1. Introduction
Plastics occur in many forms of fibers, films and particles and are found in many terrestrial and aquatic environments especially those near anthropogenic activities (Cole et al., 2011). The size of plastic materials ranges from 1 nm to 5 mm and considered as nano (1-1000 nm) and micro (>1 µm – 5 mm) plastics compounds. They also contaminate many food products thereby exposing not only the biota but the human population as well (Diaz-Basantes et al., 2020). Considering some efforts to reduce plastic emissions by limiting single use plastic products, they are still used as food wraps/containers for storage and many other plastic based materials are still used in our economy (thermoplastics surfaces, toys, various products). Moreover, since plastics slowly degrade it is estimated that there would still remain 710 million metric tons of plastics finding their way in oceans by 2040 (Amelia et al., 2021). Large plastics could degrade into smaller and smaller particles down to the nanoscale by natural weathering, sunlight and erosion. Biofilms could also degrade many plastics but this process is relatively lengthy depending on the polymer composition and its location. Bacteria were shown to have the capacity to adhere to plastic surfaces (anchor proteins/peptides) and to assist degradation forming a unique environment: the plastisphere (Park et al., 2023). Fungi and bacteria found in these biofilms could degrade plastics such as polyurethanes (Mikeskova et al., 2012; Alvarez-Barragan et al., 2016). These microorganisms produce a series of hydrolytic enzymes such as esterase, lipase, proteases and laccase able to degradation polyesters. Pseudomonas sp biofilms were shown to have flexible metabolic activities involved in the oxidation of aromatic and aliphatic hydrocarbons found in plastics (Wilkes and Aristilde, 2017). Peptides capable of interacting with plastics were shown to contain WXXW, FHXXW and WXXWXXW motifs with X being any aminoacids (Gebhardt et al., 1996; Quiang et al., 2017). The amino acids W, F convey hydrophilic and (H) cationic interactions forming electro-attractive bonds on the negative charges found on plastic during weathering. These peptides were even found to specifically bind specific plastic polymers such as polystyrene (PS), polyethylene (PE), polyethylene terephthalate (PET) and polypropylene (Vodnick et al., 2012; Behera et al., 2023; Woo et al., 2022). Hence the interest of using them in the development of detection systems for plastic materials.
Conventional methods to detect plastics include pyrolysis gas chromatography, Fourier transformed infra red/Raman spectroscopy and transmission electron microscopy. These methods exhibit high selectivity and sensitivity but are expensive, labor-intensive and time-consuming, which limits their use on large scales during screening studies. Hence the need for quick and rapid sensing technologies for various plastics.
Gold nanoparticles (nAU) are ideal substrates for optical biosensing because of their high molar extinction coefficient often visible by the naked eye, large surface area and their optical properties related to size and distance distribution (Sathiyaraj et al., 2020). These nAu could bind typical biomolecules such as nucleic acids, proteins/peptides forming films (coatings) at the surface of the nanoparticles. When these complexes are combined with test objects detection with high accuracy could be measured by a simple UV-visible spectrophotometer (Li et al., 2017). An interesting feature of nAu consists that color changes are related to the intermolecular distance between nAu. Free nAu monomers display a pink red (525 nm) to violet (>600 nm) color as the distance decreases proportionally between nAu (aggregation state). Aggregation could occur spontaneously or induced by the addition of salts (NaCl) or acid (HCl). In the case of the present study, nAu coated with either PE, PET, PP or PS binding peptides, the complex will bind to the corresponding target plastic fiber/particle thereby protecting them against induced aggregation. In theory, plastic peptides found to bound various plastic polymers (PE, PET, PP and PS) should be detectable by nAu coated with these peptides provided that no significant cross-reactivity occurs between a given plastic-binding peptide with other non-target peptides. However, given that plastic binding potential is based on hydrophobic and cationic interactions, the possibility exists that these peptides could cross-reaction with other plastics materials.
The purpose of this study was therefore the develop a plastic binding assay for PE, PET, PP and PS nanoparticles using a nAu-peptide sensor strategy. First, nAu will be coated with either the above plastic-binding peptides and tested with the corresponding plastic polymer. Second, the specificity of each nAu-plastic peptide will be examined with non-target peptides in the attempt to determine any cross-reactivity. This newly developped approach will be tested in a case study involving mussels caged in urban area known to release plastic nanoparticles (street runoffs, municipal effluents and downstream a large city area.
2. Methods
2.1. Preparation of nAu Peptides
The peptides for polyethylene (PE), polyethylene teraphtalate (PET), polypropylene (PP) and polystyrene (PS) were synthesized at Canpeptides (Montreal, Canada) at 10 mg scale based on reported sequences (see
Table 1 for amino acid composition). They were dissolved in 50 mM NaCl containing 0.3 mM KH
2PO
4 and NaHCO
3, pH 7.4 at 0.5 mg/mL and stored at -20
oC. At the day of analysis, the peptides were diluted to 10 µg/mL in MilliQ water. Citrate coated 10 nm diameter nano-gold (nAu) were purchased at Nanocomposix (USA). The stock solution was 26 mg/mL in 2% citrate buffer as a stabilizing agent. The citrate nAu solution was centrifuged at 20 000 x g for 10 min at 15
oC. The supernatant was carefully removed, and the pellet resuspended in borosilicate tubes at the same volume with 1 µg/mL of PE and PS binding peptides and 0.25
g/mL PET and PP (
Table 1). The lower concentration of peptides used for PET and PP was to limit strong aggregation of the nAu suspension (appearance of dark violet coloration from the usual pink/red appearance). After standing at room temperature for 1-2 h, the suspension was centrifuged again as described above to remove unbound peptides in the supernatant and the pellet resuspended in MilliQ water. Preliminary experiments fluorescently labeled peptides confirmed binding to nAu by the presence of fluorescence in the MilliQ washed nAu suspensions (between 5-20 % of added fluorescence were retained on the nAu).
2.2. Assay for PE, PET, PP and PS Nanoplastics
The PP and PE nanoparticles (0.1 µm diameter) were obtained from CD Bioparticles (NY, USA). PS (0.1 µm diameter) and PET nanoparticles (1-3 µm diameter) were purchased from Polyscience (Il, USA) and nanoChemazone (On, Canada) respectively. The plastic samples were diluted at 10 mg/mL in MilliQ water. For the assays, a standard curve between 1-100 µg/mL was constructed in MilliQ water at the day of the experiment. For the assay, 100 µL of nAu-peptide (to either PE, PET, PP or PS) was added to a clear microplate and increasing amount of corresponding target plastic were added and mixed for 5 min. After the addition of the aggregation agent (10 µL of 0.1M HCl), the plasmon resonance was measured between 500 and 750 nm using a microplate reader (Neo-2, Synergy, Biotek instrument, CA, USA). The disaggregation ratio was calculated by the resonance ratio at 525/620 nm. The specificity of each peptides against PE, PET, PP and PS plastics were also determined i.e., nAu containing each of the designed peptides were tested on all 4 peptides individually.
2.3. Application in Freshwater Mussels Caged in a Large Urban Area
The peptide-based assay were examined in freshwater mussels caged for 3 months (July-October, 2020) at 2 rainfall overflow sites (OVF1 and OVF2), one site located 15 km downstream from the city centre of Montréal (Down City; Québec, Canada) and a downstream site of the municipal effluent dispersion plume (Down Eff) discharged on the north shore of the Saint-Lawrence river as previously described (Gagné et al., 2023). This study revealed that micro and nanoplastics are released in urban area and that wastewater treatment plant can lower plastic micro and nanoparticles in mussel tissues. Hence, the Down Eff site was considered the “reference” site. A number of 30 mussels were placed in nets and 3 nets were included at each site. The mussels were then placed in > 1m depth at the 4 sites described above from July 15th to October 15th. At the end of the exposure, the mussels were collected and allowed to stand for 12 h in clean aquarium water to allow purging of gut contents. The digestive gland was dissected on ice and homogenized in 100 mM NaCl containing 10 mM Hepes-NaOH, pH 7.4, 0.1 mM dithiothreitol and 1 µg/mL protease inhibitor (aprotinin). Homogenization was achieved with a polytron tissue grinder equipped with a steel probe for 30 sec on ice. The homogenate was then extracted by adding one volume of saturated (5M) NaCl and one volume of acetonitrile and stand for 30 min with mixing each 5-10 min. The sample was then centrifuged at 500 x g for 3 min to separate the phases. Preliminary experiments with fluorescently labeled nanoplastics revealed that plastics readily partitioned (>99%) in the acetonitrile phase. A 4x 10 µL volume was mixed with 140 µL of nAu treated to each PE, PET, PP and PS peptides in clear microplate for 5 min followed by the addition of 10 µl of 100 mM HCl. The samples were then analyses by scanning spectrophotometry between 500 and 750 nm (2 nm increments, Neo-2 Biotech Instruments, USA). The disaggregation ratio was calculated at 525/620 nm. The blank consisted of 10 µL acetonitrile and standard solutions of each plastic particles were used (1-100 µg/mL). The data were expressed as relative levels of each plastics (µg/mg proteins). The total proteins in the digestive gland homogenate were determined using the Coomassie Brillant Blue assay using bovine serum albumin for calibration (Bradford, 1976). Other mussel physiological endpoints were included to seek out trends with bioavailable plastics in mussels and previously described (André et al., 2023). They included the condition factor (mussel weight g/shell length cm), digestive gland index (DGI: g digestive gland/g tissues wet weight), gonado-somatic index (GSI; g gonad/g tissues wet weight), total lipids and Nile Red solvatochromic shift (NR shift). Total lipids were determined by Frings et al (1972) using the microplate phosphovanilin methodology. Calibration was achieved with Canola oil and the data were expressed as µg lipids/mg proteins. The presence of plastic materials were determined using the solvatochromic properties of Nile Red, often used to stain plastics in various environmental samples (Gagné et al., 2019). The principle of this assay is based in the blue shift in the emission spectra of NR in tissues by non-polar materials such as plastics. This assay was designed as a semi-quantitative test for plastic-like materials based in the blue shift in the emission spectra of the dye in tissues. A 20 µL acetonitrile sample was mixed with 180 µM Nile Red (phosphate buffered saline) and emission scan was measured between 520-700 nm using an excitation wavelength of 490 nm (Neo-2, synergy, Biotech Instrument, USA). The first derivative spectra was calculated and the emission shift ratio was obtained by 620 nm/650 nm emission). Standard solutions of PS nanoplastics was used for validation. The data was expressed as the shift ratio/mg proteins in the digestive gland.
2.4. Data Analysis
All experiments were run in triplicates and the data were expressed as the mean with standard deviation. For mussel exposure experiments, 4 individuals per site were analyzed. The data was analyzed using rank analysis of variance and critical differences between treatments were determined using the Conovan-Iman test. Correlation analysis was done using the Pearson moment procedure. To correct against the (lack of) specificity of some peptides, the residual values of each plastics were obtained from the levels of the other plastics: PS residual levels obtained from the multiple regression of PS (dependent variable) with PE, PET and PP (independent variable) etc. The 4 regression models for all types plastic yield significant regressions. Significant was set at α≤0.05 using the Statsoft (version 13) software package.
3. Results and Discussion
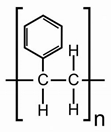
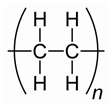
The plastic used in this study consisted of PE, PET, PP and PS particles as shown in
Table 1. PS consists of styrene (aromatic) repeats while the more polar PET consisted of aromatic esters repeats. The peptide composition for each type of plastics are indicated based on the reported literature. The number of amino acids ranged between 7-13 amino acids. The hydrophobicity ranged between 43-67%. The peptide for PET and PE tended to aggregate more strongly nAu during the pre-incubation step as evidenced by the appearance of violet color. To limit this aggregation, 5 to 10 less peptides were added during the peptide coating step for nAu. These peptides were generally more hydrophobic (54 and 67% for PET and PE respectively), which could account for the stronger aggregation potential of nAu. The isoelectric point (IP) of the peptides for PE, PET, PP were above 9 suggesting that these peptides were cationic at pH 7.4 and could interact with weathered plastics (containing R-OH and RCOOH ligands) and to Au
o at the surface of the nAu. The PE peptides was the least polar suggesting stronger hydrophobic interactions at the surface of nAu in keeping with the hydrophobic PE plastic composed of ethylene repeats. In the case of PS peptide, the IP was close to pH 7 suggesting more polar interactions between nAu and PS with hydroxylated amino acids (tyr, ser) and perhaps some anionic interaction from terminal tyr COOH amino acid.
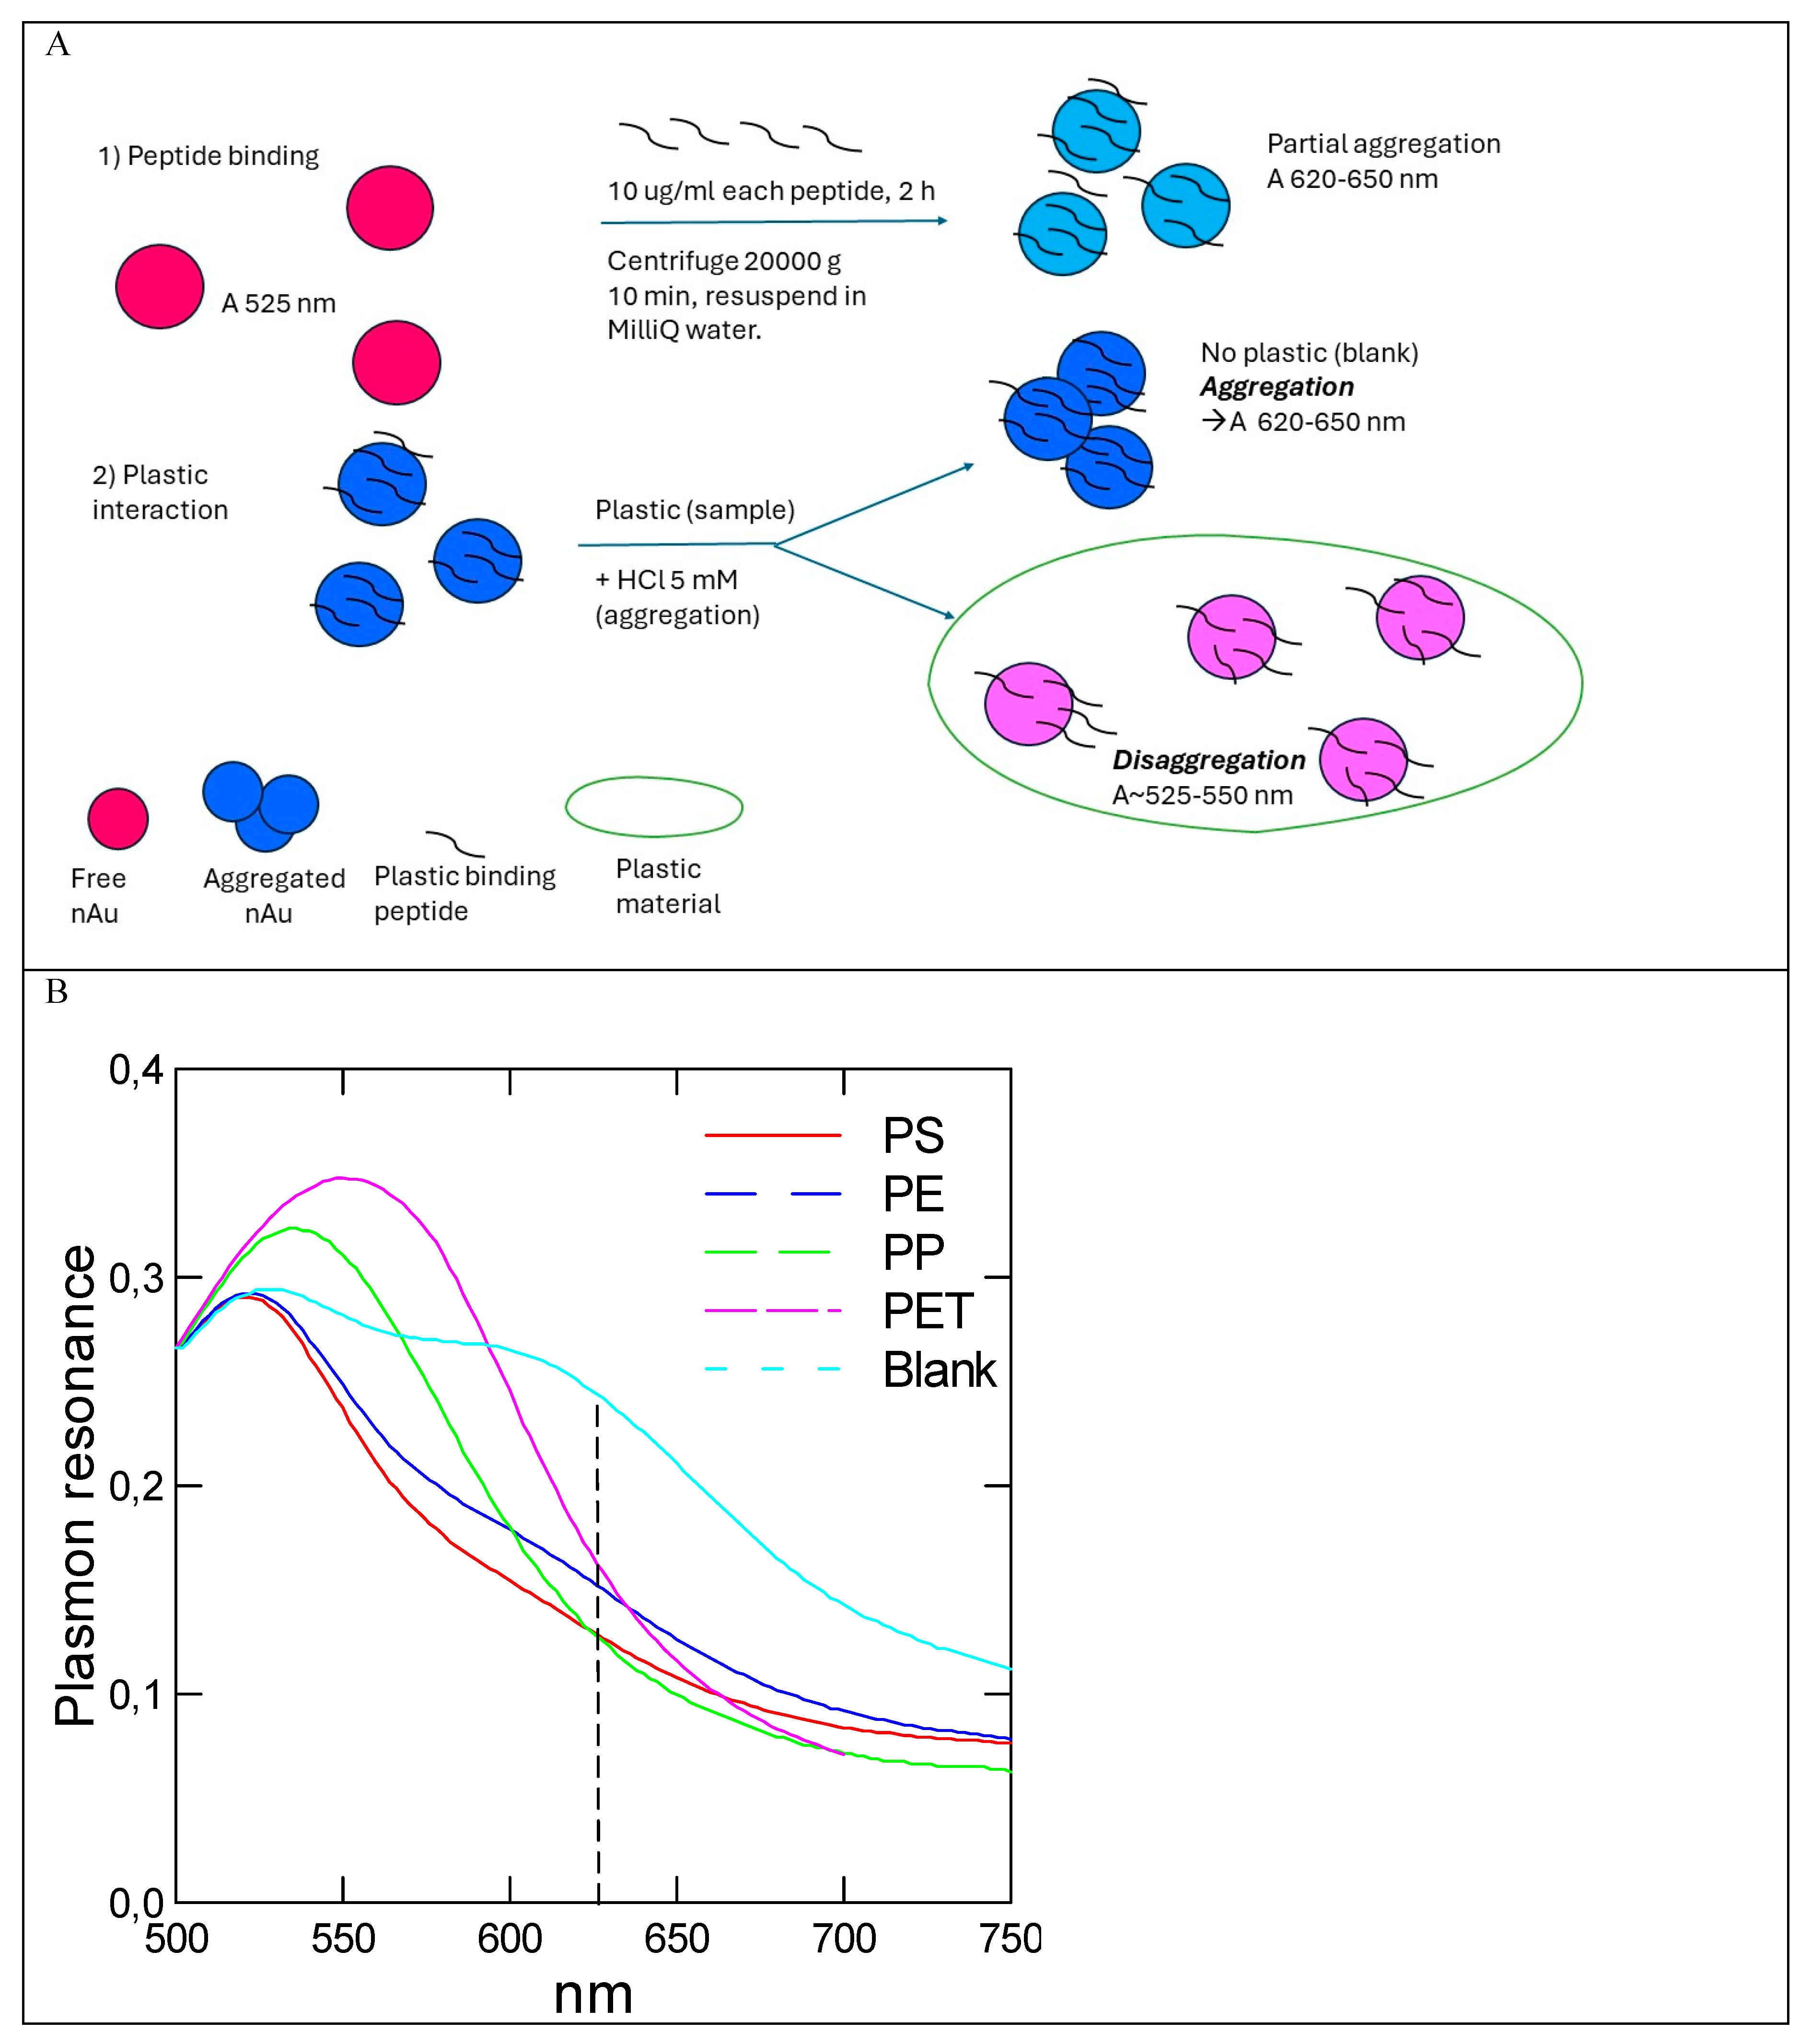
The principle of the assay is based on the binding of nAu peptide to plastic materials leading to reduced acid induced aggregation (
Figure 1A). The interaction of nAu-peptides with the corresponding plastic material (i.e. PP - PP-binding peptide nAu complex) prevents aggregation induced by the addition of acid (10 mM HCl). Thus, the aggregation induced by HCl will be dampened when nAu-peptide interact with plastic materials thereby increasing the disaggregation ratio at 530/625 nm. Peptides were previously shown to bind at the surface of nAu through a combination of hydrophobic and ionic interactions (Ahn et al., 2022). Peptides with cysteine residues (R-SH) as with the PET peptide can also form more stable (covalent) bonds to the surface of nAu by forming R-S-Au covalent bond. The binding of peptides at the surface of nAu is relatively quick requiring only 1-3 h to form bonds. In some cases, thiol containing agents could be incubated up to 12 h at room temperature as with mercaptoundecanoic acid ligand used as a general probe for plastics detection in water samples (Zhou et al, 2023). The resonance spectra of each nAu-peptide with its corresponding plastic are shown (
Figure 1B). The blank consisted of the nAu-peptide only leading to 2 peaks around 530 and 600-630 nm corresponding to a disaggregation ratio (530/620 nm) of circa 0.3/0.25 = 1.2. Although the maxima for aggregated nAu was closer to 600 nm, we selected 620 nm to reduce the spectral overlap with the various types of plastics. In the presence of plastics, the disaggregation ratio is increased up to 2.75 for PP in agreement with the plastics preventing aggregation by HCl. It is also noticeable that the disaggregation of nAu is reduced for PET peptide (the maximum is displaced from 525 to 550 nm) suggesting that nAu-PET peptide-PET were closer together compared to nAu-PS/PE/PP peptides when compared to the blank. The spectral shift (from 525 nm) is related to the relative distance between nAu particles following the plasmonic ruler phenomenon, which is used to estimate the relative distance between nAu (Jain et al., 2007). The explanation for this is presently unclear but could be related with the lower amounts of cationic peptides remaining at the surface of nAu offering less charge repulsion between nAu-PET peptide. Indeed, the nAu were treated to 0.25 µg/mL PET-peptides corresponding to about 7 times less than the other peptides based on molar values. The lower quantity of attached cationic PET peptides at the surface of nAu permits closer associations between nAu-PET peptide by lowering charge repulsion from cationic peptides.
In the context that plastic materials in contaminated environments occur as mixtures, the specificity of each plastic-binding peptide was tested with other plastics (
Table 2). For example, the signal ratio of nAu-PP peptide was tested not only with PP plastics but with PS, PET and PE plastics as well. Globally the plastic peptides reacted the most with the corresponded target plastics but showed partial reaction with other plastics. The results showed that nAu PS peptide reacted less with PE and PP plastics corresponding to 67 and 44 % of the PS signal. The nAu PET peptide showed some partial reactivity with PS (68%), PE (38%) and PP (59%). The nAu-PE peptide showed partial reactivity with PS (60%) and PP (34%). Finally, the nAu-PP peptide showed partial reactivity with PS (50%) and PE (39%). If we consider the 50% partial reactivity as a threshold, the PP-peptide offered the best specificity compared to the other peptides. This suggests that the signal obtained for these peptides partially react with other plastics suggesting that the methodology only measures the relative levels of plastics rather than absolute levels. A way to correct for the lack of specificity would be to subtract the signal (disaggregation ratio) of the target plastic with the other plastic signal: e.g. corrected nAu-PS signal = nAu-PS signal-(0.67* nAu-PET signal)-(0.44*nAu-PP signal). A more robust means would be to extract the residual level of the target plastic with the other plastics using a multiple regression model: residual nAu-PS signal obtained from a multiple regression model of nAu-PS (dependent variable) with PP, PE and PET signals (independent variables). Notwithstanding these correction strategies, only the relative levels of the target plastic are obtained, not the absolute values. Confirmation by more specific (and expensive) methodologies such as thermogravimetric Fourier transformation infrared spectroscopy or pyrolysis GC-MS spectrometry would be required (Jung et al., 2023).
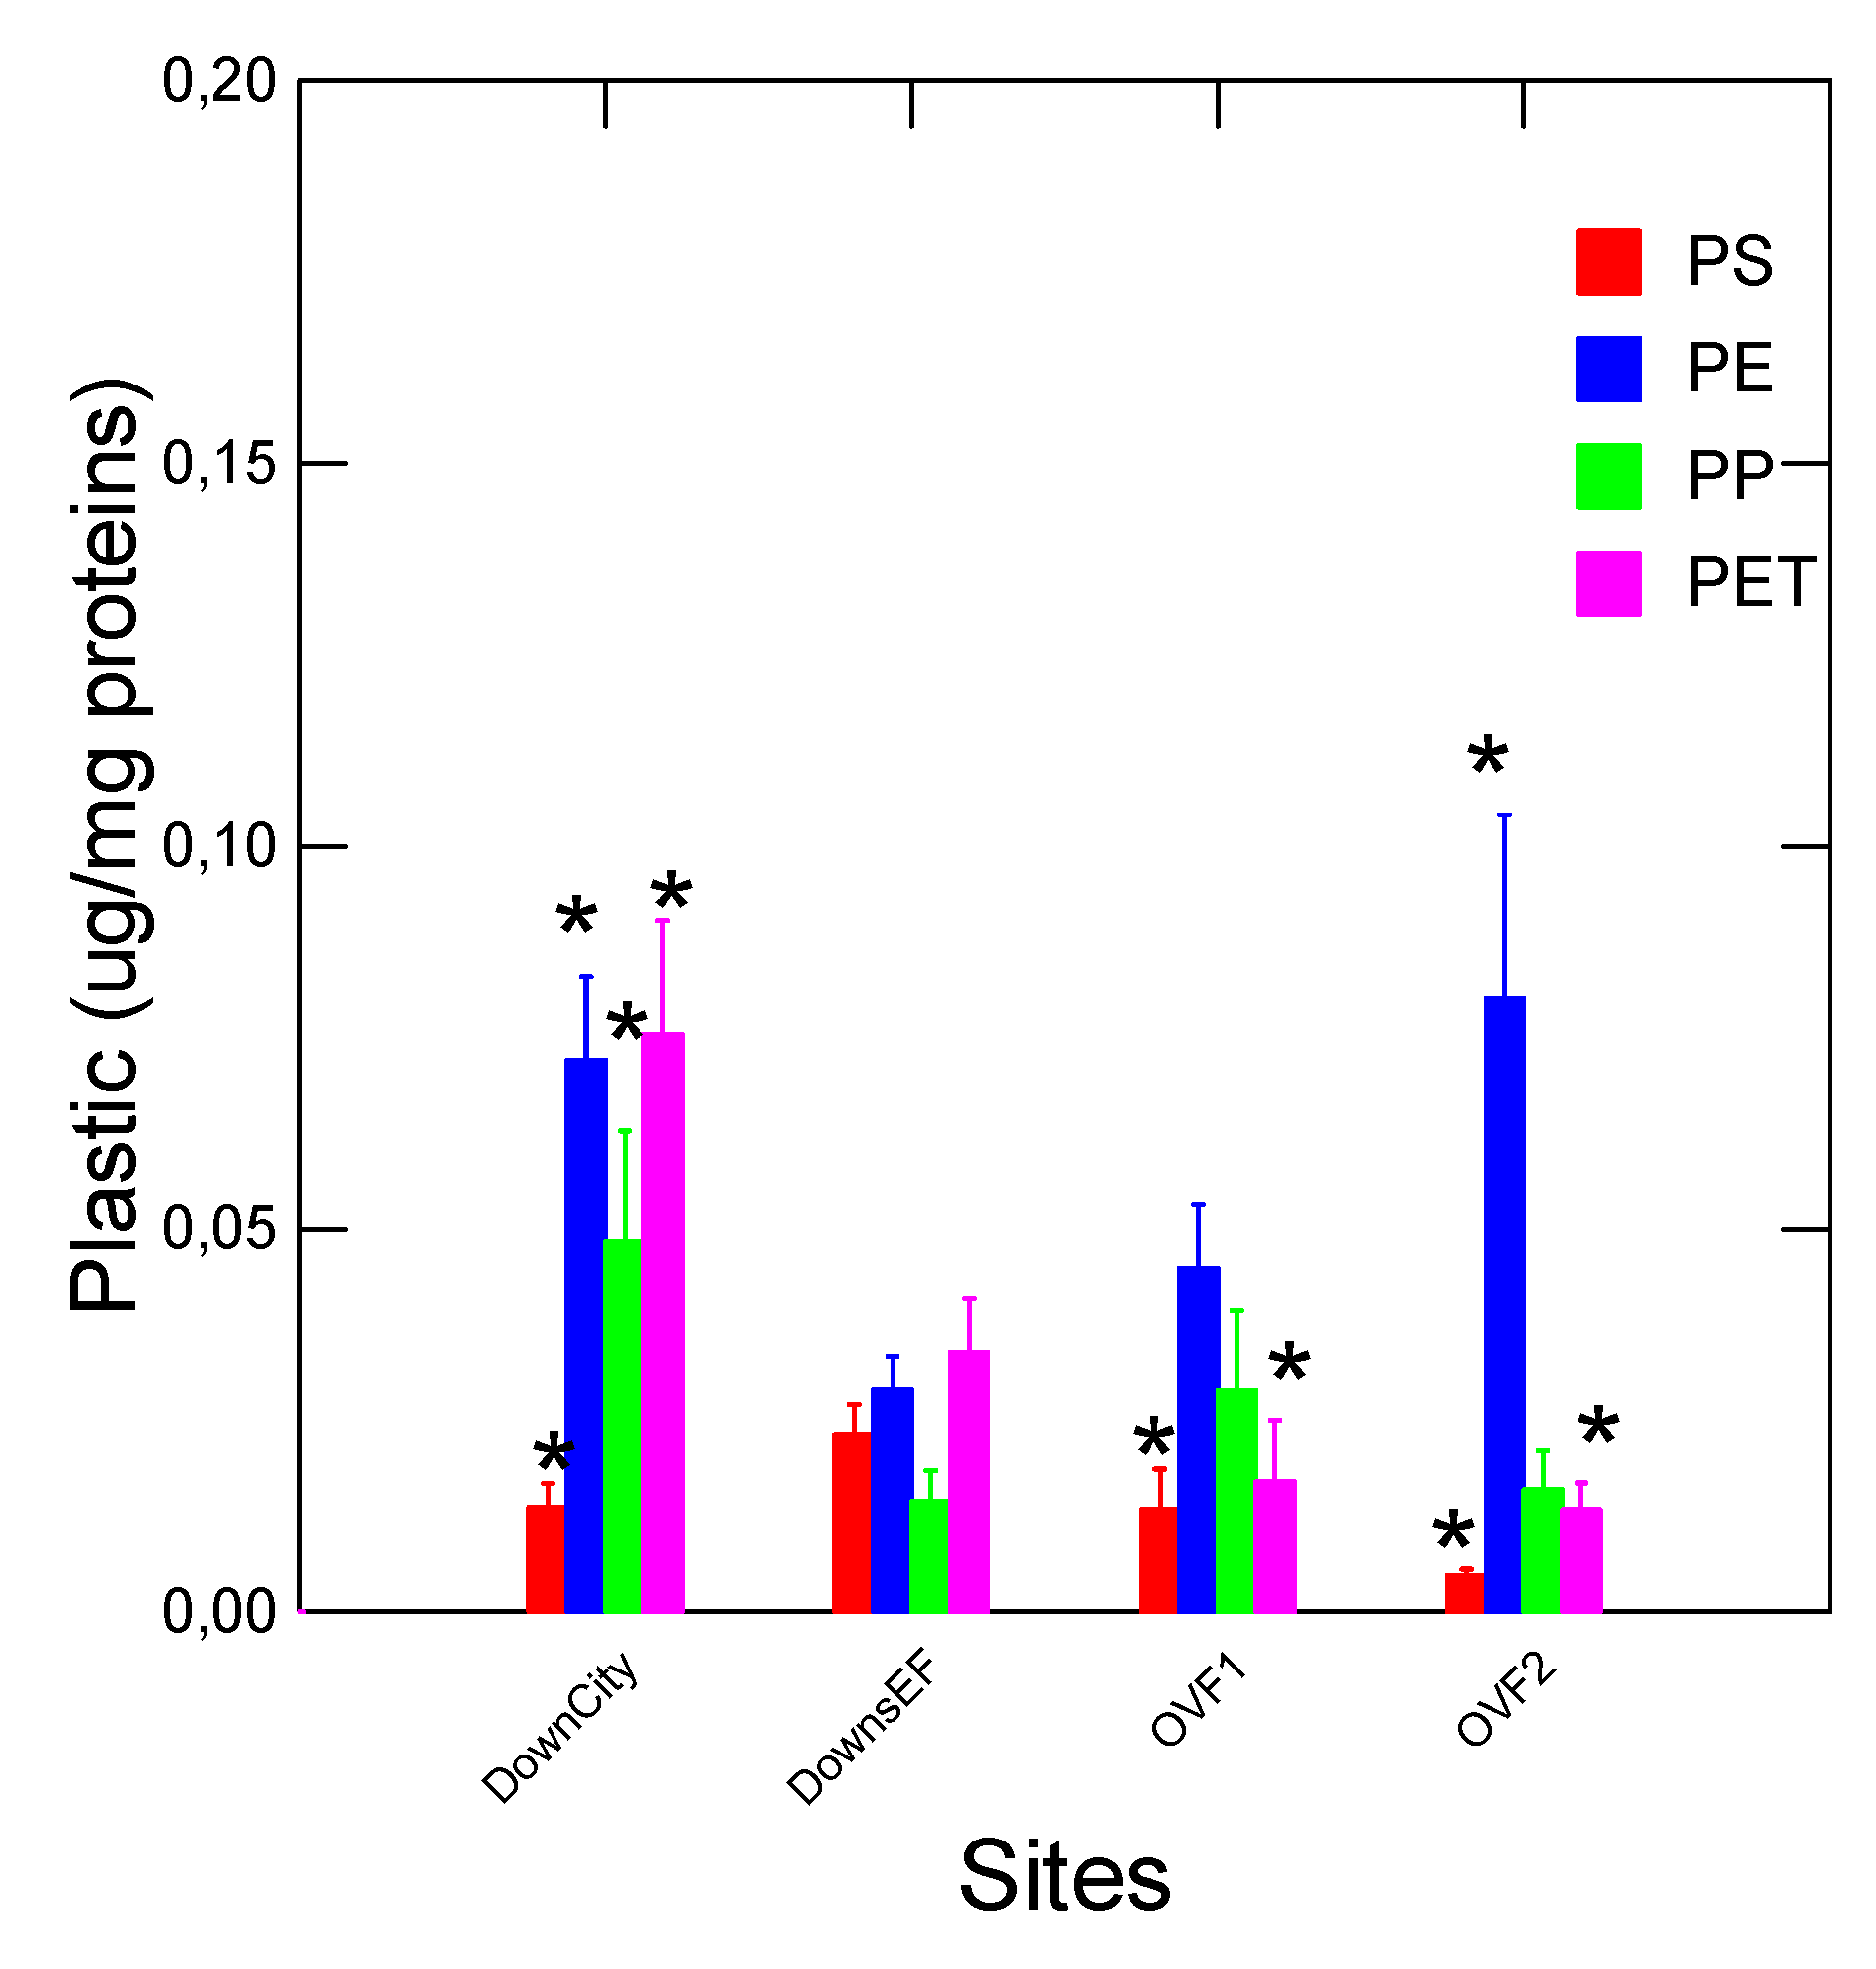
As a case study, mussels were caged at 2 rainfall overflow sites (source of tire wear plastics), downstream a large City (emitters of various plastics compounds) and downstream (8 km) a municipal effluent dispersion plume (
Figure 2). The relative levels of each plastic were obtained following the residual method described above. The data revealed that mussels placed at the Down Eff site had lower levels of PP, PE and PET compared to the Down City site and some rainfall overflow sites. For PS, the levels in mussels at the Down EFF site had higher levels compared to the other sites. The general decreased in total plastic loadings at sites downstream wastewater treatment plants was also observed previously (Gagné et al., 2023). However, municipal effluents were reported to emit circa 1 µg/L of nanoplastics from 3 different cities (Okoffo and Thomas, 2024). Untreated effluents contained up to 30 µg/L nanoplastics and could be released during heavy rainfall at overflow sites. For the city of Montréal, this represents important amounts of plastics theoretically since the station emits 2.5-7.5 x 10
9 L/day (it is one of the highest effluent volume emitters in North America). Tires and asphalts are made from recycled plastics containing PE, PP and PET, which are released by road wear in surface waters (Palos et al., 2021; Guselnikova et al., 2023). However, it is not known whether the plastic binding peptides used here could bind to other plastics such as Nylon, PVC and polyesters. The removal rates of total nanoplastics were generally >90% for most PP, PP, PET, PVC, Nylon, polymethylmethacrylate and polycarbonate nanoplastics (Okoffo and Thomas, 2024). However, PS nanoplastics were sometimes less efficiently removed (43 %) by primary and secondary treatment eflluents) where the effluent for the mussels caging was an advanced primary treatment. The mussel health status was determined by following changes in condition factor (CF), digestive gland and gonad somatic indexes (DGI, GSI), total lipids in tissues and the NR shift to detect low polarity compounds in acetonitrile extracts (
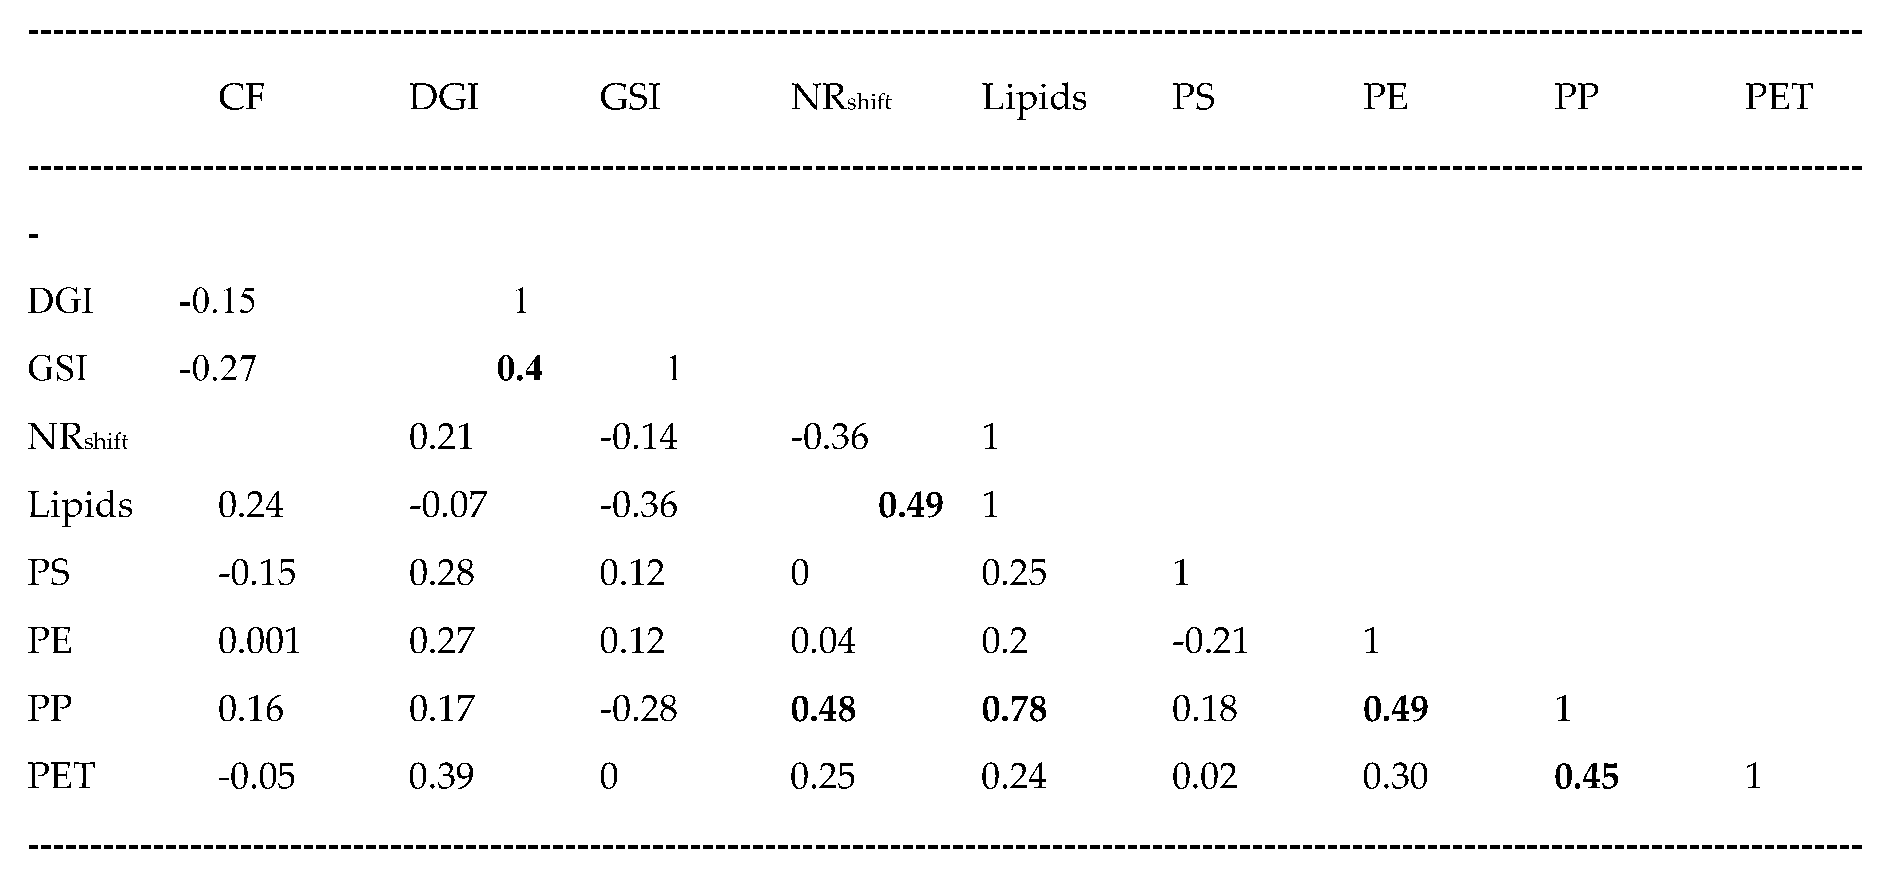
Table 3). The data revealed that the CF and lipids levels did not change across the sites while the GSI and DGI were higher at the Down Eff sites compared to either Down City or overflow sites. The NRshift was higher at the OVF1 site and the DOWN City sites (containing higher levels of PE, PET and PP plastics) compared to the Downs Eff site. Correlation analysis revealed that PE, PET, and PS were not correlated with each other suggesting that residual method used to compensate for specificity as discussed above was able to remove most of the interference because a lack of specificity would have produced highly significant correlations with each other. PP was weakly (but significantly) correlated with PE (r=0.49), PET (r=0.45), NR shift (r=0.48) and lipids levels (r=0.78). The NRshift were correlated with lipids (r=0.49) and the DGI correlated with the GSI (r=0.4). This suggest that the size of mussels’ digestive gland and lipids were associated to the PP levels in mussels. This is consistent with the notion that less polar PP (as with other non-polar chemicals) would be associated to lipids in tissues. An analysis of covariance with lipids and DGI as the covariate increased the significance 10-fold (lowered between treatments errors) in PP levels in the digestive gland at the Downs City compared to Downs EFF sites (p=0.01 to p=0.001 when lipids and DGI were included as the covariate). This suggests that the observed increases in PP was not solely associated to lipid levels or changes in the DGI in mussels but to site-specific sources of plastics.
In conclusion, the study revealed that plasmonic nano-gold sensors can be used to track the relative levels of PE, PET, PP and PS nanoparticles in biological tissue extracts. Although the plastic specific peptides reacted the most with its corresponding target peptide, some cross-reaction with other plastics were found for the peptides used in the present study. Multiple regression analysis revealed that each of 4 peptides were significantly correlated with at least one of the non-target plastics. The relative levels of plastics could be determined by extracting the residual levels of the plastics i.e., the portion of plastic not related to the other interfering plastics. As a case study, mussels placed downstream a large city, rainfall overflow sites and a treated municipal effluent dispersion plume showed higher levels of total plastics at the large city and some overflow sites. Most plastics (PE, PET and PP) were found at higher levels of the Downs City and sometimes the OVF sites with the exception of PS levels which were higher in the treated municipal effluent plume compared to the other sites. A rapid and inexpensive peptide-based nAu sensor for the most abundant plastics for PE, PET, PP and PS is proposed. Although the lack of specificity of some peptides towards non-target plastics could be mitigated by multiple regression analysis, the assay is limited to relative levels of plastics in biological samples.
Table 4.
Correlation analysis.
Table 4.
Correlation analysis.
Funding
This work was supported by the plastic initiative and the Saint-Lawrence Action plan of Environment and Climate Change Canada.
Institutional Review Board Statement
Not applicable.
Informed Consent Statement
Not applicable.
Data Availability Statement
The data presented in this study are available on request from the corresponding author.
Acknowledgments
This work was funded by the Plastic Research Initiative of Environment and Climate Change Canada. The helpful assistance of Hiba Qchigach for the mussel handling and preparation is recognized. The authors thank Marie-Hélène Brunet for the preparation of tissue samples (flow cytometry) and Maxime Gauthier for the helpful comments in the preparation of the manuscript.
Conflicts of Interest
The authors declare no conflict of interest.
References
- Amelia, TSM, Khalik WMAWM, Ong MC, Shao YT, Pan H-J, Bhubalan K 2021. Marine microplastics as vectors of major ocean pollutants and its hazards to the marine ecosystem and humans. Prog. Earth Planet Sci 8, 12.
- Anh NH, Doan MQ, Dinh NX, Huy TQ, Tri DQ, Loan LTN, Hao BV, Le AT 2022. Gold nanoparticle-based optical nanosensors for food and health safety monitoring: recent advances and future perspectives. RSC Adv 12, 10950–10988. [CrossRef]
- André C, Duy SV, Sauvé S, Gagné F 2023. Comparative toxicity of urban wastewater and rainfall overflow in caged freshwater mussel Elliptio complanata. Front Physiol 14, 1233659. [CrossRef]
- Alvarez-Barragan J, Dominguez-Malfavon L, Vargas-Suarez M, Gonzalez-Hernandez R, Aguilar-Osorio G, Loza-Tavera H 2016. Biodegradative activities of selected environmental fungi on a polyester polyurethane varnish and polyether polyurethane foams. Appl Environ Microbiol 82, 5225–5235. [CrossRef]
- Behera A, Mahapatra SR, Majhi S, Misra N, Sharma R, Singh J, Singh RP, Pandey SS, Singh KRB, Kerry RG 2023. Gold nanoparticle assisted colorimetric biosensors for rapid polyethylene terephthalate (PET) sensing for sustainable environment to monitor microplastics. Environ Res 234, 116556.
- Bradford MM 1976. A rapid and sensitive method for the quantitation of microgram quantities of protein utilizing the principle of protein-dye binding. Anal Biochem 72, 248-254.
- Cole M, Lindeque P, Halsband C, Galloway TS 2011. Microplastics as contaminants in the marine environment: a review. Mar Poll Bull 62, 2588–2597. [CrossRef]
- Diaz-Basantes MF, Conesa JA, Fullana A 2020. Microplastics in honey, beer, milk and refreshments in Ecuador as emerging contaminants. Sustainability 12, 5514. [CrossRef]
- Frings CS, Fendley TW, Dunn RT, Queen CA 1972. Improved determination of total serum lipids by the sulfo-phospho-vanillin reaction. Clin Chem 18, 673-674. [CrossRef]
- Gagné F, Roubeau-Dumont E, André C, Auclair J 2023. Micro and Nanoplastic Contamination and Its Effects on Freshwater Mussels Caged in an Urban Area. J Xenobiot 13, 761-774. [CrossRef]
- Gagné F, Auclair J, Quinn B 2019. Detection of polystyrene nanoplastics in biological samples based on the solvatochromic properties of Nile red: application in Hydra attenuata exposed to nanoplastics. Environ Sci Pollut Res Int 26, 33524-33531. [CrossRef]
- Gebhardt K, Lauvrak V, Babaie E, Eijsink V, Lindqvist BH 1996. Adhesive peptides selected by phage display: characterization, applications and similarities with fibrinogen. Pept Res 9, 269–278.
- Guselnikova O, Semyonov O, Sviridova E, Gulyaev R, Gorbunova A, Kogolev D, Trelin A, Yamauchi Y, Boukherroub R, Postnikov P 2023. "Functional upcycling" of polymer waste towards the design of new materials. Chem Soc Rev 52, 4755-4832. [CrossRef]
- Jain PK, Huang W and MA., El-Sayed 2007. On the universal scaling behavior of the distance decay of plasmon coupling in metal nanoparticle pairs: A plasmon ruler equation. Nano Lett 7, 2080-2088. [CrossRef]
- Jung S, Raghavendra AJ, Patri AK 2023. Comprehensive analysis of common polymers using hyphenated TGA-FTIR-GC/MS and Raman spectroscopy towards a database for micro and nanoplastics identification, characterization, and quantitation. NanoImpact 30, 100467.
- Li X, Wu Z, Zhou X, Hu J 2017. Colorimetric response of peptide modified gold nanoparticles: an original assay for ultrasensitive silver detection. Biosens Bioelectron 92, 496–501. [CrossRef]
- Mikesková H, Novotný Č, Svobodová K 2012. Interspecific interactions in mixed microbial cultures in a biodegradation perspective. Appl Microbiol Biotechnol 95, 861–870. [CrossRef]
- Okoffo ED, Thomas KV 2024. Mass quantification of nanoplastics at wastewater treatment plants by pyrolysis-gas chromatography-mass spectrometry. Water Res 254, 121397. [CrossRef]
- Park WJ, Hwangbo M, Chu K-H 2023. Plastisphere and microorganisms involved in polyurethane biodegradation. STOTEN 886, 163932. [CrossRef]
- Palos R, Gutiérrez A, Vela FJ, Olazar M, Arandes JM, Bilbao J 2021. Waste refinery: the valorization of waste plastics and end-of-life tires in refinery units. A Review. Energy Fuels 35, 3529-3557. [CrossRef]
- Qiang X, Sun K, Xing L, Xu Y, Wang H, Zhou Z, Zhang J, Zhang F, Caliskan B, Wang M, Qiu Z 2017. Discovery of a polystyrene binding peptide isolated from phage display library and its application in peptide immobilization. Scientific Reports 7, 2673. [CrossRef]
- Sathiyaraj, S., Suriyakala, G., Gandhi, A.D., Babujanarthanam, R., Almaary, K.S., and Chen, T.W. (2020). Synthesis, characterization, and antibacterial activity of biosynthesized gold nanoparticles. Bioint Res Appl Chem 11, 9619–962.
- Vodnik M, Štrukelj B, Lunder M 2012. HWGMWSY, an unanticipated polystyrene binding peptide from random phage display libraries. Anal Biochem 424, 83-86. [CrossRef]
- Wilkes R-A, Aristilde L 2017. Degradation and metabolism of synthetic plastics and associated products by Pseudomonas sp.: capabilities and challenges. J Appl Microbiol 123, 582–593.
- Woo H, Kang SH, Kwon Y, Choi Y, Kim J, Ha DH, Tanaka M, Okochi M, Kim JS, Kim HK, Choi J 2022. Sensitive and specific capture of polystyrene and polypropylene microplastics using engineered peptide biosensors. RSC Adv, 2022, 12, 7680. [CrossRef]
- Zhou H, Cai W, Li J, Wu D 2023. Visual monitoring of polystyrene nanoplastics < 100 nm in drinking water based on functionalized gold nanoparticles. Sens Act B Chem 392, 134099. [CrossRef]
|
Disclaimer/Publisher’s Note: The statements, opinions and data contained in all publications are solely those of the individual author(s) and contributor(s) and not of MDPI and/or the editor(s). MDPI and/or the editor(s) disclaim responsibility for any injury to people or property resulting from any ideas, methods, instructions or products referred to in the content. |
© 2024 by the authors. Licensee MDPI, Basel, Switzerland. This article is an open access article distributed under the terms and conditions of the Creative Commons Attribution (CC BY) license (http://creativecommons.org/licenses/by/4.0/).
