Submitted:
29 March 2024
Posted:
01 April 2024
You are already at the latest version
Abstract
Keywords:
1. Introduction
2. Materials and Methods
2.1. Experimental Animals
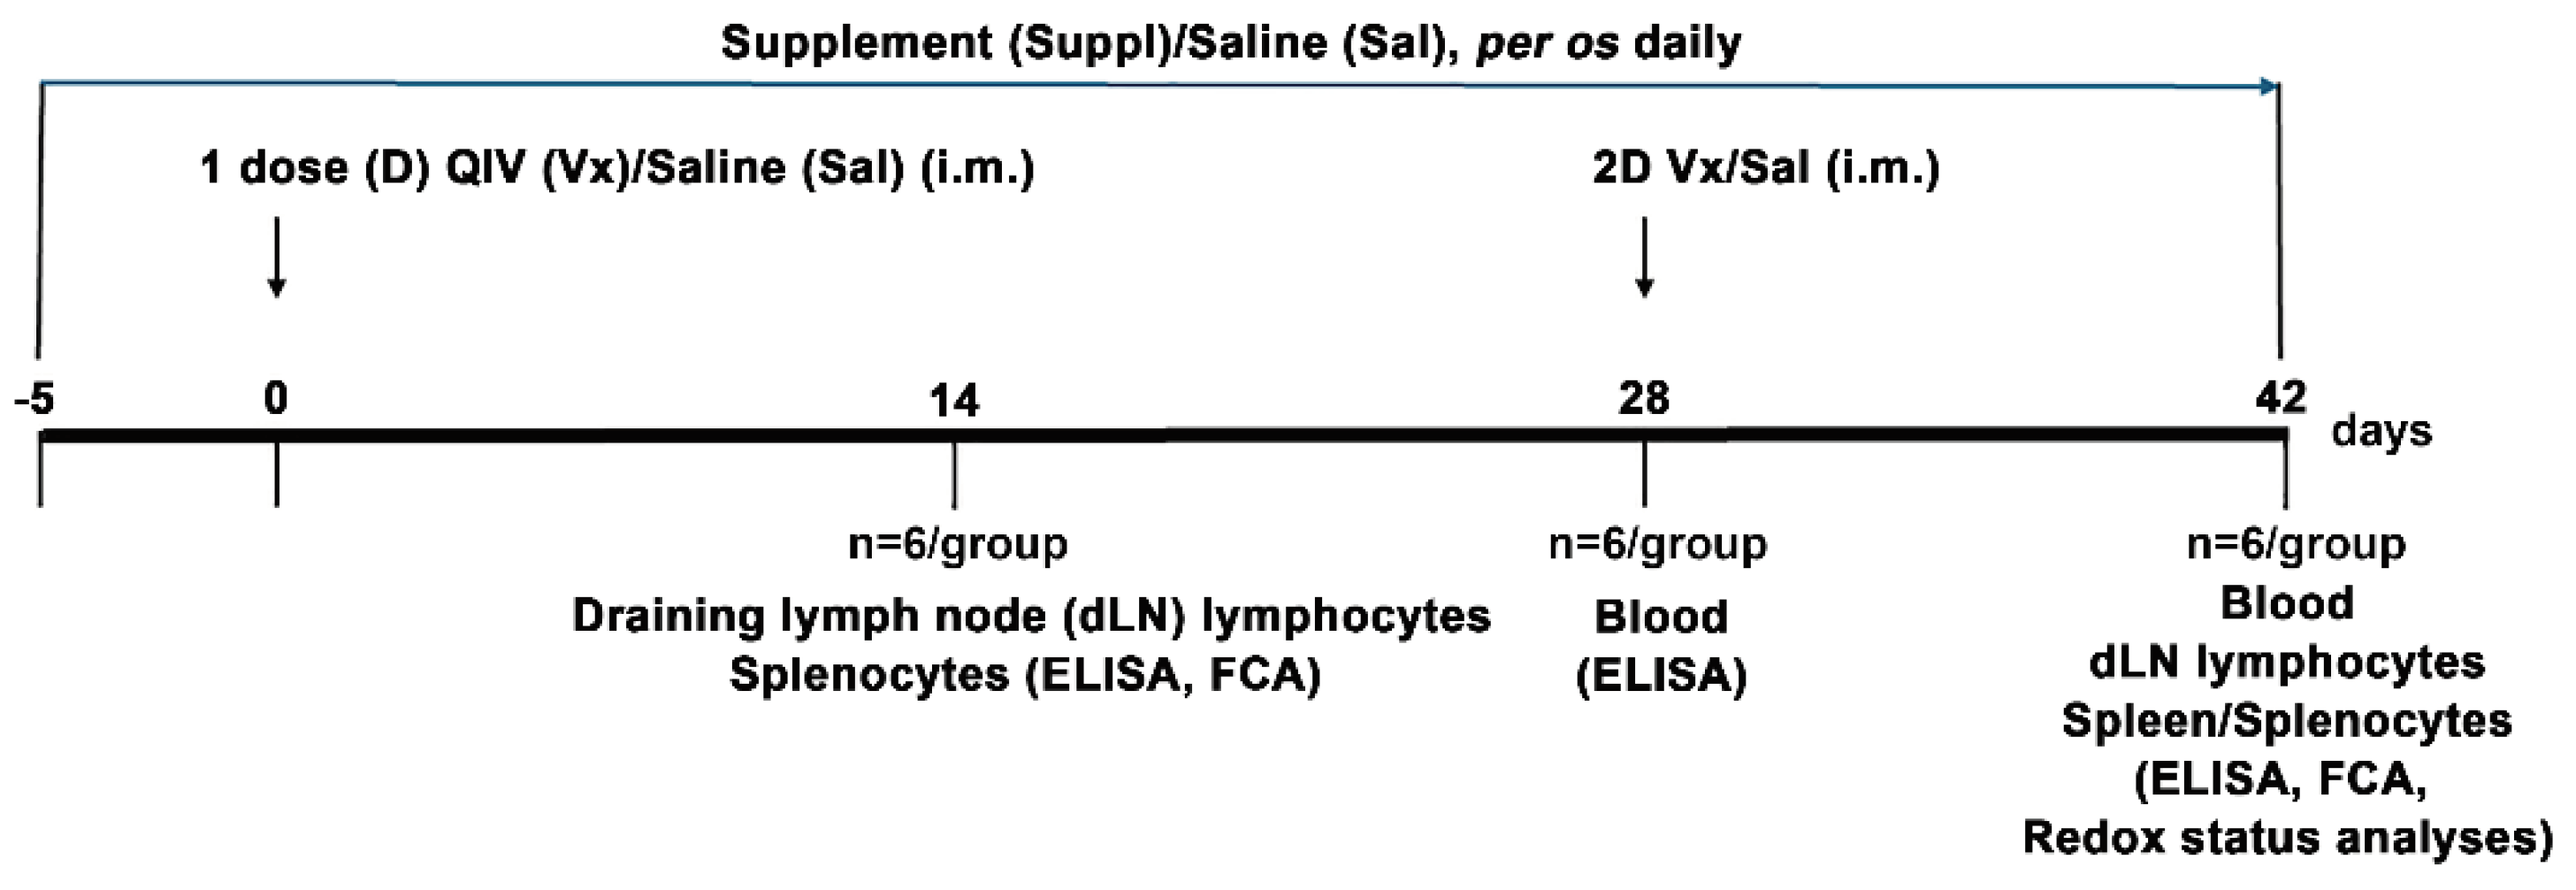
2.2. Immunization and Treatment
2.3. Reagents and Antibodies
2.4. Serum Collection
2.5. Antibody Titre Determination
2.6. Isolation of Cells from dLNs and Spleens
2.7. Cultivation of Cells
2.8. Cell Proliferation Assessment
2.9. Intracellular Cytokine Production Assessment
2.10. IFN-γ and IL-4 Production Assessment
2.11. Immunostaining and FCA
2.11.1. Surface Antigens Staining
2.11.2. Intracellular Antigen Staining
2.11.3. FCA
2.12. ELISA
2.13. Redox Status Parameters Assessment
2.14. Statistics
3. Results
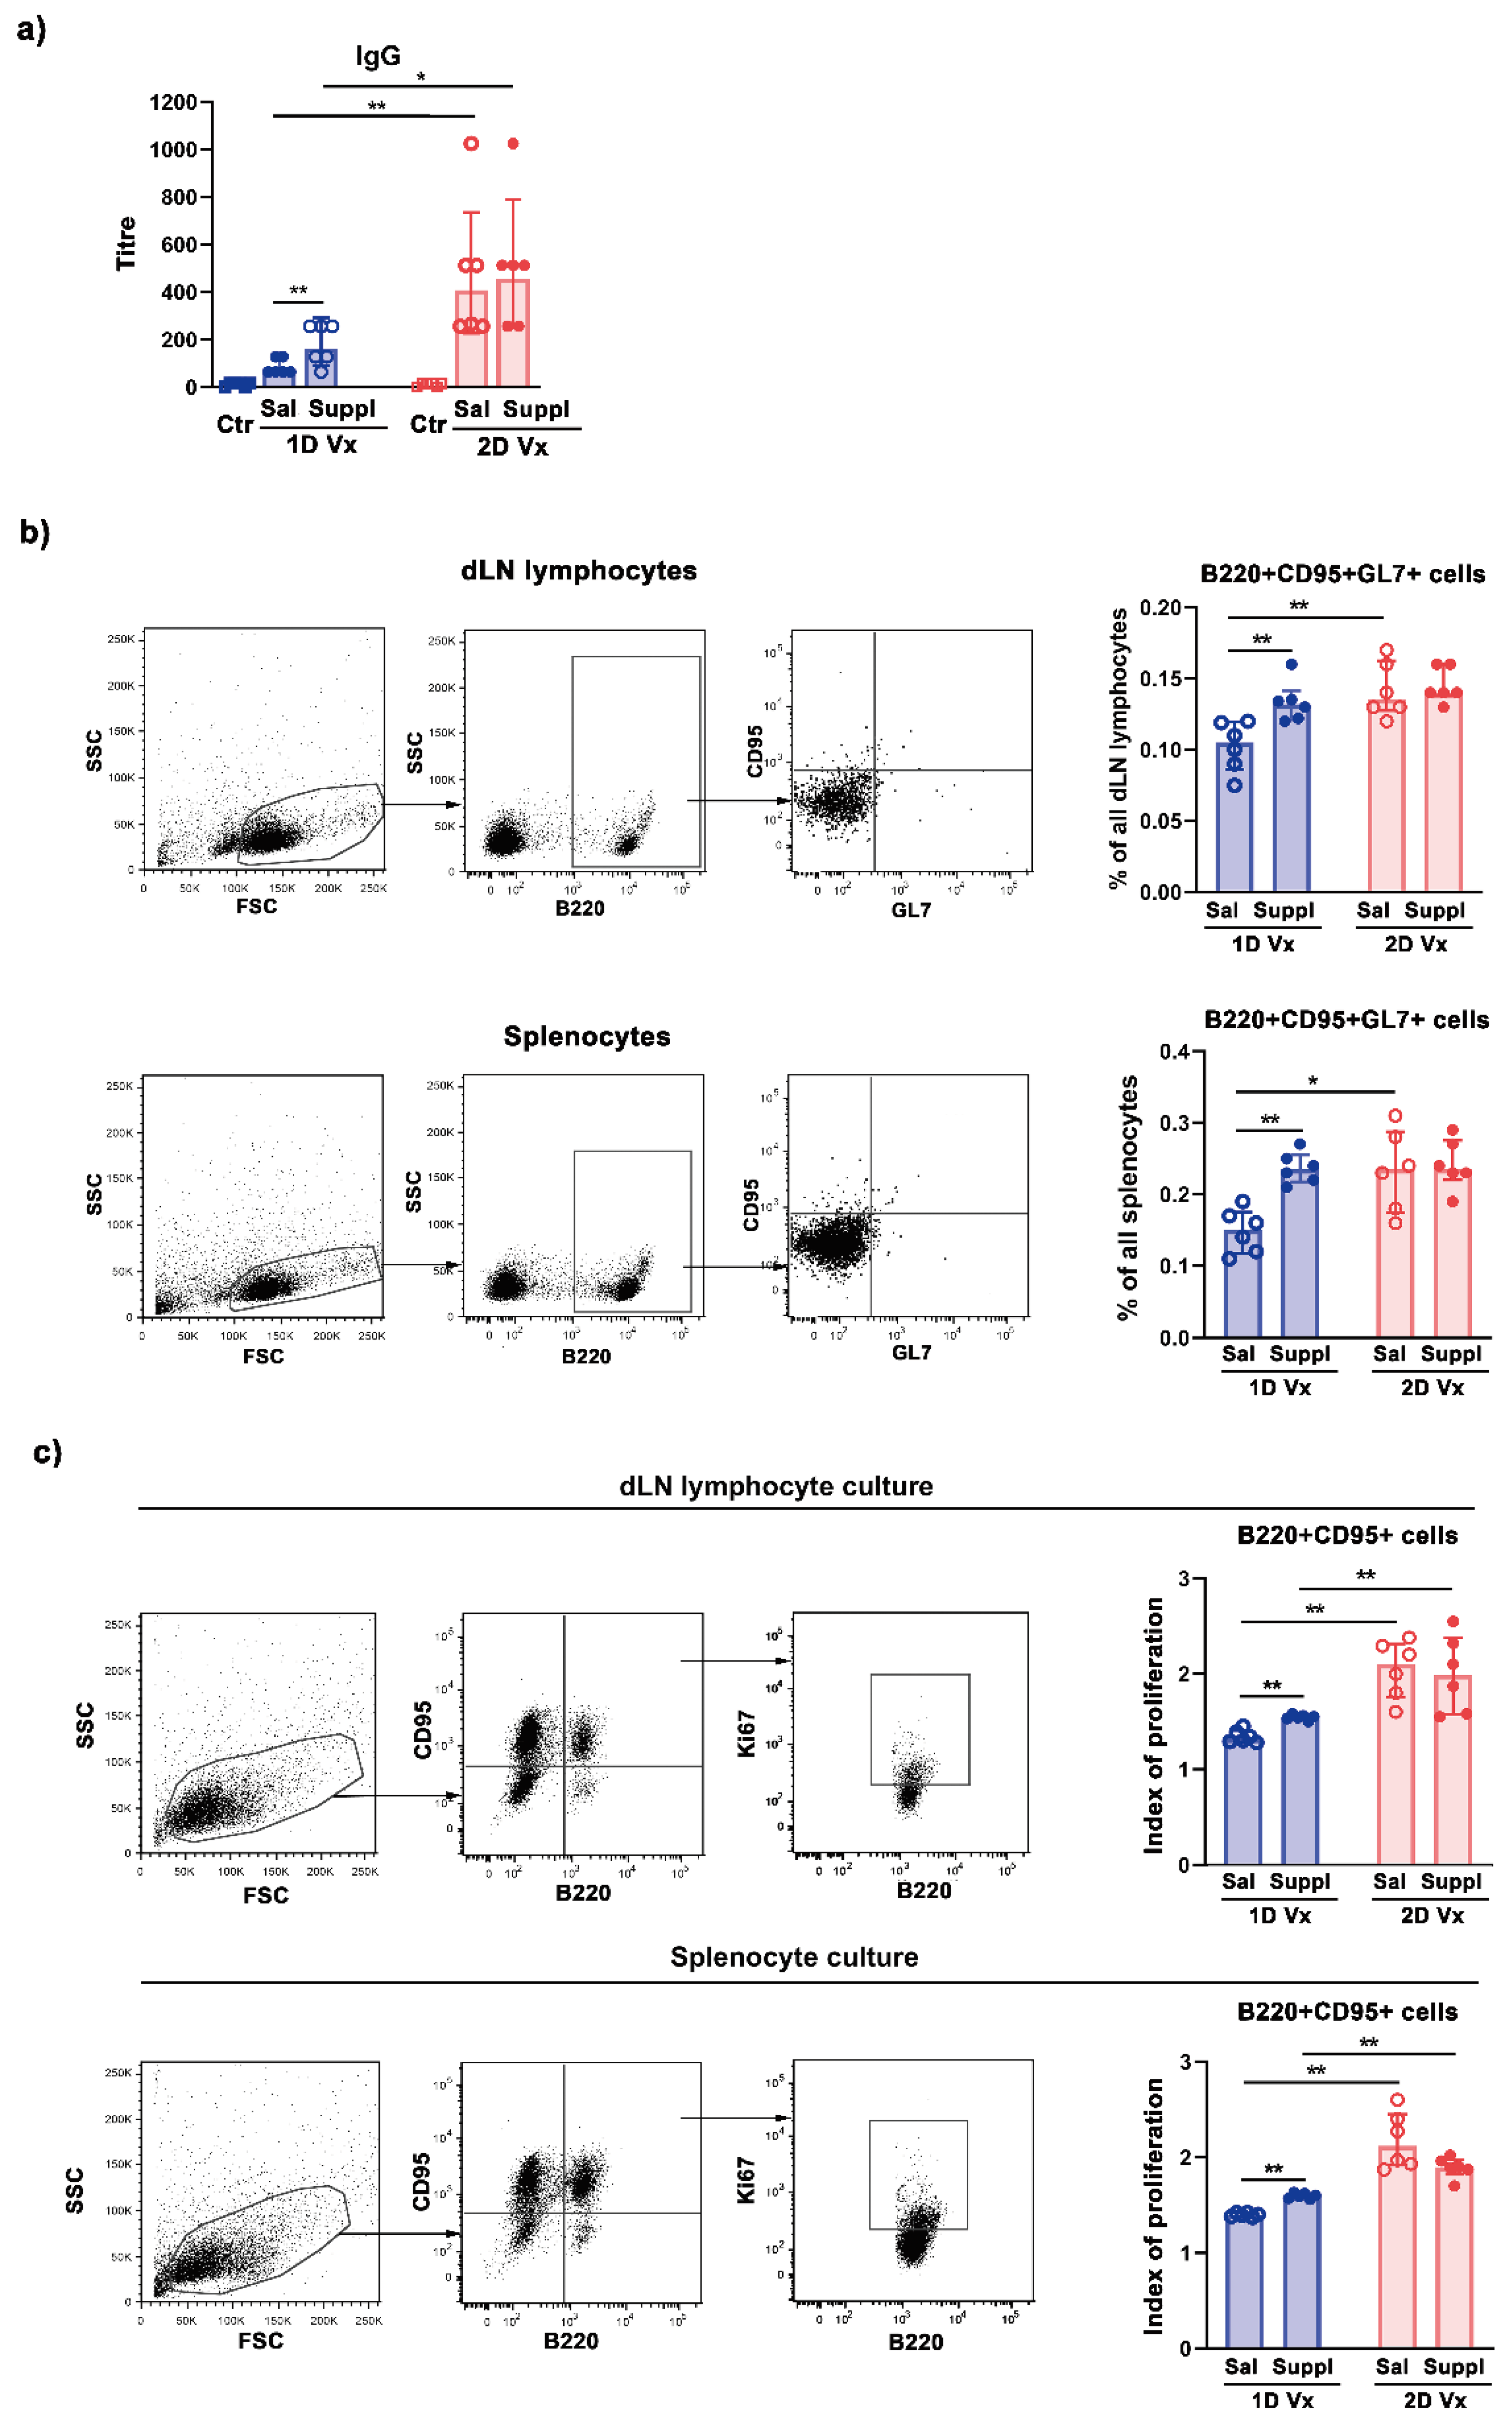
3.1. Antioxidant/Immunomodulatory Supplementation Increased the Total Titre of Influenza Virus-Specific IgG in Sera and the Frequency of GC B cells in dLNs and Spleens of Mice Injected with One Dose of QIV
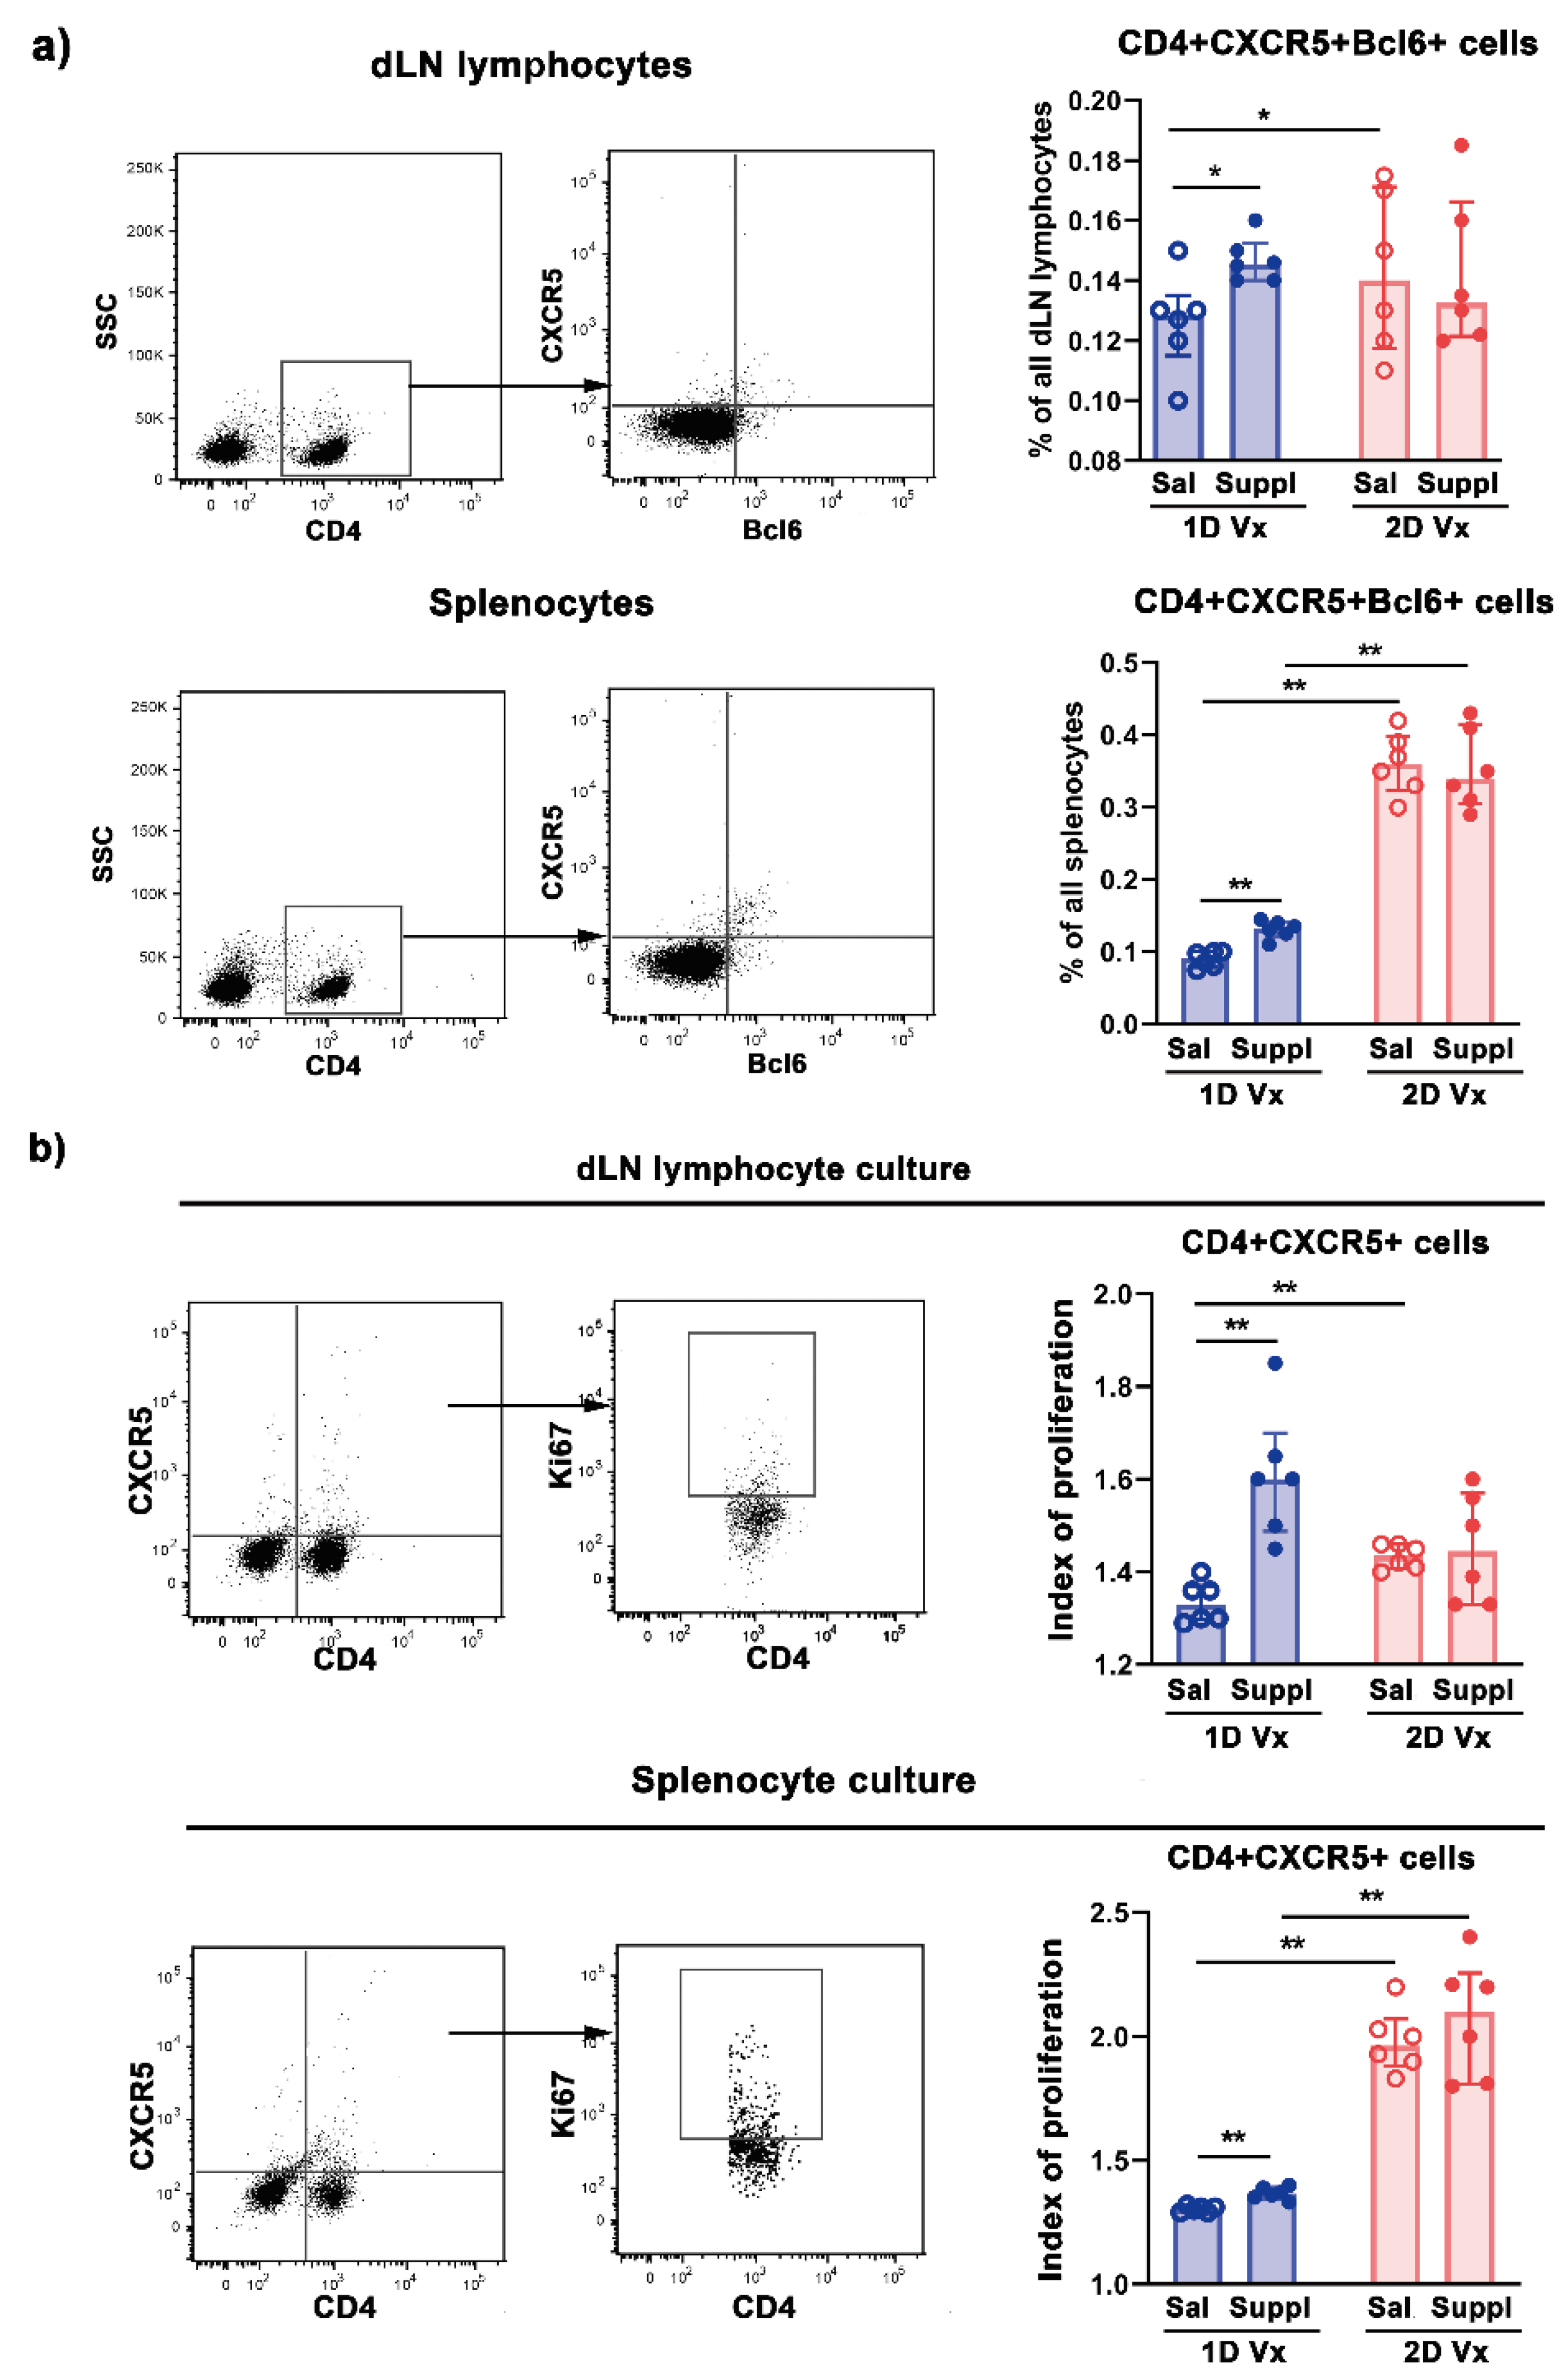
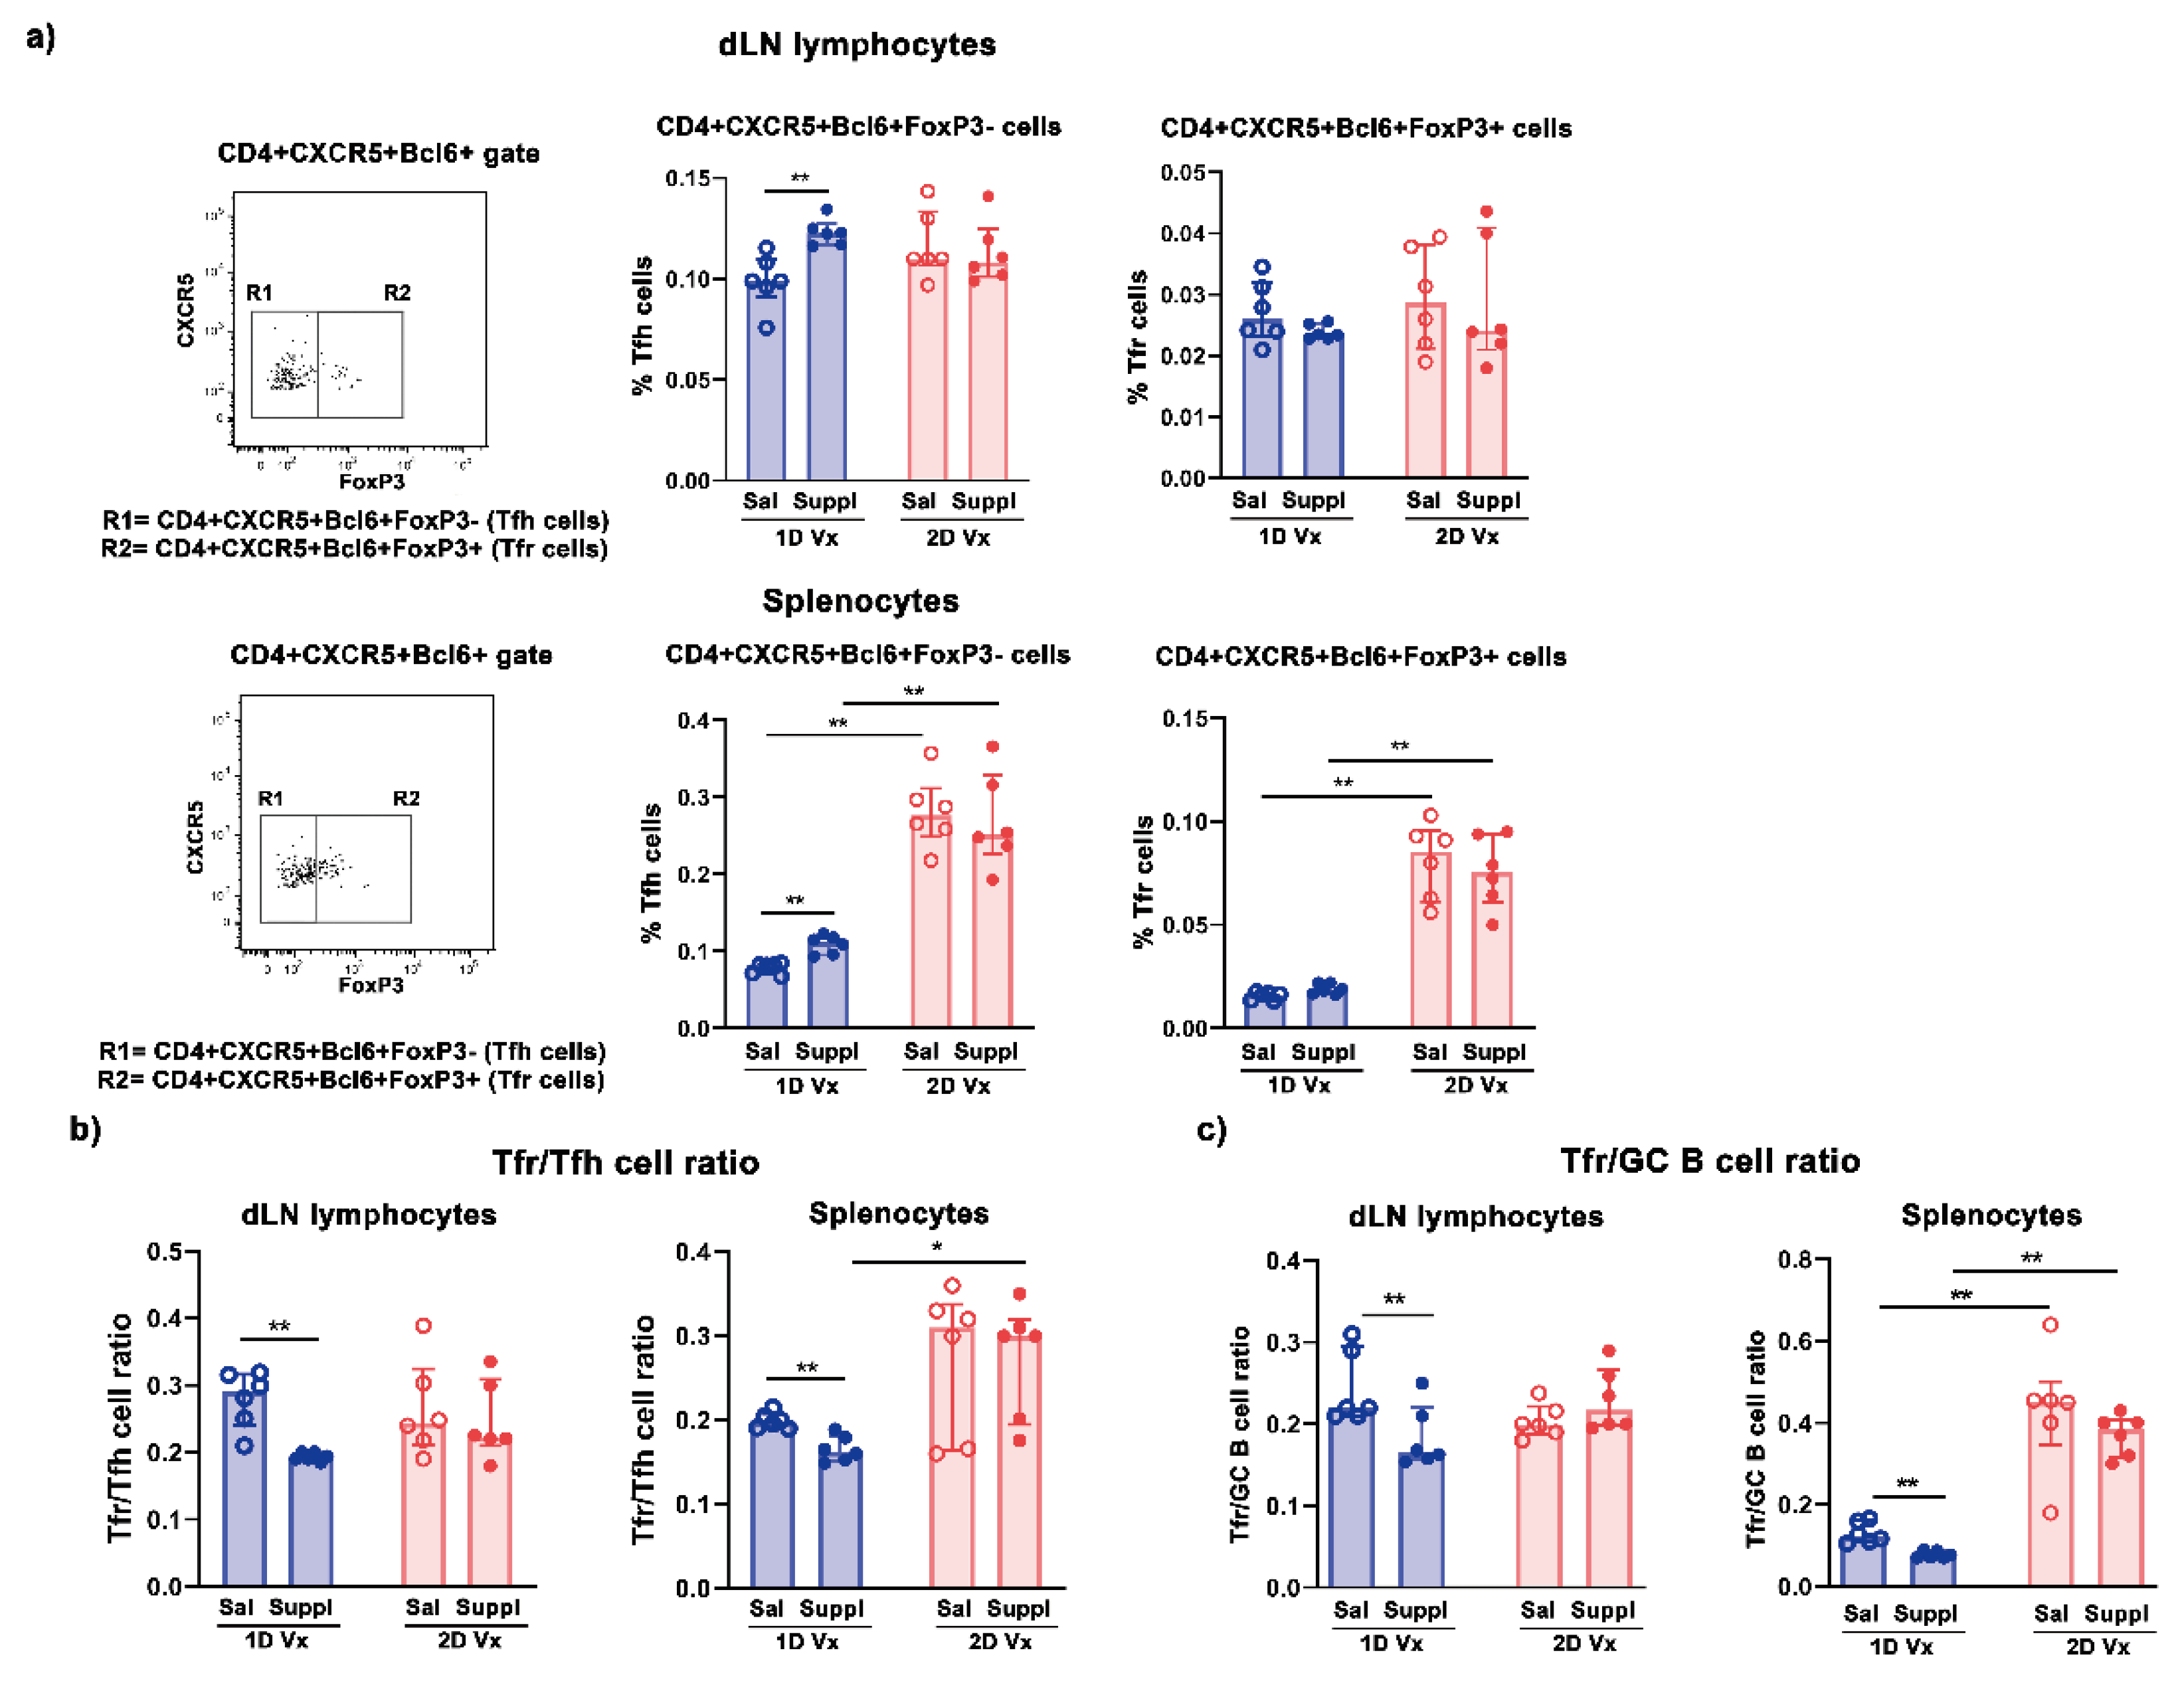
3.2. Supplementation with Anti-Oxidants/Immunomodulators Increased the Frequency of Tfh Cells Only in SLOs from Mice Injected with One Dose of QIV
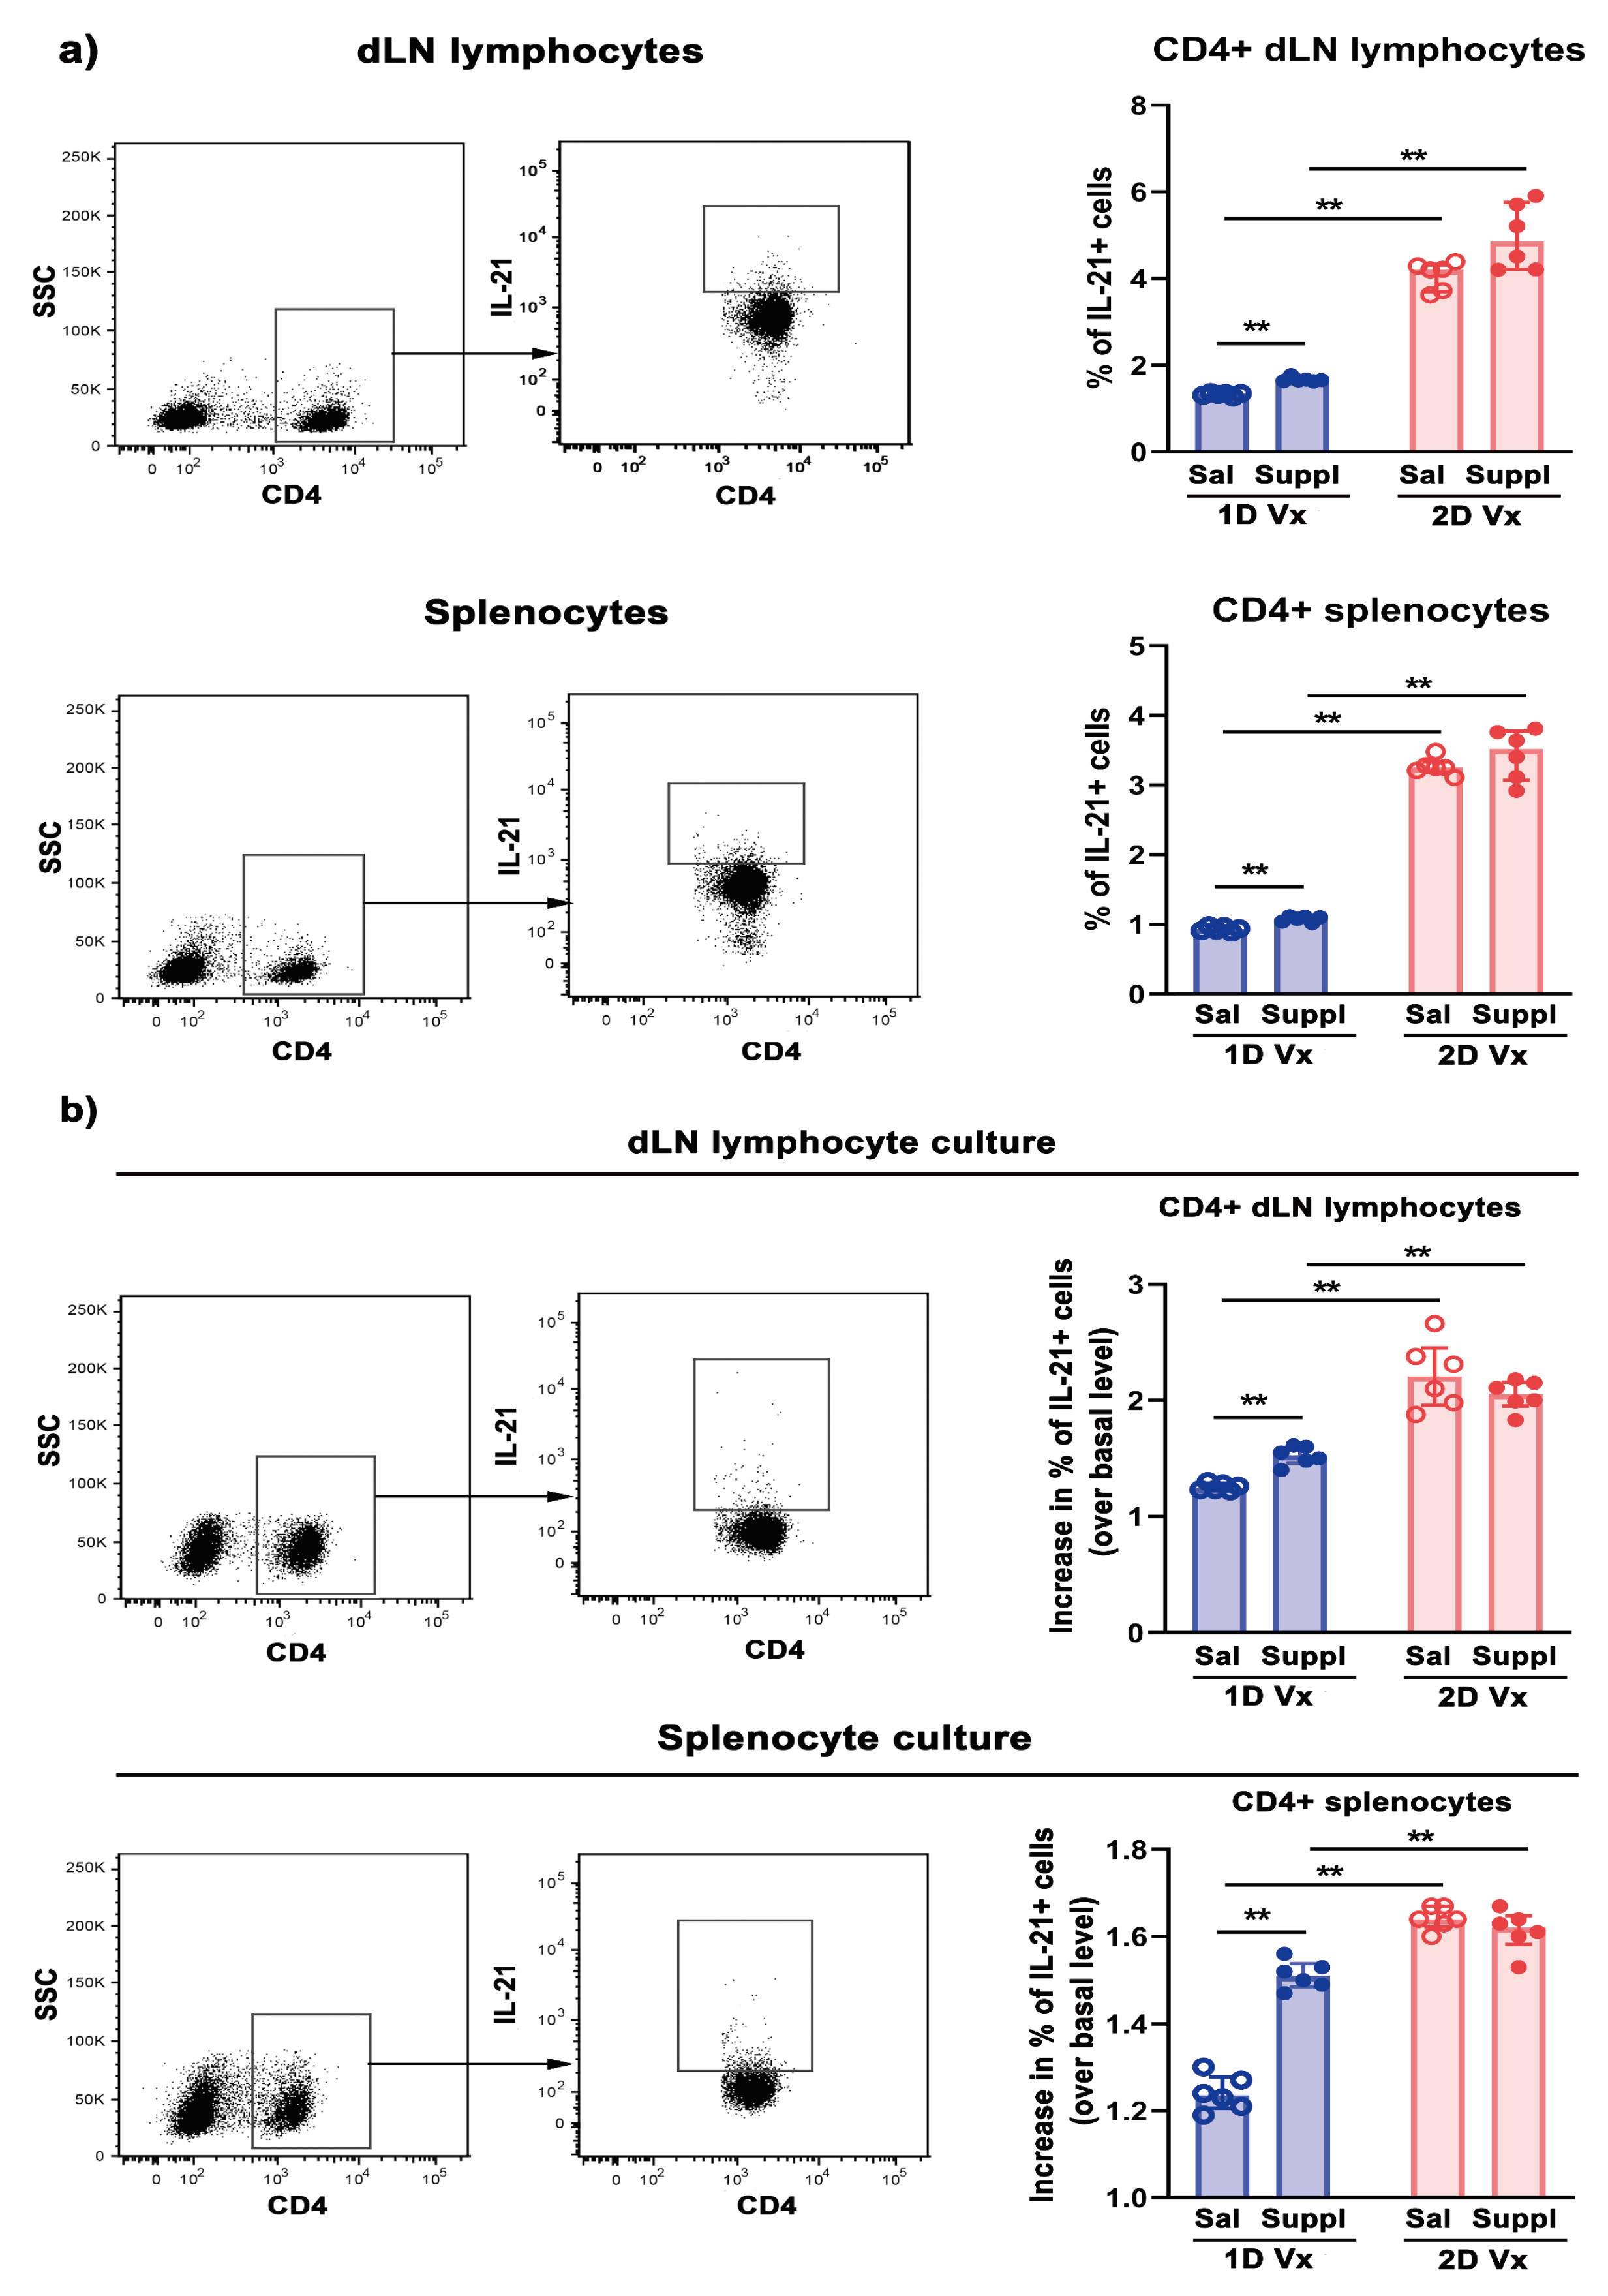
3.3. Different Effects of Supplementation with Antioxidants/Immunomodulators on the Frequency of IL-21+CD4+ Cells in SLOs from Mice Injected with One and Two Doses of QIV
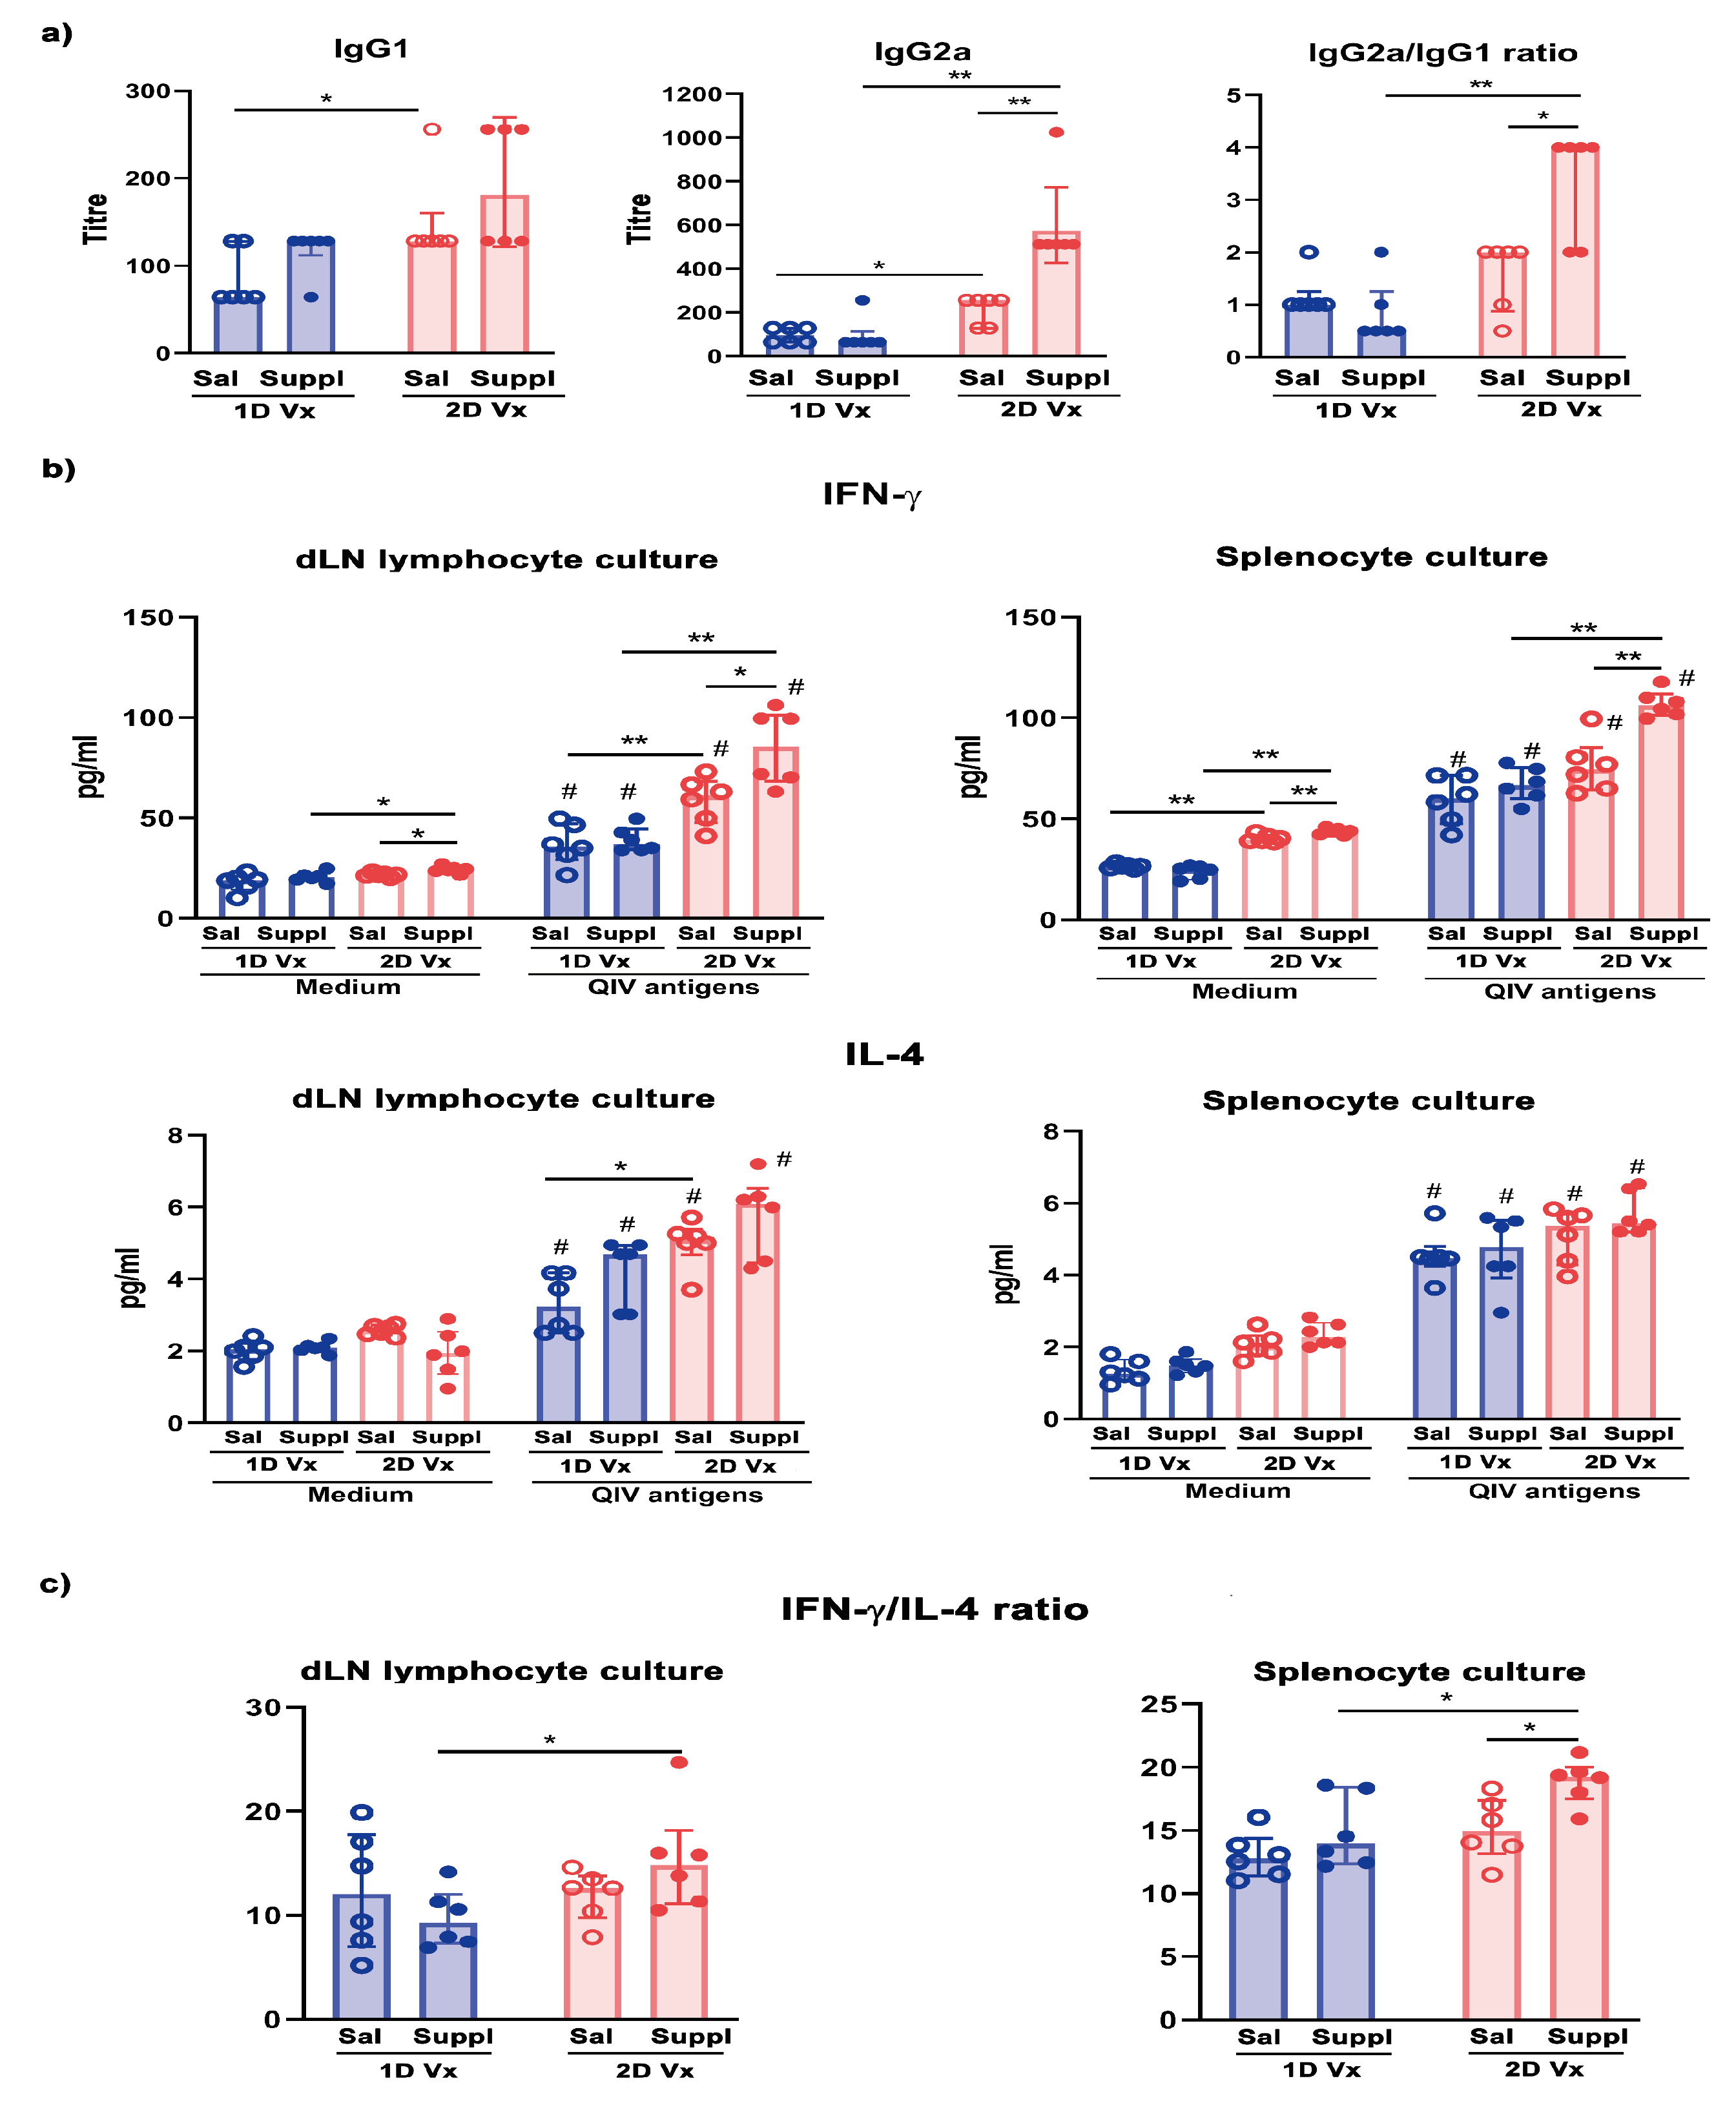
3.4. Antioxidant/Immunomodulatory Supplementation Affected IgG Subclass Profile Only in Mice Injected with Two Doses of QIV
4. Discussion
5. Conclusions
Author Contributions
Funding
Institutional Review Board Statement
Data Availability Statement
Acknowledgments
Conflicts of Interest
References
- World Health Organization (WHO). Influenza (seasonal). Available online: https://www.who.int/news-room/fact-sheets/detail/influenza-(seasonal)#:~:text=There%20are%20around%20a%20billion,650%20000%20respiratory%20deaths%20annually (accessed on 18. 3. 2024).
- Buchy, P.; Badur, S. Who and When to Vaccinate against Influenza. Int. J. Infect. Dis. 2020, 93, 375–387. [Google Scholar] [CrossRef] [PubMed]
- Krammer, F.; Smith, G.J.D.; Fouchier, R.A.M.; Peiris, M.; Kedzierska, K.; Doherty, P.C.; Palese, P.; Shaw, M.L.; Treanor, J.; Webster, R.G.; Garcia-Sastre, A. Influenza. Nat. Rev. Dis. Primers. 2018, 4, 3. [Google Scholar] [CrossRef] [PubMed]
- Coughlan, L.; Palese, P. Overcoming barriers in the path to a universal influenza virus vaccine. Cell. Host. Microbe. 2018, 24, 18–24. [Google Scholar] [CrossRef]
- Dhakal, S.; Klein, S.L. Host Factors Impact Vaccine Efficacy: Implications for Seasonal and Universal Influenza Vaccine Programs. J. Virol. 2019 Nov 1; 93(21), e00797-19. [CrossRef]
- Erbelding, E.J.; Post, D.; Stemmy, E.; Roberts, P.C.; Augustine, A.D.; Ferguson, S.; Paules, C.I.; Graham, B.S.; Fauci, A.S. A universal influenza vaccine: the strategic plan for the National Institute of Allergy and Infectious Diseases. J. Infect. Dis. 2018, 218(3), 347–354. [Google Scholar] [CrossRef] [PubMed]
- WHO. Ageing and Health Unit. Available online: https://www.who.int/news-room/fact-sheets/detail/ageing-and-health (accessed 18.3.2024.).
- Goodwin, K.; Viboud, C.; Simonsen, L. Antibody Response to Influenza Vaccination in the Elderly: A Quantitative Review. Vaccine 2006, 24, 1159–1169. [Google Scholar] [CrossRef]
- Jackson, M.L.; Phillips, C.H.; Benoit, J.; Kiniry, E.; Madziwa, L.; Nelson, J.C.; Jackson, L.A. The Impact of Selection Bias on Vaccine. Vaccine 2018, 36(5), 751–757. [Google Scholar] [CrossRef]
- Muller, L.; Andree, M.; Moskorz, W.; Drexler, I.; Walotka, L.; Grothmann, R.; Ptok, J.; Hillebrandt, J.; Ritchie, A.; Rabl, D.; Ostermann, P.N.; Robitzsch, R.; Hauka, S.; Walker, A.; Menne, C.; Grutza, R.; Timm, J.; Adams, O.; Schaal, H. Age-dependent immune response to the Biontech/Pfizer BNT162b2 COVID-19 vaccination. Clin. Infect. Dis. 2021, 73(11), 2065–2072. [Google Scholar] [CrossRef] [PubMed]
- Plotkin, S.A. Correlates of protection induced by vaccination. Clin. Vaccine Immunol. 2010, 17, 1055–1065. [Google Scholar] [CrossRef]
- Wouters-Wesseling, W.; Rozendaal, M.; Snijder, M.; Graus, Y.; Rimmelzwaan, G.; De Groot, L.; Bindels, J. Effect of a Complete Nutritional Supplement on Antibody Response to Influenza Vaccine in Elderly People. J. Gerontol. A Biol. Sci. Med. Sci. 2002, M563–M566. [Google Scholar] [CrossRef]
- Carr, A.C.; Maggini, S. Vitamin C and Immune Function. Nutrients 2017, 9(11), 1211. [Google Scholar] [CrossRef]
- Hemilä, H.; Fitzgerald, J.T.; Petrus, E.J.; Prasad, A. Zinc acetate lozenges may improve the recovery rate of common cold patients: an individual patient data meta-analysis. Open. Forum. Infect. Dis. 2017, 4(2), ofx059. [Google Scholar] [CrossRef] [PubMed]
- Jayawardena, R.; Sooriyaarachchi, P.; Chourdakis, M.; Jeewandara, C.; Ranasinghe, P. Enhancing immunity in viral infections, with special emphasis on COVID-19: A review. Diabetes Metab. Syndr. 2020, 14(4), 367–382. [Google Scholar] [CrossRef]
- Steinbrenner, H.; Al-Quraishy, S.; Dkhil, M.A.; Wunderlich, F.; Sies, H. Dietary Selenium in Adjuvant Therapy of Viral and Bacterial Infections. Adv. Nutr. 2015, 6(1), 73–82. [Google Scholar] [CrossRef]
- Schloss, J.; Leach, M.; Brown, D.; Hannan, N.; Kendall-Reed, P.; Steelc, A. The effects of N-acetyl cysteine on acute viral respiratory infections in humans: A rapid review. Adv. Integr. Med. 2020, 7(4): 232–239. [CrossRef]
- Weiss, G.; Carver, P.L. Role of divalent metals in infectious disease susceptibility and outcome. Clin. Microbiol. Infect. 2018, 24, 16–23. [Google Scholar] [CrossRef] [PubMed]
- Gombart, A.F.; Pierre, A.; Maggini, S. A Review of Micronutrients and the Immune System—Working in Harmony to Reduce the Risk of Infection. Nutrients 2020, 12(1), 236. [Google Scholar] [CrossRef]
- Calder, P.C.; Berger, M.M.; Gombart, A.F.; McComsey, G.A.; Martineau, A.R.; Eggersdorfer, M. Micronutrients to Support Vaccine Immunogenicity and Efficacy. Vaccines 2022, 10(4), 568. [Google Scholar] [CrossRef]
- Sage, P.T.; Alvarez, D.; Godec, J.; von Andrian, U.H.; Sharpe, A.H. Circulating T follicular regulatory and helper cells have memory-like properties. J. Clin. Invest. 2014, 124(12), 5191–5204. [Google Scholar] [CrossRef]
- Wing, J.B.; Tekgüç, M.; Sakaguchi, S. Control of germinal center responses by Tfollicular regulatory cells. Front. Immunol. 2018, 9, 1910. [Google Scholar] [CrossRef]
- Quast, I.; Dvorscek, A.R.; Pattaroni, C.; Steiner, T. M.; McKenzie, C. I.; Pitt, C.; O’Donnel, K.; Ding, Z.; Hill, D. L.; Brink, R.; Robinson, M.J.; Zotos, D.; Tarlinton, D.M. Interleukin-21, acting beyond the immunological synapse, independently controls T follicular helper and germinal center B cells. Immunity, 2022; 55, 1414–1430.e5. [Google Scholar] [CrossRef]
- Stevens, T.L.; Bossie, A.; Sanders, V.L.; Fernandez-Botran, R. , Coffman, R.L.; Mosmann, T.R.; Vitetta, E.S. Regulation of antibody isotype secretion by subsets of antigen-specific helper T cells. Nature, 1988; 334, 255–258. [Google Scholar] [CrossRef]
- Jacob, S.; Nair, A.B.; Morsy, M.A. Dose Conversion Between Animals and Humans: A Practical Solution. Indian J. Pharm. Educ. Res. 2002, 56, 600–607. [Google Scholar] [CrossRef]
- Petrović, R.; Bufan, B.; Arsenović-Ranin, N.; Živković, I.; Minić, R.; Radojević, K.; Leposavić, G. Mouse strain and sex as determinants of immune response to trivalent influenza vaccine. Life Sci. 2018, 207, 117–126. [Google Scholar] [CrossRef]
- Alvarez, D.F.; Helm, K.; DeGregori, J.; Roederer, M.; Majka, S. Publishing flow cytometry data. Am. J. Physiol. Lung. Cell. Mol. Physiol. 2010, 298, L127–L130. [Google Scholar] [CrossRef]
- Auclair, C.; Voisin, E. Nitroblue tetrazolium reduction. In Handbook of methods for oxygen radical research, 1st ed.; Greenwald, R.A., Ed.; Publisher: CRC Press, Boca Raton, USA, 1985; pp. 123–132. [Google Scholar] [CrossRef]
- Kotur-Stevuljevic, J.; Bogavac-Stanojevic, N.; Jelic-Ivanovic, Z.; Stefanovic, A.; Gojkovic, T.; Joksic, J.; Sopic, M.; Gulan, B.; Janac, J.; Milosevic, S. Oxidative stress and paraoxonase 1 status in acute ischemic stroke patients. Atherosclerosis 2015, 241, 192–198. [Google Scholar] [CrossRef]
- Witko-Sarsat, V.; Friedlander, M.; Capeillère-Blandin, C.; Nguyen-Khoa, T.; Nguyen, A.T.; Zingraff, J.; Jungers, P.; Descamps-Latscha, B. Advanced oxidation protein products as a novel marker of oxidative stress in uremia. Kidney. Int. 1996, 49(5), 1304–1313. [Google Scholar] [CrossRef]
- Misra, H.P.; Fridovich, I. The role of superoxide anion in thautoxidation of epinephrine and a simple assay for superoxide dismutase. J. Biol. Chem. 1972, 247(10), 3170–3175. [Google Scholar] [CrossRef]
- Dimitrijević, M.; Kotur-Stevuljević, J.; Stojić-Vukanić, Z.; Vujnović, I.; Pilipović, I.; Nacka-Aleksić, M.; Leposavić, G. Sex differencein oxidative stress parameters in spinal cord of rats with experimental autoimmune encephalomyelitis: relation to neurological deficit. Neurochem. Res. 2017, 42, 481–492. [Google Scholar] [CrossRef]
- Hauge, S.; Madhun, A.; Cox, R.G.; Haaheim, L.R. Quality and Kinetics of the Antibody Response in Mice after Three Different Low-Dose Influenza Virus Vaccination Strategies. Clin. Vaccine. Immunol. 2007, 14(8), 978–983. [Google Scholar] [CrossRef]
- Wang, Y.; Shi, J.; Yan, J.; Xiao, Z.; Hou, X.; Lu, P.; Hou, S.; Mao, T.; Liu, W.; Ma, Y.; Zhang, L.; Yang, X.; Qi, H. Germinal-center development of memory B cells driven by IL-9 from follicular helper T cells. Nat. Immunol. 2017, 18, 921–930. [Google Scholar] [CrossRef]
- Shinall, S.M.; Gonzalez-Fernandez, M.; Noelle, R.J; Waldschmid, T.J. Identification of Murine Germinal Center B Cell Subsets Defined by the Expression of Surface Isotypes and Differentiation Antigens. J. Immunol. 2000, 164(11), 5729–5738. [Google Scholar] [CrossRef]
- Minton, K. Germinal-centre B cells take control. Nat. Rev. Immunol. 2008, 8, 826–827. [Google Scholar] [CrossRef]
- Stebegg, M.; Kumar, S.D.; Silva-Cayetano, A.; Fonseca, V.R.; Linterman, M.A.; Graca, L. The initiation of the GC requires both CD4+ T cells and B cells to be activated by cognate antigen. Front. Immunol. 2018, 9, 2469. [Google Scholar] [CrossRef]
- Yeh, C-H.; Finney, J.; Okada, T.; Kurosaki, T.; Kelsoe, G. Primary germinal center-resident T follicular helper cells are a physiologically distinct subset of CXCR5hiPD-1hi T follicular helper cells. Immunity, 2022; 55, 272–289.e7. [CrossRef]
- Kaneko, N.; Kuo, H-H.; Boucau, J.; Farmer, J.R.; Allard-Chamard, H.; Mahajan, V.S., Alicj Piechocka-Trocha, A.; Lefteri, K.; Osborn, M.; Bals, J.; Bartsch, Y.S.; Bonheur, N.; Caradonna, T.M.; Chevalier, J.; Chowdhury, F.; Diefenbach, T.J.; Einkauf, K.; Fallon, J.; Feldman, J.; Finn, K.K.; Pillai, S. Loss of Bcl-6-Expressing T Follicular Helper Cells and Germinal Centers in COVID-19. Cell 2020, 183, 143-157.e13. [CrossRef]
- Krishnaswamy, J.K.; Alsén, S.; Yrlid, U.; Eisenbarth, S.C.; Williams, A. Determination of T Follicular Helper Cell Fate by Dendritic Cells. Front. Immunol. 2018, 9, 2169. [Google Scholar] [CrossRef]
- Sage, P.T.; Ron-Harel, N.; Juneja, V.R.; Sen, D.R.; Maleri, S.; Sungnak, W.; Kuchroo, V.K.; Haining, W.N.; Chevrier, N.; Haigis, M.; Sharpe, A.H. Suppression by TFR cells leads to durable and selective inhibition of B cell effector function, Nat. Immunol. 2016, 17, 1436–1446. [Google Scholar] [CrossRef]
- Ding, T.; Niu, H.; Zhao, X.; Gao, C.; Li, X.; Wang, C. T Follicular Regulatory Cells: Potential Therapeutic Targets in Rheumatoid Arthritis. Front. Immunol. 2019, 10, 2709. [Google Scholar] [CrossRef]
- Lopez-Ocasio, M.; Buszko, M.; Blain, M.; Wang, K.; Shevach, E.M. T Follicular Regulatory Cell Suppression of T Follicular Helper Cell Function Is Context-Dependent in vitro. Front. Immunol. 2020, 17, 637. [Google Scholar] [CrossRef]
- Kuchen, S.; Robbins, R.; Sims, G.P.; Sheng, C.; Phillips, T.M.; Lipsky, P.E.; Ettinger, R. Essential role of IL-21 in B cell activation, expansion, and plasma cell generation during CD4+ T cell-B cell collaboration. J. Immunol. 2007, 179, 5886–5896. [Google Scholar] [CrossRef]
- Linterman, M.A.; Beaton, L.; Yu, D.; Ramiscal, R.R.; Srivastava, M.; Hogan, J.J.; Verma, N.K.; Smyth, M.J.; Rigby, R.J.; Vinuesa, C.G. IL-21 acts directly on B cells to regulate Bcl-6 expression and germinal center responses, J. Exp. Med. 2010, 207, 353–363. [Google Scholar] [CrossRef]
- Nurieva, R.I.; Chung, Y.; Hwang, D.; Yang, X.O.; Kang, H.S.; Ma, L.; Wang, Y.H.; Watowich, S.S.; Jetten, A.M.; Tian, Q.; Dong, C. Generation of T follicular helper cells is mediated by interleukin-21 but independent of T helper 1, 2, or 17 cell lineages. Immunity 2008, 29, 138–149. [Google Scholar] [CrossRef]
- Vogelzang, A.; McGuire, H.M.; Yu, D.; Sprent, J.; Mackay, C.R.; King, C. A fundamental role for interleukin-21 in the generation of T follicular helper cells. Immunity 2008, 29, 127–137. [Google Scholar] [CrossRef]
- Grodeland, G.; Fossum, E.; Bogen, B. Polarizing T and B Cell Responses by APC-Targeted Subunit Vaccines. Front. Immunol. 2015, 6, 367. [Google Scholar] [CrossRef]
- Daifalla, N.S.; Bayih, A.G.; Gedamu, L. Differential Immune Response against Recombinant Leishmania donovani Peroxidoxin 1 and Peroxidoxin 2 Proteins in BALB/c Mice. J. Immunol. Res. 2015, 348401. [Google Scholar] [CrossRef]
- King, M.R.; Ismail, A.S.; Davis, L.S.; Karp, D.R. Oxidative stress promotes polarization of human T cell differentiation toward a T helper 2 phenotype. J. Immunol. 2006, 176(5), 2765–2772. [Google Scholar] [CrossRef]
- Miller, L.T.; Watson, W.H.; Kirlin, W.G.; Ziegler, T.R.; Jones, D.P. Oxidation of the glutathione/glutathione disulfide redox state is induced by cysteine deficiency in human colon carcinoma HT29 cells. J. Nutr. 2002, 132(8), 2303–2306. [Google Scholar] [CrossRef] [PubMed]
- Cunningham-Rundles, S.; Cunningham-Rundles, C.; Dupont, B. Zinc-induced activation of human B lymphocytes. Clin. Immunol. Immunopathol. 1980, 16, 115–22. [Google Scholar] [CrossRef]
- Duchateau, J.; Delespesse, G.; Vereecke, P. Influence of oral zinc supplementation on lymphocyte response to mitogensnormal subjects. Am. J. Clin. Nutr. 1981, 34, 88–93. [Google Scholar] [CrossRef] [PubMed]
- Sadeghsoltani, F.; Mohammadzadeh, I.; Safari, M-M.; Hassanpour, P.; Izadpanah, M.; Qujeq, D.; Moein, S.; Vaghari-Tabar, M. Zinc and Respiratory Viral Infections: Important Trace Element in Anti-viral Response and Immune Regulation. Biol. Trace. Elem. Res. 2022, 200, 2556–2571. [CrossRef]
- Provinciali, M.; Montenovo, A.; Di Stefano, G.; Colombo, M.; Daghetta, L.; Cairati, M.; Veroni, C.; Cassino, R.; Della Torre, F.; Fabris, N. Effect of zinc or zinc plus arginine supplementation on antibody titre and lymphocyte subsets after influenza vaccination in elderly subjects: a randomized controlled trial. Age Ageing 1998, 27(6), 715–722. [Google Scholar] [CrossRef]
- Türk, S.; Bozfakioğlu, S.; Ecder, S.T.; Kahraman, T.; Gürel, N.; Erkoç, R.; Aysuna, N.; Türkmen, A.; Bekiroğlu, N.; Ark, E. Effects of zinc supplementation on the immune system and on antibody response to multivalent influenza vaccine in hemodialysis patients. Int. J. Artif. Organs. 1998, 21(5), 274–278. [Google Scholar] [CrossRef] [PubMed]
- Lemire, J. M.; Adams, J. S. ; R. Sakai, R.; Jordan, S.C. 1α,25-Dihydroxyvitamin D3 suppresses proliferation and immunoglobulin production by normal human peripheral blood mononuclear cells. J. Clin. Invest. 1984; 74, 657–661. [Google Scholar] [CrossRef]
- Govaert, M.T.; Thijs, C.T.; Masurel, N.; Sprenger, M.J.; Dinant, G. J.; Knottnerus, J.A. The Efficacy of Influenza Vaccination in Elderly Individuals: A Randomized Double-blind Placebo-Controlled Trial. JAMA 1994, 272, 1661–1665. [Google Scholar] [CrossRef] [PubMed]
- Principi, N.; Marchisio, P.; Terranova, L.; Zampiero, A.; Baggi, E.; Daleno, C.; Tirelli, S.; Pelucchi, C.; Esposito, S. Impact of vitamin D administration on immunogenicity of trivalent inactivated influenza vaccine in previously unvaccinated children. Hum. Vaccin. Immunother. 2013, 9, 969–974. [Google Scholar] [CrossRef]
- Daynes, R.A.; Araneo, B.A.; Hennebold, J.; Enioutina, E.; Mu, H.H. Steroids as regulators of the mammalian immune response. J. Invest. Dermatol. 1995, 105(1 Suppl), 14S–19S. [Google Scholar] [CrossRef]
- Lee, M-D.; Lin, C-H.; Lei, W-T.; Chang, H-Y.; Lee, H-C.; Yeung, C-Y.; Chiu, N-C.; Chi, H.; Liu, J-M.; Hsu, R.J.; Cheng, Y-J.; Yeh, T-L., Lin, C-J. Does Vitamin D Deficiency Affect the Immunogenic Responses to Influenza Vaccination? A Systematic Review and Meta-Analysis. Nutrients 2018, 10(4), 409. [CrossRef]
- Overbeck, S.; Rink, L.; Haase, H. Modulating the immune response by oral zinc supplementation: a single approach for multiple diseases. Arch. Immunol. Ther. Exp. 2008, 56, 15–30. [Google Scholar] [CrossRef]
- Prinz, W.; Bloch, J.; Gilich, G.; Mitchell, G. A systematic study of the effect of vitamin C supplementation on the humoral immune response in ascorbate-dependent mammals. I. The antibody response to sheep red blood cells (a T-dependent antigen) in guinea pigs. Int. J. Vitam. Nutr. Res. 1980, 50, 294–300.
- Anderson, R.; Oosthuizen, R. , Maritz, R., Theron, A.; Van Rensburg, A.J. The effects of increasing weekly doses of ascorbate on certain cellular and humoral immune functions in normal volunteers. Am. J. Clin. Nutr. 1980, 33, 71–76. [Google Scholar] [CrossRef]
- Carlson, B.A.; Yoo, M.-H.; Shrimali, R.K.; Irons, R.; Gladyshev, V.N.; Hatfield, D.L.; Park, J.M. Role of selenium-containing proteins in T-cell and macrophage function. Proc. Nutr. Soc. 2010, 69, 300–310. [Google Scholar] [CrossRef] [PubMed]
- Zhang, R.; Wang, C.; Guan, Y.; Wei X.; Sha, M.; Yi, M.; Jing, M.; Lv, M.; Guo, W.; Xu, J.; Wan, Y.; Jia X-M.; Jiang, Z. Manganese salts function as potent adjuvants. Cell. Mol. Immunol. 2021, 18, 1222–1234. [Google Scholar] [CrossRef]
- Otomaru, K.; Oishi, S.; Fujimura, Y.; Iwamoto, Y.; Nagai, K.; Ijiri, M. Effects of vitamin C supplementation on the blood oxidative stress and antibody titre against Histophilus somni vaccination in calves. J. Vet. Res. 2021, 65, 73–78. [Google Scholar] [CrossRef] [PubMed]
- Wu, M.; He, M.; Kang, Y. Vitamin C supplementation improved the efficacy of foot-and-mouth disease vaccine. Food Agricul. Immunol. 2018, 29:1, 470-483. [CrossRef]
- Demircan, K.; Chillon, T.S.; Sun, Q.; Heller, A.R.; Klingenberg, G.J.; Hirschbil-Bremer, I.M.; Seemann, P.; Diegmann, J.; Bachmann, M.; Moghaddam, A.; Schomburg, L. Humoral immune response to COVID-19 mRNA vaccination in relation to selenium status. Redox Biol. 2022, 50, 102242. [Google Scholar] [CrossRef]
- Shojadoost, B.; Taha-Abdelaziz, K.; Alkie, T.N.; Bekele-Yitbarek, A.; Barjesteh, N.; Laursen, A.; Smith, T.K.; Shojadoost, J.; Shari, S. Supplemental dietary selenium enhances immune responses conferred by a vaccine against low pathogenicity avian influenza virus. Vet. Immunol. Immunopathol. 2020, 227, 110089. [Google Scholar] [CrossRef]
- Cui, C.; Wang, S.; Lu, W.; Wang, Y.; Li, J.; Qu, K.; Yang, M.; Wang, L.; Yu, Y. The adjuvanticity of manganese for microbial vaccines via activating the IRF5 signaling pathway. Biochem. Pharmacol. 2021, 192, 114720. [Google Scholar] [CrossRef] [PubMed]
- Crotty, S. T Follicular Helper Cell Biology: A Decade of Discovery and Diseases. Immunity 2019, 50, 1132–1148. [Google Scholar] [CrossRef] [PubMed]
- Huijskens, M.J.; Walczak, M.; Koller, N., Briede, J.J.; Senden-Gijsbers, B.L.; Schnijderberg, M.C.; Bos, G.M.; Germeraad, W.T. Technical advance: Ascorbic acid induces development of double-positive T cells from human hematopoietic stem cells in the absence of stromal cells. J. Leukoc. Biol. 2014, 96, 1165–1175. [CrossRef]
- Molina, N.; Morandi, A.C.; Bolin, A.P.; Otton, R. Comparative effect of fucoxanthin and vitamin C on oxidative and functional parameters of human lymphocytes. Int. Immunopharmacol. 2014, 22, 41–50. [Google Scholar] [CrossRef]
- Manning, J.; Mitchell, B.; Appadurai, D.A.; Shakya, A.; Pierce, L.J.; Wang, H.; Nganga, V.; Swanson, P.C.; May, J.M.; Tantin, D., Spangrude, G.J. Vitamin C promotes maturation of T-cells. Antioxid. Redox Signal. 2013, 19, 2054–2067. [CrossRef]
- Winchurch, R.A.; Togo, J.; Adler, W.H. Supplemental zinc restores antibody formation in cultures of aged spleen cells. Effects of mediator production. Eur. J. Immunol. 1987, 17, 127–131. [Google Scholar] [CrossRef]
- Hoffmann, F.W.; Hashimoto, A.C.; Shafer, L.A.; Dow, S.; Berry, M.J.; Hoffmann, P.R. Dietary selenium modulates activation and differentiation of CD4+ T cells in mice through a mechanism involving cellular free thiols. J. Nutr. 2010, 140, 1155–1161. [Google Scholar] [CrossRef] [PubMed]
- Coutelier, J.P.; van der Logt, J.T.; Heessen, F.W. IgG subclass distribution of primary and secondary immune responses concomitant with viral infection. J. Immunol. 1991, 147, 1383–1386. [Google Scholar] [CrossRef]
- Reinhardt, R.L.; Liang, H.E.; Locksley, R.M. Cytokine-secreting follicular T cells shape the antibody repertoire. Nat. Immunol. 2009, 10, 385–393. [Google Scholar] [CrossRef]
- King, M.R.; Ismail, A.S.; Davis, L.S.; Karp, D.R. Oxidative stress promotes polarization of human T cell differentiation toward a T helper 2 phenotype. J. Immunol. 2006, 176(5), 2765–2772. [Google Scholar] [CrossRef] [PubMed]
- Woo, A.; Kim, J. H.; Jeong, Y. J.; Maeng, H. G.; Lee, Y. T.; Kang, J.S. Vitamin C acts indirectly to modulate isotype switching in mouse B cells. Anat. Cell Biol. 2010, 43, 25–35. [Google Scholar] [CrossRef] [PubMed]
- Chen, H-Y.; Almonte-Loya, A.; Lay, F-Y.; Hsu, M.; Johnson, E.; González-Avalos, E.; Yin, J.; Bruno, R.S.; Ma, Q.; Ghoneim, H.E.; Wozniak, D.J.; Harrison, F.E.; Lio, C-W.J. Epigenetic remodeling by vitamin C potentiates plasma cell differentiation. eLife 2022, 11, e73754. [CrossRef]
- Salas, M.; Kirchner, H. Induction of interferon-γ in human leukocyte cultures stimulated by Zn2+. Clin. Immunol. Immunopathol. 1987, 45, 139–142. [Google Scholar] [CrossRef] [PubMed]
- Prasad, A.S. Effects of zinc deficiency on Th1 and Th2 cytokine shifts. J. Infect. Dis. 2000, 182(1), S62–S68. [Google Scholar] [CrossRef]
- Bao, B.; Prasad, A.S.; Beck, F.W.; Godmere, M. Zinc modulates mRNA levels of cytokines. Am. J. Physiol. Endocrinol. Metab. 2003, 285, 1095–1102. [Google Scholar] [CrossRef] [PubMed]
- Beck, M.A.; Nelson, H.K.; Shi, Q.; Van Dael, P.; Schiffrin, E.J.; Blum, S.; Barclay, D.; Levander, O.A. Selenium deficiency increases the pathology of an influenza virus infection. FASEB J. 2001, 15, 1481–1483. [Google Scholar] [CrossRef]
- Hoffmann, F.W.; Hashimoto, A.C.; Shafer, L.A.; Dow, S.; Berry, M.J.; Hoffmann, P.R. Dietary selenium modulates activation and differentiation of CD4+ T cells in mice through a mechanism involving cellular free thiols. J. Nutr. 2010, 140, 1155–1161. [Google Scholar] [CrossRef]
- Sepidarkish, M.; Farsi, F.; Akbari-Fakhrabadi, M.; Namazi, N.; Almasi-Hashiani, A.; Hagiagha, A.M.; Heshmati, J. The effect of vitamin D supplementation on oxidative stress parameters: A systematic review and meta-analysis of clinical trials. Pharmacol. Res. 2019, 139, 141–152. [Google Scholar] [CrossRef] [PubMed]
- Aranow, C. Vitamin D and the Immune System. J. Investig. Med. 2011, 59(6), 881–886. [Google Scholar] [CrossRef]
- Sundaram, M.E.; Coleman, L.A. Vitamin D and Influenza. Adv. Nutr. 2012, 3, 517–525. [Google Scholar] [CrossRef] [PubMed]
- DiLillo, D.J.; Tan, G.S.; Palese, P.; Ravetch, J.V. ; Broadly neutralizing hemagglutinin stalk-specific antibodies require FcγR interactions for protection against influenza virus in vivo. Nat. Med. 2014, 20(2), 143–151. [Google Scholar] [CrossRef]
- Huber, V.C.; McKeon, R.M.; Brackin, M.N.; Miller, L.A.; Keating, R.; Brown, S.A.; Makarova, N.; Perez, D.R.; Macdonald, G.H.; McCullers, J.A. Distinct contributions of vaccine-induced immunoglobulin G1 (IgG1) and IgG2a antibodies to protective immunity against influenza. Clin. Vaccine Immunol. 2006, 13(9), 981–990. [Google Scholar] [CrossRef]
- Schmitz, N.; Beerli, R.R.; Bauer, M.; Jegerlehner, A.; Dietmeier, K.; Maudrich, M., Pumpens, P.; Saudan, P.; Bachmann, M.F. Universal vaccine against influenzavirus: linking TLR signaling to anti-viral protection. Eur. J. Immunol. 2012, 42(4), 863–869. [CrossRef]
- Potluri, T.; Fink, A.L.; Sylvia, K.E.; Dhakal, S.; Vermillion, M.S.; Vom Steeg, L.; Deshpande, S.; Narasimhan, H.; Klein, S.L. Age-associated changes in theimpact of sex steroids on influenza vaccine responses in males and females. NPJ Vaccines 2019, 4, 29. [Google Scholar] [CrossRef] [PubMed]
Disclaimer/Publisher’s Note: The statements, opinions and data contained in all publications are solely those of the individual author(s) and contributor(s) and not of MDPI and/or the editor(s). MDPI and/or the editor(s) disclaim responsibility for any injury to people or property resulting from any ideas, methods, instructions or products referred to in the content. |
© 2024 by the authors. Licensee MDPI, Basel, Switzerland. This article is an open access article distributed under the terms and conditions of the Creative Commons Attribution (CC BY) license (http://creativecommons.org/licenses/by/4.0/).


