Submitted:
30 March 2024
Posted:
01 April 2024
You are already at the latest version
Abstract
Keywords:
1. Introduction
- Service class 1: corresponds to conditions (20ºC and 65% relative humidity) where the average moisture content in most softwoods remains below 12%
- Service class 2: corresponds to conditions (20ºC and 85% relative humidity) where the average moisture content in most softwoods remains below 20%
- Service class 3: corresponds to conditions where the average moisture content in most softwoods exceeds 20%
2. Materials and Methods
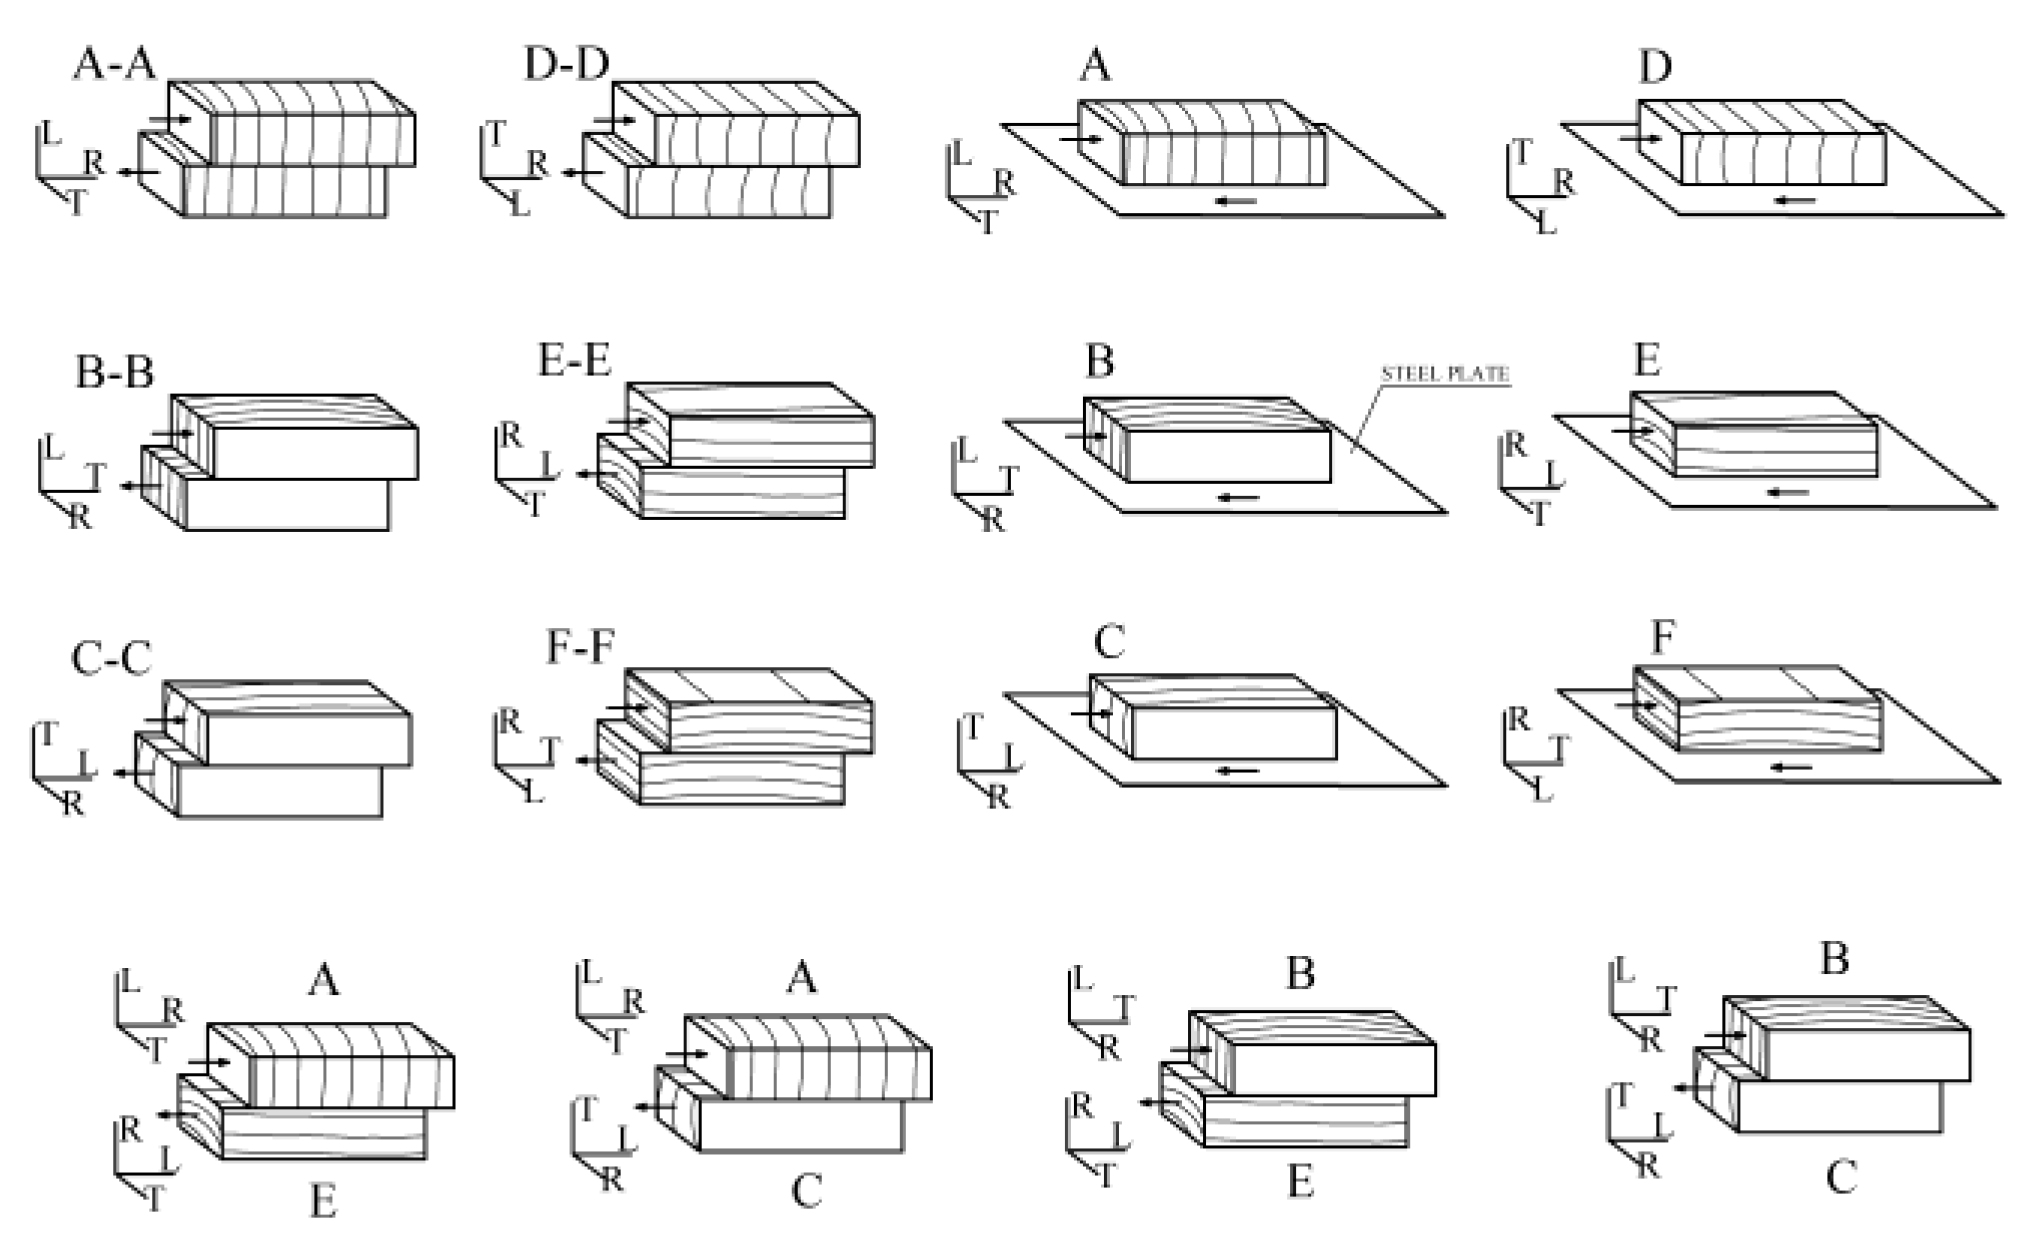
- Transverse plane (perpendicular to the fiber)
- (A) predominant direction of radial sliding (sliding parallel to the radius of the growth rings)
- (B) predominant direction of tangential sliding to the growth rings
- Radial plane defined by the axis of the three and a radius of the trunk
- (C) sliding direction parallel to the fiber (i.e., radial surfaces)
- (D) sliding direction perpendicular to the fiber
- Tangential plane (tangent to the growth rings)
- (E) sliding direction parallel to the fiber (i.e., tangential surfaces)
- (F) sliding direction perpendicular to the fiber
3. Results and Discussion
3.1. Timber-to-Timber Tests with Identical Orientations
3.2. Timber-to-Timber Tests with Different Orientations
3.3. Timber-to-Steel Tests
3.4. Correlation between μk and μs
3.5. Influence of the Moisture Content on Friction Coefficients
4. Conclusions
Author Contributions
Funding
Acknowledgments
Conflicts of Interest
References
- Roos, A.; Woxblom, L.; McCluskey, D. The Influence of Architects and Structural Engineers on Timber in Construction–Perceptions and Roles. Silva Fennica 2010, 44, 871–884. [Google Scholar] [CrossRef]
- Minunno, R.; O’Grady, T.; Morrison, G.M.; Gruner, R.L. Investigating the Embodied Energy and Carbon of Buildings: A Systematic Literature Review and Meta-Analysis of Life Cycle Assessments. Renewable and Sustainable Energy Reviews 2021, 143, 110935. [Google Scholar] [CrossRef]
- Tonelli, C.; Grimaudo, M. Timber Buildings and Thermal Inertia: Open Scientific Problems for Summer Behavior in Mediterranean Climate. Energy and Buildings 2014, 83, 89–95. [Google Scholar] [CrossRef]
- Martínez-Alonso, C.; Berdasco, L. Carbon Footprint of Sawn Timber Products of Castanea Sativa Mill. in the North of Spain. Journal of Cleaner Production 2015, 102, 127–135. [Google Scholar] [CrossRef]
- Arriaga, F.; Wang, X.; Íñiguez-González, G.; Llana, D.F.; Esteban, M.; Niemz, P. Mechanical Properties of Wood: A Review. Forests 2023, 14, 1202. [Google Scholar] [CrossRef]
- Conedera, M.; Tinner, W.; Krebs, P.; de Rigo, D.; Caudullo, G. Castanea Sativa in Europe: Distribution, Habitat, Usage and Threats. In European Atlas of Forest Tree Species; Publication Office of the European Union: Luxembourg, 2016. [Google Scholar]
- Rodríguez-Guitián, M.; Rigueiro, A.; Real, C.; Blanco, J.; Ferreiro da Costa, J. El Habitat” 9269 Bosques de Castanea Sativa” En El Extremo Noroccidental Iberico: Primeros Datos Sobre La Variabilidad Floristica de Los” Soutos”. Bulletin de la Société d’ Histoire Naturelle de Toulouse 2005, 141, 75–81. [Google Scholar]
- González-Varo, J.P.; López-Bao, J.V.; Guitián, J. Presence and Abundance of the Eurasian Nuthatch Sitta Europaea in Relation to the Size, Isolation and the Intensity of Management of Chestnut Woodlands in the NW Iberian Peninsula. Landscape Ecology 2008, 23, 79–89. [Google Scholar] [CrossRef]
- Council Directive 92/43/EEC On the Conservation of Natural Habitats and of Wild Fauna and Flora Available online: http://data.europa.eu/eli/dir/1992/43/2013-07-01.
- MITECO Forest Statistics Yearbook 2021; Spnanish Ministry for Ecological Transition and Demographic Challenge: Madrid, Spain, 2022.
- Vega, A.; Dieste, A.; Guaita, M.; Majada, J.; Baño, V. Modelling of the Mechanical Properties of Castanea Sativa Mill. Structural Timber by a Combination of Non-Destructive Variables and Visual Grading Parameters. Eur. J. Wood Prod. 2012, 70, 839–844. [Google Scholar] [CrossRef]
- The Chestnut Handbook: Crop & Forest Management; Beccaro, G. , Alma, A., Bounous, G., Gomes-Laranjo, J., Eds.; CRC Press: Boca Raton London New York, 2020; ISBN 978-0-429-44560-6. [Google Scholar]
- Carbone, F.; Moroni, S.; Mattioli, W.; Mazzocchi, F.; Romagnoli, M.; Portoghesi, L. Competitiveness and Competitive Advantages of Chestnut Timber Laminated Products. Annals of Forest Science 2020, 77, 51. [Google Scholar] [CrossRef]
- Villar, J.R.; Guaita, M.; Vidal, P.; Arriaga, F. Analysis of the Stress State at the Cogging Joint in Timber Structures. Biosystems Engineering 2007, 96, 79–90. [Google Scholar] [CrossRef]
- Villar, J.R.; Guaita, M.; Vidal, P. Numerical Simulation of Framed Joints in Sawn-Timber Roof Trusses. Span J Agric Res 2008, 6, 508. [Google Scholar] [CrossRef]
- Sjödin, J.; Serrano, E.; Enquist, B. An Experimental and Numerical Study of the Effect of Friction in Single Dowel Joints. Holz Roh Werkst 2008, 66, 363–372. [Google Scholar] [CrossRef]
- Koch, H.; Eisenhut, L.; Seim, W. Multi-Mode Failure of Form-Fitting Timber Connections – Experimental and Numerical Studies on the Tapered Tenon Joint. Engineering Structures 2013, 48, 727–738. [Google Scholar] [CrossRef]
- Aira, J.R.; Íñiguez-González, G.; Guaita, M.; Arriaga, F. Load Carrying Capacity of Halved and Tabled Tenoned Timber Scarf Joint. Mater Struct 2016, 49, 5343–5355. [Google Scholar] [CrossRef]
- Villar-García, J.R.; Crespo, J.; Moya, M.; Guaita, M. Experimental and Numerical Studies of the Stress State at the Reverse Step Joint in Heavy Timber Trusses. Mater Struct 2018, 51, 17. [Google Scholar] [CrossRef]
- Villar-García, J.R.; Vidal-López, P.; Crespo, J.; Guaita, M. Analysis of the Stress State at the Double-Step Joint in Heavy Timber Structures. Materiales de Construcción 2019, 69, e196–e196. [Google Scholar] [CrossRef]
- Domínguez, M.; Fueyo, J.G.; Villarino, A.; Anton, N. Structural Timber Connections with Dowel-Type Fasteners and Nut-Washer Fixings: Mechanical Characterization and Contribution to the Rope Effect. Materials 2021, 15, 242. [Google Scholar] [CrossRef] [PubMed]
- Fonseca, E.M.M.; Leite, P.A.S.; Silva, L.D.S.; Silva, V.S.B.; Lopes, H.M. Parametric Study of Three Types of Timber Connections with Metal Fasteners Using Eurocode 5. Applied Sciences 2022, 12, 1701. [Google Scholar] [CrossRef]
- EN 1995-1-1 Eurocode 5: Design of Timber Structures - Part 1-1: General - Common Rules and Rules for Buildings; CEN: Brussels, Belgium, 2016.
- EN 1995-2 Eurocode 5: Design of Timber Structures - Part 2: Bridges; CEN: Brussels, Belgium, 2016.
- Blass, H.; Aune, P.; Choo, B.; Görlacher, R.; Grifiths, D. Timber Engineering. STEP 1: Basis of Design, Material Properties, Structural Components and Joints; Centrum Hout: Almere, Netherlands, 1995. [Google Scholar]
- Argüelles, R.; Arriaga, F.; Esteban, M.; Íñiguez, G.; Argüelles Bustillo, R. Timber Structures. Basis for Calculation [Estructuras de madera. Bases de cálculo]; AITIM. Technical Research Association of the Wood and Cork Industries: Madrid, Spain, 2013; ISBN 978-84-87381-44-7. [Google Scholar]
- Kretschmann, D.E. Wood Handbook: Wood as an Engineering Material; US Department of Agriculture, Forest Service, Forest Products Laboratory: Madison, WI, USA, 2010. [Google Scholar]
- Argüelles, R.; Arriaga, F.; Esteban, M.; Íñiguez, G.; Argüelles Bustillo, R. Timber Structures. Joints [Estructuras de madera. Uniones]; AITIM. Technical Research Association of the Wood and Cork Industries: Madrid, Spain, 2015; ISBN 978-84-87381-44-7. [Google Scholar]
- Fu, W.; Guan, H.; Chen, B. Investigation on the Influence of Moisture Content and Wood Section on the Frictional Properties of Beech Wood Surface. Tribology Transactions 2021, 64, 830–840. [Google Scholar] [CrossRef]
- Dorn, M.; Habrová, K.; Koubek, R.; Serrano, E. Determination of Coefficients of Friction for Laminated Veneer Lumber on Steel under High Pressure Loads. Friction 2021, 9, 367–379. [Google Scholar] [CrossRef]
- Villar-García, J.R.; Vidal-López, P.; Corbacho, A.J.; Moya, M. Determination of the Friction Coefficients of Chestnut (Castanea Sativa Mill.) Sawn Timber. International Agrophysics 2020, 34, 65–77. [Google Scholar] [CrossRef] [PubMed]
- Villar-García, J.R.; Vidal-López, P.; Rodríguez-Robles, D.; Moya Ignacio, M. Friction Coefficients of Chestnut (Castanea Sativa Mill.) Sawn Timber for Numerical Simulation of Timber Joints. Forests 2022, 13, 1078. [Google Scholar] [CrossRef]
- EN 13183-1 Moisture Content of a Piece of Sawn Timber - Part 1: Determination by Oven Dry Method; CEN: Brussels, Belgium, 2002.
- ASTM G115-10 Standard Guide for Measuring and Reporting Friction Coefficients; ASTM International: West Conshohocken, PA, USA, 2018.
- Villar-García, J.R.; Vidal-López, P.; Moya Ignacio, M. Device to Perform Friction Tests between Solid Bodies. Utility Model U 201932027. 2020.
- Crespo, J.; Regueira, R.; Soilán, A.; Díez, M.R.; Guaita, M. Methodology to Determine the Coefficients of Both Static and Dynamic Friction Apply to Different Species of Wood. In Proceedings of the 1st Ibero-Latin American Congress on wood in construction (CIMAD); Coimbra, Coimbra, Portugal, 11 June 2011. [Google Scholar]
- Aira, J.R.; Arriaga, F.; Íñiguez-González, G.; Crespo, J. Static and Kinetic Friction Coefficients of Scots Pine (Pinus Sylvestris L.), Parallel and Perpendicular to Grain Direction. Materiales de Construcción 2014, 64, e030. [Google Scholar] [CrossRef]
- Berman, A.; Ducker, W.; Israelachvili, J. Experimental and Theoretical Investigations of Stick-Slip Friction Mechanisms. In Physics of Sliding Friction.; Persson, B.N.J., Tosatti, E., Eds.; NATO ASI Series; Springer: Dordrecht, Netherlands, 1996; ISBN 978-94-015-8705-1. [Google Scholar]
- Möhler, K.; Herröder, W. Range of the coefficient of friction of spruce wood rough from sawing [Obere und untere Reibbeiwerte von sägerauhem Fichtenholz]. Holz als Roh-und Werkstoff 1979, 37, 27–32. [Google Scholar] [CrossRef]
- Xu, M.; Li, L.; Wang, M.; Luo, B. Effects of Surface Roughness and Wood Grain on the Friction Coefficient of Wooden Materials for Wood–Wood Frictional Pair. Tribology Transactions 2014, 57, 871–878. [Google Scholar] [CrossRef]
- McKenzie, W.M.; Karpovich, H. The Frictional Behaviour of Wood. Wood Sci.Technol. 1968, 2, 139–152. [Google Scholar] [CrossRef]
| Mean (CoV %) |
A- A | B- B | C- C | D- D | E- E | F- F |
|---|---|---|---|---|---|---|
| μs | 0.67 (15.3) |
0.71 (11.4) |
0.68 (14.4) |
0.78 (8.2) |
0.63 (13.9) |
0.73 (9.9) |
| μk | 0.42 (4.8) |
0.47 (12.7) |
0.49 (12.9) |
0.56 (16.7) |
0.46 (29.3) |
0.54 (24.6) |
| Mean (CoV %) |
A- C | A- E | B- C | B- E |
|---|---|---|---|---|
| μs | 0.70 (18.1) |
0.65 (15.6) |
0.64 (9.9) |
0.70 (10.3) |
| μk | 0.48 (25.7) |
0.45 (13.6) |
0.43 (14.3) |
0.50 (20.7) |
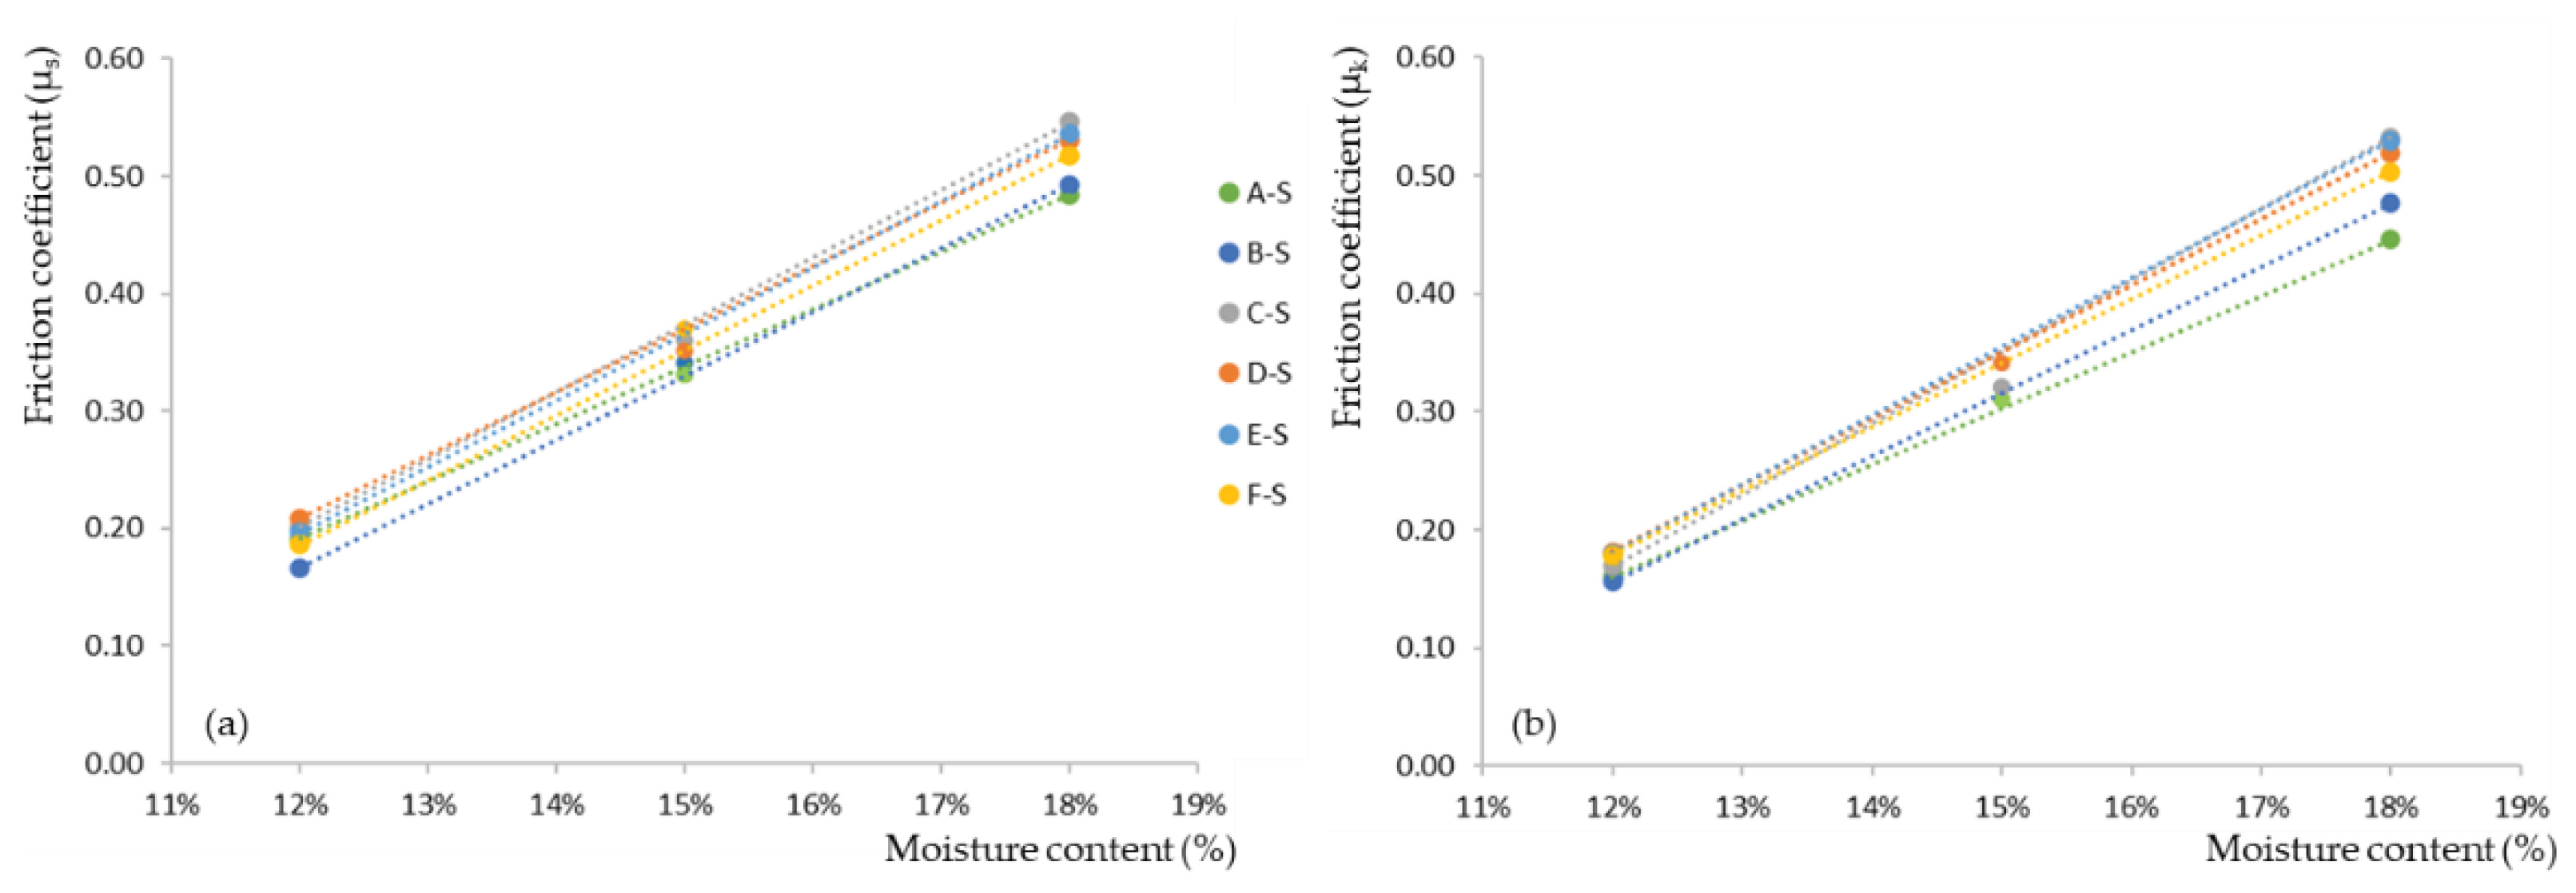
| Mean (CoV %) |
A- S | B- S | C- S | D- S | E- S | F- S |
|---|---|---|---|---|---|---|
| μs | 0.48 (2.5) |
0.49 (6.1) |
0.55 (4.6) |
0.53 (3.2) |
0.54 (4.9) |
0.52 (4.4) |
| μk | 0.45 (7.2) |
0.47 (7.2) |
0.53 (7.2) |
0.52 (3.1) |
0.53 (5.2) |
0.50 (5.3) |
| Mean (CoV %) |
A- A | B- B | C- C | D- D | E- E | F- F |
|---|---|---|---|---|---|---|
| μs | 0.67 (15.3) |
0.71 (11.4) |
0.68 (14.4) |
0.78 (8.2) |
0.63 (13.9) |
0.73 (9.9) |
| μk | 0.42 (4.8) |
0.47 (12.7) |
0.49 (12.9) |
0.56 (16.7) |
0.46 (29.3) |
0.54 (24.6) |
| Mean (CoV %) |
A- C | A- E | B- C | B- E |
|---|---|---|---|---|
| μs | 0.56 (32.0) |
0.57 (20.9) |
0.51 (26.5) |
0.56 (17.4) |
| μk | 0.44 (16.2) |
0.39 (31.7) |
0.40 (26.3) |
0.41 (25.9) |
| Mean (CoV %) |
A- S | B- S | C- S | D- S | E- S | F- S |
|---|---|---|---|---|---|---|
| μs | 0.33 (7.3) |
0.34 (17.2) |
0.36 (10.6) |
0.35 (2.9) |
0.33 (8.8) |
0.37 (17.6) |
| μk | 0.31 (8.1) |
0.31 (5.5) |
0.32 (10.2) |
0.34 (5.7) |
0.32 (5.4) |
0.32 (15.9) |
| Interpolated value (error %) |
A- A | B- B | C- C | D- D | E- E | F- F |
|---|---|---|---|---|---|---|
| μs | 0.56 | 0.55 | 0.54 | 0.65 | 0.50 | 0.64 |
| (-5.0%) | (-9.5%) | (6.4%) | (-5.7%) | (3.2%) | (-8.6%) | |
| μk | 0.37 | 0.36 | 0.40 | 0.45 | 0.37 | 0.47 |
| (-0.1%) | (9.2%) | (7.7%) | (-4.5%) | (0.0%) | (8.2%) | |
|
Interpolated value (error %) |
A- C | A- E | B- C | B- E | ||
| μs | 0.61 | 0.54 | 0.54 | 0.59 | ||
| (8.7%) | (-4.5%) | (6.8%) | (6%) | |||
| μk | 0.43 | 0.39 | 0.40 | 0.44 | ||
| (-1.2%) | (-0.4%) | (-0.9%) | (7%) | |||
|
Interpolated value (error %) |
A- S | B- S | C- S | D- S | E- S | F- S |
| μs | 0.34 | 0.33 | 0.37 | 0.37 | 0.37 | 0.35 |
| (2%) | (-3%) | (4%) | (6%) | (11%) | (-5%) | |
| μk | 0.30 | 0.32 | 0.35 | 0.35 | 0.35 | 0.34 |
| (-2%) | (2%) | (10%) | (3%) | (11%) | (6%) |
Disclaimer/Publisher’s Note: The statements, opinions and data contained in all publications are solely those of the individual author(s) and contributor(s) and not of MDPI and/or the editor(s). MDPI and/or the editor(s) disclaim responsibility for any injury to people or property resulting from any ideas, methods, instructions or products referred to in the content. |
© 2024 by the authors. Licensee MDPI, Basel, Switzerland. This article is an open access article distributed under the terms and conditions of the Creative Commons Attribution (CC BY) license (http://creativecommons.org/licenses/by/4.0/).


