1. Introduction
Low Earth Orbit (LEO) satellites typically operate at altitudes below 2000km above the Earth’s surface. Compared with Medium Earth Orbit (MEO) and High Earth Orbit (HEO) satellites, LEO satellites offer several advantages including lower orbit altitudes, faster orbital velocities, rapid geometric configuration changes, and reduced signal attenuation. The continuous advancement of aerospace technology, particularly in the commercial aerospace field, has led to the increasingly widespread application of LEO satellites in various information support roles such as communication, navigation, and remote sensing [
1,
2]. Recognizing that a single LEO satellite cannot fulfill the demand for continuous and stable global or regional services, large-scale LEO constellations have emerged as the main model for the application and advancement of LEO satellite technology [
3,
4]. The continuous progress in small satellite technology and the advent of multi-satellite launched by single rocket have significantly reduced the cost associated with launching satellites and establishing constellations. The scale of design and deployment of LEO constellations have experienced rapid growth consequently. Notable examples of LEO constellations include Starlink, StarNet, and OneWeb [
5]. Starlink is a LEO satellite Internet constellation with the designed scale of 42,000 satellites operated by American aerospace company SpaceX, which is capable of launching approximately 60 satellites per rocket. Due to September 2023, over 5200 satellites have been launched and provide service capabilities to over 2 million users worldwide. China’s Star Network System has planned a two-stage satellite constellation comprising approximately 13,000 satellites, with the aim of delivering high-speed satellite Internet services to users. Several technology verification satellites have already been launched successfully. OneWeb has developed a LEO communication constellation with global seamless coverage, intending to deploy 1980 satellites in the space segment to provide cost-effective space-based broadband access services to ground users [
6,
7]. The DOVE remote sensing constellation, which is designed and operated by Planet Labs, is the world’s largest remote sensing constellation and comprise a total of 175 satellites. The constellation employs a heterogeneous design approach, with over 100 satellites currently operational in orbit. These satellites conduct remote sensing observations over terrestrial and key maritime regions daily.
Table 1 provides an overview of the primary LEO constellations.
LEO heterogeneous giant constellations, which comprised of thousands or even tens of thousands of satellites, have emerged as the primary trajectory development of LEO information support applications in the future. Concurrently, several such LEO giant constellations may simultaneously exist in the future LEO space environment. The sustained normal operation of these large-scale LEO satellites in orbit imposes heightened demands on LEO space situational awareness, space debris environment analysis, and the accuracy and real-time performance of collision warning systems [
8,
9]. Whether for LEO satellite information support applications or collision warning analysis, precise orbit determination and rapid forecasting of LEO satellites are imperative [
10]. However, the multitude of LEO satellites, coupled with the complexity of the operational space environment, underscores the inherent variances in the dynamic environments of LEO satellites distributed among varying orbital altitudes [
11]. Vallado [
12] analyzed state vector propagation of typical satellites using different fight dynamics programs. Besides the researched numerous satellites located in multiple type orbits of LEO, MEO, HEO and GEO satellites. Since not only LEO satellites are focused, the Earth’s non-spherical gravitational field has been considered up to 70 orders, which may not be sufficient for LEO satellites, moreover the influence of the order selection of the Earth’s Ocean tide is not assessed. In order to accommodate the constraints of limited computing resources on LEO satellites, it is essential to devise a rational mechanical model for LEO satellites that strikes a balance between complexity and accuracy, and meeting the development trend of real time autonomous orbit determination and prediction of LEO satellite [
13,
14].
Within this application framework, this paper focused on optimizing the selection of LEO satellite mechanical models at different orbital altitudes and assessing the impact of typical perturbation forces on the accuracy of LEO satellite orbit prediction. The main sections are structured as follows:
Section 2 primarily elucidates LEO satellite orbits and the main typical perturbation force models. the numerical analysis experimental design and evaluation methods for LEO satellite orbit prediction are presented in
Section 3. Quantitative calculation results illustrating the impact of different perturbation forces on the orbit prediction accuracy of LEO satellites is assessed, including influence of different gravitational field orders and atmospheric models on the orbit prediction accuracy of LEO satellites. Research findings and offers insights into future directions are summarized in
Section 5.
2. Satellite Dynamical Model
In the inertial coordinate system, the motion of satellites in orbit can be described using the two-body model in the presence of perturbation forces. The dynamic equation is presented below.
where
is the universal gravitational constant,
is the total mass of the Earth,
and
represent the position, velocity and acceleration vector of the satellite respectively.
in the formula is the gravity of the center of the Earth;
is the total perturbation term caused by the perturbation force, which is the function vector of
. In the case of LEO satellites, main perturbation forces encompass Earth’s non-spherical gravity, Earth’s deformation perturbations, solar and lunar gravity, atmospheric drag, solar radiation pressure, relativistic effects, and Earth’s radiation pressure.
2.1. Non-Spherical Gravitational Perturbation of the Earth
The Earth’s non-spherical perturbation acceleration is expressed as:
where
is the transformation matrix from the Earth-fixed coordinate system to the inertial coordinate system,
is the Earth’s non-spherical gravitational perturbation acceleration, and
is the Earth’s gravitational potential function. The calculation formula is listed as follows:
where
and
are the normalized spherical harmonic coefficient of the Earth’s gravitational potential,
and
are the order of the polynomial, and
is the highest order [
15]. The calculation of
and
are shown in Equation 4.
where λ and φ represent the geocentric longitude and geocentric latitude of the unit particle in the Earth-fixed coordinate system, and
are standardized associated Legendre polynomials. When only n=2 and m=0 is considered, the formula of
is simplified to the following form in Equation 5.
Compared with MEO and HEO satellites, LEO satellites are more significantly perturbed by the Earth’s non-spherical gravity. Therefore, higher polynomial orders need to be considered. Detailed analysis is derived in
Section 4.
2.2. Deformation Perturbation of the Earth
The Earth will undergo tidal phenomena under the gravitational pull of the Sun and the Moon, leading to fluctuations in the Earth’s gravitational field. Consequently, the sum of the gravitational field coefficients and are no longer a constant. Major Earth’s deformation perturbations encompass solid tides, ocean tides, and rotational deformations.
2.2.1. Solid Tidal Perturbation of the Earth
The phenomenon of small-scale periodic solid earth change is called the Earth’s solid tides. The impact of the Earth’s solid tide model on
and
encompass two components: variations attributed to frequency-independent and frequency-dependent Love-Shida’s number [
16,
17].
The formula for calculating the coefficient change (up to the second order) resulting from the frequency-independent Love-Shida’s number is presented in Equation 6.
where
= 1, 2,
j =1, 2 correspond to the Moon and the Sun respectively,
is the second-order Love-Shida’s number,
are the geographical coordinates,
is the mass,
is the geocentric distances, and
is the tidal lag angle.
The formula for calculating the change in spherical harmonic coefficient induced by the frequency-dependent Love-Shida’s number is displayed in Equation 7.
where
is the Love-Shida’s number corresponding to the tidal level of the sub-tidal wave
,
is argument angle of the sub-tidal wave
, and
is the argument angle of the sub-tidal wave
.
2.2.2. Ocean Tide Perturbation of the Earth
The Earth’s ocean tides response to perturbations from solar and lunar tides. The calculation illustrating the influence of the additional sea tide position on the gravitational field coefficient is presented in Equation 8 [
18].
where
is the number of sub-tidal wave,
,
are the prograde wave coefficient corresponding to the sub-tidal wave
,
,
are the retrograde wave coefficient corresponding to the sub-tidal wave
. The calculation of
is shown in Equation 9.
where
is the average density of seawater and
is the load deformation coefficient.
2.2.3. Perturbation of Deformation of the Earth’s Rotation
The uneven rotation of the Earth induces deformation of the Earth is defined as the Earth’s rotation deformation. The variety of the Earth’s gravitational potential coefficient resulting from the perturbation of Earth’s rotational deformation is depicted in Equation 10.
where
is the change in day length and
is the average angular velocity of the Earth’s rotation [
15].
2.3. Atmospheric Frag Perturbation
Atmospheric drag is the most significant non-conservative perturbation force of LEO satellites. The calculation formula of analytical atmospheric drag model is presented in Equation 11.
where
is the atmospheric drag coefficient, which is related to the material of the windward surface of the satellite,
is the windward area of the satellite,
is the mass of the satellite,
is the velocity vector of the satellite relative to the atmosphere.
is the atmospheric density, which can be obtained through the atmospheric density model. Typical atmospheric density models include the standard atmospheric model, Harris-Priester model, Jacchia series, and MSIS series models [
19]. The accuracy of different atmospheric density models also varies. A detailed analysis of their impact on satellite orbit prediction accuracy is provided in
Section 4.
2.4. Third-Body’s Gravitational Perturbation
The third-body’s gravitational perturbation refers to the gravitational term exerted by celestial bodies other than the central celestial body on the satellite. The perturbation acceleration is calculated as depicted in Equation 12.
where j denotes the id of the third body,
represents the gravitational constant of the celestial body,
represents the geocentric position vector of the celestial body, and
represents the geocentric position vector of the satellite. Due to the low orbit altitude of LEO satellites, the solar and lunar gravity among the third-body’s gravitational perturbation are considered.
2.5. Solar Pressure Perturbation
The solar pressure refers to the solar radiation pressure exerted on satellites due to solar exposure. The calculation formula of analytical Cannonball solar pressure model is listed in Equation 13.
where
is the satellite surface reflection coefficient, which is related to the satellite material.
is the apparent area of the satellite illuminated.
is the eclipse factor, which is determined by the mutual positional relationship of the Sun, Earth, Moon and satellite.
is the radiation intensity of one astronomical unit from the Sun.
2.6. Radiation Pressure Perturbation of the Earth
The Earth receives solar radiation, which is partly released in the form of optical and infrared radiation, results the Earth albedo radiation pressure perturbation and Earth infrared radiation pressure perturbation respectively. The calculation formulas are presented in Equations 14 and 15.
where
is the satellite surface reflectivity coefficient,
is the incident angle of solar radiation to the satellite panel,
is the reflection angle of the Earth’s radiation panel to the satellite panel,
is the Earth’s albedo, and
is the Earth’s infrared emissivity [
20,
21].
2.7. Relativistic Effect Model
The in-orbit motion of LEO satellites will be affected by the relativistic effect, and the perturbation acceleration is calculated by Equation16.
where the first part in the formula is the Schwarzschild term, the second part is the geodetic precession term and the third part is the Lense-Thirring term.
and
are the first and second parameter of the relativistic effect respectively,
is the angular momentum of the Earth’s unit mass,
is calculated by Equation 17.
where
and
are the velocity vectors of the Earth and the Sun in the solar center of mass system respectively;
and
are the vector and distances of the Earth to the Sun respectively.
3. Experimental Designs on the Impact of Orbit Prediction Accuracy
The experimental design assessing the impact on LEO satellite orbit prediction accuracy mainly encompasses the determination of satellite orbit parameters, the establishment of the satellite orbit reference mechanics model, and the design of experiments to assess the influence on orbit forecast accuracy.
To analyze the impact of perturbation forces on orbit prediction accuracy, in order to decreasing the complexity of numerical analysis set and increasing the readability of conclusion comparisons [
22], various typical LEO orbit altitudes including 500 km, 1000 km, 1500 km, and 2000 km are considered based on the statistical results of LEO constatations in
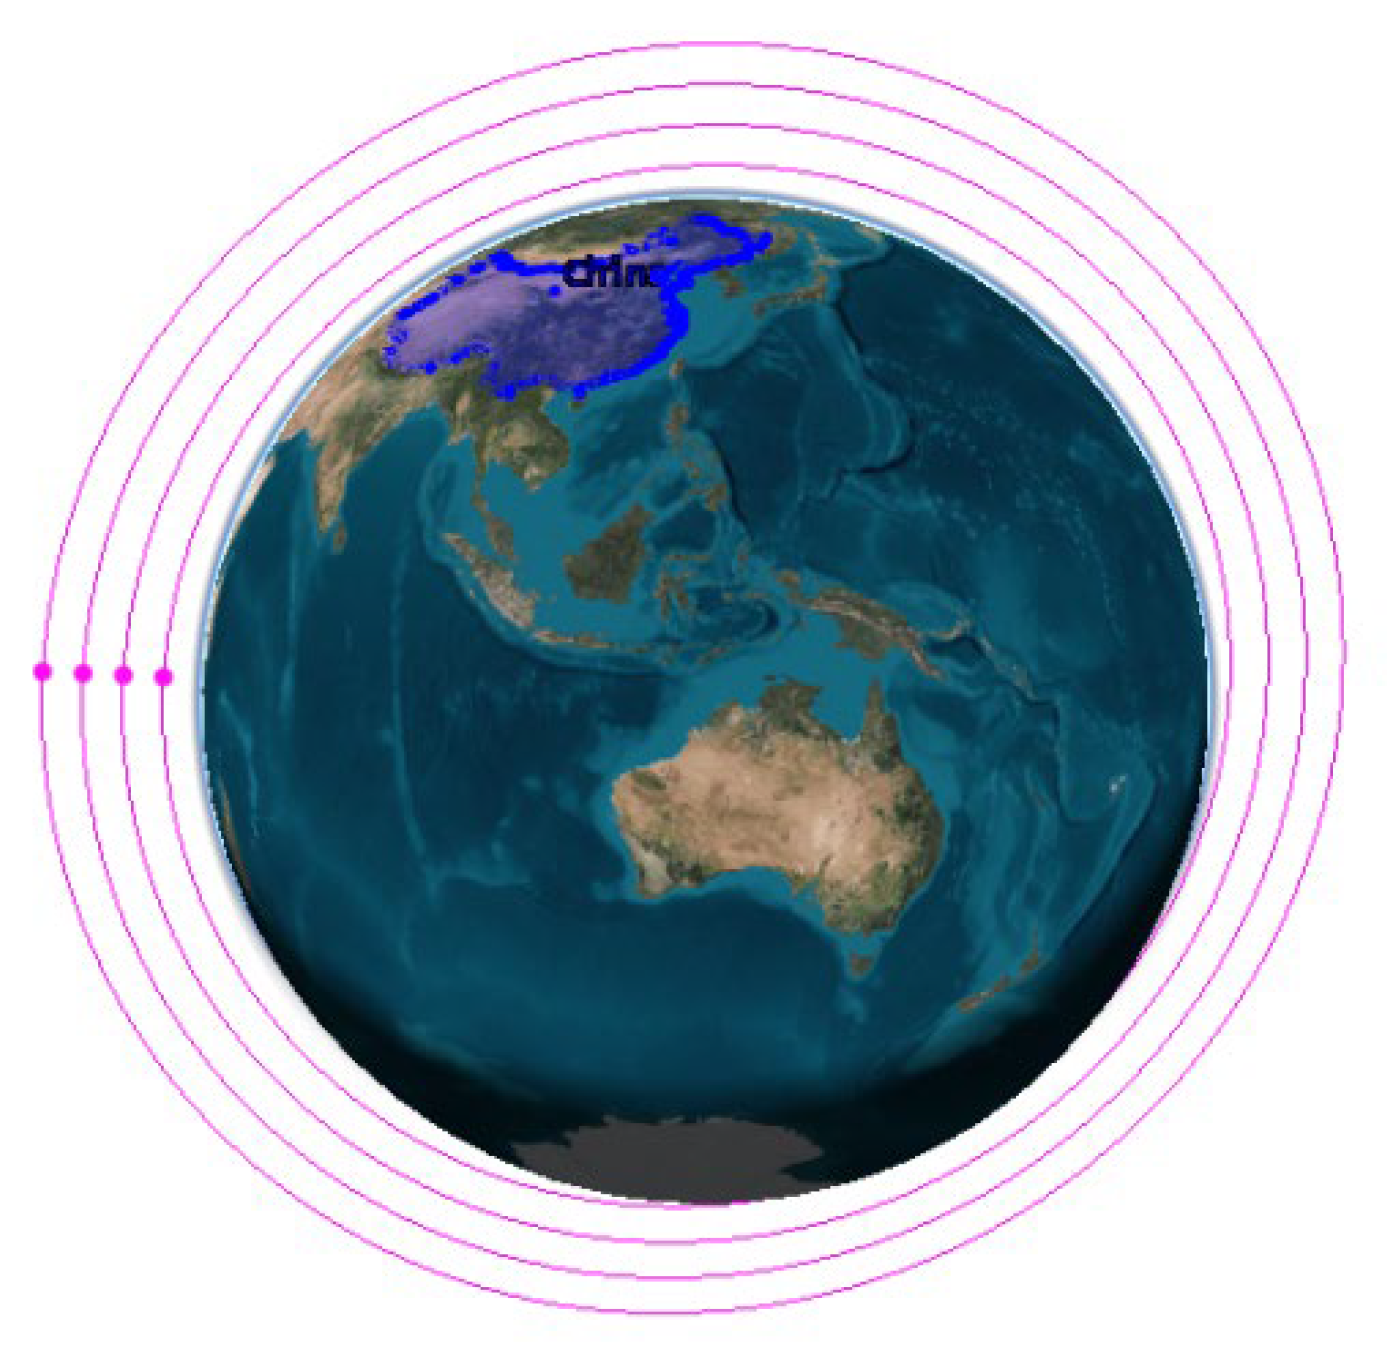
Table 1. The orbit parameters and in-orbit schematic diagrams of LEO satellites are presented in
Table 2 and
Figure 1 respectively.
Besides, values of other parameters are set: , , , , , all equals to 0.02 m2/kg in the atmospheric frag model, solar pressure model and Earth’s radiation pressure model, the initial cartesian covariance of position and velocity is 25 m2 and 1e-4 m2/s2 respectively.
RKF 7(8) is selected for numerical calculations of satellite orbit extrapolation, and the step of the extrapolation is set to 1s. The format of RKF 7(8) is listed in Equation 18.
The
in Equation 18 is calculated by Equation 19, which is listed as follows.
The value of the coefficient
,
,
and
are listed in
Table 3.
The reference orbit dynamical model used in analyzing the impact of LEO satellite orbit prediction accuracy is constructed as depicted in
Table 4.
In the analysis of typical perturbation forces influence on the orbit forecast accuracy of LEO satellites, two types of orbit forecasts were performed. The reference orbit is predicted one day considering all the reference perturbation in
Section 2, on the contrary, the assessment orbit of LEO satellite is predicted without considering a certain perturbation force successively. Deviations between the reference orbit and the assessment orbit in accuracy were recorded at intervals of 1 hour, 6 hours, and 24 hours to assess the impact of each perturbation on LEO satellite orbit prediction accuracy. Specific experiments were designed to explore the effects of different perturbation forces, the selection of Earth’s non-spherical gravity field orders, the selection of ocean tide orders, and the difference of various atmospheric density models on LEO satellite orbit forecast accuracy. Detailed analysis results are presented in the next section.
4. Analysis of the Impact of Orbit Prediction Accuracy
4.1. The Impact of Typical Perturbation Forces on the Orbit Prediction Accuracy of LEO Satellites
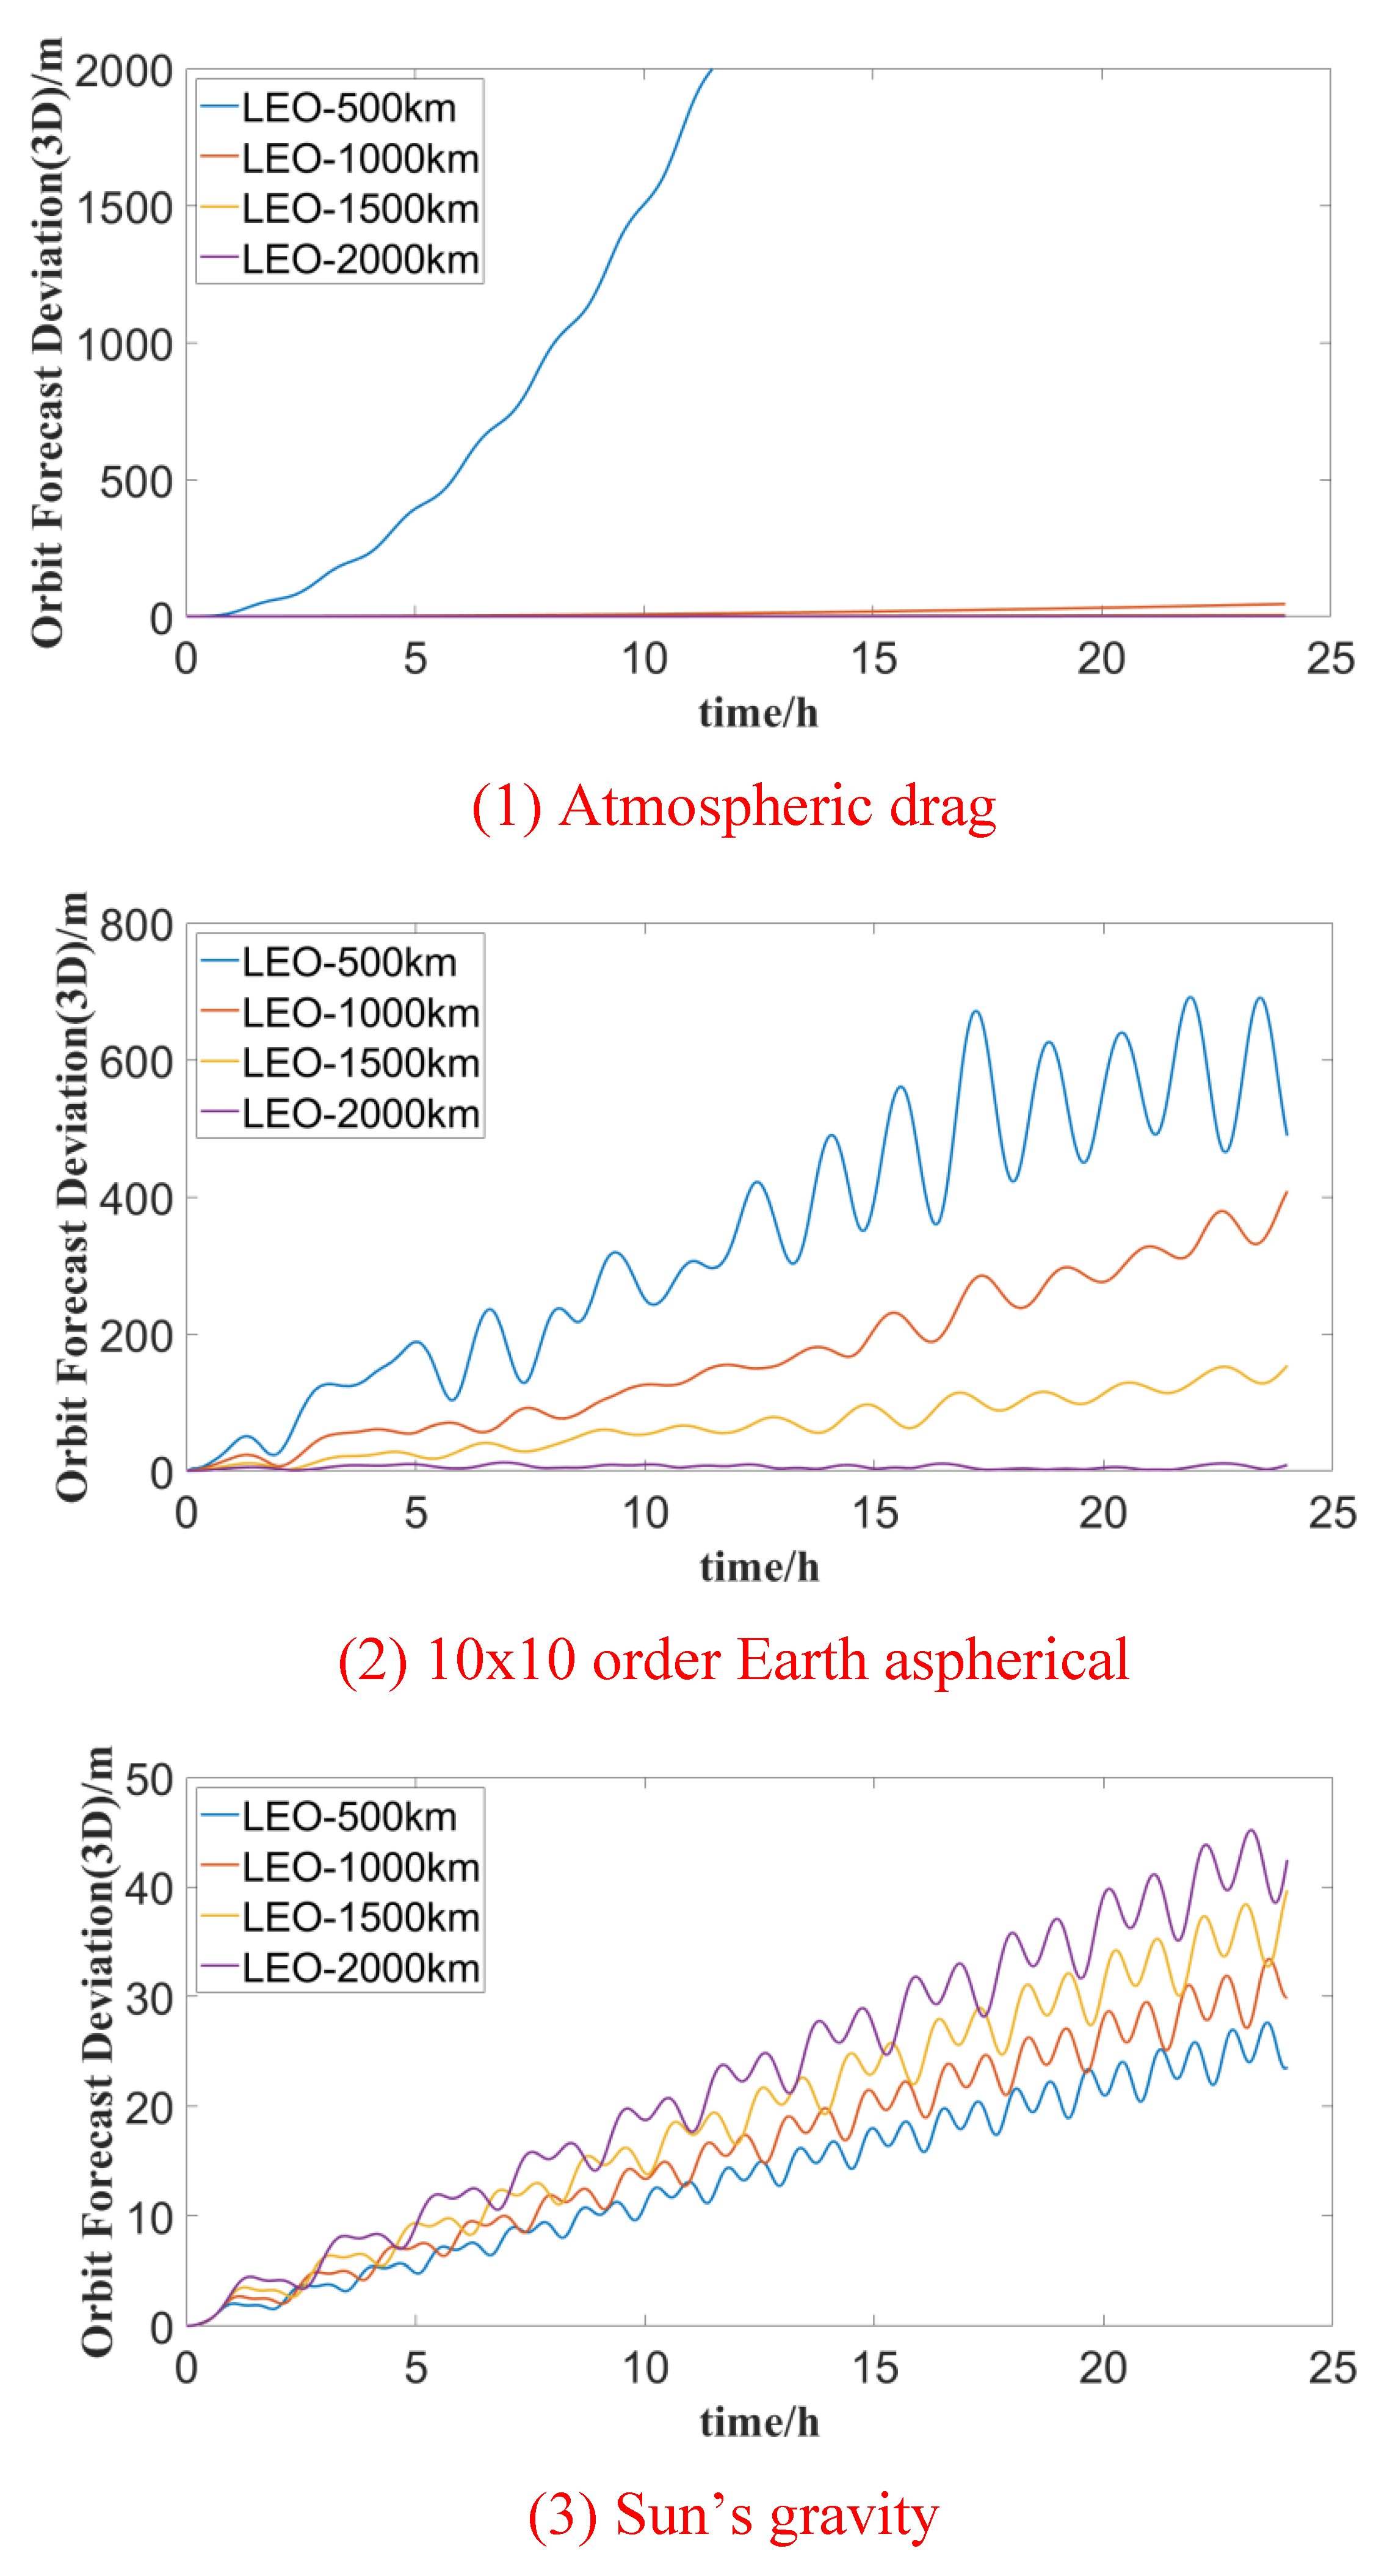
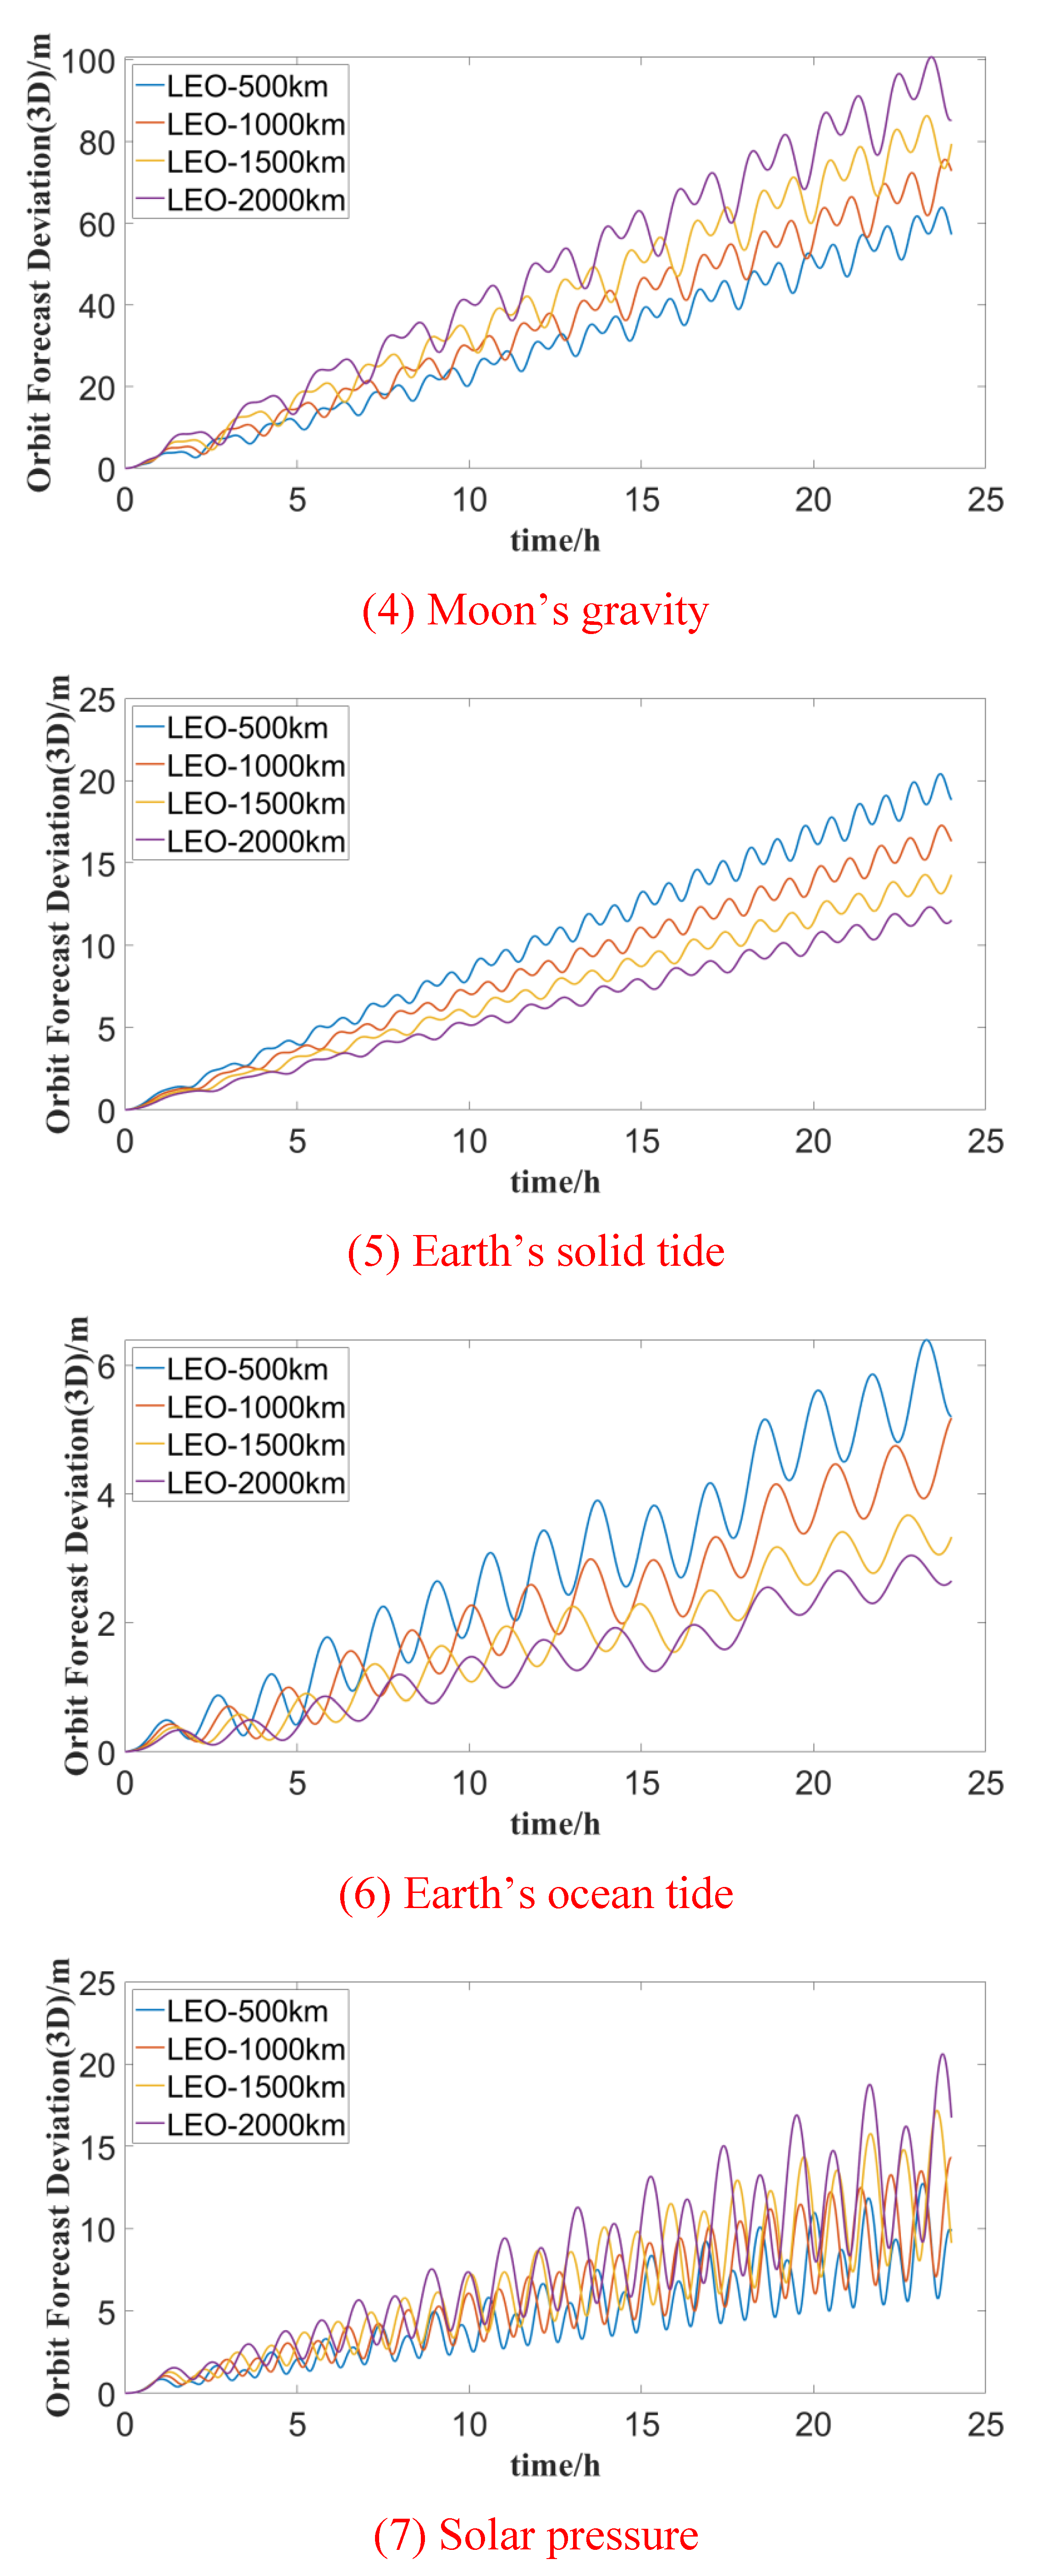
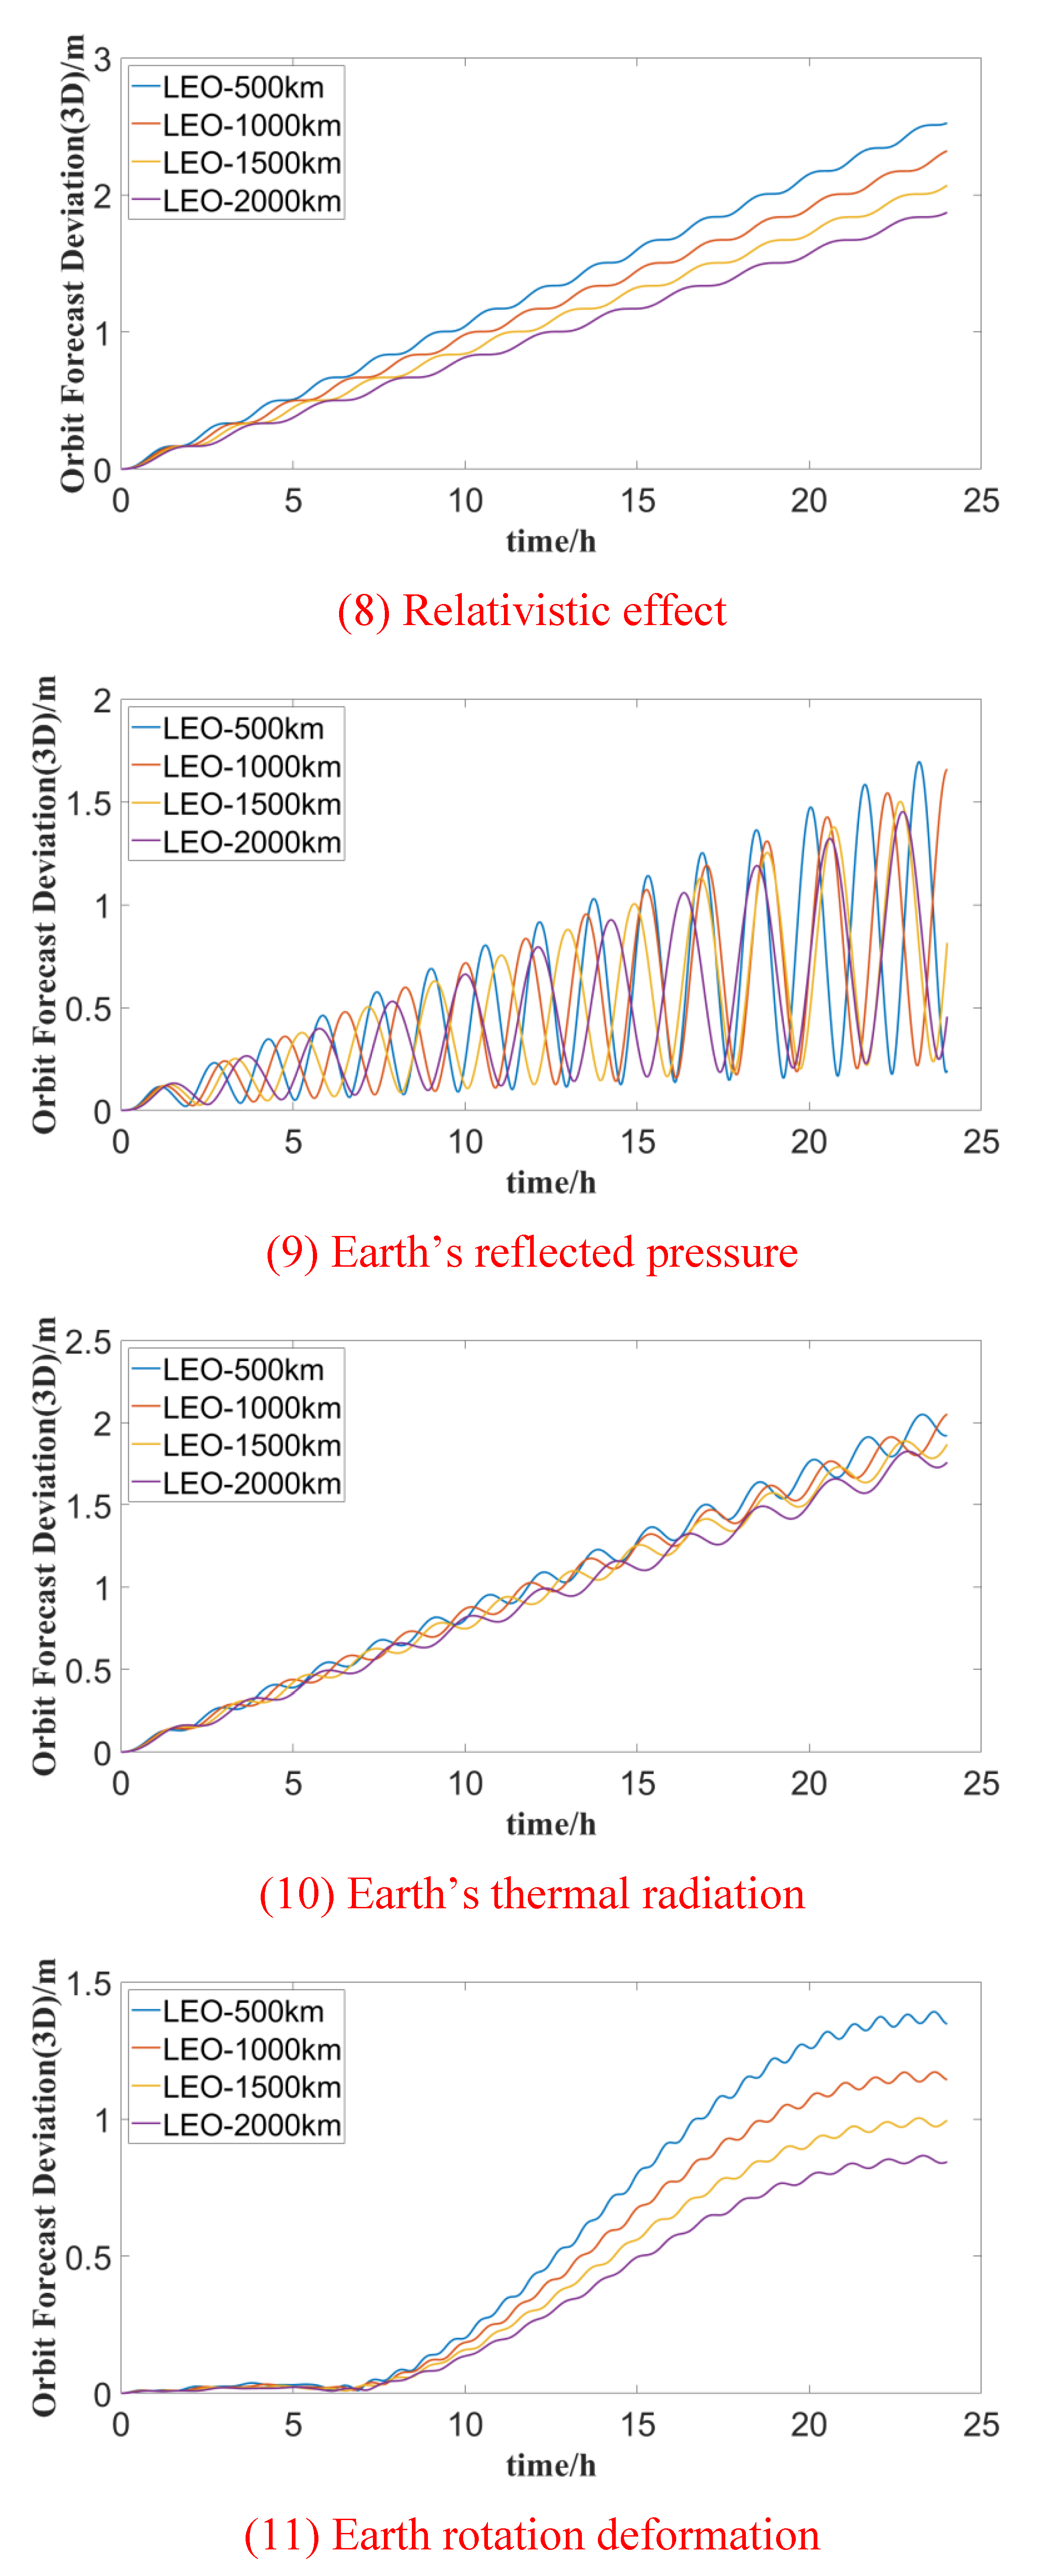
The effects of various perturbations on the orbit prediction accuracy of LEO satellites at different altitudes during a one-day forecast period are illustrated in
Figure 2. It is evident from the figure that atmospheric drag and Earth’s non-spherical gravitational perturbation are the primary perturbation forces affecting LEO satellites, with their impact becoming more pronounced as satellite orbit altitude decreases.
For LEO satellites at an altitude of 500 km, the orbit forecast deviation exceeds 1000m after 10 hours due to atmospheric drag. At higher orbits, LEO satellites are notably perturbed by the gravitational forces of the Sun and the Moon, resulting in forecast deviations on the order of tens of meters. Satellites at 2000 km altitude experience an orbit prediction deviation of about 100 meters under the influence of lunar gravitational perturbation, with short-term forecast changes being correlated with the satellite orbit period.
Solid tides exert a greater influence on satellite orbit forecast accuracy than sea tides, Earth’s rotation deformation, and relativistic effects, with the maximum orbital deviation reaching about 20 m. The impact is more significant at lower orbit altitudes, albeit generally lower than the gravitational perturbation of the Sun and the Moon. Solar pressure, Earth’s reflected pressure, and thermal radiation pressure are less affected by satellite orbit altitude. However, for LEO satellites at 2000 km altitude, the maximum influence of solar pressure on orbit prediction deviation is approximately 20 m.
The statistical results of the maximum forecast deviation for different perturbation forces in satellite orbit forecast durations of 1 hour, 6 hours, and 24 hours are presented in
Table 5. Overall, the orbital deviations of each perturbation force in the 1-hour forecast time are significantly lower compared to those in the 24-hour forecast. Therefore, when meeting mission application requirements, it is advisable to opt for a shorter forecast time.
With the exception of the maximum deviation of 0.867 m for LEO satellite orbit prediction at 2000 km altitude due to Earth’s rotation deformation, all other perturbation terms exert an influence of more than 1 m on the orbit accuracy of LEO satellites in the 24-hour forecast period. When considering only atmospheric drag, the maximum orbital deviations for 500 km, 1000 km, 1500 km, and 2000 km LEO satellites in a one-hour forecast are 12.987 m, 0.050 m, 0.005 m, and 0.002 m respectively. In contrast, the 24-hour predicted maximum orbital deviations are 8751.576 m, 45.702 m, 5.420 m, and 1.645 m respectively. These findings suggest that the influence of atmospheric drag on satellites with an orbital altitude of more than 1000 km is much less than that of satellites in low orbits at 500 km.
Considering only Earth’s non-spherical gravitational perturbation (10×10 order), the maximum orbital deviations for 1-hour forecasts compared with the reference orbit are 37.483 m, 18.678 m, 8.478 m, and 3.926 m, respectively. Correspondingly, the 24-hour maximum orbital deviations are 691.792 m, 407.238 m, 153.016 m, and 12.258 m respectively. These results highlight the importance of considering higher-order gravity fields of LEO satellites. In the following section, a detailed analysis of precision and optimization of satellite orbit prediction with different gravity field orders will be presented.
4.2. The Impact of Non-Spherical Gravitational Field Order Selection on LEO Satellite Orbit Prediction
Based on
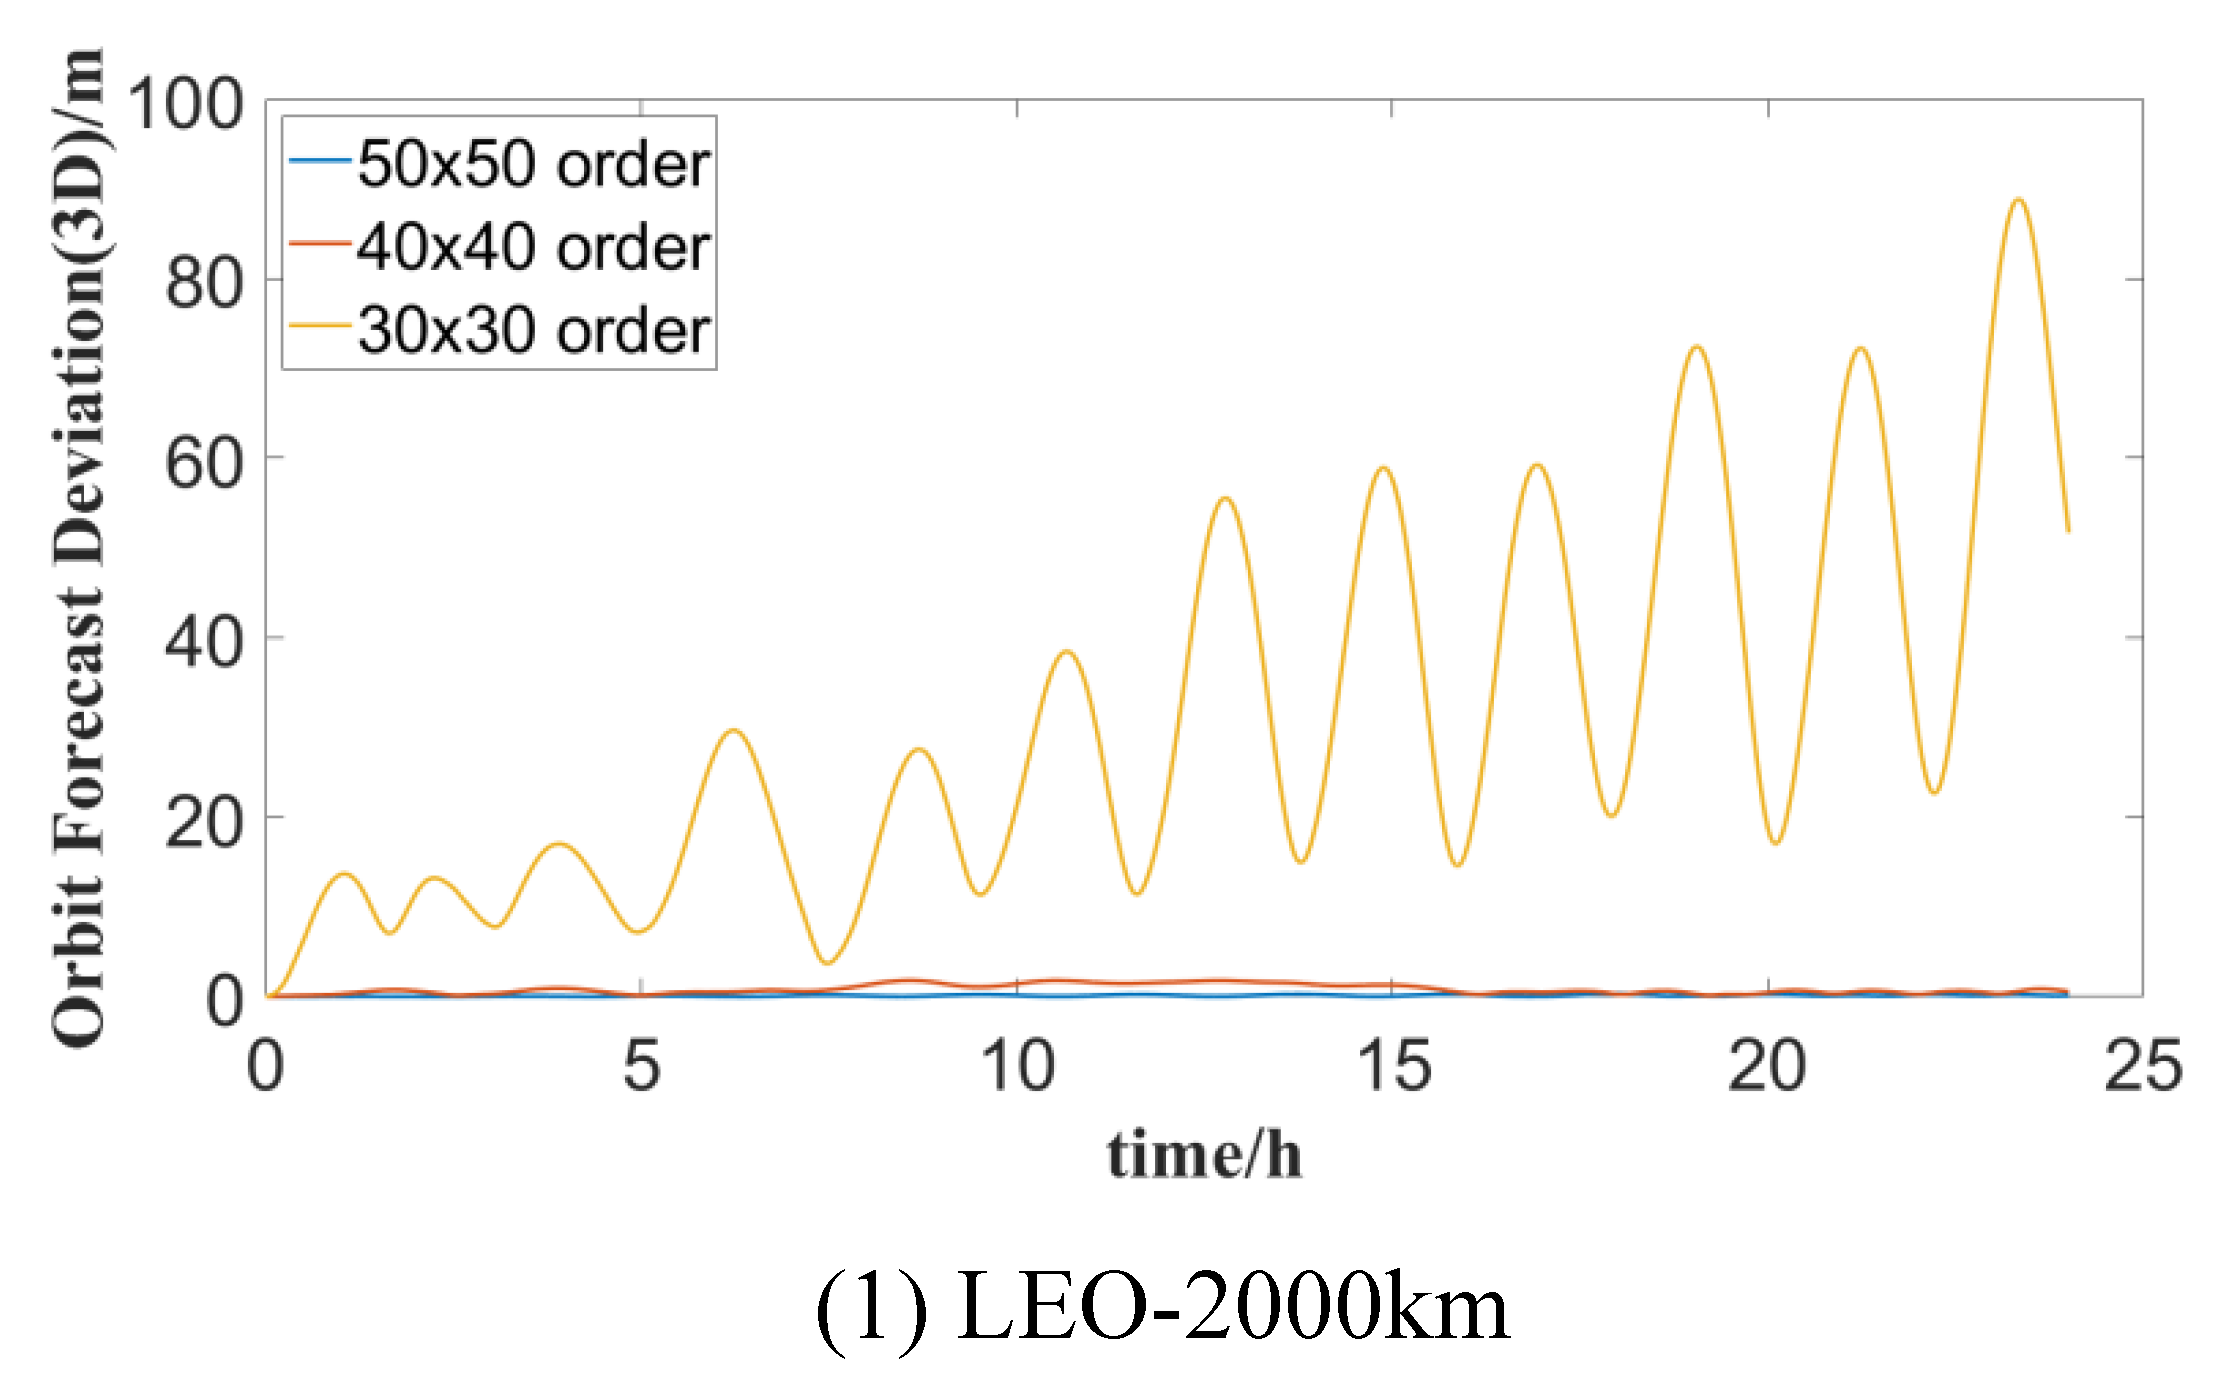
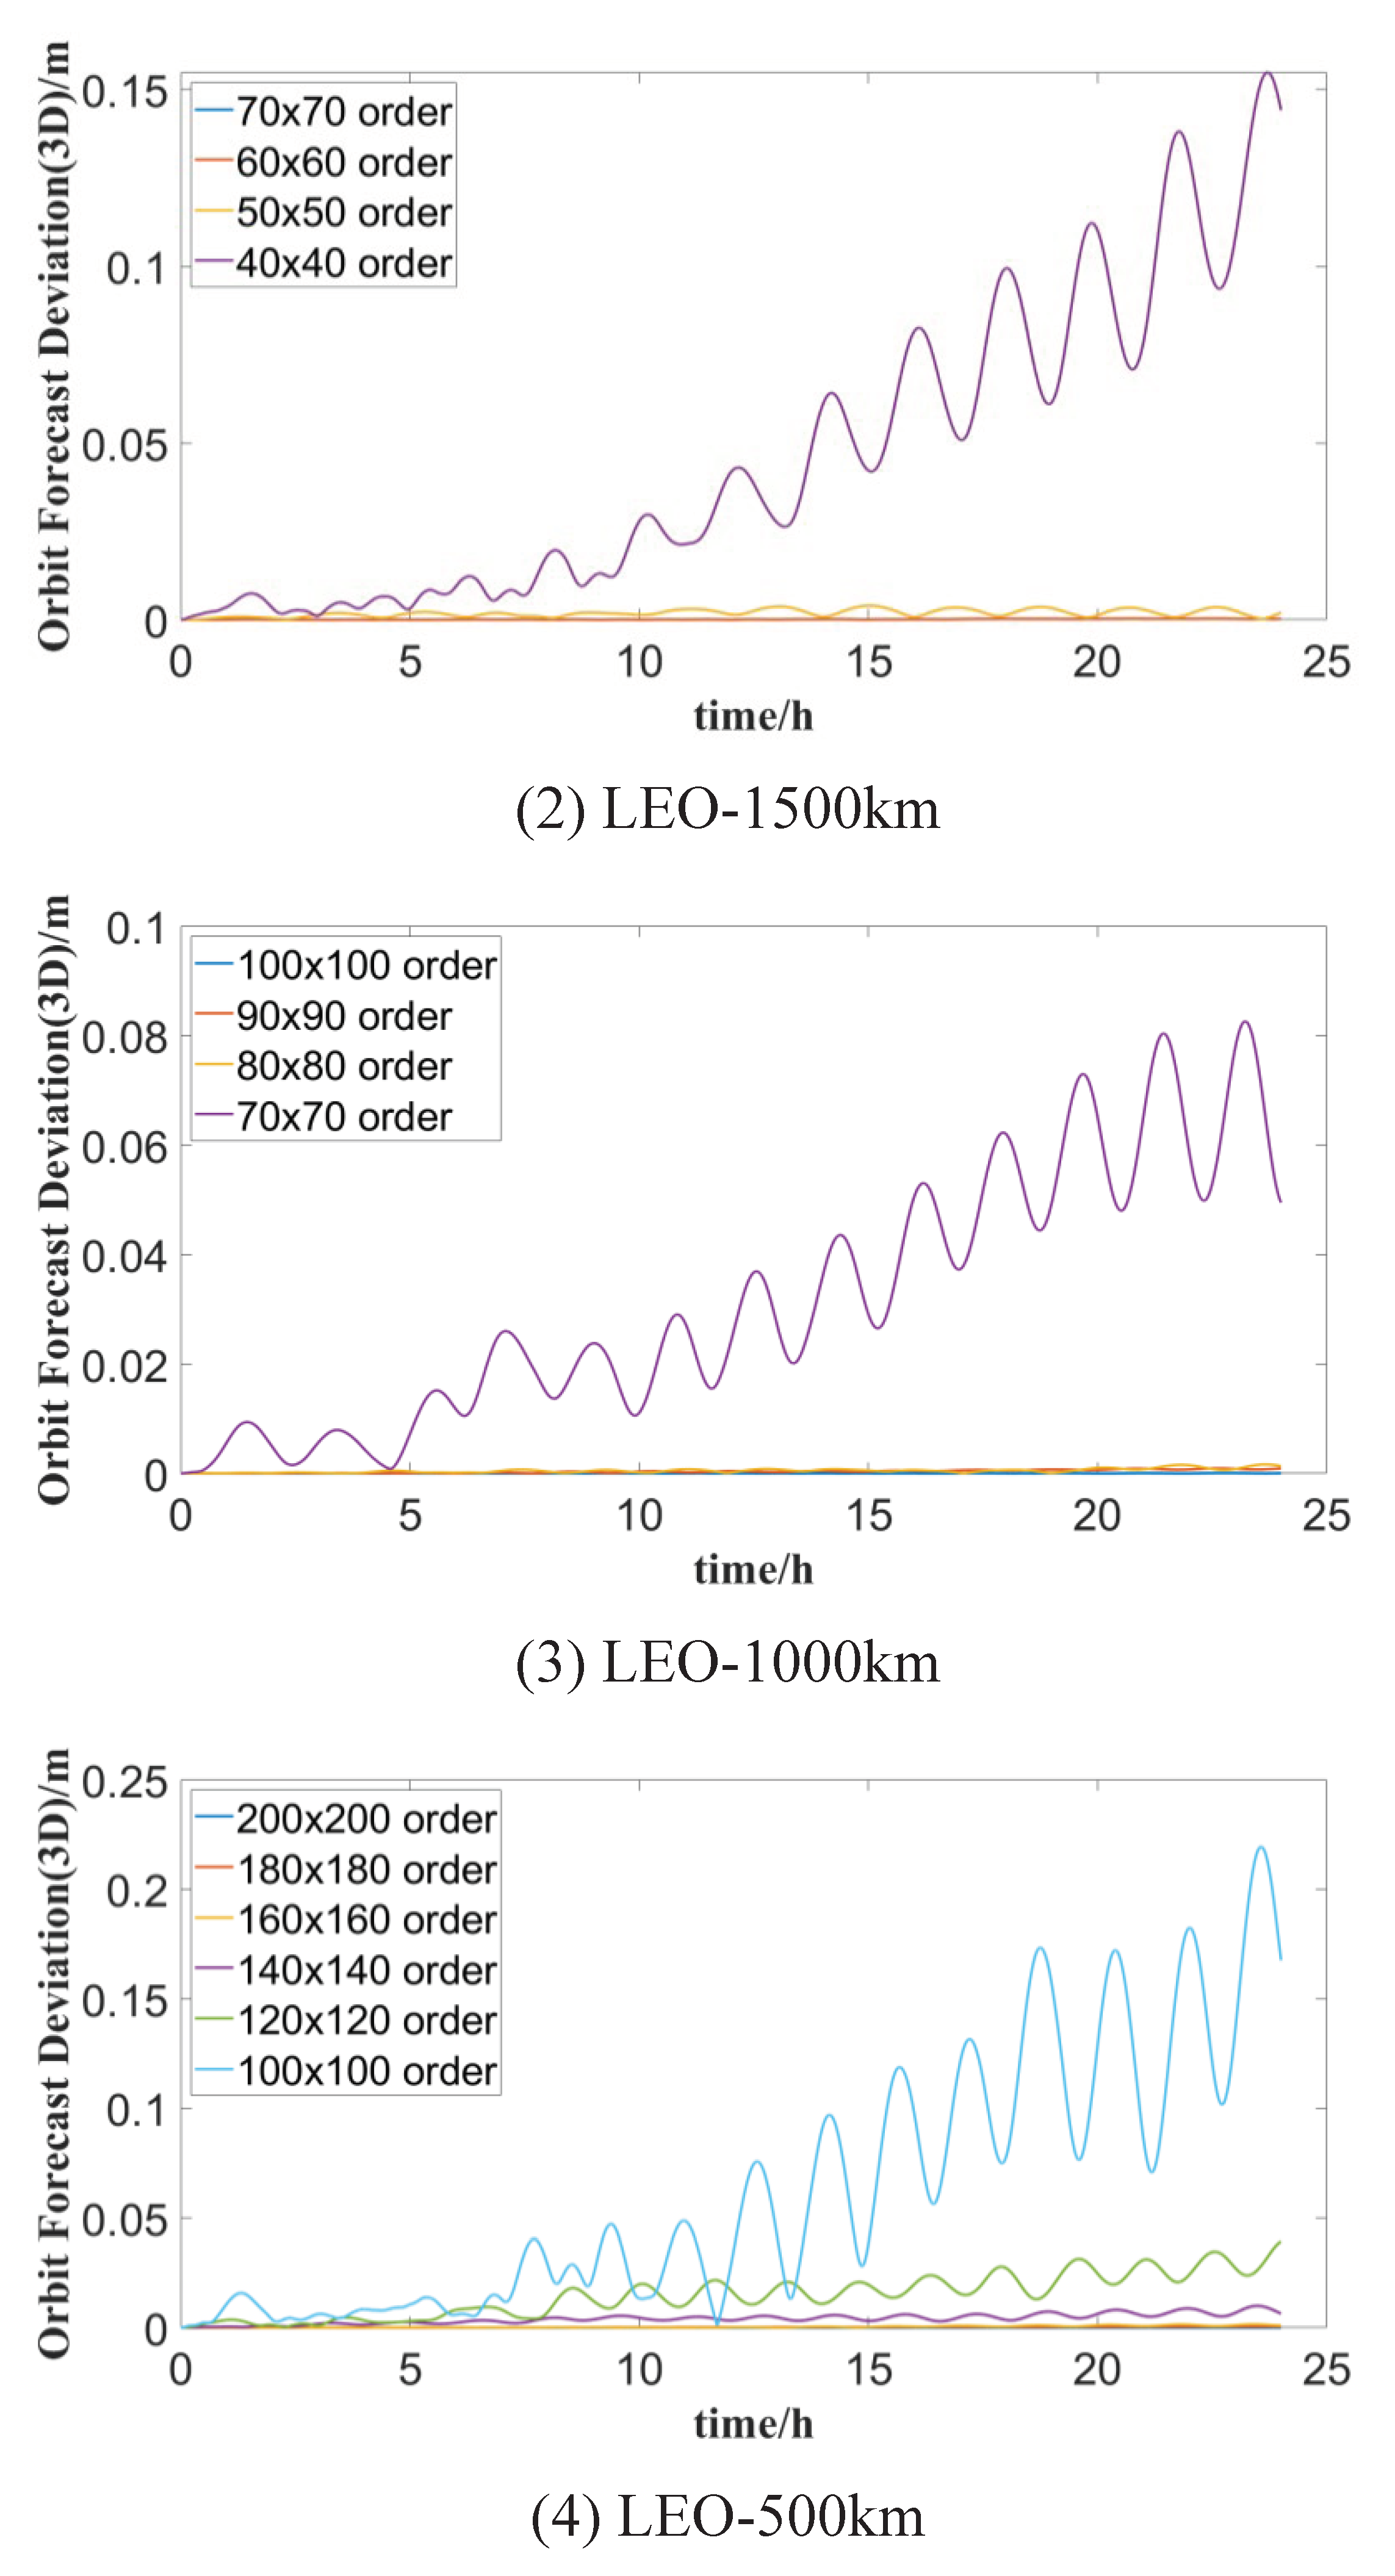
Table 5, it can be seen that the maximum deviation between the predicted orbit and the reference orbit is more than a few tens of meters when only the order of 10x10 Earth’s gravity field is considered. To analyze the influence of different orders of Earth’s non-spherical gravity field on orbit prediction accuracy and determine the most reasonable order of gravity field for LEO satellites at varying orbit altitudes, the orbit prediction deviations of LEO satellites with different gravity field orders are calculated, as depicted in
Figure 3. Overall, the accuracy of orbit prediction is more significantly affected by Earth’s gravitational field at lower orbital altitudes, necessitating consideration of a greater number of gravitational field orders.
The statistical results detailing the orbit prediction bias of LEO satellites with varying orders of non-spherical gravity field are presented in
Table 6,
Table 7,
Table 8 and
Table 9. According to these tables, there are differences in the minimum gravitational field orders required for LEO satellites at different altitudes when considering various forecast durations while maintaining the same reference orbit accuracy.
For a 1-hour forecast duration, the minimum gravitational field orders required are as follows: 140x140 order for 500km LEO satellites, 80x80 order for 1000km LEO satellites, 60x60 order for 1500km LEO satellites, and 40x40 order for 2000km LEO satellites. Under the constraint of a 6-hour forecast duration and the same accuracy as the reference orbit, the required gravitational field orders for different LEO satellites are: 160x160 order for 500km LEO satellites, 90x90 order for 1000km LEO satellites, 60x60 order for 1500km LEO satellites, and 50x50 order for 2000km LEO satellites.
The reasonable gravitational field orders for different LEO satellites at the 24-hour forecast duration are as follows: 200x200 order for 500km LEO satellites, 100x100 order for 1000km LEO satellites, 60x60 order for 1500km LEO satellites, and 50x50 order for 2000km LEO satellites. The statistical results in
Table 10 depict the gravitational field orders required for typical altitude LEO satellites under different forecast durations, ensuring accuracy equivalent to that of the reference orbit.
4.3. Impact of Ocean Tide Order Selection on LEO Satellite Orbit Prediction
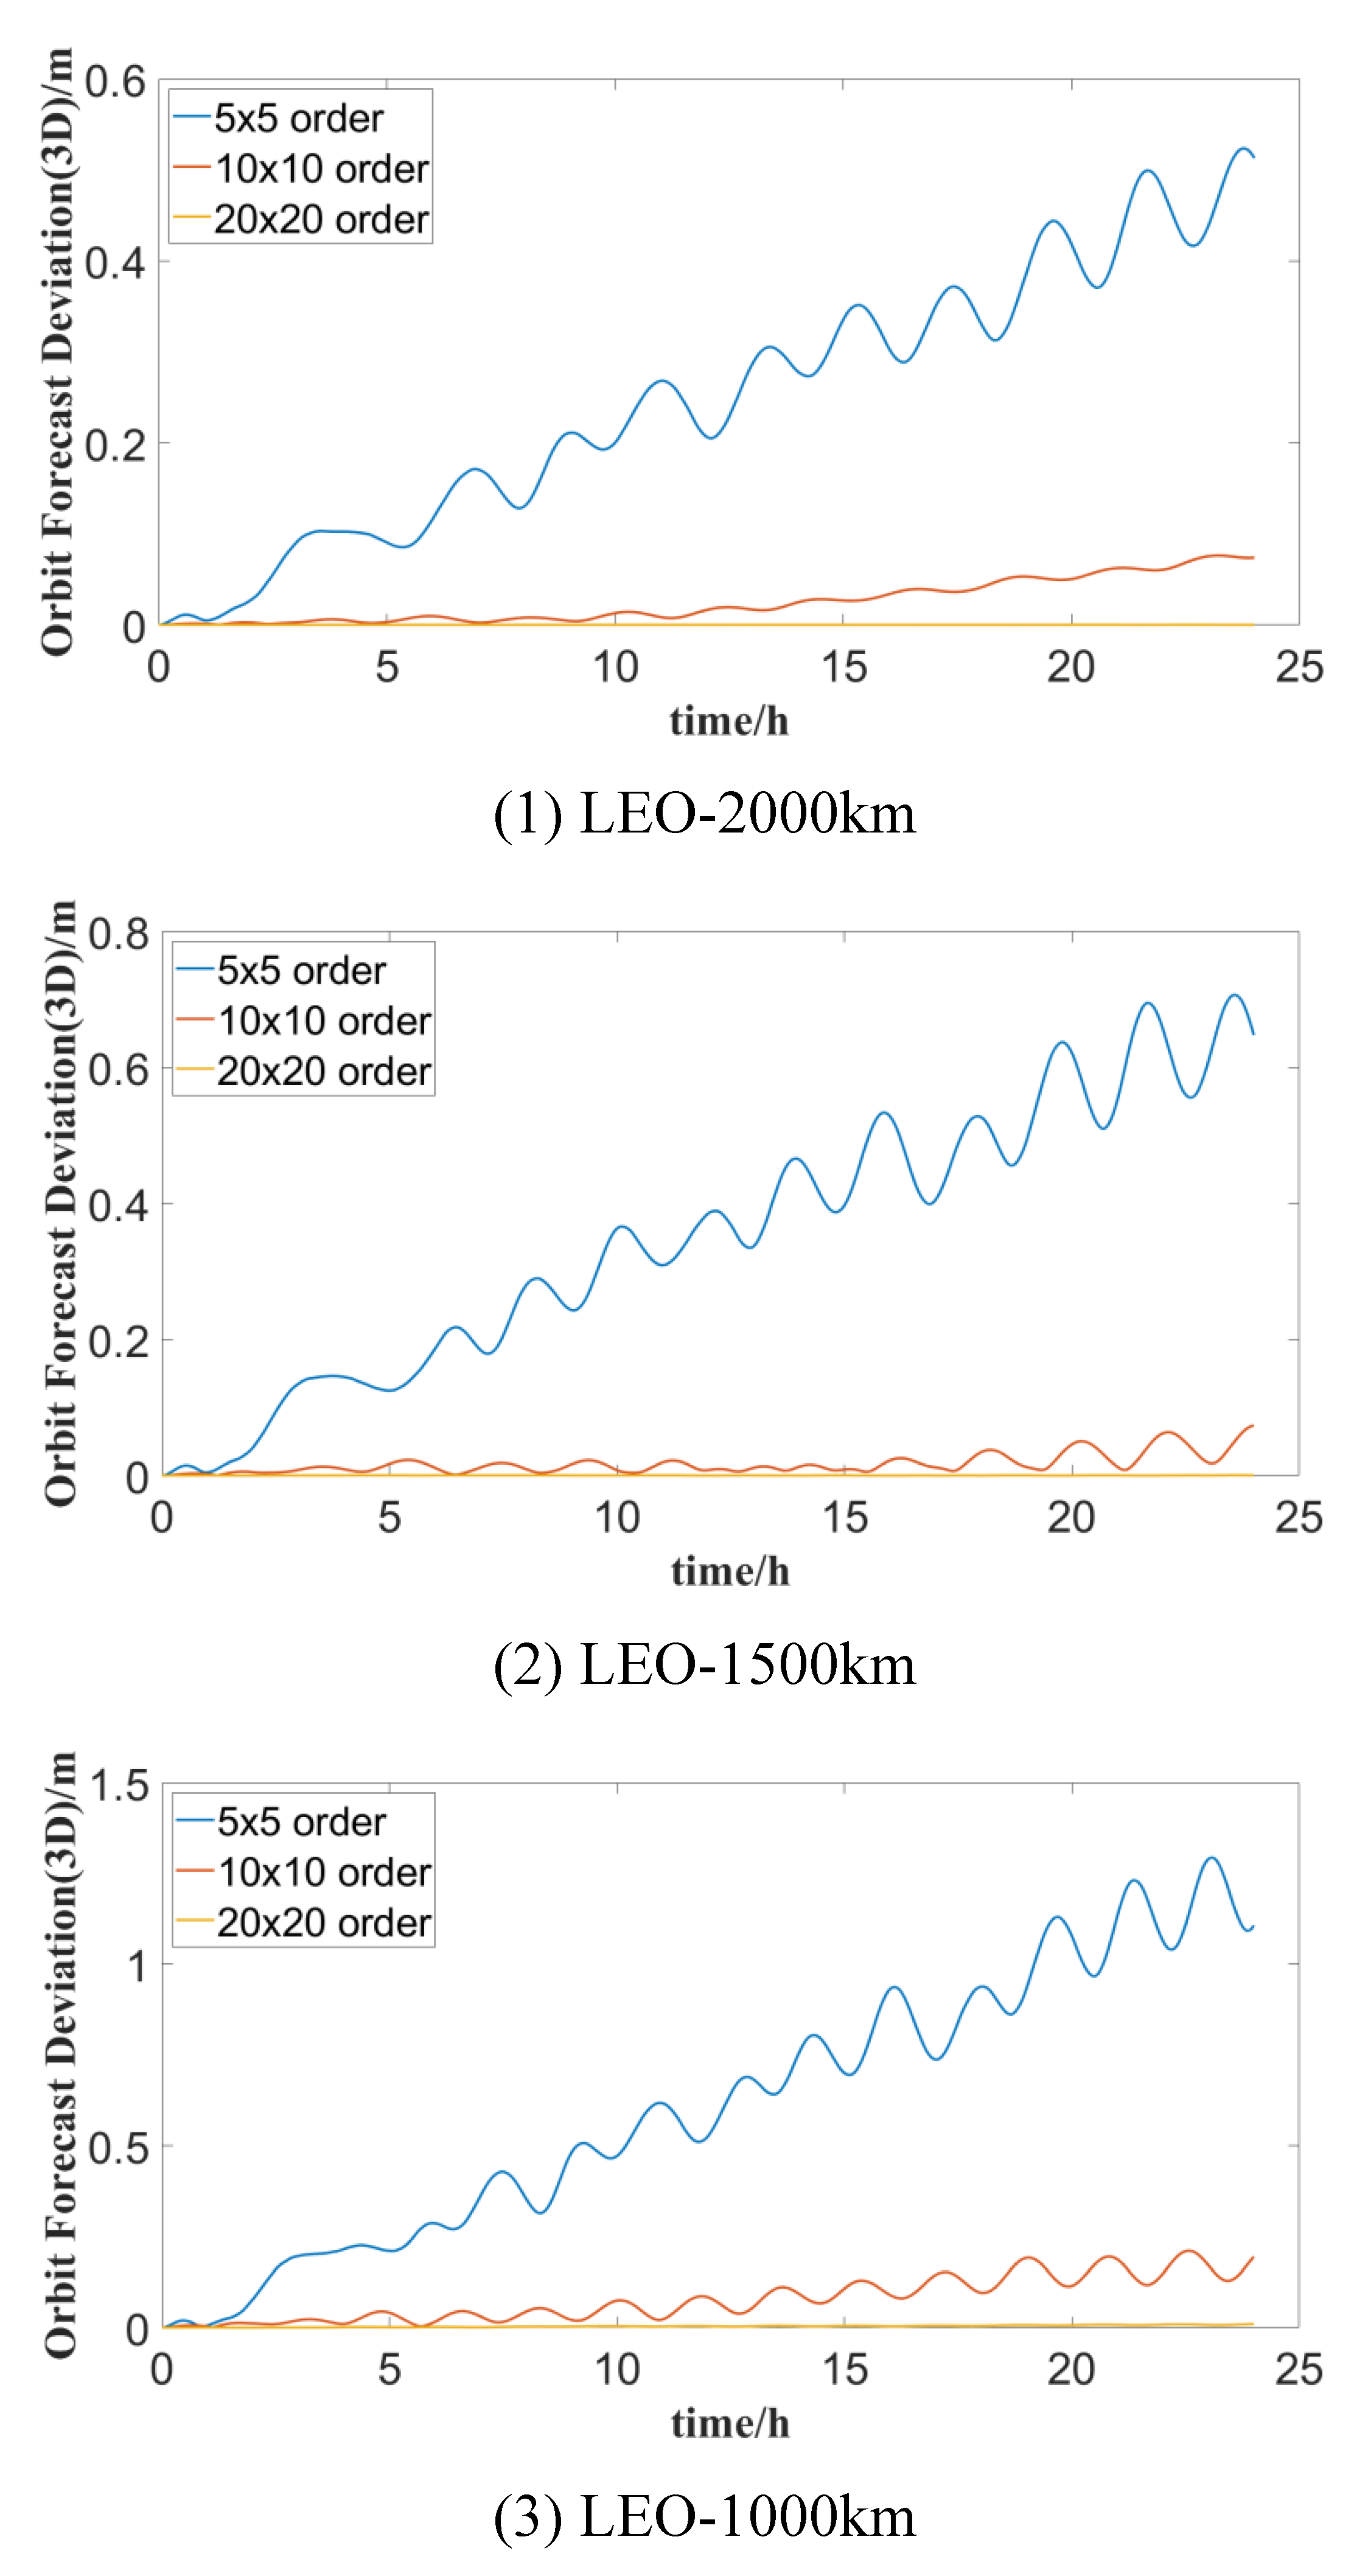
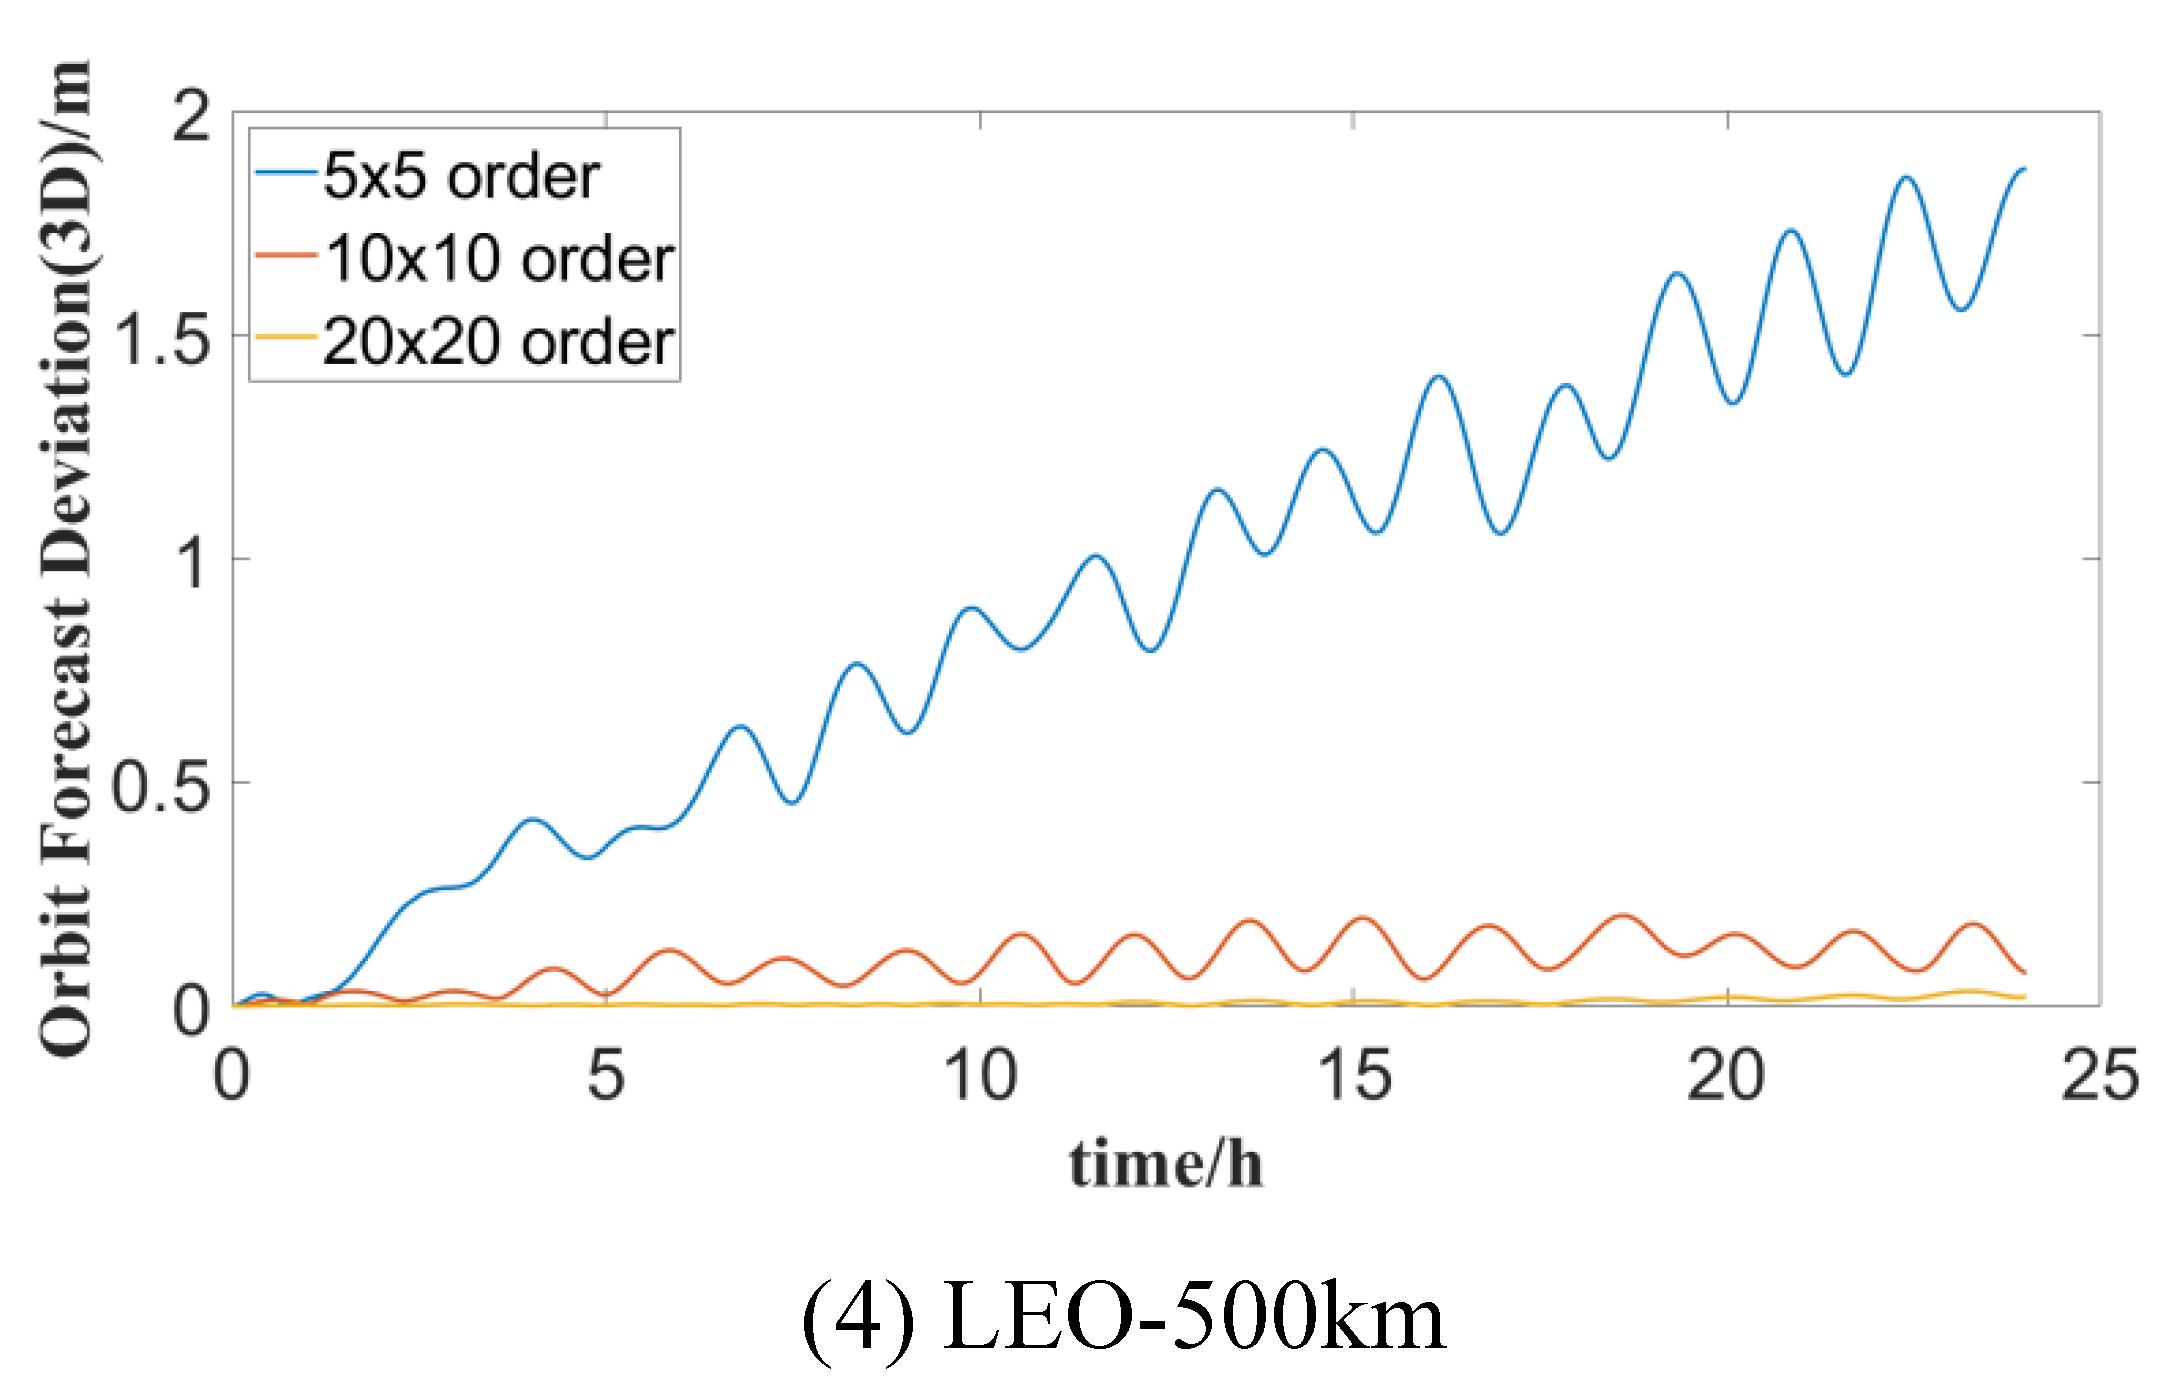
To analyze the influence of different orders of ocean tide perturbation on the accuracy of orbit prediction and determine the reasonable order of ocean tide perturbation for LEO satellites at varying orbit heights, the orbit prediction deviations of LEO satellites considering ocean tide perturbations of 5x5, 10x10, 20x20, and 30x30 orders are calculated respectively, and the results are illustrated in
Figure 4. In general, the orbit accuracy of LEO satellites is significantly affected by the orders of the ocean tide gravitational field, and a greater number of orders need to be considered under the same constraints as the reference orbit precision accuracy.
The statistical orbit forecast deviation of LEO satellite under different tide orders are shown in
Table 11,
Table 12 and
Table 13. It can be seen from the tables that the orbit forecast accuracy is significantly influenced by both the forecast duration and the order of tide perturbation.
For instance, in a forecast duration of 1 hour, the orbit deviations of LEO satellites at 500km and 1000km are 0.002m and 0.001m considering the 20x20 tide perturbation order respectively. In comparison, there is no difference in the orbit precision of satellites at 1500km and 2000km compared to considering the 30x30 tide perturbation order. In a 24-hour forecast duration, the orbit deviations of LEO satellites at 500km, 1000km, 1500km, and 2000km are 1.871m, 1.294m, 0.707m, and 0.524m respectively, when only the 5x5 tide perturbation order is considered.
Aiming for accuracy equivalent to that of the reference orbit, the tide perturbation order for satellites at 1500km and 2000km should be 20x20, while for satellites at 1000km and 500km, it should be 30x30.
4.4. Impact of Different Atmospheric Models on LEO Satellite Orbit Prediction
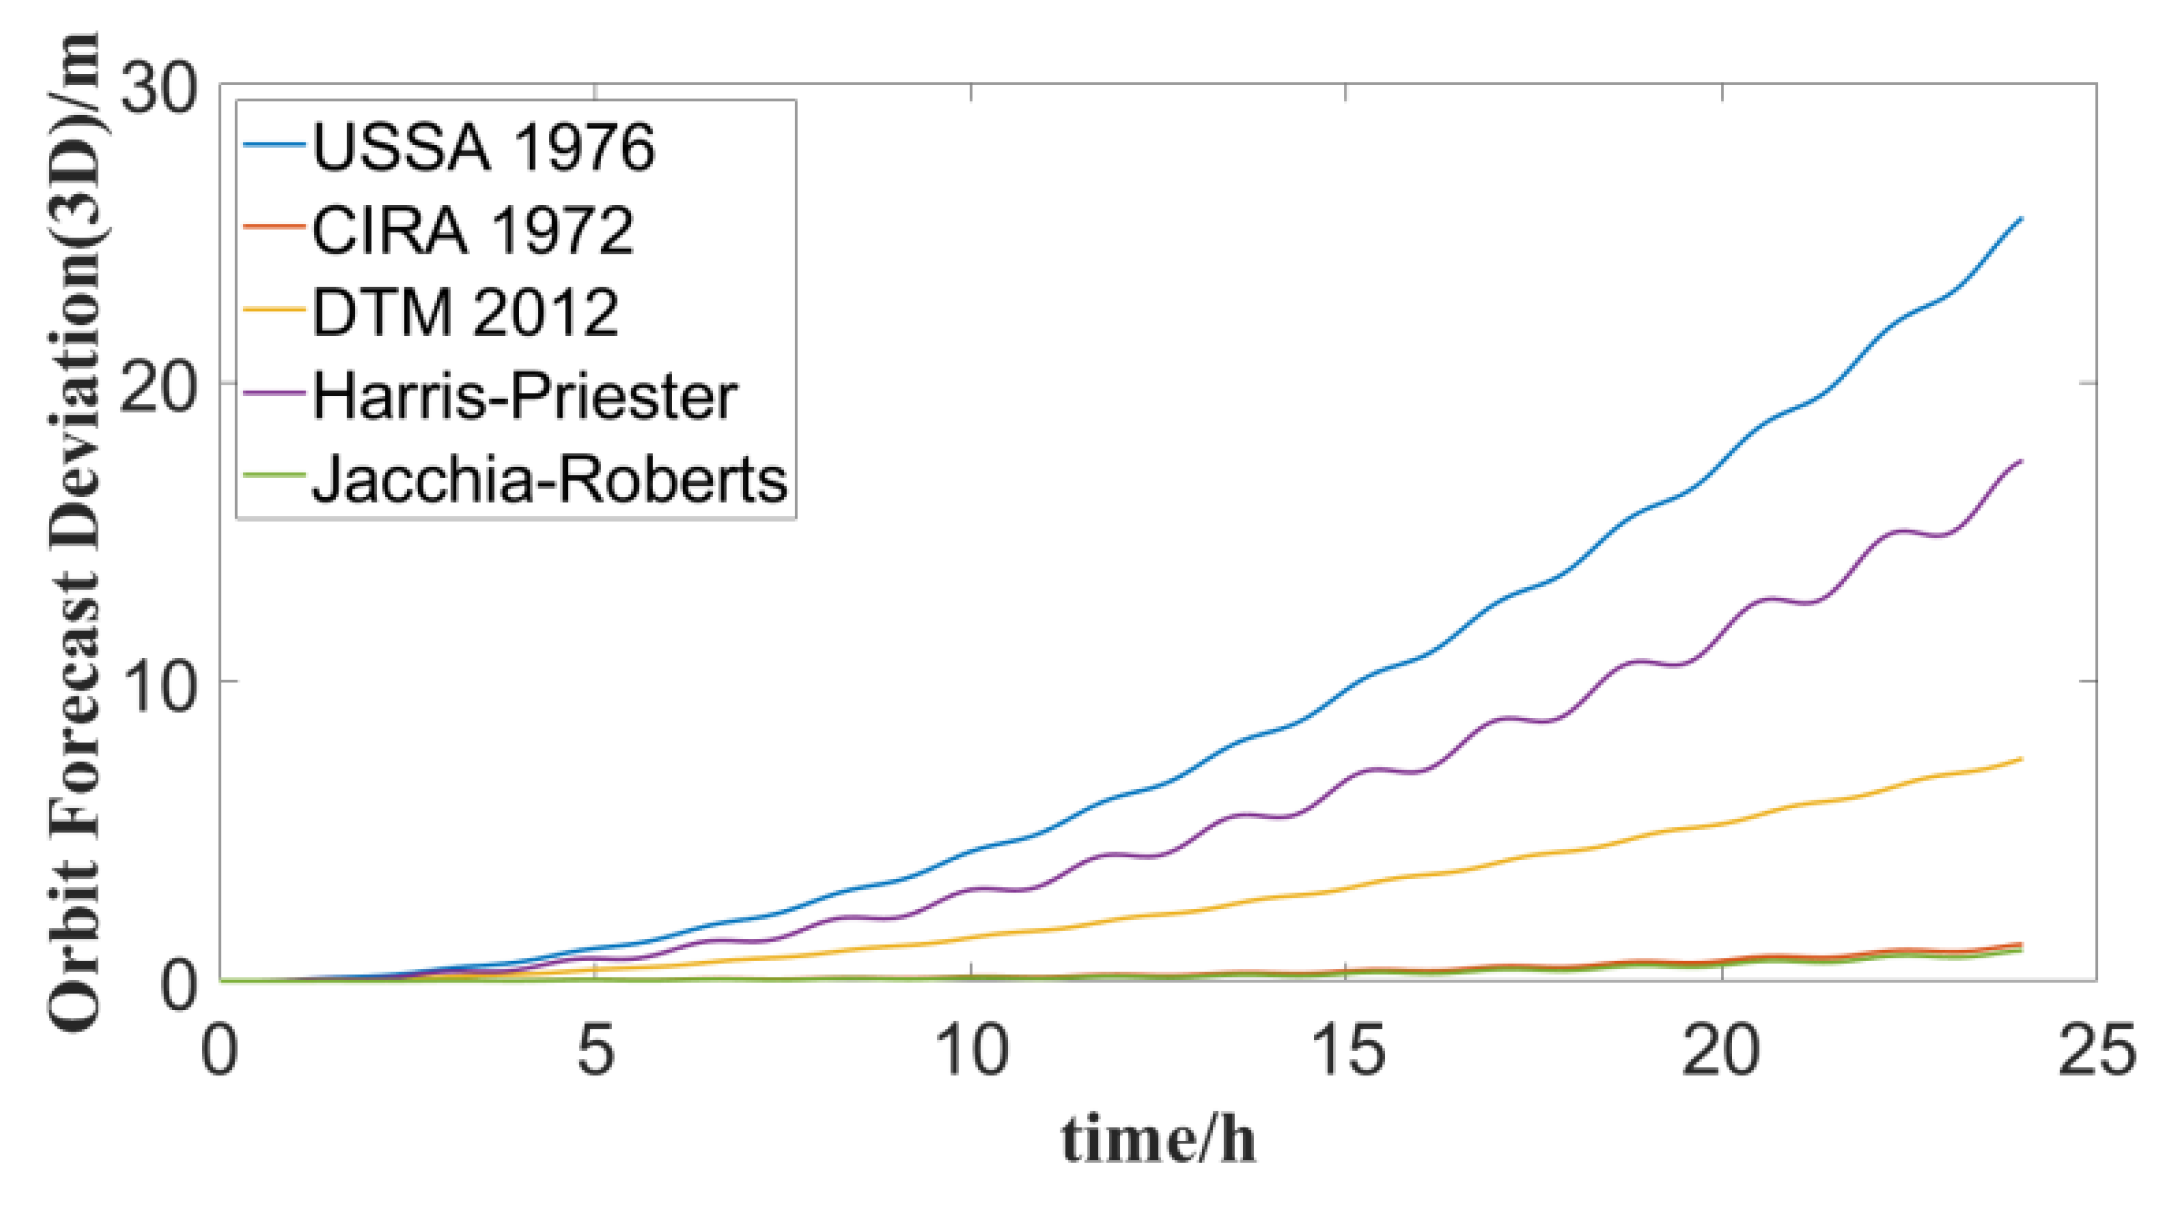
Atmospheric drag stands as the foremost non-conservative perturbation force affecting LEO satellites, highly linked to the precision of the atmospheric density model. In order to analyze the impact of different atmospheric density models on satellite orbit forecast deviations and evaluate the accuracy differences of different atmospheric models, several typical atmospheric models including Standard Atmosphere 1976, CIRA 1972, DTM 2012, Harris-Priester and Jacchia-Roberts were selected to calculate the 1000km LEO satellite orbit prediction deviation when the above atmospheric density model and the NRLMSISE 2000 atmospheric model are selected respectively. The results are shown in
Figure 5 and
Table 14.
In general, when the forecasting period is extended, diverse atmospheric density models exert a more pronounced impact on satellite orbit forecast deviations, particularly affecting orbit accuracy along the T direction. Notably, the Standard Atmosphere 1976 model and the NRLMSISE 2000 model exhibit the largest disparity in accuracy. The two models yield satellite orbit deviations of 1.497m for the 6-hour forecast and 25.494m for the 24-hour forecast. Conversely, the discrepancy between the Jacchia-Roberts model and the NRLMSISE 2000 model is minimal. For the 6-hour forecast, the satellite orbit deviation between the two models is merely 0.039m, while it reaches 1.024m for the 24-hour forecast.
5. Conclusions
To meet the demand for high precision and rapid prediction of LEO satellite orbit determination amid the rapid expansion of large-scale LEO heterogeneous constellation applications, the effects of typical perturbation forces on orbit prediction accuracy of LEO satellites at different altitudes are systematically analyzed with the goal of optimizing the selection of mechanical models of LEO satellites at different orbital altitudes. The main conclusions are as follows:
Atmospheric drag and Earth’s non-spherical gravitational perturbation stand out as the most significant perturbations affecting LEO satellites, followed by the gravitational influence of the Sun and Moon, as well as Earth’s solid and ocean tides. For a LEO satellite at an altitude of 500 km, the orbital deviation due to atmospheric drag reaches 8751.576 m within a 24-hour forecast. When considering only the 10x10 order Earth’s non-spherical gravity, the orbital deviation amounts to 691.792 m. However, when factoring in Earth’s relativistic effects and radiation pressure, the orbit deviation remains under 1m within a 6-hour forecast.
Under identical constraints regarding reference orbit accuracy, the orders of non-spherical gravitational fields and tidal gravitational perturbations that need consideration vary across different forecast durations. For a 1-hour forecast, the appropriate orders of non-spherical gravitational fields for LEO satellites at altitudes of 500km, 1000km, 1500km, and 2000km are 140x140, 80x80, 60x60, and 40x40, respectively. And for a 24-hour forecast, the suitable orders of gravitational fields are 200x200, 100x100, 60x60, and 50x50 for the corresponding altitudes. Additionally, the recommended orders of sea tide perturbation are 30x30 for 500km and 1000km satellites, and 20x20 for 1500km and 2000km satellites.
Different atmospheric density models exhibit significant variations in their impact on the orbit prediction accuracy of LEO satellites. For a 1-hour forecast, the accuracy differences among the Standard Atmosphere 1976, CIRA 1972, DTM 2012, Harris-Priester, Jacchia-Roberts, and NRLMSISE 2000 atmospheric density models remain within 0.38 m. However, for a 24-hour forecast, the deviation in orbit forecast accuracy between the Standard Atmosphere 1976 and NRLMSISE 2000 atmospheric models extends to 25.494 m.
Numerical analysis of LEO satellite orbit prediction of specific calculation set is researched in the paper. In the further, the impact of different orbit parameters and different model parameters on orbit prediction will be analyzed, and high-precision orbit determination and fast orbit prediction performance analysis of LEO heterogeneous constellations based on the numerical analysis and optimization selection of LEO satellite mechanical models will be carried out.
Author Contributions
Conceptualization and Methodology, Y.Z.(Yang Zhang); software, S.H.(Shengmao He) and C.P.(Chao Peng); validation, R.L. (Ran Li); investigation, G.Y.(Guang Yang); writing—original draft preparation, Y.Z.(Yang Zhang); writing—review and editing, Y.Z. (Yang Zhang) and D.X.(Deyong Xian); visualization, Y.X(Yuchang Xu); supervision, H.Y. All authors have read and agreed to the published version of the manuscript.
Funding
This work is financially supported by the Key Laboratory Fund Project for Simulation of Complex Electronic Systems (Grant No. 614201004022210), the Chinese Academy of Sciences Youth Innovation Promotion Association (Grant No. 2022126), the National Key Research and Development Plan (Grant No. 2022YFC2204700), the Beijing Natural Science Foundation (Grant No. 1234041), and the Xi’an Key Laboratory of Aircraft Optical Imaging and Measurement Technology (Grant No.2023-004).
Conflicts of Interest
The authors declare no conflict of interest.
References
- Xiaohong, Z.H.; Fujian, M.A. Review of the development of LEO navigation-augmented GNSS. Acta Geod. Et Cartogr. Sin. 2019, 48, 1073. [Google Scholar]
- Zheng, Z.; Guo, J.; Gill, E. Distributed onboard mission planning for multi-satellite systems. Aerosp. Sci. Technol. 2019, 89, 111–122. [Google Scholar] [CrossRef]
- Lee, H.W.; Jakob, P.C.; Ho, K.; Shimizu, S.; Yoshikawa, S. Optimization of satellite constellation deployment strategy considering uncertain areas of interest. Acta Astronaut. 2018, 153, 213–228. [Google Scholar] [CrossRef]
- Prol, F.S.; Ferre, R.M.; Saleem, Z.; Valisuo, P.; Pinell, C.; Lohan, E.S.; Elsanhoury, M.; Elmusrati, M.; Islam, S.; Celikbilek, K.; et al. Position, Navigation, and Timing (PNT) Through Low Earth Orbit (LEO) Satellites: A Survey on Current Status, Challenges, and Opportunities. IEEE Access 2022, 10, 83971–84002. [Google Scholar] [CrossRef]
- Shakun, L.; Koshkin, N.; Korobeynikova, E.; Kozhukhov, D.; Kozhukhov, O.; Strakhova, S. Comparative analysis of global optical observability of satellites in LEO. Adv. Space Res. 2021, 67, 1743–1760. [Google Scholar] [CrossRef]
- Ge, H.; Li, B.; Jia, S.; Nie, L.; Wu, T.; Yang, Z.; Shang, J.; Zheng, Y.; Ge, M. LEO Enhanced Global Navigation Satellite System (LeGNSS): progress, opportunities, and challenges. Geo-Spat. Inf. Sci. 2022, 25, 1–13. [Google Scholar] [CrossRef]
- Shi, Y.; Xu, T.; Li, M.; Wei, K.; Wang, S.; Wang, D. Real-Time Precise Orbit Determination of Low Earth Orbit Satellites Based on GPS and BDS-3 PPP B2b Service. Remote. Sens. 2024, 16, 833. [Google Scholar] [CrossRef]
- Pang, B.-J.; Wang, D.-F.; Xiao, W.-K.; Lu, B.-B. Characterizing space debris longitude-dependent distribution based on RAAN perturbation rate. Adv. Space Res. 2020, 65, 1714–1722. [Google Scholar] [CrossRef]
- Pang, B.-J.; Wang, D.-F.; Xiao, W.-K.; Lu, B.-B. Characterizing space debris longitude-dependent distribution based on RAAN perturbation rate. Adv. Space Res. 2020, 65, 1714–1722. [Google Scholar] [CrossRef]
- Madonna, D.P.; Pontani, M.; Gasbarri, P. Nonlinear attitude maneuvering of a flexible spacecraft for space debris tracking and collision avoidance. Acta Astronaut. 2023, 210, 268–288. [Google Scholar] [CrossRef]
- Vallado, D.A. (2001). Fundamentals of astrodynamics and applications (Vol. 12). Springer Science & Business Media.
- Vallado, D.A. (2005, January). An analysis of state vector propagation using differing flight dynamics programs. In Paper AAS 05-199 presented at the AAS/AIAA Space Flight Mechanics Conference. Copper Mountain, CO.
- Li, X.; Zhang, K.; Meng, X.; et al. LEO–BDS–GPS integrated precise orbit modeling using FengYun-3D, FengYun-3C onboard and ground observations. GPS Solut. 2020, 24, 1–13. [Google Scholar] [CrossRef]
- Shi, Y.; Xu, T.; Li, M.; Wei, K.; Wang, S.; Wang, D. Real-Time Precise Orbit Determination of Low Earth Orbit Satellites Based on GPS and BDS-3 PPP B2b Service. Remote. Sens. 2024, 16, 833. [Google Scholar] [CrossRef]
- Montenbruck, O.; Gill, E.; Lutze, F. Satellite Orbits: Models, Methods, and Applications. Appl. Mech. Rev. 2002, 55, B27–B28. [Google Scholar] [CrossRef]
- Wahr, J.; Wyss, M. Interpretation of postseismic deformation with a viscoelastic relaxation model. J. Geophys. Res. 1980, 85, 6471–6477. [Google Scholar] [CrossRef]
- Love, A.E.H. The yielding of the Earth to disturbing forces. Proc. R. Soc. London. Ser. A Contain. Pap. A Math. Phys. Character 1909, 82, 73–88. [Google Scholar] [CrossRef]
- Schwiderski, E.W. (). Atlas of ocean tidal charts and maps, part I: The semidiurnal principal lunar tide M2. Mar. Geod. 1983, 6, 219–265. [Google Scholar] [CrossRef]
- Capon, C.; Smith, B.; Brown, M.; Abay, R.; Boyce, R. Effect of ionospheric drag on atmospheric density estimation and orbit prediction. Adv. Space Res. 2019, 63, 2495–2505. [Google Scholar] [CrossRef]
- Stephens, G.L.; Campbell, G.G.; Haar, T.V. Earth radiation budgets. J. Geophys. Res. Ocean. 1981, 86, 9739–9760. [Google Scholar] [CrossRef]
- Knocke, P.; Ries, J.; Tapley, B. Earth radiation pressure effects on satellites. In Astrodynamics conference (p. 4292.
- Zhang, Y.; Li, Z.; Li, R.; Wang, Z.; Yuan, H.; Song, J. Orbital design of LEO navigation constellations and assessment of their augmentation to BDS. Adv. Space Res. 2020, 66, 1911–1923. [Google Scholar] [CrossRef]
Figure 1.
Schematic diagram of a typical LEO satellite in orbit.
Figure 1.
Schematic diagram of a typical LEO satellite in orbit.
Figure 2.
Variations in typical LEO ssatellite orbit prediction due to various perturbations forces.
Figure 2.
Variations in typical LEO ssatellite orbit prediction due to various perturbations forces.
Figure 3.
LEO satellite orbit prediction deviations for different Earth aspheric gravity orders.
Figure 3.
LEO satellite orbit prediction deviations for different Earth aspheric gravity orders.
Figure 4.
LEO satellite orbit forecast deviations for different Earth tide orders.
Figure 4.
LEO satellite orbit forecast deviations for different Earth tide orders.
Figure 5.
Comparison of orbit forecast deviations of 1000km altitude LEO satellites under different atmospheric models.
Figure 5.
Comparison of orbit forecast deviations of 1000km altitude LEO satellites under different atmospheric models.
Table 1.
Typical low orbit constellation information statistics.
Table 1.
Typical low orbit constellation information statistics.
| Constellation |
Business |
Country |
Quantity |
Orbital height |
Orbital inclination |
| Boeing |
Communication |
USA |
2956 |
1200 km |
45º, 55º, 88º |
| OneWeb |
Broadband |
USA |
1980 |
1200km |
87.9º |
| DOVE |
Remote Sensing |
USA |
175 |
400 km |
51.6° |
| 475 km |
98° |
| Starlink |
Broadband+ |
USA |
1584 |
550 km |
53º |
| 1600 |
1110 km |
53.8º |
| 400 |
1130 km |
74º |
| 375 |
1275 km |
81º |
| 450 |
1325 km |
70º |
| 2493 |
335.9 km |
42º |
| 2478 |
340.8 km |
48º |
| 2547 |
345.6 km |
53º |
| 30000 |
328~580 km |
35º ~ 81º |
| GW-A59 |
Broadband+ |
China Star Network Group |
480 |
590 km |
85º |
| 2000 |
600 km |
50º |
| 3600 |
508 km |
55º |
| GW-2 |
Broadband+ |
China Star Network Group |
1728 |
1145 km |
30º |
| 1728 |
1145 km |
40º |
| 1728 |
1145 km |
50º |
| 1728 |
1145 km |
60º |
| Sansumg |
Broadband |
South Korea |
4600 |
1400-1500 km |
- |
Table 2.
Initial orbit parameters of LEO satellites.
Table 2.
Initial orbit parameters of LEO satellites.
| orbit parameters |
(km) |
|
( º ) |
( º ) |
( º ) |
( º ) |
| LEO-500 km |
6878.14 |
0.00 |
70 |
0 |
30 |
0 |
| LEO-1000 km |
7378.14 |
0.00 |
70 |
0 |
30 |
0 |
| LEO-1500 km |
7878.14 |
0.00 |
70 |
0 |
30 |
0 |
| LEO-2000 km |
8378.14 |
0.00 |
70 |
0 |
30 |
0 |
Table 3.
the value of the coefficient in RKF7(8).
Table 3.
the value of the coefficient in RKF7(8).
| i\j |
|
|
|
|
| 0 |
1 |
2 |
3 |
4 |
5 |
6 |
7 |
8 |
9 |
10 |
11 |
|
|
| 0 |
0 |
0 |
|
|
|
|
|
|
|
|
|
|
|
|
0 |
| 1 |
|
|
|
|
|
|
|
|
|
|
|
|
|
0 |
| 2 |
|
|
|
|
|
|
|
|
|
|
|
|
|
0 |
| 3 |
|
|
0 |
|
|
|
|
|
|
|
|
|
|
0 |
| 4 |
|
|
0 |
|
0 |
0 |
|
|
|
|
|
|
|
0 |
| 5 |
|
|
0 |
0 |
|
|
|
|
|
|
|
|
|
|
| 6 |
|
|
0 |
0 |
|
|
|
|
|
|
|
|
|
|
| 7 |
|
|
0 |
0 |
0 |
|
|
|
|
|
|
|
|
|
| 8 |
|
2 |
0 |
0 |
|
|
|
|
3 |
|
|
|
|
|
| 9 |
|
|
0 |
0 |
|
|
|
|
|
|
|
|
|
|
| 10 |
1 |
|
0 |
0 |
|
|
|
|
|
|
|
|
|
|
0 |
| 11 |
0 |
|
0 |
0 |
0 |
0 |
|
|
|
|
|
0 |
|
|
|
| 12 |
1 |
|
0 |
0 |
|
|
|
|
|
|
|
0 |
1 |
|
|
Table 4.
The reference orbit model setting of LEO satellites.
Table 4.
The reference orbit model setting of LEO satellites.
| Type of perturbation force |
Model |
| Earth’s non-spherical gravity |
GGM03C (300x300 order) |
| atmospheric drag |
NRLMSIS 2000 |
| solid tide |
IERS Conventions 2003 |
| tide |
FES 2004 (30x30 order) |
| Earth’s rotational deformation |
IERS Conventions 2003 |
| Sunlight pressure |
Cannonball |
| Sun’s gravity |
DE 405 |
| moon gravity |
DE 405 |
| relativistic effect |
IERS Conventions 2003 |
| Earth radiation pressure |
Literature [15,16] |
Table 5.
Statistical analysis of main perturbation forces on LEO satellite orbit prediction (m).
Table 5.
Statistical analysis of main perturbation forces on LEO satellite orbit prediction (m).
| instigative force |
duration |
LEO-500km |
LEO-1000km |
LEO-1500km |
LEO-2000km |
| Atmospheric drag |
1 hour |
12.987 |
0.05 |
0.005 |
0.002 |
| 6 hours |
541.357 |
2.845 |
0.317 |
0.103 |
| 24 hours |
8751.576 |
45.702 |
5.420 |
1.645 |
| Earth’s non-spherical (10x10 order) |
1 hour |
37.483 |
18.678 |
8.478 |
3.926 |
| 6 hours |
188.174 |
70.385 |
30.404 |
9.824 |
| 24 hours |
691.792 |
407.238 |
153.016 |
12.258 |
| Sun’s gravity |
1 hour |
2.025 |
2.501 |
2.846 |
3.059 |
| 6 hours |
7.166 |
8.672 |
9.759 |
11.934 |
| 24 hours |
27.635 |
33.433 |
39.579 |
45.193 |
| Moon’s gravity |
1 hour |
3.051 |
3.168 |
3.155 |
3.224 |
| 6 hours |
14.706 |
16.034 |
20.846 |
24.124 |
| 24 hours |
63.834 |
75.547 |
86.244 |
100.642 |
| Earth’s solid tide |
1 hour |
1.048 |
0.863 |
0.702 |
0.567 |
| 6 hours |
5.083 |
4.302 |
3.666 |
3.165 |
| 24 hours |
20.414 |
17.282 |
14.286 |
12.320 |
| solar pressure |
1 hour |
0.832 |
0.923 |
0.953 |
0.948 |
| 6 hours |
3.306 |
3.184 |
3.731 |
4.443 |
| 24 hours |
12.745 |
14.326 |
17.187 |
20.622 |
| Earth’s ocean tide |
1 hour |
0.432 |
0.332 |
0.248 |
0.186 |
| 6 hours |
1.774 |
0.994 |
0.897 |
0.855 |
| 24 hours |
6.393 |
5.169 |
3.668 |
3.043 |
| Relativistic effect |
1 hour |
0.127 |
0.109 |
0.092 |
0.078 |
| 6 hours |
0.662 |
0.562 |
0.503 |
0.496 |
| 24 hours |
2.524 |
2.320 |
2.069 |
1.871 |
| Earth’s thermal radiation |
1 hour |
0.104 |
0.097 |
0.088 |
0.078 |
| 6 hours |
0.542 |
0.476 |
0.469 |
0.493 |
| 24 hours |
2.049 |
2.051 |
1.888 |
1.824 |
| Earth’s reflected pressure |
1 hour |
0.108 |
0.098 |
0.087 |
0.077 |
| 6 hours |
0.461 |
0.36 |
0.378 |
0.397 |
| 24 hours |
1.695 |
1.658 |
1.502 |
1.453 |
| Earth’s rotation deformation |
1 hour |
0.011 |
0.01 |
0.01 |
0.009 |
| 6 hours |
0.038 |
0.033 |
0.028 |
0.022 |
| 24 hours |
1.392 |
1.172 |
1.004 |
0.867 |
Table 6.
LEO satellite (500km) orbit prediction deviation statistics under different gravitational field orders (m).
Table 6.
LEO satellite (500km) orbit prediction deviation statistics under different gravitational field orders (m).
| forecast duration (h) |
200x200 order |
180x180 order |
160x160 order |
140x140 order |
120x120 order |
100x100 order |
| 1 |
0.000 |
0.000 |
0.000 |
0.000 |
0.003 |
0.011 |
| 6 |
0.000 |
0.000 |
0.000 |
0.003 |
0.008 |
0.016 |
| 24 |
0.000 |
0.002 |
0.002 |
0.010 |
0.039 |
0.219 |
Table 7.
LEO satellite (1000km) orbit prediction deviation statistics under different gravitational field orders (m).
Table 7.
LEO satellite (1000km) orbit prediction deviation statistics under different gravitational field orders (m).
| forecast duration (h) |
100x100 order |
90x90 order |
80x80 order |
70x70 order |
| 1 |
0.000 |
0.000 |
0.000 |
0.006 |
| 6 |
0.000 |
0.000 |
0.001 |
0.015 |
| 24 |
0.000 |
0.001 |
0.002 |
0.083 |
Table 8.
LEO satellite (1500km) orbit prediction deviation statistics under different gravitational field orders (m).
Table 8.
LEO satellite (1500km) orbit prediction deviation statistics under different gravitational field orders (m).
| forecast duration (h) |
60x60 order |
50x50 order |
40x40 order |
| 1 |
0.000 |
0.001 |
0.004 |
| 6 |
0.000 |
0.002 |
0.009 |
| 24 |
0.000 |
0.004 |
0.155 |
Table 9.
LEO satellite (2000km) orbit prediction deviation statistics under different gravitational field orders (m).
Table 9.
LEO satellite (2000km) orbit prediction deviation statistics under different gravitational field orders (m).
| forecast duration (h) |
50x50 order |
40x40 order |
30x30 order |
| 1 |
0.000 |
0.000 |
0.014 |
| 6 |
0.000 |
0.001 |
0.027 |
| 24 |
0.000 |
0.002 |
0.089 |
Table 10.
Selection of gravitational field orders of LEO satellites under different forecast durations.
Table 10.
Selection of gravitational field orders of LEO satellites under different forecast durations.
| forecast duration (h) |
LEO-500km |
LEO-1000km |
LEO-1500km |
LEO-2000km |
| 1 |
140x140 order |
80x80 order |
60x60 order |
40x40 order |
| 6 |
160x160 order |
90x90 order |
60x60 order |
50x50 order |
| 24 |
200x200 order |
100 x100 order |
60x60 order |
50x50 order |
Table 11.
LEO satellite orbit forecast deviation statistics considering 5x5 order ocean tide perturbation (m).
Table 11.
LEO satellite orbit forecast deviation statistics considering 5x5 order ocean tide perturbation (m).
| forecast duration (h) |
LEO-500km |
LEO-1000km |
LEO-1500km |
LEO-2000km |
| 1 |
0.027 |
0.020 |
0.015 |
0.011 |
| 6 |
0.418 |
0.287 |
0.185 |
0.116 |
| 24 |
1.871 |
1.294 |
0.707 |
0.524 |
Table 12.
LEO satellite orbit forecast deviation statistics considering 10x10 order ocean tide perturbation (m).
Table 12.
LEO satellite orbit forecast deviation statistics considering 10x10 order ocean tide perturbation (m).
| forecast duration (h) |
LEO-500km |
LEO-1000km |
LEO-1500km |
LEO-2000km |
| 1 |
0.014 |
0.007 |
0.003 |
0.002 |
| 6 |
0.125 |
0.045 |
0.023 |
0.010 |
| 24 |
0.203 |
0.211 |
0.073 |
0.076 |
Table 13.
LEO satellite orbit forecast deviation statistics considering 20x20 order ocean tide perturbation (m).
Table 13.
LEO satellite orbit forecast deviation statistics considering 20x20 order ocean tide perturbation (m).
| forecast duration (h) |
LEO-500km |
LEO-1000km |
LEO-1500km |
LEO-2000km |
| 1 |
0.002 |
0.001 |
0.000 |
0.000 |
| 6 |
0.004 |
0.002 |
0.000 |
0.000 |
| 24 |
0.009 |
0.004 |
0.000 |
0.000 |
Table 14.
Deviation statistics of LEO satellite orbit forecasts at 1000km altitude under different atmospheric models (m).
Table 14.
Deviation statistics of LEO satellite orbit forecasts at 1000km altitude under different atmospheric models (m).
| |
USSA 1976 |
CIRA$1972 |
DTM$2012 |
Harris$-Pariester |
Jacchia$-Roberts |
| 1 hour |
R |
0.022 |
0.001 |
0.008 |
0.017 |
0.001 |
| T |
0.031 |
0.002 |
0.009 |
0.033 |
0.002 |
| N |
0.000 |
0.000 |
0.000 |
0.000 |
0.000 |
| 3D |
0.038 |
0.002 |
0.012 |
0.038 |
0.002 |
| 6 hours |
R |
0.120 |
0.008 |
0.033 |
0.125 |
0.007 |
| T |
1.492 |
0.047 |
0.499 |
1.002 |
0.039 |
| N |
0.001 |
0.000 |
0.001 |
0.001 |
0.000 |
| 3D |
1.497 |
0.047 |
0.501 |
1.009 |
0.039 |
| 24 hours |
R |
0.523 |
0.059 |
0.142 |
0.531 |
0.057 |
| T |
25.491 |
1.222 |
7.426 |
17.382 |
1.023 |
| N |
0.017 |
0.000 |
0.005 |
0.013 |
0.000 |
| 3D |
25.494 |
1.223 |
7.427 |
17.383 |
1.024 |
|
Disclaimer/Publisher’s Note: The statements, opinions and data contained in all publications are solely those of the individual author(s) and contributor(s) and not of MDPI and/or the editor(s). MDPI and/or the editor(s) disclaim responsibility for any injury to people or property resulting from any ideas, methods, instructions or products referred to in the content. |
© 2024 by the authors. Licensee MDPI, Basel, Switzerland. This article is an open access article distributed under the terms and conditions of the Creative Commons Attribution (CC BY) license (http://creativecommons.org/licenses/by/4.0/).
