1. Introduction
Within the last century, humans have drastically accelerated the loss and alteration of biodiversity across the globe, due to overexploitation of biological resources and the destruction of natural habitats [
1,
2]. Rewilding projects have been initiated throughout Europe, which is in line with the EU Biodiversity Strategy for 2030, aiming to protect and restore nature [
2,
3]. The aim of rewilding is to manage ecological succession with the objective of restoring ecosystems and ecological dynamics, thus enhancing biodiversity [
1,
4]. This can be achieved by reintroducing key grazers such as cattle, sheep, or horses to areas with high habitat homogeneity [
1,
4]. In areas of rewilding, barriers are needed to keep the large grazers in an enclosure to prevent conflicts between humans and animals [
5,
6]. These barriers are often physical, such as electric fences or sisal ropes, which can be an obstacle for the local wildlife as it restricts their migration and is not fit for quick alterations [
5,
7,
8,
9].
As an alternative, virtual fences provide a solution that does not affect wildlife. By establishing borders that can be easily moved, virtual fences also reduce the risk of an area being overgrazed [
10,
11]. There are several types of virtual fence [
8,
10]. One of them is Nofence
©. The Nofence
© system works by equipping each animal with a collar. The collar is connected to a GPS based system, and can issue auditory warning cues or electric impulses to keep the animals within a designated area. The system is primarily used on cattle and sheep, which have shown the ability to respond to the audio warnings issued by the collars, and the system has thereby proven to be successful at keeping the animals enclosed [
12,
13,
14,
15,
16,
17]. Therefore, Nofence
© can also be beneficial for agricultural use, as it allows farmers to contain and move animals within certain areas more easily [
10,
13]. However, implementing the Nofence
© system, might be considered costly and requires large financial investments from farmers to enclose their livestock [
17]. The initial investment have the potential of keeping potential buyers away, even though it would be cheaper in the long run, as most farmers already have their cattle enclosed in a traditional physical fencing [
10]. Also, a collar for every cow could make it financially difficult for farmers to use the Nofence
© technology on a large scale [
10,
18]. In order to lower costs, it may be possible to reduce the number of collars, if the herd maintains a cohesive social group around dominant individuals.
Previous studies show how cattle exhibit a tendency to form and maintain cohesive social groups as part of their normal behaviour [
19,
20,
21]. All cows within the herd may not require collars if they are organized in social groups around one or several dominant individuals [
19,
22]. It could then be sufficient to place a collar on the dominant individuals as the rest of the herd might follow these individuals. According to Arave & Albright [
19] the dominant individuals occupy the middle whereas Šárová et al. [
22] conclude that the dominant individuals occupy the front. The results from Šárová et al. [
22] furthermore shows that an increase in dominance leads to a greater influence on herd movement. Despite their different conclusions, both studies suggest a pattern in the spatial distribution. Studies such as those by Kondo et al. [
23,
24] and Šárová et al. [
22] investigate behaviour to describe such hierarchies and individual positional preferences based on the location of the herd and observation of individuals. However, this method is time consuming and difficult to implement on a large scale [
18]. Therefore, another method is needed to determine how the herd positions itself, and whether the herd follows one or more dominant cows.
The aim of this paper is to determine how individuals within a herd position themselves in relation to each other, solely by looking at distances between individuals within a Nofence
© system. This may allow farmers to reduce costs by only collaring dominant cows. This was achieved by studying a herd of 17 Angus cows (
Bos taurus) using GPS locations provided by the Nofence
© collars. It is expected to find an established pattern within the herd, with individuals maintaining a consistent position in relation to herd mates over the course of a given time period. The pattern is expected to show few individuals with high or low ranks while the remaining cattle varies within the middle rank values [
19,
22]. The ranks are based on the distances between individuals. Identifying such patterns could provide a deeper understanding of spatial distribution and thereby hierarchy when using a Nofence
© system. To investigate if any pattern appears, this paper examines the distances between an individual to the rest of the herd mates using nearest neighbour and distribution plots.
2. Materials and Methods
2.1. Location and Animals
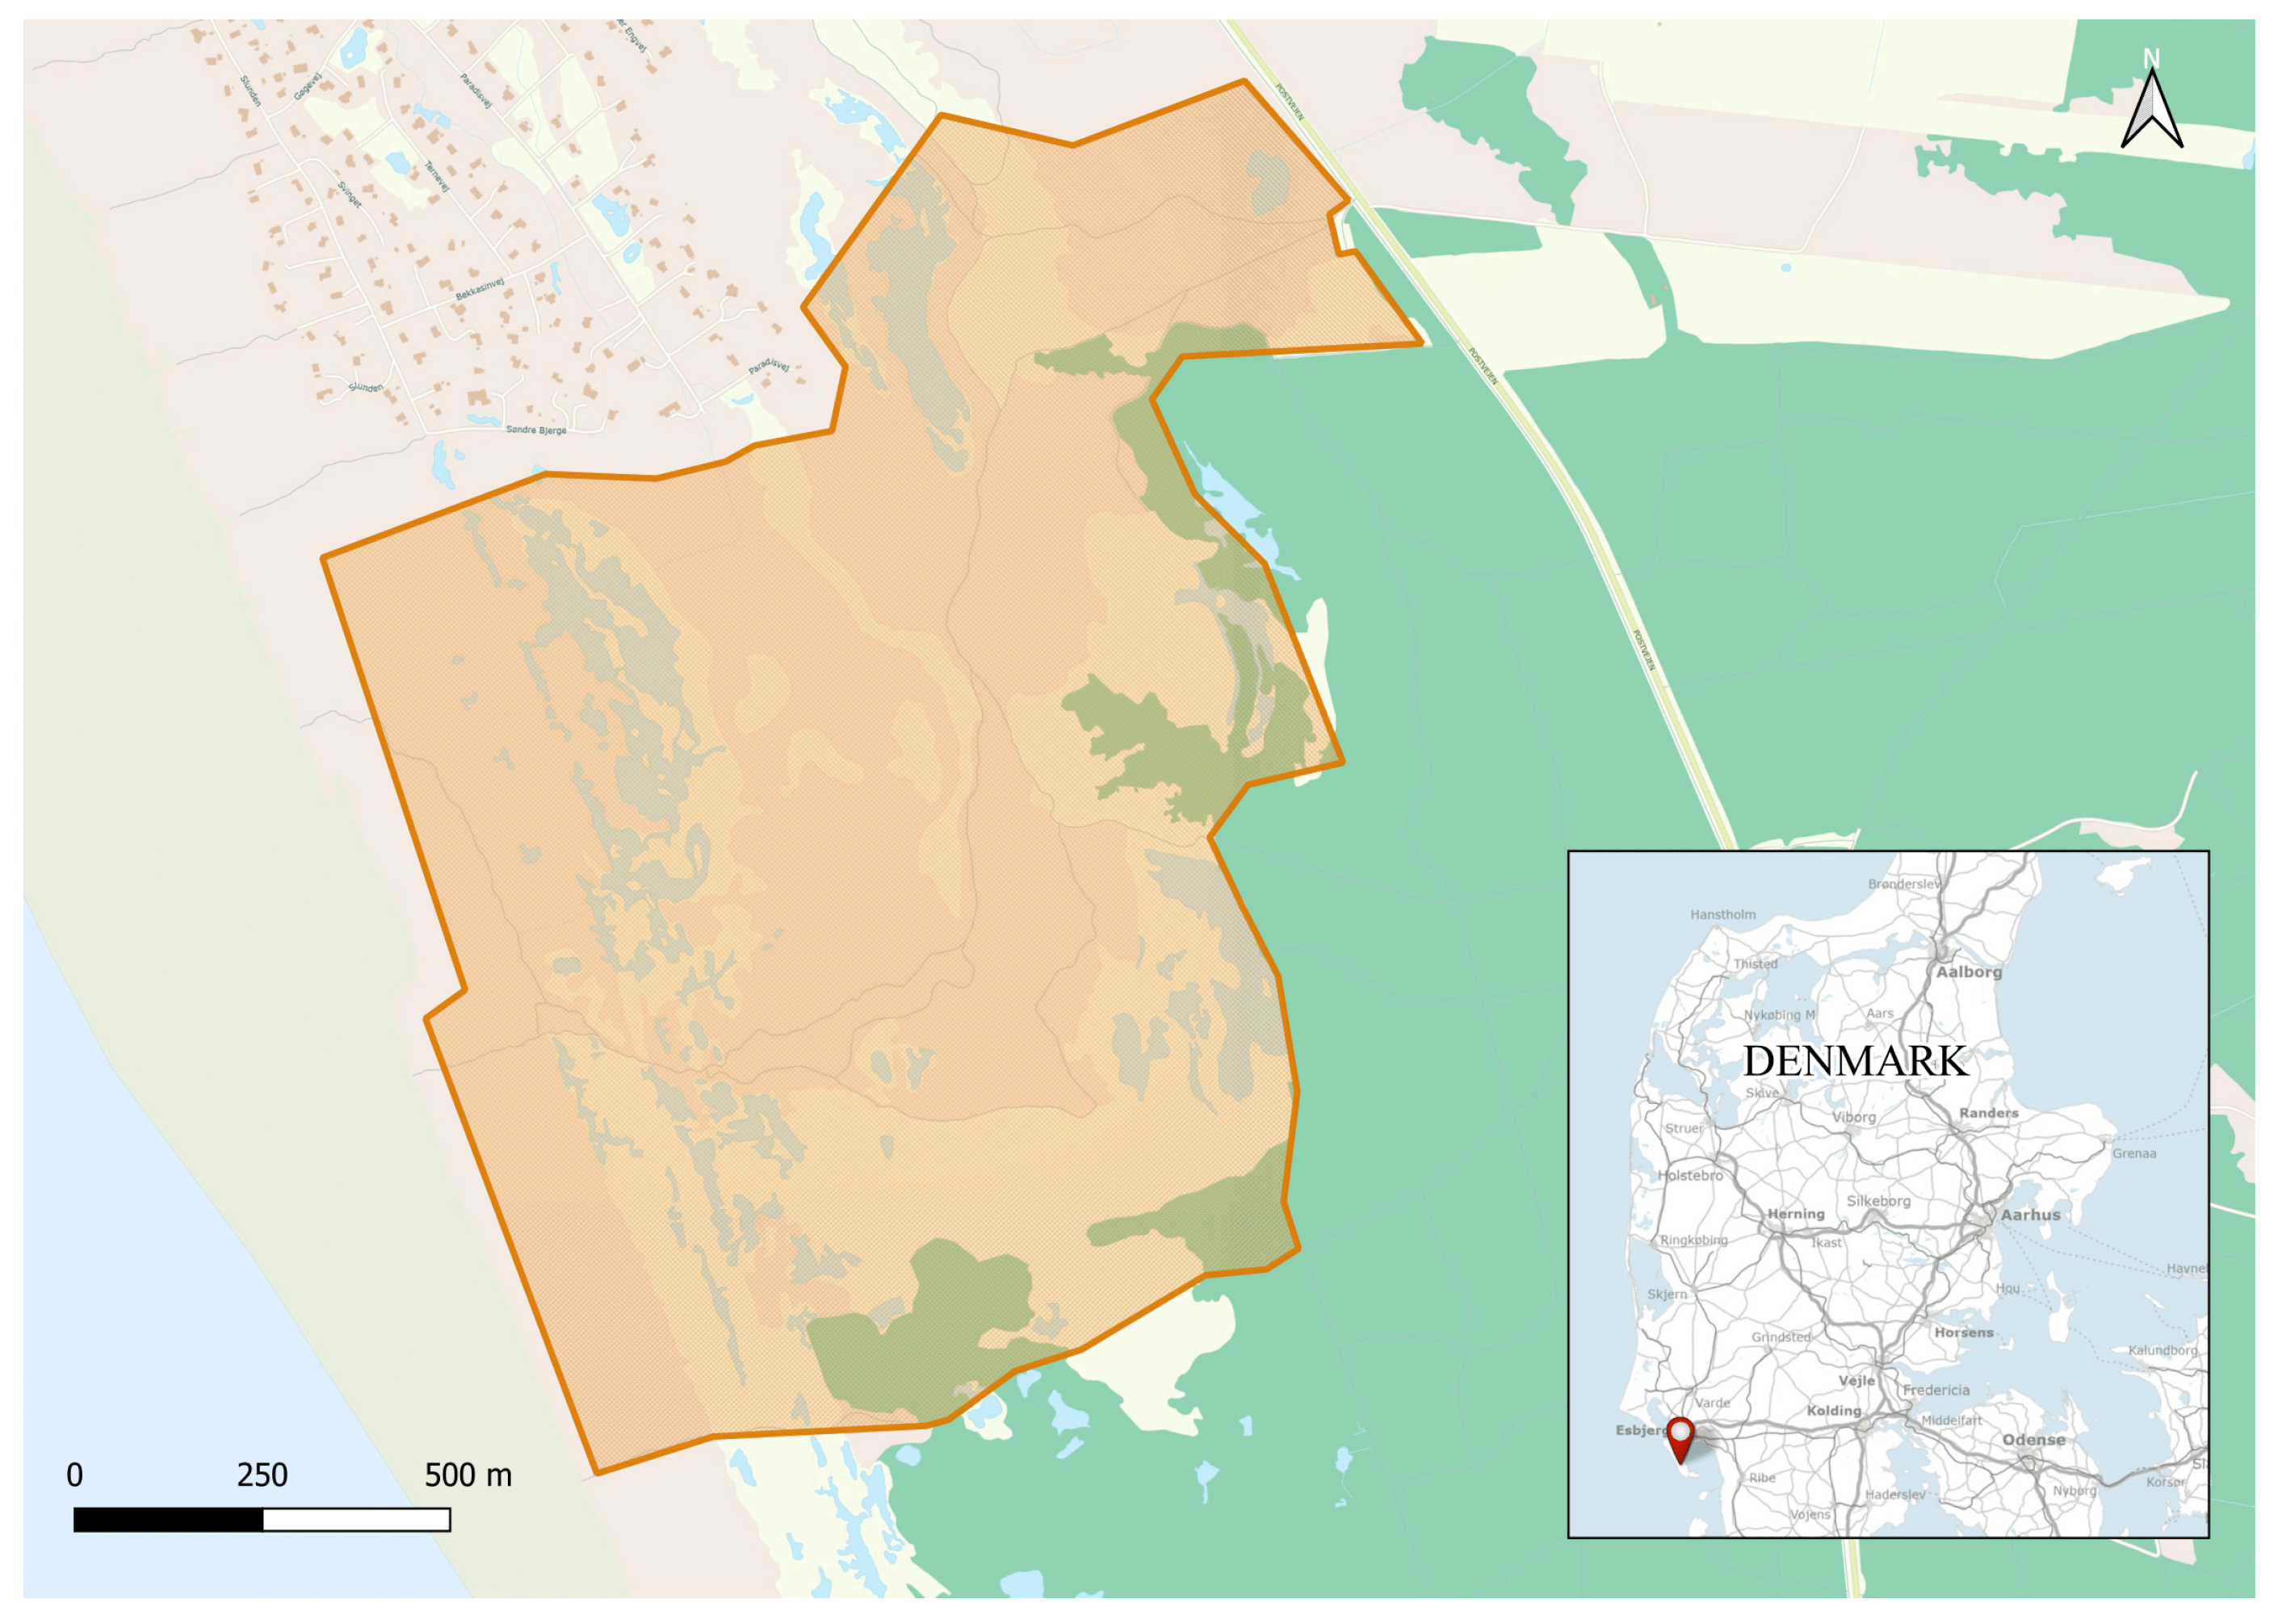
The study was conducted on a herd of domestic cattle in an area called Gåsehullerne on the island Fanø in Denmark (
Figure 1). The cattle were located on the western part of the island in an area of coastal moorland and dune landscapes with grass and heath vegetation. The cattle had access to both lakes and dry areas covering a total of 160 hectares.
The herd was introduced to the area in May 2023. Data collection for this study took place between 15th of August and 15th of October 2023 during which the borders remained unchanged, and the cattle were well habituated to the area and the borders prior to data collection. The herd consisted of 17 Angus cattle (B. taurus), (16 heifers aged 10-17 months and a single cow aged 11 years and 3 months). Throughout this paper, these animals will be referred to as cows.
2.2. The Nofence© System
All animals wore a Nofence
© collar, each with a unique serial number, used to identify each individual (
Appendix C). Off 17 animals, 16 wore the same collars throughout the entire experiment. One collar lost connection and was replaced after three days, and therefore one animal had two serial numbers (
Appendix C). The Nofence
© collars were equipped with a battery, two solar panels and an integrated GPS receiver. The collars issued three kinds of messages: A poll message, a client warning, and a client zap. All the messages consisted of a timestamp, a serial number, and longitude and latitude. The poll messages were issued every 15 minutes. The client warnings were issued with the auditory warning whenever an individual drew near the virtual border. The warning was a rising tone at 82 decibels lasting between 5-20 seconds, depending on whether the animal turned around or continued being at risk of crossing the virtual border. The client zap messages were issued if an individual crossed the border despite the warning. The signal was paired with an electric shock of
J for one second. An individual can be given up to three electric shocks, thus sending three client zap signals before the shock warning is disabled.
2.3. Data Collection
The timing of the poll messages was not aligned, meaning the poll signals came at a different time point for each individual in the herd. Therefore, it was necessary to arrange the data in 15-minute intervals. Each day started with the interval at 00:00 - 00:15 UTC. The GPS signals from the client warnings and the client zaps were included in the data set. If several signals were issued from one cow within the 15-minute interval, a median of longitude and latitude were taken. Some days were excluded from the data collection due to malfunctioning collars. 16 days (August 22nd to August 29th, September 1st to September 3rd, and September 24th to September 28th) were removed from the data set since less than 17 cows were registered. This could be due to the collars losing power or connection.
All data was sorted, and the statistical analysis done in R version 4.3.2 [
26].
2.4. Statistical Analysis
Non-parametric methods were used for the statistical analyses, as the data did not follow a normal distribution.
The distance between the cattle were investigated by running a nearest neighbour analysis. For each 15-minute interval, a distance between each individual was calculated resulting in 16 distances per cow. This was done by using GPS positions derived from the different messages. Based on the 16 distances, a median was derived and used to determine the cow’s median distance to the rest of the herd. Each median value was ranked from the shortest (Rank 1) to the longest distance (Rank 17). For each day in the study period, a median was again calculated by grouping all ranks for every 15-minute interval. This resulted in one single value representing how a cow ranked each day. The use of a median based method was chosen on the basis of the amount of data being inconsistent between each cow throughout the study period, as the collars regularly lost signal shortly.
To see how ranks were distributed between the cattle during the time period, a boxplot and a density plot was made. Both plots contain the rank for each individual each day. In addition, a time series graph was used to visualize if any pattern in ranks occurred during the period, thus determining whether the cows maintained the same rank on a daily basis. A cumulative graph of ranks for each cow was also made and assessed as another way to visualize a possible pattern. Kendall’s Coefficient of Concordance (W) was calculated to test if such a pattern was significant.
3. Results
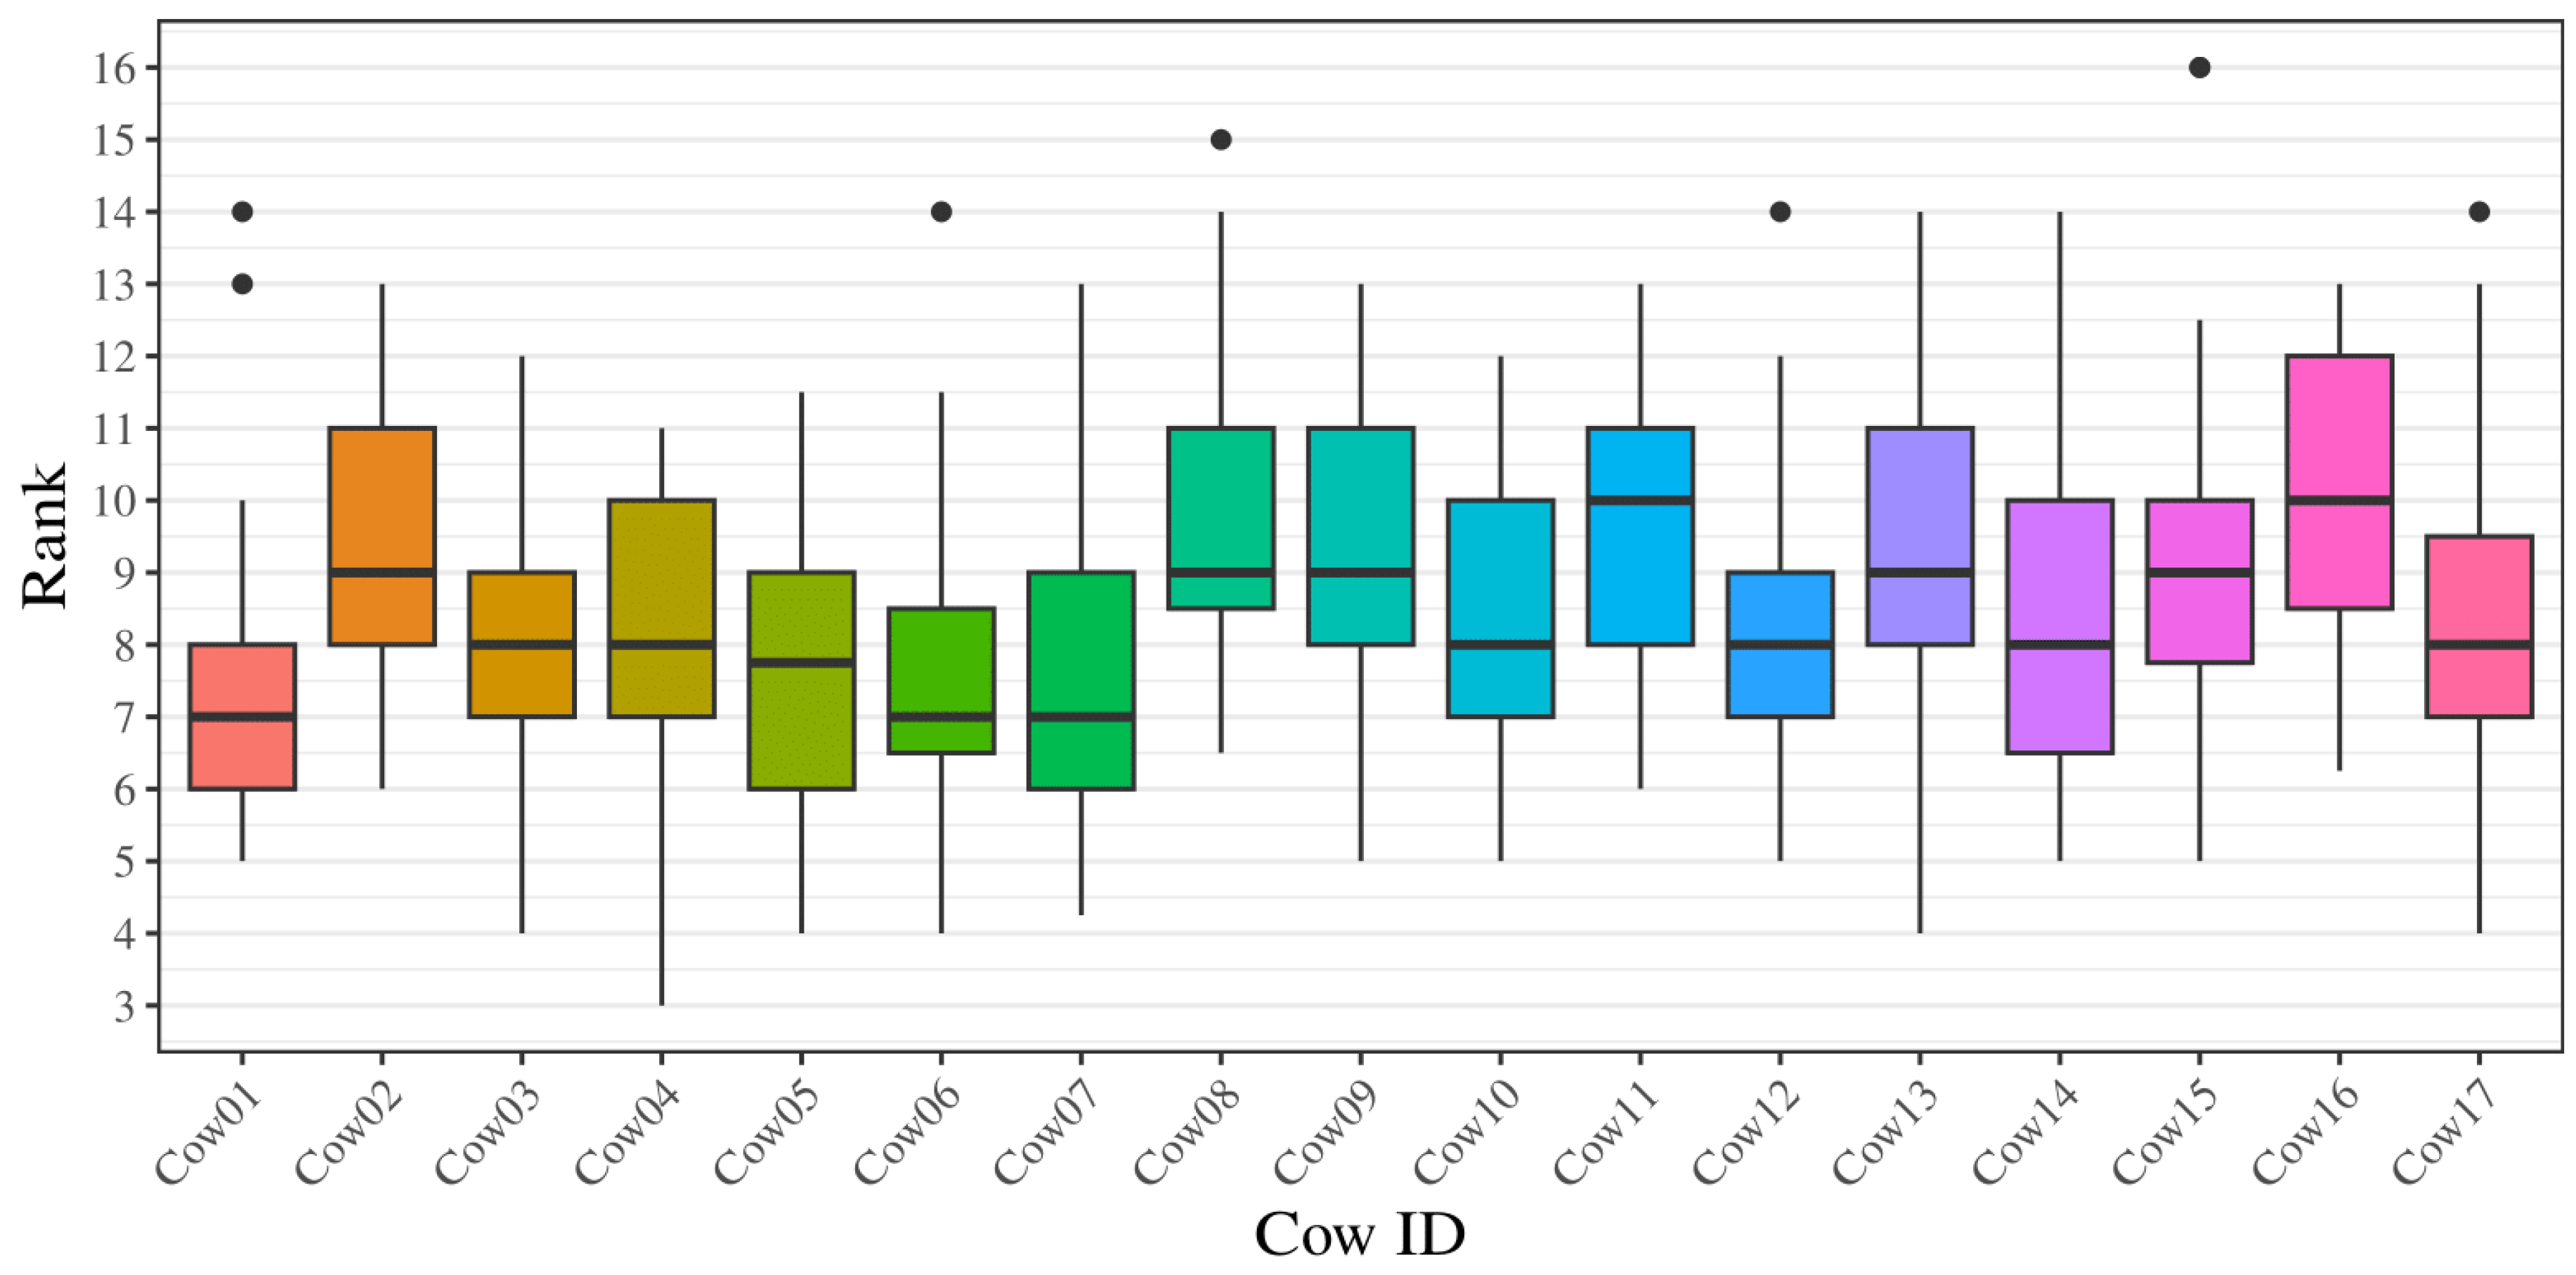
The ranking distribution for each cow throughout the entire period lies within a minimum 3 and maximum 16 (
Figure 2). The medians range between 7 and 10 (
Figure 2).
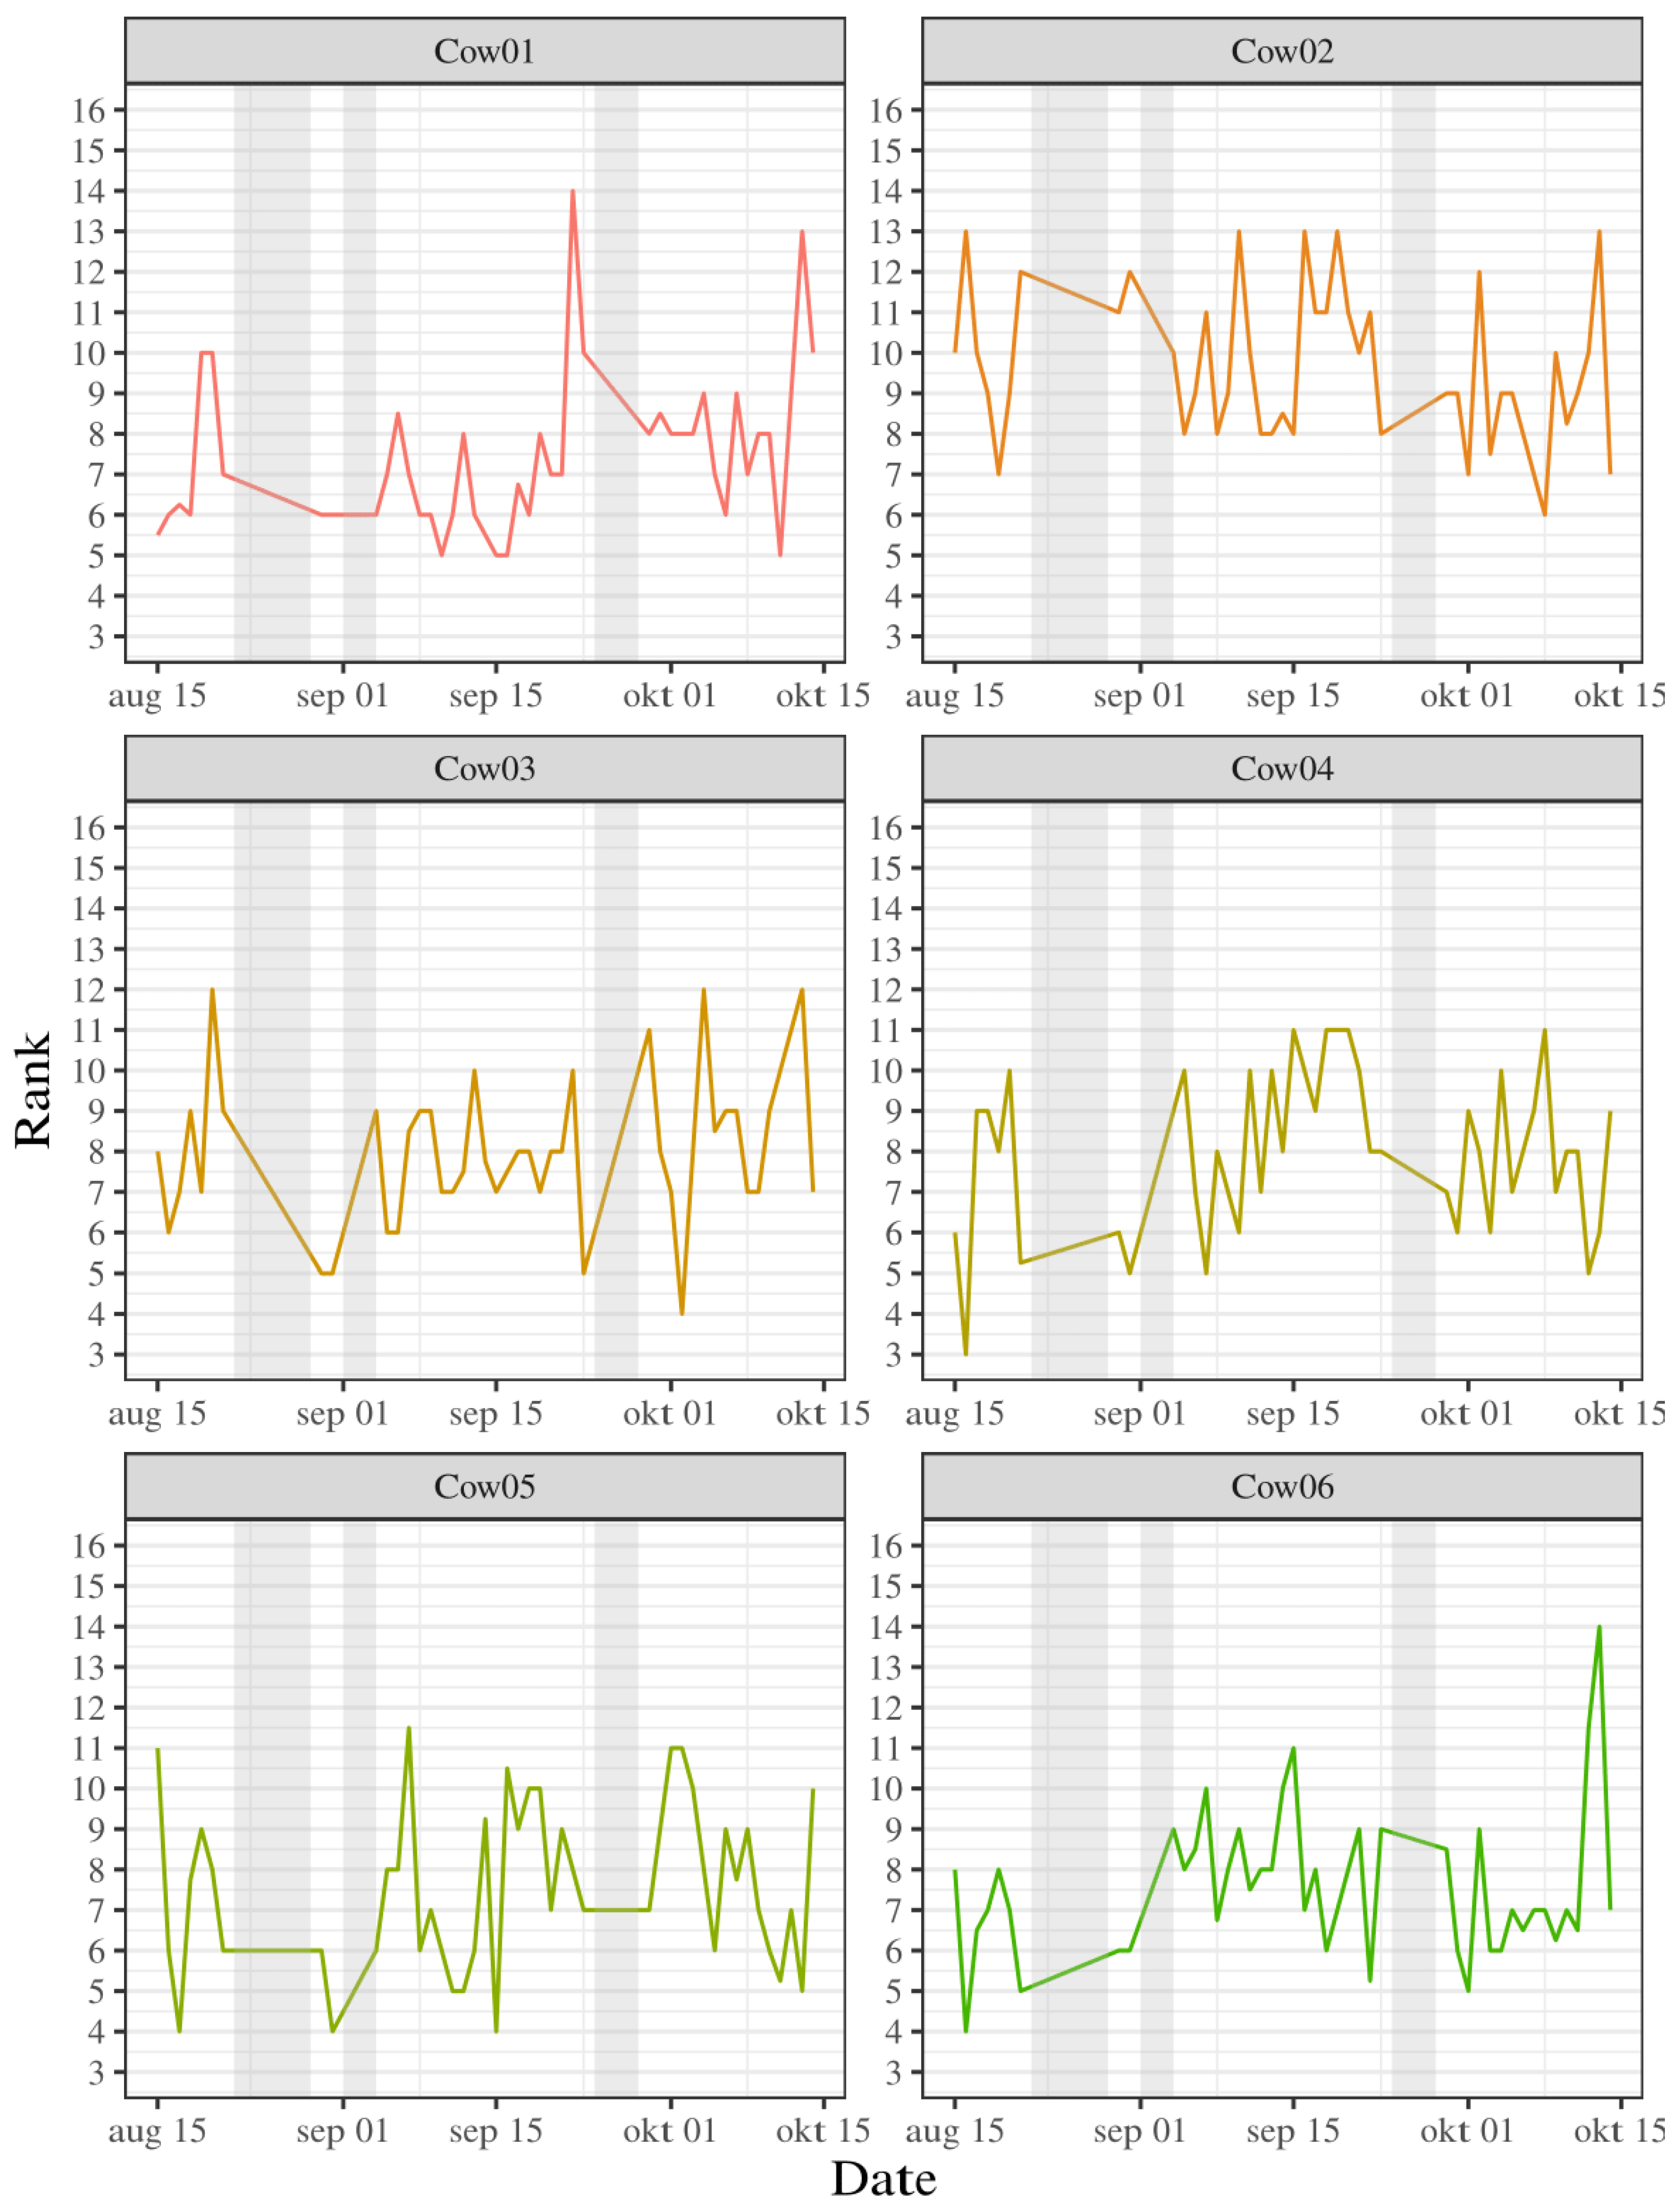
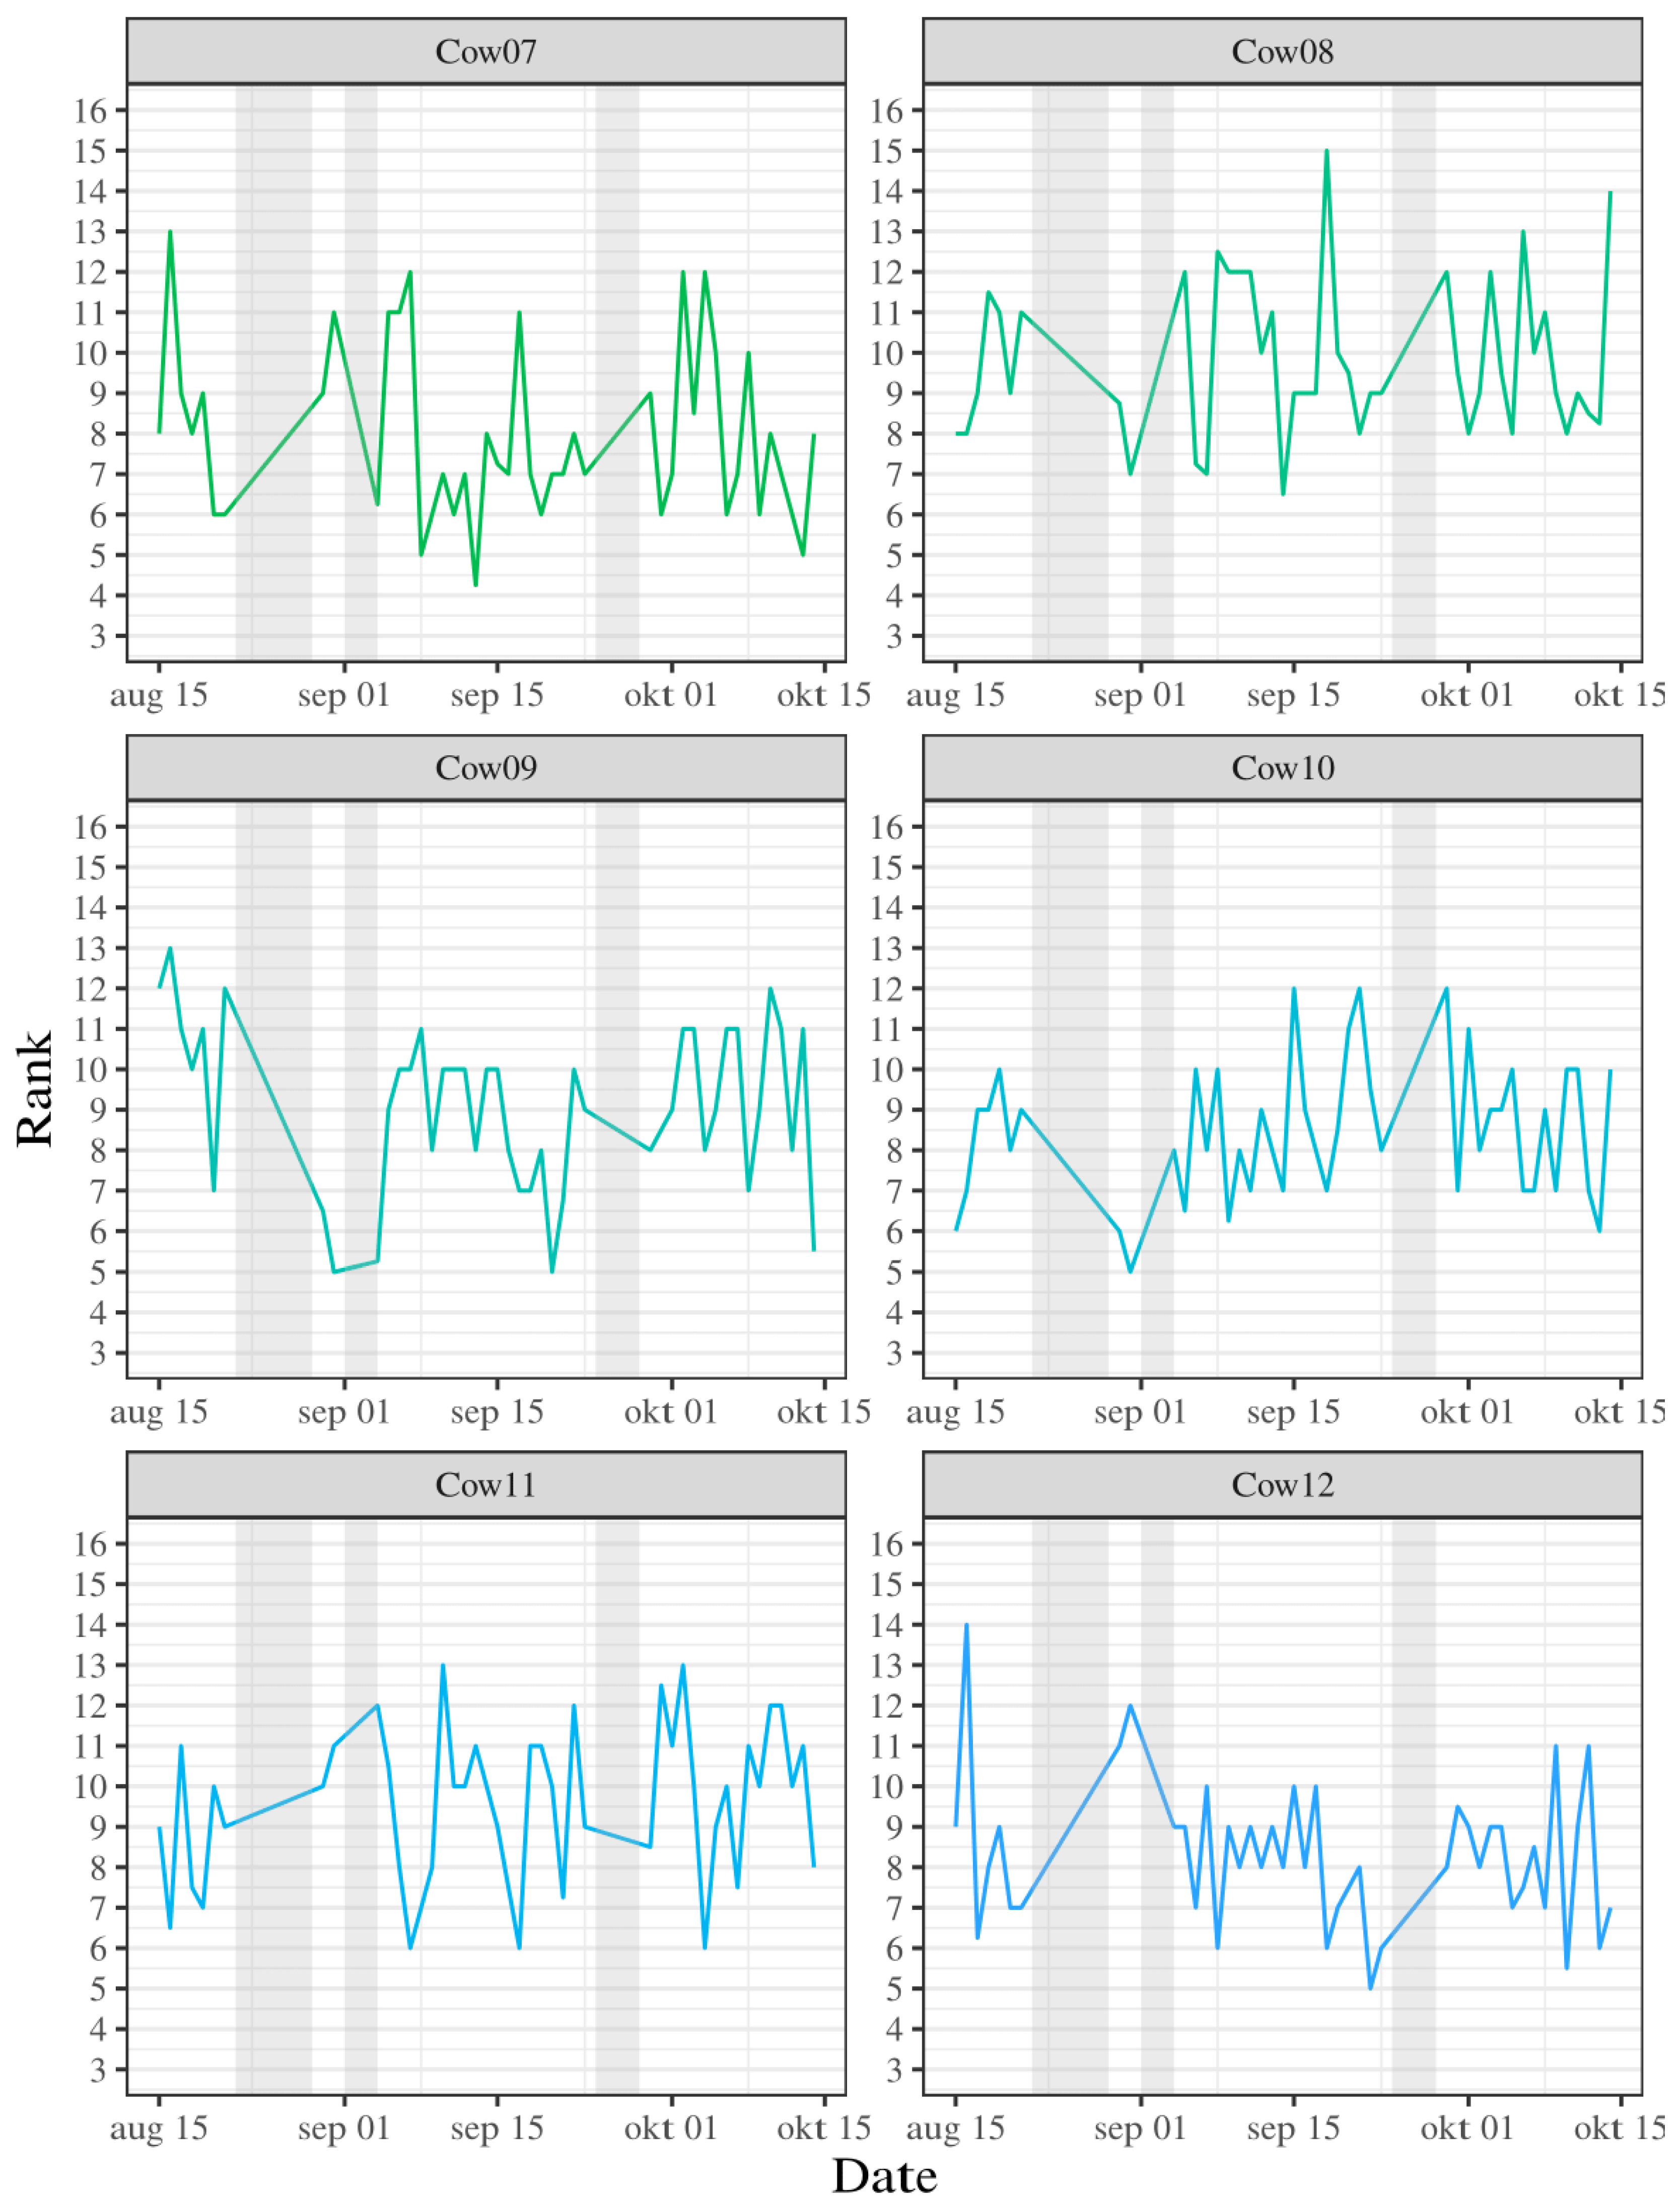
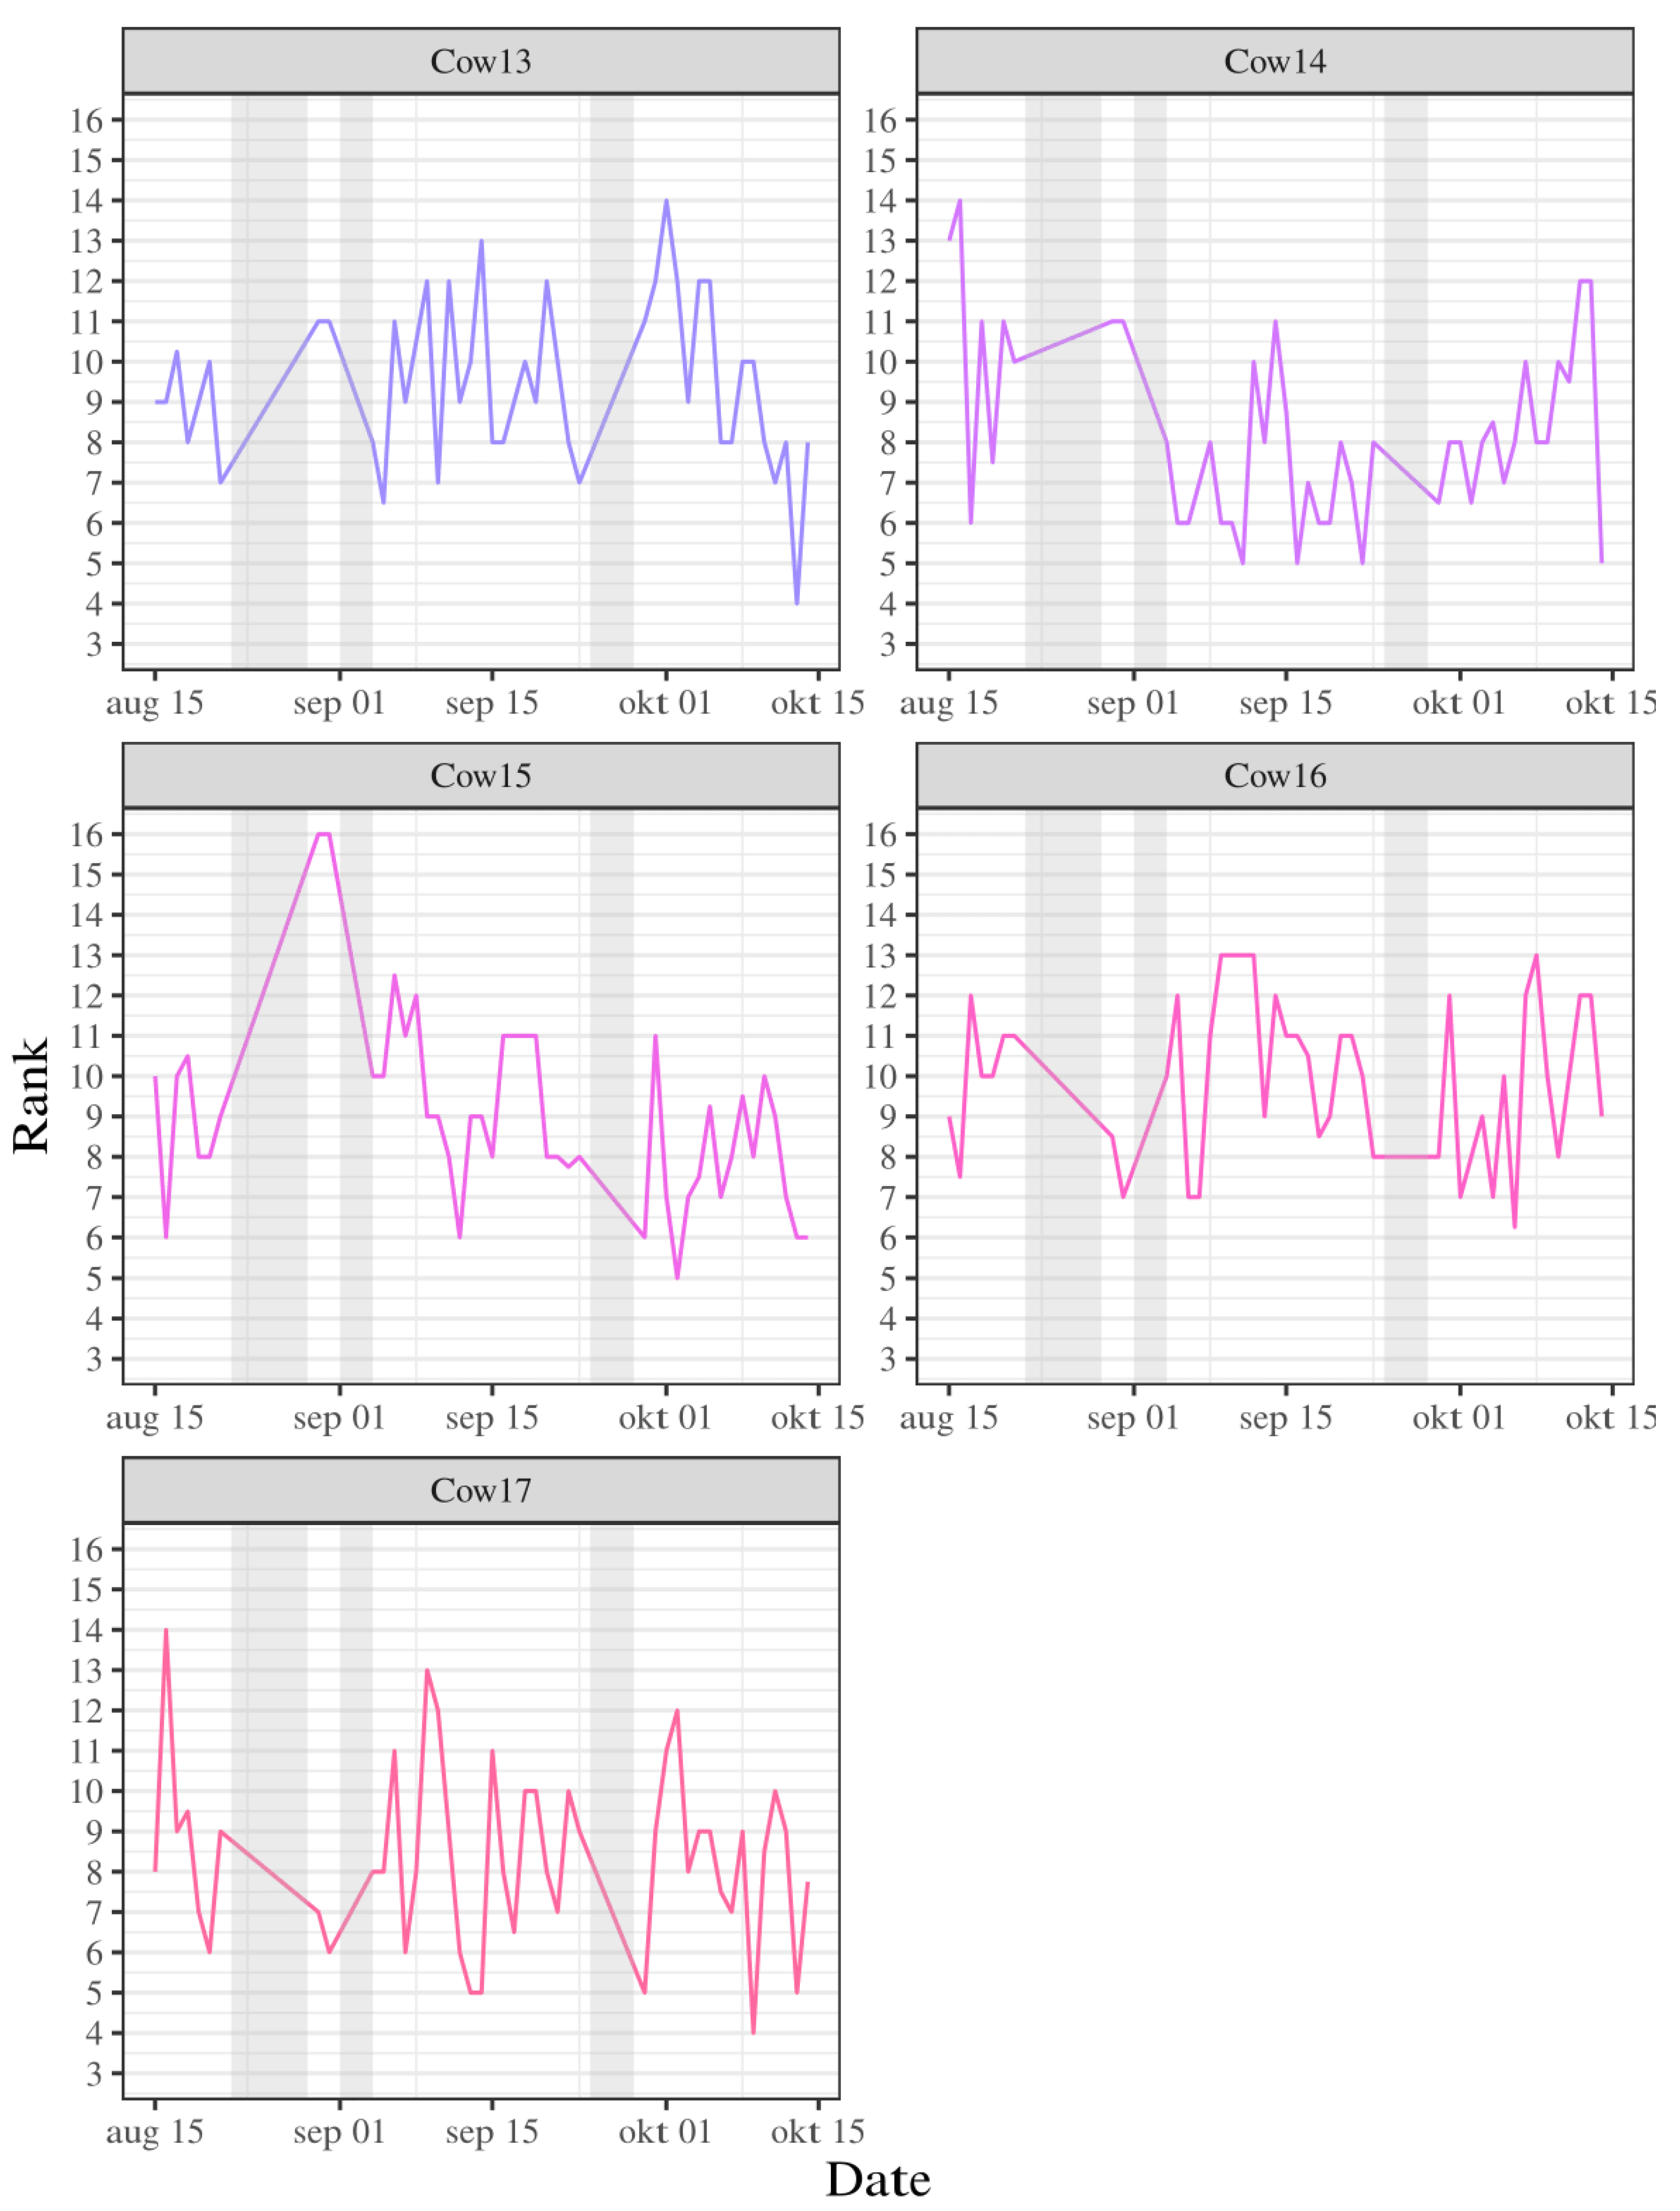
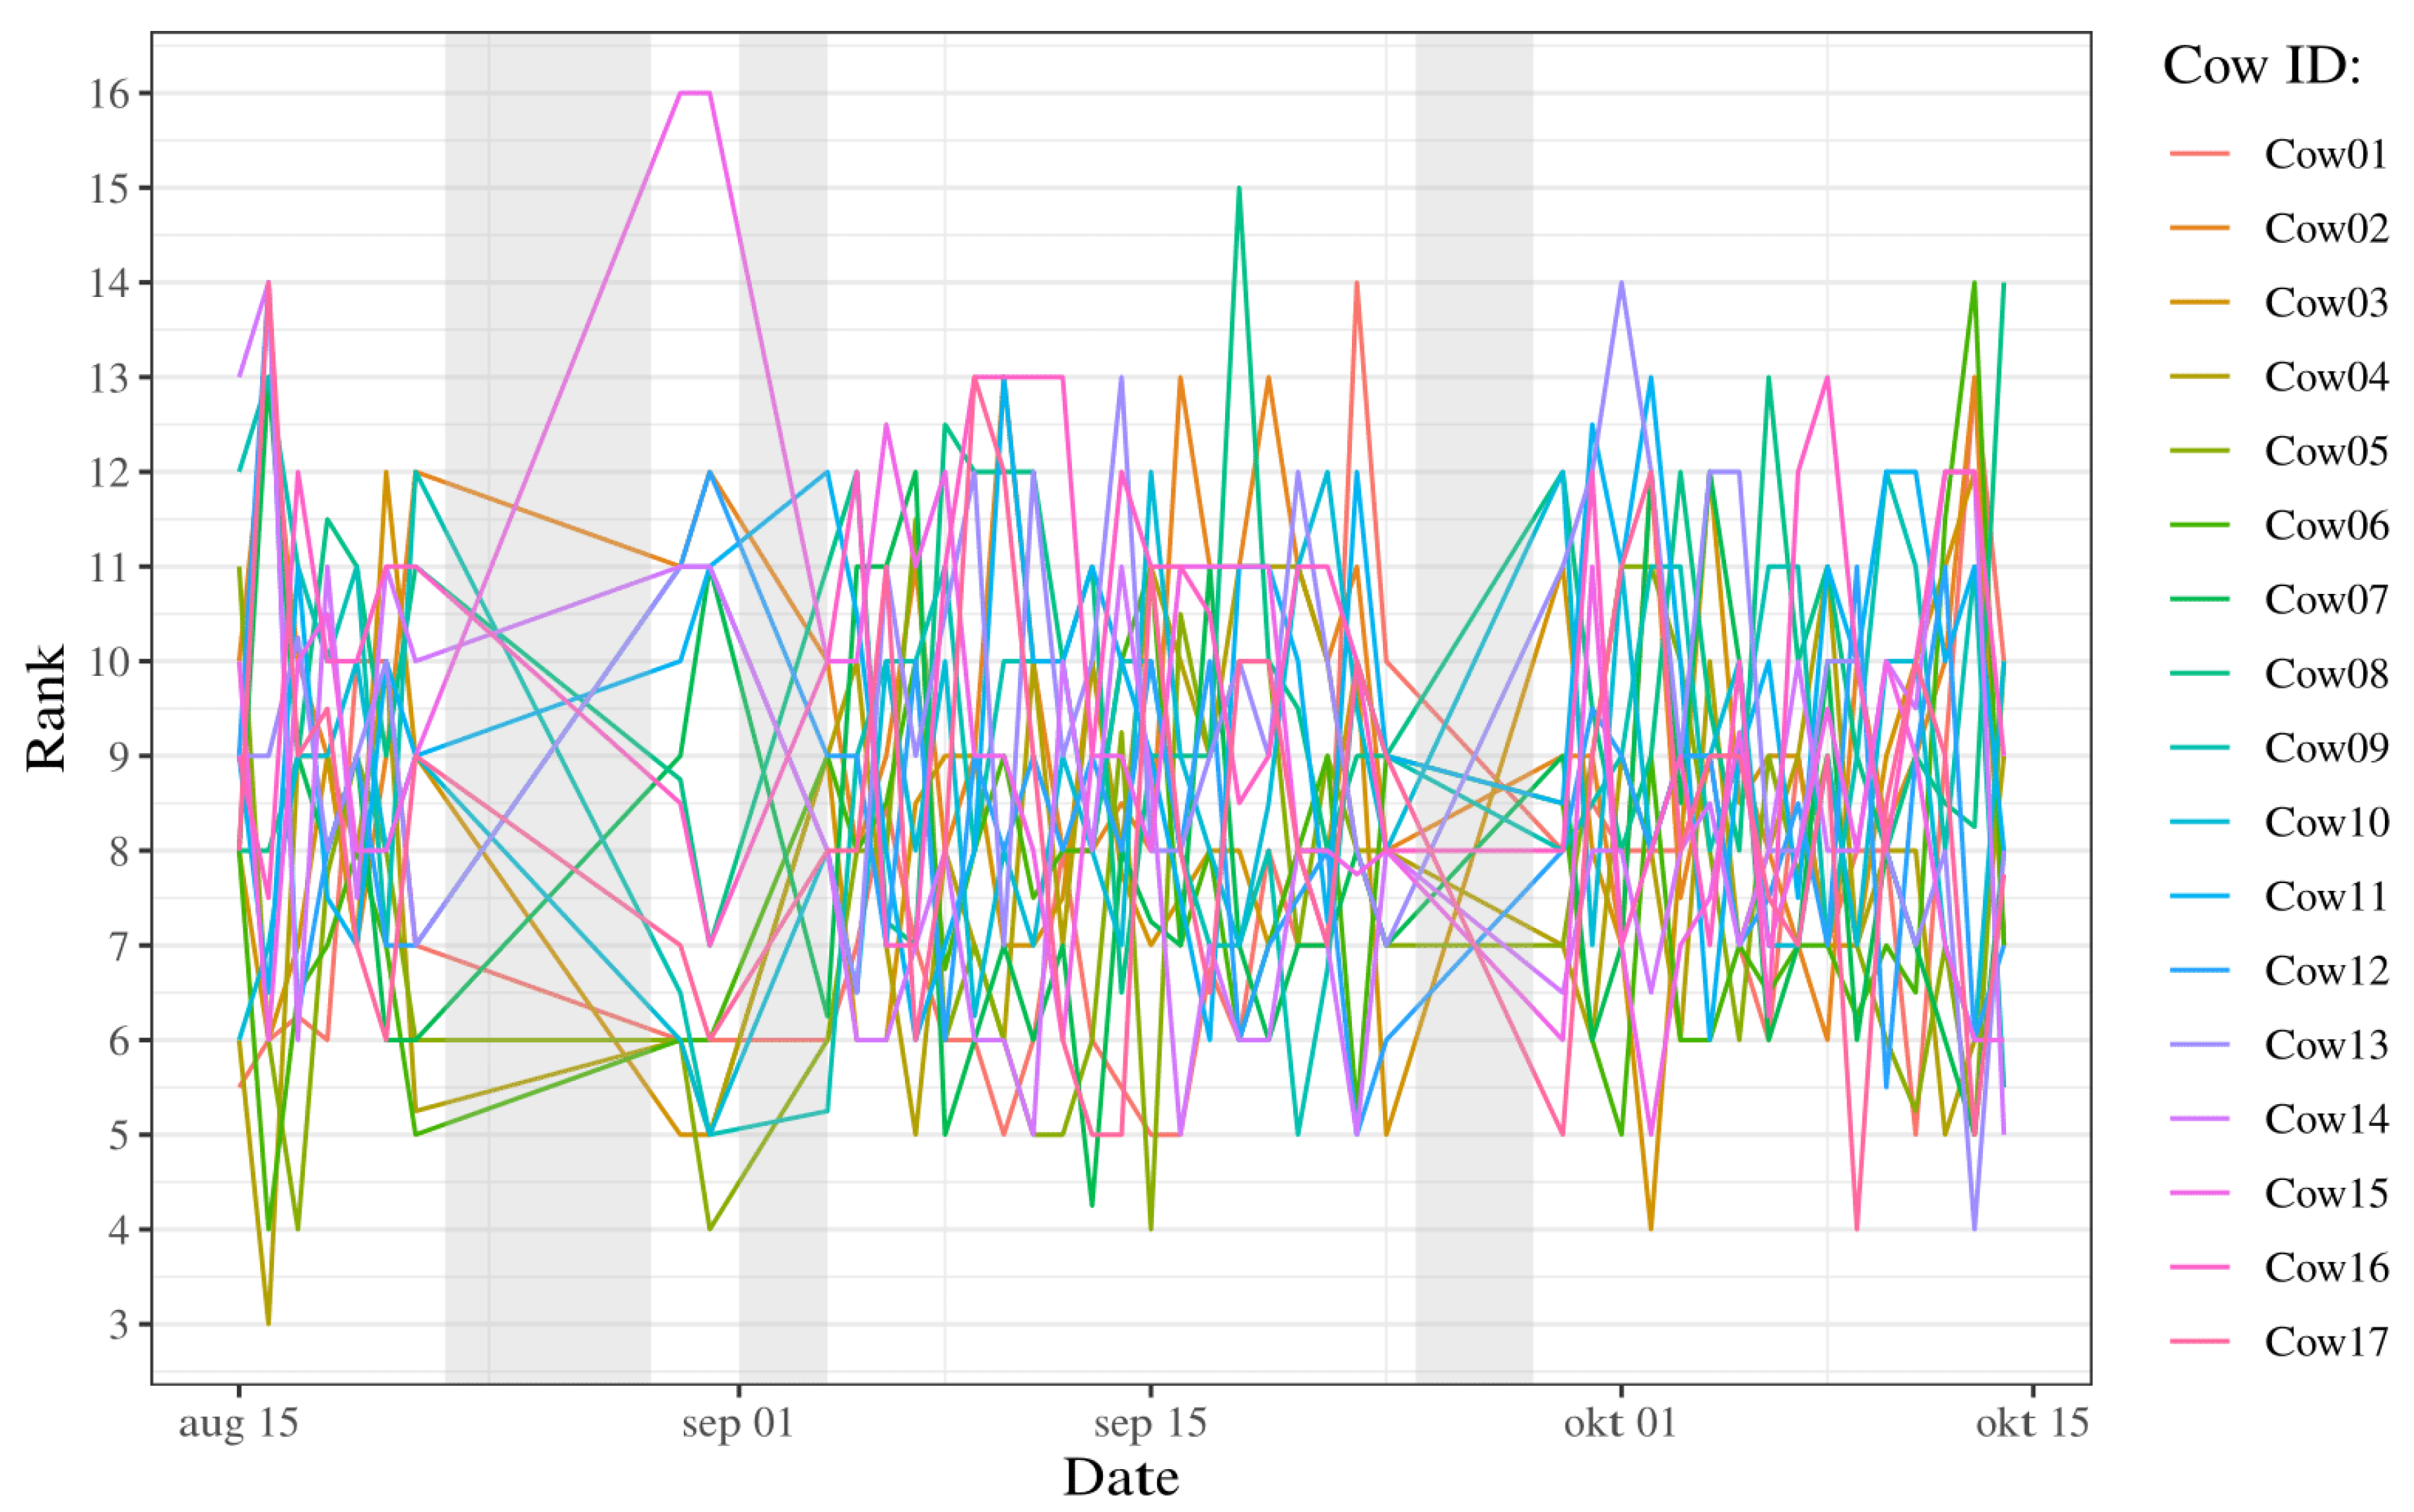
As none of the cows maintained the same rank during the study period, the time series shows crossings and overlaps of the ranks between different individuals (
Figure 3,
Appendix A). Kendall’s Coefficient of Concordance shows a concordance in rank between the days (
). However, the concordance shows only a slight agreement (
), meaning that the ranks varied between days.
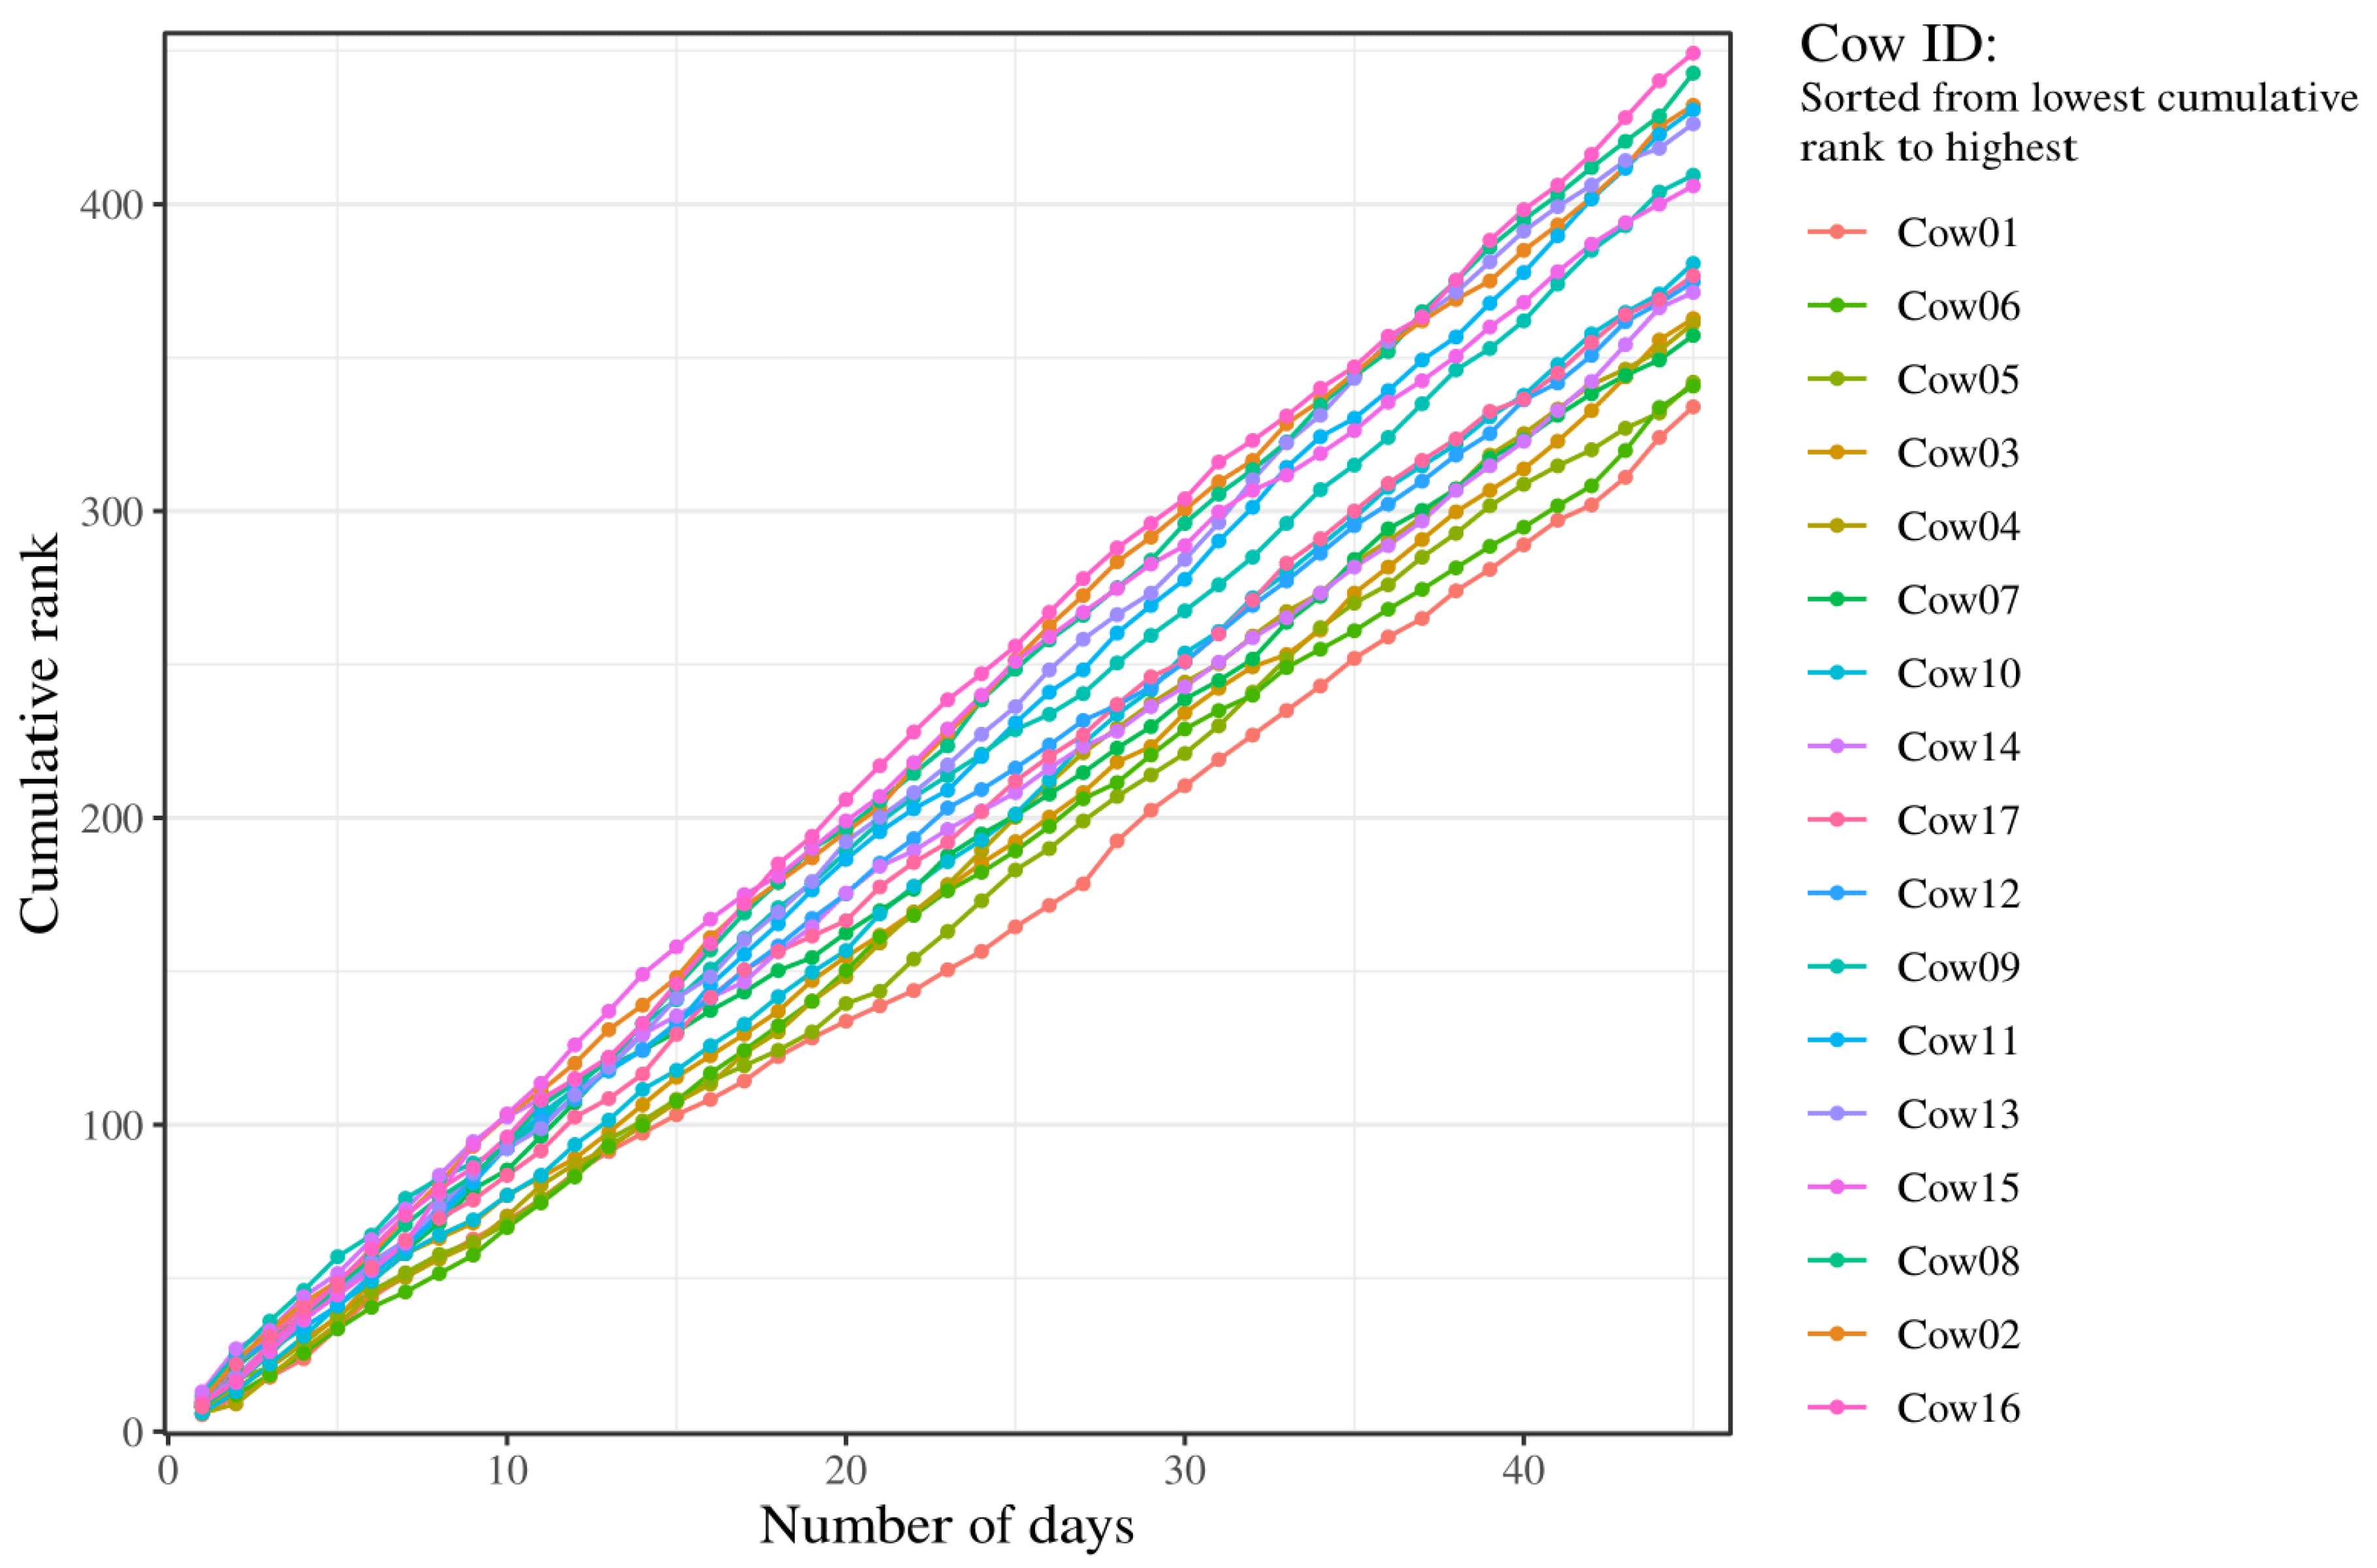
When assessing the cumulative rank of each cow it shows an almost parallel course where the lines crosses and overlap (
Figure 4). A separation begins around day number 20 which increases slightly throughout the rest of the study period. By the end the highest cumulative rank is 449, indicating the individual how had the overall lowest computed rank in the study period, and the lowest is 334.
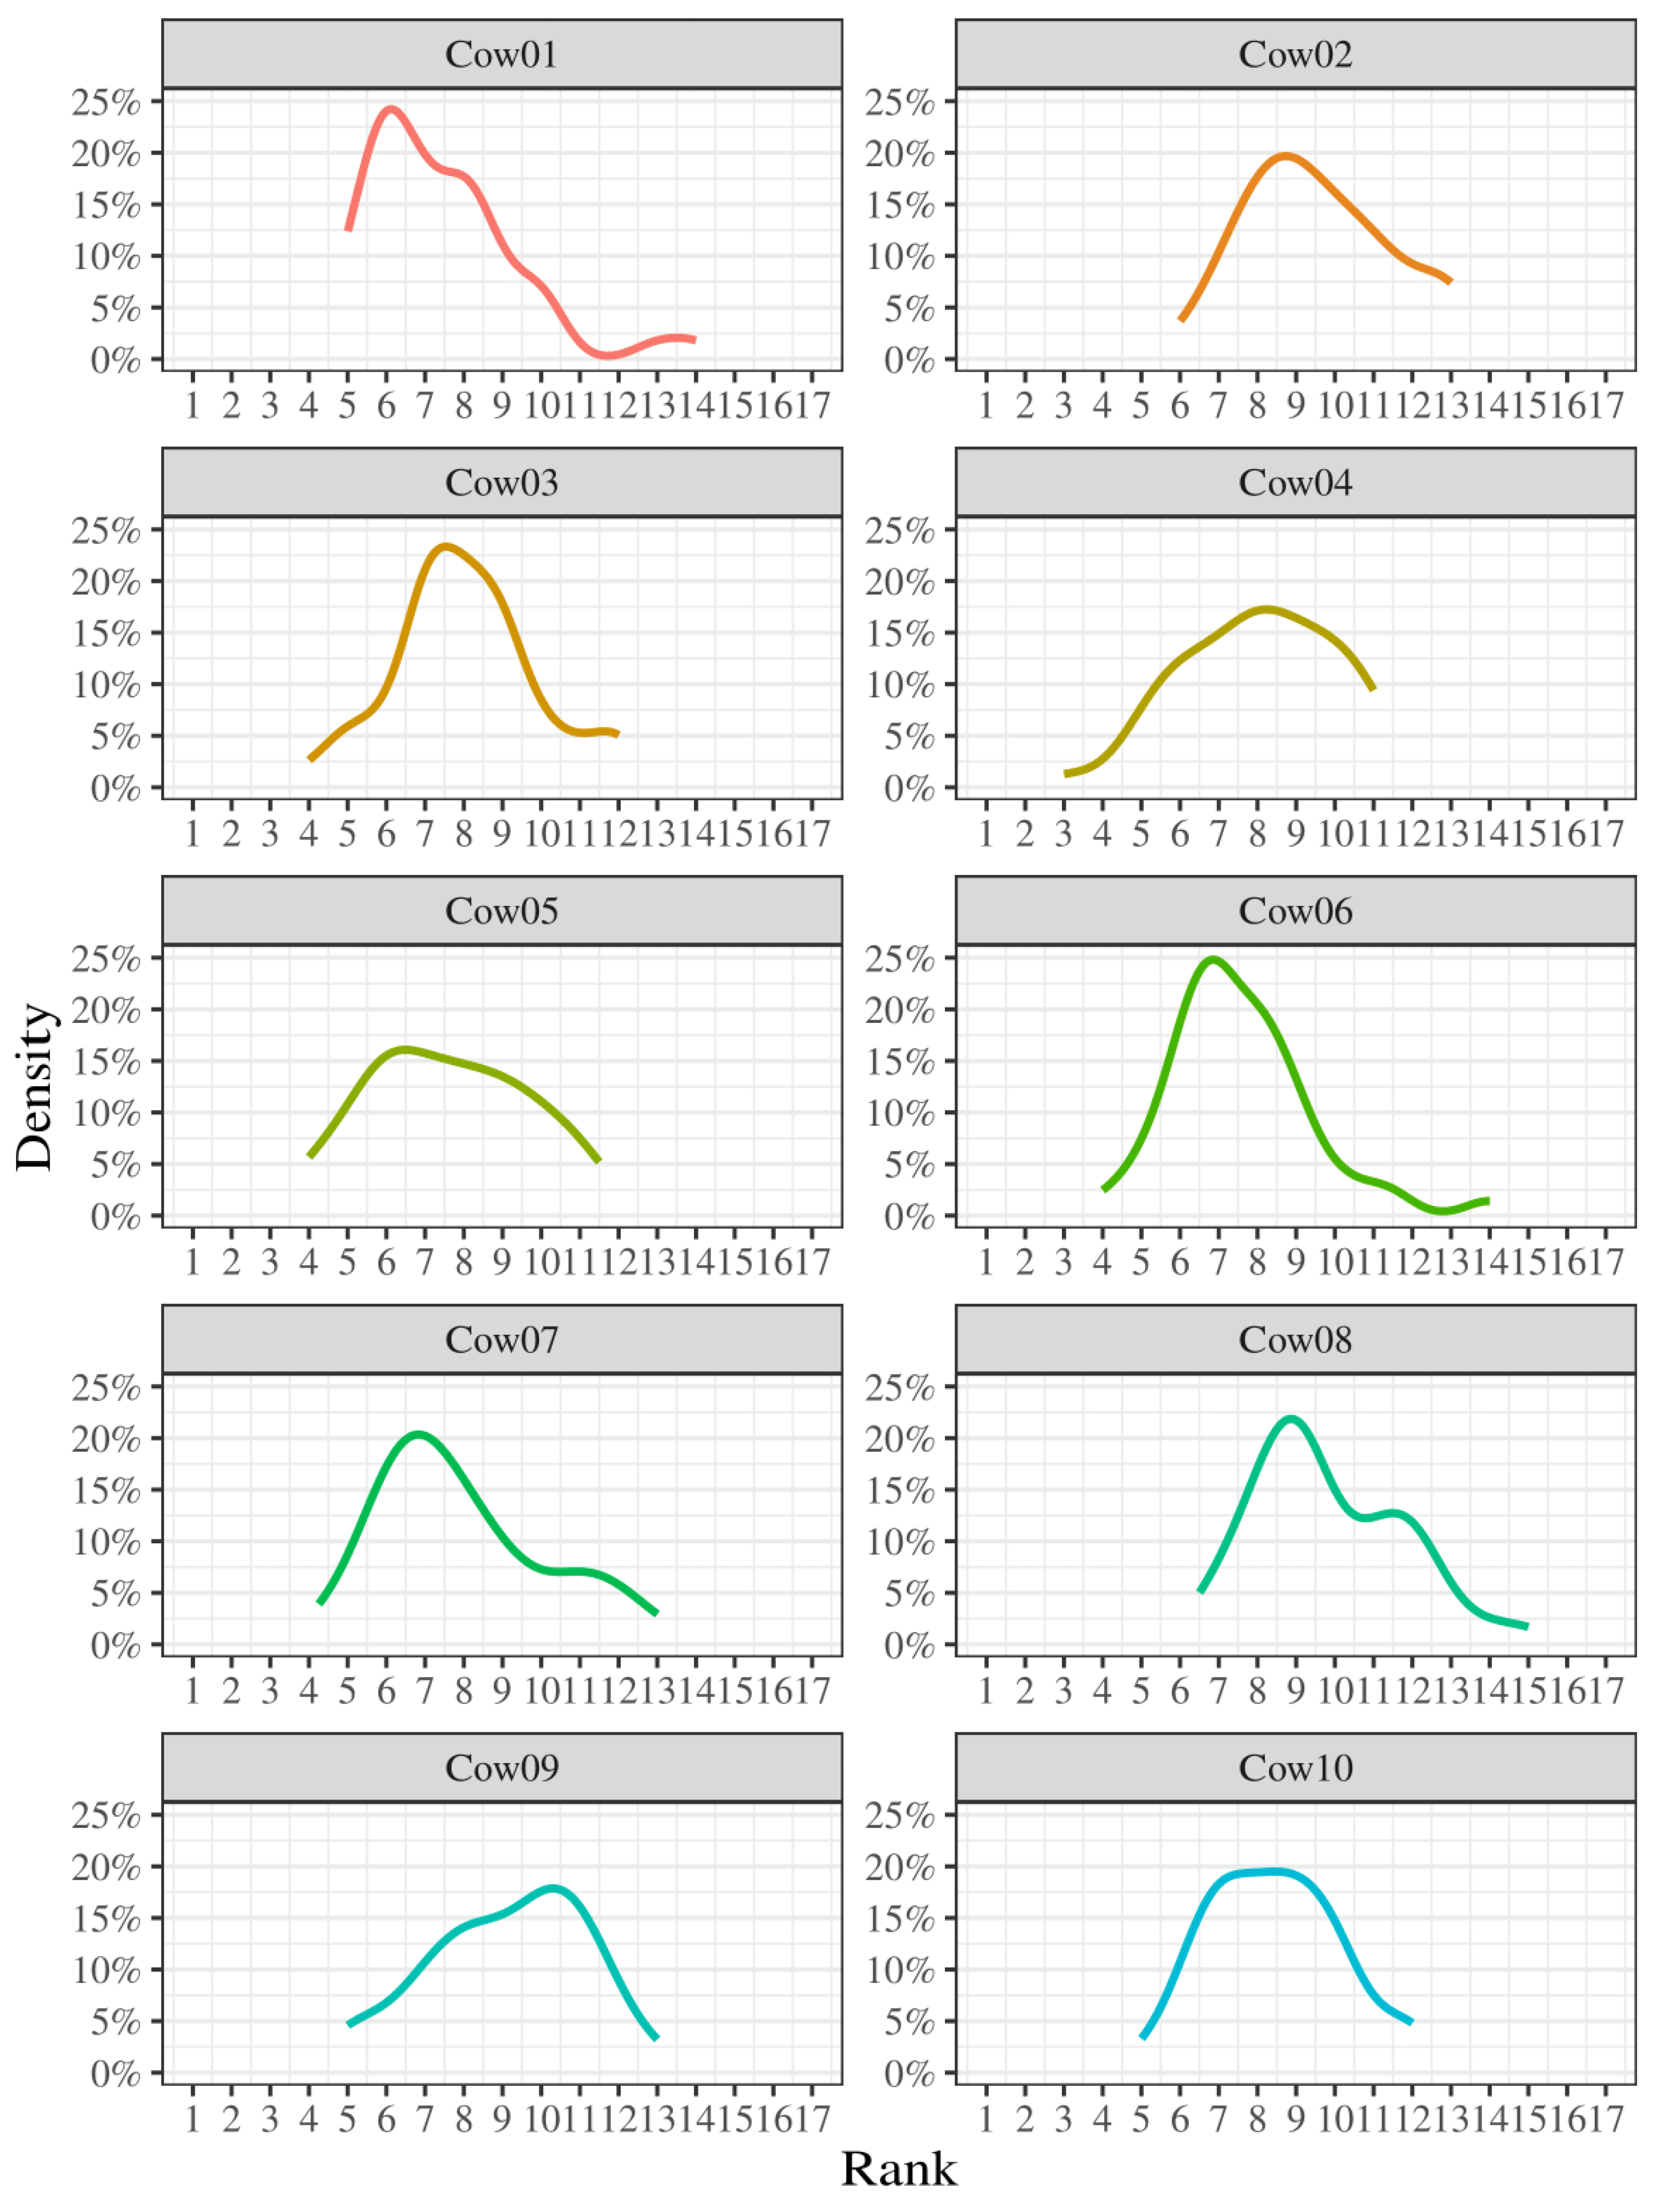
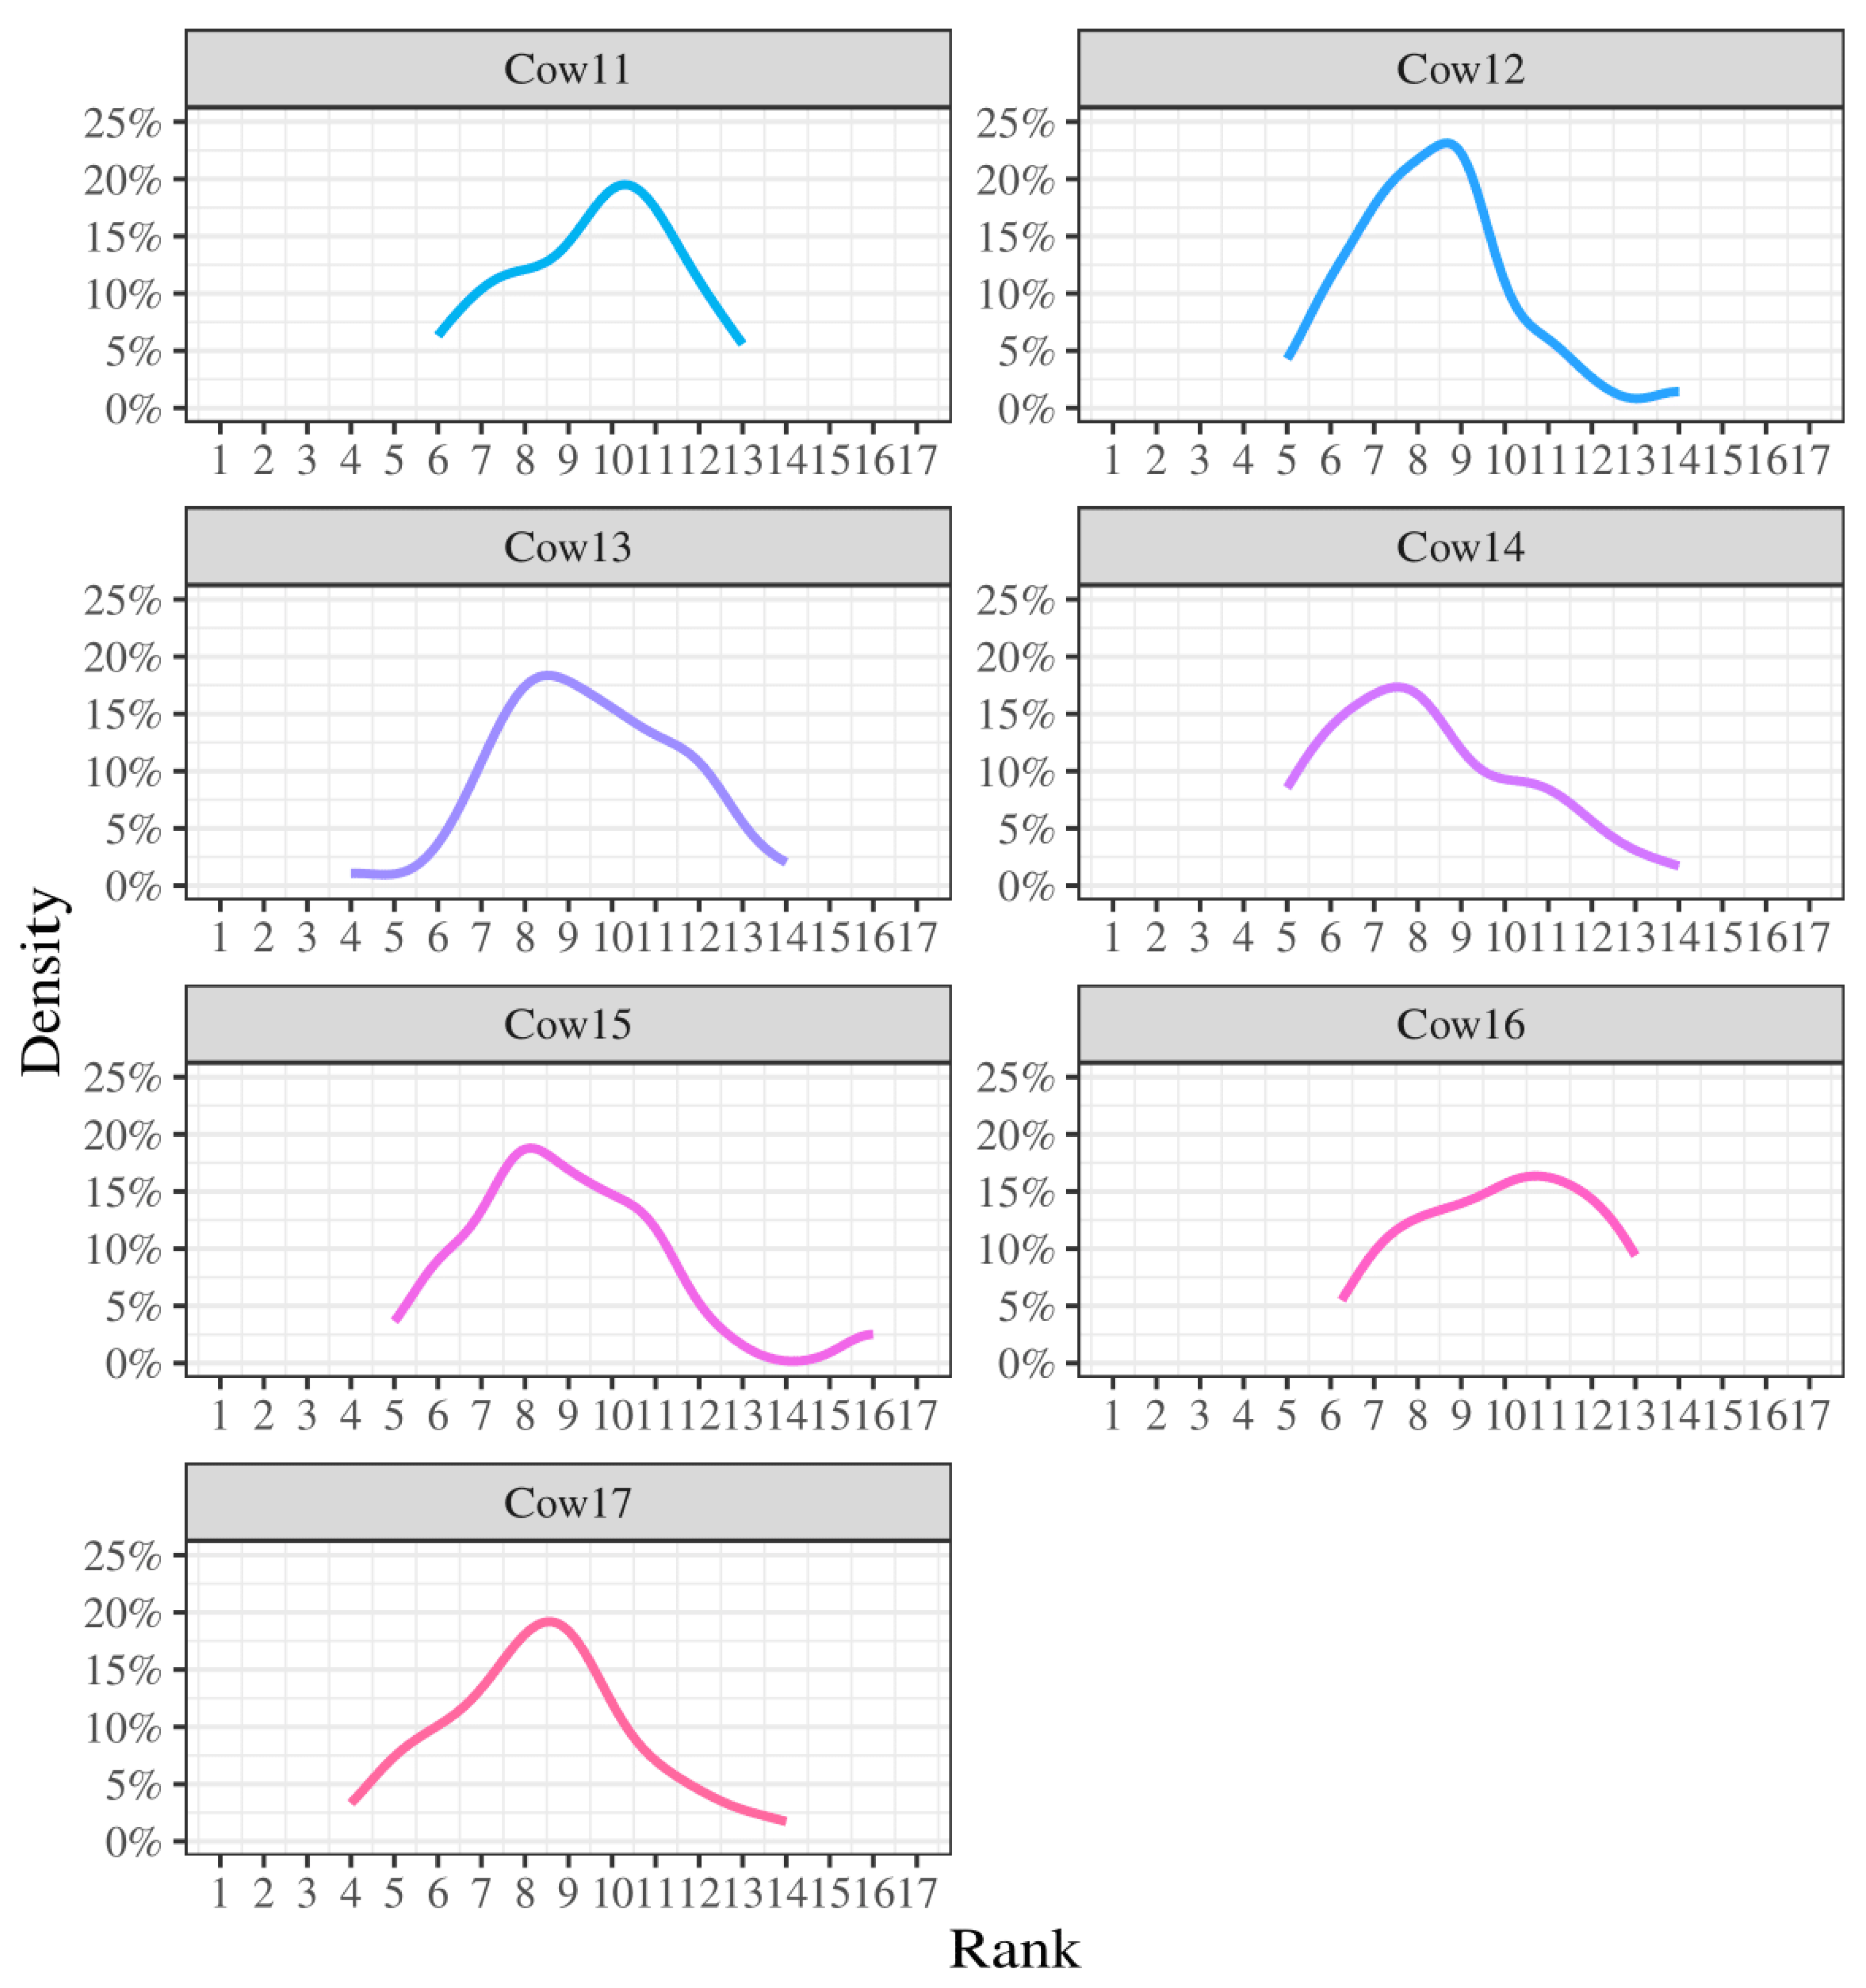
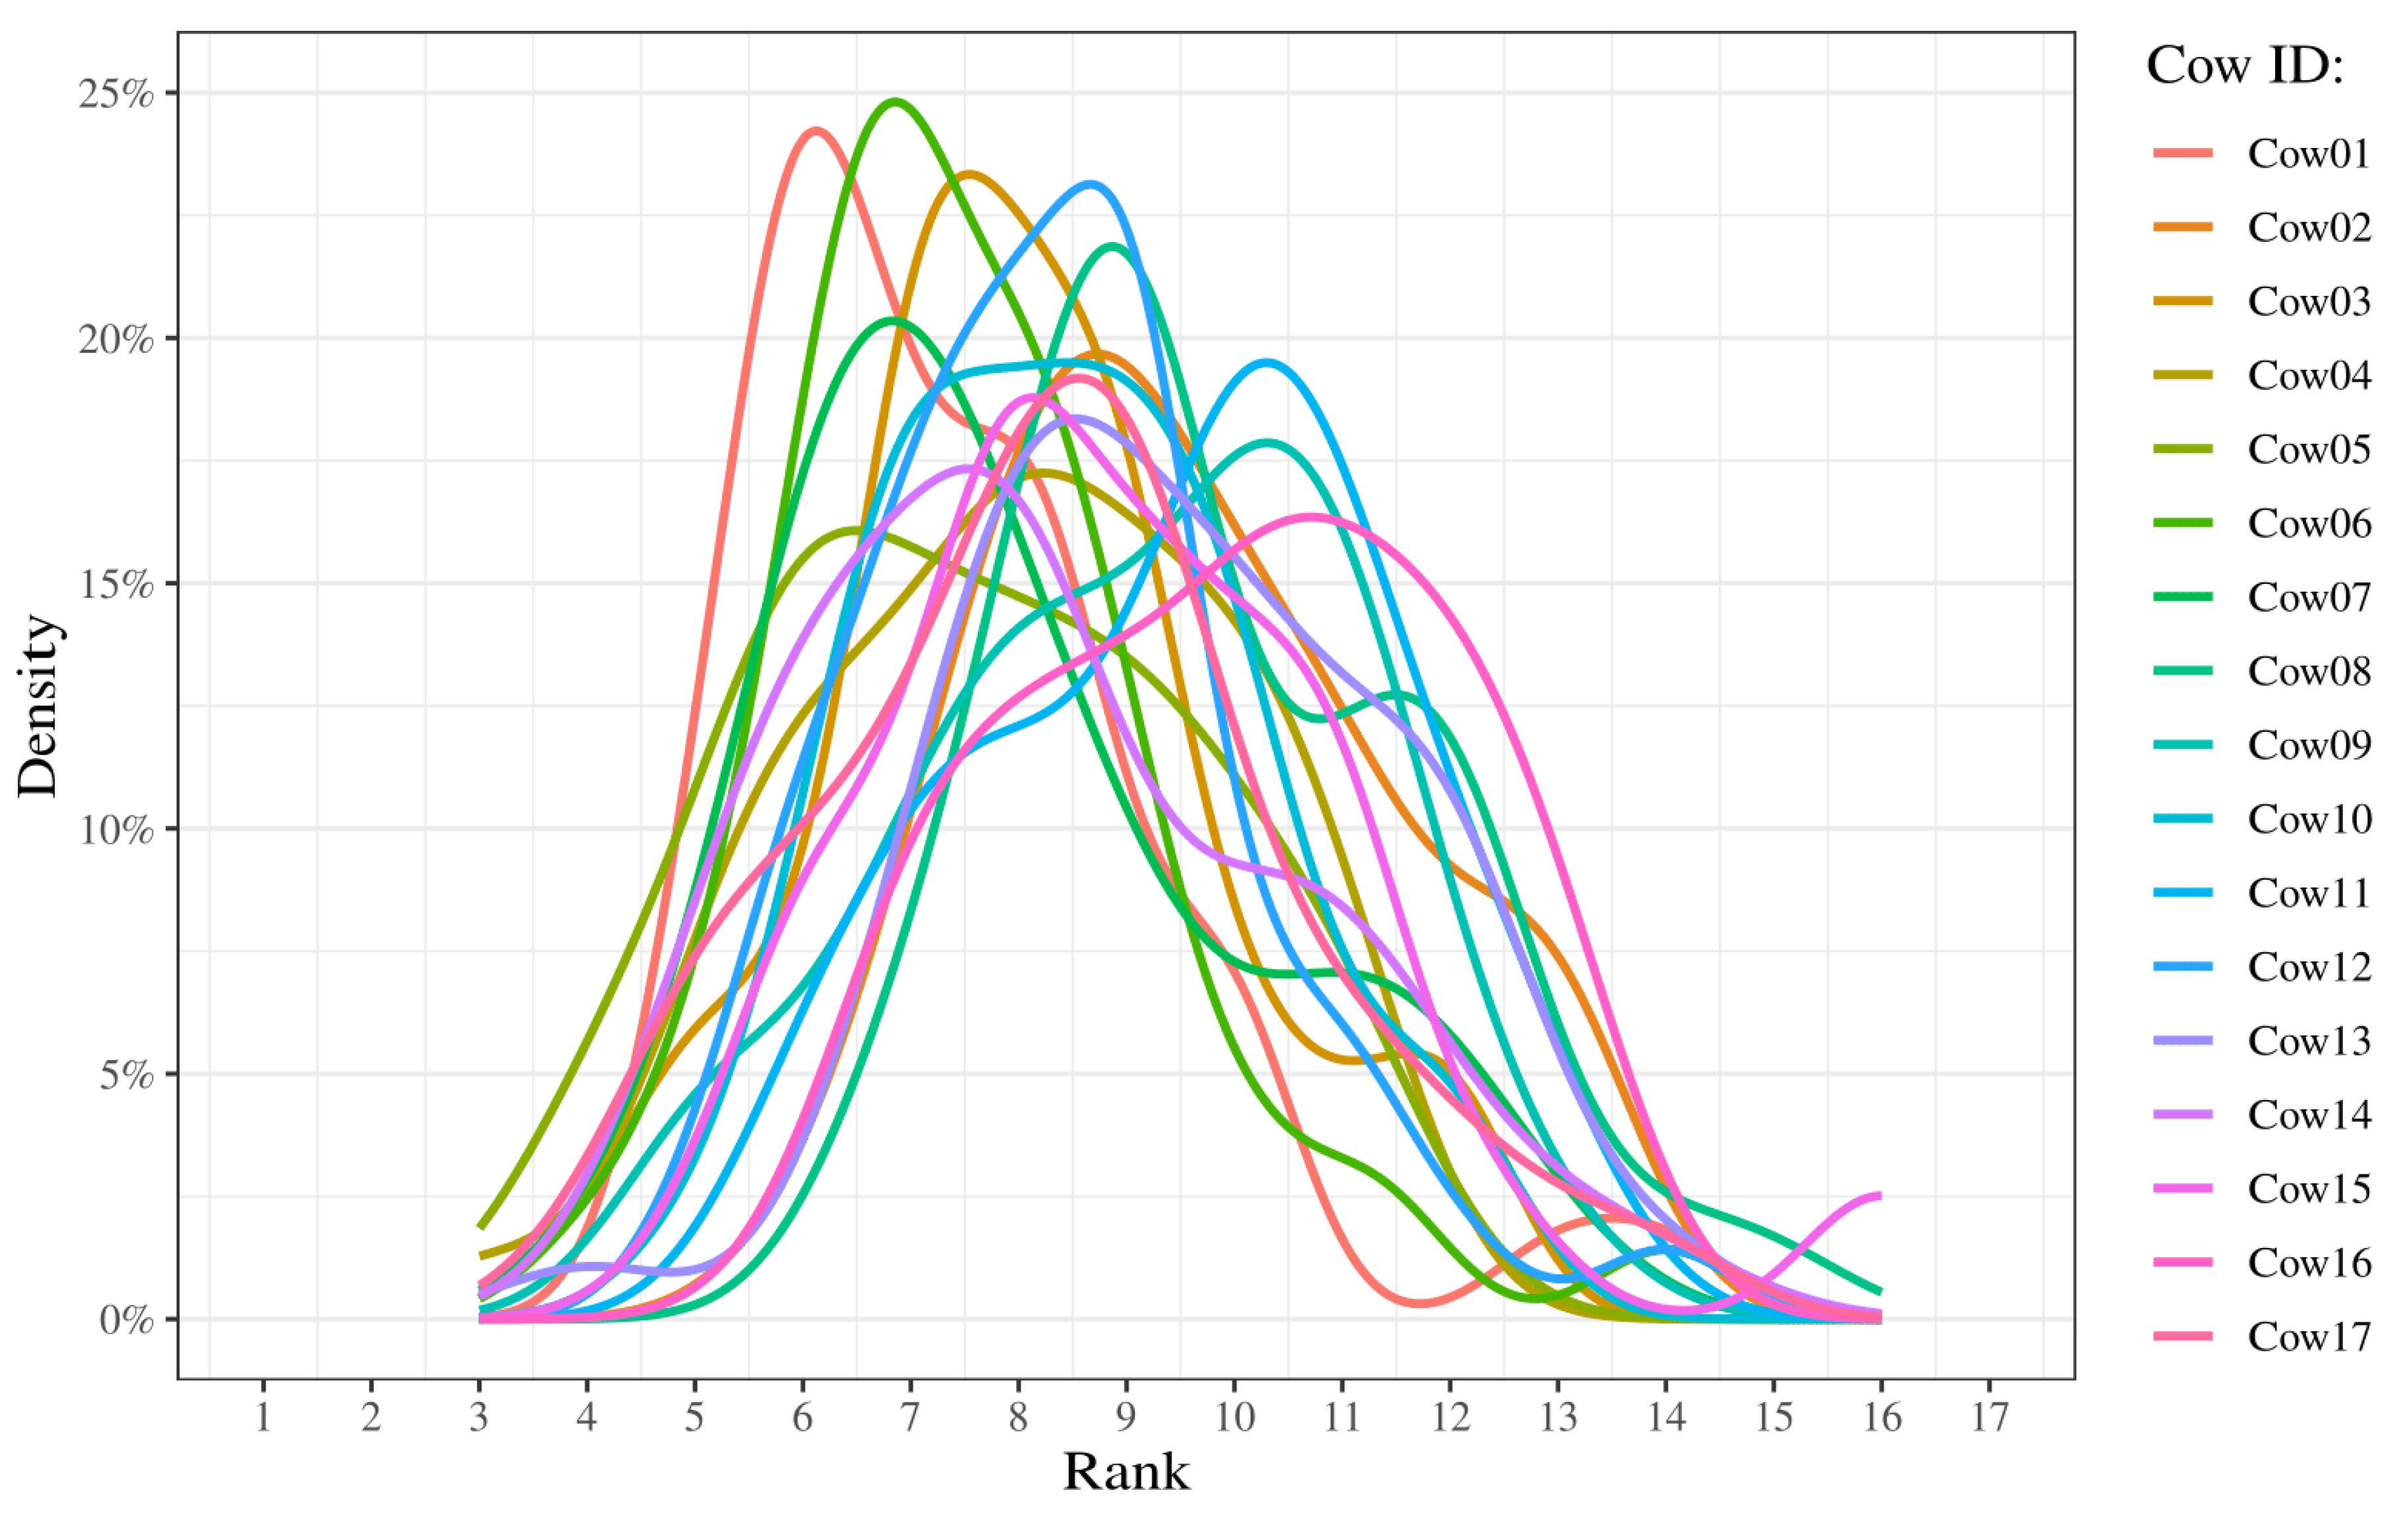
The distribution of ranks for each cow is compared to visualize how frequently the cows have a certain rank (
Figure 5,
Appendix B). All cows exhibit a broad span of ranks lying between 3 and 16, with peaks between 6 and 10 on all graphs (
Table 1).
The graphs have peaks between rank 6-11, the skewness values range between
and
, and the kurtosis values range between
and
(
Table 1). 4 cows exhibit a kurtosis value above 3, while 13 cows exhibit a kurtosis value below 3. Spearman Rank Correlation shows a moderate negative correlation (
) between peak x-value and skewness (
Table 1).
4. Discussion
In order to determine whether any pattern is evident in the spatial distribution, correlations of ranks throughout the study period were calculated. This included nearest neighbour analysis and the distribution of the ranks based on the distances. The results suggest that the rank of the cattle generally varies for all the individuals throughout the period.
4.1. Pattern in Spatial Distribution
The expectation was to see a pattern that shows few individuals with high or low rank, with the remaining cattle varying within the middle rank values during the period. The expectation was based on the placement of the dominant individuals as a herd moves freely [
19,
22]. However, this study does not show a pattern in the spatial distribution and therefore no obvious hierarchy was found within the herd, due to the method used. The time series (
Figure 3) shows great variation in the computed ranks throughout the study period. This means none of the cows remained in the same rank though the time period, which is contrary to expatiation. The great variation is supported by Kendall’s Coefficient of Concordance (
), which shows a low concordance and and thereby indicate a considerable variation in ranking across the days. In addition, the p-value from Kendall’s Coefficient of Concordance (
) indicates that the low concordance is significant. Because the rank varies so widely, no pattern can be derived that allows us to deduce anything about the hierarchy.
The expected pattern, of distribution of rank, in this study is supported by Kondo et al. [
24], which investigates the spatial and social behaviour in a herd of beef cattle on grazing pasture and in a dry-lot. This study showed that changes in the surroundings had no influence on individuals who were assigned overall low or high rank. This may indicate that the hierarchy is quite stable, which is supported by the results in Arave & Albright [
19], suggesting social status can be stable over a period of several years in an established herd. Additionally, Tibbetts et al. [
27] state that hierarchies are commonly maintained over long periods of time. This is due to individuals saving time and energy, while also minimizing the risk of injuries by respecting an established hierarchy [
27].
The density plots (
Figure 5) indicate that the cattle generally have more ranks centered around the middle values and rarely have high and low ranks. This can be seen on the rank-values ranging from 3 to 16, and with graph peak values lying between 6 and 11 (
Table 1). This is also supported by the boxplots (
Figure 2), where the median for each individual is relatively close to each other with values between 7 and 10. Despite the low concordance shown in the Kendall’s Coefficient of Concordance, few of the density plots (
Figure 5) indicate skewness and thereby a tendency to either higher or lower ranks. Calculating the skewness (
Table 1) confirms that some cows are right skewed, while no clear left skewness is shown for any of the cattle. The kurtosis of the density plots (
Table 1) shows several values close to 3, which indicate that a lot of the values are centred around the mean. Therefore, the cattle fall between the middle ranks. There are also a few individuals who show a kurtosis value above 3, which suggests that their values may be located closer to the tails of the density plots (
Figure 5). Individuals, showing a high kurtosis, also show an extreme right skewness, indicating a tendency of having higher ranks. This is supported by the moderate correlation between the peak x-values and skewness (
). The cumulative graph some clustering around the end
Figure 4. This might indicate an underlying pattern in the computed rank that could indicate a hierarchy. The cluster with the lowest cumulative rank, indicating the highest rank throughout the days, consists of Cow01, Cow05 and Cow06. When comparing results of the cumulative graph to the other analyses conducted in this study, it is still unclear if this pattern is concludable. A possible improvement would be to extend the study period as the clustering might become more visible and also clear in the other analyses.
Though this study shows tendencies suggesting a hierarchy, no clear pattern can be extracted when looking at the data collectively. A pattern in hierarchy and spatial distribution was also absent in Gabrieli & Malkinson [
28]. They examined a herd of 130 cows by monitoring agonistic behaviour, measuring distances between the cows during rest and grazing, and calculating their fitness in order to find a correlation between dominance and fitness. They did not find a pattern in dominant behaviour, and concluded that no cow consistently ranked first, middle, or last. Furthermore, no pattern could be found in individual positioning [
28]. This is consistent with the results of this study. The lack of consistency in the spatial distribution of the cattle in this study may be due to the median based method, which may not be optimal to examine spatial distribution.
4.2. Method Considerations
The method in this study uses median values, meaning a cow is less likely to have an overall low or high rank. The expected pattern of few individuals with high ranks and few individuals with low ranks were therefore not seen. Another way to process the data could be by using sum, mean or geometric mean instead of medians. However, this requires no loss of signal in the data collection. Since this system has several periods without data, it will not be possible to use this method in this study. Another way to improve the method could be by increasing the message frequency. In this study, a message was given for every 15 minutes. However, the messages were not aligned between individuals, resulting in the use of median. While the improvement of signals might better the method in this study, other methods might also be important to take into consideration. Noteworthy, the cumulative ranks curves show a more clear pattern with three distinct hierarchical groups, low rank, middle rank and high rank. This suggest that in order to discover the high ranked cows (which could bear the collars alone) it is necessary to estimate the hierarchical position over several days, in order to reduce the effect of the inter-days fluctuations in hierarchical positions.
4.3. Alternative Methods
According to Tzanidakis et al. [
18], the first step in making a model to study the behaviour of livestock, is by making observations. It might be possible to prevent the signal failure issues in this study, or similar GPS technology studies, through physical observation. Multiple studies use physical observation to calculate a win:loss ratio and uses this as a dominance value instead of only basing it on distances [
19,
24,
28]. The win:loss ratio is based on observed agonistic encounters, where the number of interactions (such as threats and pushing) won is compared to the number of interactions lost. The cattle are then ranked by dominance based on these values [
24,
28]. Physical observations also have some disadvantages, as it is time consuming thus demanding additional labor and financial resources [
29]. Additionally, physical observations may be more inaccurate due to risk of missing important cues [
30]. Instead of using physical observations to investigate behaviour in cattle, Tzanidakis et al. [
18] suggest that GPS-GIS technology could be used in future studies. In order to conduct a comprehensive analysis of cattle hierarchy dynamics within a virtual fence system, it may be necessary to combine several of these methods so the system can be implemented for agricultural use as well as in rewilding projects. In this study, only the physical positions of individuals in relation to the herd were taken into account. Including the use of an individual-level approach might have been able to reveal patterns between individuals, thereby finding a pattern within the herd.
5. Conclusion
In conclusion, this study shows no clear pattern of hierarchy, in a virtual fence system, when only investigating distances between individual herd members. While some tendencies could be discerned, only a low concordance between the days could be found. The method used in this study may have been affected by timing differences between collar messages leading to the use of median values which might be inadequate to describe herd positioning. Future studies could take into account interpersonal interaction, thereby incorporating individual personalities and not just analysing the herd as one unit. Another possibility is to extend the study period as clearer indication of a pattern might arise. As a result of this study, it has not been possible to identify a pattern that would allow only a limited number of collars to be applied to a specific number of cows. More studies are necessary to investigate whether it is possible to reduce the expenses of a virtual fence system, and make it more applicable for farming on a large scale and rewilding projects.
Author Contributions
Conceptualisation, S.M.L., J.H.J., M.G.N., M.R.F., N.H.N., N.Ø.M., R.C.S., M.F.A., S.K.S., D.B., A.K.O.A., C.S. and C.P.; methodology, P.A.S., N.S.H., M.C., A.S., R.M.D. and I.F.T.; formal analysis, P.A.S., N.S.H., M.C., A.S., R.M.D. and I.F.T.; investigation, P.A.S., N.S.H., M.C., A.S., R.M.D. and I.F.T.; data curation, P.A.S., N.S.H., M.C., A.S., R.M.D. and I.F.T.; writing—original draft preparation, P.A.S., N.S.H., M.C., A.S., R.M.D. and I.F.T.; writing—review and editing, S.M.L., J.H.J., M.G.N., M.R.F., N.H.N., N.Ø.M., R.C.S., M.F.A., S.K.S., D.B., A.K.O.A., C.S. and C.P.; visualisation, P.A.S., N.S.H., M.C., A.S., R.M.D. and I.F.T.; supervision, M.F.A., S.K.S., D.B., A.K.O.A., C.S. and C.P. All authors have read and agreed to the published version of the manuscript.
Funding
This research was funded by 15. Juni Fonden, Hedeselskabet and Markus Jebsens Naturpulje. We are grateful for the support, which made it possible to conduct this study.
Institutional Review Board Statement
The study was conducted according to the institutional guidelines for animal research (directive 2010/63/EU), and approved by the Danish Experimentation Animal Inspectorate of Denmark (2020-15-0201-00588, approval date: 8 July 2020) prior to the start of the study.
Informed Consent Statement
Not applicable.
Data Availability Statement
The data presented in this study are available on request from the corresponding author.
Acknowledgments
We would like to thank Dan Pode Poulsen and Michael Baun for their invaluable contribution in providing data, offering consultation, sharing information, and granting us the opportunity to conduct the experiment within the ongoing project aimed at testing Nofence
© virtual fencing. The data used in this research have been made available by ’Projekt Virtuelt Hegn, Fanø’
httpswww.virtuelthegn.dk.
Conflicts of Interest
The authors declare no conflict of interest.
Appendix A
Figure A1.
Times series of ranks based on medians within the herd throughout the 45-day study period. Each colour represents each individual cow in the herd. The period of study started on August 15th and was concluded on the 15th of October. The grey marked areas show the excluded dates, resulting from signal issues.
Appendix B
Figure A2.
Density plot of ranks based on median values for each cow during the 45-day study period. Density is represented with percentages illustrating the amount of times an individual is observed in a specific rank. Each colour represents an individual in the herd.
Figure A2.
Density plot of ranks based on median values for each cow during the 45-day study period. Density is represented with percentages illustrating the amount of times an individual is observed in a specific rank. Each colour represents an individual in the herd.
Appendix C
Table A1.
The serial number from the Nofence© collars, and their reference name in this study. One collar lost connection and was replaced after three days, which resulted in Cow01 having two serial numbers.
Table A1.
The serial number from the Nofence© collars, and their reference name in this study. One collar lost connection and was replaced after three days, which resulted in Cow01 having two serial numbers.
| Reference |
Collar
serial number |
| Cow 01 |
73798
90894 |
| Cow 02 |
73882 |
| Cow 03 |
73957 |
| Cow 04 |
73985 |
| Cow 05 |
74042 |
| Cow 06 |
82461 |
| Cow 07 |
82463 |
| Cow 08 |
82513 |
| Cow 09 |
82573 |
| Cow 10 |
82587 |
| Cow 11 |
84878 |
| Cow 12 |
89446 |
| Cow 13 |
89481 |
| Cow 14 |
89495 |
| Cow 15 |
90747 |
| Cow 16 |
90754 |
| Cow 17 |
90876 |
References
- Pereira, H.M.; Navarro, L.M. Rewildning European Landscapes. Springer 2015, 1, 3–17. [CrossRef]
- European Commission. EU biodiversity strategy for 2030 : Bringing nature back into our lives. Publications Office of the European Union 2021, The European Commission. [CrossRef]
- Carver, S.; Convery, I.; Hawkins, S.; Beyers, R.; Eagle, A.; Kun, Z.; Maanen, E.V.; Cao, Y.; Fisher, M.; Edwards, S.R.; Nelson, C.; Gann, G.D.; Davis, J.; Sinclair, A.; Bekoff, M.; Noss, R.; Foreman, D.; Pettersson, H.; Root-Bernstein, M.; Svenning, J.; Taylor, P.; Wynne-Jones, S.; Featherstone, A.W.; Fløjgaard, C.; Stanley-Price, M.; Navarro, L.M.; Aykroyd, T.; Parfitt, A.; Soulé, M. Guiding principles for rewilding. In: Conservation Biology 2021, 35, 1882–1893. [CrossRef]
- Fløjgaard, C.; Buttenschøn, R.M.; Byriel, D.B.; Clausen, K.K.; Gottlieb, L.; Kanstrup, N.; Strandberg, B.; Ejrnæs, R. Biodiversitetseffekter af rewilding. DCE: Nationalt Center for Miljø og Energi 2021, of Aarhus Universitet, institut for Bioscience and København Universitet, institut for Geovidenskab og Naturforvaltning, 124.
- Hayward, M.W.; Kerley, G.I.H. Fencing for conservation Restriction of evolutionary potential or a riposte to threatening processes. In: Biological Conservation 2009, 142, 1–13. [CrossRef]
- Boone, R.B.; Hobbs, N.T. Lines around fragments effects of fencing on large herbivores. In: African Journal of Range and Forage Science 2009, 21, 147–158. [CrossRef]
- Harrington, J.L. Characteristics of Ungulate Behavior and Mortality Associated with Wire Fences. All Graduate Theses and Dissertations 2006, Utah State University, Logan, Utah, 1295–1305. [CrossRef]
- Jachowski, D.S.; Slotow, R.; Millspaugh, J.J. Good virtual fences make good neighbors. opportunities for conservation. Virtual fencing for conservation. In: Animal Conservation 2014, 17, 187–196. [CrossRef]
- MacDonald, A.M.; Jones, P.F.; Hanlon, J.A.; Martin, B.H.; Jakes, A.F. How did the deer cross the fence An evaluation of wildlife-friendlier fence modifications to facilitate deer movement. In: Frontiers in Conservation Science 2022, 3, 991765. [CrossRef]
- Umstatter, C. The evolution of virtual fences A review. In: Computers and Electronics in Agriculture 2011, 75, 10–22. [CrossRef]
- Osipova, L.; Okello, M.M.; Njumbi, S.J.; Ngene, S.; Western, D.; Hayward, M.W.; Balkenhol, N. Fencing solves human-wildlife conflict locally but shifts problems elsewhere. A case study using functional connectivity modelling of the African elephant. In: Applied Ecology 2018, 55, 2673–2684. [CrossRef]
- Lee, C.; Henshall, J.M.; Wark, T.J.; Crossman, C.C.; Reed, M.T.; Brewer, H.G.; O’Grady, J.; Fisher, A.D. Associative learning by cattle to enable effective and ethical virtual fences. In: Applied Animal Behaviour Science 2009, 119, 15–22. [CrossRef]
- Lomax, S.; Colusso, P.; Clark, C.E.F. Does Virtual Fencing Work for Grazing Dairy Cattle. In: Animals 2019, 9, 429. [CrossRef]
- Aaser, M.F.; Staahltoft, S.K.; Korsgaard, A.H.; Trige-Esbensen, A.; Alstrup, A.K.O.; Sonne, C.; Bruhn, D.; Frikke, J.; Linder, A.C. Is Virtual Fencing an Effective Way of Enclosing Cattle. Personality, Herd Behaviour and Welfare. In: Animals 2022, 12, 842. [CrossRef]
- Hamidi, D.; Grinnell, N.; Komainda, M.; Riesch, F.; Horn, J.; Ammer, S.; Traulsen, I.; Palme, R.; Hamidi, M.; Isselstein, J. Heifers don’t care no evidence of negative impact on animal welfare of growing heifers when using virtual fences compared to physical fences for grazing. In: Animal 2022, 16, 100614. [CrossRef]
- Staahltoft, S.K.; Aaser, M.F.; Jensen, J.N.S.; Zadran, I.; Sørensen, E.B.; Nielsen, A.E.; Alstrup, A.K.O.; Bruhn, D.; Linder, A.C.; Sonne, C.; Frikke, J.; Pertoldi, C. The Effectiveness of Virtual Fencing of Bull Calves in a Holistic Grazing System. In: Animals 2023, 13, 917. [CrossRef]
- Vik, J.; Melås, A.M.; Stræte, E.P.; Søraa, R.A. Balanced readiness level assessment (BRLa): A tool for exploring new and emerging technologies. Technological Forecasting and Social Change 2021, 169, 120854. [CrossRef]
- Tzanidakis, C.; Tzamaloukas, O.; Simitzis, P.; Panagakis, P. Precision Livestock Farming Applications (PLF) for Grazing Animals. In: Agriculture 2023, 13, 288. [CrossRef]
- Arave, C.W.; Albright, J.L. Cattle Behavior. In: Journal of Dairy Science 1981, 64, 1318–1329. [CrossRef]
- Sowell, B.F.; Mosley, J.C.; Bowman, J.G.P. Social behavior of grazing beef cattle Implication. In: Journal of animal science 2000, 77, 1–6. [CrossRef]
- Gibbons, J.M.; Lawrence, A.B.; Haskell, M.J. Measuring sociability in dairy cows. In: Applied Animal Behaviour 20, 122, 84–91. [CrossRef]
- Šárová, R.; Špinka, M.; Panamá, J.L.A.; Šimecek, P. Graded leadership by dominant animals in a herd of female beef cattle on pasture. In: Animal Behaviour 2010, 79, 1037–1045. [CrossRef]
- Kondo, S.; Sekine, J.; Okubo, M.; Asahida, Y. The Effect of Group Size and Space Allowance on. In: Applied Animal Behaviour Science 1989, 24, 127–135. [CrossRef]
- Kondo, S.; Saito, M.; Miyashita, H.; Nishino, S.; Asahida, Y. Spatial and social behavior of a beef-cattle group on grazing pasture and in dry-lot. Thesis Submitted to Hokkaido University Collection of Scholarly and Academic Papers : HUSCAP 1990, 14, 99–105.
- QGIS Development Team. QGIS Geographic Information System (Version 3.28.10). QGIS Association 2023.
- R Core Team. R: A Language and Environment for Statistical Computing (Version 4.3.2). R Foundation for Statistical Computing 2023.
- Tibbetts, E.A.; Pardo-Sanchez, J.; Weise, C. The establishment and maintenance of dominance hierarchies. In: Philosophical Transactions of the Royal Society B: Biological Sciences 2022, 377, 20200450. [CrossRef]
- Gabrieli, R.; Malkinson, D. Social organization and fitness response in grazing beef cows – Understanding through interactions and activity measuring. In: Applied Animal Behaviour Science 2022, 254. [CrossRef]
- Richeson, J.T.; Lawrence, T.E.; White, B.J. Using advanced technologies to quantify beef cattle behavior. In: Translational Animal Science 2018, 2, 223–229. [CrossRef]
- White, B.J.; Goehl, D.R.; Amrine, D.E.; Booker, C.; Wildman, B.; Perrett, T. Bayesian evaluation of clinical diagnostic test characteristics of visual observations and remote monitoring to diagnose bovine respiratory disease in beef calves. In: Preventive Veterinary Medicine 2016, 126, 74–80. [CrossRef]
|
Disclaimer/Publisher’s Note: The statements, opinions and data contained in all publications are solely those of the individual author(s) and contributor(s) and not of MDPI and/or the editor(s). MDPI and/or the editor(s) disclaim responsibility for any injury to people or property resulting from any ideas, methods, instructions or products referred to in the content. |
© 2024 by the authors. Licensee MDPI, Basel, Switzerland. This article is an open access article distributed under the terms and conditions of the Creative Commons Attribution (CC BY) license (http://creativecommons.org/licenses/by/4.0/).
