Submitted:
30 March 2024
Posted:
01 April 2024
You are already at the latest version
Abstract
Keywords:
1. Introduction
- Elaboration of the RAW mechanism and RAW-based channel access in the IEEE 802.11ah-based IoT network are presented to provide a more comprehensive understanding of RAW. Furthermore, mathematical analysis is presented to show significant impact of RAW parameters on network performance.
- A PPO-based DRL algorithm is designed to find the optimal RAW parameters to improve network throughput, which interacts with the network environments in the NS-3 simulator.
- Network environments with periodic and random traffic are considered in the NS-3 simulator to validate the feasibility and generalization capability of the PPO-based DRL algorithm, and the performance of the proposed algorithm is evaluated through NS-3.
2. Related Work
2.1. Analytical Modeling for RAW Mechanism
2.2. Optimization in RAW Mechanism
2.3. AI-Based Methods for RAW Mechanism
3. RAW Mechanism in Wireless IoT Networks
3.1. Operation of the RAW Mechanism
3.1.1. Structure of the RAW Parameter Set
3.1.2. RAW-Based Channel Access and Data Transmission
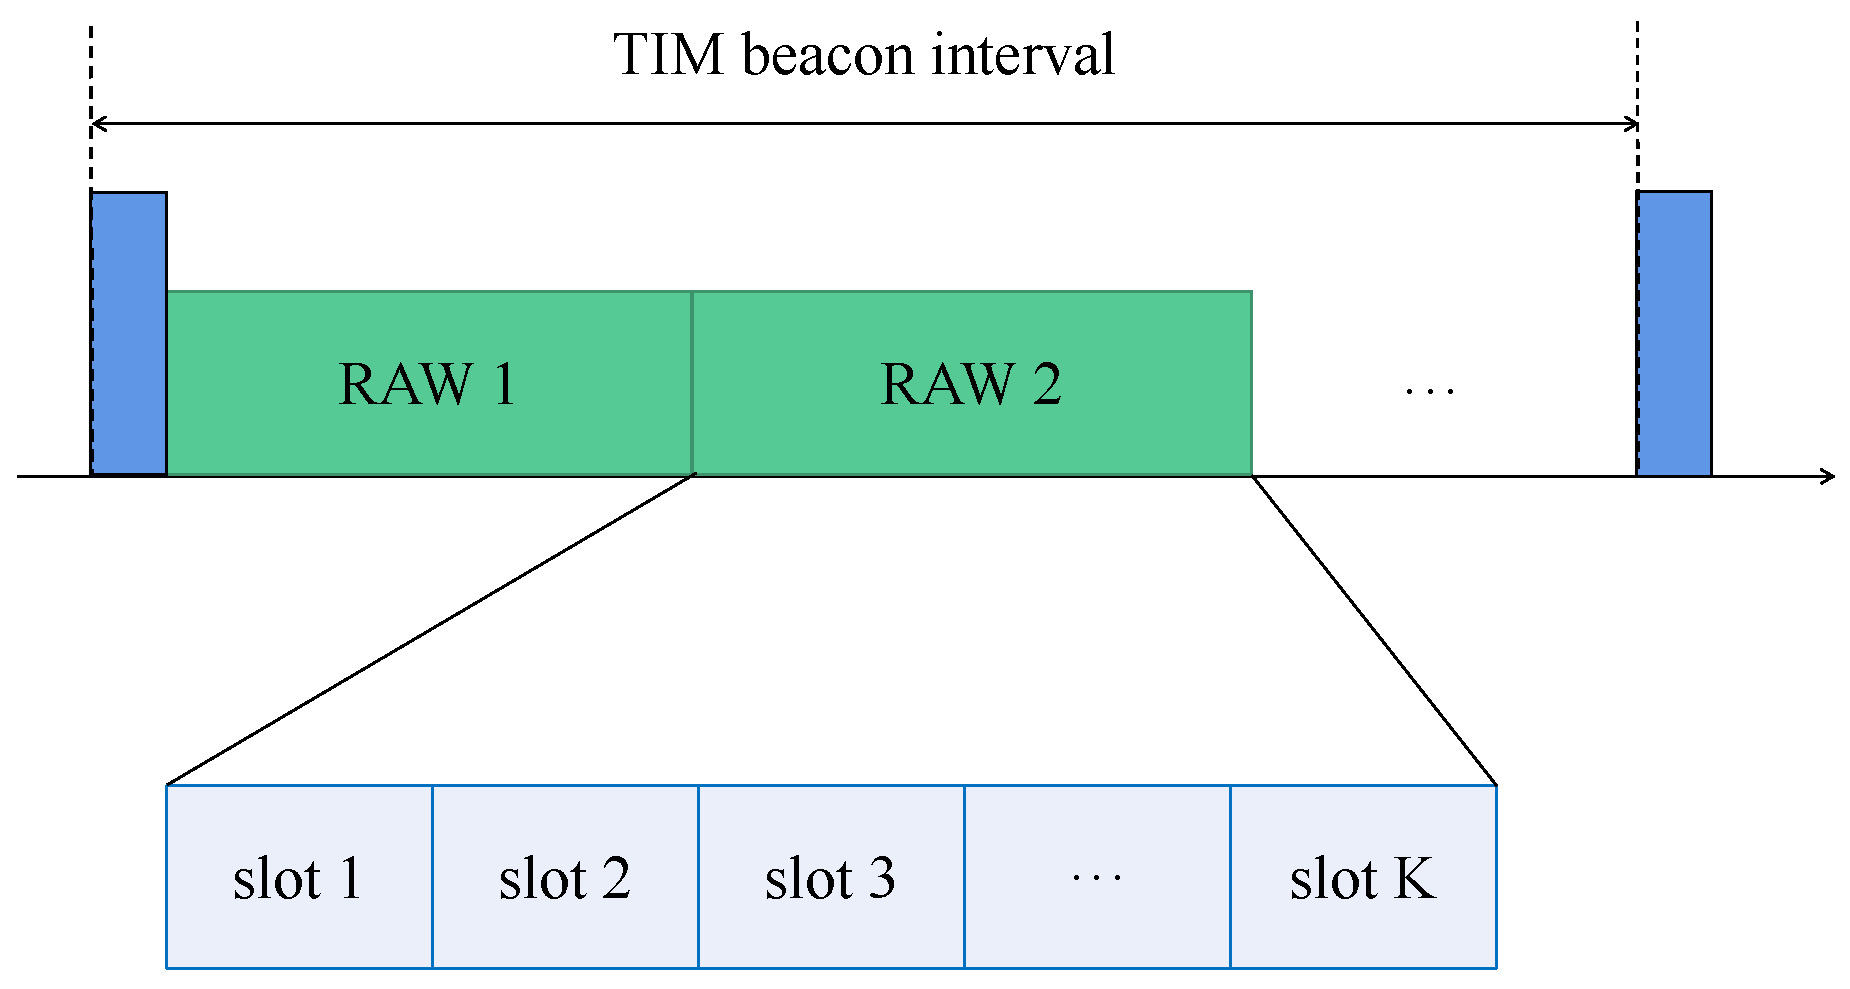
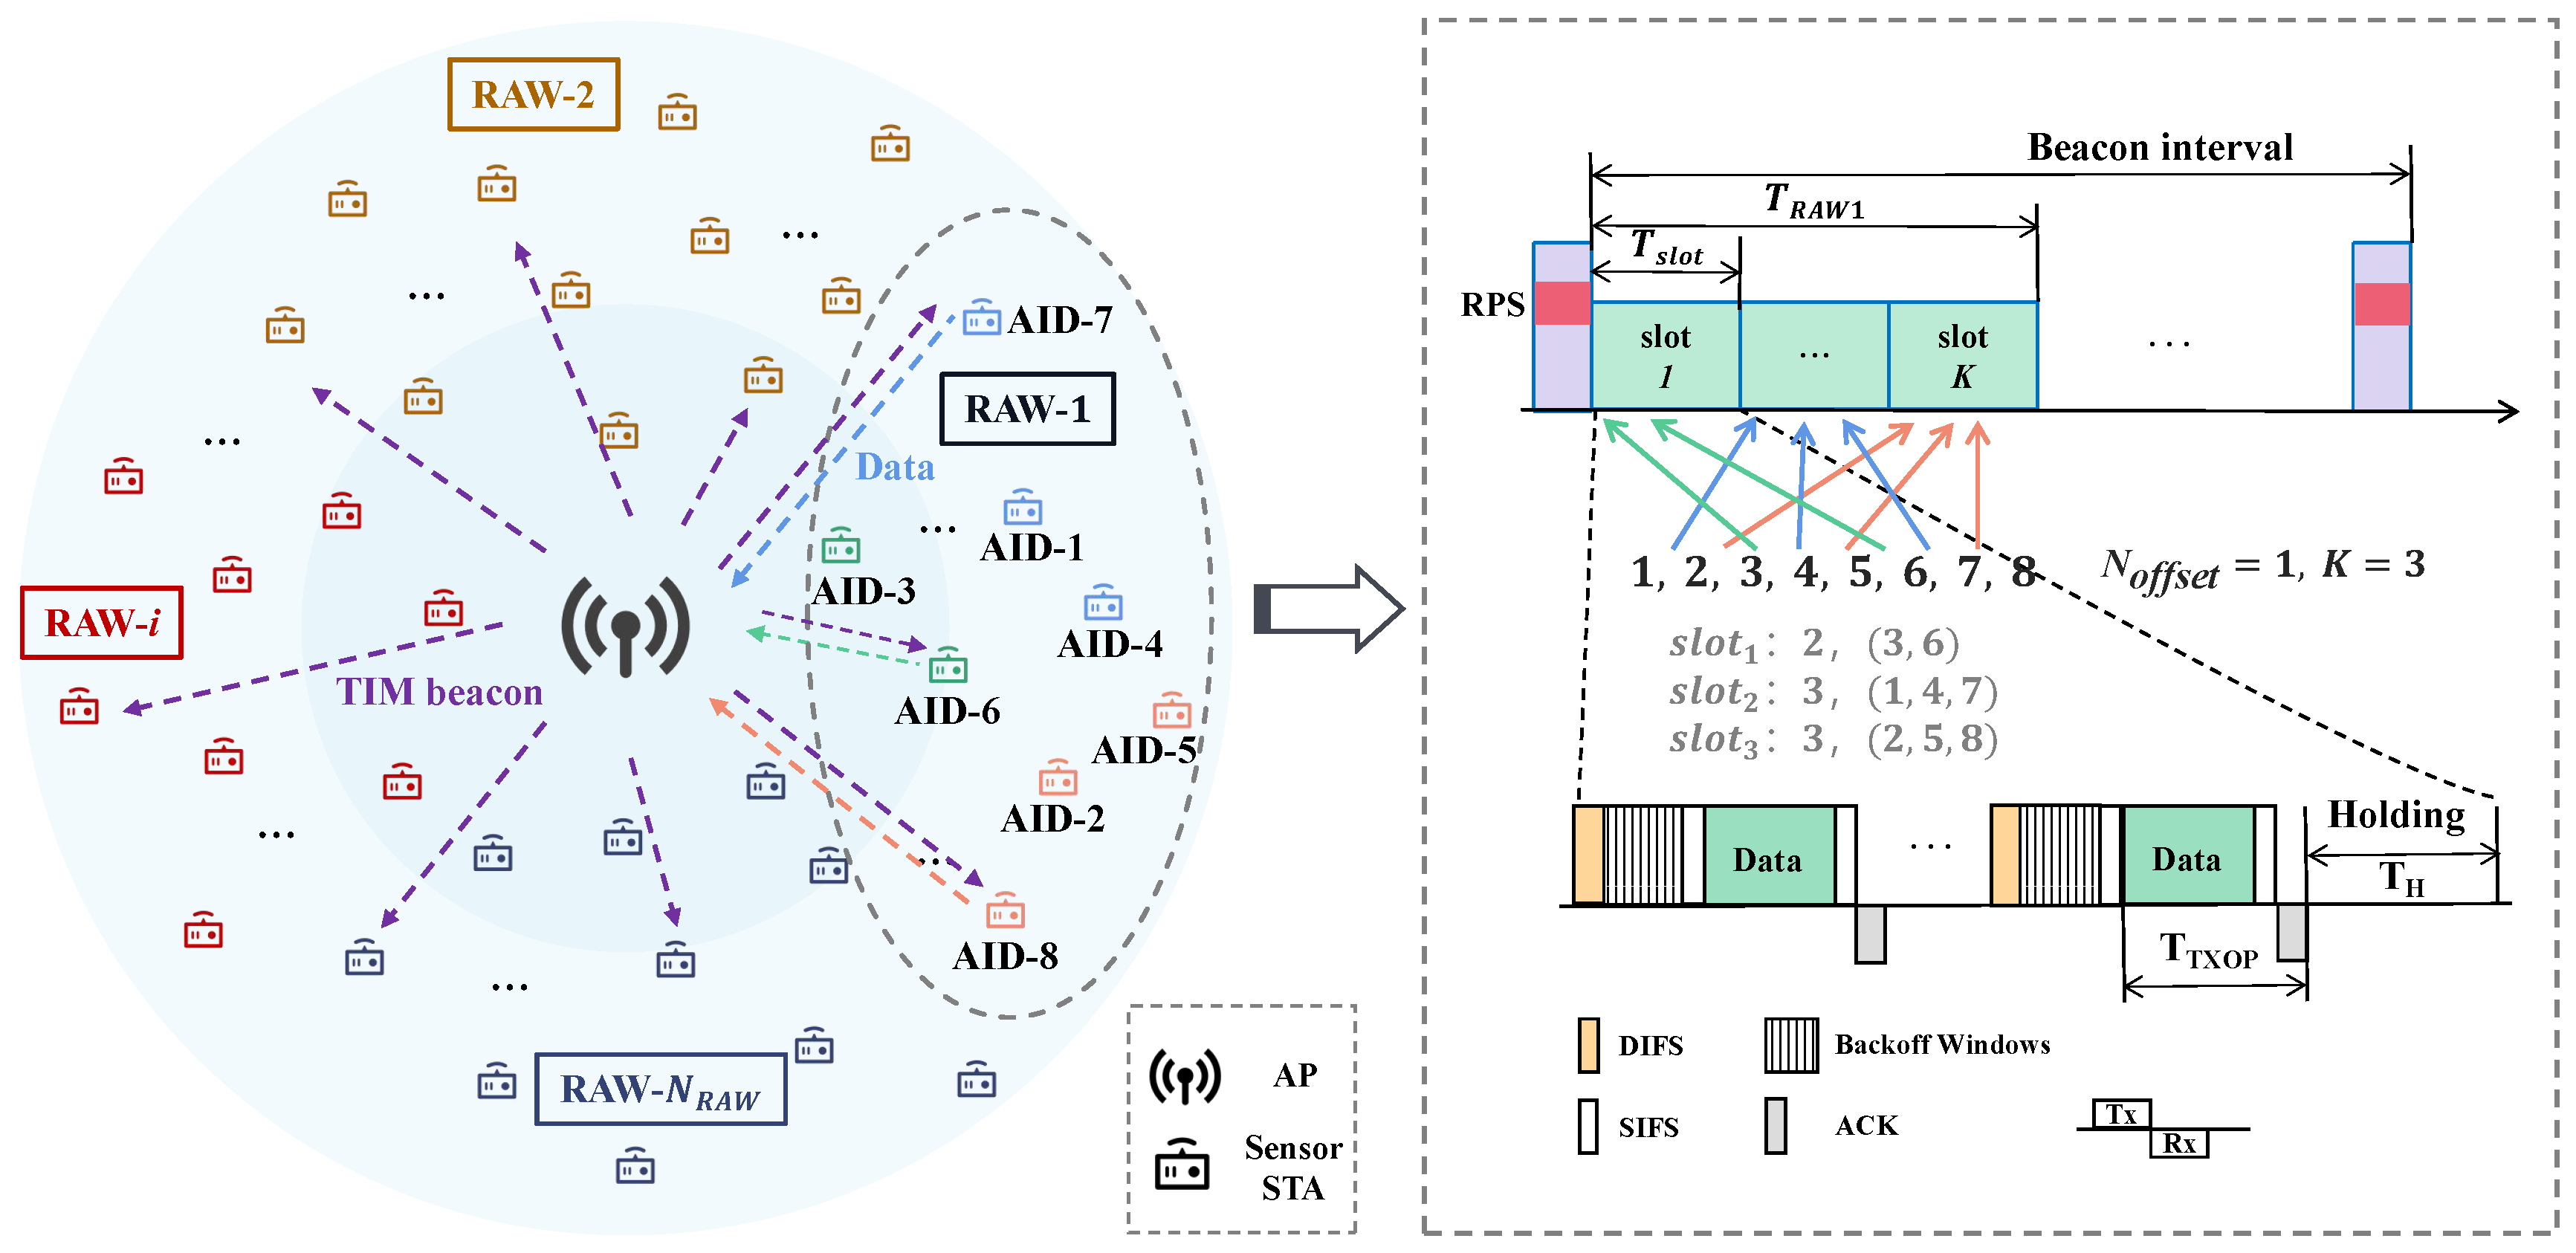
- The STAs listen to the beacon frames broadcast by the AP, request association and authentication, and receive their AID. The AP periodically broadcasts beacon frames carrying the RPS element and informs STAs of information including their RAW group, the slot count in a RAW, and the slot duration. STAs are then assigned to different slots based on the mapping function (2).
- The STAs contend for channel access following the enhanced distributed channel access (EDCA) mechanism when their slot arrives: STAs perform carrier listening for a distributed inter-frame spacing (DIFS) time before initiating channel access. Once the channel is sensed idle, STAs start decreasing their backoff counter, and initiate channel access when their backoff counter reaches zero. If ’s backoff counter decreases to zero before ’s, initiates channel access, while suspends its backoff counter until the channel is sensed idle again.
- If the backoff counters of two or more STAs in the network decrease to zero simultaneously, these STAs attempt to access the channel at the same time, which may result in collisions. Upon encountering a collision, the STAs increase and reset their backoff counter until they reach the maximum retry limit, at which point packet loss occurs.
- STAs that successfully access the channel will transmit their data after waiting for a short inter-frame spacing (SIFS) time. A received acknowledgment (ACK) frame from the AP indicates the completion of data transmission. The time taken for one data transmission is denoted as .
3.2. Performance Modeling and RAW Parameters Optimization
4. DRL for RAW Parameters Optimization
4.1. MDP Reformulation
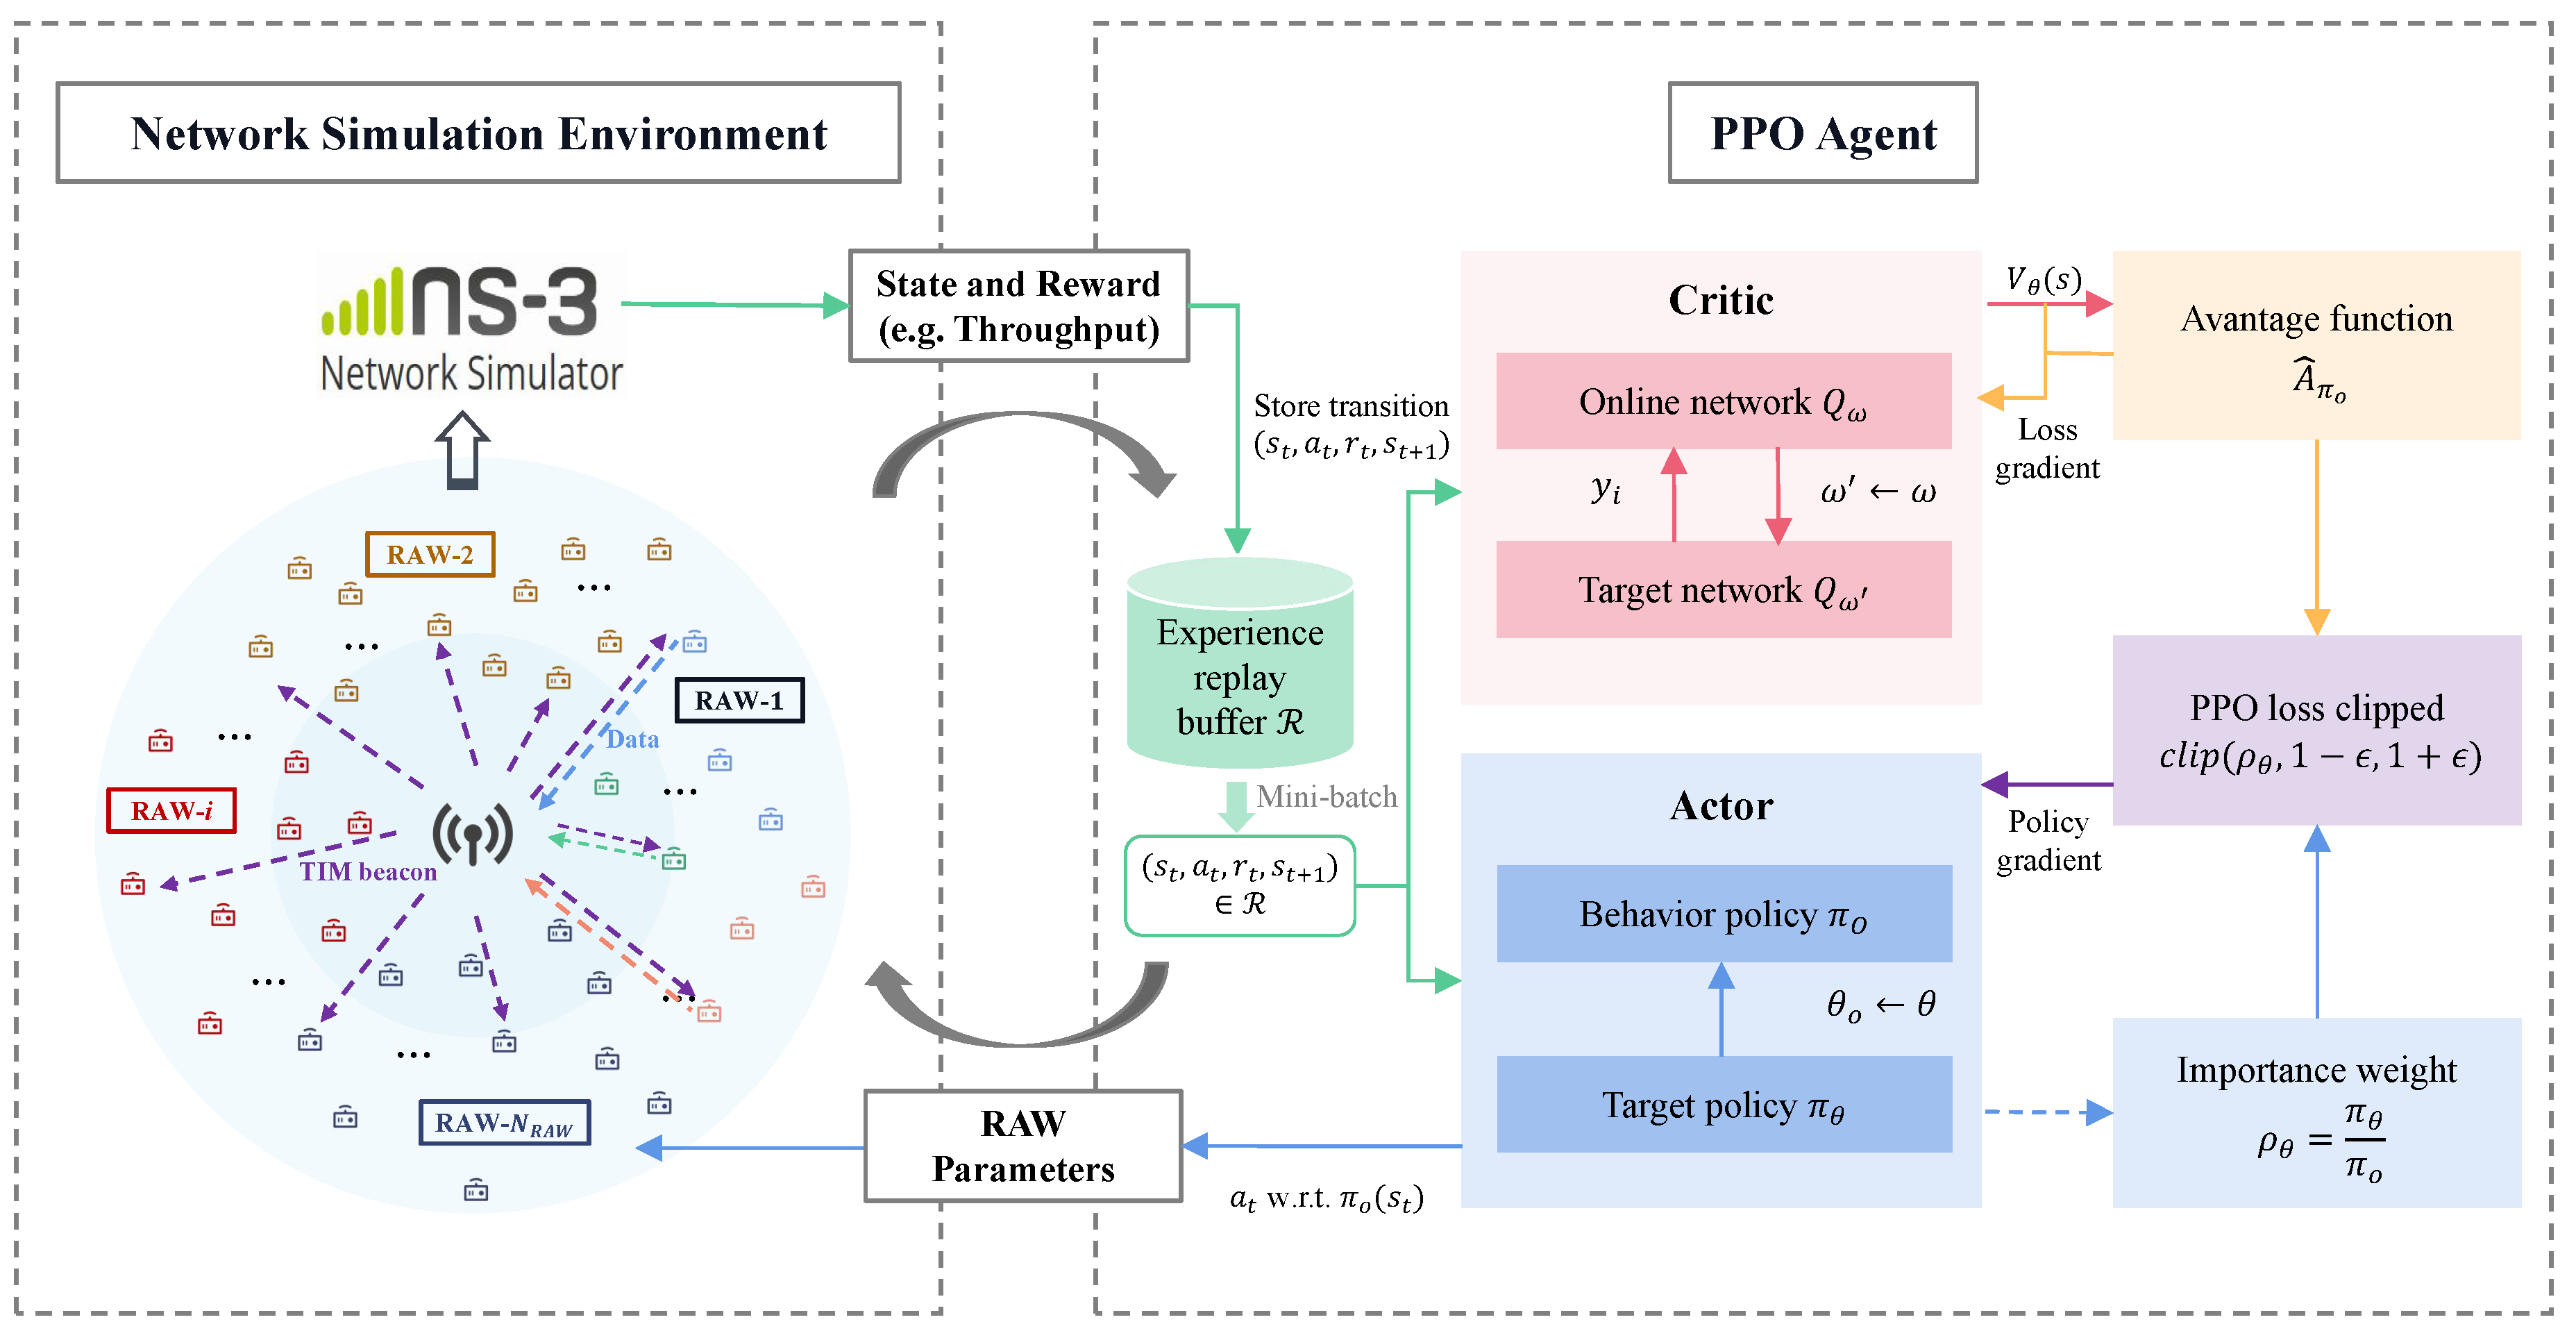
- The AP collects information about the network (e.g., network size N and traffic arrival of the STAs) through management frames. Based on received packets from the STAs, network performance such as throughput and packet loss ratio can be statistically determined.
- To alleviate hidden nodes issues and collisions, STAs obey the NCSB mechanism when accessing the channel among slots.
- State: The state at the current time step is defined as the throughput obtained from the current simulation statistics, denoted as . During the simulation, the AP collects the number of packets received and the payload size of each packet at the current time step to calculate the network throughput at the end of the current step.
- Action: The actions in the MDP are defined as the RAW parameters, including the number of RAW groups, the number of slots in each RAW group, and the slot duration in each RAW group. Thus, the action at step t is denoted as .
- Reward: According to the optimization objective, the reward is defined as the throughput obtained at each time step, represented as .
- Observation: The observation set is defined as the network information observable by the AP, including network size N, the set of traffic loads , and the set of traffic intervals , which can be represented as .
4.2. PPO for Optimizing RAW Parameters
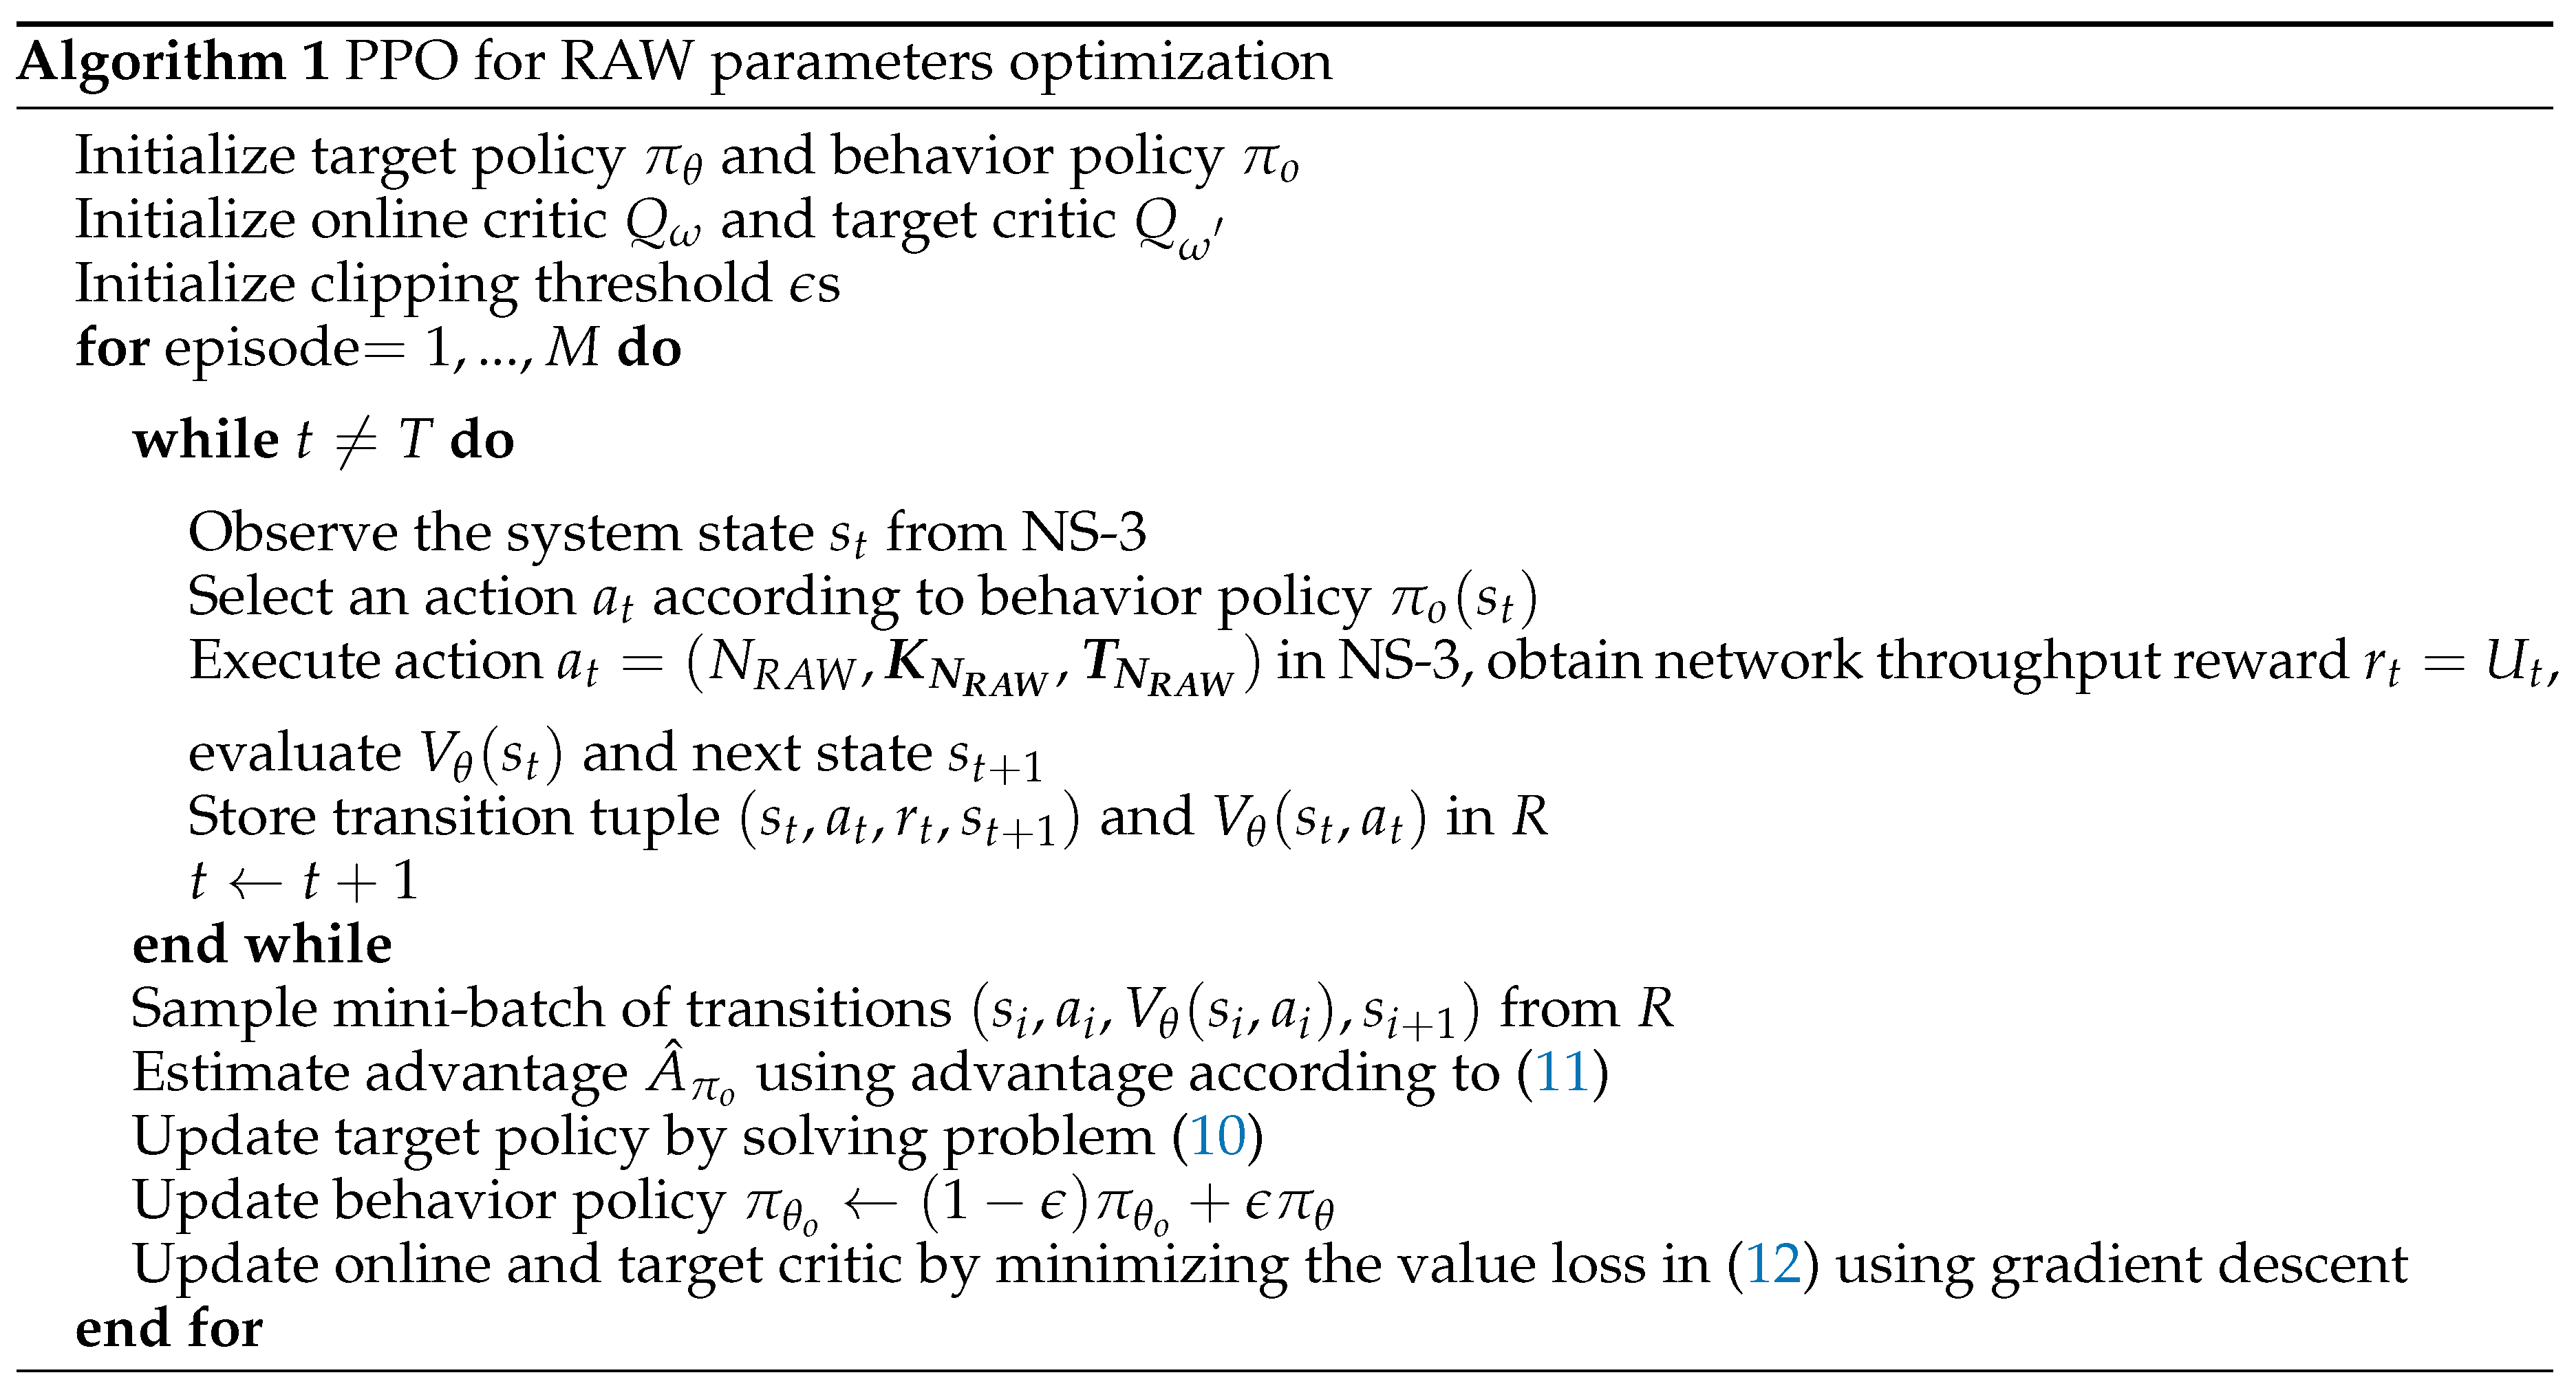
5. DRL-guided NS-3 Simulation
5.1. Simulation Setup
5.2. Learning Performance in Periodic Traffic Networks
5.2.1. Convergence to the Optimal RAW Parameters
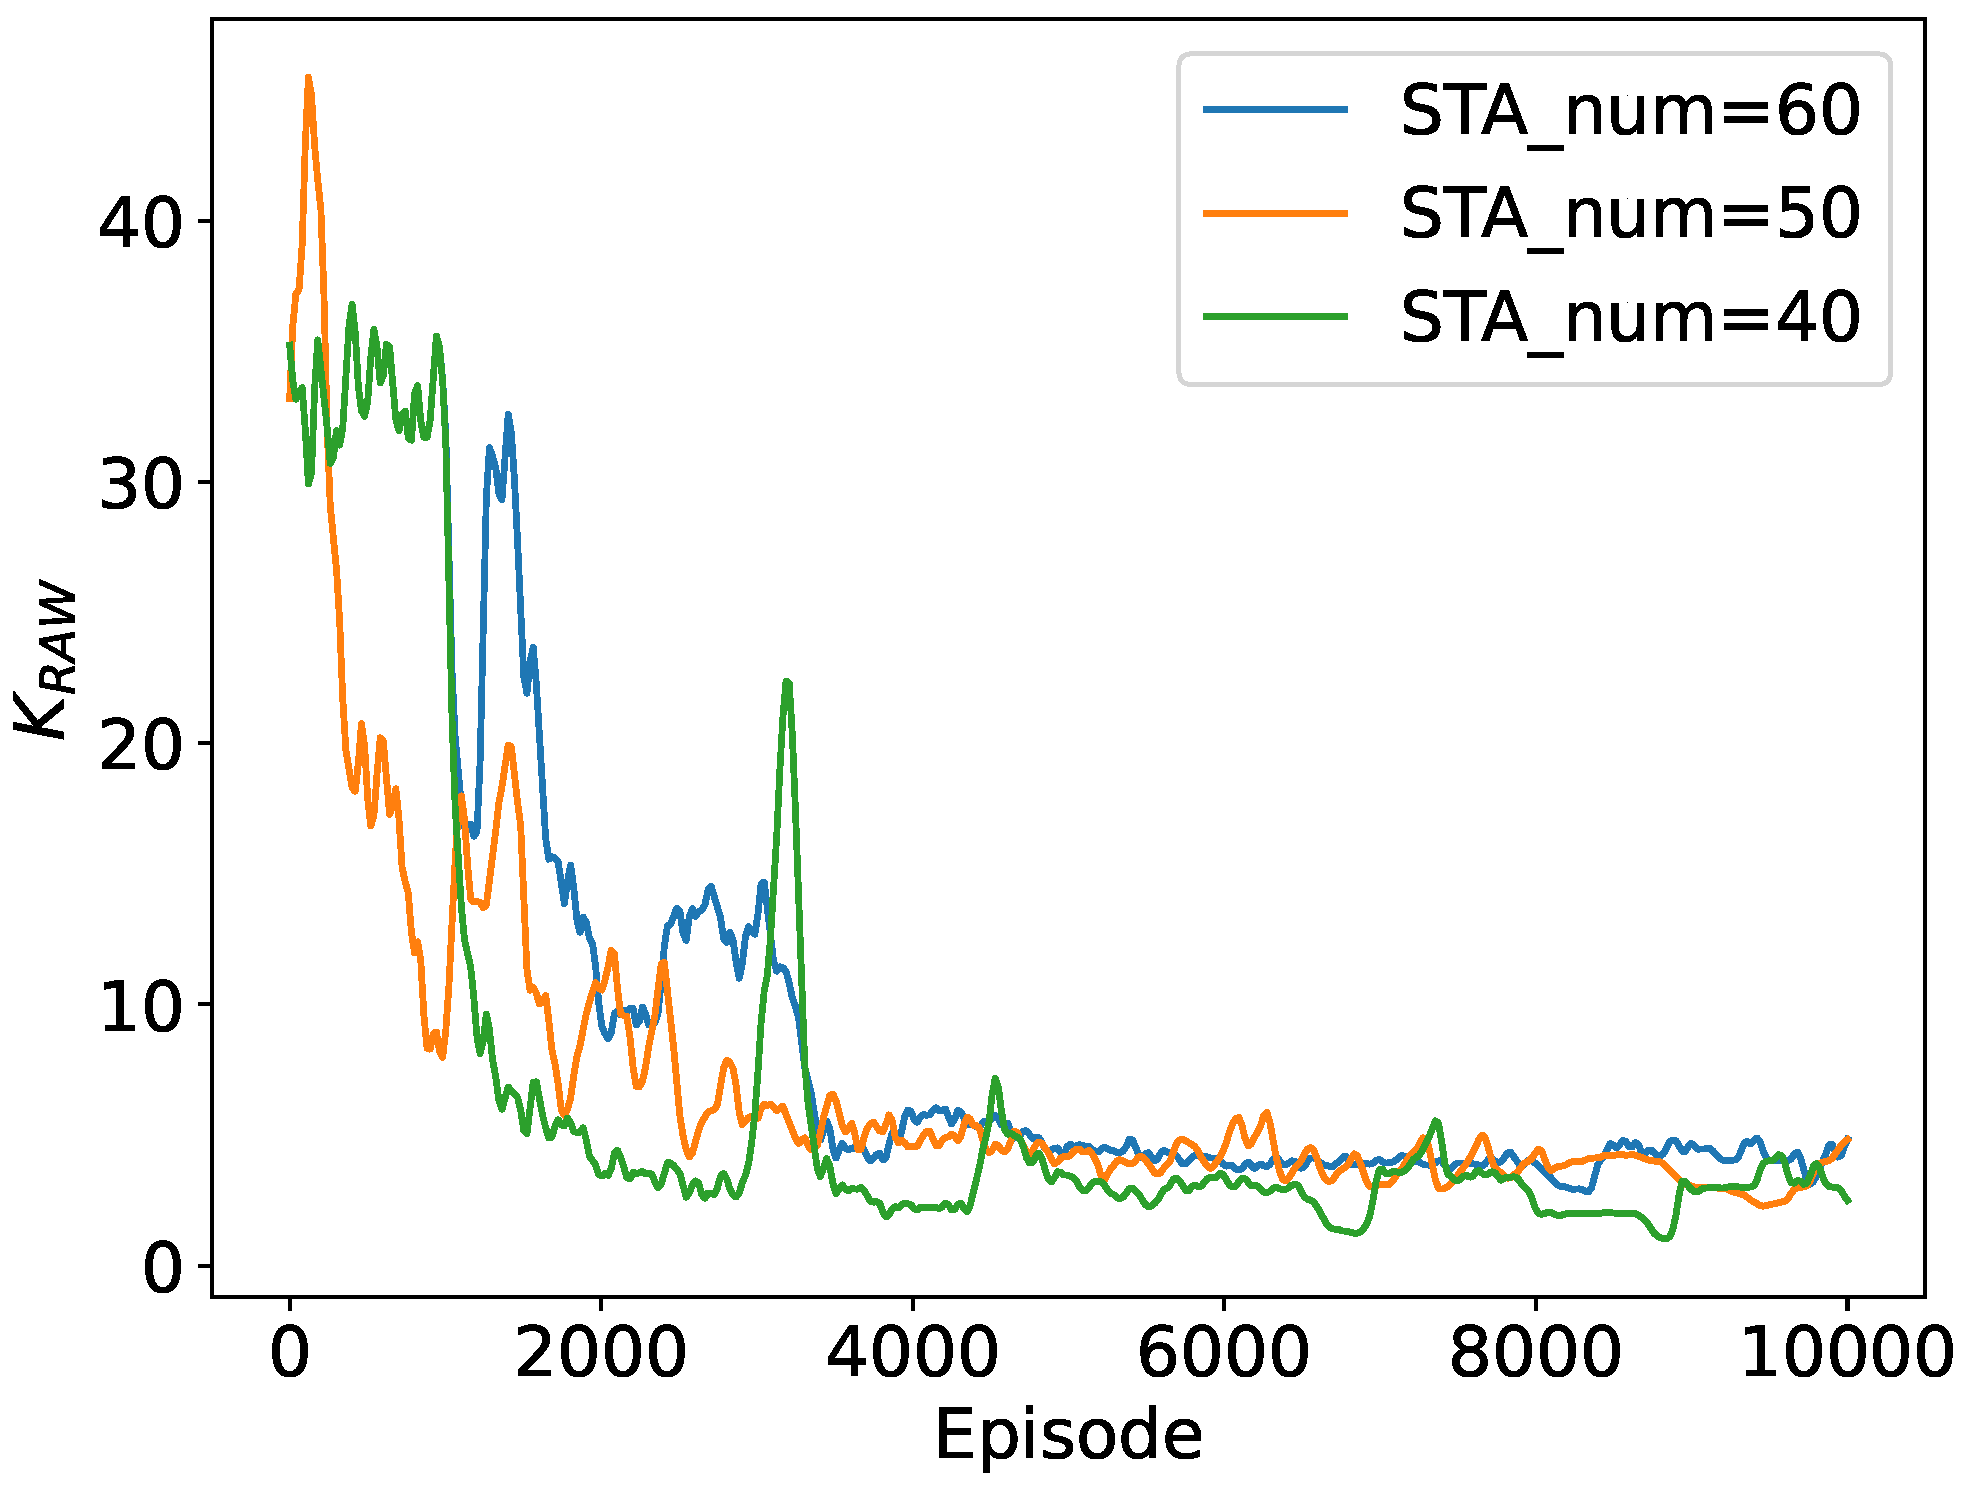
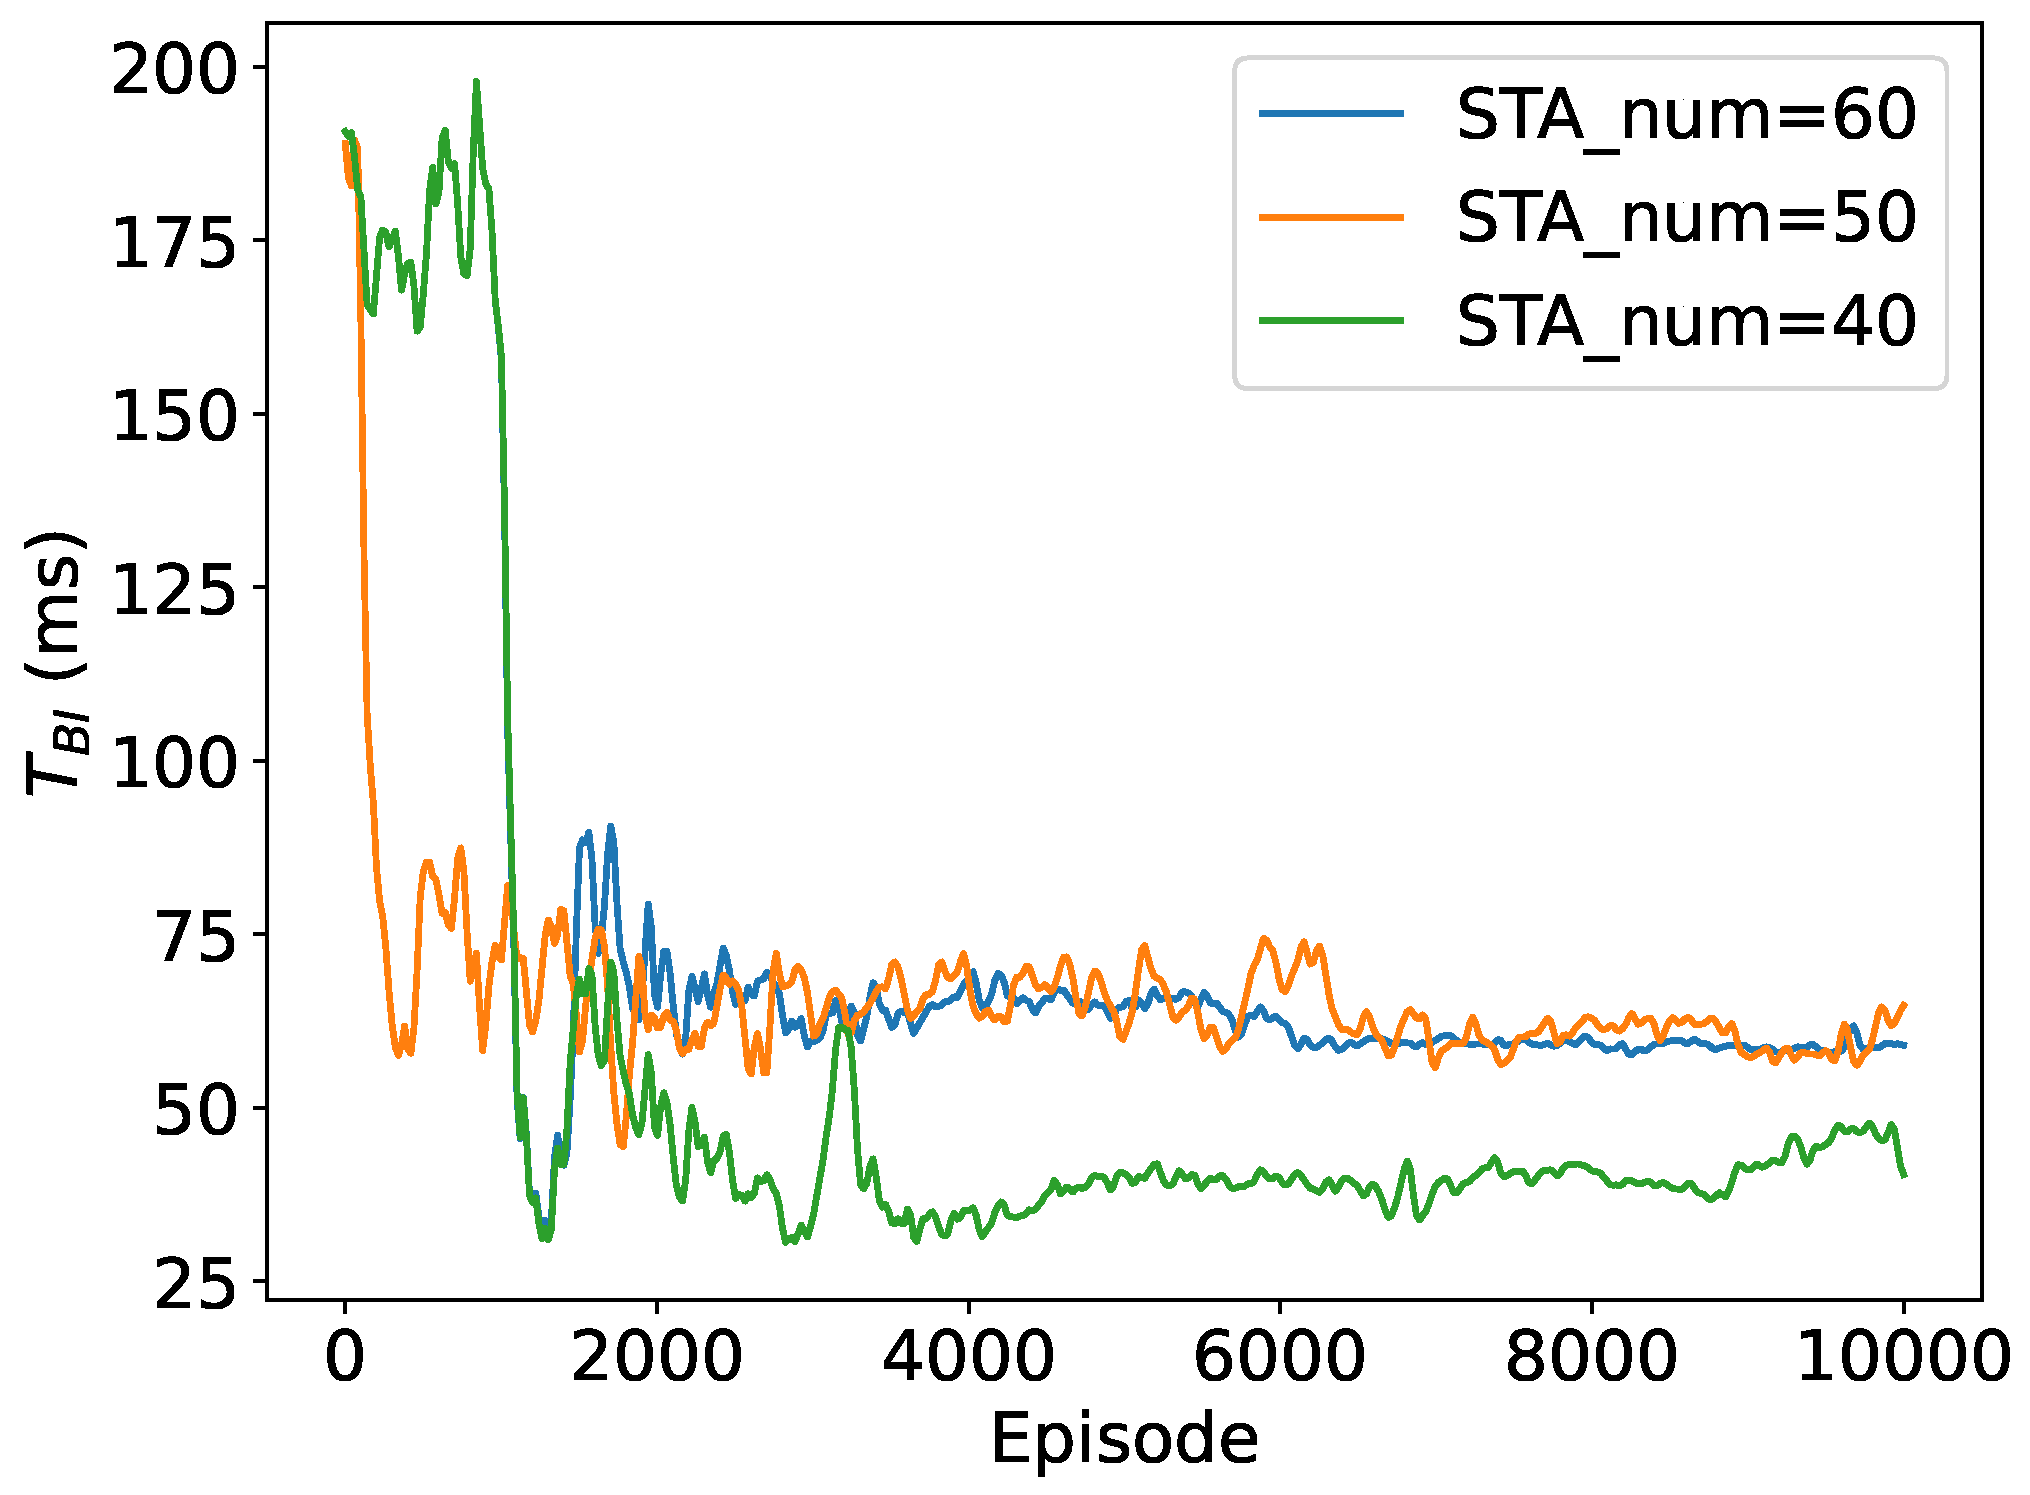
5.2.2. Throughput Performance with Different Traffic Loads
5.3. Learning Performance in Random Traffic Networks
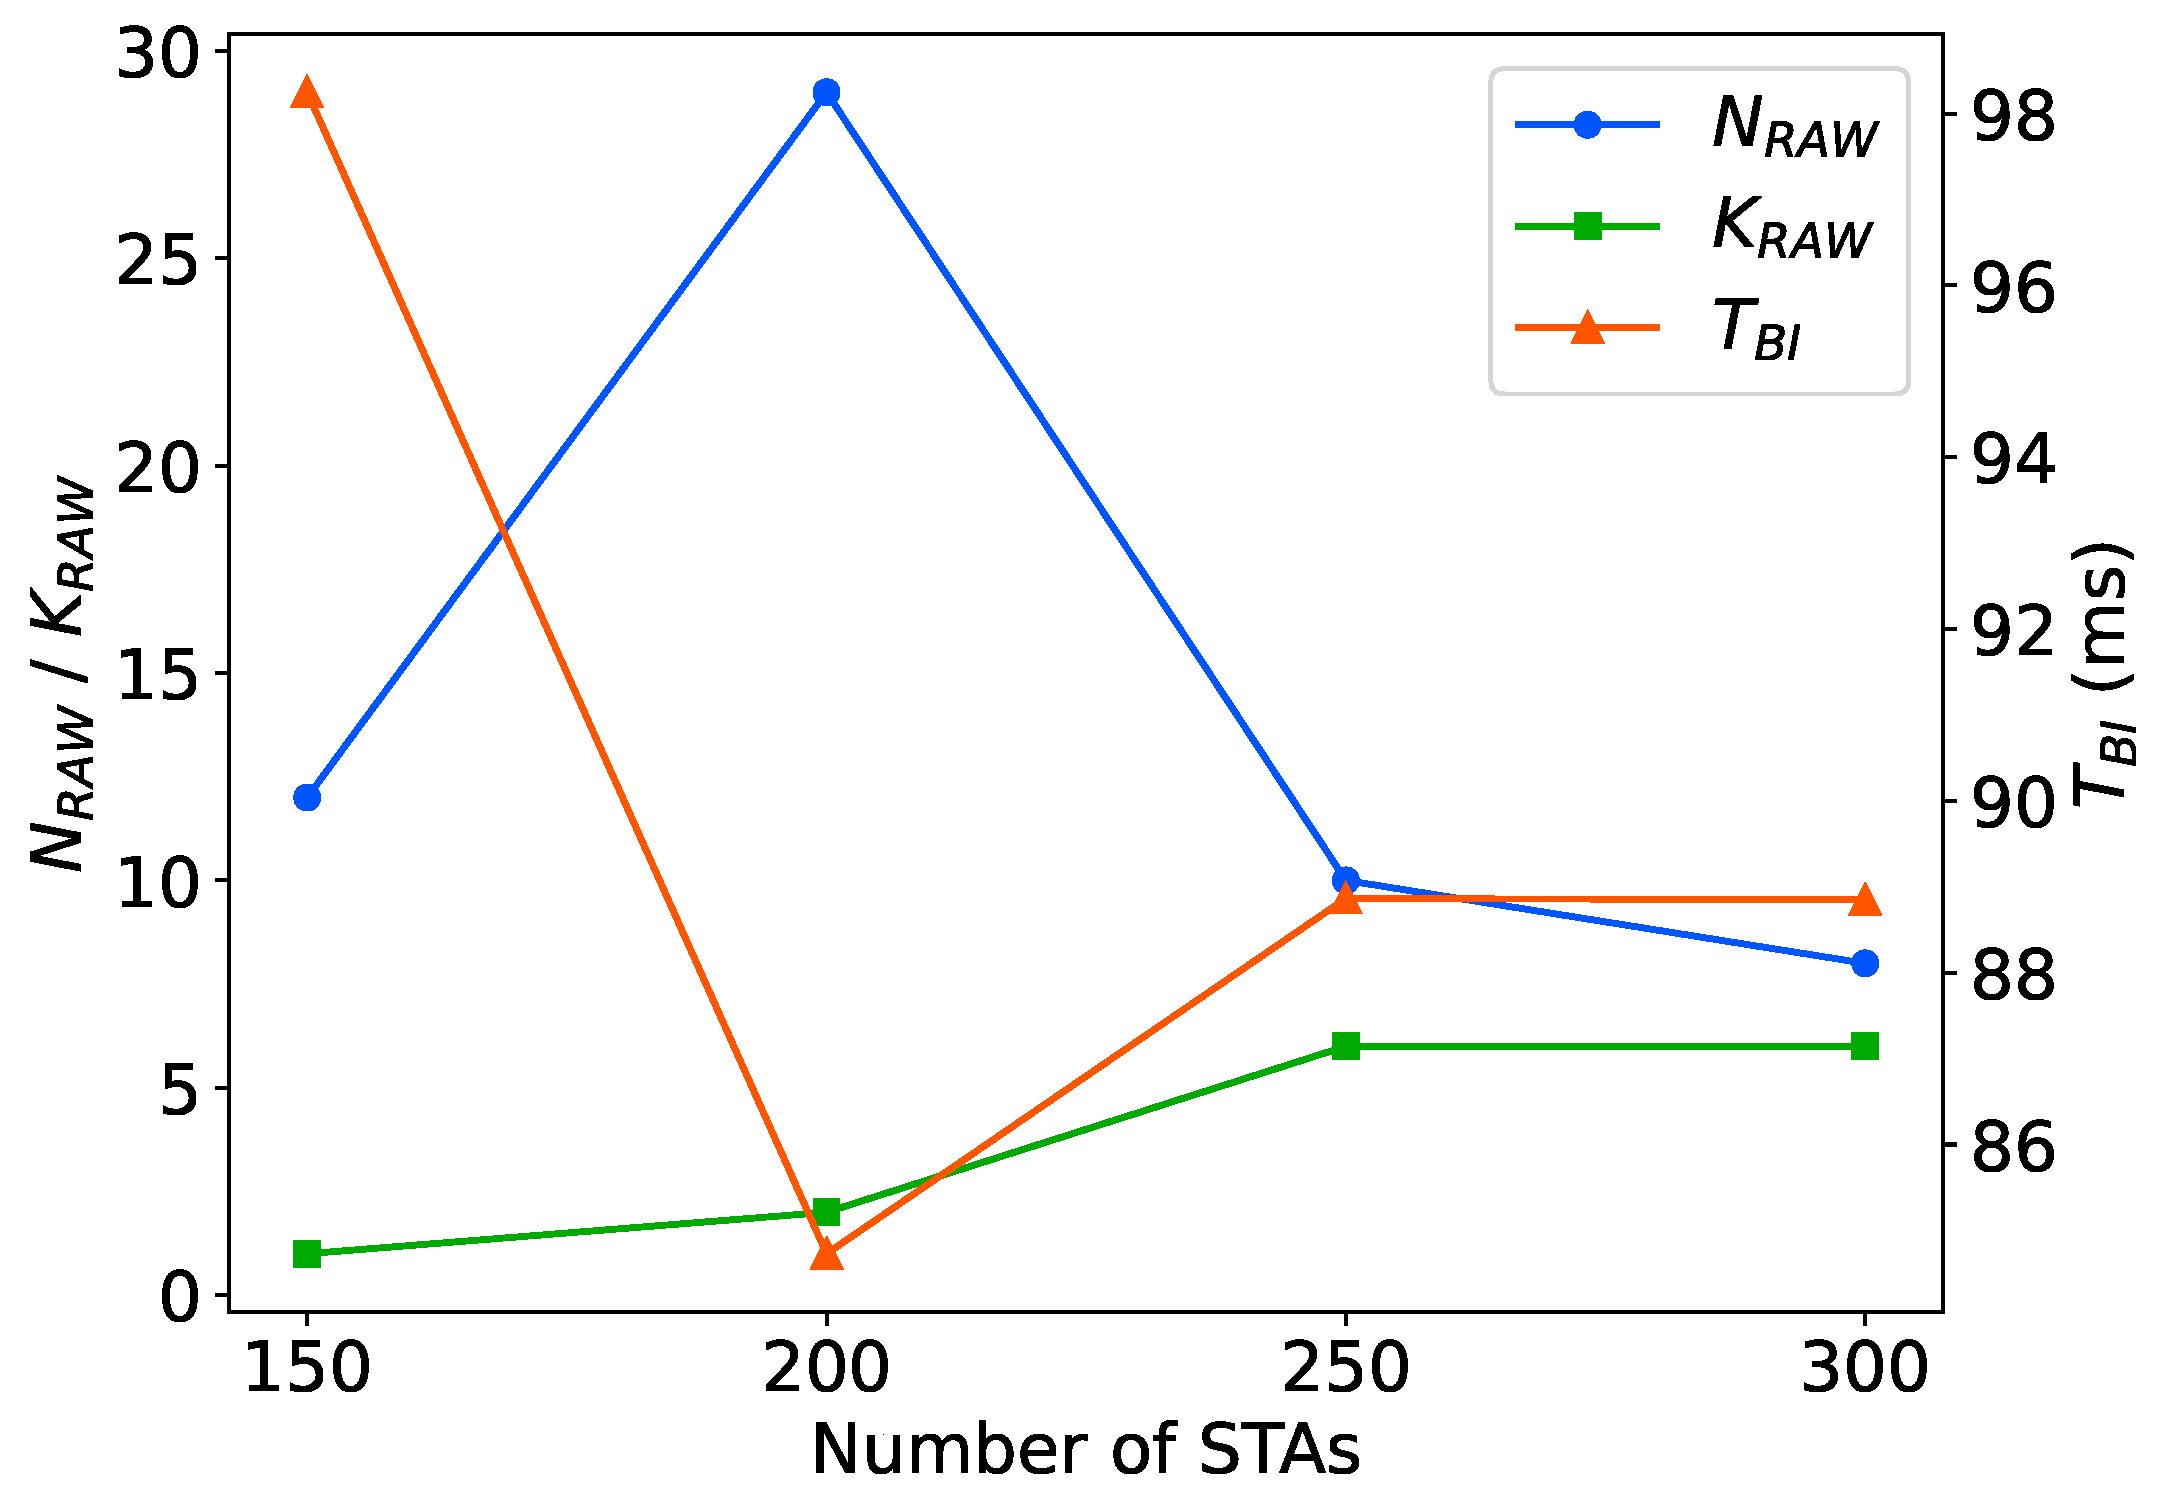
5.3.1. Convergence to the Optimal RAW Parameters
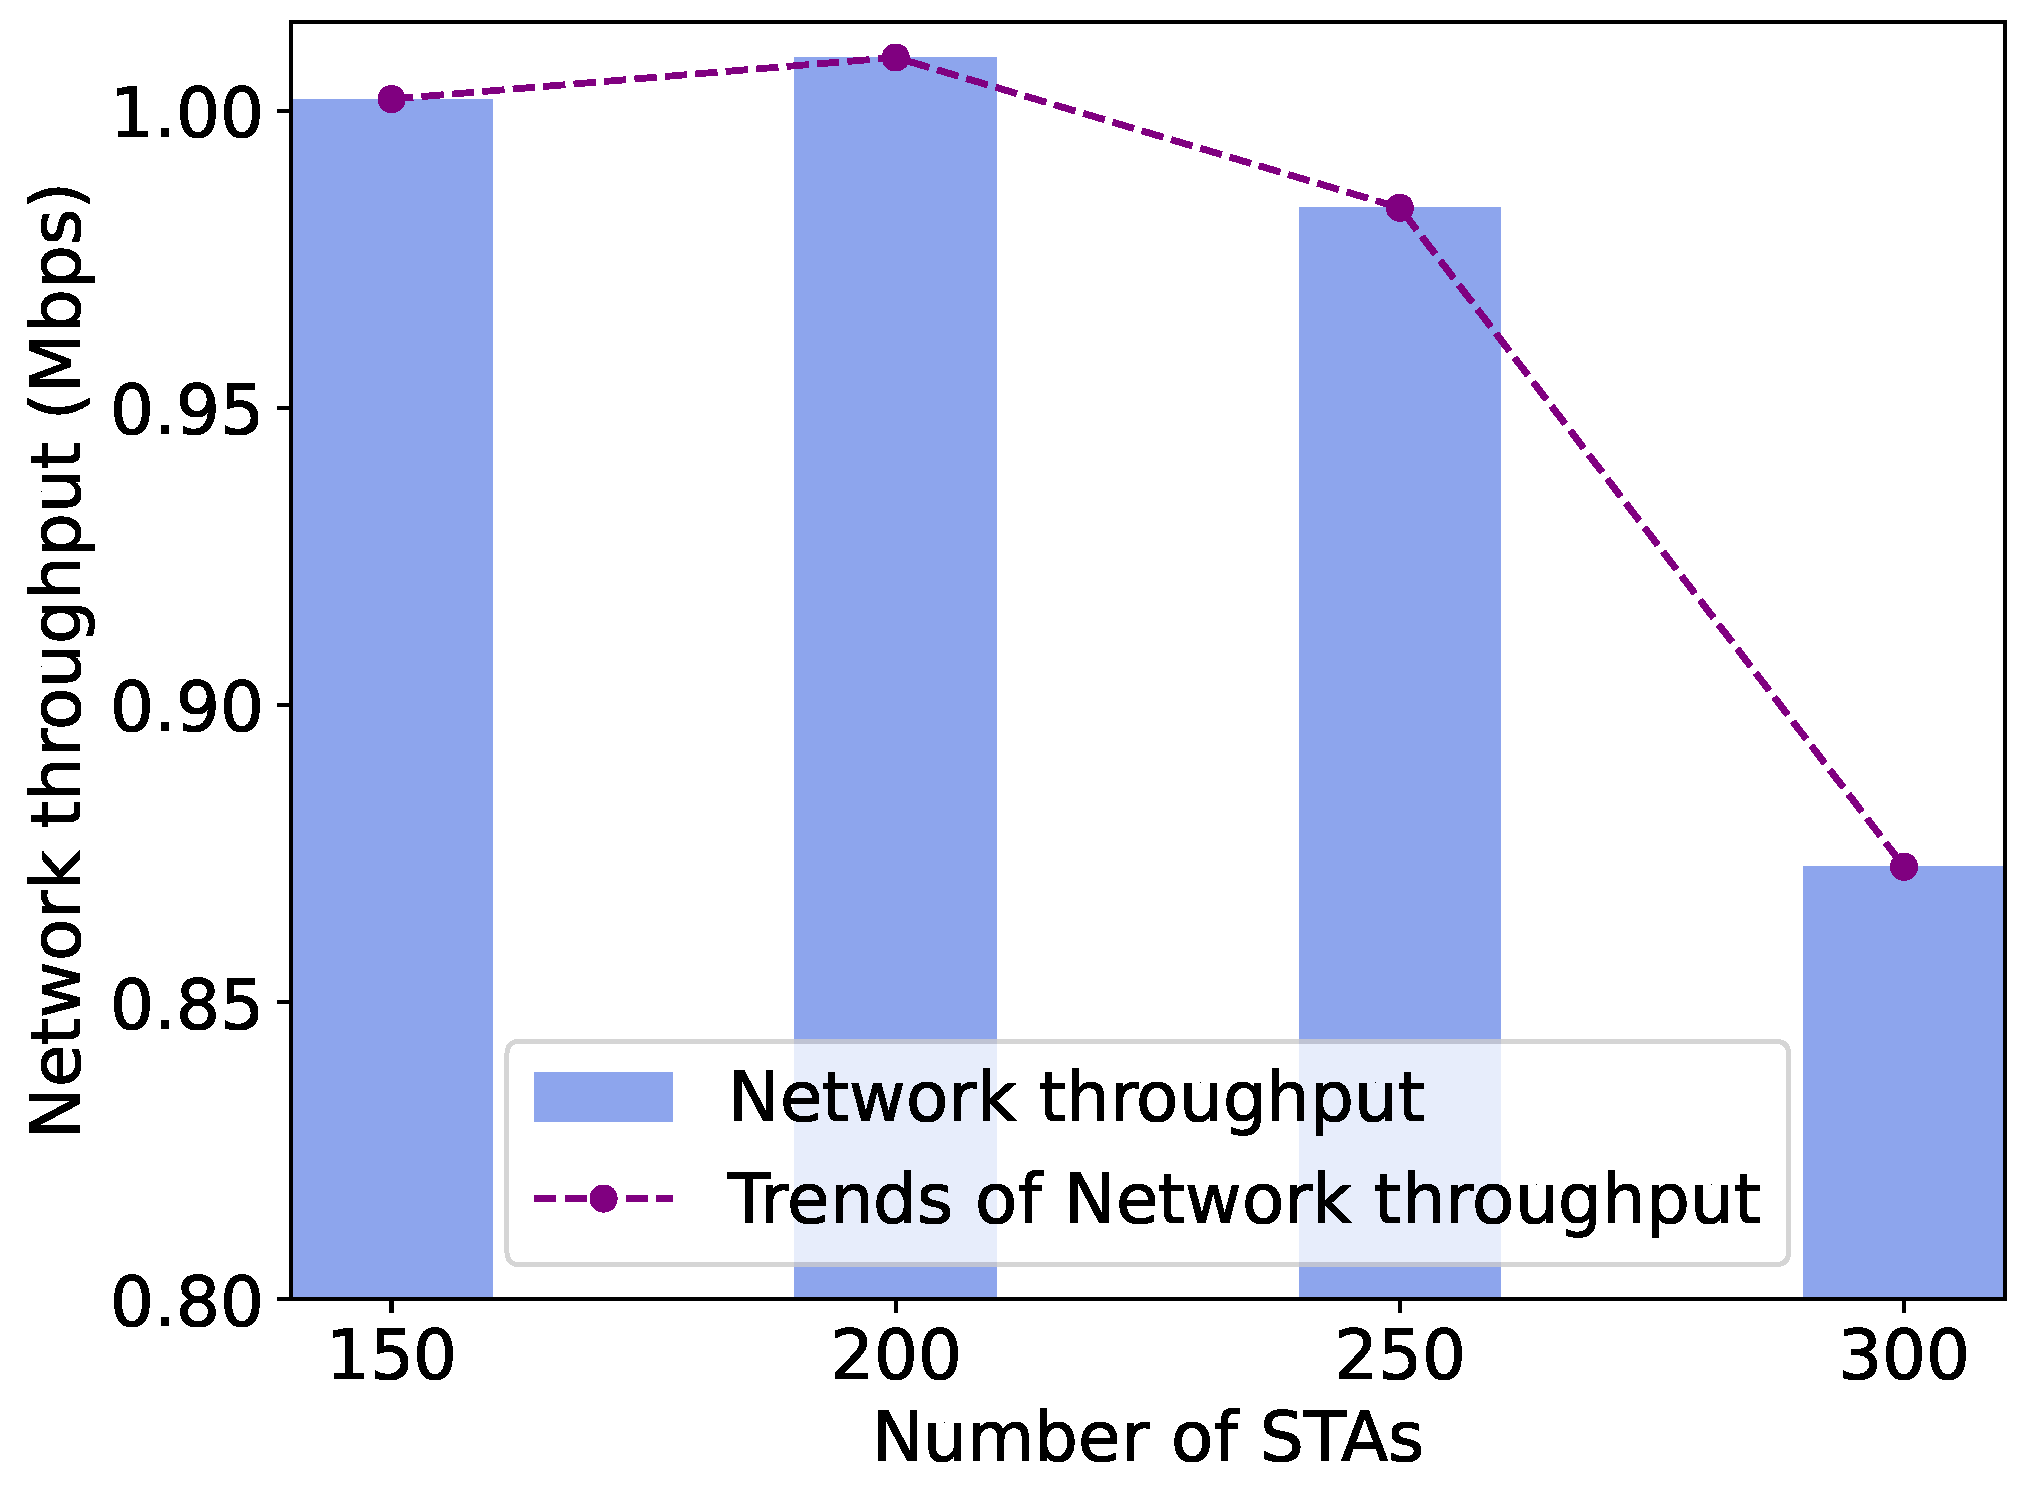
5.3.2. Throughput Performance with Different Network Sizes
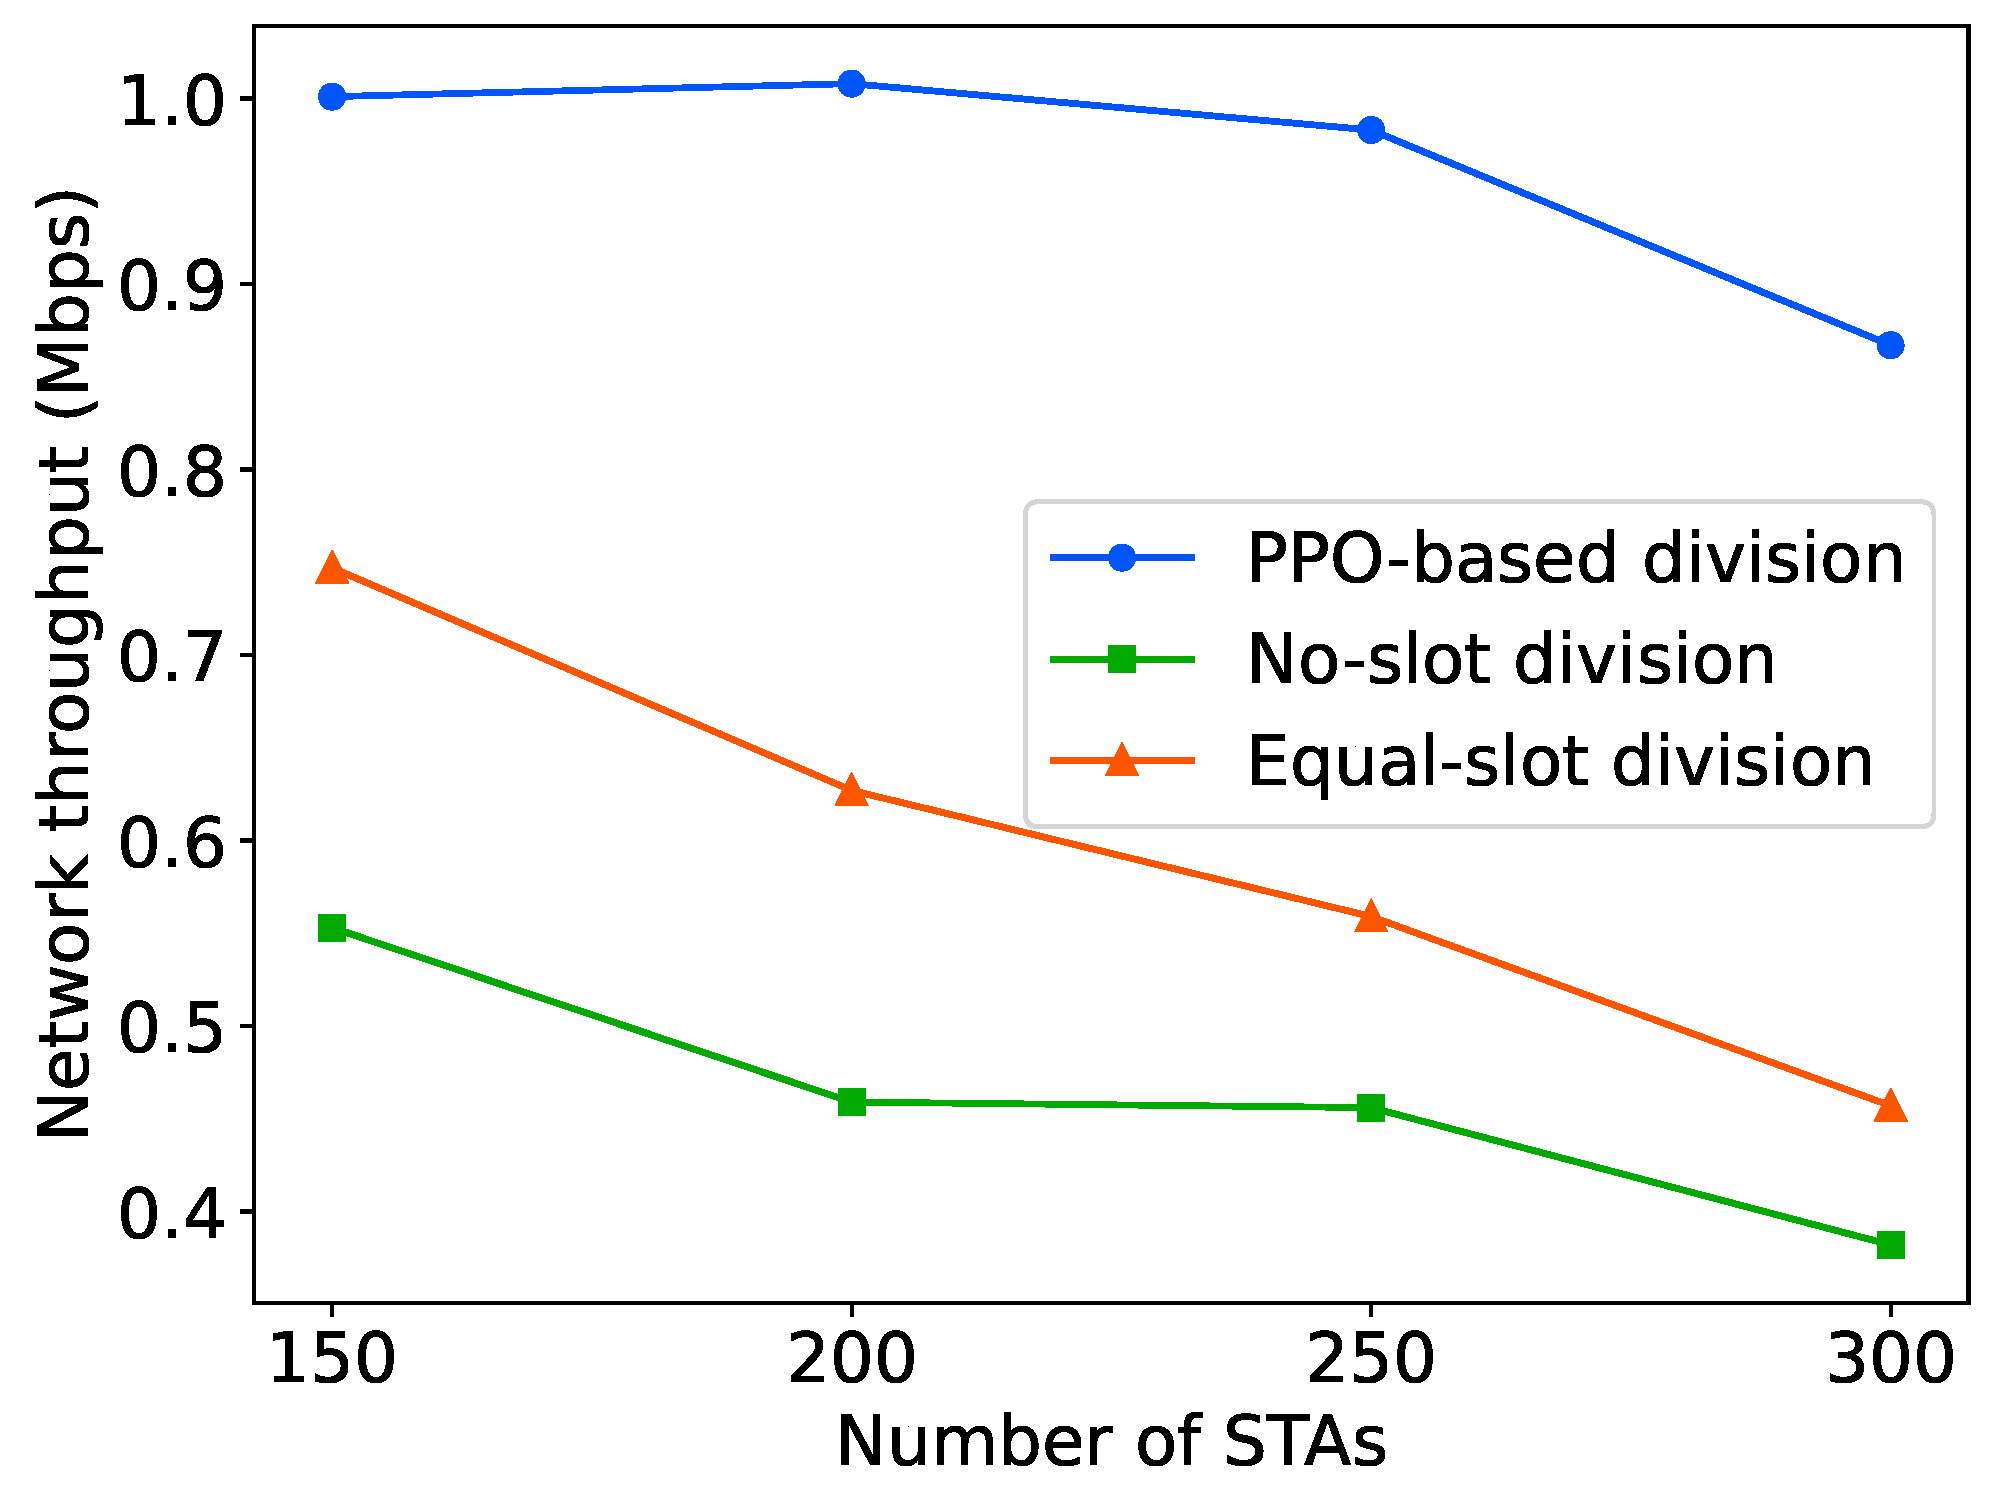
5.4. Throughput Comparison of Different Slot Division Schemes
6. Conclusion
References
- Vailshery, L.S. Internet of Things (IoT) and non-IoT active device connections worldwide from 2010 to 2025, 2022. https://www.statista.com/statistics/1101442/iot-number-of-connected-devices-worldwide/.
- Wi-Fi Alliance. Wi-Fi CERTIFIED HaLow™:Wi-Fi® for IoT applications (2021), 2021. https://www.wi-fi.org/file/wi-fi-certified-halow-wi-fi-for-iot-applications-2021.
- Wi-Fi Alliance. Wi-Fi CERTIFIED HaLow ™ Technology Overview, 2021. https://www.wi-fi.org/file/wi-ficertified-halow-technology-overview-2021.
- IEEE Standard for Information technology–Telecommunications and information exchange between systems - Local and metropolitan area networks–Specific requirements - Part 11: Wireless LAN Medium Access Control (MAC) and Physical Layer (PHY) Specifications Amendment 2: Sub 1 GHz License Exempt Operation. IEEE Std 802.11ah-2016 (Amendment to IEEE Std 802.11-2016, as amended by IEEE Std 802.11ai-2016) 2017, pp. 1–594.
- Tian, L.; Famaey, J.; Latré, S. Evaluation of the IEEE 802.11 ah restricted access window mechanism for dense IoT networks. In Proceedings of the 2016 IEEE 17th international symposium on a world of wireless, mobile and multimedia networks (WoWMoM). IEEE, 2016, pp. 1–9.
- Taramit, H.; Barbosa, L.O.; Haqiq, A. Energy efficiency framework for time-limited contention in the IEEE 802.11 ah standard. In Proceedings of the 2021 IEEE GlobecomWorkshops (GC Wkshps). IEEE, 2021, pp.1–6.
- Wang, Y.; Chai, K.K.; Chen, Y.; Schormans, J.; Loo, J. Energy-delay aware restricted access window with novel retransmission for IEEE 802.11 ah networks. In Proceedings of the 2016 IEEE Global Communications Conference (GLOBECOM). IEEE, 2016, pp. 1–6.
- Seferagi´c, A.; De Poorter, E.; Hoebeke, J. Enabling wireless closed loop communication: Optimal scheduling over IEEE 802.11 ah networks. IEEE Access 2021, 9, 9084–9100.
- Lakshmi, L.R.; Sikdar, B. Achieving fairness in IEEE 802.11 ah networks for IoT applications with different requirements. In Proceedings of the ICC 2019-2019 IEEE International Conference on Communications (ICC). IEEE, 2019, pp. 1–6.
- Mahesh, M.; Harigovindan, V. Throughput enhancement of IEEE 802.11 ah raw mechanism using ANN. In Proceedings of the 2020 First IEEE International Conference on Measurement, Instrumentation, Control and Automation (ICMICA). IEEE, 2020, pp. 1–4.
- Oliveira, E.C.; Soares, S.M.; Carvalho, M.M. K-Means Based Grouping of Stations with Dynamic AID Assignment in IEEE 802.11 ah Networks. In Proceedings of the 2022 18th International Conference on Mobility, Sensing and Networking (MSN). IEEE, 2022, pp. 134–141.
- Robaglia, B.M.; Destounis, A.; Coupechoux, M.; Tsilimantos, D. Deep reinforcement learning for scheduling uplink iot traffic with strict deadlines. In Proceedings of the 2021 IEEE Global Communications Conference (GLOBECOM). IEEE, 2021, pp. 1–6.
- Kumar, A.; Verma, G.; Rao, C.; Swami, A.; Segarra, S. Adaptive contention window design using deep Q-learning. In Proceedings of the ICASSP 2021-2021 IEEE International Conference on Acoustics, Speech and Signal Processing (ICASSP). IEEE, 2021, pp. 4950–4954.
- Bianchi, G. Performance analysis of the IEEE 802.11 distributed coordination function. IEEE Journal on selected areas in communications 2000, 18, 535–547.
- Soares, S.M.; Carvalho, M.M. Throughput analytical modeling of IEEE 802.11 ah wireless networks. In Proceedings of the 2019 16th IEEE Annual Consumer Communications & Networking Conference (CCNC). IEEE, 2019, pp. 1–4.
- Zheng, L.; Ni, M.; Cai, L.; Pan, J.; Ghosh, C.; Doppler, K. Performance Analysis of Group-Synchronized DCF for Dense IEEE 802.11 Networks. IEEE Trans. Wirel. Commun. 2014, 13, 6180–6192, . [CrossRef]
- Sangeetha, U.; Babu, A. Performance analysis of IEEE 802.11 ah wireless local area network under the restricted access window-based mechanism. International Journal of Communication Systems 2019, 32.
- Taramit, H.; Camacho-Escoto, J.J.; Gomez, J.; Orozco-Barbosa, L.; Haqiq, A. Accurate Analytical Model and Evaluation of Wi-Fi Halow Based IoT Networks under a Rayleigh-Fading Channel with Capture. Mathematics 2022, 10, 952, . [CrossRef]
- Zhao, Y.; Yilmaz, O.N.; Larmo, A. Optimizing M2M energy efficiency in IEEE 802.11 ah. In Proceedings of the 2015 IEEE Globecom Workshops (GC Wkshps). IEEE, 2015, pp. 1–6.
- Nawaz, N.; Hafeez, M.; Zaidi, S.A.R.; McLernon, D.C.; Ghogho, M. Throughput enhancement of restricted access window for uniform grouping scheme in IEEE 802.11 ah. In Proceedings of the 2017 IEEE international conference on communications (ICC). IEEE, 2017, pp. 1–7.
- Tian, L.; Khorov, E.; Latré, S.; Famaey, J. Real-Time Station Grouping under Dynamic Traffic for IEEE 802.11ah. Sensors 2017, 17, 1559, . [CrossRef]
- Tian, L.; Santi, S.; Latré, S.; Famaey, J. Accurate sensor traffic estimation for station grouping in highly dense IEEE 802.11 ah networks. In Proceedings of the Proceedings of the First ACM InternationalWorkshop on the Engineering of Reliable, Robust, and Secure EmbeddedWireless Sensing Systems, 2017, pp. 1–9.
- Khorov, E.; Lyakhov, A.; Nasedkin, I.; Yusupov, R.; Famaey, J.; Akyildiz, I.F. Fast and Reliable Alert Delivery in Mission-Critical Wi-Fi HaLow Sensor Networks. IEEE Access 2020, 8, 14302–14313, . [CrossRef]
- Ahmed, N.; De, D.; Hussain, M.I. A QoS-aware MAC protocol for IEEE 802.11 ah-based Internet of Things. In Proceedings of the 2018 fifteenth international conference on wireless and optical communications networks (WOCN). IEEE, 2018, pp. 1–5.
- Tian, L.; Mehari, M.; Santi, S.; Latré, S.; De Poorter, E.; Famaey, J. IEEE 802.11 ah restricted access window surrogate model for real-time station grouping. In Proceedings of the 2018 IEEE 19th International Symposium on" A World of Wireless, Mobile and Multimedia Networks"(WoWMoM). IEEE, 2018, pp. 14–22.
- Hasi, M.A.A.; Haque, M.D.; Siddik, M.A. Traffic Demand-based Grouping for Fairness among the RAW Groups of Heterogeneous Stations in IEEE802. 11ah IoT Networks. In Proceedings of the 2022 International Conference on Advancement in Electrical and Electronic Engineering (ICAEEE). IEEE, 2022, pp. 1–6.
- Chang, T.C.; Lin, C.H.; Lin, K.C.J.; Chen,W.T. Traffic-aware sensor grouping for IEEE 802.11 ah networks: Regression based analysis and design. IEEE Transactions on Mobile Computing 2018, 18, 674–687.
- Garcia-Villegas, E.; Lopez-Garcia, A.; Lopez-Aguilera, E. Genetic Algorithm-Based Grouping Strategy for IEEE 802.11ah Networks. Sensors 2023, 23, 862, . [CrossRef]
- Tian, L.; Lopez-Aguilera, E.; Garcia-Villegas, E.; Mehari, M.T.; De Poorter, E.; Latré, S.; Famaey, J. Optimizationoriented RAW modeling of IEEE 802.11 ah heterogeneous networks. IEEE Internet of Things Journal 2019, 6, 10597–10609.
- Bobba, T.S.; Bojanapally, V.S. Fair and Dynamic Channel Grouping Scheme for IEEE 802.11 ah Networks. In Proceedings of the 2020 IEEE 5th International Symposium on Telecommunication Technologies (ISTT). IEEE, 2020, pp. 105–110.
- Mahesh, M.; Pavan, B.S.; Harigovindan, V. Data rate-based grouping using machine learning to improve the aggregate throughput of IEEE 802.11 ah multi-rate IoT networks. In Proceedings of the 2020 IEEE international conference on advanced networks and telecommunications systems (ANTS). IEEE, 2020, pp.1–5.
- Ibrahim, A.; Hafez, A. Adaptive IEEE 802.11 ah MAC protocol for Optimization Collision Probability in IoT smart city data traffic Based Machine Learning models 2023.
- Pavan, B.S.; Harigovindan, V.P. GRU based optimal restricted access window mechanism for enhancing the performance of IEEE 802.11ah based IoT networks. J. Ambient. Intell. Humaniz. Comput. 2023, 14, 16653–16665, . [CrossRef]
- Schulman, J.; Wolski, F.; Dhariwal, P.; Radford, A.; Klimov, O. Proximal policy optimization algorithms. arXiv preprint arXiv:1707.06347 2017.
- Sutton, R.S.; McAllester, D.; Singh, S.; Mansour, Y. Policy gradient methods for reinforcement learning with function approximation. Advances in neural information processing systems 1999, 12.
- Lillicrap, T.P.; Hunt, J.J.; Pritzel, A.; Heess, N.; Erez, T.; Tassa, Y.; Silver, D.; Wierstra, D. Continuous control with deep reinforcement learning. arXiv preprint arXiv:1509.02971 2015.
- Schulman, J.; Levine, S.; Abbeel, P.; Jordan, M.; Moritz, P. Trust region policy optimization. In Proceedings of the International conference on machine learning. PMLR, 2015, pp. 1889–1897.
- Kim, Y.; Hwang, G.; Um, J.; Yoo, S.; Jung, H.; Park, S. Throughput Performance Optimization of Super Dense Wireless Networks With the Renewal Access Protocol. IEEE Trans. Wirel. Commun. 2016, 15, 3440–3452, . [CrossRef]
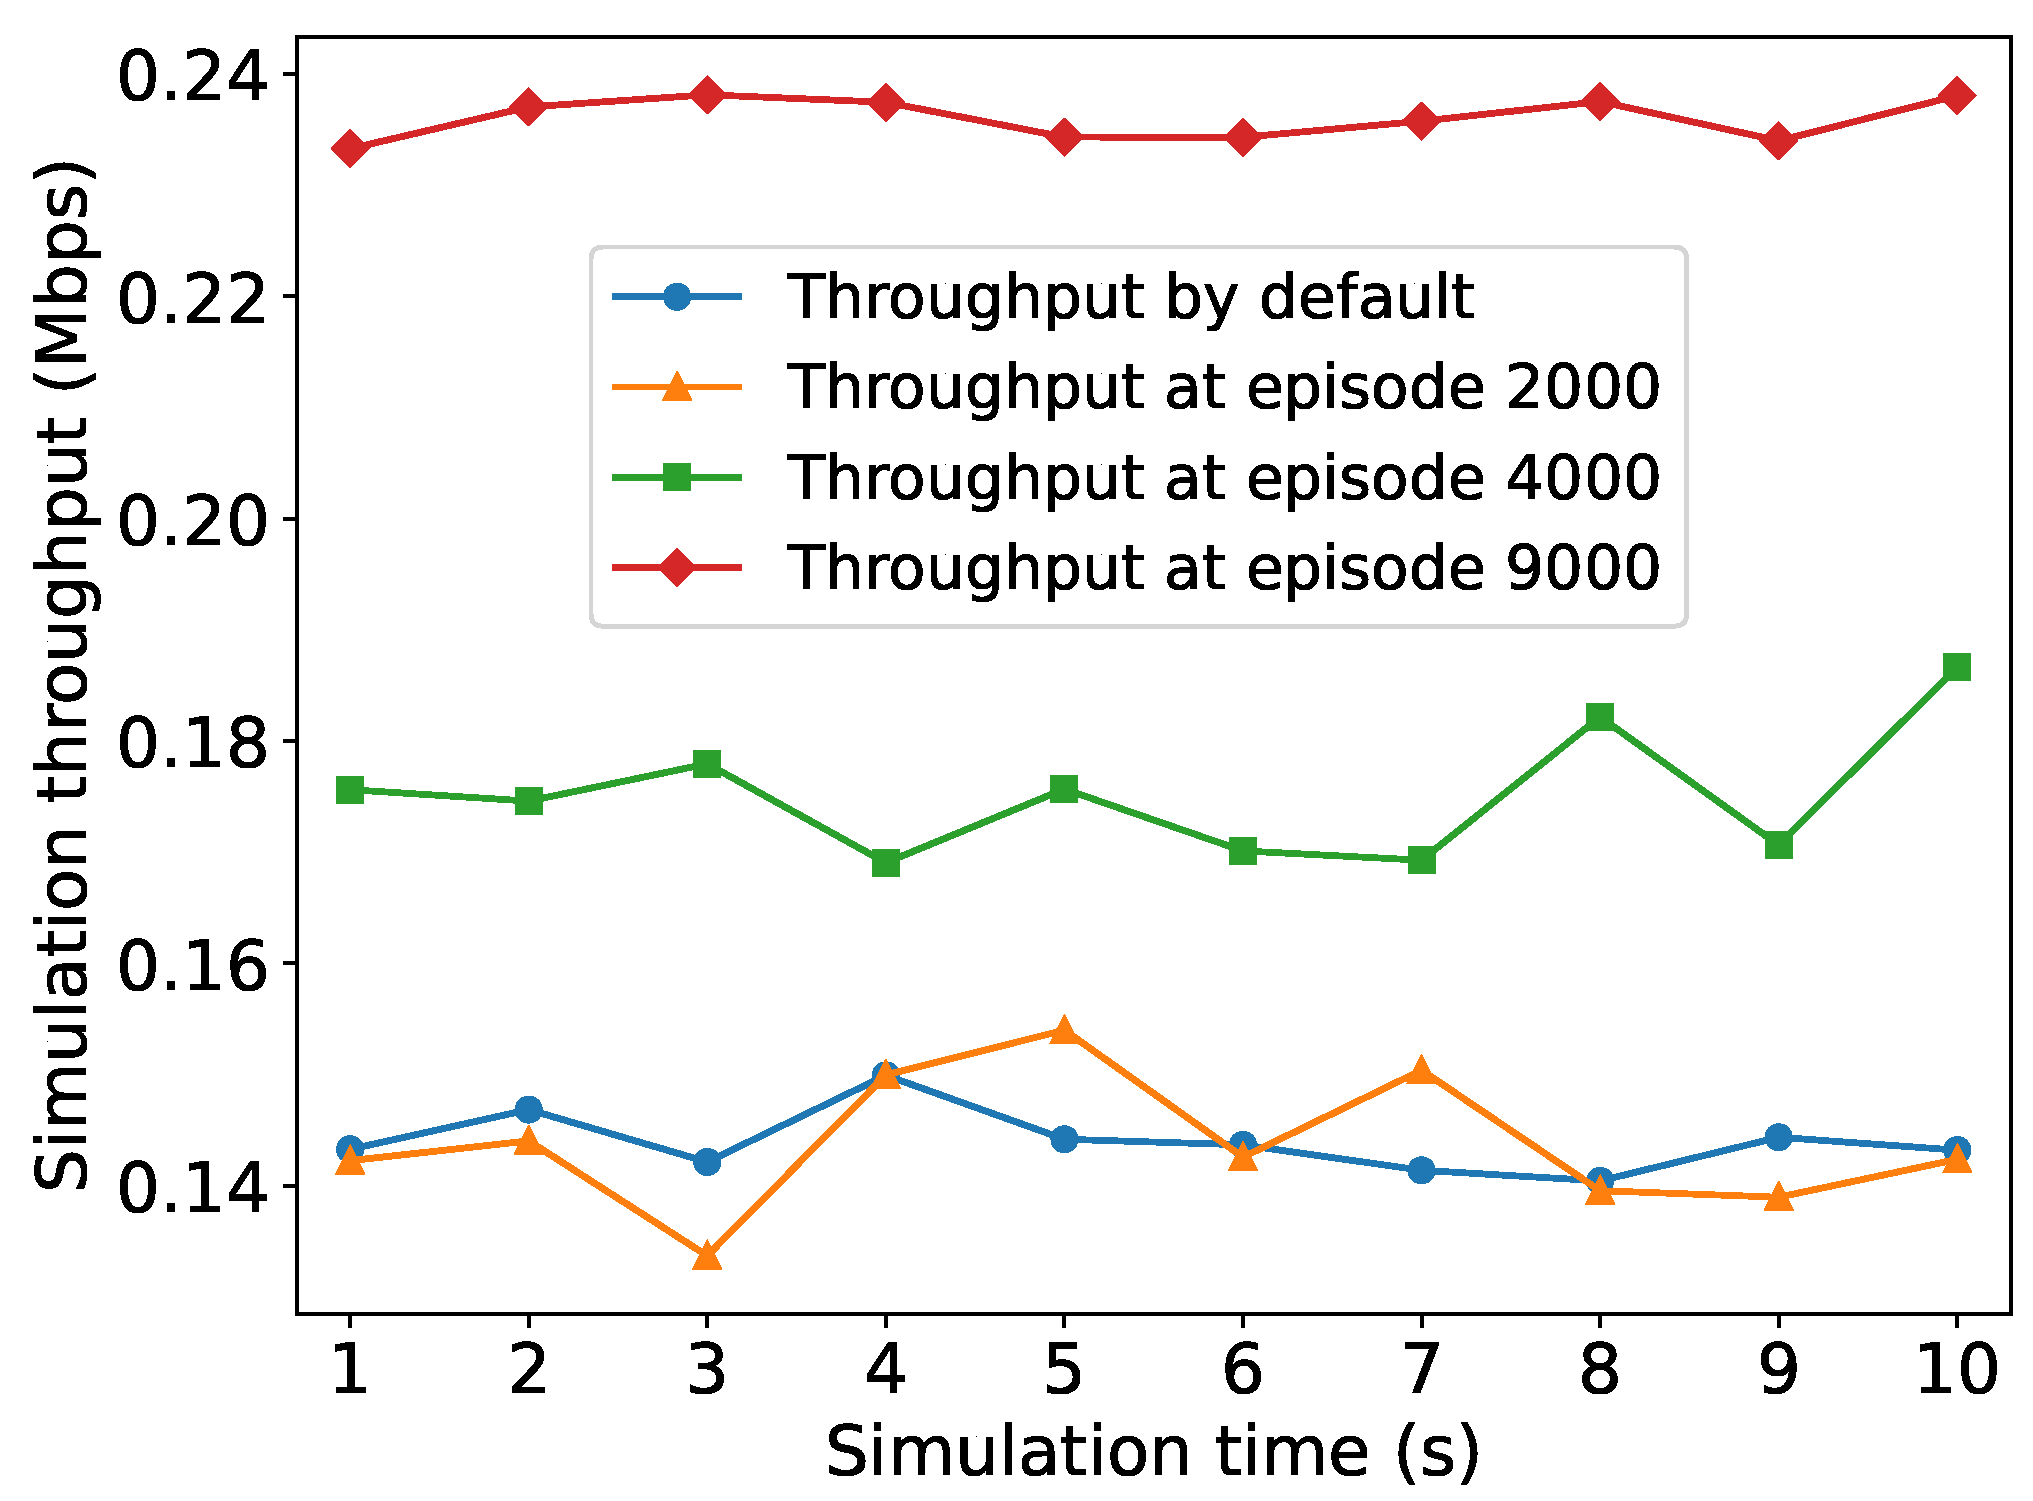
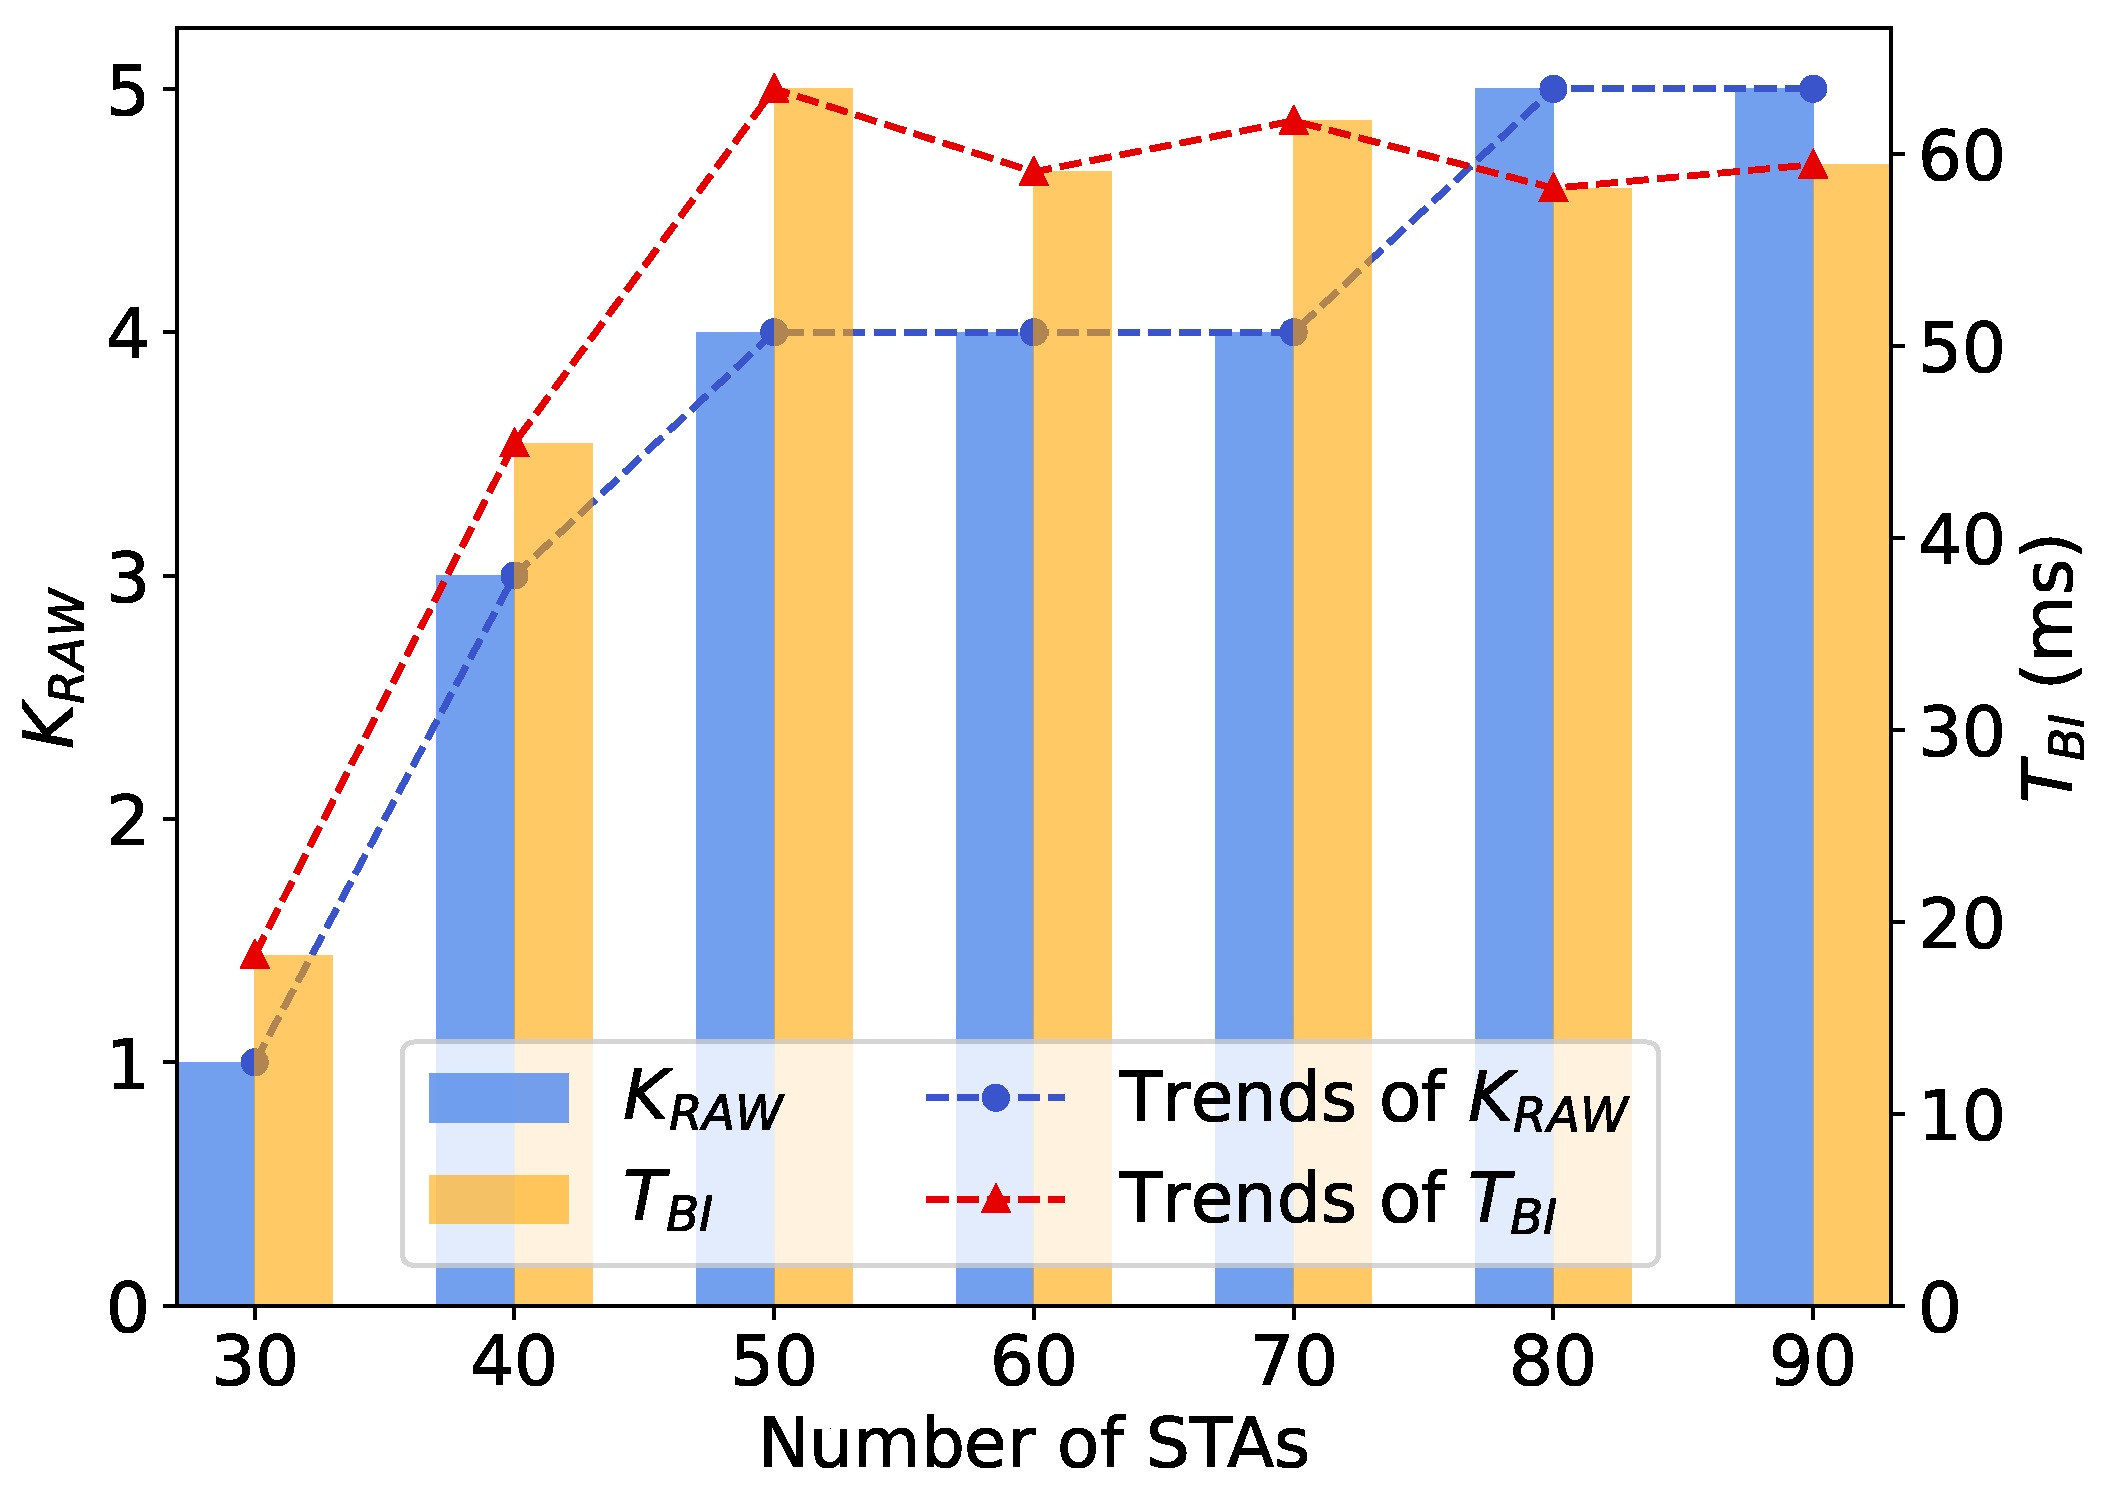
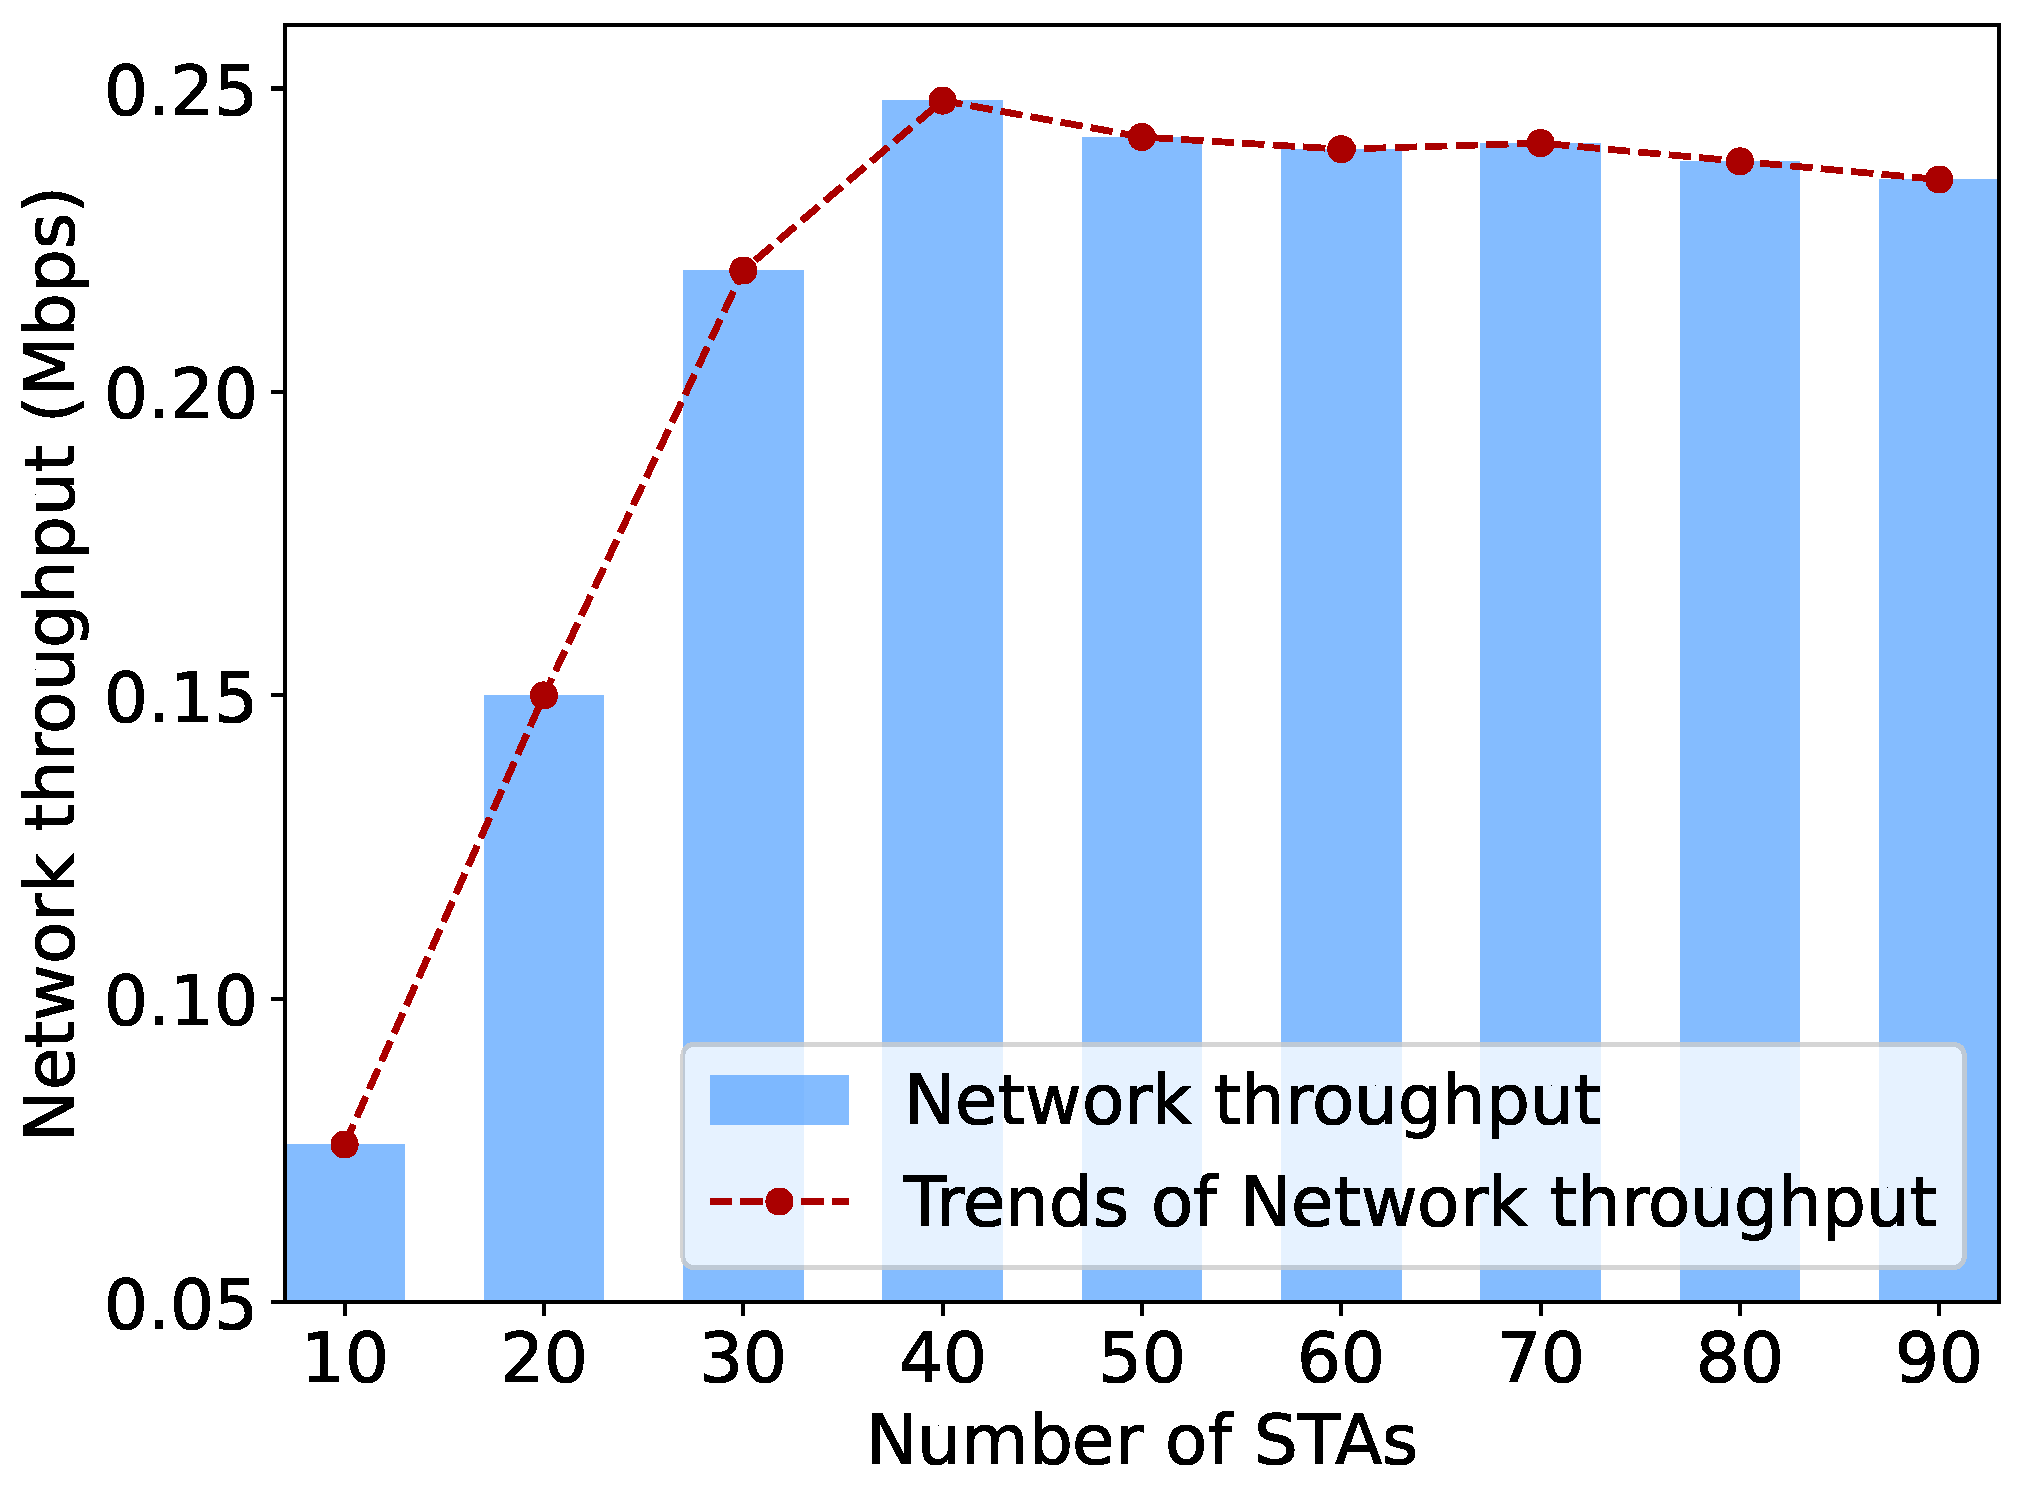
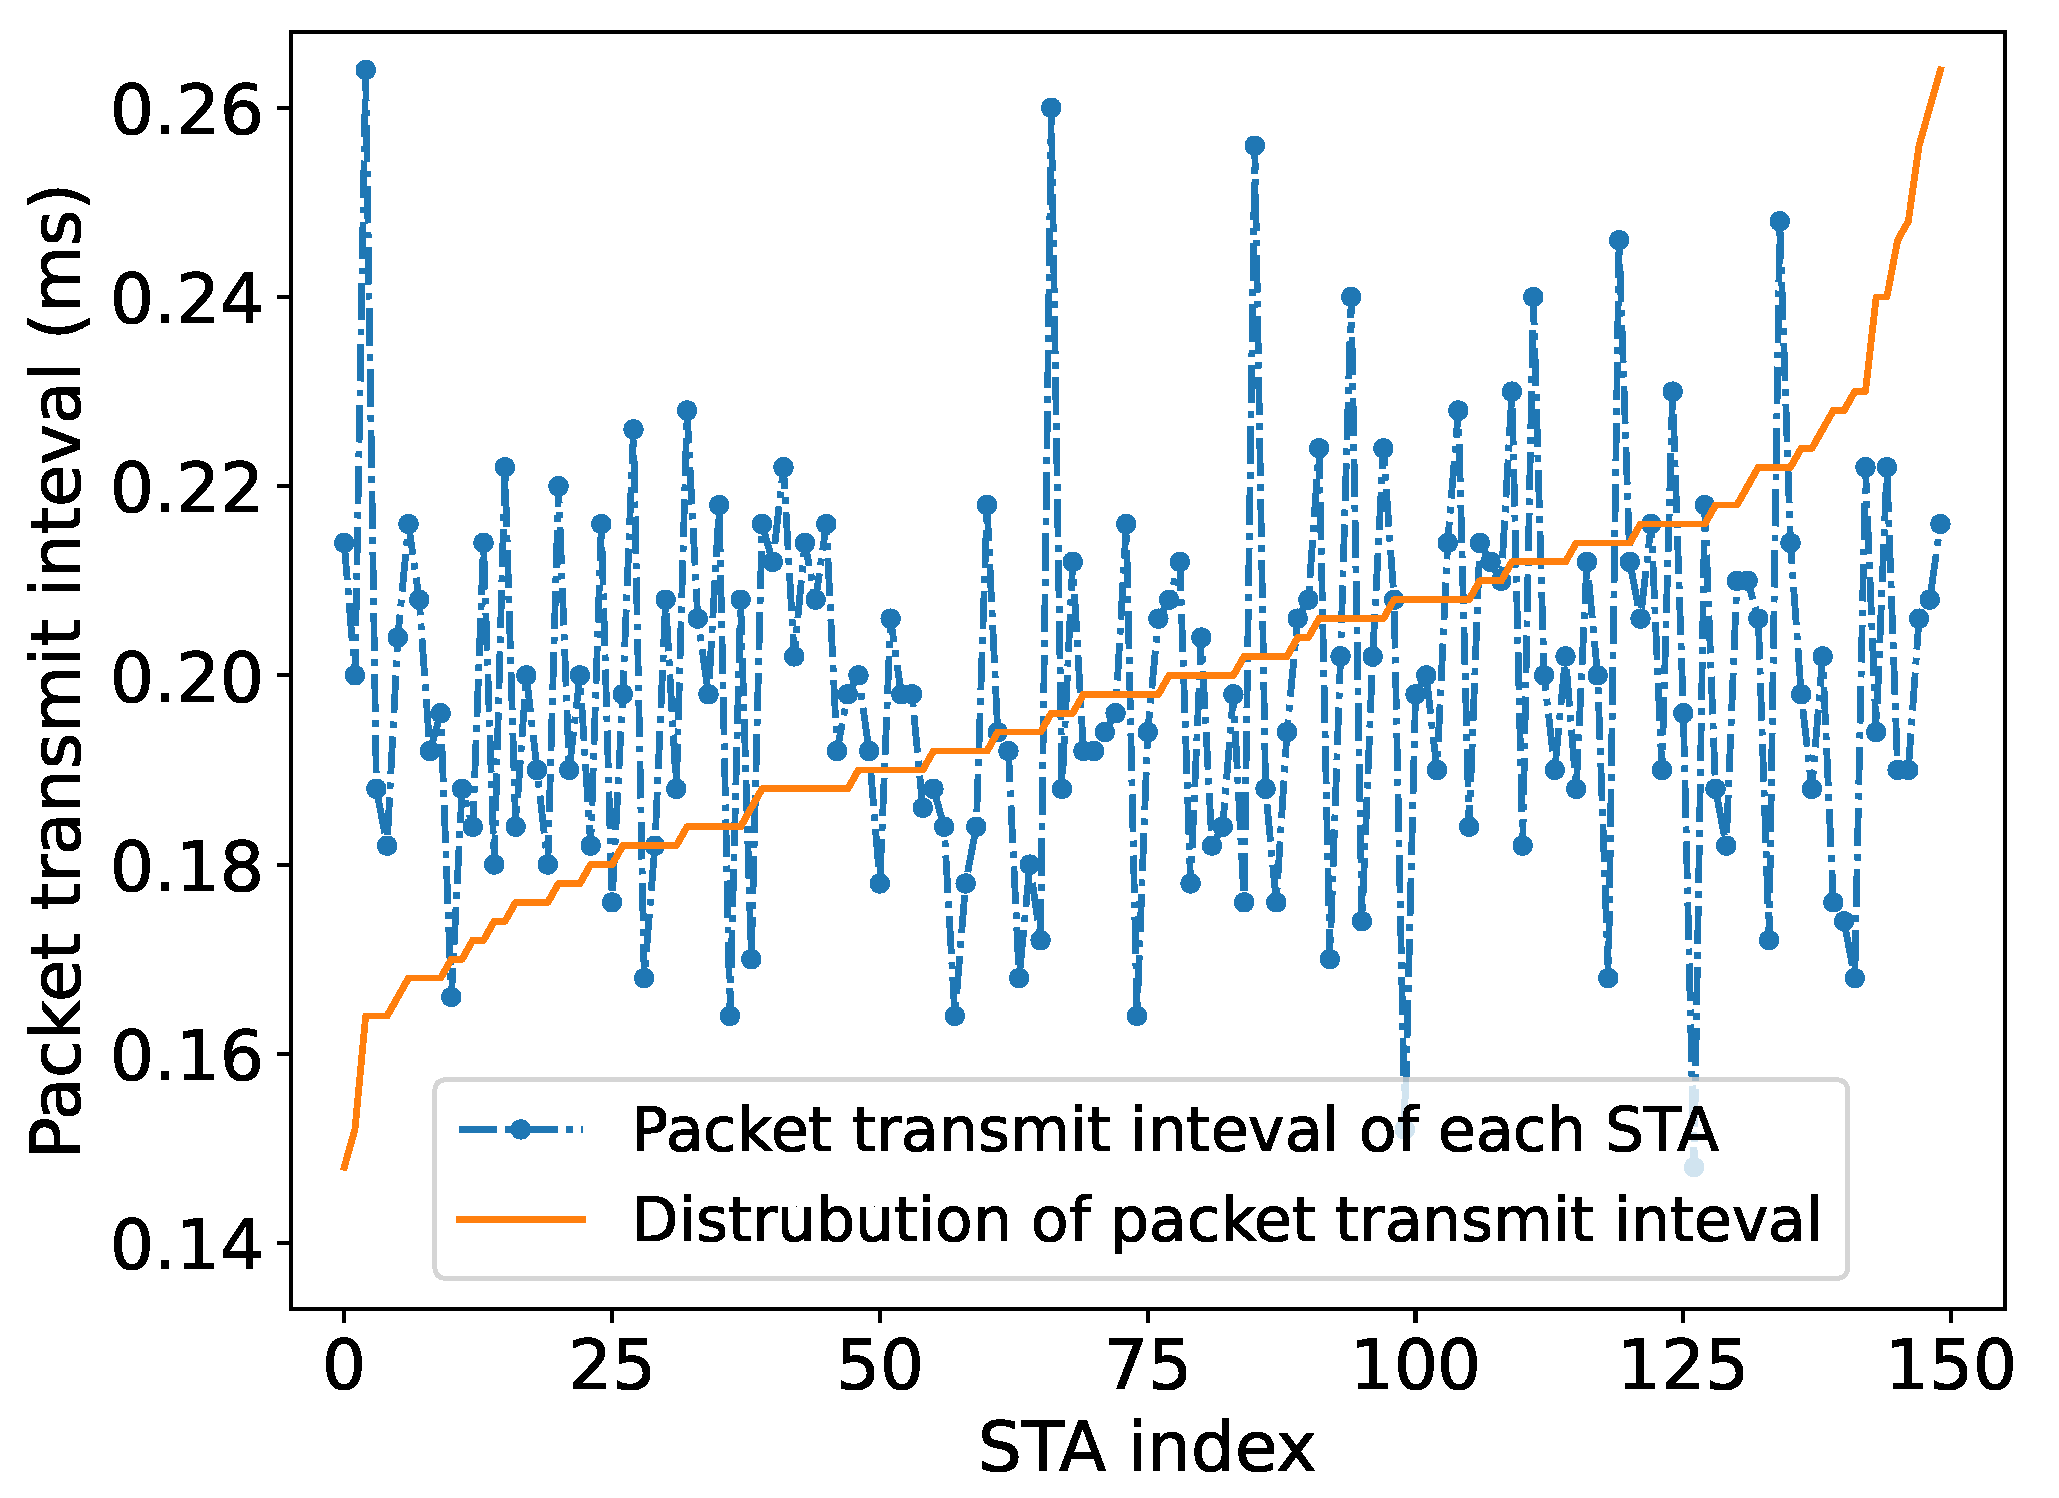
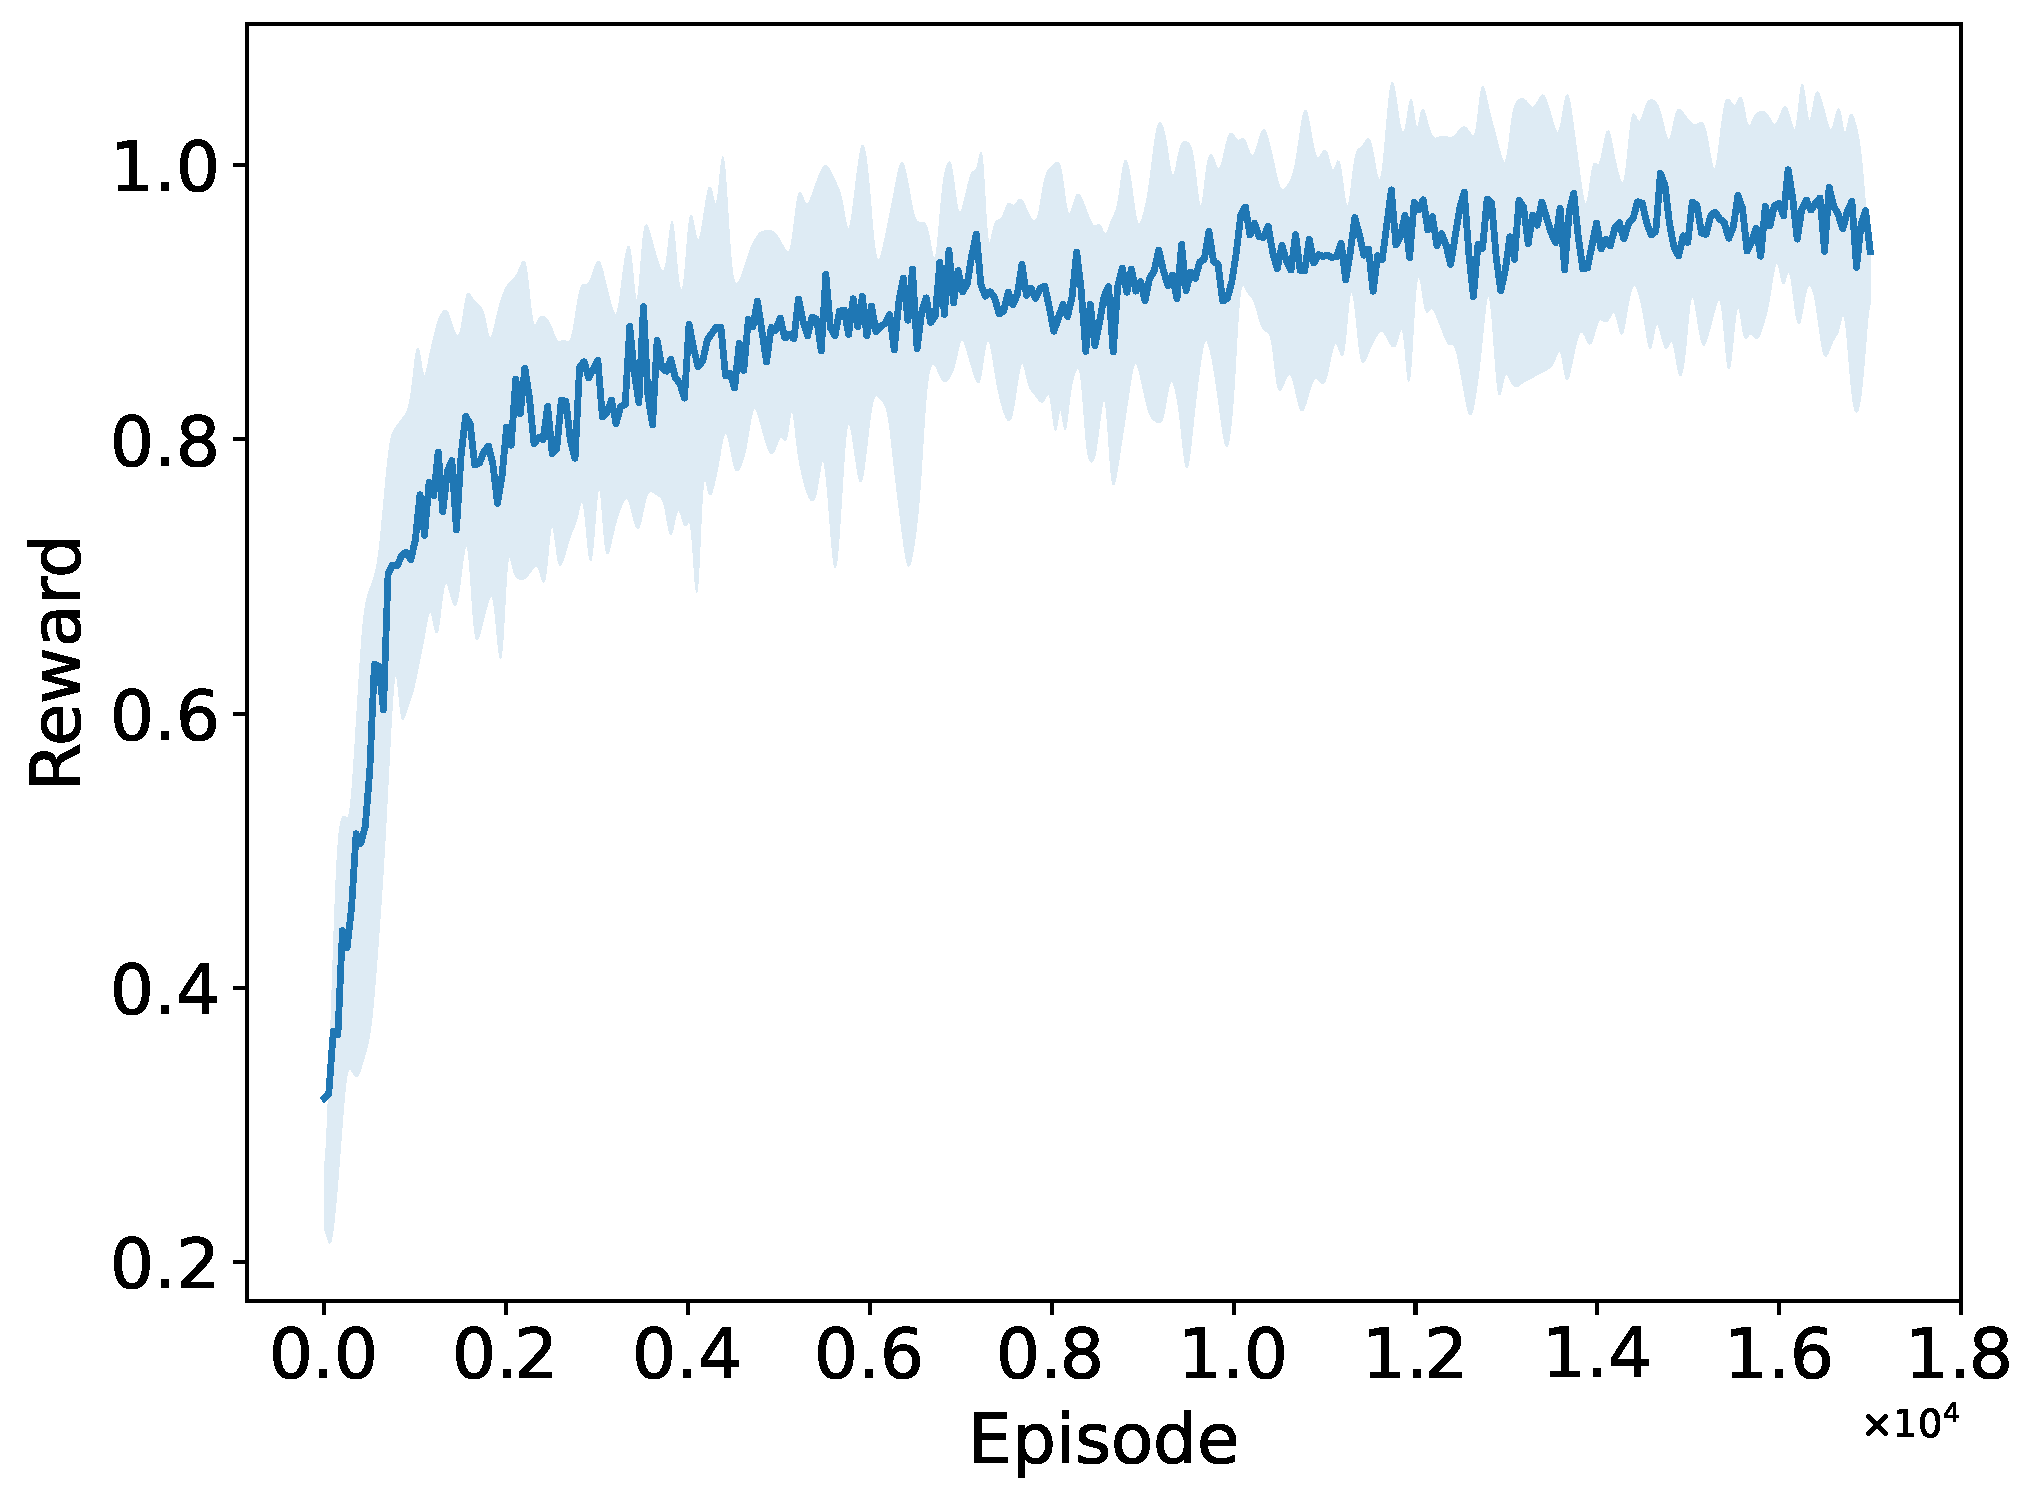
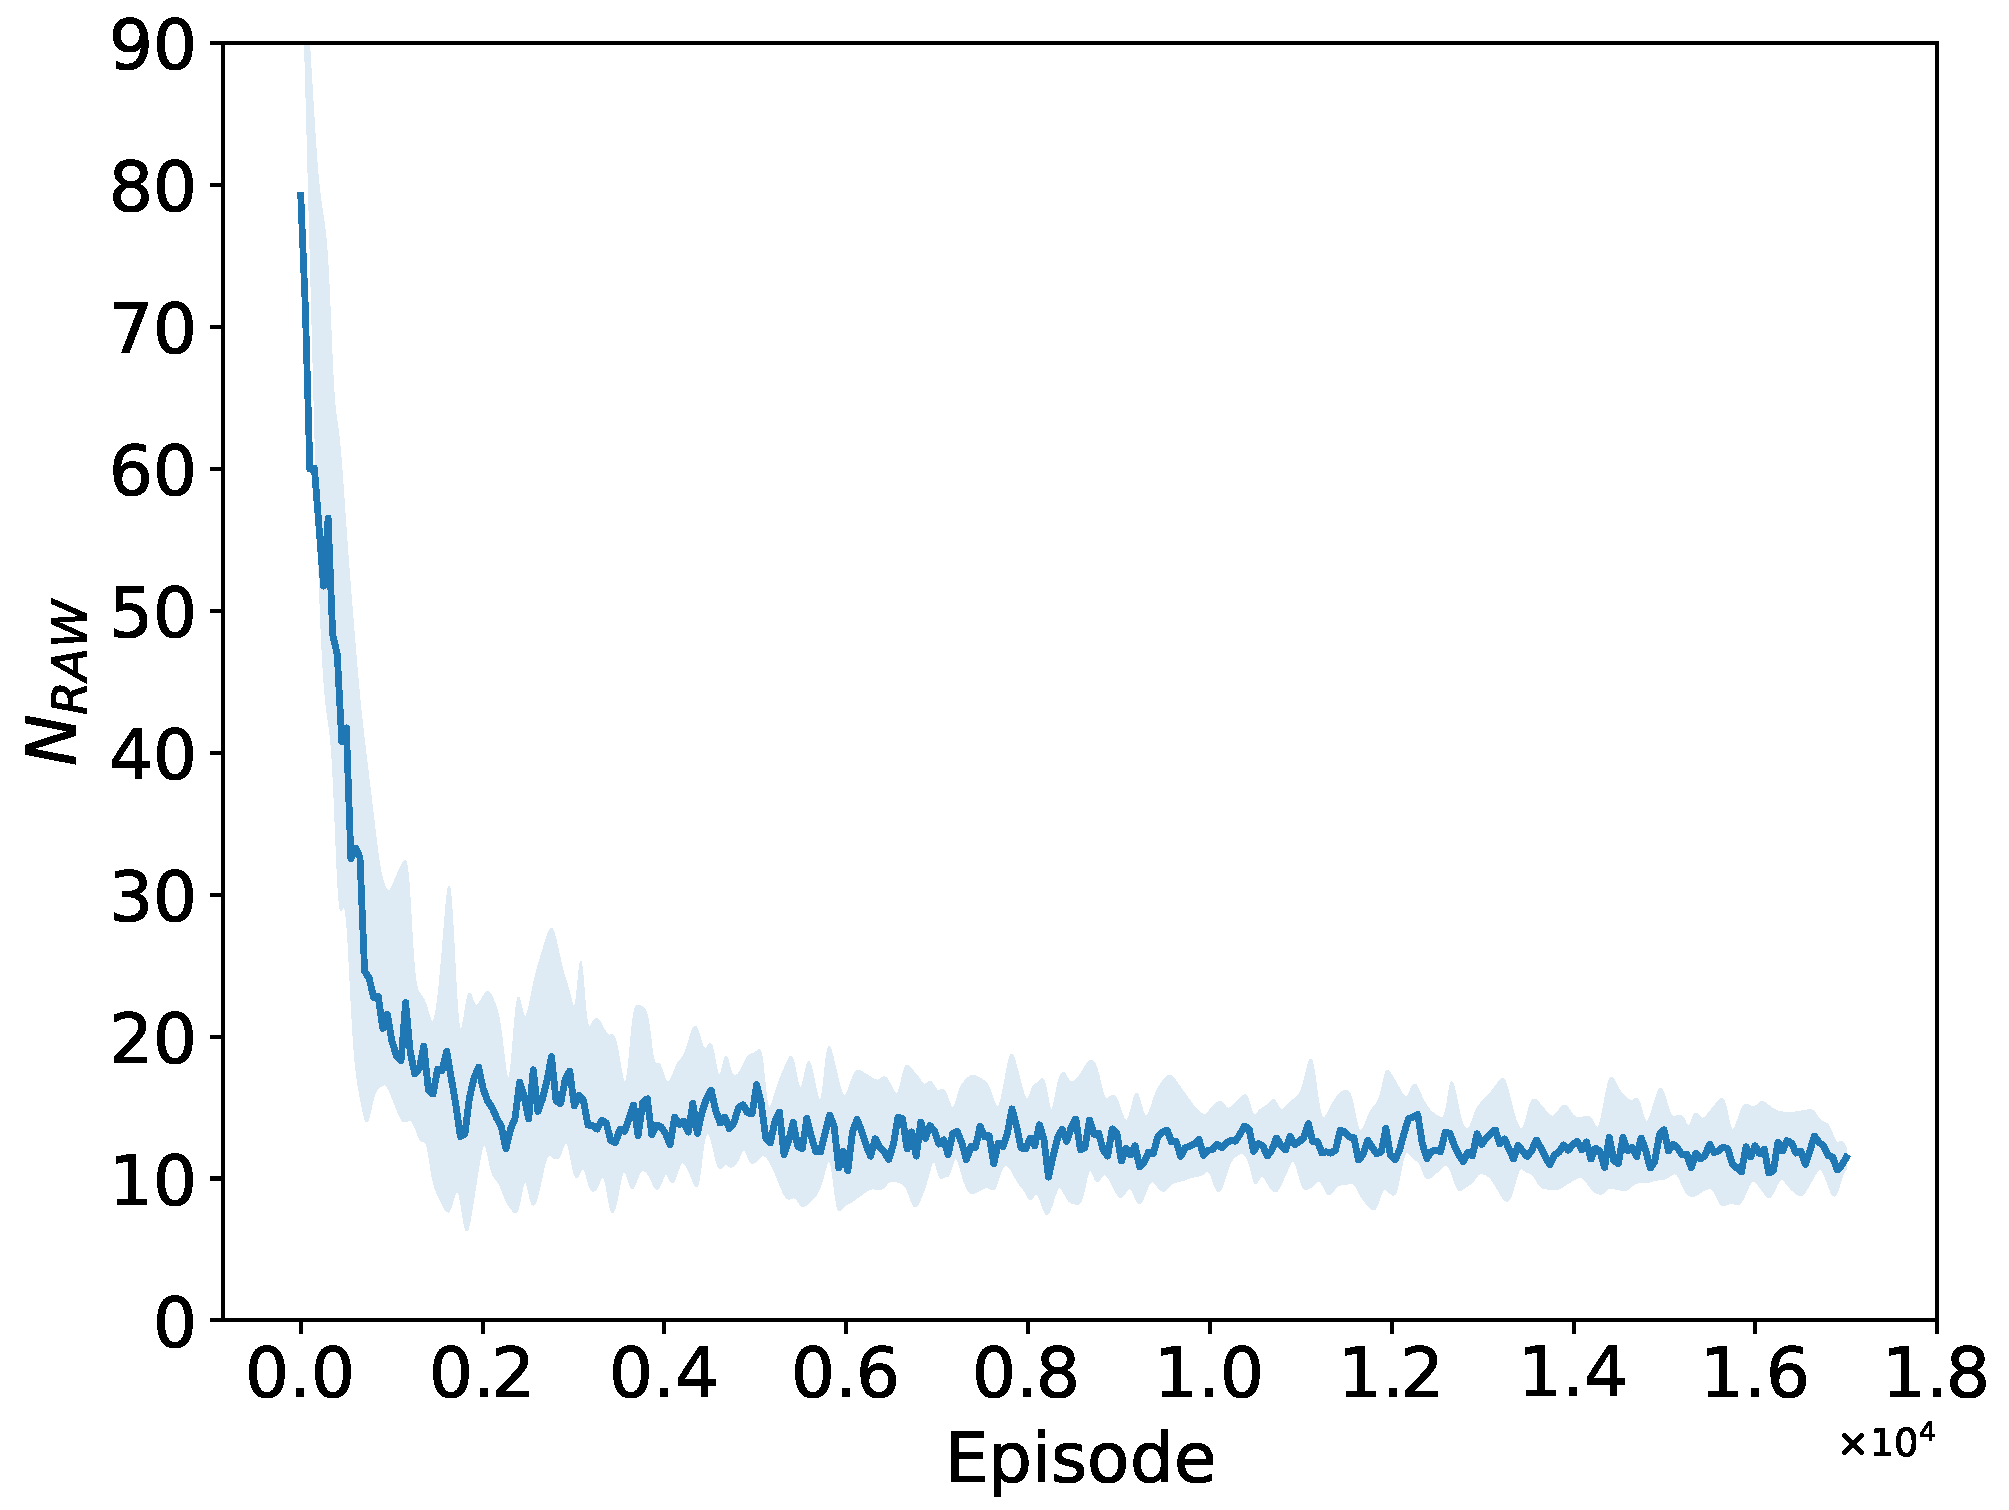
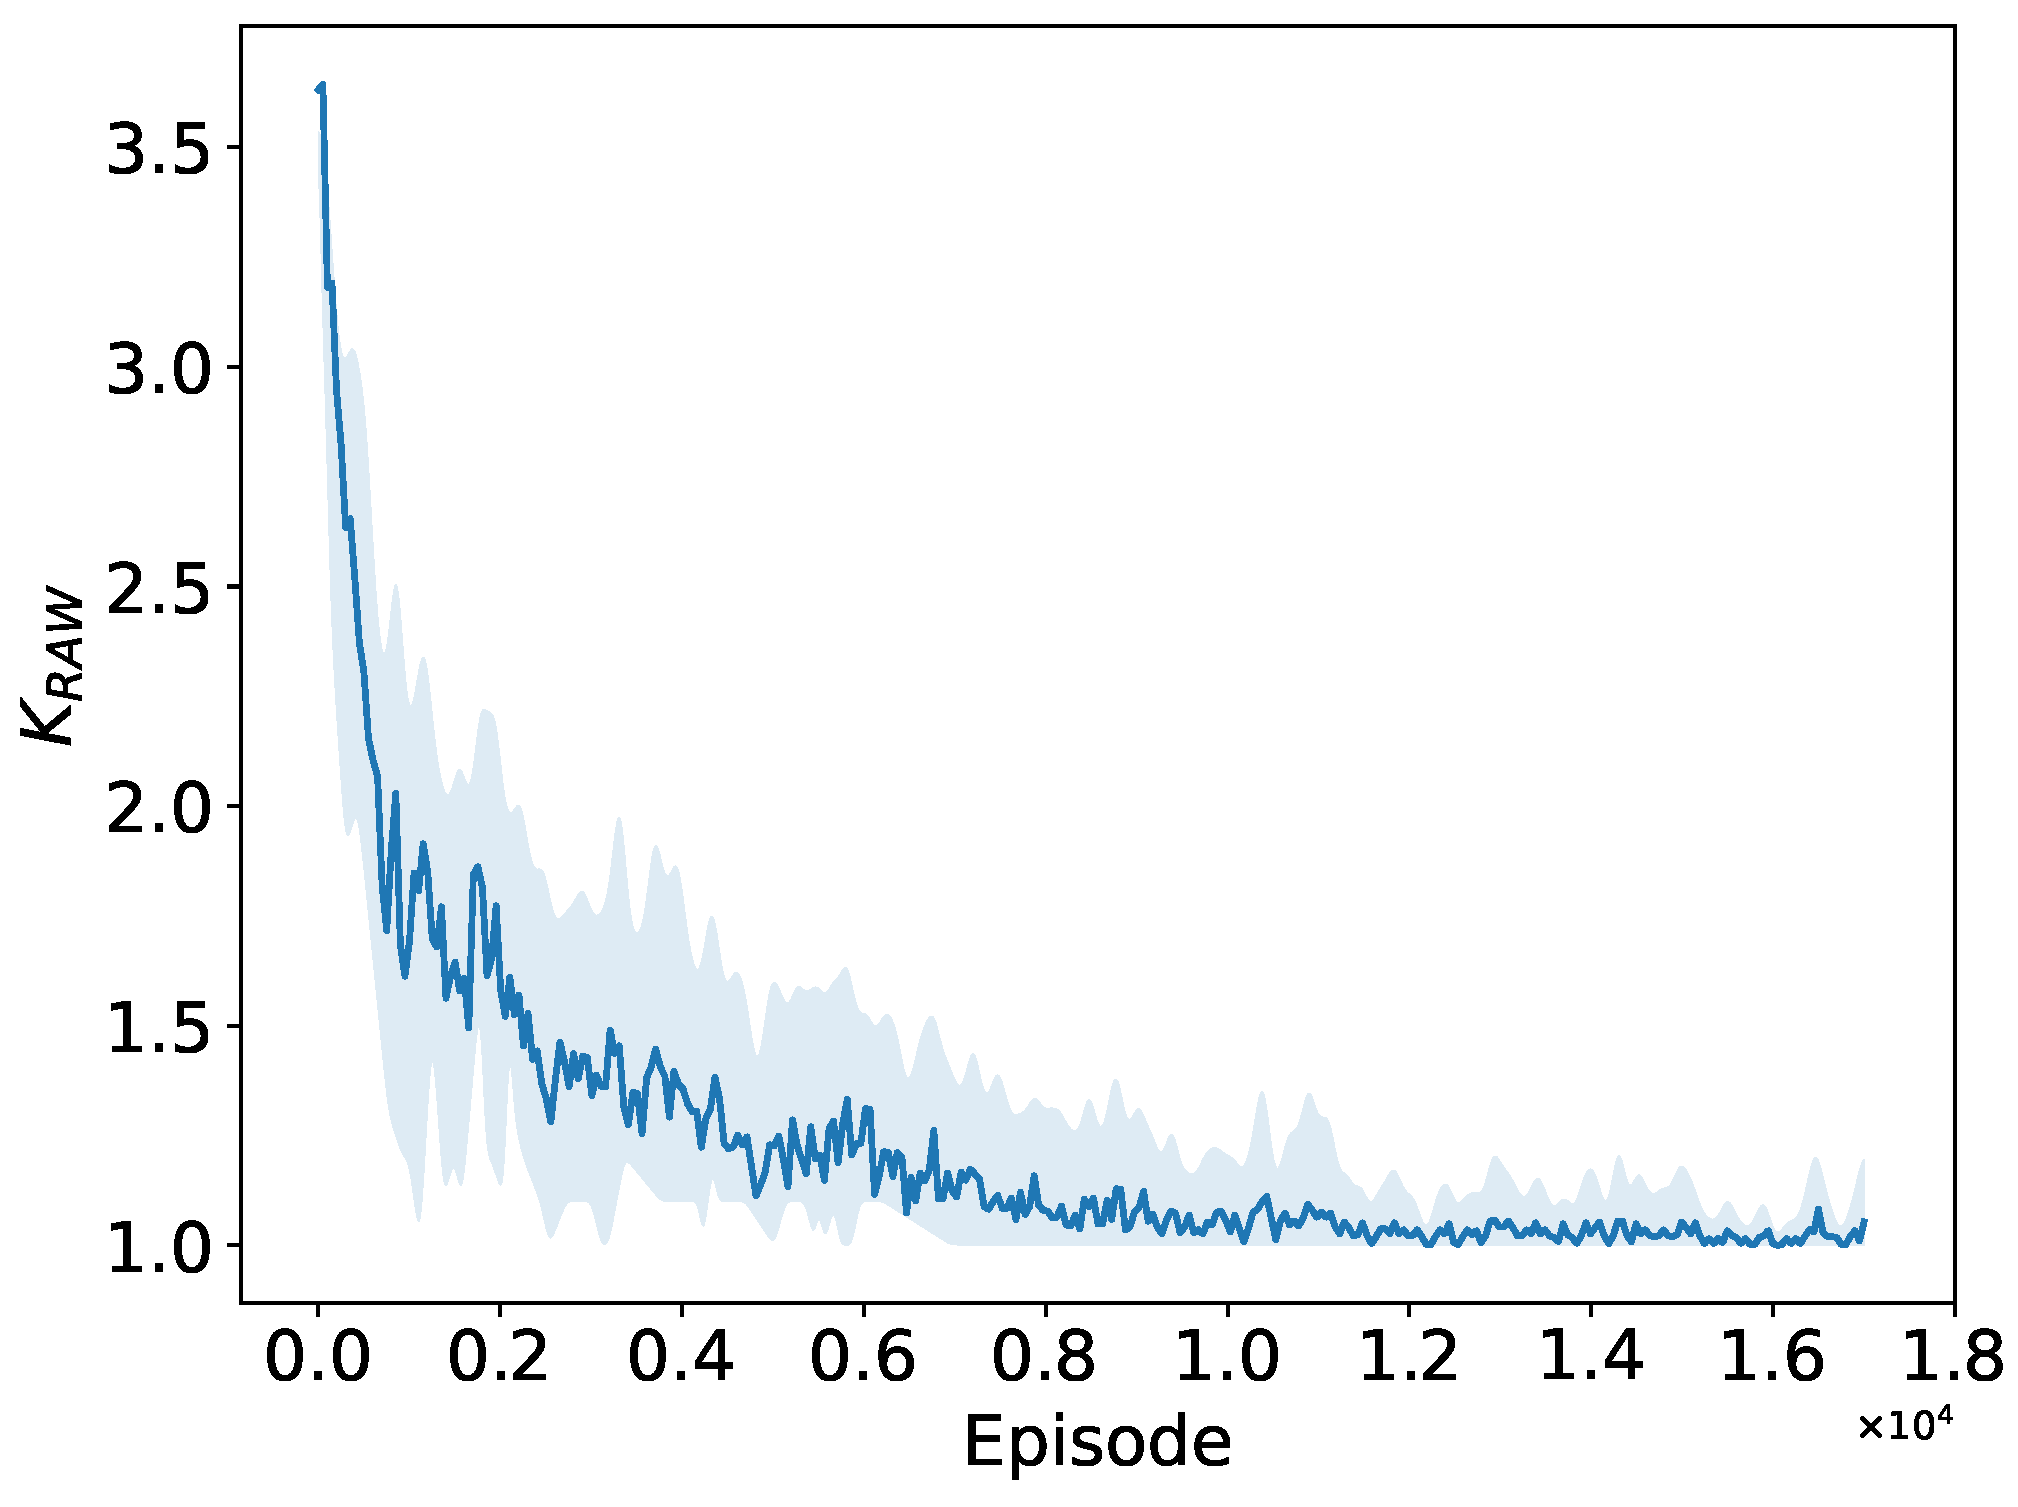
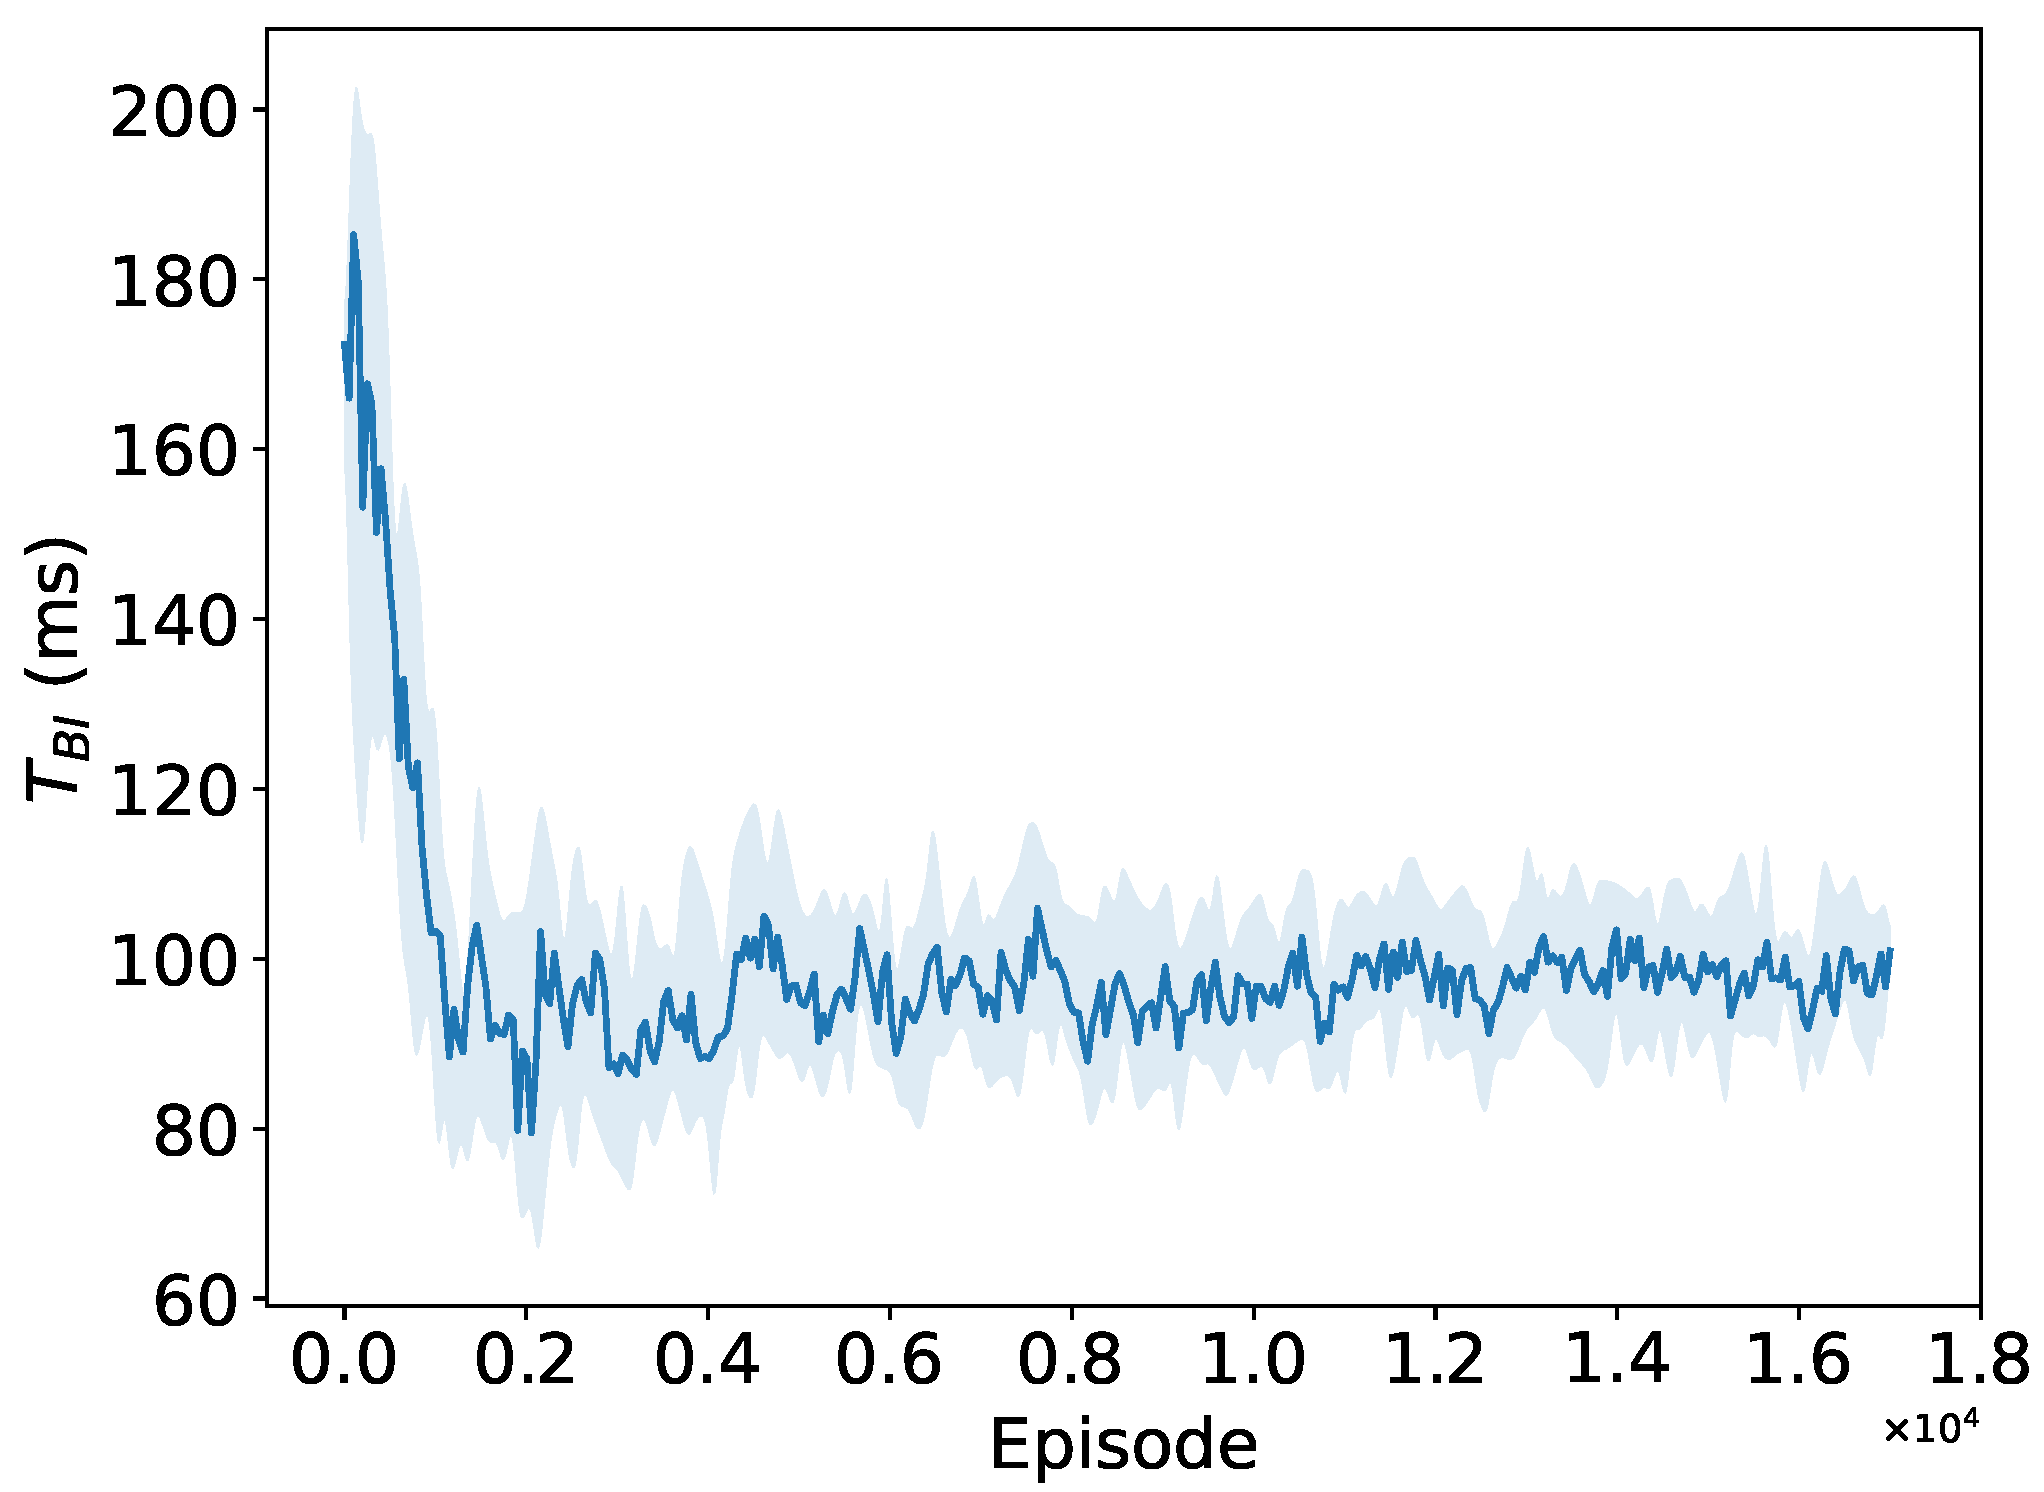
| Parameters | Value |
|---|---|
| Wi-Fi channel configuration | MCS 0, 2 MHz |
| Data rate | 650 kbit/s |
| Traffic type | UDP |
| Payload size | 100 Bytes |
| Number of STAs | 60 (basic setting) |
| Number of RAW group | 1 (basic setting) |
| Coverage Radius | 300 m |
| Training episode | MAX = 10000 |
| Parameters | Value |
|---|---|
| Wi-Fi channel configuration | MCS 0, 2 MHz |
| Data rate | 650 Kbit/s |
| Traffic type | UDP |
| Payload size | 100 Bytes |
| Number of Node | 150 (basic setting) |
| Coverage Radius | 300 m |
| Training episode | MAX = 20000 |
Disclaimer/Publisher’s Note: The statements, opinions and data contained in all publications are solely those of the individual author(s) and contributor(s) and not of MDPI and/or the editor(s). MDPI and/or the editor(s) disclaim responsibility for any injury to people or property resulting from any ideas, methods, instructions or products referred to in the content. |
© 2024 by the authors. Licensee MDPI, Basel, Switzerland. This article is an open access article distributed under the terms and conditions of the Creative Commons Attribution (CC BY) license (http://creativecommons.org/licenses/by/4.0/).


