Preprint
Article

Vesicle Morphogenesis in Amphiphilic Triblock Copolymer Solutions

Altmetrics

Downloads

108

Views

31

Comments

0

A peer-reviewed article of this preprint also exists.

Submitted:

01 April 2024

Posted:

02 April 2024

You are already at the latest version

Alerts
Abstract
Coarse-grained molecular dynamics simulations are employed to investigate the spatiotemporal evolution of vesicles (polymersomes) by the self-assembly of randomly distributed amphiphilic BAB triblock copolymers with hydrophilic A and hydrophobic B blocks in an aqueous solution. The vesiculation pathway consists of several intermediate structures, such as an interconnected network of copolymer aggregates, a cage of cylindrical micelles and a lamellar cage. The cage-to-vesicle transition occurs at a constant aggregation number and practically eliminates the hydrophobic interfacial area between the B block and solvent. Molecular reorganization under-lying the sequence of morphology transitions from a cage-like aggregate to a vesicle is nearly isentropic. The end-to-end distances of isolated copolymer chains in solution and those within a vesicular assembly follow log normal probability distributions. This is attributed to the pre-ponderance of folded chain configurations in which the two hydrophobic end groups of a given chain stay close to each other. However, the probability distribution of end-to-end distances is broader for chains within the vesicle as compared to that of a single chain. This is due to the swelling of the folded configurations within the hydrophobic bilayer. Increasing the hydropho-bicity of the B block reduces the vesiculation time without qualitatively altering the self-assembly pathway.
Keywords: 
Subject: Chemistry and Materials Science  -   Chemical Engineering

1. Introduction

Block copolymers (BCPs) have been a focal point of research for several decades. They have been engineered to produce various morphologies by altering the combinations of chemically distinct polymer segments that interact selectively with their environment, such as an aqueous/organic solvent or a polymer matrix. The ability to tailor morphological features by the manipulation polymer chain length, composition, and monomer chemistry has led to their applications in areas such as advanced materials manufacturing, catalysis, emulsification, environmental remediation, targeted drug delivery, gene therapy and medical diagnostics [1,2,3,4,5,6,7,8,9,10,11,12].
While several experimental studies have shed light on BCP phase behavior in solutions, a comprehensive theoretical understanding of the energetic and entropic factors driving morphological changes is only slowly emerging [13,14,15,16,17]. Real-time visualization of the self-assembly processes in copolymer solutions is challenging due to the limitations of current imaging technologies, often leading to reliance on cryogenic Transmission Electron Microscopy (cryo-TEM) imaging or nuclear magnetic resonance (NMR) spectroscopy for morphology characterization [18,19]. Shape transitions in BCP systems are often interpreted using simple geometric models based on the elegant packing parameter concept [13]. However, experimental [16,17,20,21,22,23,24,25] and molecular/mesoscopic simulation [26,27,28,29,30,31,32,33,34,35,36,37,38,39,40,41,42] studies have revealed an extraordinary diversity in BCP morphologies with complex topological and interfacial characteristics.
The self-assembly in BAB triblock copolymer solutions in which B and A represent the solvophobic and solvophilic blocks, respectively, was investigated by Kotaka et al. [43] who reported that poly(methylmethacrylate)-polystyrene-poly(methylmethacrylate) BCPs in a toluene-p-cymene (pCY) solvent mixture with high pCY content form highly branched structures. Balsara et al. [44] suggested that micellization in BAB triblock solutions with solvophilic A blocks could lead to morphologies with B-rich cores surrounded by loops of A segments. A series of quasi-elastic light scattering experiments conducted on poly(vinylpyridine)-polystyrene-poly(vinylpyridine) solutions in toluene which preferentially solvates the polystyrene block confirmed only the presence of individual micelles [44]. However, certain BCP-solvent combinations promote the formation of networks in which adjacent solvophobic spherical aggregates are connected by extended A strands. Such branched structures are arguably thermodynamically favorable since they avoid the entropic penalty associated with loop formation. In subsequent experiments with different triblock polymer-solvent systems, network structures facilitated by extended solvophilic segments were directly observed or inferred [45,46,47,48,49,50,51,52]. Overall, the evolution and stability of such structures depend on the entropic and energetic contributions to the system free energy which are in turn dependent on the molecular architecture and polymer-solvent interactions.
Depending on the chain length, mole fraction of A/B and monomer chemistry, BAB and ABA copolymers can form different nanostructures, such as lamellae, star-/flower-like micelles, and vesicles [53,54,55]. In general, BAB architectures with solvents with relative preference to the A block readily form bilayers and vesicles (polymersomes) [56,57,58,59,60,61]. Hence, they are excellent candidates for the synthesis of vesicles which are extensively used to encapsulate therapeutic agents for targeted drug delivery [62,63] or stimuli-responsive nanoparticles for application in medical imaging [64]. In comparison, ABA polymers tend to readily form network structures and are often used to produce thermoreversible gels [65,66,67].
Self-consistent field theory [30,31,32], dissipative particle dynamics (DPD) [33,34,35,36,37,38,39,40,41], and coarse-grained molecular dynamics (CGMD) simulations with prescribed/biased initial conditions [28,29,42] have been employed to study bilayer to vesicle transition, and kinetics of copolymer exchange between self-assembled aggregates in BCP solutions. Further, CGMD simulations that account for solvent-mediated hydrophobic interactions implicitly have been used to study differences in copolymer architecture (linear vs. bottlebrush) on self-assembly in solution [68] and shape deformation of polymersomes induced by osmotic pressure stress [69]. Mattice et al. used Monte Carlo simulations to study self-assembly in ABA copolymers [70,71,72] and found that they form a rich variety of structures. In their simulations, the formation of branched structures in ABA triblock copolymer solutions was observed under conditions in which the corresponding AB diblock copolymers would provide steric stabilization for a polymer colloid. Chen et al. [73] explored the self-assembly pathways in coil-rod-coil triblock copolymers in a rod-selective solvent using DPD simulations and constructed a phase diagram of the predicted morphologies. They observed the formation of different types of micelles while changing the relative block fractions and rod length. These authors also identified a kinetic process leading to vesiculation that involved intermediate structures such as rodlike micelles and lamellae, as observed in CGMD simulations of AB BCPs [27]. Han et al. [74] reported two mechanisms of vesicle formation by ABA polymers through Monte Carlo simulations, which are facilitated by either solvent diffusion into a spherical micelle or the deformation of a lamellar structure. Kangarlou et al. [75] performed CGMD simulations of polyethylene oxide molecules end-capped with cholesterol in water by using the MARTINI force field and predicted the formations of flower-like micelles. Song et al. [76] conducted a Monte Carlo simulation study on the effect of the hydrophilicity of the B block on the self-assembly of cyclic AB and BAB polymers. They found that increasing the compatibility between the B block and solvent results in a sequence of morphological changes in the following order: network structures, cylindrical micelles, disklike (lamellar) and toroidal-like micelles, vesicles, and multicompartment vesicles.
Despite the insights gained from the abovementioned studies, simulations with near molecular scale resolution that capture the real-time evolution of the self-assembly process in the presence of explicit solvent-mediated interactions in triblock copolymer solutions are lacking. As isolated copolymers dispersed within a solvent are brought together by thermodynamic forces to form a molecular assembly, their individual configurations undergo significant changes due to inter-chain interactions. Our previous work on vesicle formation in AB BCPs [27] revealed that once a molecular aggregate of a critical size is formed, isentropic reorganization of the polymer chains within a constrained geometrical environment directs the pathway of morphology evolution, guided by the motif of reducing hydrophobic contacts. CGMD simulations of vesiculation in BAB BCPs reported in this work track configurational changes at the single chain level and hence provide a fuller understanding of the energetic and entropic mechanisms underlying the self-assembly process.
The equilibrium configurations of BAB and AB copolymers in solvents with greater affinity to the A block are qualitatively different. A comparison of the probability distribution functions of the magnitude of the end-to-end vector of AB and BAB polymers of the same chain length and A/B molar ratio is provided in the Figure S1 in the Supplementary Materials along with depictions of representative chain topologies. Specifically, the most probable configuration for AB copolymers corresponds to a semi-stretched state. In comparison, BAB copolymers exhibit more complex configurational dynamics resulting in dominant equilibrium topologies that resemble hairpins, rings, and “ρ” shapes, in which a hydrophobic end group stays close to another hydrophobic portion of the chain. Such differences in chain architecture/topology could have a pronounced influence on vesiculation pathways. This is explored in this work by performing CGMD simulations of vesicle formation in BAB copolymer solutions.
CGMD simulations reported in this work are adapted from previous studies on self-assembly, shape transitions, and rheology of surfactant solutions [26,27,77,78,79,80,81,82,83,84]. They utilize the MARTINI coarse-graining approach and force fields [85]. These simulations provide a detailed picture of vesicle formation from an initially homogeneous copolymer solution, capturing various intermediate (transient) morphologies. We present the simulation methodologies and data analysis techniques in Section 2, results in Section 3, and conclusions in Section 4.

2. Methods

2.1. Methods and Software

The force field constraints of the molecular models used in this work were based on the requirements of the MARTINI force field [85].
The stretching and bending interactions between bonded beads were modeled by weak harmonic potentials Vb and Vθ, respectively, given by Equations (1) and (2) below:
V b   ( b ) = 1 2 K b ( b b 0 ) 2
V θ   ( θ ) = 1 2 K θ ( c o s ( θ ) c o s ( θ 0 ) ) 2
where b0 and θ0 represented the equilibrium bond distance and equilibrium bond angle at the minimum energy configuration, respectively, and Kb and Kθ represented constants associated with bond stretching and bending energies, respectively. The non-bonded interactions between beads i and j were described by a 6–12 Lennard−Jones (LJ) potential given by
V L J r i j = C i j 12 r 12 C i j 6 r 6 .
Equation (3) can also be written as
V L J r i j = 4 ε i j σ i j r 12 σ i j r 6 ,
where
C i j ( 12 ) = 4 ε i j σ i j 12   and   C i j ( 6 ) = 4 ε i j σ i j 6 .
In the above equations, r represents the distance between beads i and j, ε i j is the depth (minimum) of the potential well (energy function), and σ i j is the distance at which V L J is zero. ε i j and σ i j are also referred to as the interaction strength and cutoff length, respectively.
MARTINI force field requires the LJ potential to be shifted smoothly to 0 between 0.9 and 1.2 nm, rather than using a hard cutoff to avoid singularities in the computation of the inter-particle forces. This is achieved by using a potential−switch function SV given by
S V r i j = C i j 12 S 12 C i j 6 S 6 ,
where
S α = 1 r α C   ;   r r s h i f t 1 r α A 3 r r s h i f t 3 B 4 r r s h i f t 4 C   ;   r s h i f t < r r c u t 0   ;   r > r c u t
α = 6   o r   12 .
In Equation (7), the parameters A, B, and C are defined by
A = α α + 4 r c u t α + 1 r s h i f t r c u t α + 2 r c u t r s h i f t 2 ,
B = α ( α + 3 ) r c u t ( α + 1 ) r s h i f t r c u t α + 2 ( r c u t r s h i f t ) 3 ,
and
C = 1 r c u t α A 3 r c u t r s h i f t 3 B 4 r c u t r s h i f t 4 ,
where values of r s h i f t = 0.9 nm and r c u t = 1.2 nm are used. The force field parameter values used in this study are listed in Supplementary Materials as Tables S1–S3.
In the present simulations, water (four molecules cluster, represented by W), PB monomer (represented by B) and PEO monomer (represented by A) are modeled by bead types P4, C4, SNda, respectively [85]. 400,000 water beads, 40,000 antifreeze water beads (modeled by bead type WF) [86], and 3883 polymer chains consisting of five PB, ten PEO and five PB beads (10.7 wt%) were randomly placed in an initial cubical box of linear dimension 40 nm using PACKMOL 20.14.0 software [87]. The simulations were performed using the Gromacs 2020.2 MD software. The reference pressure and temperature were 1 bar and 300 K, respectively. First, simulations are conducted to minimize the energy of the initial system by using the steepest descent algorithm. This is followed by a short (2 ns in this work) NVT simulation to equilibrate the system at a desired temperature to ensure algorithmic stability. Subsequently, a sufficiently long NPT simulation (production run) is carried out (600 ns in this work). In the subsequent discussions, the state of the system at the start of the NPT simulations is referred to as the initial condition (t = 0). More details about the simulation are provided in Supplementary Materials as Section S1. The molecular visualization was performed using VMD 1.9.3. Data analysis and graphing were performed using MatlabTM 2023, Microsoft 365TM, Visual C++ 2022, and OriginlabTM 2022.

2.2. Data Analytics

Discrete spatiotemporal data generated from the CGMD simulations were analyzed to identify copolymer clusters. Any two beads with center-to-center separation less than the cutoff distance are regarded as part of a cluster (aggregate). Further, within any bead in each cluster, there exists at least one bead at a distance less than the cutoff value. In this study, we use 0.5 nm as the cutoff distance. This selection is based on the cutoff distance of 0.47 nm for non-bonded LJ interactions between PB and PEO monomers. We also calculated solvent-accessible surface area (SASA), which may be interpreted as the surface area of the solvent-polymer interface. Specifically, SASA is measured as the area circumscribed by the motion of the center of a spherical probe that slides along the periphery of the polymer beads that constitute a cluster [88].

2.2.1. Information Entropy (H)

To quantify the changes in the configurational entropy associated with the packing of copolymers within various intermediate assemblies leading to vesiculation, we calculated the probability distribution function (pdf) of the extension of the polymer chains. First, the end-to-end distance of each chain (Q) in the cluster was calculated. Given p(Q), we calculated the information entropy H of the structure using its standard definition as H(Q) ≡ ∑ p(Q) ln (p(Q)), where the discrete summation was carried out for the ensemble of copolymers within a cluster.

2.2.2. Pair Correlation Function ( g ( r )

)
Pair correlation function ( g ( r ) ) describes how the density of B, A, or W beads varies as a function of distance from the center of mass of a cluster along the radial direction. A larger value of g signifies tighter packing of the beads. In general, g shows (local density)/(overall density). g ( r ) is given by
g ( r ) = < ρ ( r ) > ρ = 1 ρ i = 1 N δ 1 ( r i r ) δ 2 ( r + r r i ) 1 V ( r )
where < ρ ( r ) > is the average density of beads at a distance r from the center of mass, ρ = 3 N m / ( 4 π r m a x 3 ) is the average cluster density, Nm is the total number of monomer beads contained in the cluster, r m a x is the distance of the farthest bead from the center of mass of the cluster, V ( r ) = ( 4 / 3 ) π ( r + r ) 3 r 3 and
δ 1 ( x ) = 0 ,   i f   x < 0 1 ,   i f   x 0   and   δ 2 ( x ) = 0 ,   i f   x 0 1 ,   i f   x > 0 .
Equation (12) means beads at the inner boundary are included while those at the outer boundary are excluded. In the calculation, we used ∆r = 0.1 nm.

3. Results and Discussion

3.1. Morphology Evolution

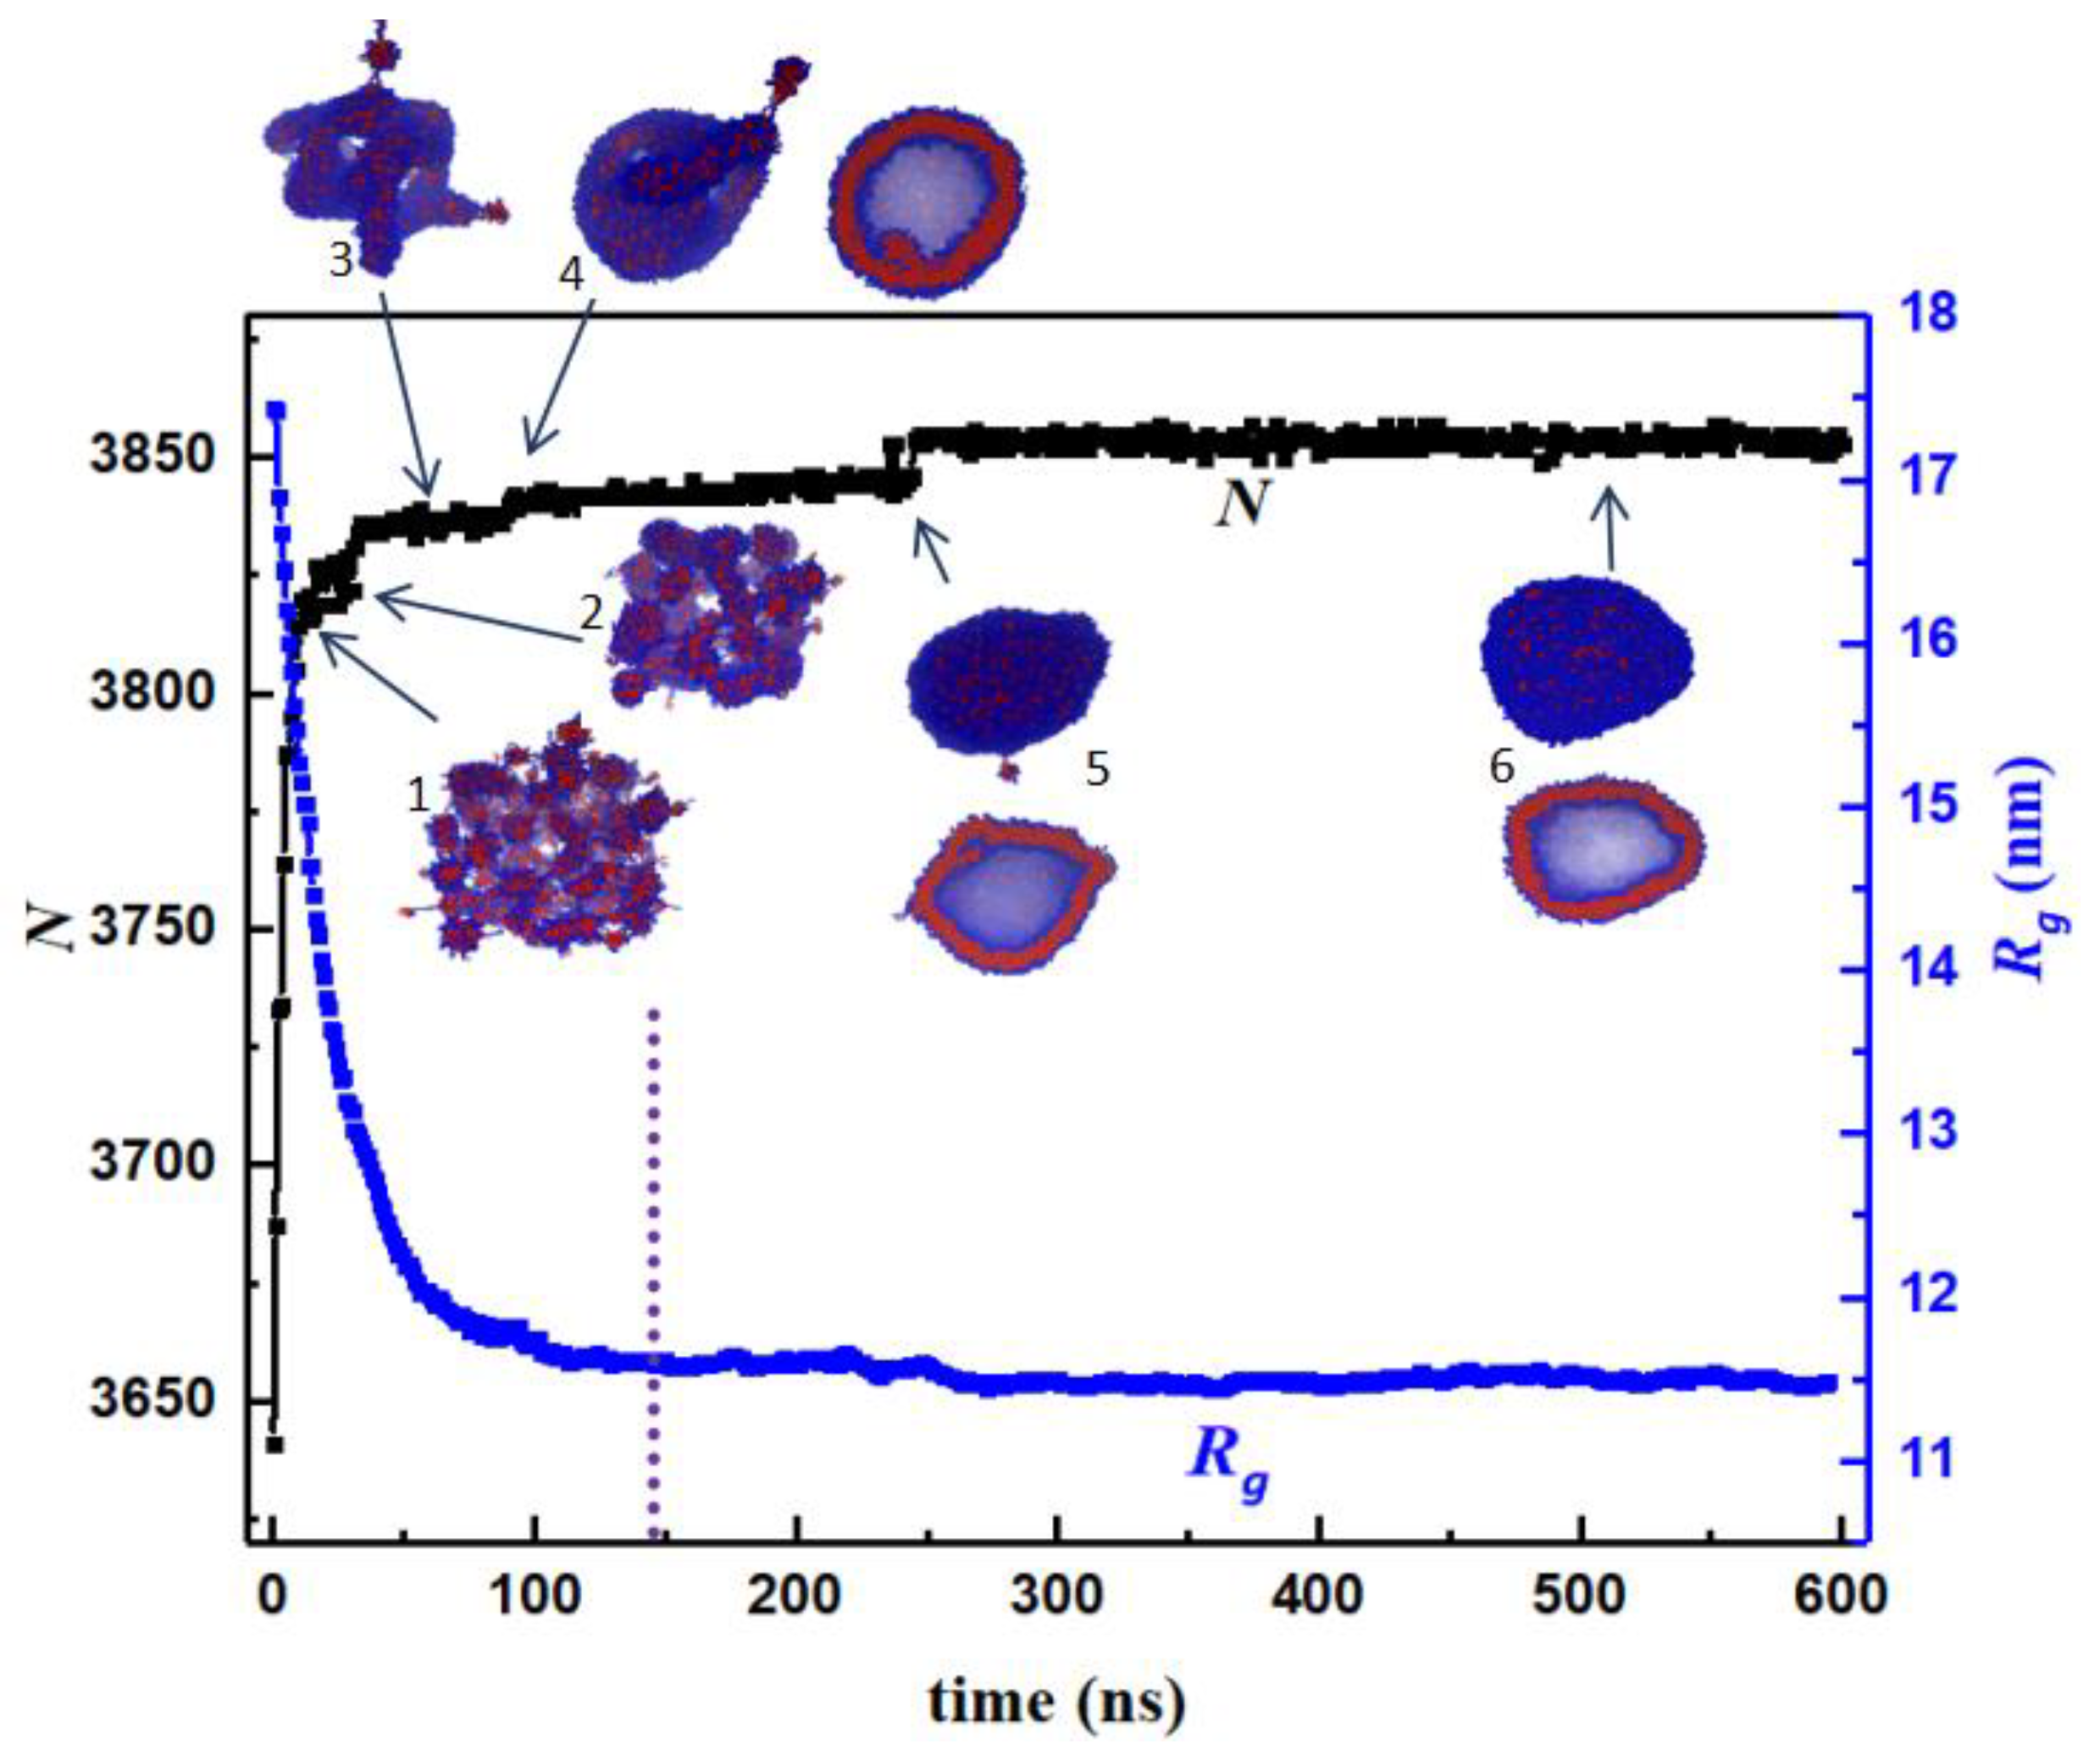
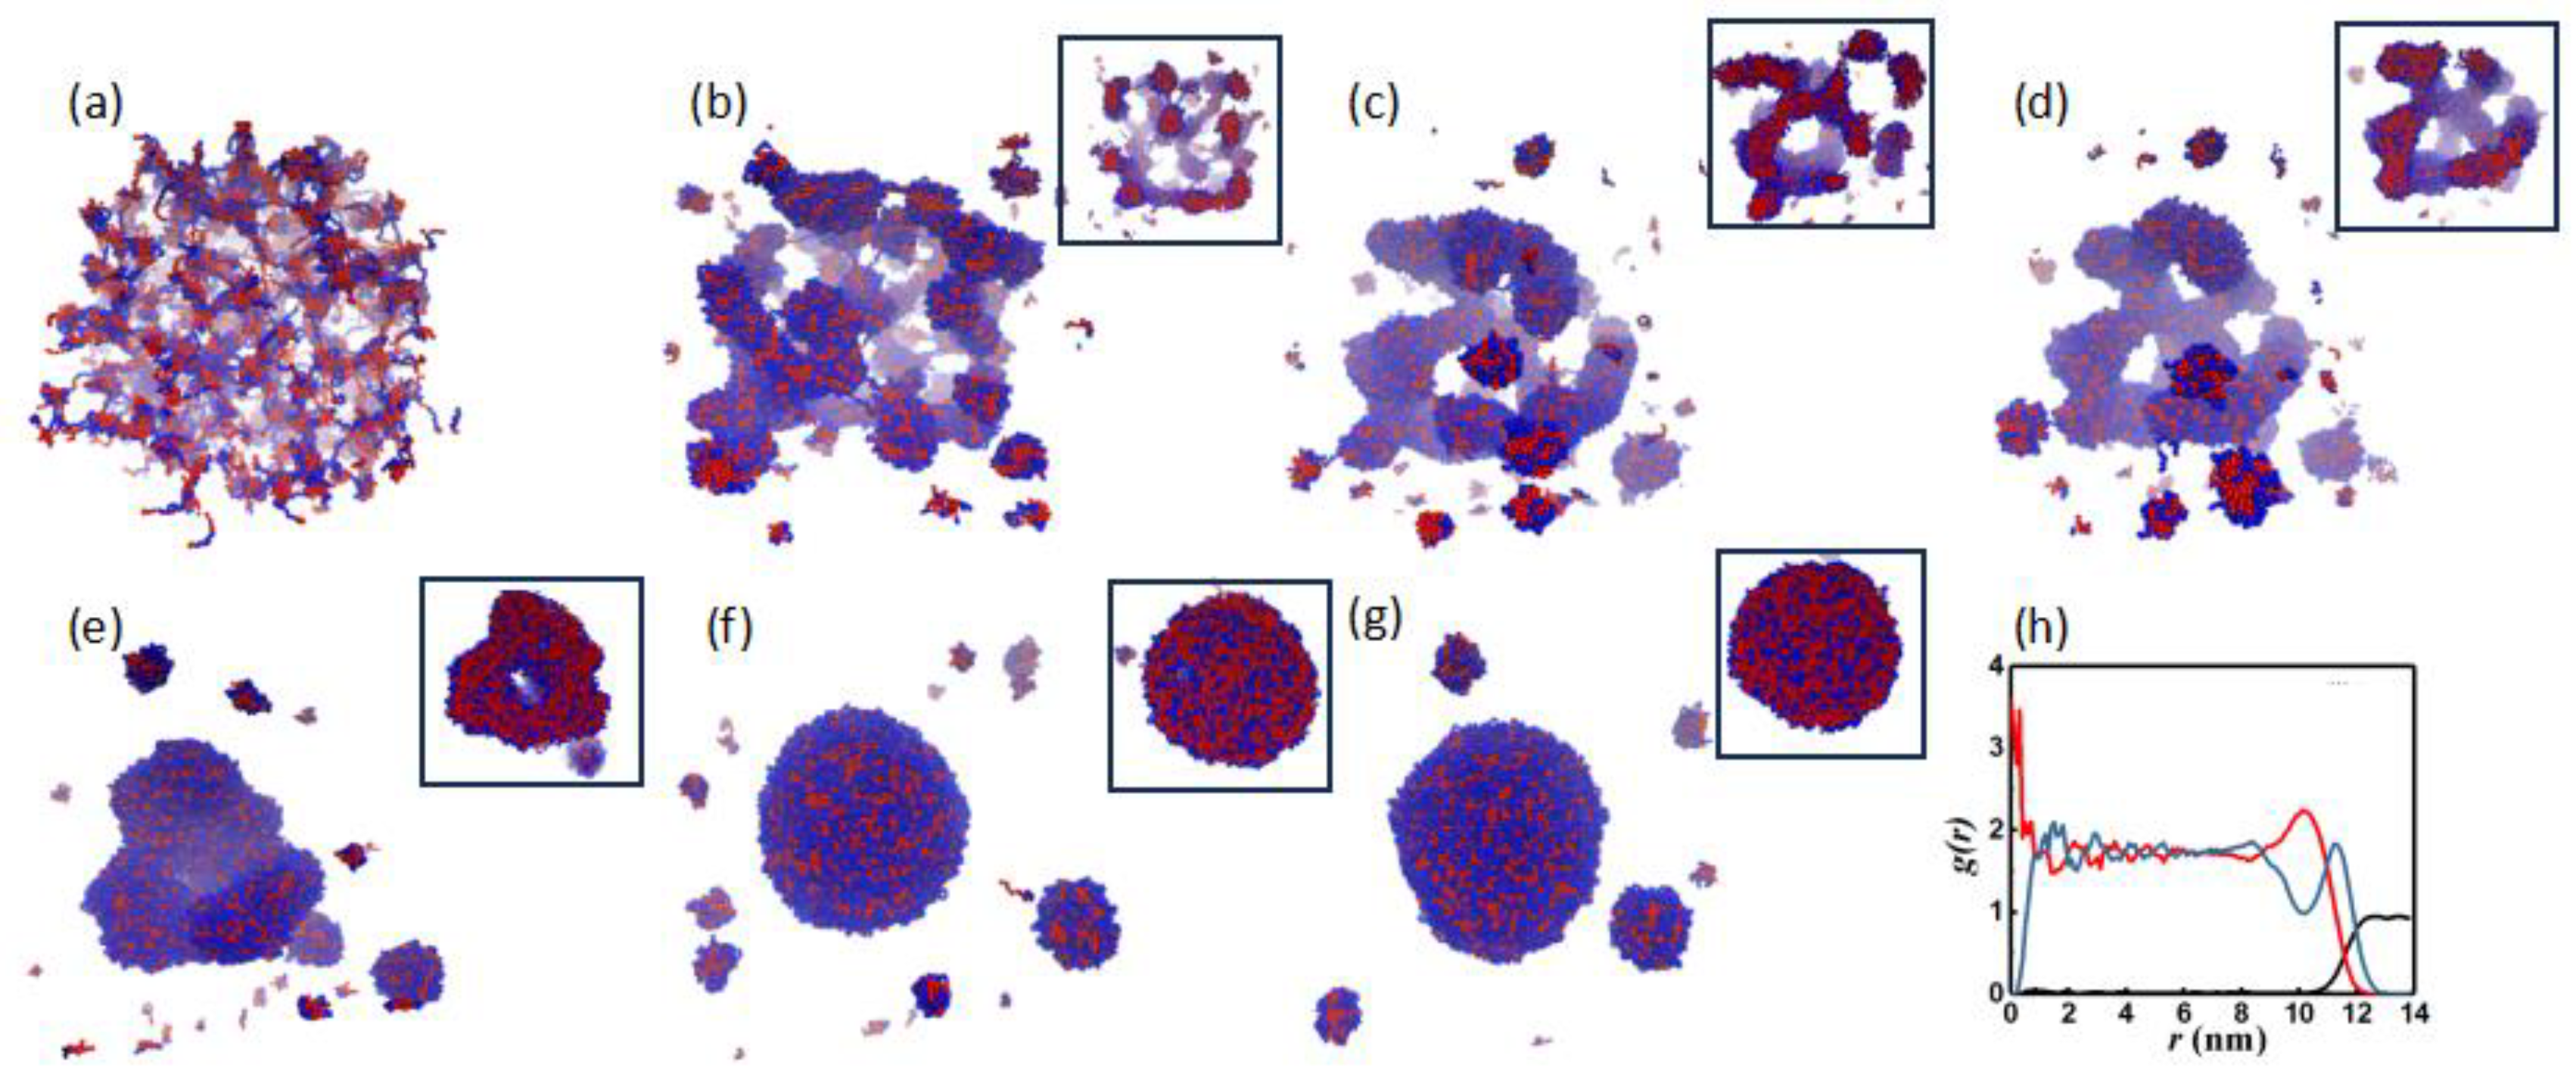
Figure 1 illustrates the structure evolution during vesiculation in BAB copolymers. The polymers form core (B)-corona (A) micelles which are interconnected by bridges of elongated A segments: see Figure 1a. This structure is unstable due to its relatively large solvent/polymer interfacial area. Hence, it coarsens by the merger between neighboring micelles and, to a lesser extent, by the incorporation of small polymer aggregates from the solution (Figure 1b). The coarsening process continues until a cage-like morphology with a circumferential mesh of cylindrical micelles is established (Figure 1c,d). The cylindrical micelles rearrange and coalesce with adjacent structures to form a large lamellar (bilayer) shell with holes (Figure 1e). This structure subsequently evolves into a fully closed bilayer (vesicle) (Figure 1f,g). As seen from Figure 2, the closure of the bilayer is accompanied by a reduction in the volume (or equivalently the radius of gyration Rg) of the structure. In the early stages of structure evolution, the aggregation number N grows rapidly due to copolymer aggregation. The step changes in N seen in the later stages of morphology evolution are caused by the addition of small polymer aggregates into the primary structure. Overall, once the cage-like structure shown in Figure 1d is formed, the vesiculation process is facilitated largely through its reorganization at a nearly constant aggregation number. Figure 1h shows the radial distribution functions (rdfs) of water as well as monomers A and B for the vesicle depicted in Figure 1g. It can be inferred that the vesicle has a water core of radius of approximately 6 nm that does not contain any polymer. The vesicle wall has a diffuse double-layer structure with the rdfs exhibiting two well-defined A peaks on either side of the B-rich inner layer.
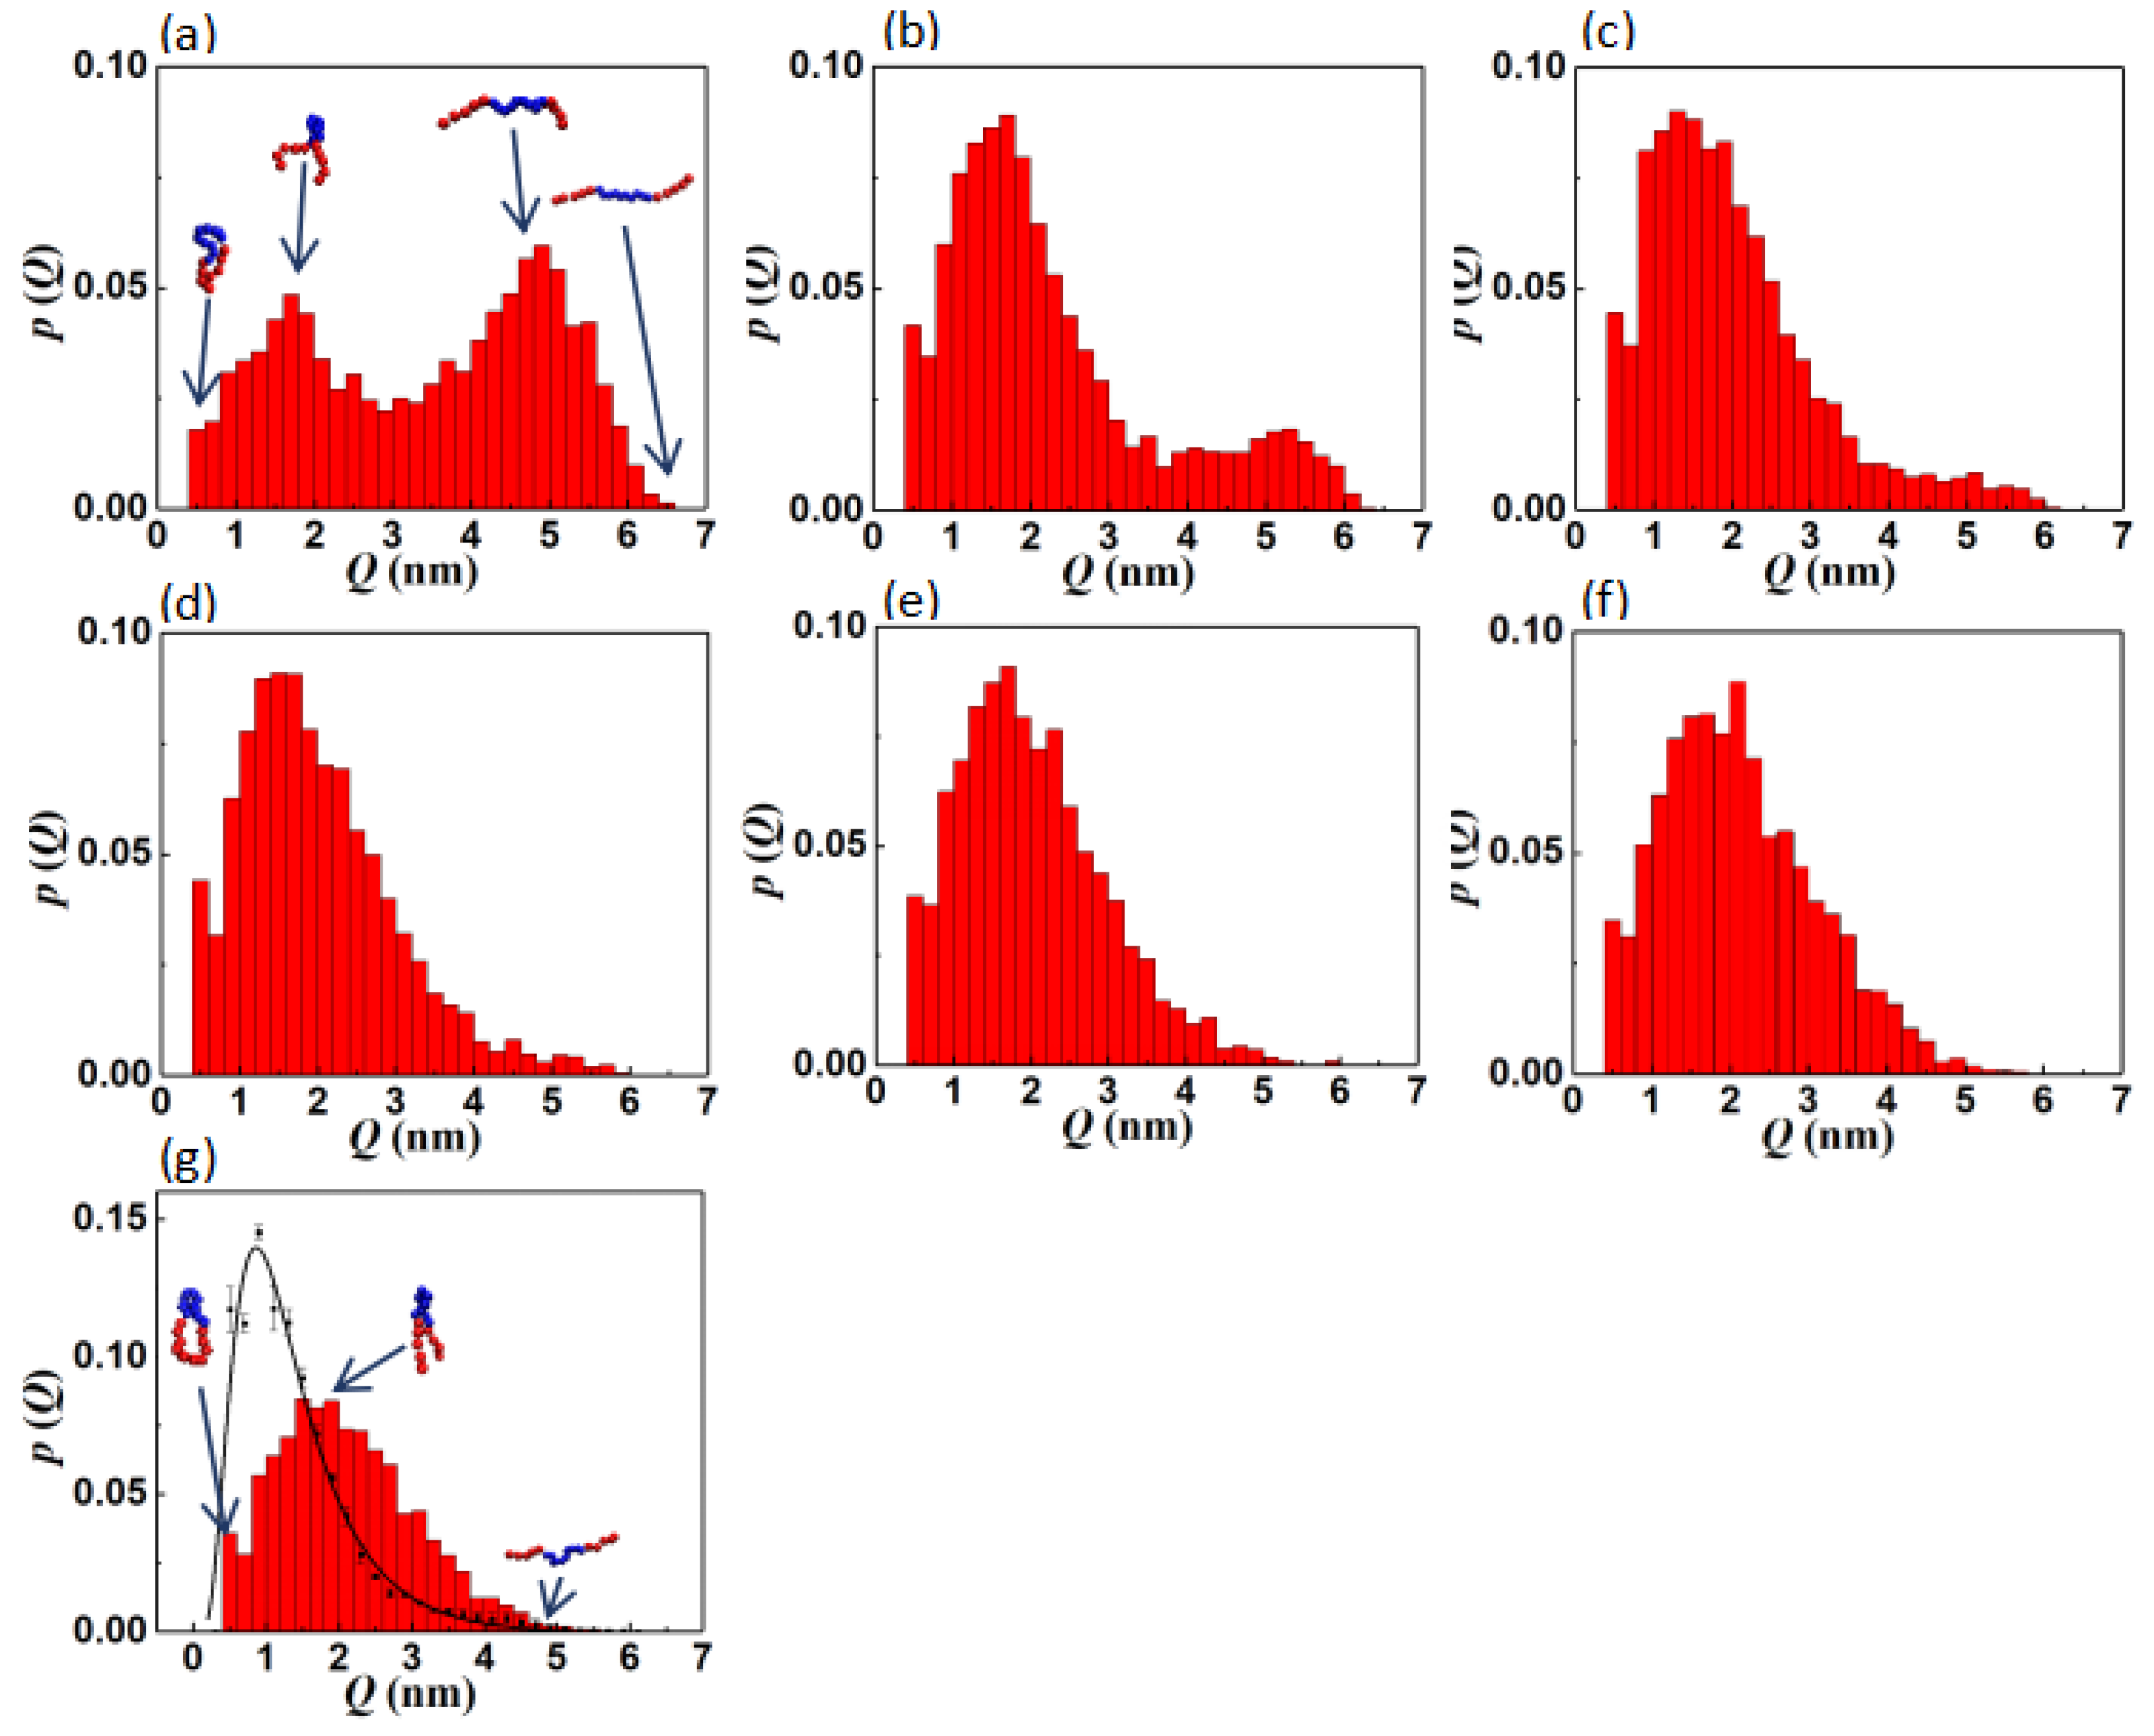
We studied the changes in the distribution of copolymer chain configurations during the vesiculation process. Figure 3a–g show the pdfs of the end-to-end distance Q of the polymer chains within the structures depicted in Figure 1a,g. The probability distribution function p(Q) for the interconnected micelle morphology shown in Figure 1a exhibits two prominent peaks, namely the one at the larger Q value (≈ 4.9 nm) corresponding to the stretched polymers that form the bridges between the micelles and the second at the lower Q value (≈ 1.7 nm) representing the folded configurations within the micelles. As the self-assembly process progresses, the peak at the larger Q value becomes smaller and eventually disappears implying that folded configurations become the predominant ones within the assemblies. There is a very small, albeit persistent, third peak at Q ≈ 0.5 nm which is close to the cut off distance for non-bonded interactions in the simulations. This corresponds to a relatively small number of ring-like polymer chains. In Figure 3g, p(Q) obtained from CGMD simulations of a single chain in solution is also shown for comparison. Polymer chains that constitute the vesicle exhibit a broader Q distribution compared to that of an isolated (single) chain in solution. The mutual affinity of B-type monomer pairs is greater than those of A-B and B-solvent pairs. This allows for the opening of the hairpin like configurations of the individual polymer chains within the B-rich inner layer of the vesicle, thereby resulting in greater end-to-end distances.

3.1.1. Interfacial Area and Information Entropy

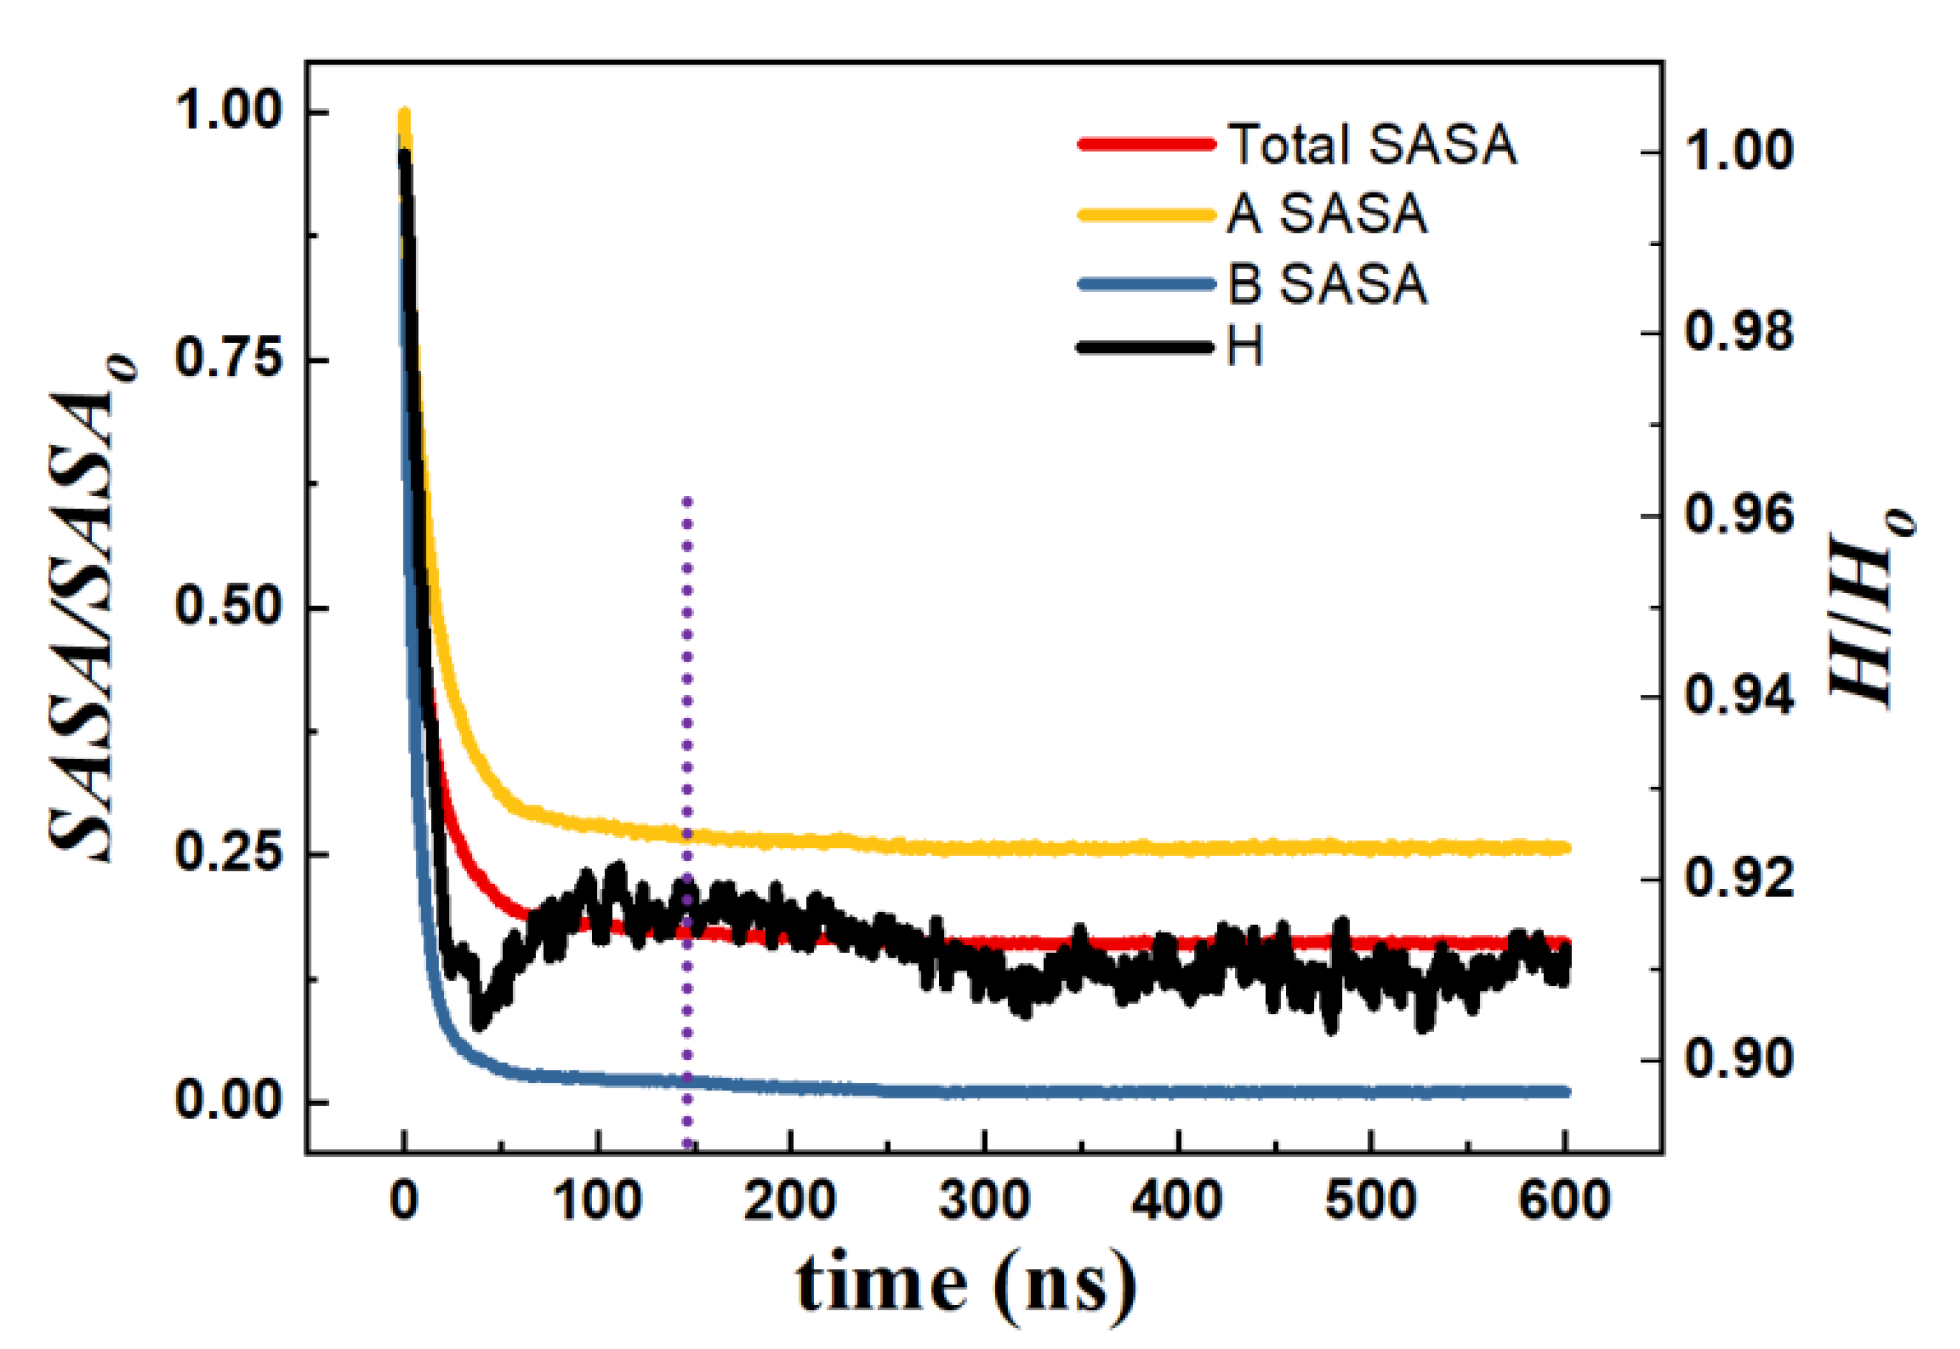
The variations in the SASA and H, normalized with respect to their initial values, accompanying vesiculation are shown in Figure 4. The polymer-solvent interfacial area decreases rapidly at the early stages of self-assembly. However, once the lamellar cage is formed at t ≈ 60 ns, the SASA does not change appreciably. The total SASA at equilibrium is approximately 16% of its initial value. As expected, the decrease in the relative SASA is greater for the hydrophobic segments (≈ 99%) than that for the hydrophilic ones (≈ 74%). In other words, self-assembly and reorganization of the copolymers are guided by the motif of almost entirely shielding the hydrophobic monomers from the solvent, i.e., to reduce the unfavorable interfacial energy of the hydrophobic interactions at the expense of gaining curvature energy. A qualitatively similar energetic motif of vesicle formation was inferred from CGMD simulations of AB copolymer solutions [27]. However, the vesiculation pathway in AB solutions consists of topologically simpler morphologies (spherical/rod-like micelles and rectangular/discoid lamella) compared to those depicted in Figure 1. The complex intermediate structures observed in BAB solutions may be a consequence of the remarkable diversity inherent in the single chain configurations produced by the selective A/B segmental interactions with the solvent as well as the relative differences in A-B and A-A pair affinities in triblock systems, as illustrated in Figure S1 in the Supplementary Materials.
The variations in H along the vesiculation pathway (≈ 9%) are modest compared to those in the SASA. When the cage-like structure (Figure 1d) is formed from the interconnected micelles (Figure 1a), the number of stretched chains is significantly reduced. This decreases H as seen in Figure 4. While a cage-like structure (≈ 40 ns) reorganizes into a vesicle (≈ 150 ns), H increases slightly. This can be attributed to the opening of the folded chain configurations due to increased attractive B-B pair interactions within the bilayer. The small decrease in H for t > 150 ns is due to the rearrangement of the copolymers within the closed bilayer to form a nearly spherical and compact vesicle. During this process, Rg also decreases by a very small amount (from 11.7 nm to 11.3 nm) (Figure 2).

3.2 Effect of Solvent Affinity of the Hydrophobic Segment on Self-Assembly

We further investigated the effect of the variation in hydrophobicity of the B block on the self-assembly mechanism. In the above simulations, bead type C4 from the MARTINI database, was used to model the B monomers. The set of force field parameters for this bead type, given in Table 1 in the Supplementary Materials mimics, a polybutadiene monomer. As mentioned in Section 2, the bead type SNda used for segment A models a polyethylene oxide monomer. To simulate variations in solvent affinity, we keep the bead type of the A segment unchanged and change that of the B segment. Specifically, we perform a set of simulations of self-assembly in 5B10A5B copolymer solutions in which the A monomer has the characteristics of type SNda and the B monomer is modeled by the bead type Cn, n = 1, 2, 3, 4, 5. The hydrophilicity of the Cn bead type is in the following order: C1 < C2 < C3 = C4 < C5. The difference between bead types C3 and C4 is that the latter is more attractive to A beads. The relevant force field parameters of the Cn beads are given in Table 1.
Simulations showed that the conclusions reached regarding the pathway of morphology evolution as well as variations in SASA and H presented in Section 3.1 are qualitatively unchanged for bead types C1 - C4: see Figure S2 in the Supplementary Materials for an illustration of the self-assembly process for the C1-type copolymer as well as Figure 5 for the variations in N, SASA and H for the various bead-types. However, the kinetics of self-assembly and vesiculation are influenced by the hydrophilicity of the B segment: the less hydrophilic the beads, the faster the vesicle formation process. For instance, as seen from Table 1, the vesicle formation time predicted for the copolymers with the C1-type B segment is nearly one half of that for the C3/C4-type cases. Further, the kinetics of vesiculation for C3- and C4-types are statistically indistinguishable, as evidenced by data provided in Table 1 and Figure 5.
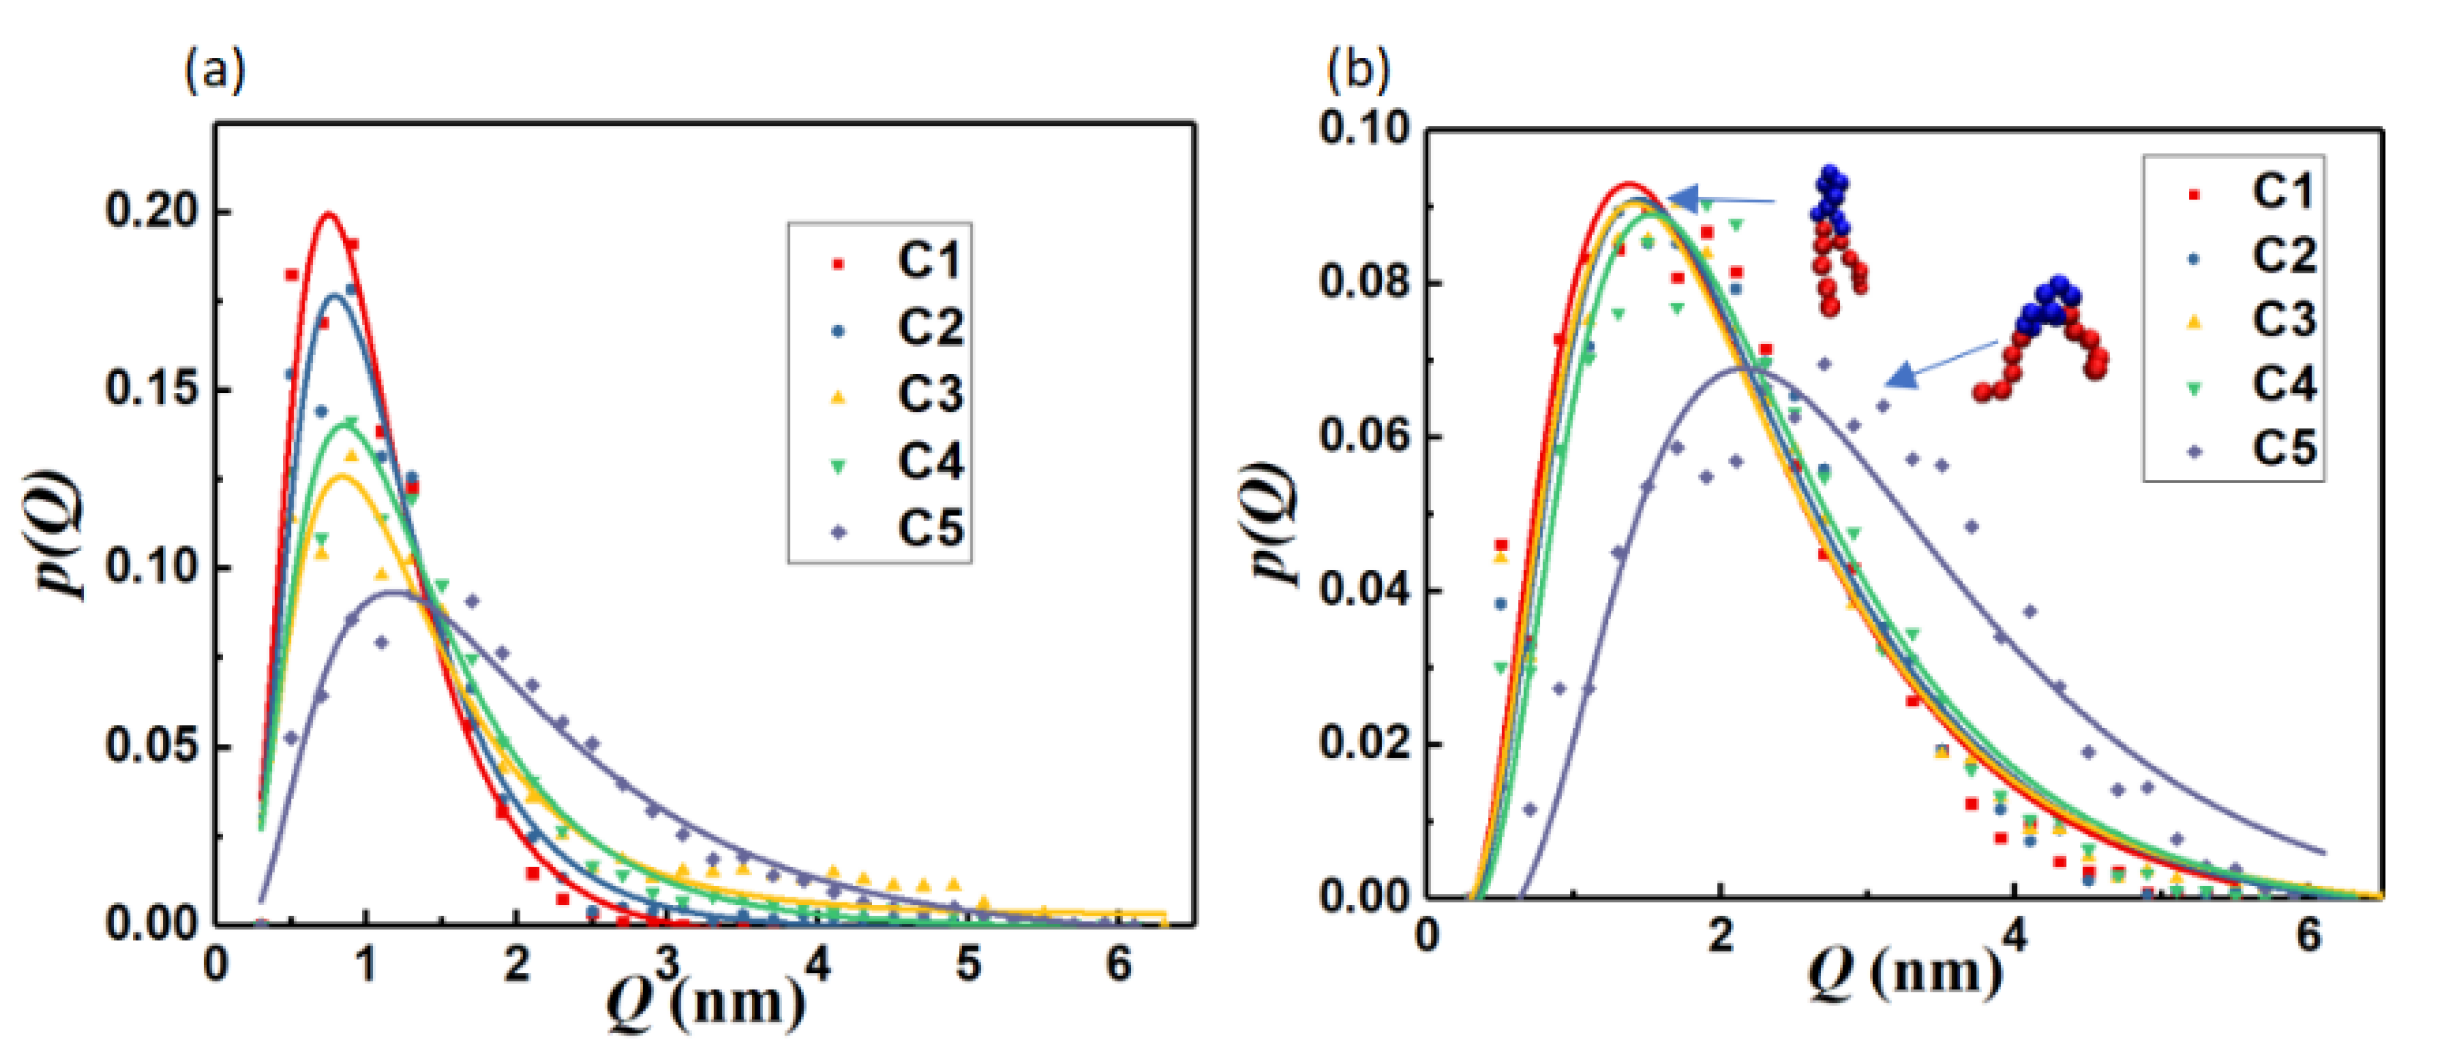
Figure 6 shows p(Q) of a single chain in solution at equilibrium and of chains within the equilibrium morphologies for copolymers with B monomers of different (C1−C5) characteristics. As the hydrophilicity of the B segment is increased, the distribution of chain lengths becomes broader as expected. Moreover, in all cases, the pdfs of the chains within the molecular assemblies are broader and exhibit a peak shift to larger Q values as compared to those of single chains. This is due to the swelling of chains within the B-rich regions of the bilayers. Further, the pdfs show a very good degree of fit to lognormal distributions as previously reported for AB copolymers [27].
The BCP architecture with the most hydrophilic B block (C5 beads) does not form vesicles but forms multilayered spherical micelles. Figure 7 shows the self-assembly pathway for the C5-type copolymers. Interconnected copolymer aggregates are formed at the early stages of self-assembly (Figure 7a). Subsequently, adjacent micelles aggregate to form short rods (Figure 7b). Up to this stage, the morphology evolution parallels those seen in vesicle forming BAB solutions (Figure 1 and Figure S2 in the Supplementary Materials). However, due to the enhanced hydrophilicity, the rod-like micelles of the C5-type BCPs merge with adjacent structures to form longer wormlike micelles with spatial distributions shown in Figure 7c,d. Fragments that break away from the largest (primary) structure, cause a decrease in Rg. The primary structure further shrinks to become a spherical multilayer micelle (Figure 7e,g). The rdfs plotted in Figure 7h clearly show a B-rich region in the micelle core surrounded by a shell that contains both A and B monomers inside and hydrophilic A segments at the solvent-micelle interface.

4. Conclusions

CGMD simulations of the real-time evolution of vesicles, starting with an initial condition of randomly distributed stretched BAB copolymer chains in an explicit solvent, have been performed to identify intermediate self-assembled states along the vesiculation pathway. The vesiculation process is facilitated by the rapid formation of interconnected spherical aggregates, merger of spherical aggregates to form a cage-like assembly made up of cylindrical micelles which reorganize into lamellar (bilayer) structures, and the closure of the lamellar cage to form a vesicle. SASA decreases monotonically during vesiculation, with a near (99%) elimination of the hydrophobic (B–solvent) interface. The transition from the cage-like to vesicle morphology occurs at practically constant aggregation number with negligible changes in configuration entropy. Such a vesiculation mechanism facilitated by the isentropic reorganization of an aggregate of a critical size (aggregation number) was also observed in the CGMD simulations of AB copolymer simulations [27]. However, the intermediate structures predicted in BAB systems are topologically complex in comparison to the regular transient shapes (spherical/rod-like, rectangular/discoid lamella) seen during the vesicle morphogenesis in AB diblock polymers. The end-to-end distance of a single chain at equilibrium and that of individual chains within the equilibrated vesicular structure follow lognormal probability distributions. However, the latter distribution is broader suggesting that the increased hydrophobicity (increase in the number of proximal B monomer pairs) within the bilayer results in the swelling of the hairpin-shaped BAB copolymer chains. The simulations were used to probe the influence of monomer chemistry on morphology evolution. Increasing the hydrophobicity of the B segments does not influence the self-assembly pathway. However, it makes the kinetics of vesiculation faster. Decreasing the hydrophilicity of the B segments prevents the formation of vesicles and promotes a molecular assembly process that results in multi-layered spherical micelles.

Supplementary Materials

The following supporting information can be downloaded at the website of this paper posted on Preprints.org. Section S1. Simulation Details. Table S1. Parameter values for non-bonded interactions for the BAB copolymer. Table S2. Parameter values for bond stretching interactions. Table S3. Parameter values for bond bending interactions. Figure S1. p(Q) vs. Q for an AB diblock and a BAB triblock copolymer. Typical chain configurations are shown alongside. Figure S2. Structure evolution for the C1-type B segment. (a) 0 ns, (b) 10 ns, (c) 20 ns, (d) 30 ns, (e) 40 ns, (f) 50 ns, (g) 150 ns, (h) 600 ns. (i) shows the cross section of the structure in panel (h).

Author Contributions

Conceptualization, supervision, project administration, funding acquisition, R.S.; methodology, investigation, resources, writing—original draft preparation, writing—review and editing, S.L., R.S.; software, validation and formal analysis, data curation, visualization, S.L. simulation of structure formation with different B-type beads: M.S., S.L. All authors have read and agreed to the published version of the manuscript.

Funding

This work was supported by the donors of ACS Petroleum Research Fund under grant #66629-ND9.

Data Availability Statement

Supporting data, figures and animations are provided in Supplementary Materials. Requests for additional data may be sent via email to the authors.

Acknowledgments

This research is supported in part through computational resources provided by Syracuse University. The authors gratefully acknowledge the funding from NSF award ACI-1341006 to support research computing in Syracuse. The visualization figures were made with VMD, which is developed with NIH support by the Theoretical and Computational Biophysics group at the Beckman Institute, University of Illinois at Urbana-Champaign. The authors gratefully acknowledge the developer of Gromacs software/manual.

Conflicts of Interest

The authors declare no conflict of interest.

References

  1. Bleul, R.; Thiermann, R.; Maskos, M. Techniques to Control Polymersome Size. Macromolecules 2015, 48, 7396–7409. [Google Scholar] [CrossRef]
  2. Karayianni, M.; Pispas, S. Block Copolymer Solution Self-Assembly: Recent Advances, Emerging Trends, and Applications. J. Polym. Sci. 2021, 59, 1874–1898. [Google Scholar] [CrossRef]
  3. Li, S.; Byrne, B.; Welsh, J.E.; Palmer, A.F. Self-Assembled Poly(Butadiene)-b-Poly(Ethylene Oxide) Polymersomes as Paclitaxel Carriers. Biotechnol. Prog. 2007, 23, 278–285. [Google Scholar] [CrossRef] [PubMed]
  4. Allen, C.; Eisenberg, A.; Mrsic, J.; Maysinger, D.; Eisenberg, A. PCL-b-PEO Micelles as a Delivery Vehicle for Fk506: Assessment of a Functional Recovery of Crushed Peripheral Nerve. Drug Deliv. 2000, 7, 139–145. [Google Scholar] [CrossRef] [PubMed]
  5. Allen, C.; Yu, Y.; Maysinger, D.; Eisenberg, A. Polycaprolactone-b-Poly(Ethylene Oxide) Block Copolymer Micelles as a Novel Drug Delivery Vehicle for Neurotrophic Agents Fk506 and l-685,818. Bioconjugate Chem. 1998, 9, 564–572. [Google Scholar] [CrossRef]
  6. Boucher-Jacobs, C.; Rabnawaz, M.; Katz, J.S.; Even, R.; Guironnet, D. Encapsulation of Catalyst in Block Copolymer Micelles for the Polymerization of Ethylene in Aqueous Medium. Nat. Commun. 2018, 9, 841. [Google Scholar] [CrossRef]
  7. Cuomo, F.; Ceglie, A.; De Leonardis, A.; Lopez, F. Polymer Capsules for Enzymatic Catalysis in Confined Environments. Catalysts 2018, 9, 1. [Google Scholar] [CrossRef]
  8. Peters, R.J.; Marguet, M.; Marais, S.; Fraaije, M.W.; van Hest, J.C.; Lecommandoux, S. Cascade Reactions in Multicompartmentalized Polymersomes. Angew. Chem. Int. Ed. 2013, 53, 146–150. [Google Scholar] [CrossRef]
  9. Wilson, D.A.; Nolte, R.J.; van Hest, J.C. Autonomous Movement of Platinum-Loaded Stomatocytes. Nat. Chem. 2012, 4, 268–274. [Google Scholar] [CrossRef]
  10. Marguet, M.; Bonduelle, C.; Lecommandoux, S. Multicompartmentalized Polymeric Systems: Towards Biomimetic Cellular Structure and Function. Chem. Soc. Rev. 2013, 42, 512–529. [Google Scholar] [CrossRef]
  11. Che, H.; van Hest, J.C. Stimuli-Responsive Polymersomes and Nanoreactors. J. Mater. Chem. B 2016, 4, 4632–4647. [Google Scholar] [CrossRef]
  12. Jacobs, M.L.; Boyd, M.A.; Kamat, N.P. Diblock Copolymers Enhance Folding of a Mechanosensitive Membrane Protein during Cell-free Expression. Proc. Natl. Acad. Sci. USA 2019, 116, 4031–4036. [Google Scholar] [CrossRef] [PubMed]
  13. Israelachvili, J.N.; Mitchell, D.J.; Ninham, B.W. Theory of Self-Assembly of Lipid Bilayers and Vesicles. Biochim. Biophys. Acta (BBA)-Biomembr. 1977, 470, 185–201. [Google Scholar] [CrossRef]
  14. Huang, C.; Quinn, D.; Sadovsky, Y.; Suresh, S.; Hsia, K.J. Formation and Size Distribution of Self-Assembled Vesicles. Proc. Natl. Acad. Sci. USA 2017, 114, 2910–2915. [Google Scholar] [CrossRef] [PubMed]
  15. Thiermann, R.; Bleul, R.; Maskos, M. Kinetic Control of Block Copolymer Self-Assembly in a Micromixing Device – Mechanistical Insight into Vesicle Formation Process. Macromolecular Chemistry and Physics 2016, 218. [Google Scholar] [CrossRef]
  16. Mai, Y.; Eisenberg, A. Self-Assembly of Block Copolymers. Chem. Soc. Rev. 2012, 41, 5969–5985. [Google Scholar] [CrossRef] [PubMed]
  17. Antonietti, M.; Förster, S. Vesicles and Liposomes: A Self-Assembly Principle Beyond Lipids. Adv. Mater. 2003, 15, 1323–1333. [Google Scholar] [CrossRef]
  18. Li, X.; Cooksey, T.J.; Kidd, B.E.; Robertson, M.L.; Madsen, L.A. Mapping Coexistence Phase Diagrams of Block Copolymer Micelles and Free Unimer Chains. Macromolecules 2018, 51, 8127–8135. [Google Scholar] [CrossRef]
  19. Holder, S.W.; Grant, S.C.; Mohammadigoushki, H. Nuclear Magnetic Resonance Diffusometry of Linear and Branched Wormlike Micelles. Langmuir 2021, 37, 3585–3596. [Google Scholar] [CrossRef]
  20. Van Hest, J.C.; Delnoye, D.A.; Baars, M.W.; van Genderen, M.H.; Meijer, E.W. Polystyrene-Dendrimer Amphiphilic Block Copolymers with a Generation-Dependent Aggregation. Science 1995, 268, 1592–1595. [Google Scholar] [CrossRef]
  21. Zhang, L.; Eisenberg, A. Multiple Morphologies of “Crew-Cut” Aggregates of Polystyrene-b-Poly(Acrylic Acid) Block Copolymers. Science 1995, 268, 1728–1731. [Google Scholar] [CrossRef]
  22. Discher, B.M.; Won, Y.-Y.; Ege, D.S.; Lee, J.C.-M.; Bates, F.S.; Discher, D.E.; Hammer, D.A. Polymersomes: Tough Vesicles Made from Diblock Copolymers. Science 1999, 284, 1143–1146. [Google Scholar] [CrossRef] [PubMed]
  23. Jain, S.; Bates, F.S. On the Origins of Morphological Complexity in Block Copolymer Surfactants. Science 2003, 300, 460–464. [Google Scholar] [CrossRef] [PubMed]
  24. Won, Y.-Y.; Brannan, A.K.; Davis, H.T.; Bates, F.S. Cryogenic Transmission Electron Microscopy (Cryo-Tem) of Micelles and Vesicles Formed in Water by Poly(Ethylene Oxide)-Based Block Copolymers. J. Phys. Chem. B 2002, 106, 3354–3364. [Google Scholar] [CrossRef]
  25. Chen, L.; Shen, H.; Eisenberg, A. Kinetics and Mechanism of the Rod-to-Vesicle Transition of Block Copolymer Aggregates in Dilute Solution. J. Phys. Chem. B 1999, 103, 9488–9497. [Google Scholar] [CrossRef]
  26. Liu, S.; Sureshkumar, R. Morphological Diversity in Diblock Copolymer Solutions: A Molecular Dynamics Study. Colloids Interfaces 2023, 7, 40. [Google Scholar] [CrossRef]
  27. Liu, S.; Sureshkumar, R. Energetic and Entropic Motifs in Vesicle Morphogenesis in Amphiphilic Diblock Copolymer Solutions. Colloids and Interfaces 2024, 8, 12. [Google Scholar] [CrossRef]
  28. Srinivas, G.; Discher, D.E.; Klein, M. L. Self-Assembly and Properties of Diblock Copolymers by Coarse-Grain Molecular Dynamics. Nature Materials 2004, 3, 638–644. [Google Scholar] [CrossRef] [PubMed]
  29. Srinivas, G.; Shelley, J.C.; Nielsen, S. O.; Discher, D. E.; Klein, M. L. Simulation of Diblock Copolymer Self-Assembly, Using a Coarse-Grain Model. The Journal of Physical Chemistry B 2004, 108, 8153–8160. [Google Scholar] [CrossRef]
  30. He, X.; Schmid, F. Spontaneous Formation of Complex Micelles from a Homogeneous Solution. Physical Review Letters 2008, 100, 13. [Google Scholar] [CrossRef]
  31. He, X.; Schmid, F. Dynamics of Spontaneous Vesicle Formation in Dilute Solutions of Amphiphilic Diblock Copolymers. Macromolecules 2006, 39, 2654–2662. [Google Scholar] [CrossRef]
  32. Sevink, G.J.; Zvelindovsky, A. V. Self-Assembly of Complex Vesicles. Macromolecules 2005, 38, 7502–7513. [Google Scholar] [CrossRef]
  33. Ye, X.; Khomami, B. Self-Assembly of Linear Diblock Copolymers in Selective Solvents: From Single Micelles to Particles with Tri-Continuous Inner Structures. Soft Matter 2020, 16, 6056–6062. [Google Scholar] [CrossRef] [PubMed]
  34. Li, Z.; Dormidontova, E. E. Equilibrium Chain Exchange Kinetics in Block Copolymer Micelle Solutions by Dissipative Particle Dynamics Simulations. Soft Matter 2011, 7, 4179. [Google Scholar] [CrossRef]
  35. Javan Nikkhah, S.; Turunen, E.; Lepo, A.; Ala-Nissila, T.; Sammalkorpi, M. Multicore Assemblies from Three-Component Linear Homo-Copolymer Systems: A Coarse-Grained Modeling Study. Polymers 2021, 13, 2193. [Google Scholar] [CrossRef] [PubMed]
  36. Ortiz, V.; Nielsen, S.O.; Discher, D. E.; Klein, M. L.; Lipowsky, R.; Shillcock, J. Dissipative Particle Dynamics Simulations of Polymersomes. The Journal of Physical Chemistry B 2005, 109, 17708–17714. [Google Scholar] [CrossRef] [PubMed]
  37. Shillcock, J. C. Spontaneous Vesicle Self-Assembly: A Mesoscopic View of Membrane Dynamics. Langmuir 2012, 28, 541–547. [Google Scholar] [CrossRef] [PubMed]
  38. Xiao, M.; Liu, J.; Yang, J.; Wang, R.; Xie, D. Biomimetic Membrane Control of Block Copolymer Vesicles with Tunable Wall Thickness. Soft Matter 2013, 9, 2434. [Google Scholar] [CrossRef]
  39. Li, Y.; Zhang, H.; Wang, Z.; Bao, M. Micelle-Vesicle Transitions in Catanionic Mixtures Of SDS/DTAB Induced by Salt, Temperature, and Selective Solvents: A Dissipative Particle Dynamics Simulation Study. Colloid and Polymer Science 2014, 292, 2349–2360. [Google Scholar] [CrossRef]
  40. Luo, Z.; Li, Y.; Wang, B.; Jiang, J. Ph-Sensitive Vesicles Formed by Amphiphilic Grafted Copolymers with Tunable Membrane Permeability for Drug Loading/Release: A Multiscale Simulation Study. Macromolecules 2016, 49, 6084–6094. [Google Scholar] [CrossRef]
  41. Wu, S.; Lu, T.; Guo, H. Dissipative Particle Dynamic Simulation Study of Lipid Membrane. Frontiers of Chemistry in China 2010, 5, 288–298. [Google Scholar] [CrossRef]
  42. Feng, X.; Yan, N.; Jin, J.; Jiang, W. Disassembly of Amphiphilic AB Block Copolymer Vesicles in Selective Solvents: A Molecular Dynamics Simulation Study. Macromolecules 2023, 56, 2560–2567. [Google Scholar] [CrossRef]
  43. Kotaka, T.; Tanaka, T.; Hattori, M.; Inagaki, H. Block Copolymer Micelles in Dilute Solution. Macromolecules 1978, 11, 138–145. [Google Scholar] [CrossRef]
  44. Balsara, N.P.; Tirrell, M.; Lodge, T. P. Micelle Formation of BAB Triblock Copolymers in Solvents that Preferentially Dissolve the A Block. Macromolecules 1991, 24, 1975–1986. [Google Scholar] [CrossRef]
  45. Yang, Y.-W.; Yang, Z.; Zhou, Z.-K.; Attwood, D.; Booth, C. Association of Triblock Copolymers of Ethylene Oxide and Butylene Oxide in Aqueous Solution. A Study of BnEmBn Copolymers. Macromolecules 1996, 29, 670–680. [Google Scholar] [CrossRef]
  46. Raspaud, E.; Lairez, D.; Adam, M.; Carton, J.-P. Triblock Copolymers in A Selective Solvent. 1. Aggregation Process in Dilute Solution. Macromolecules 1994, 27, 2956–2964. [Google Scholar] [CrossRef]
  47. Mortensen, K.; Brown, W.; Joergensen, E. Phase Behavior of Poly(Propylene Oxide)-Poly(Ethylene Oxide)-Poly(Propylene Oxide) Triblock Copolymer Melt and Aqueous Solutions. Macromolecules 1994, 27, 5654–5666. [Google Scholar] [CrossRef]
  48. Pleštil, J.; Hlavatá, D.; Hrouz, J.; Tuzar, Z. Dilute and Semidilute Solutions of ABA Block Copolymer in Solvents Selective for A or B Blocks: 1. Small-Angle X-Ray Scattering Study. Polymer 1990, 31, 2112–2117. [Google Scholar] [CrossRef]
  49. Taribagil, R.R.; Hillmyer, M. A.; Lodge, T. P. Hydrogels from ABA and ABC Triblock Polymers. Macromolecules 2010, 43, 5396–5404. [Google Scholar] [CrossRef]
  50. Giacomelli, F.C.; Riegel, I. C.; Petzhold, C. L.; da Silveira, N. P.; Štěpánek, P. Aggregation Behavior of a New Series of ABA Triblock Copolymers Bearing Short Outer A Blocks in B-Selective Solvent: From Free Chains to Bridged Micelles. Langmuir 2008, 25, 731–738. [Google Scholar] [CrossRef]
  51. Zhou, Z.; Chu, B.; Nace, V. M. Association Behavior of a Triblock Copolymer of Oxyethylene (E) And Oxybutylene (B). A Study of B5E91B5 in Aqueous Solution. Langmuir 1996, 12, 5016–5021. [Google Scholar] [CrossRef]
  52. Almehmady, A.; Cavanagh, R.; Mantovani, G.; Stolnik, S. ABA Block Copolymers Comprising a Water Soluble Poly(N-Hydroxyethyl Acrylamide) B Block form Self-Assemblies of Varied Morphologies in an Aqueous Environment. Polymer Chemistry 2023, 14, 4089–4100. [Google Scholar] [CrossRef]
  53. Singh, V.; Eljaaly, K.; Md, S.; Alhakamy, N.A.; Kesharwani, P. Triblock Copolymeric Drug Delivery as an Emerging Nanocarrier for Treatment of Infectious Diseases. Journal of Drug Delivery Science and Technology 2022, 75, 103691. [Google Scholar] [CrossRef]
  54. Hoang, N.H.; Lim, C.; Sim, T.; Oh, K. T. Triblock Copolymers for Nano-Sized Drug Delivery Systems. Journal of Pharmaceutical Investigation 2016, 47, 27–35. [Google Scholar] [CrossRef]
  55. Wanka, G.; Hoffmann, H.; Ulbricht, W. Phase Diagrams and Aggregation Behavior of Poly(Oxyethylene)-Poly(Oxypropylene)-Poly(Oxyethylene) Triblock Copolymers in Aqueous Solutions. Macromolecules 1994, 27, 4145–4159. [Google Scholar] [CrossRef]
  56. Yu, G.; Eisenberg, A. Multiple Morphologies Formed from an Amphiphilic ABC Triblock Copolymer in Solution. Macromolecules 1998, 31, 5546–5549. [Google Scholar] [CrossRef]
  57. Nardin, C.; Hirt, T.; Leukel, J.; Meier, W. Polymerized ABA Triblock copolymer vesicles. Langmuir 1999, 16, 1035–1041. [Google Scholar] [CrossRef]
  58. Yang, Z.; Wang, X.; Yang, Y.; Liao, Y.; Wei, Y.; Xie, X. Synthesis of Electroactive Tetraaniline−PEO−Tetraaniline Triblock Copolymer and Its Self-Assembled Vesicle with Acidity Response. Langmuir 2010, 26, 9386–9392. [Google Scholar] [CrossRef] [PubMed]
  59. Gao, C.; Wu, J.; Zhou, H.; Qu, Y.; Li, B.; Zhang, W. Self-Assembled Blends of AB/BAB Block Copolymers Prepared Through Dispersion Raft Polymerization. Macromolecules 2016, 49, 4490–4500. [Google Scholar] [CrossRef]
  60. Yuan, J.; Li, Y.; Li, X.; Cheng, S.; Jiang, L.; Feng, L.; Fan, Z. The “Crew-Cut” Aggregates of Polystyrene-B-Poly(Ethylene Oxide)-B-Polystyrene Triblock Copolymers in Aqueous Media. European Polymer Journal 2003, 39, 767–776. [Google Scholar] [CrossRef]
  61. Wang, J.; Leung, L. M. Self-Assembly and Aggregation of ATRP Prepared Amphiphilic BAB Tri-Block Copolymers Contained Nonionic Ethylene Glycol and Fluorescent 9,10-di(1-Naphthalenyl)-2-Vinyl-Anthracene/1-Vinyl-Pyrene Segments. European Polymer Journal 2013, 49, 3722–3733. [Google Scholar] [CrossRef]
  62. Zhao, X.; Liu, W.; Chen, D.; Lin, X.; Lu, W. W. Effect of Block Order of ABA- And BAB-Type Nipaam/Hema Triblock Copolymers on Thermoresponsive Behavior of Solutions. Macromolecular Chemistry and Physics 2007, 208, 1773–1781. [Google Scholar] [CrossRef]
  63. HE, G.; MA, L.; PAN, J.; VENKATRAMAN, S. ABA and BAB Type Triblock Copolymers of PEG and PLA: A Comparative Study of Drug Release Properties and “Stealth” Particle Characteristics. International Journal of Pharmaceutics 2007, 334, (1–2). [Google Scholar] [CrossRef] [PubMed]
  64. Mohammadi, M.; Ramezani, M.; Abnous, K.; Alibolandi, M. Biocompatible Polymersomes-Based Cancer Theranostics: Towards Multifunctional Nanomedicine. Int. J. Pharm. 2017, 519, 287–303. [Google Scholar] [CrossRef] [PubMed]
  65. Bae, S.J.; Suh, J. M.; Sohn, Y. S.; Bae, Y. H.; Kim, S. W.; Jeong, B. Thermogelling Poly(Caprolactone-b-Ethylene Glycol-b-Caprolactone) Aqueous Solutions. Macromolecules 2005, 38, 5260–5265. [Google Scholar] [CrossRef]
  66. Naharros-Molinero, A.; Caballo-González, M.Á.; de la Mata, F. J.; García-Gallego, S. Direct and Reverse Pluronic Micelles: Design and Characterization of Promising Drug Delivery Nanosystems. Pharmaceutics 2022, 14, 2628. [Google Scholar] [CrossRef] [PubMed]
  67. Wang, Q.; Li, L.; Jiang, S. Effects of a PPO−PEO−PPO Triblock Copolymer on Micellization and Gelation of a PEO−PPO−PEO Triblock Copolymer in Aqueous Solution. Langmuir 2005, 21, 9068–9075. [Google Scholar] [CrossRef] [PubMed]
  68. Lyubimov, I.; Wessels, M.G.; Jayaraman, A. Molecular Dynamics Simulation and Prism Theory Study of Assembly in Solutions of Amphiphilic Bottlebrush Block Copolymers. Macromolecules 2018, 51, 7586–7599. [Google Scholar] [CrossRef]
  69. Chakraborty, K.; Shinoda, W.; Loverde, S. M. Molecular Simulation of the Shape Deformation of a Polymersome. Soft Matter 2020, 16, 3234–3244. [Google Scholar] [CrossRef]
  70. Rodrigues, K.; Mattice, W. L. Micelles and Networks Formed by Symmetric Triblock Copolymers in Dilute Solutions that are Poor Solvents for the Terminal Blocks. Polymer Bulletin 1991, 25, 239–243. [Google Scholar] [CrossRef]
  71. Rodrigues, K.; Mattice, W. L. Intraparticle Distribution Functions for a Micelle Formed by a Small Symmetric Triblock Copolymer in a Poor Solvent for the Terminal Blocks. Langmuir 1992, 8, 456–459. [Google Scholar] [CrossRef]
  72. Nguyen-Misra, M.; Mattice, W. L. Micellization and Gelation of Symmetric Triblock Copolymers with Insoluble End Blocks. Macromolecules 1995, 28, 1444–1457. [Google Scholar] [CrossRef]
  73. Chen, Z.; Wang, X.; Zhang, L.; He, L. Vesicles from the Self-Assembly of Coil–Rod–Coil Triblock Copolymers in Selective Solvents. Polymer 2014, 55, 2921–2927. [Google Scholar] [CrossRef]
  74. Han, Y.; Yu, H.; Du, H.; Jiang, W. Effect of Selective Solvent Addition Rate on the Pathways for Spontaneous Vesicle Formation of ABA Amphiphilic Triblock Copolymers. Journal of the American Chemical Society 2009, 132, 1144–1150. [Google Scholar] [CrossRef] [PubMed]
  75. Kangarlou, B.; Dahanayake, R.; Martin, I J. ; Ndaya, D.; Wu, C.-M.; Kasi, R. M.; Dormidontova, E. E.; Nieh, M.-P. Flower-Like Micelles of Polyethylene Oxide End-Capped with Cholesterol. Macromolecules 2021, 54, 8960–8970. [Google Scholar] [CrossRef]
  76. Song, Y.; Xie, T.; Jiang, R.; Wang, Z.; Yin, Y.; Li, B.; Shi, A.-C. Effect of Chain Architecture on Self-Assembled Aggregates from Cyclic AB Diblock and Linear ABA Triblock Copolymers in Solution. Langmuir 2018, 34, 4013–4023. [Google Scholar] [CrossRef] [PubMed]
  77. Dhakal, S.; Sureshkumar, R. Anomalous Diffusion and Stress Relaxation in Surfactant Micelles. Phys. Rev. E 2017, 96, 2605. [Google Scholar] [CrossRef] [PubMed]
  78. Dhakal, S.; Sureshkumar, R. Topology, Length Scales, and Energetics of Surfactant Micelles. J. Chem. Phys. 2015, 143, 024905. [Google Scholar] [CrossRef] [PubMed]
  79. Dhakal, S.; Sureshkumar, R. Uniaxial Extension of Surfactant Micelles: Counterion Mediated Chain Stiffening and a Mechanism of Rupture by Flow-Induced Energy Redistribution. ACS Macro Lett. 2015, 5, 108–111. [Google Scholar] [CrossRef]
  80. Sangwai, A.V.; Sureshkumar, R. Binary Interactions and Salt-Induced Coalescence of Spherical Micelles of Cationic Surfactants from Molecular Dynamics Simulations. Langmuir 2011, 28, 1127–1135. [Google Scholar] [CrossRef]
  81. Sangwai, A.V.; Sureshkumar, R. Coarse-Grained Molecular Dynamics Simulations of the Sphere to Rod Transition in Surfactant Micelles. Langmuir 2011, 27, 6628–6638. [Google Scholar] [CrossRef] [PubMed]
  82. Sambasivam, A.; Sangwai, A.V.; Sureshkumar, R. Dynamics and Scission of Rodlike Cationic Surfactant Micelles in Shear Flow. Phys. Rev. Lett. 2015, 114, 8302. [Google Scholar] [CrossRef] [PubMed]
  83. Sambasivam, A.; Sangwai, A.V.; Sureshkumar, R. Self-Assembly of Nanoparticle–Surfactant Complexes with Rodlike Micelles: A Molecular Dynamics Study. Langmuir 2016, 32, 1214–1219. [Google Scholar] [CrossRef] [PubMed]
  84. Sambasivam, A.; Dhakal, S.; Sureshkumar, R. Structure and Rheology of Self-Assembled Aqueous Suspensions of Nanoparticles and Wormlike Micelles. Mol. Simul. 2017, 44, 485–493. [Google Scholar] [CrossRef]
  85. Marrink, S.J.; Risselada, H.J.; Yefimov, S.; Tieleman, D.P.; de Vries, A.H. The MARTINI Force Field:  Coarse Grained Model for Biomolecular Simulations. J. Phys. Chem. B 2007, 111, 7812–7824. [Google Scholar] [CrossRef] [PubMed]
  86. Darré, L.; Machado, M.R.; Pantano, S. Coarse-Grained Models of Water. WIREs Comput. Mol. Sci. 2012, 2, 921–930. [Google Scholar] [CrossRef]
  87. Martínez, L.; Andrade, R.; Birgin, E.G.; Martínez, J.M. Packmol: A Package for Building Initial Configurations for Molecular Dynamics Simulations. J. Comput. Chem. 2009, 30, 2157–2164. [Google Scholar] [CrossRef]
  88. Eisenhaber, F.; Lijnzaad, P.; Argos, P.; Sander, C.; Scharf, M. The Double Cubic Lattice Method: Efficient Approaches to Numerical Integration of Surface Area and Volume and to Dot Surface Contouring of Molecular Assemblies. J. Comput. Chem. 1995, 16, 273–284. [Google Scholar] [CrossRef]
  89. Bussi, G.; Donadio, D.; Parrinello, M. Canonical Sampling Through Velocity Rescaling. The Journal of Chemical Physics 2007, 126, 014101. [Google Scholar] [CrossRef]
  90. Berendsen, H.J.; Postma, J. P.; van Gunsteren, W. F.; DiNola, A.; Haak, J. R. Molecular Dynamics with Coupling to an External Bath. The Journal of Chemical Physics 1984, 81, 3684–3690. [Google Scholar] [CrossRef]
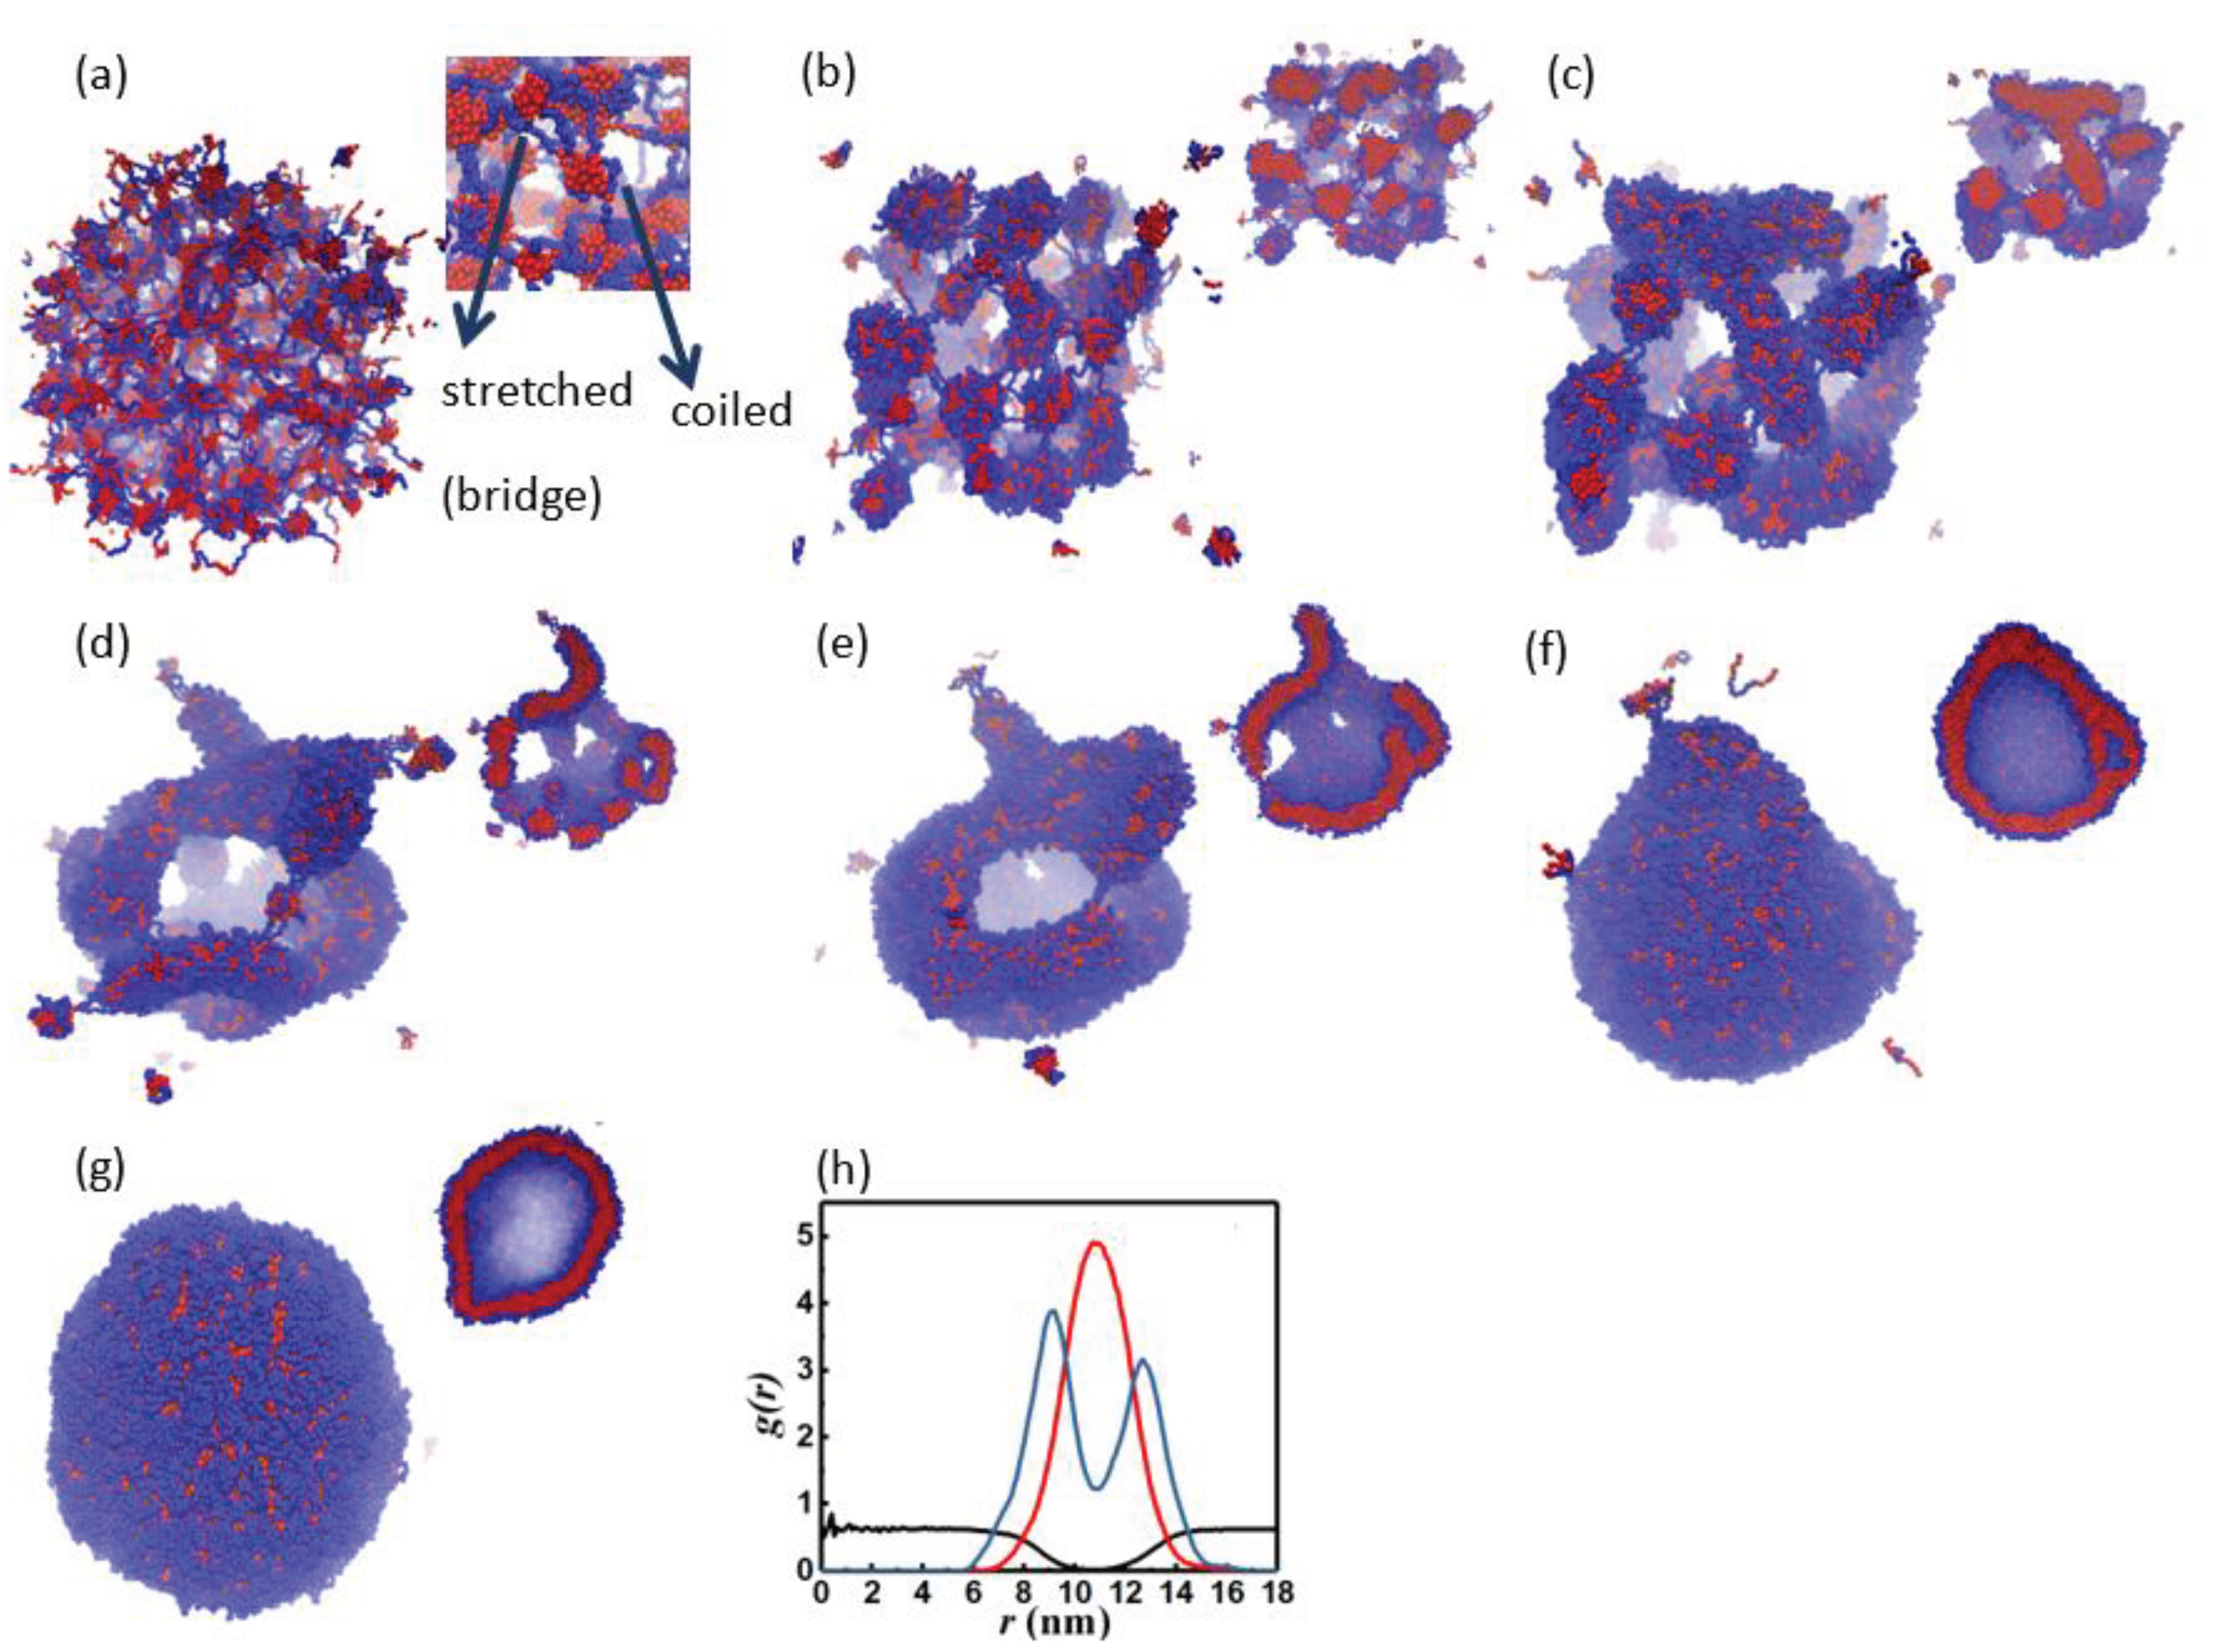
Figure 1. Structure evolution. (a) 0 ns (initial condition of the NPT simulation): a network of interconnected spherical aggregates, (b) 10 ns: a network of ellipsoidal micelles, (c) 20 ns, (d) 30 ns: cage of cylindrical micelles, (e) 50 ns: a lamellar cage, (f) 150 ns: precursor to a vesicle, (g) 600 ns: a vesicle at equilibrium. Panel (h) shows the pair correlation functions of the vesicle shown in panel (g). The black, blue, and red lines represent water, A and B, respectively. The smaller illustration next to panel (a) is an exploded view of the micelle network. The smaller illustrations next to panels (b) - (g) show the cross section of the corresponding structure.
Preprints 102761 g001
Figure 2. Structure evolution: aggregation number (N) and radius of gyration (Rg) versus time. The step changes seen in N correspond to the merger of a small copolymer aggregate with the primary structure. For snapshots 4-6, cross sections are also shown. The dotted line shows the time at which a fully enclosed vesicular structure is formed.
Preprints 102761 g002
Figure 3. The probability distribution function of the end-to-end distance Q of the polymer chains at different times corresponding to the structures (a)−(g) shown in Figure 1. (a) 0 ns, (b) 10 ns, (c) 20 ns, (d) 30 ns, (e) 50 ns, (f) 150 ns, (g) 600 ns. Typical chain configurations are shown in the inset of panels (a) and (g). The black points and the line in panel (g) show p(Q) for a single chain at equilibrium.
Preprints 102761 g003
Figure 4. Relative solvent accessible surface area and relative information entropy versus time. The dotted line shows the time at which a fully enclosed vesicular structure is formed.
Preprints 102761 g004
Figure 5. (a) aggregation number (N), (b) radius of gyration (Rg), (c) information entropy (H) and (d) relative total SASA versus time for BAB copolymer solutions with varying degrees of hydrophilicity of the B block (C1 < C2 < C3 = C4 < C5).
Preprints 102761 g005
Figure 6. p(Q) vs. Q for BAB copolymer solutions with varying degrees of hydrophilicity of the B block (C1 < C2 < C3 = C4 < C5) for (a) a single chain in solution and (b) the self-assembled structures at equilibrium. Cases C1 – C4 form vesicles whereas C5 forms spherical micelles. Lines represent log normal fits to the simulation data shown in symbols.
Preprints 102761 g006
Figure 7. Structure evolution for C5-type B segment. (a) 0 ns, (b) 10 ns, (c) 20 ns, (d) 30 ns, (e) 50 ns, (f) 150 ns, (g) 600 ns. Panel (h) shows the radial distribution functions of the micelle shown in panel (g). The black, blue, and red lines represent water, A and B, respectively. The smaller illustrations next to panels (b) − (g) show the cross sections of the corresponding large structures.
Preprints 102761 g007
Table 1. Time required for the formation of a fully enclosed vesicular structure for chains with hydrophobic segments with different degrees of hydrophobicity.
Type C1 C2 C3 C4 C5
ε B W   ( k J / m o l ) 2.0 2.3 2.7 2.7 3.1
ε B A   ( k J / m o l ) 2.7 2.7 2.7 3.1 3.5
Vesiculation Time (ns) 84 ± 8 105 ± 9 142 ± 13 130 ± 17
Disclaimer/Publisher’s Note: The statements, opinions and data contained in all publications are solely those of the individual author(s) and contributor(s) and not of MDPI and/or the editor(s). MDPI and/or the editor(s) disclaim responsibility for any injury to people or property resulting from any ideas, methods, instructions or products referred to in the content.
Copyright: This open access article is published under a Creative Commons CC BY 4.0 license, which permit the free download, distribution, and reuse, provided that the author and preprint are cited in any reuse.
Prerpints.org logo

Preprints.org is a free preprint server supported by MDPI in Basel, Switzerland.

Subscribe

© 2024 MDPI (Basel, Switzerland) unless otherwise stated