1. Introduction
Cattle production is today a major part of world food industry and is a major contributor to the European agriculture [
1]. Managing outdoor cattle necessitates fences to keep animals within a desired area while preventing interactions with anthropogenic environments and wildlife. However, fences also present several issues for wildlife and ecosystems. Physical barriers can cause direct effects through the obstruction of mobile wildlife and increase the mortality risk for wildlife either through direct collision or entanglement leading to death through starvation, predation, or exposure [
2]. Pokorny
et al. (2016) documented the mortality of 21 ungulates (13 red deer and eight roe deer) associated with fences at the Slovenia-Croatia border, representing a mortality occurrence of 0.12 mortalities per kilometre of the fence [
3].
Furthermore, indirect effects of physical fences can be observed through the behaviour and biology of wildlife. Examples include the separation of mother and offspring, habitat loss, temporary entanglement, obstructed movement, and guidance through fenced terrain. The accumulation of these often stress-inducing factors may reduce the overall fitness of individuals [
2]. Moreover, fencing causes fragmentation which effectively reduces the carrying capacity and thereby negatively affects biodiversity [
4,
5]. Fences present both practical and financial challenges, including the monetary cost associated with instalment, repair, and relocation of fences [
6]. The practical aspect of not being able to build fences on certain types of terrain is also problematic [
6]. These factors must be considered when establishing a pasture and managing a herd. To circumvent these challenges virtual fences can be implemented which potentially increases biodiversity and welfare [
7].
Nofence© (
www.nofence.no, accessed 12-03-2024) is a virtual fence system for grazers, such as cattle and goats. It makes dynamic grazing possible, and it eliminates the need for a physical fence [
8]. The concept of a virtual fence works by emitting an auditory warning from a collar when an animal approaches the virtual fence. If the animal continues, it will receive an electrical impulse. Nofence© aims to prevent the electrical impulse, through avoidance when the animal receives an auditory warning [
8].
Previous studies on implementing virtual fencing suggest no substantial impact on the behaviour and welfare of several species of livestock [
9,
10,
11,
12]. Cattle can adapt to a virtual fence, as they show an ability to respond to the auditory warning and thereby receive fewer electrical impulses over time [
13]. Associative learning is an essential tool in the learning process where cattle associate the two conditions: warning and impulse [
14]. Studies also documents variability between individuals when assessing learning ability measured in the number of warnings and electrical impulses [
13]. However, as cattle are herd animals, their ability to learn cannot be determined individually since social facilitation can influence the learning process [
7,
15]. Social facilitation (also called allelomimicry or contagious behaviour) occurs when an individual copies behaviour from another individual [
16].
This study examines if social facilitation influences the learning process and if the learning process can be accelerated, which may reduce impulses and increase animal welfare. This is achieved by studying two different kinds of learning processes and the presence of experienced cattle.
The following hypotheses were tested: Fewer impulses per warning are expected during the learning period if experienced cattle (cattle which have experienced Nofence© system) are present in a herd. Fewer impulses per warning are expected during the observation period in comparison to the learning period if the cattle have been raised with a gradual introduction to Nofence© compared to cattle that have not.
2. Materials and Methods
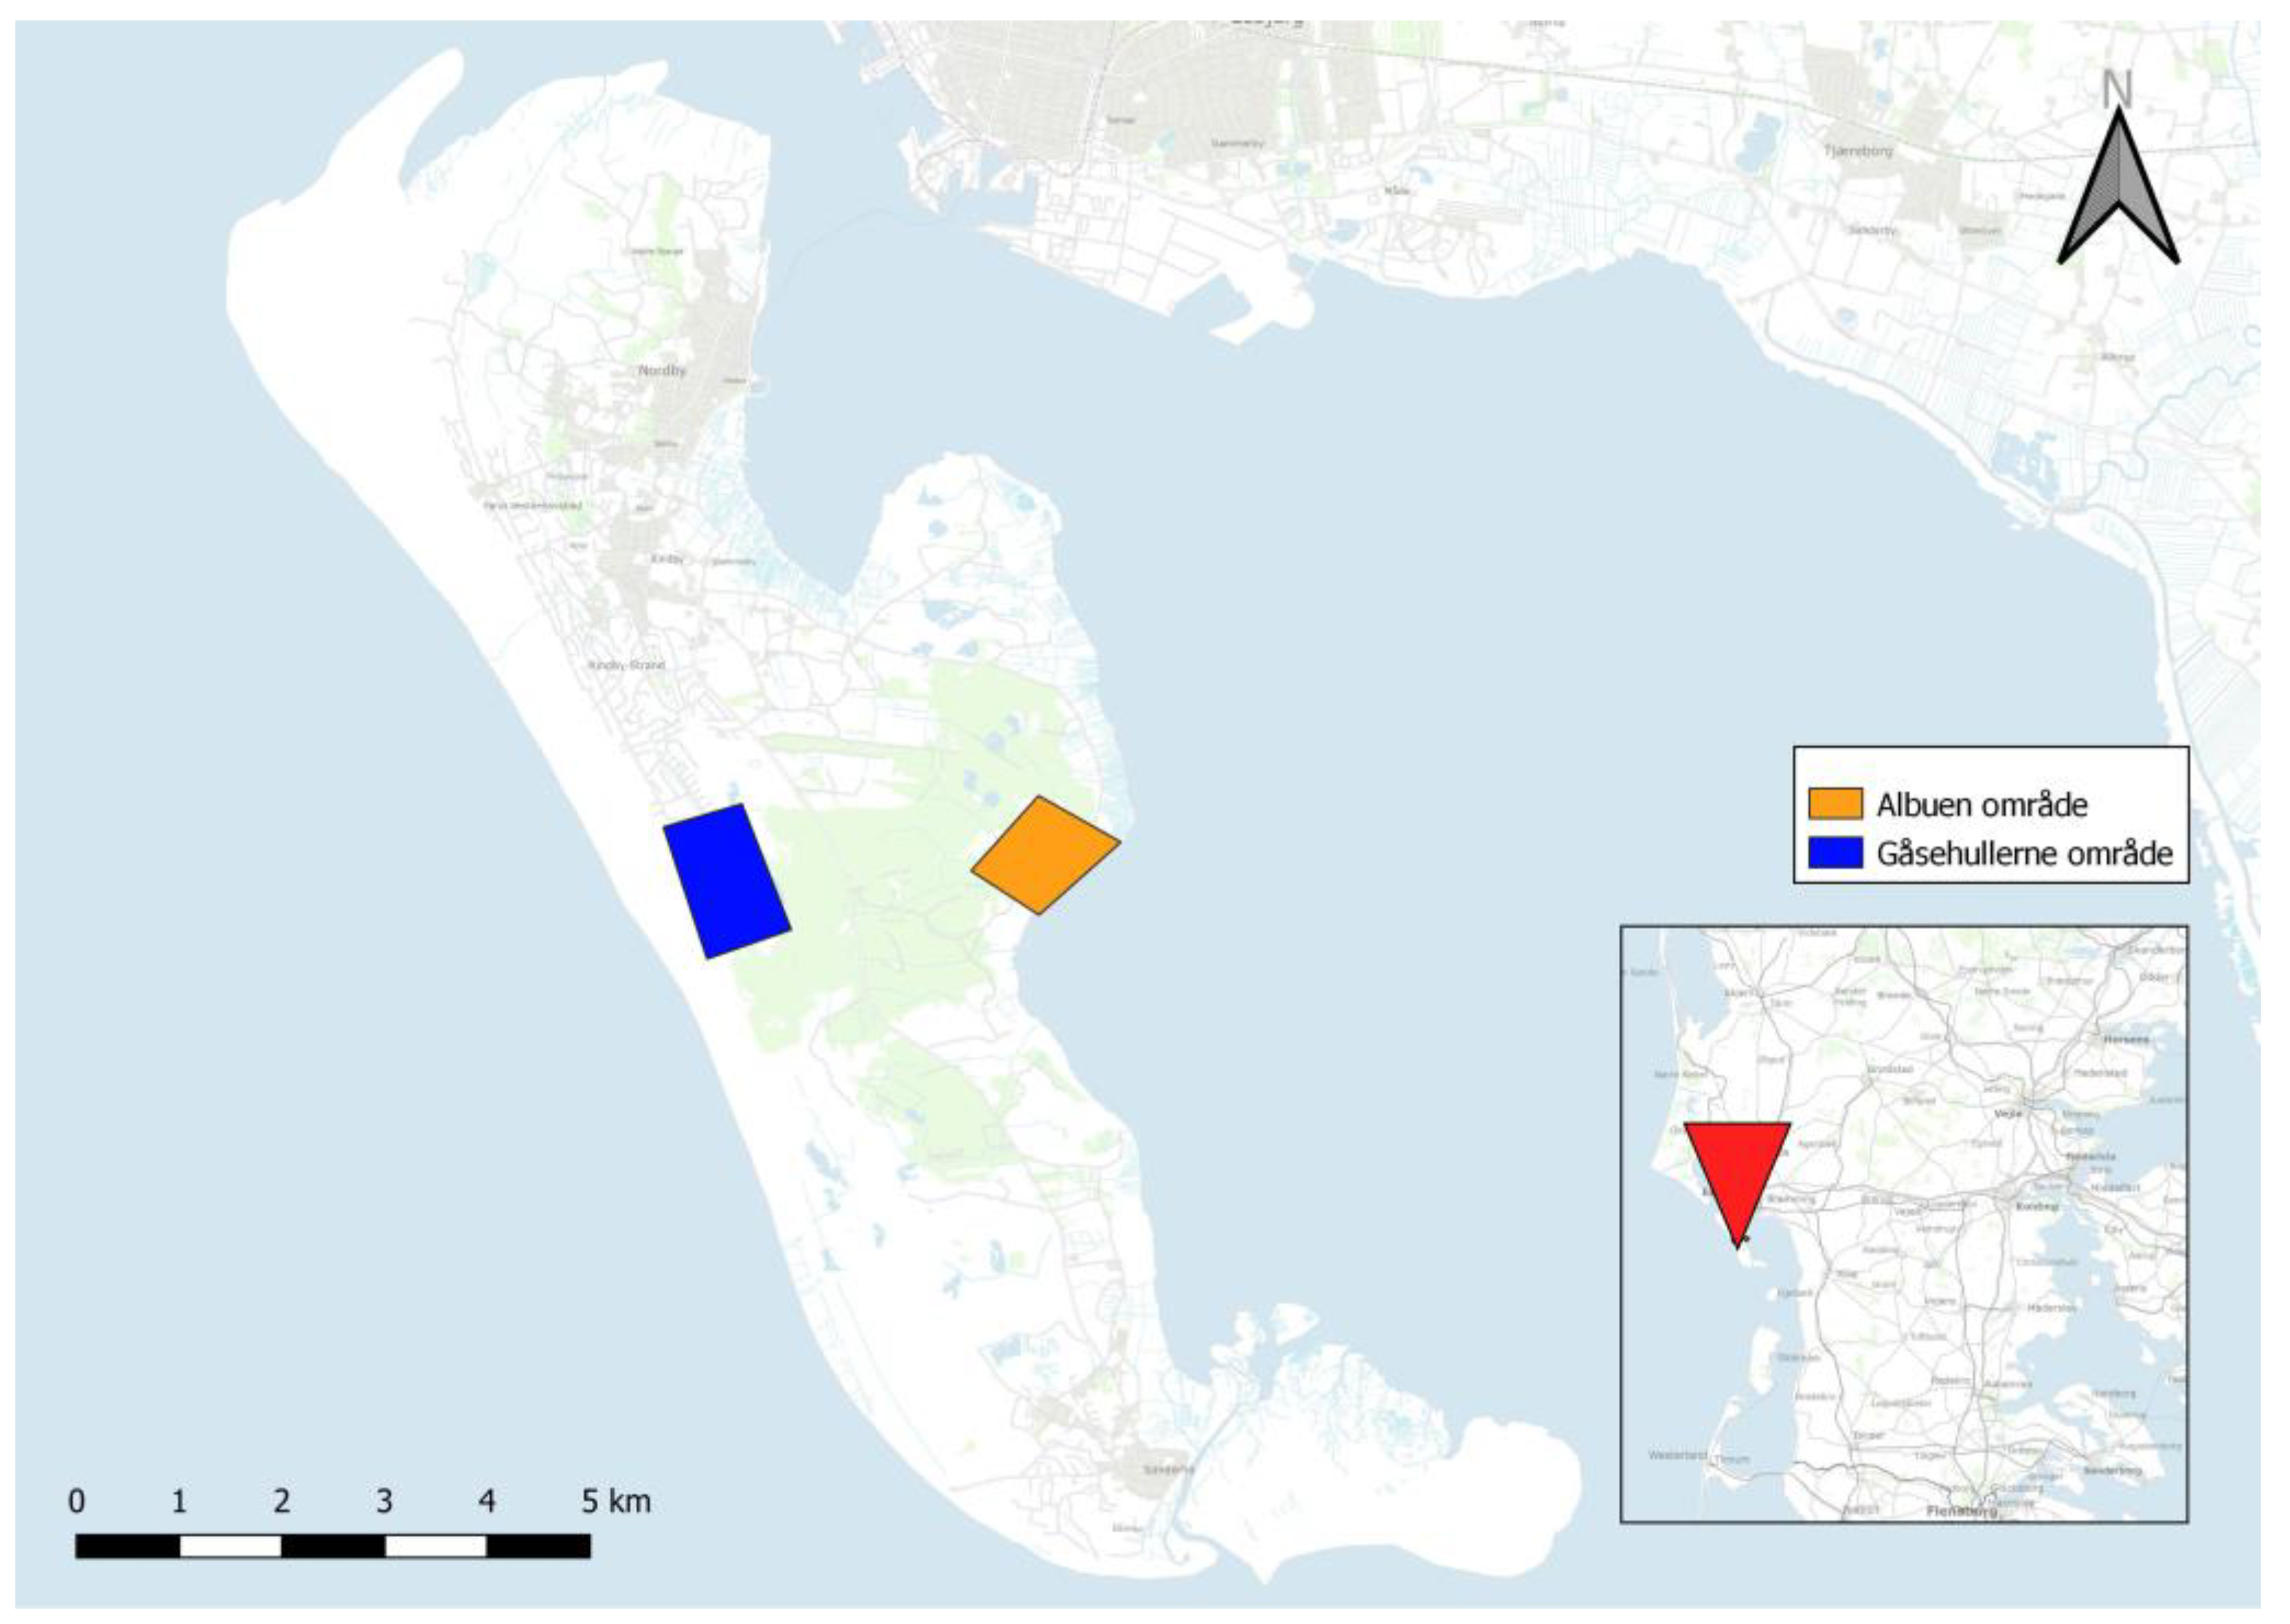
This study took place on the island of Fanø, located on the west coast of Denmark in the Wadden Sea area. A farmer implemented the Nofence© system on his Angus cattle (
Bos taurus) (
Figure A1,
Appendix A). The study period was divided into two parts: first an 11-day learning process followed by a 26-day observation period. Management of virtual fence lines and collection of data from cattle collars were managed by an external operator.
Table 1.
Glossary.
| Glossary |
Definition |
| Experienced cow |
A cow that has previously experienced the Nofence© system. |
| Learning period |
The first 11 days of Nofence© introduction. |
| Observation period |
The following 26 days after end of the learning period. |
| Learning process |
The method the cattle are being introduced to Nofence© with. |
| Learning |
The method the cattle are being introduced to Nofence© |
| Impulse |
The electrical impulse received from the Nofence© collar. |
2.1. The Virtual Fencing System
Data was collected using collars developed by Nofence©. Each cow had a collar fitted around the neck with a unique serial number to identify the animal. The collar weighed 1,446 grams and consisted of a silicone strap, two chains connected to a GPS receiver and two solar panels [
8]. The GPS receiver collected data, including the warnings and impulses that the cattle received when encountering the boundaries. The positional data was collected every 15 minutes and the activity data every 30 minutes. Activity was measured by a step counter as a unitless number. The position of the animal was collected whenever a warning or an impulse was given, or when the fence status changed. All data were available on an app (Nofence), which also made it possible to move the virtual fence [
8].
When the cattle approached the virtual boundary, the collars sent out an auditory warning. The auditory warning consisted of a tone increasing in pitch for 5-20 seconds depending on the heading and speed of the cow approaching the boundary. If the animal ignored the auditory warning and continued towards or outside the virtual boundary, the collar gave an electrical impulse of 0.2 joules at 3 kilovolts for one second with a maximum of three such impulses before sending a message to the owner that the cow had escaped [
8]. Three (A, B and C) different investigations of cattle´s adaptation to virtual fencing were conducted at two different locations. Two methods of introducing the cattle to virtual fence were investigated: In the first method, called gradual introduction, one electrical fence line was replaced by virtual fence which was then moved incrementally (20 meters, three times over a period of 14 days). After 14 days the entire physical fence was replaced with virtual fence on all sides. In the second method, an instant introduction to the virtual fence system replaced the physical electrical fence instantly. Two slightly different methods of instantaneous introductions were investigated: an electrical fence was replaced with virtual borders from one day to another or relocating a small number of cattle from a field enclosed by an electrical fence to a pasture only consisting of virtual fence.
2.2. Experimental Protocol
2.2.1. Investigation A (Gradual Learning Process)
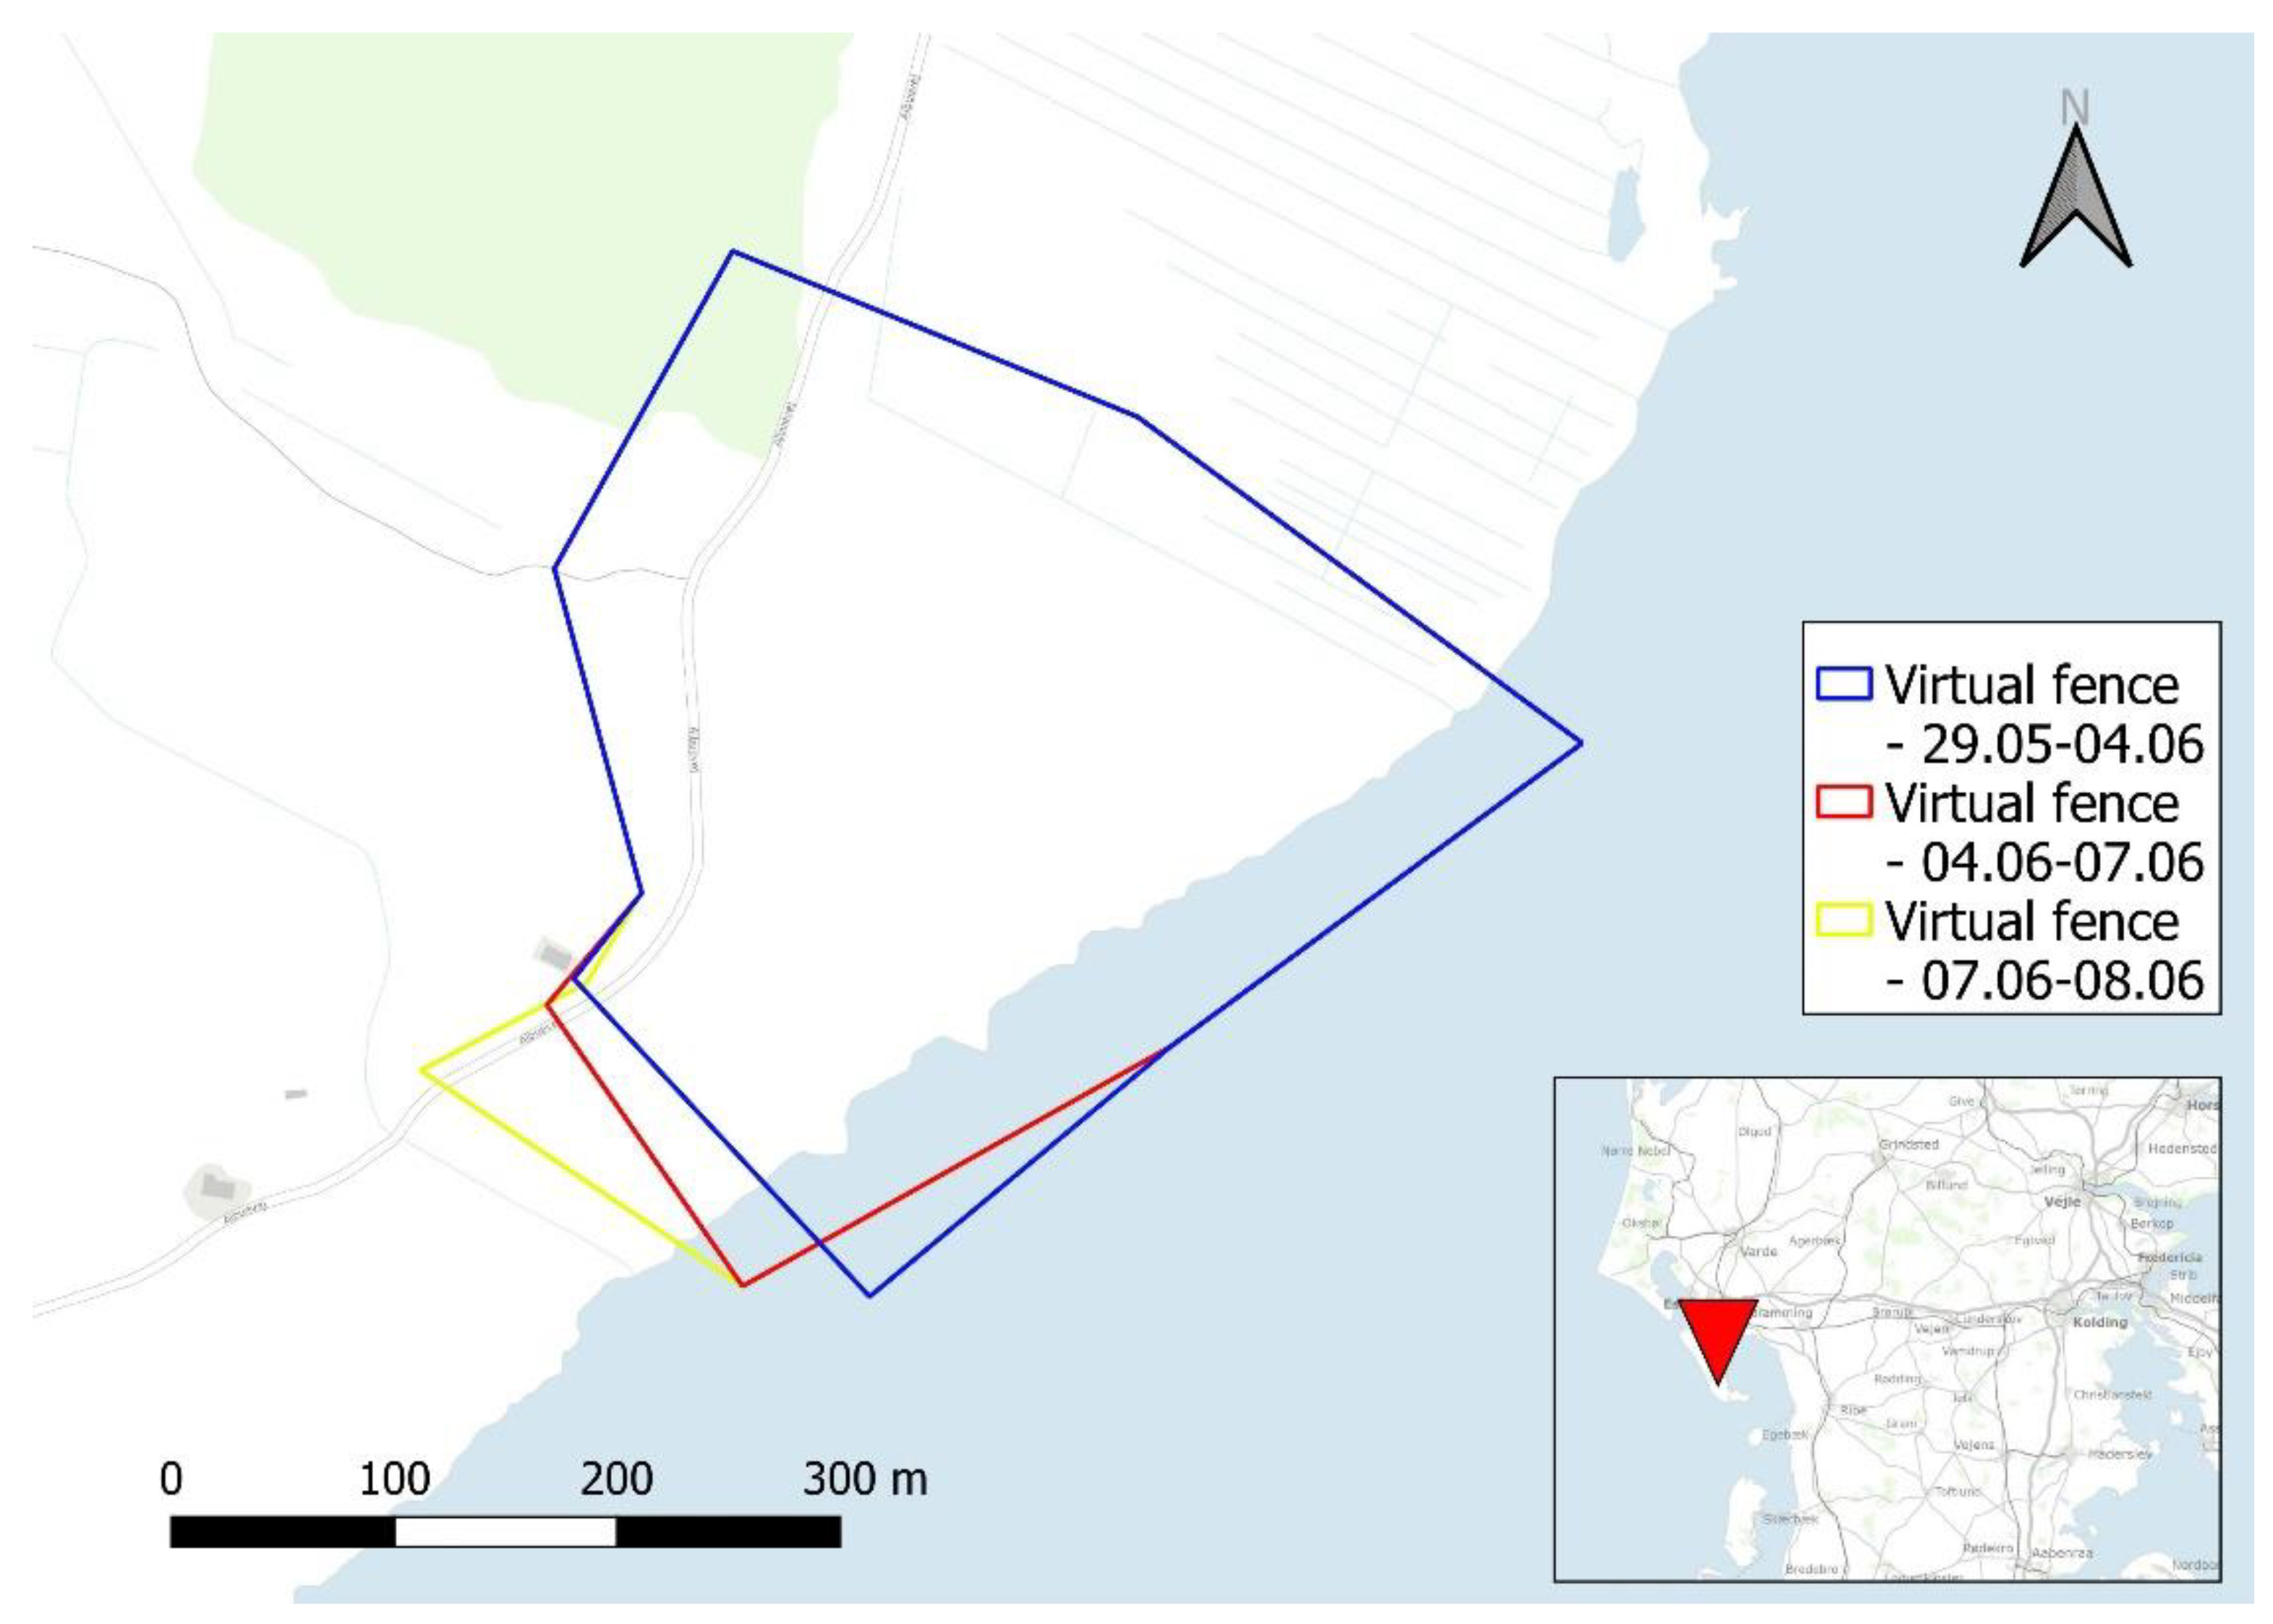
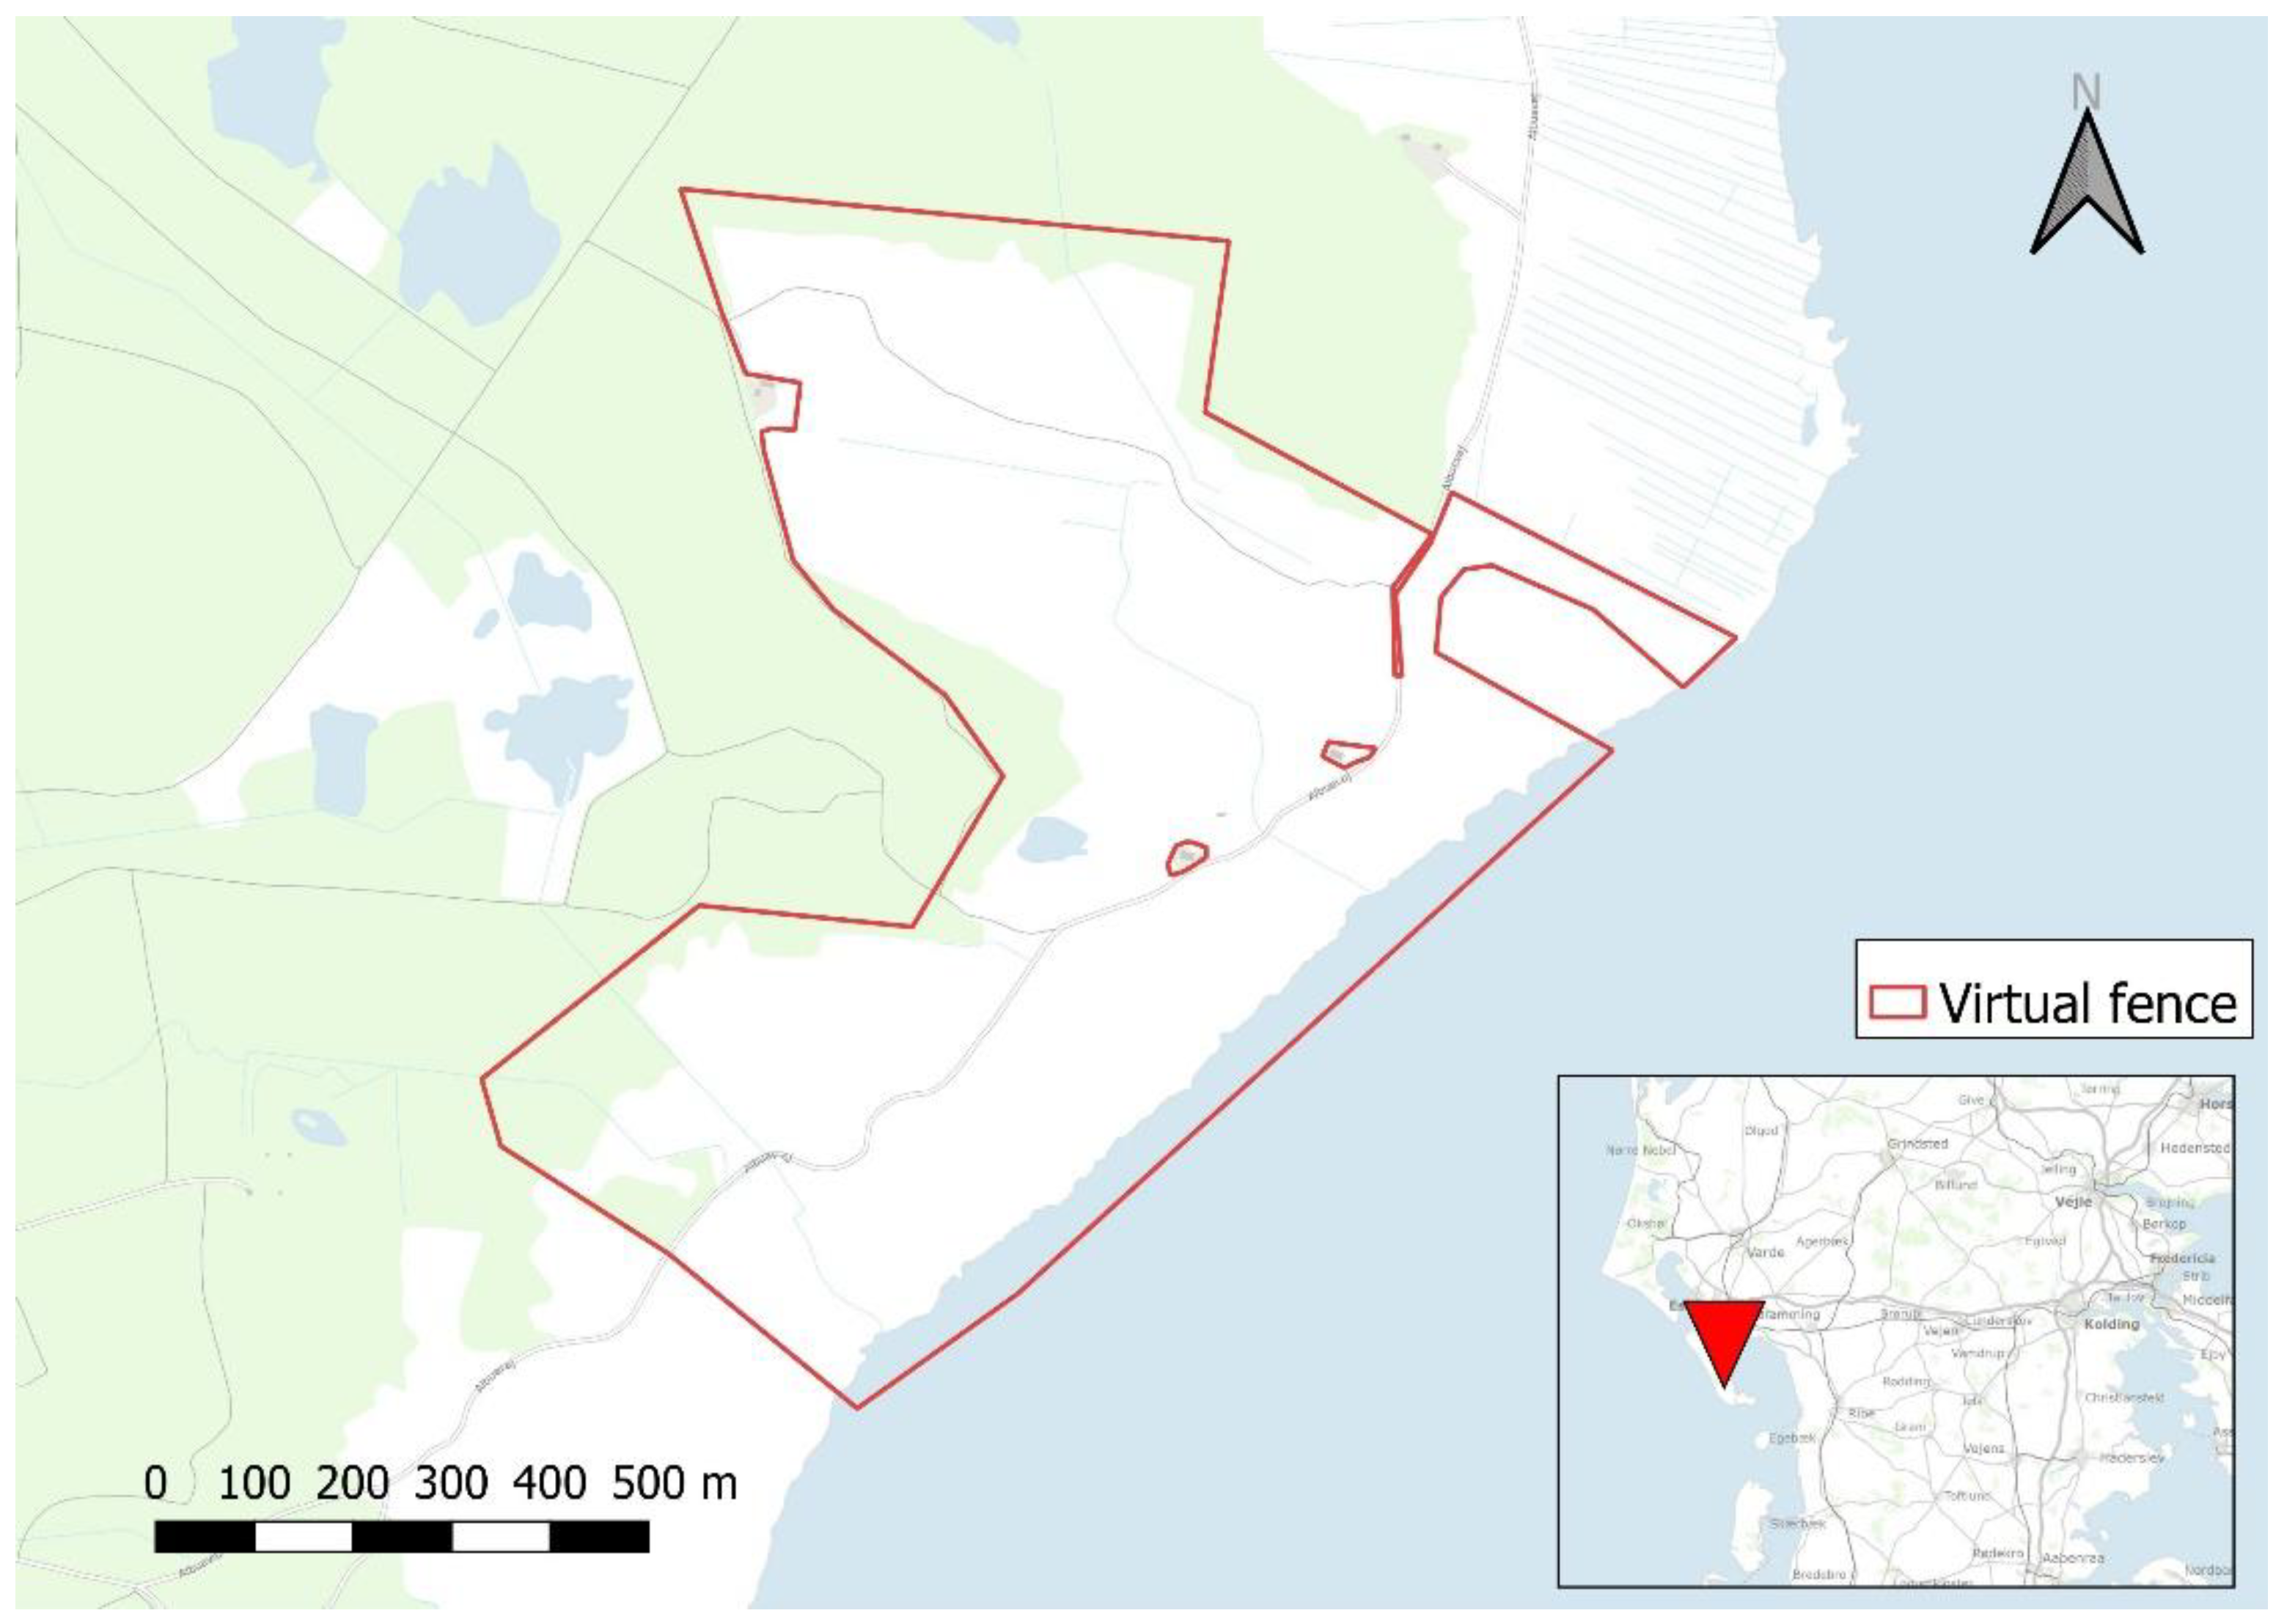
Investigation A was located on the east side of Fanø (named Albuen). The two types of primary habitats were dry heathland to the west and (salt) meadows to the southeast. The meadows were dominated by grasses and sedges, and the drier heathland was dominated by heather. On 28 May 2021, 12 cows (age: 5 years) were placed in a physical electrical enclosure of 6.5 hectares. After two days, one of the four fence lines was replaced by a virtual fence (learning period start). The fence line removed was facing southwest. The border of the virtual fence was three times moved 20 meters more south: after 6 days, 9 days and 12 days, respectively. On 10 June 2021 the three remaining physical sides of the fence were removed, leaving only virtual borders and the area was expanded to 35 hectares (
Appendix A,
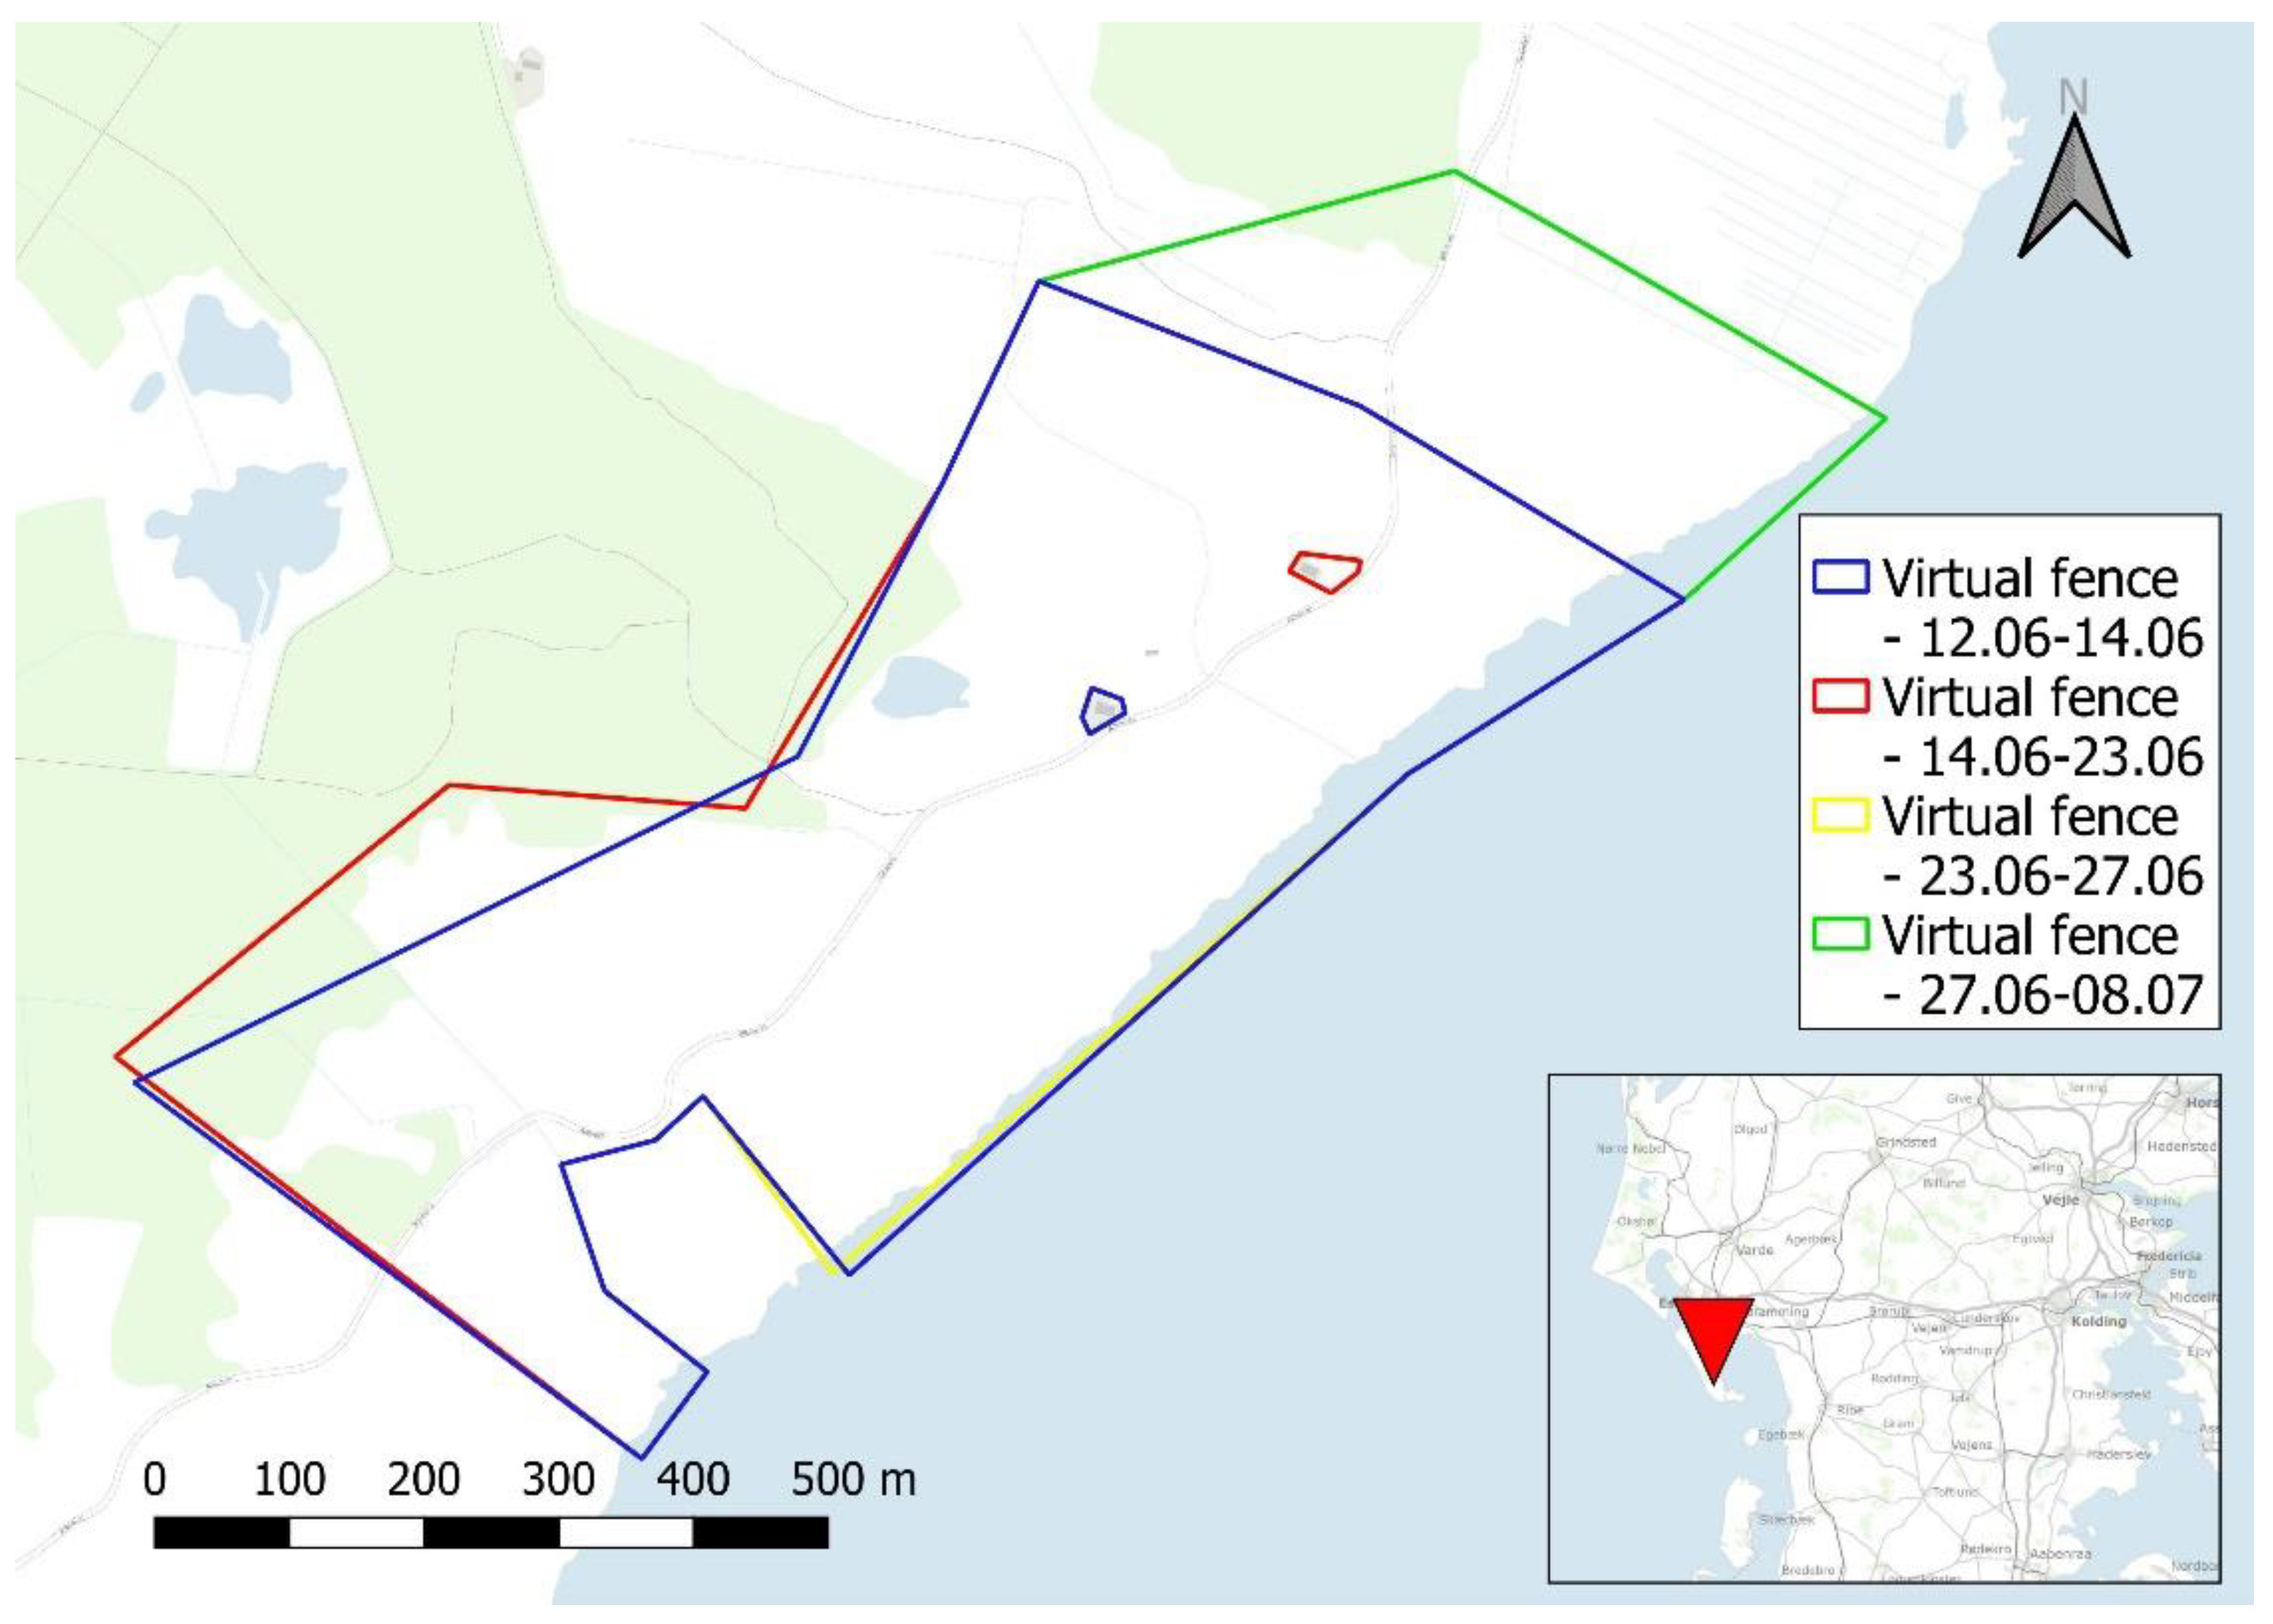
Figure A2) (the beginning of the observation period). To standardise the experiment, data collection for this and other learning periods was kept to the first 11 days of the learning period (30 May to 8 June 2021). The following observation period took place for 26 days (12 June to 8 July 2021) (
Appendix A,
Figure A3). During these 26 days, the pasture expanded from 35 to 37.7 hectares.
2.2.2. Investigation B (Instant Learning Process)
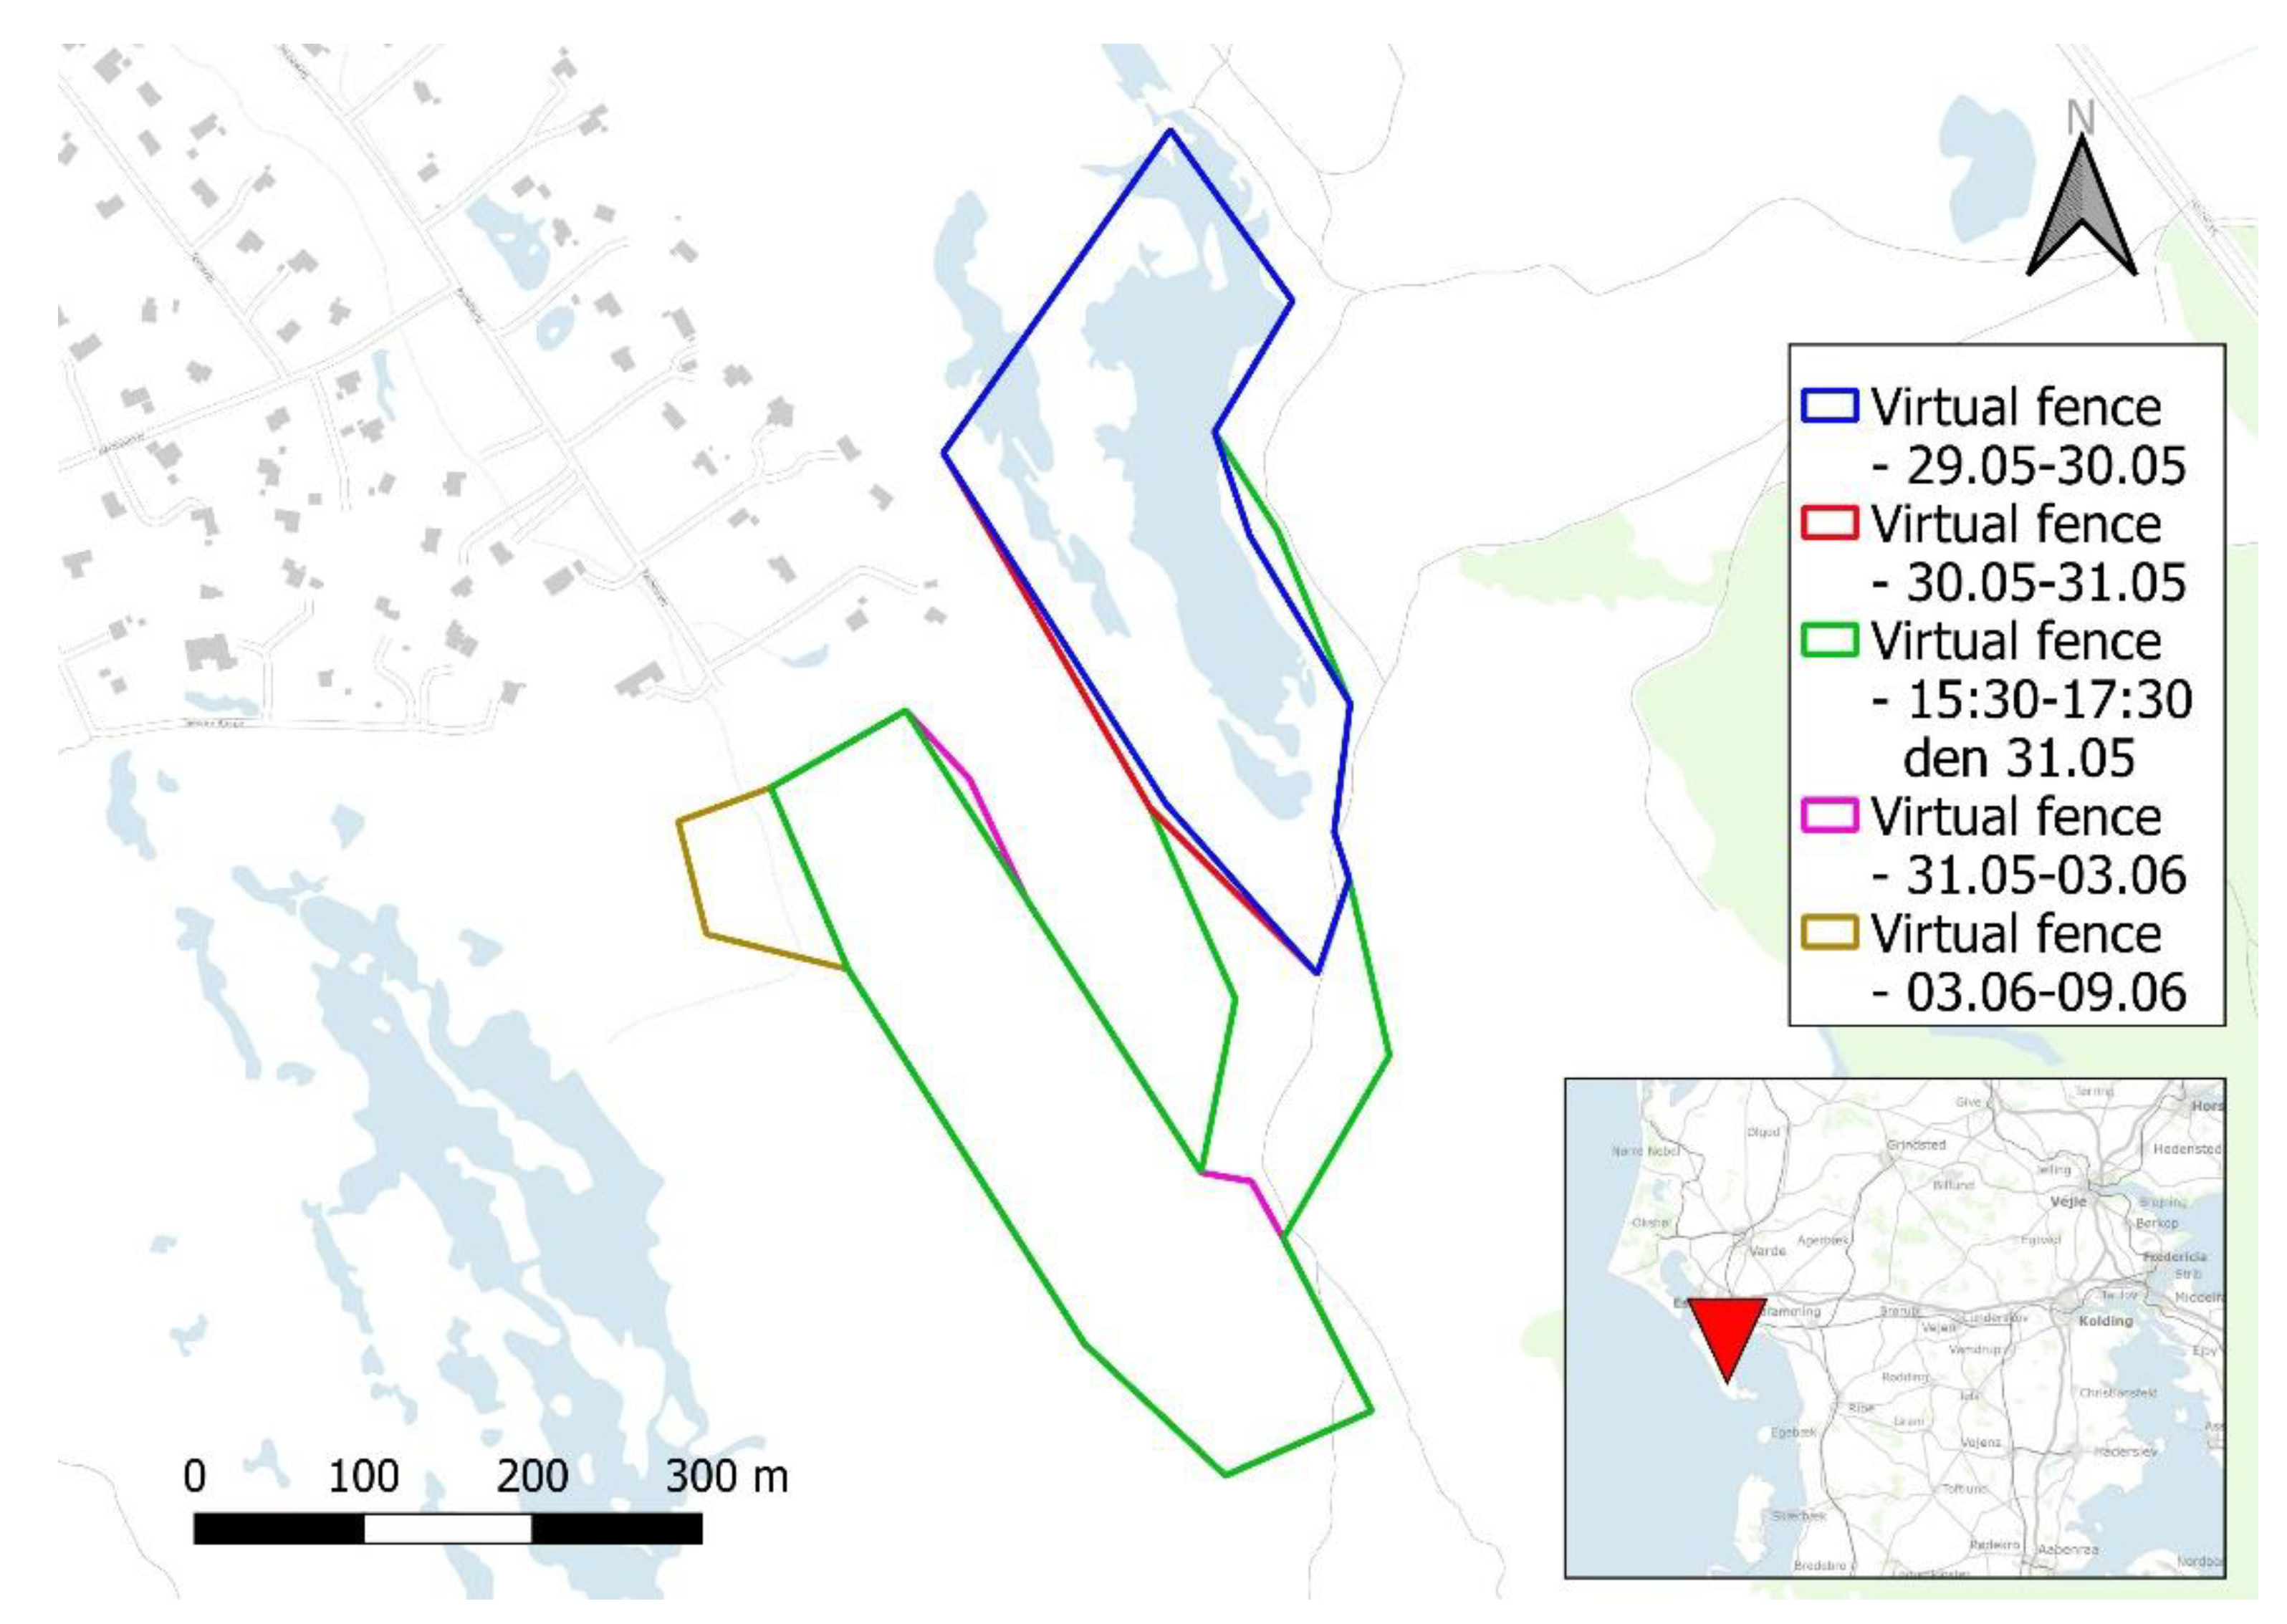
Investigation B was located on the west side of Fanø (named Gåsehullerne). The area consisted mainly of grey dunes and humid dune slacks, dominated by heather and creeping willow respectively. On 6 May 2023, 16 heifers (age < 2 years) and one experienced cow (age: 11 years) were placed in a physical electrical fence of 5.6 hectares. Under review of the data of the inexperienced cattle, the experienced cow was excluded, but data can be found in appendix B. On 29 May 2023, the entire physical fence was removed and replaced with a virtual fence. On 30 May 2023 the area was expanded to 5.8 hectares and on 31 May 2023 (in the morning) to 6.0 hectares. Same afternoon, the cattle were moved to a new 5.6 hectares area. This new area was expanded to 6.2 hectares on 3 June 2023. The learning period was between 29 May and 9 June 2023, (
Appendix A,
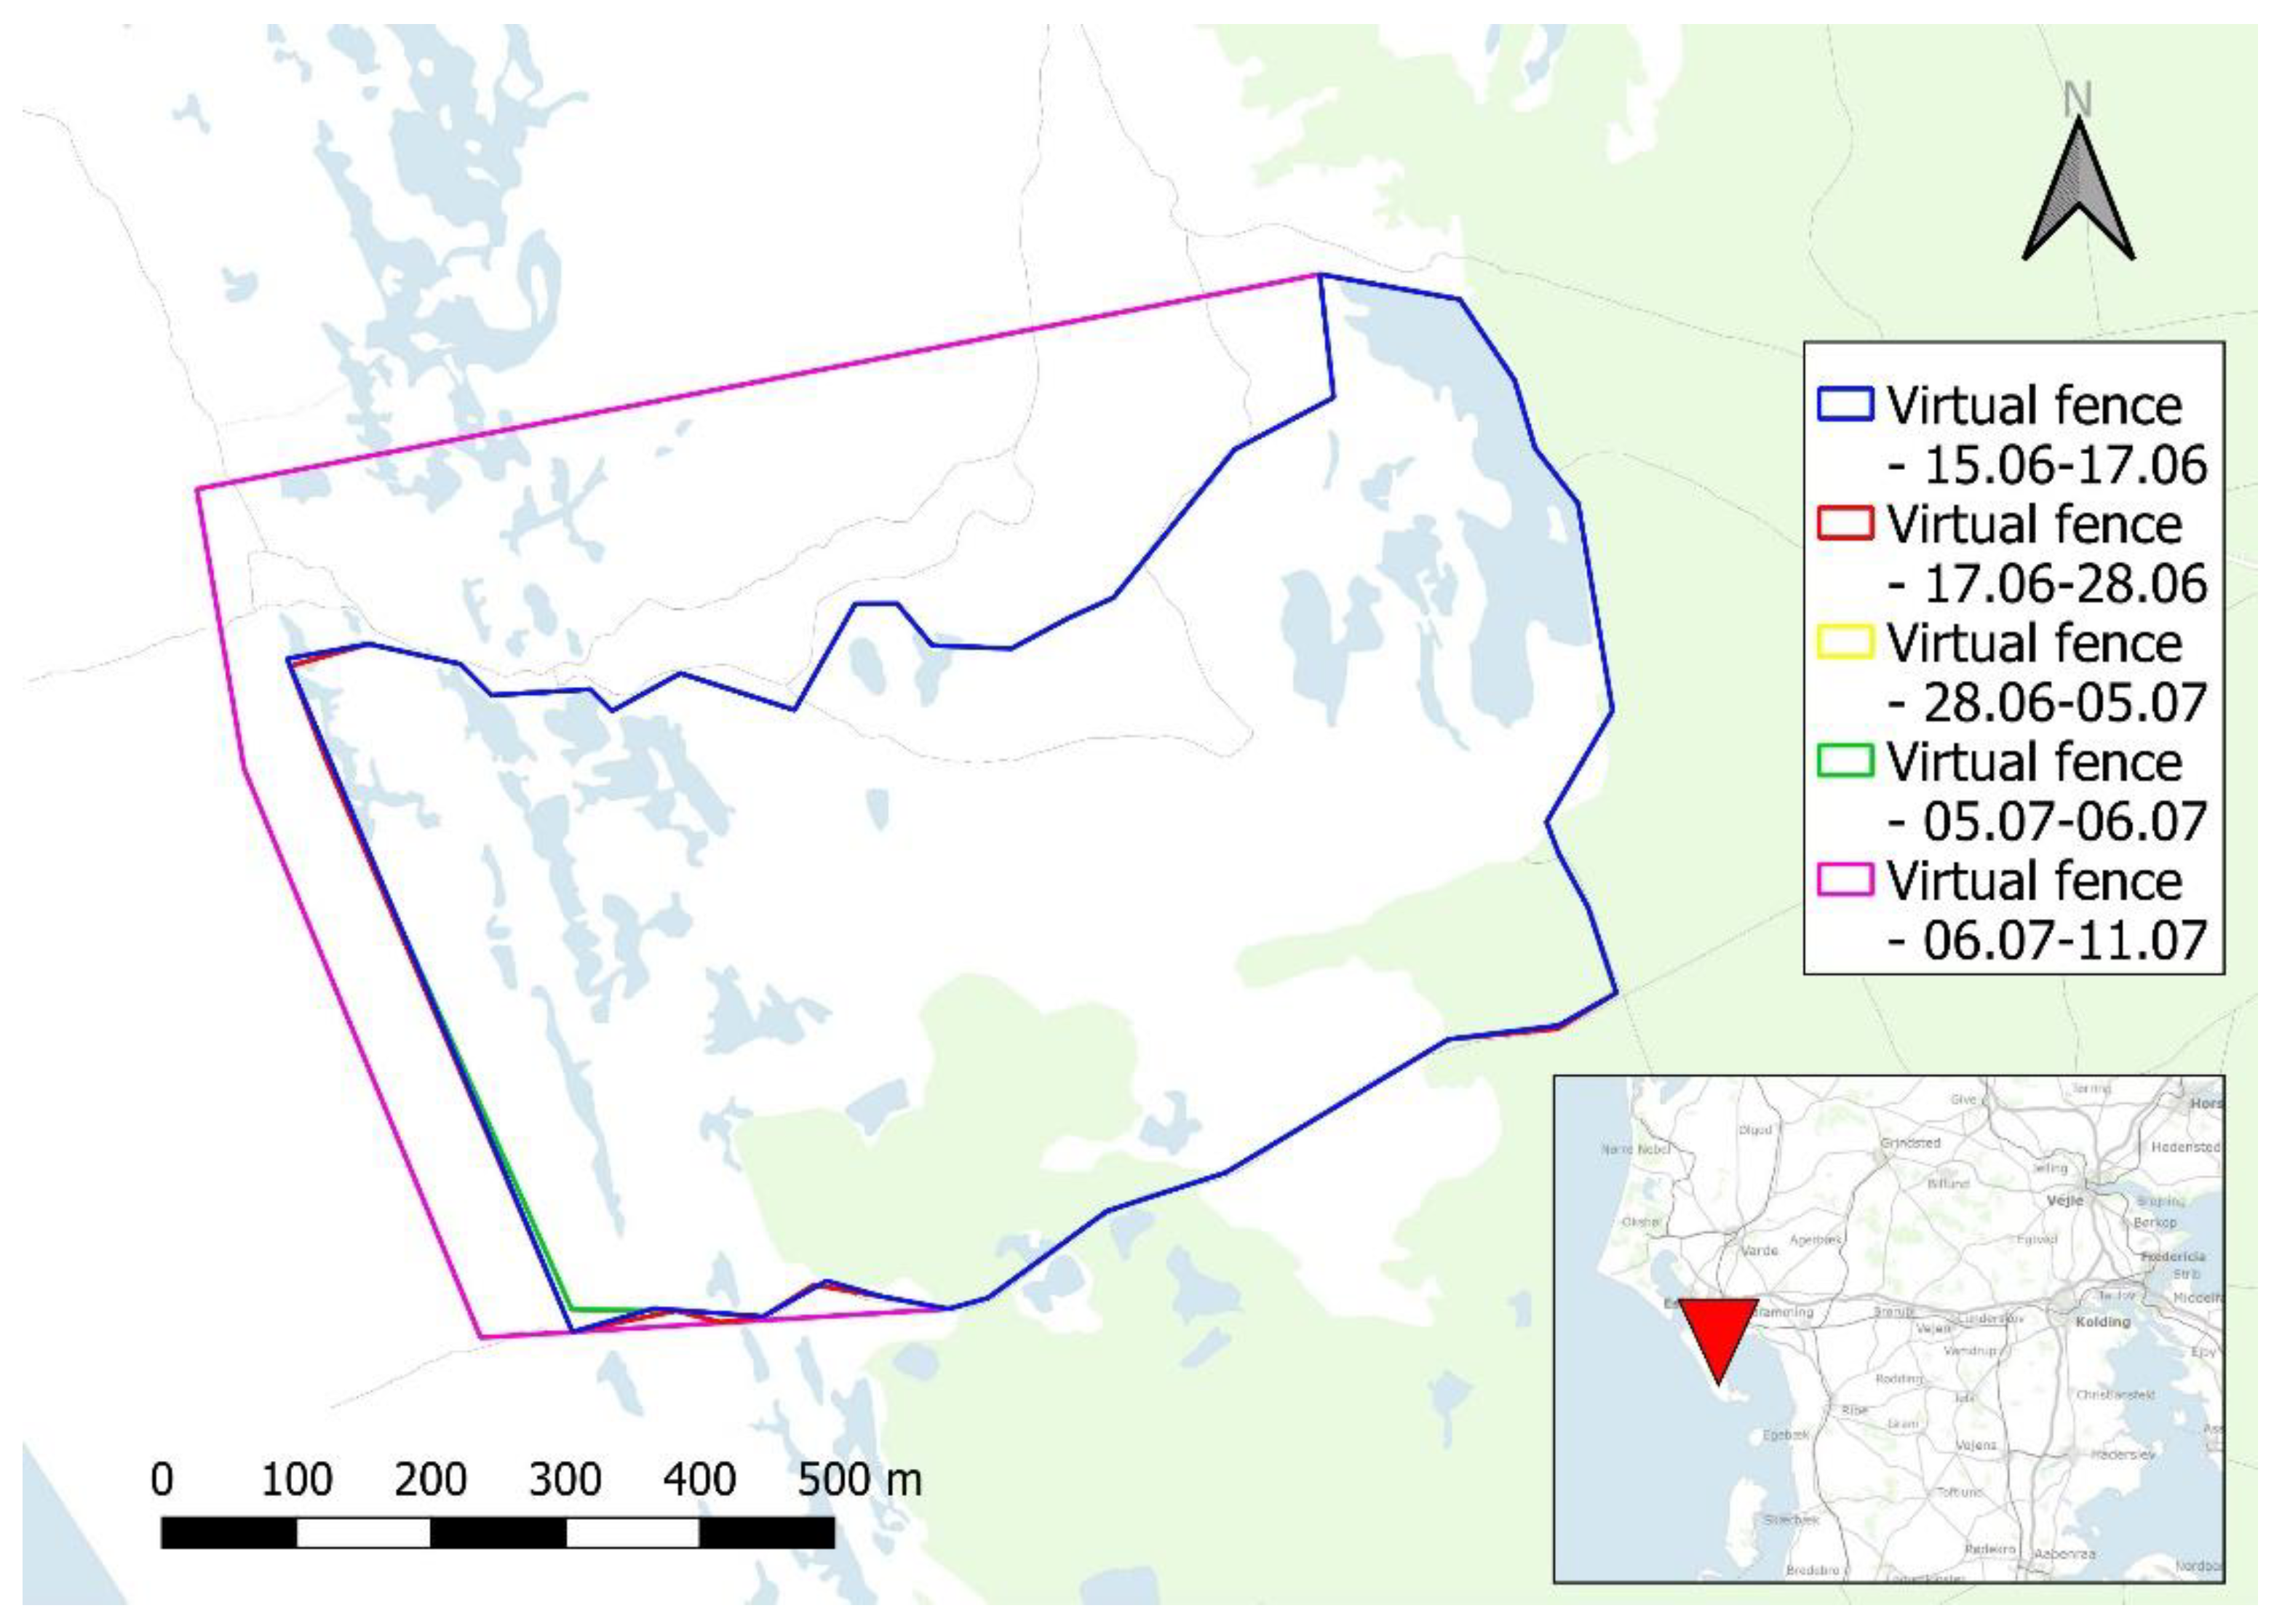
Figure A4). In the following 26 days observation period (15 June 2023 to 11 July 2023), the area varied from 42.5 to 61.4 hectares (
Appendix A,
Figure A5).
2.2.3. Investigation C (Instant Introduction)
Investigation C was located on Albuen, sharing the same individuals as in investigation A. Two cows were removed from the pasture on 1 October 2022 and 3 November 2022, respectively. One inexperienced cow (age: 2 years) per day was added to the herd of ten experienced cows on 7, 9, and 11 November 2022, respectively. Only data from the inexperienced cows were used for data analyses, but data from experienced cattle can be found in appendix B. The area was constant at 67.8 hectares throughout the experiment (
Appendix A,
Figure A6). The learning process was restricted to 11 days (7, 9, 11 November to 18, 20 and 22 November 2022) and the observation period to 26 days (18, 20, 22 November to 14, 16 and 18 December 2022).
2.3. Statistical Analysis
All figures and analyses were conducted in R-studio. The following tests have been conducted: Boxplots were made to visualise impulses given per day, warnings given per day and impulses given per warning. The data illustrated skewness of the distributions and outliers, therefore median, median absolute deviation (MAD), and non-parametric tests were used. To test for differences in medians between all pastures, a Wilcoxon rank-sum test was carried out to investigate for significance. Levene´s test was performed to test for significance in variance between impulses given per warning on each pasture. A significance level of p<0.05 were used to determine if the null hypothesis was rejected.
3. Results
3.1. Impulse Frequences
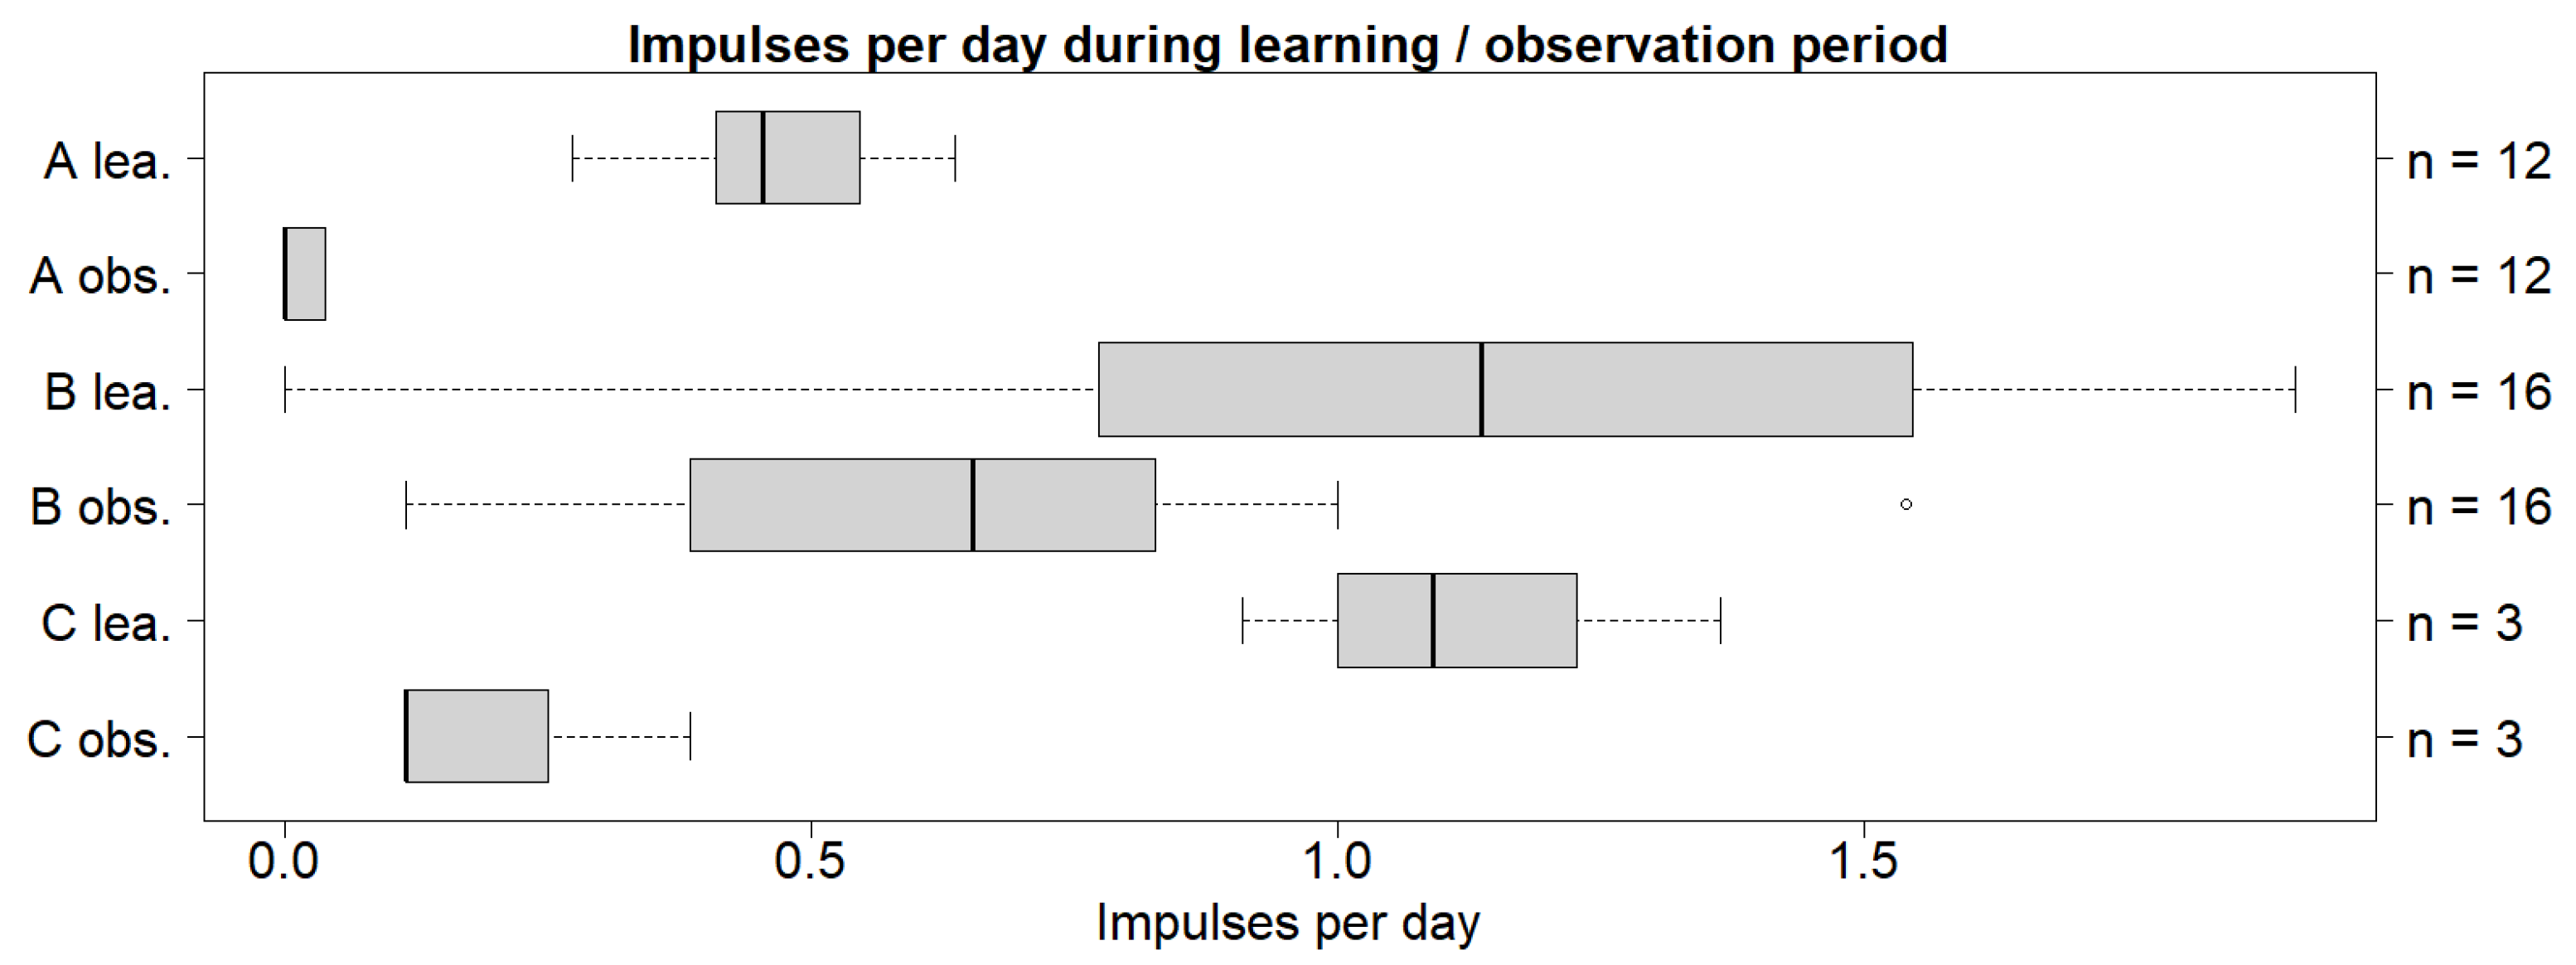
Cattle on all three pastures received fewer impulses during the observation period than their corresponding learning process. The cattle in investigation A have the lowest number of impulses per day in both learning- and observation periods with a median of 0.45 and 0.14, respectively (
Figure 1).
There was a significant difference in medians for the learning periods between A and the two other pastures (A<B and A<C), but no significance was found between B and C. During the observation period there was a significant difference between all three pastures (A<C<B). Significance was found between the learning- and observation period for A and B (observation<learning), but not for C (Table 1).
Table 1.
Impulses per warning during the learning period compared to impulses per warning during the observation period. lea. = learning period. obs. = observation period. MAD = median absolute deviation. The difference in median was tested using Wilcoxon rank-sum test. The difference in variance was tested using Levene’s test. Significant values are indicated with asterisk (*) when p < 0.05 for both tests.
| |
Comparison |
Median ± MAD |
Difference between median (%) |
Wilcoxon rank-sum test |
Levene’s test |
| Impulses per day during learning period |
A |
0.45 ± 0.14 |
86.8 |
0.00012 * |
0.00057 * |
| B |
1.14 ± 0.61 |
| A |
0.45 ± 0.14 |
83.1 |
0.010 * |
0.17 |
| C |
1.09 ± 0.27 |
| B |
1.14 ± 0.61 |
4.1 |
1 |
0.16 |
| C |
1.09 ± 0.27 |
| |
|
|
|
|
|
| Impulses per day during observation period |
A |
0 |
- |
7.03 · 10-6 * |
0.0011 * |
| B |
0.65 ± 0.31 |
| A |
0 |
- |
0.0056 * |
0.083 |
| C |
0.12 ± 0 |
| B |
0.65 ± 0.31 |
140.1 |
0.038 * |
0.24 |
| C |
0.12 ± 0 |
| |
|
|
|
|
|
| Impulses per day during learning- and observation period |
A lea. |
0.45 ± 0.14 |
- |
2.28 · 10-5 * |
0.0040 * |
| A obs. |
0 |
| B lea. |
1.14 ± 0.61 |
53.8 |
0.0053 * |
0.14 |
| B obs. |
0.65 ± 0.31 |
| C lea. |
1.09 ± 0.27 |
161.7 |
0.077 |
0.64 |
| C obs. |
0.96 ± 0.91 |
3.2. Warning Frequences:
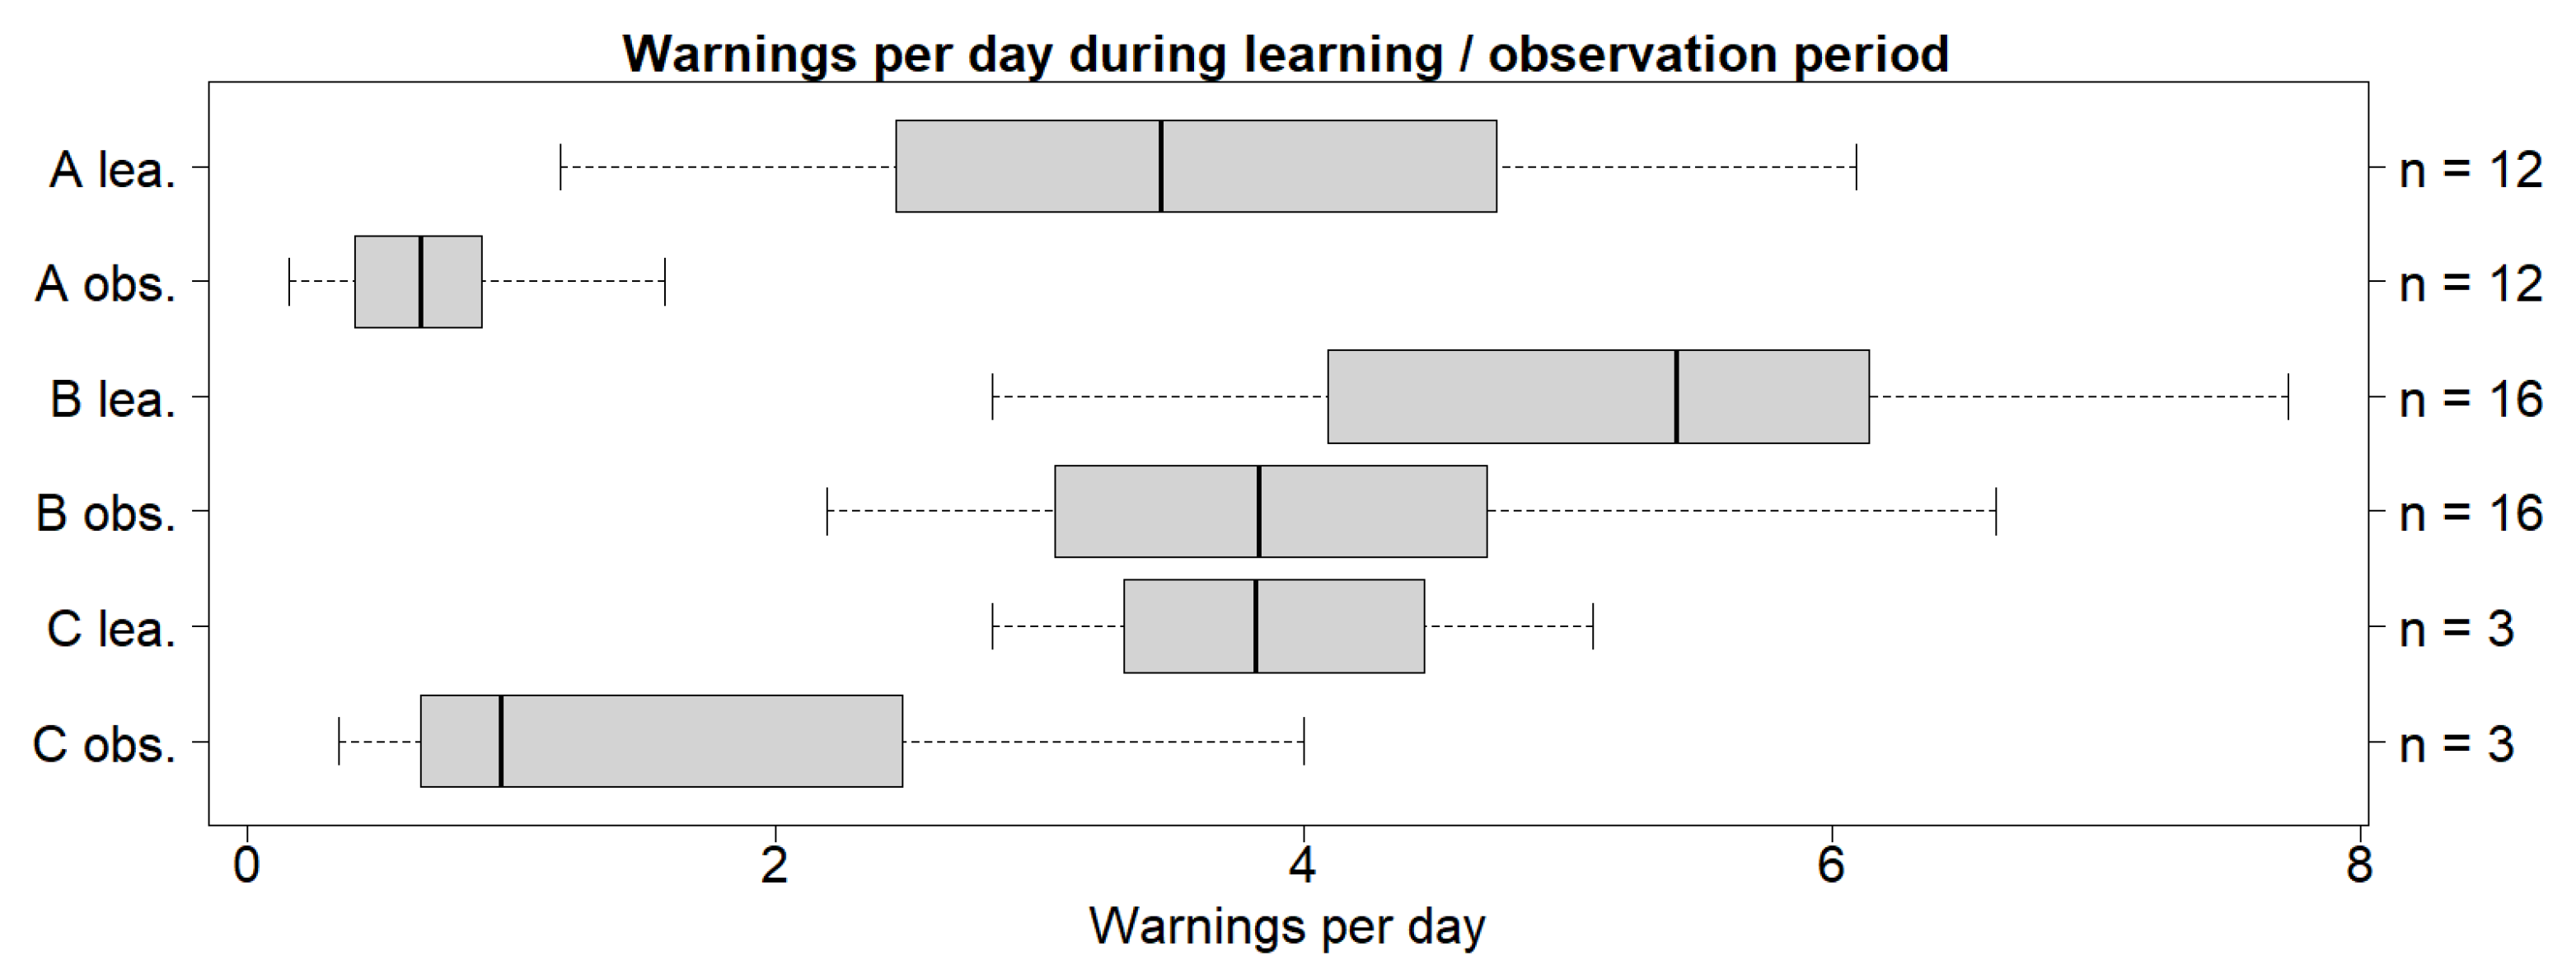
Cattle on all three pastures received fewer warnings during the observation period than their corresponding learning process (
Figure 2).
There was a significant difference in warnings per day during both the learning and observation period between A and B (A<B), but no significance was found between A and C or B and C. Significance differences in means was found between A and B (A<B) when the learning- and observation periods were compared, but not for C.
Table 2.
Warnings per day during learning- and observation period. lea. = learning period. obs. = observation period. MAD = median absolute deviation. The difference in median was tested using Wilcoxon rank-sum test. The difference in variance was tested using Levene’s test. Significant values are indicated with asterisk (*) when p < 0.05 for both tests.
| |
Comparison |
Median ± MAD |
Difference between median (%) |
Wilcoxon rank-sum test |
Levene’s test |
| Warnings per day during learning period |
A |
3.46 ± 1.62 |
44.0 |
0.015 * |
0.89 |
| B |
5.41 ± 1.55 |
| A |
3.46 ± 1.62 |
9.9 |
0.72 |
0.42 |
| C |
3.82 ± 1.48 |
| B |
5.41 ± 1.55 |
34.5 |
0.20 |
0.23 |
| C |
3.82 ± 1.48 |
| |
|
|
|
|
|
| Warnings per day during observation period |
A |
0.65 ± 0.34 |
141.6 |
9.22 · 10-6 * |
0.0051 |
| B |
3.83 ± 1.20 |
| A |
0.65 ± 0.34 |
38.1 |
0.43 |
0.049 * |
| C |
0.96 ± 0.91 |
| B |
3.83 ± 1.20 |
119.7 |
0.11 |
0.59 |
| C |
0.96 ± 0.91 |
| |
|
|
|
|
|
| Warnings per day during learning- and observation period |
A lea. |
3.46 ± 1.62 |
136.7 |
4.64 · 10-5 * |
0.0016 * |
| A obs. |
0.65 ± 0.34 |
| B lea. |
5.41 ± 1.55 |
34.3 |
0.023 * |
0.22 |
| B obs. |
3.83 ± 1.20 |
| C lea. |
3.82 ± 1.48 |
119.5 |
0.40 |
0.67 |
| C obs. |
0.96 ± 0.91 |
There was a clear decrease in impulses during learning- and observation periods. Fewer impulses, but unchanged warnings indicate the cattle learning the system. Comparing the number of impulses a cow receives per warning is therefore determined to be a better indication of learning.
3.3. Impulses per Warning during the Learning Periods for A, B and C
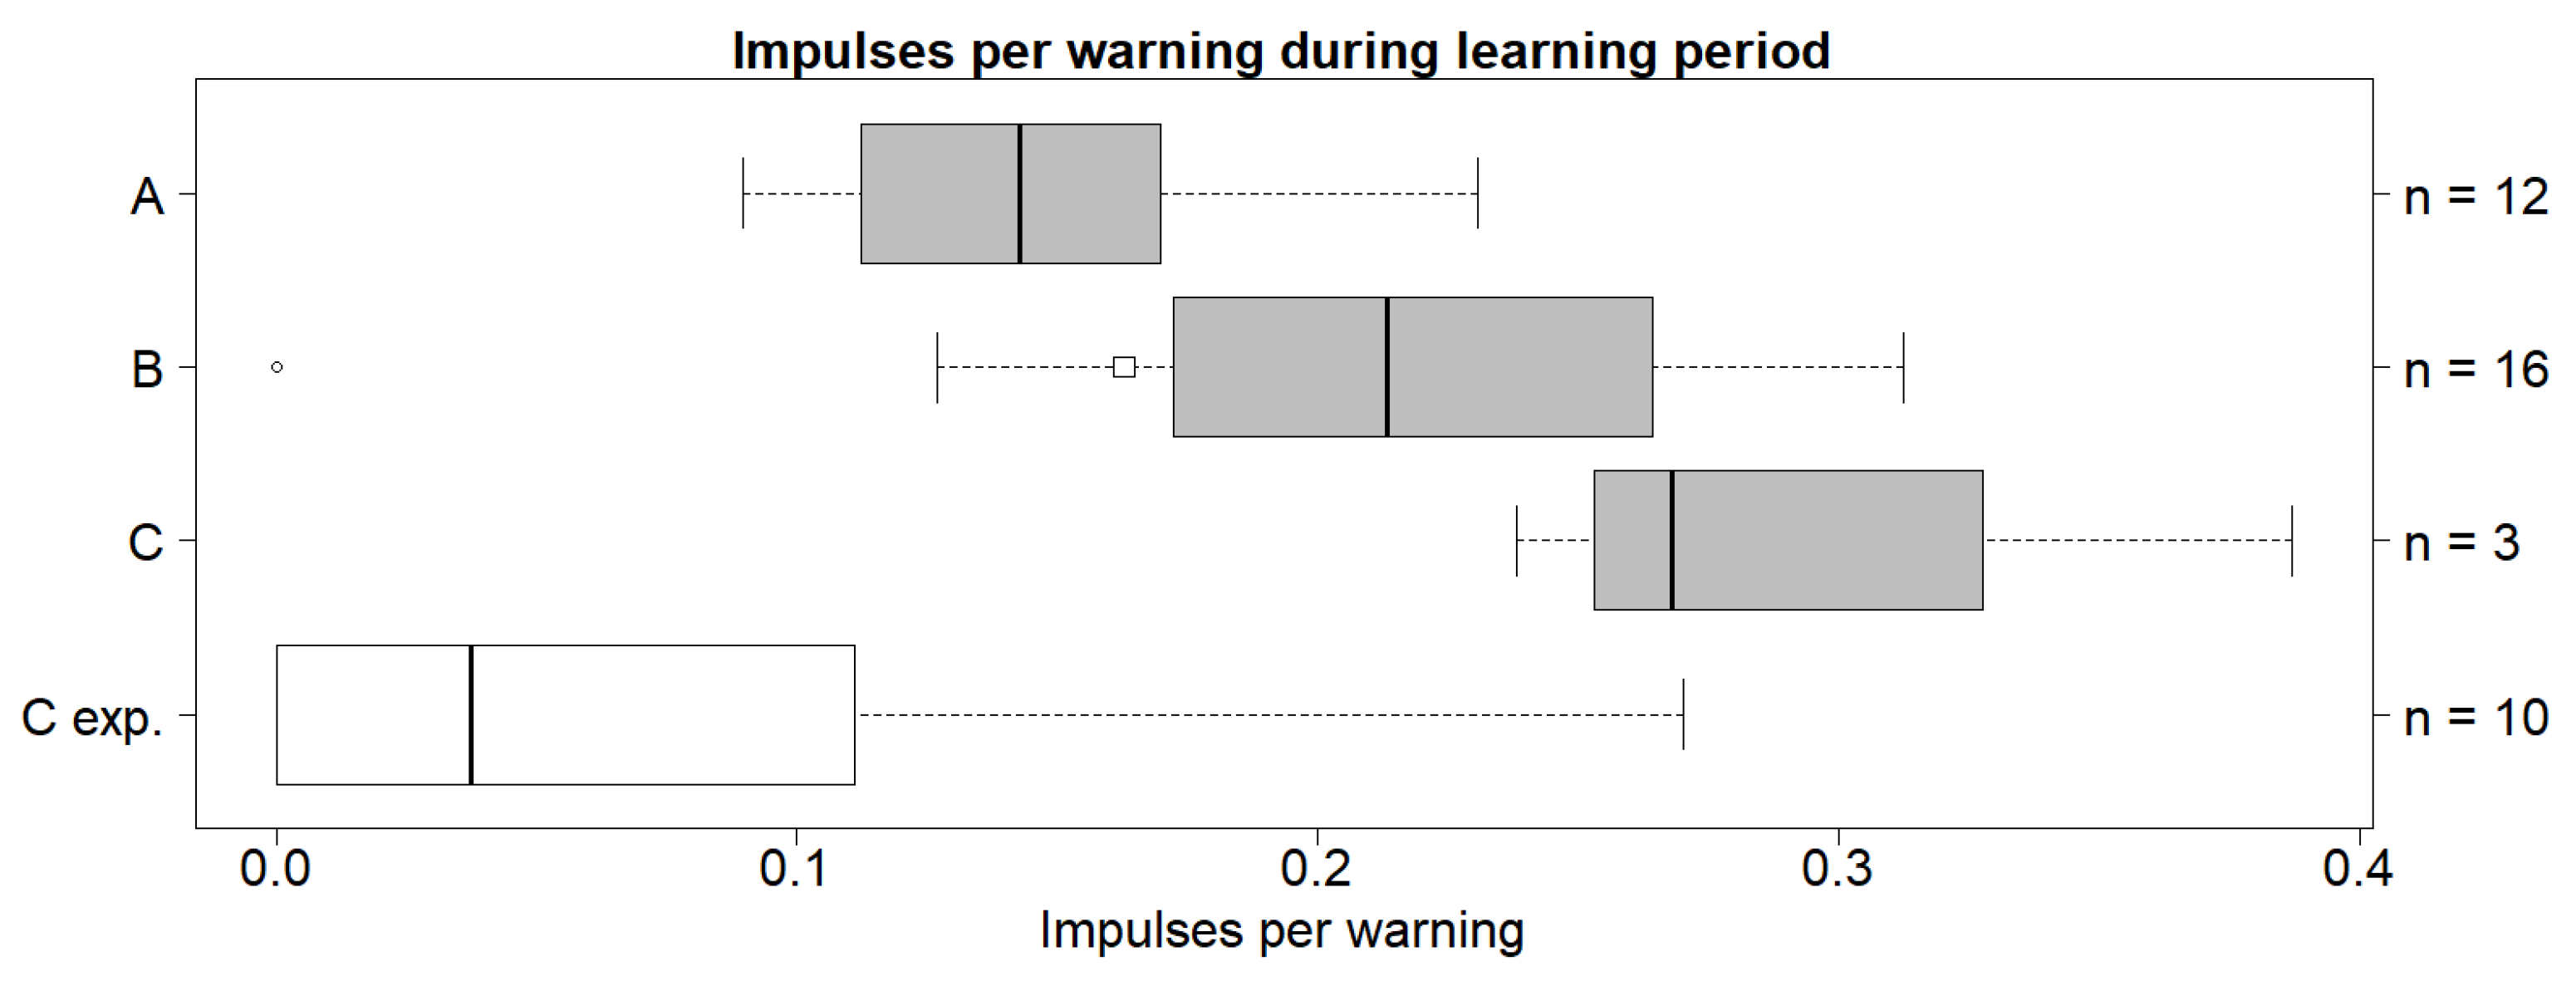
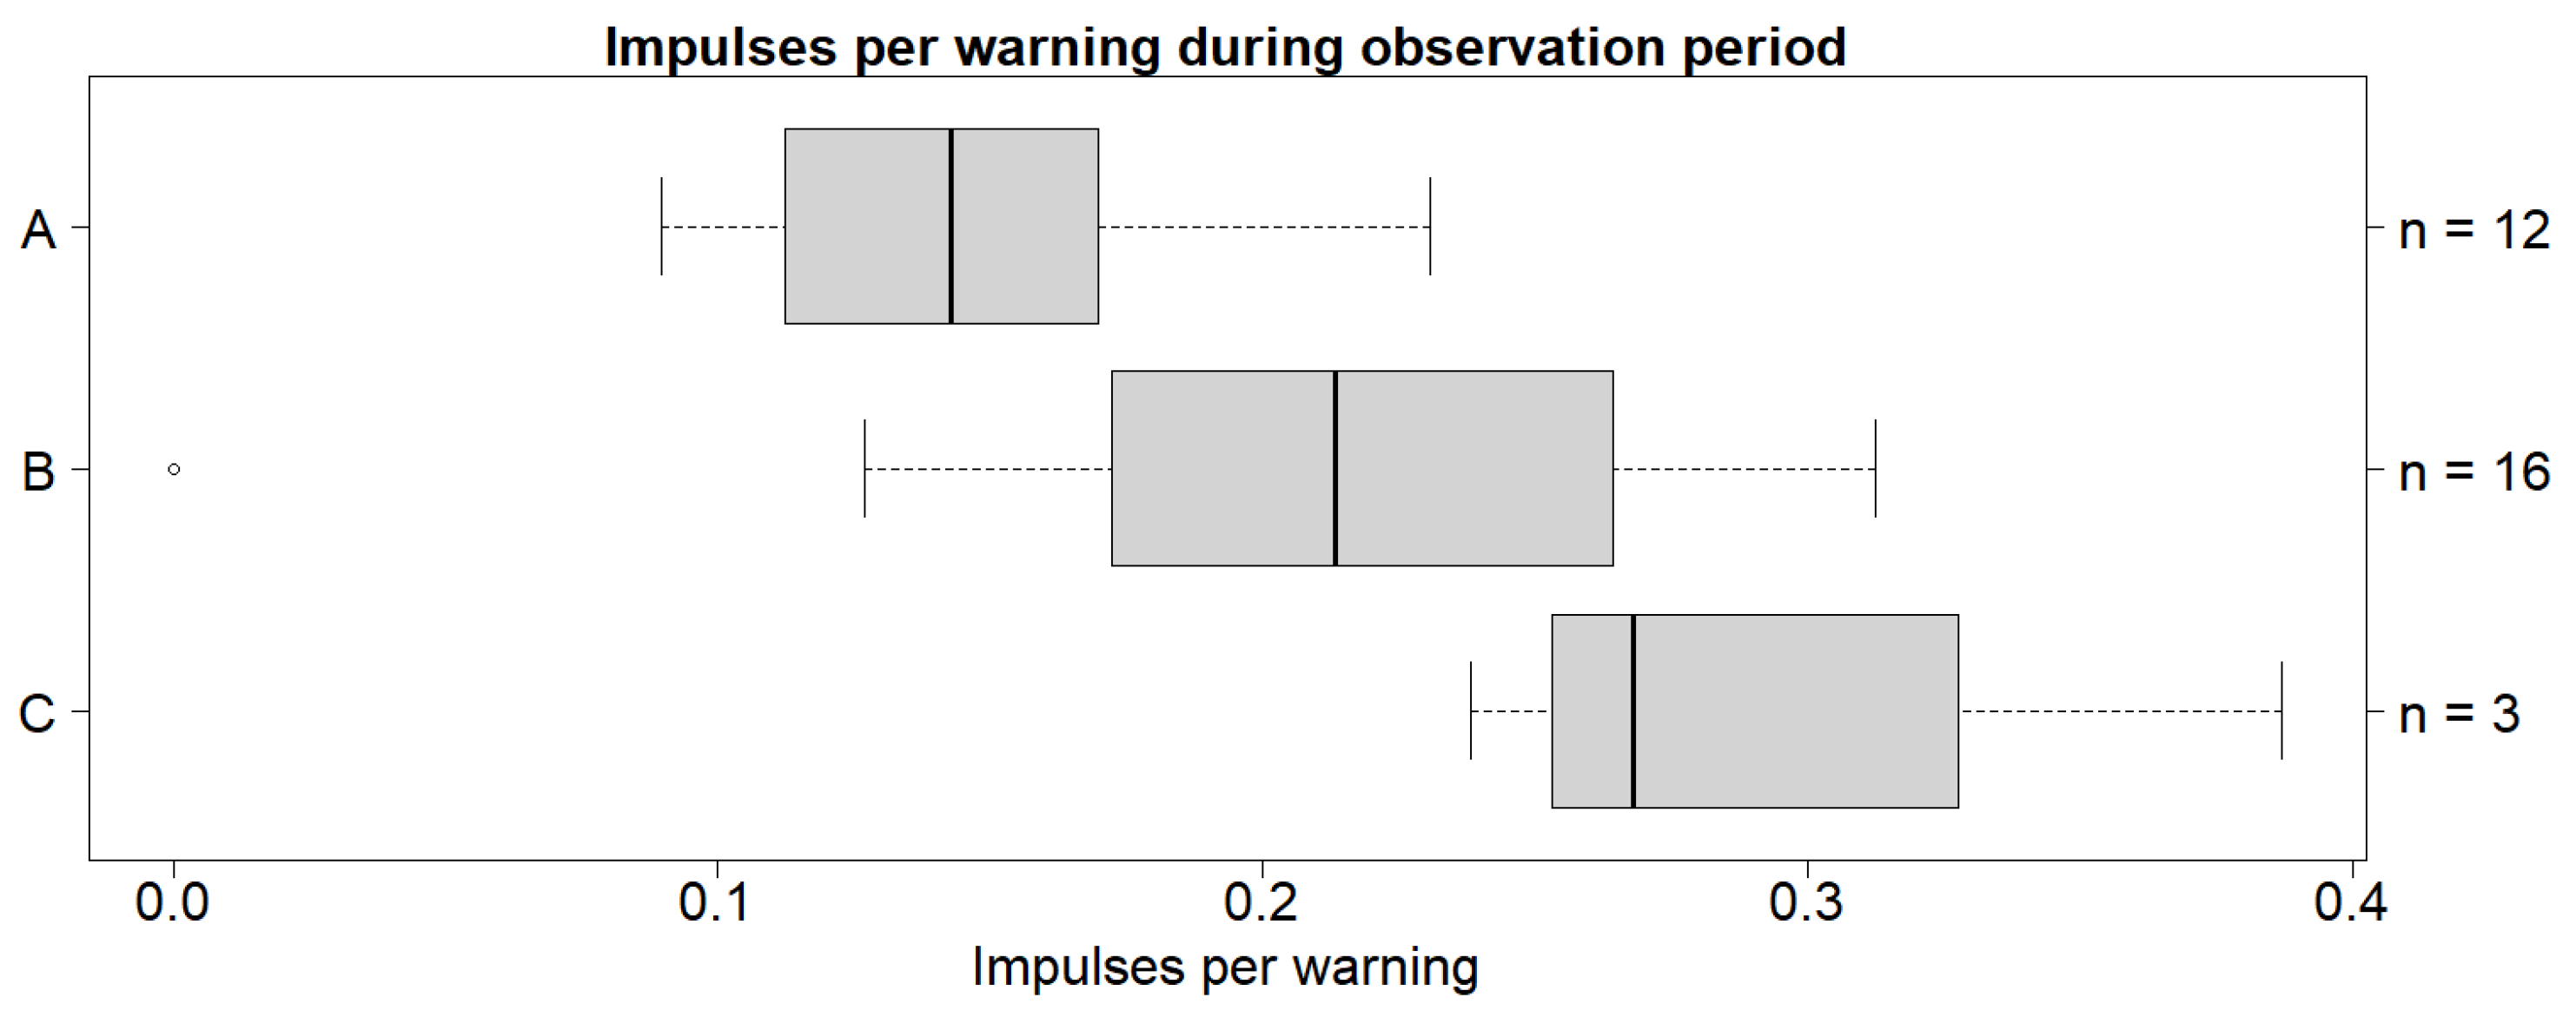
The cattle in investigation A received the fewest impulses per warning, with a median of 0.14 impulses/warning. The investigation with the most impulses given per warning was C with a median of 0.24 impulses/warning. The median number of impulses per warning received by the animals in investigation B was 0.21 impulses/warning (
Figure 3).
Median impulses per warning was significant lower in A compared to B and C with a 40% difference to B and a 52.6% difference to C. There was no significant difference between B and C. The variance in A, B and C were non-significant (Table 2). Based on this, the number of impulses per warning given during the learning period did not coincide with the number of experienced cattle.
Table 3.
Impulses per warning during the learning period, distributed across three investigations (A, B and C) following the 11 days from the start of each experiment. MAD = median absolute deviation. The difference in median was tested using Wilcoxon rank-sum test. The difference in variance is tested using Levene’s test. Significant values are indicated with asterisk (*) with p < 0.05 for both tests.
| Comparison |
Median ± MAD |
Difference between median (%) |
Wilcoxon rank-sum test |
Levene’s test |
| A |
0.14 ± 0.04 |
40.0 |
0.0062 * |
0.16 |
| B |
0.21 ± 0.07 |
| A |
0.14 ± 0.04 |
52.6 |
0.0044 * |
0.42 |
| C |
0.24 ± 0.04 |
| B |
0.21 ± 0.07 |
13.3 |
0.14 |
0.87 |
| C |
0.24 ± 0.04 |
3.3. Impulses per Warning during the Observation Period with Experienced Cattle
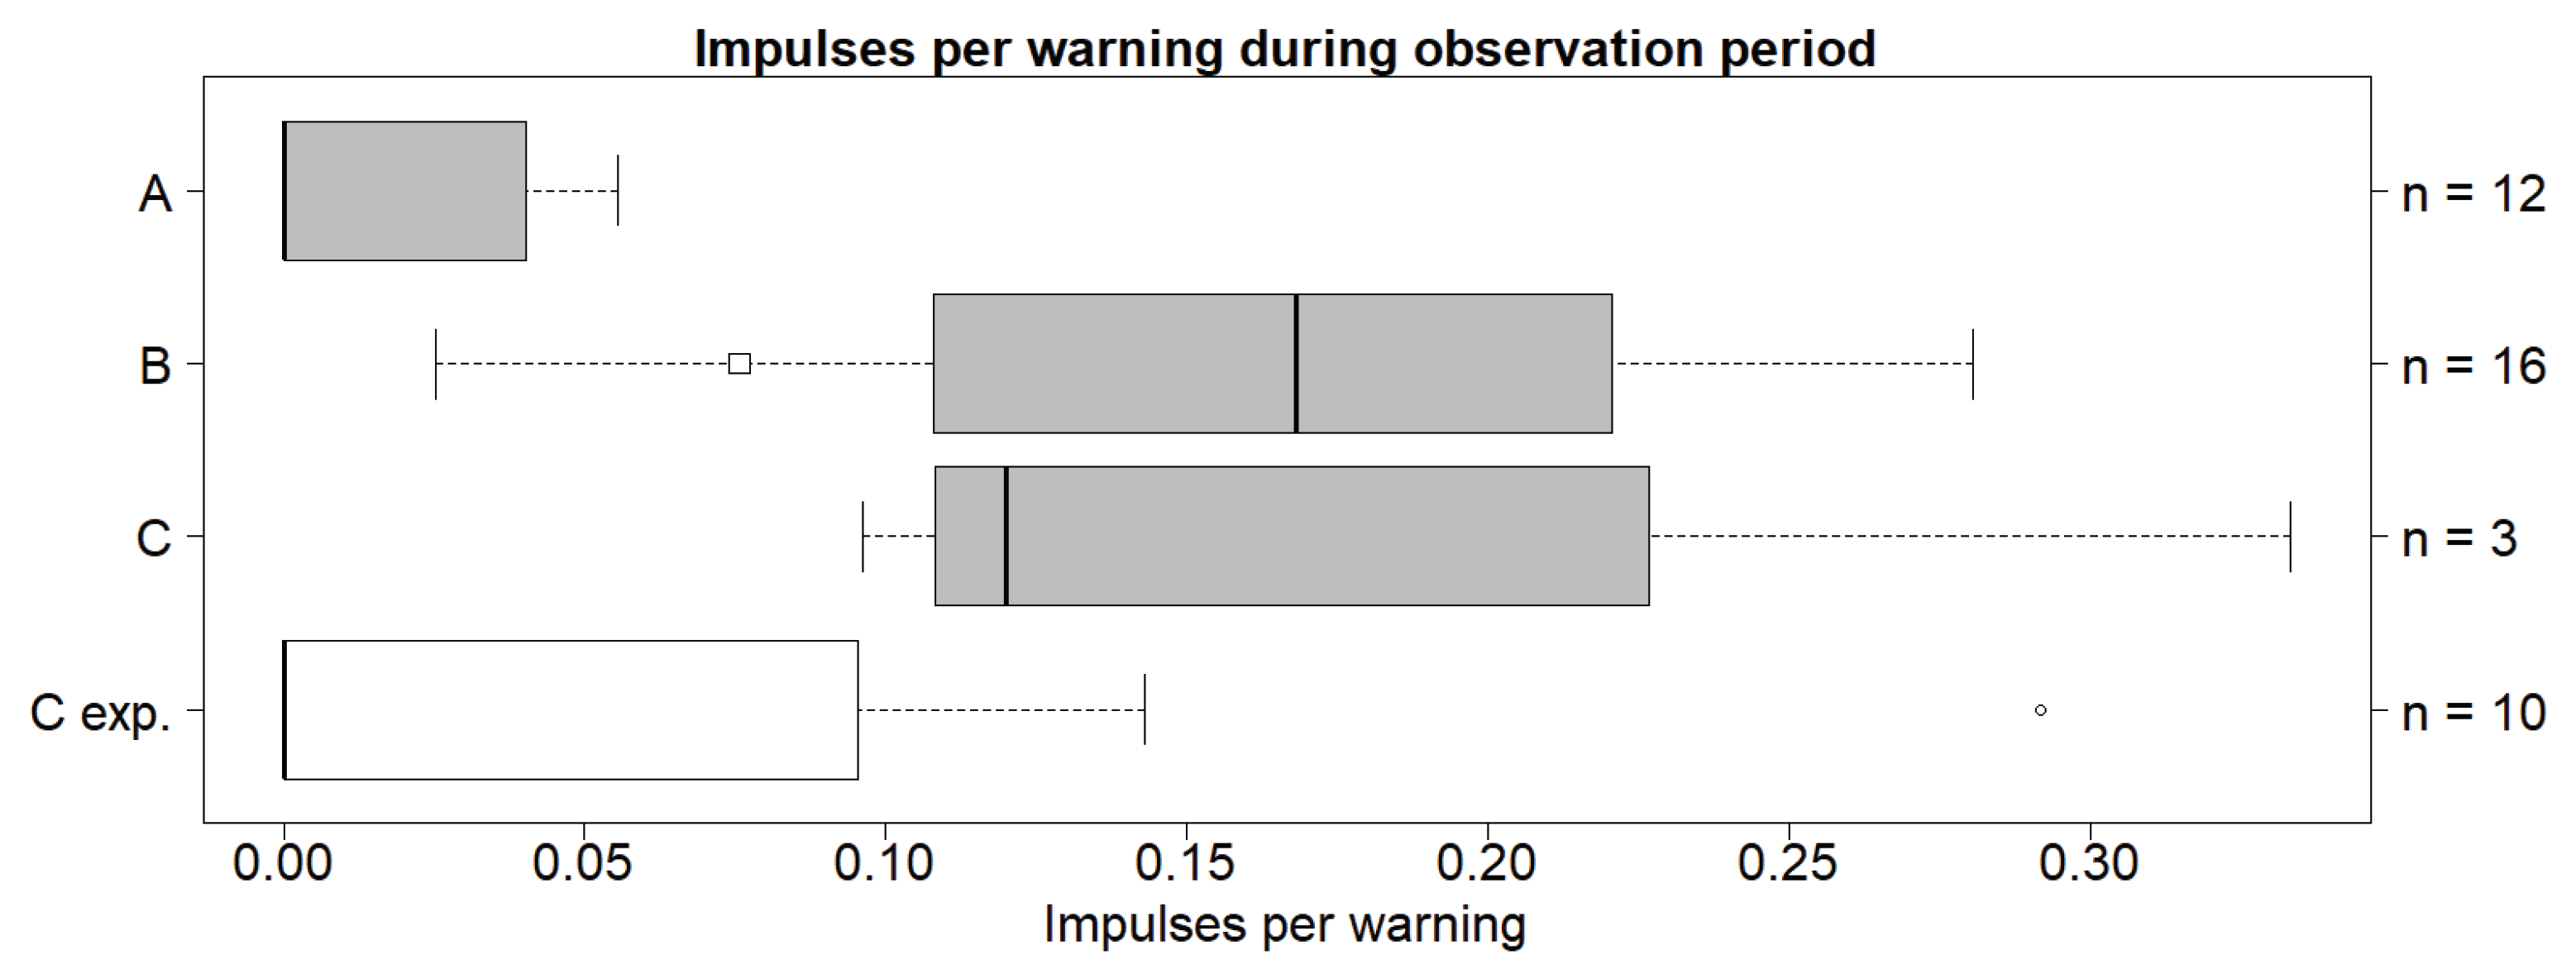
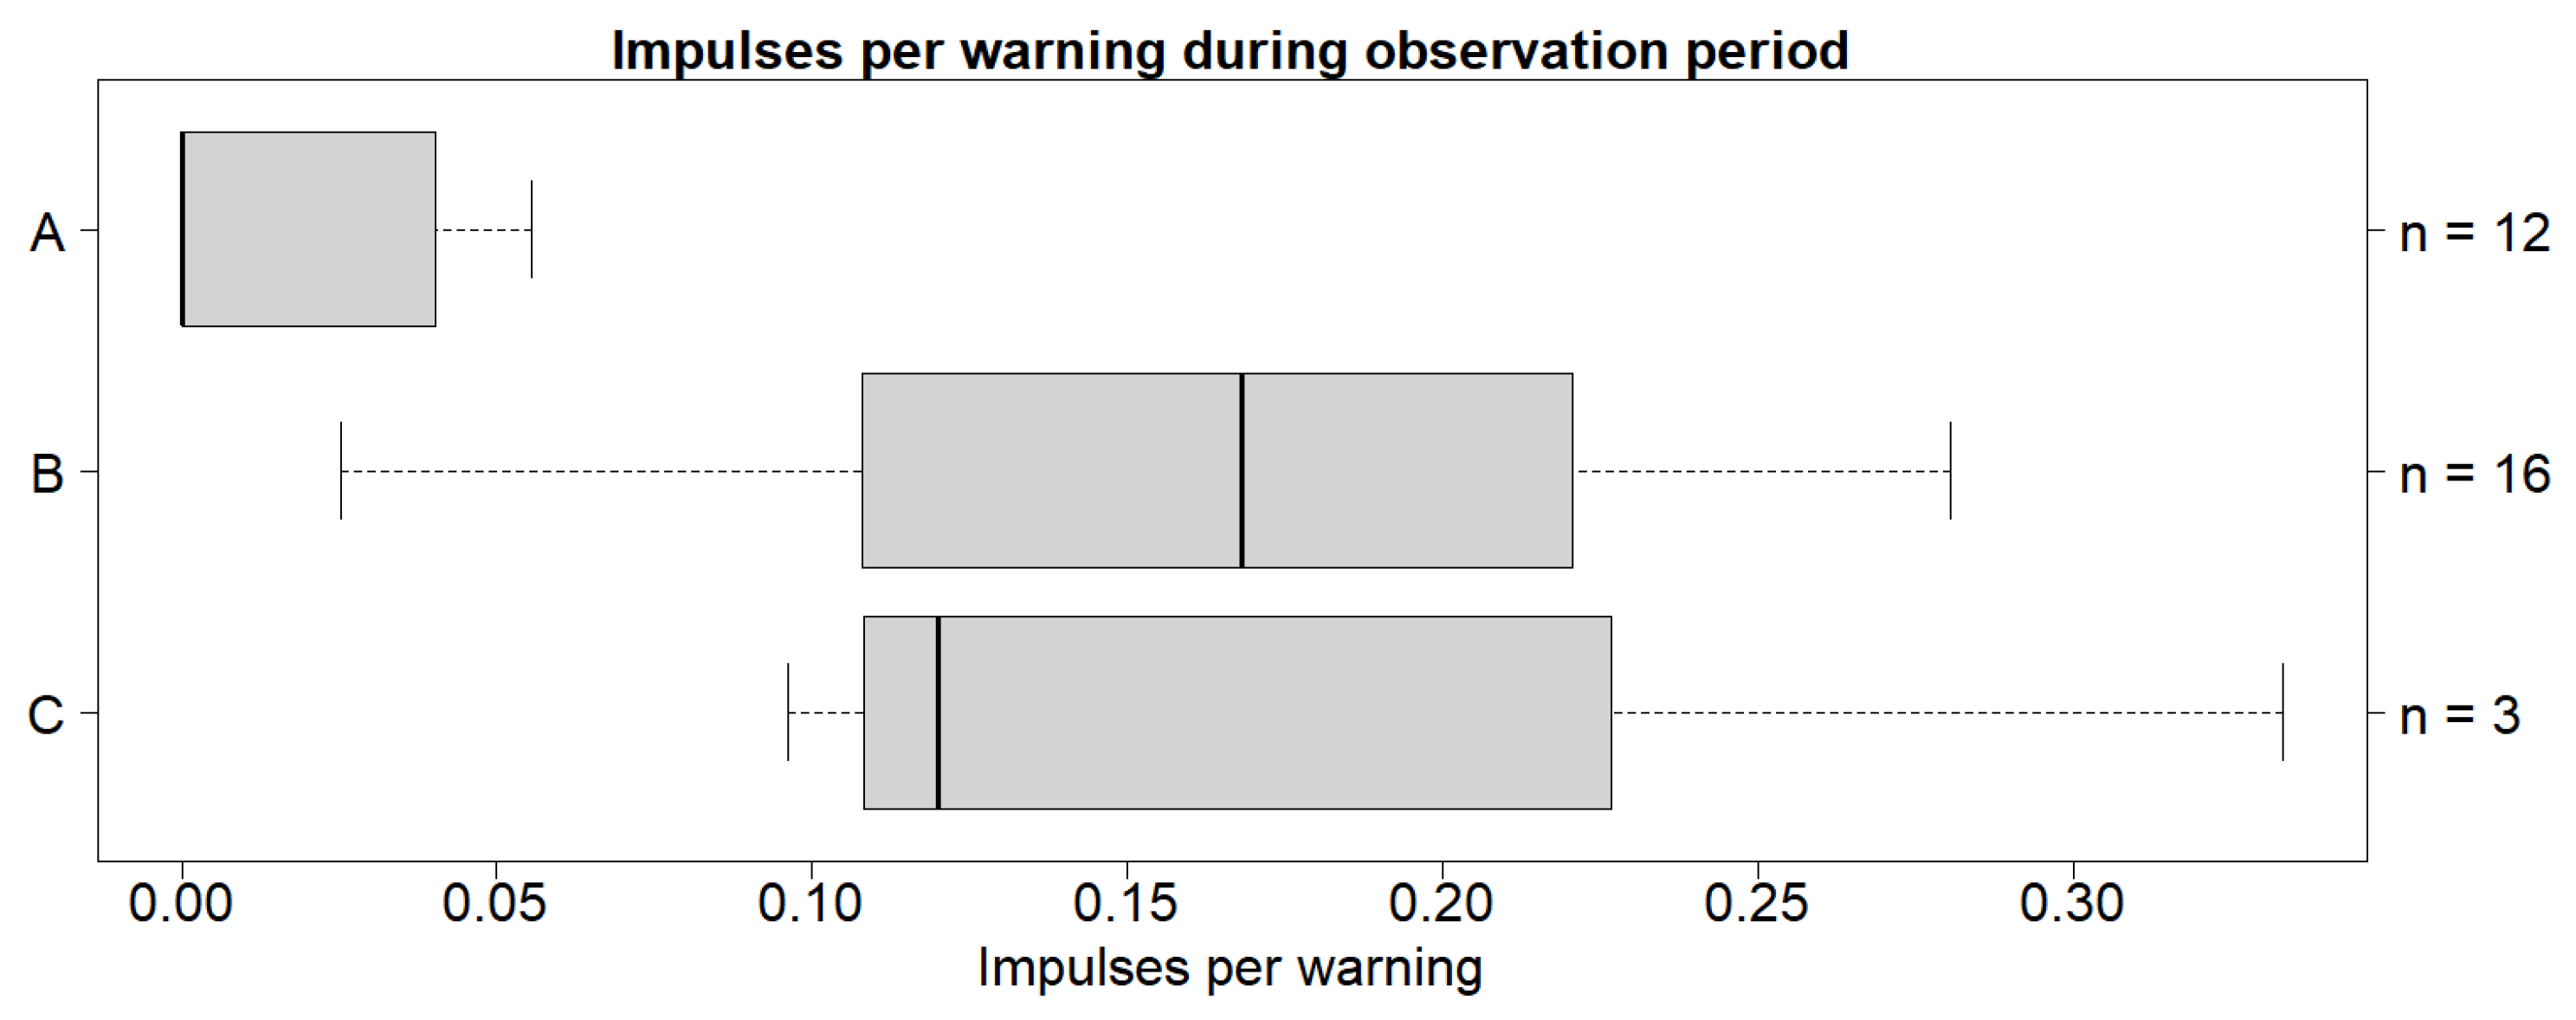
The cattle in investigation A received the fewest impulses per warning during the observation period compared to the two other investigations. The median for A was 0 impulses/warning, while the median for B and C were 0.17 impulses/warning and 0.12 impulses/warning respectively (
Figure 4).
Median impulses per warning between A and the two other investigations was significant. The difference between B and C was not significant. The difference in variance was significant lower in A than in B. However, there was no significant difference between A and C, and B and C (
Table 4). Based on this, the number of impulses per warning given during the observation period does not correlate to the number of experienced cattle.
3.4. Impulses per Warning for Learning Processes
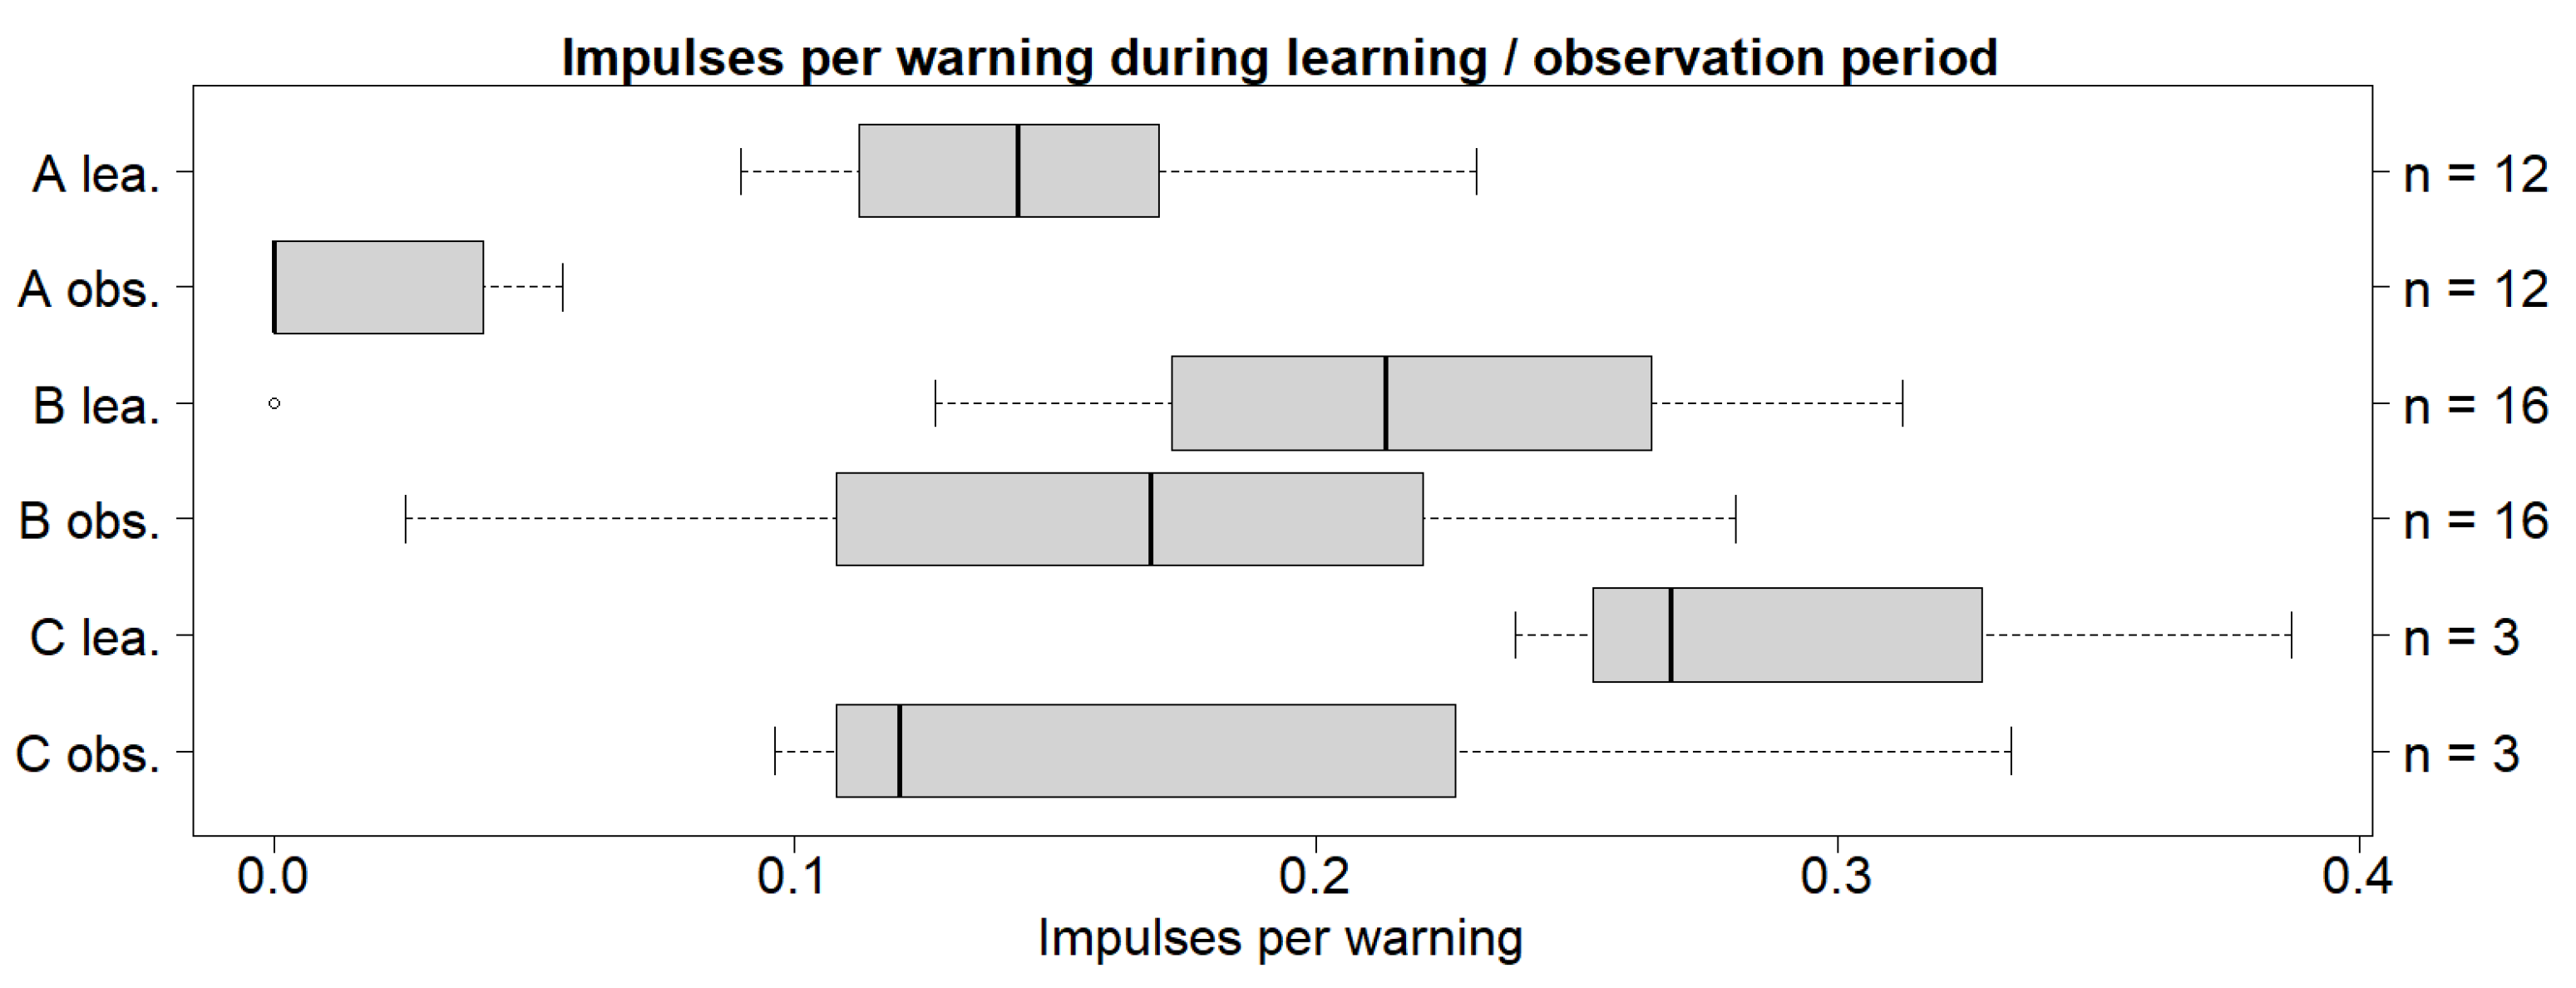
Impulses per warning for A in the observation period had a median of 0 impulses/warning while B had a median of 0.17 impulses/warning and C had a median of 0.12 impulses/warning. The lowest impulses per warning was found in the observation period for A, and the highest impulses per warning was found in the learning period for C (
Figure 5).
Investigation A was significant between the learning period and the observation period. Significance between medians was found for A, but not for B or C. However, the variance was not significant in any of the treatments (
Table 5). These results demonstrate that the learning process at A is more beneficial for lowering impulses per warning in contrast to C and B.
4. Discussion
4.1. Experienced Cattle’s Effect on Facilitated Learning
It was expected that the cattle would be able to adapt better to the virtual fence, by reducing impulses per warning, in the presence of experienced cattle in both the learning and observation periods. However, a significant improvement in associating warnings with impulses were shown. The field with gradual learning and instant learning (investigation B) were able to reduce both impulse per day and warnings per day, indicating adaptation to virtual fence. However instant introduction (Investigation C) was not able to significantly reduce impulses per day, warnings per day, or impulse per warning.
Interestingly, it appears that instant learning could not produce significant association between impulse and warning as the impulse per warning showed no significant difference. This trend exemplifies no associative learning for the virtual fencing could be found; however, according to [
17] cattle are able to make environmental associations when foraging, and it could be speculated that cattle are able to make association to the location of fence lines. Potentially group avoidance of the fence might be occurring, and therefore there might not be sufficient frequency of individual stimuli taking place to learn associatively [
18]. This concludes that overall impulse and warnings could be reduced it appears to be for other reasons than associative learning.
Based on the results, the field with no experienced cattle significantly reduced impulses per warning indicating associative learning. The fields with the presence of experienced cattle did not significantly reduce impulses per warning, indicating social facilitation were not able to significantly reduce the impulses per warning.
This does not follow previous studies that determined that cattle exhibit social facilitation in response to virtual fences and foraging. Keshavarzi et al. (2020) showed cattle were able to respond to virtual fence lines as a herd rather than as an individual, showing social facilitation through a leader cow [
15]. Bailey et al. (2000) demonstrated that cows with previous knowledge of food-rewards in a maze, can function as social models and provide visual cues to other animals as to where these food-rewards are located [
19]. This further validates cattle’s ability to socially facilitate in response to an experienced cow.
This study does not show clear signs of social facilitation in relation to virtual fencing, as the presence of experienced cattle does not lower impulse per warning for the inexperienced animals. This may be explained by a study by Marini et al. (2020), which suggests that controlling the movement of sheep requires at least 66% of sheep to be donned with a collar to encourage non-collard sheep from crossing the virtual border [
20]. One of the current study’s percentages of experienced cattle to inexperienced was not adequate, with only one experienced cow present. A percentage of 72.7 % was measured with ten experienced cattle, which according to Marini et al. (2020) should be efficient for herd management. The results of this study show the opposite, meaning other factors must influence the results. It is important to be critical when comparing the behaviour of two different species. It was found in a previous study that behavioural differences in grazing- and resting periods occur between sheep and cattle, but movement patterns remain similar [
21]. It creates a parameter as behaviour between these species is not directly comparable. Furthermore, differences in intraspecific behaviour between cattle breeds, such as grazing and movement patterns, create yet another variable [
22].
Stressors may contribute to behavioural changes in cattle. Regrouping has been proven to induce these changes [
23]. This may explain why the current study shows no social facilitation when inexperienced cattle are introduced into an established herd, which may cause stress. Furthermore, another study indicates cattle exhibit inter-individual differences, which may play a role in the behaviour of cattle, further influencing interactions with the virtual fence [
13]. However, the results of the current study showed no significant difference in the variance of impulses per warning, meaning the behaviour of the herds was homogeneous.
It is important to consider specific parameters when introducing inexperienced cattle to the virtual fence. This study illustrates a need to limit parameters, which may increase the improvement social facilitation has on the learning process. It is also important to make distinctions if the social facilitation is establishing an association between impulse and warning, or if the herd is simply mimicking [
16]. To test if associative learning occurs through facilitation, a new experiment will have to be conducted. First a period with experienced cattle, where social facilitation can occur, followed by a trial period where the experienced cattle would be removed. This could be used to conclude if the cattle are experiencing social learning, that is if the cattle can connect the warning and impulse when isolated.
4.2. The Effect of the Learning Process
It was expected that the cattle would adapt better to the virtual fence with a gradual introduction rather than an instant introduction. The gradual introduction was significant in reducing impulses per warning compared to the other introduction methods. Therefore, it appears gradual introduction increases the ability to associate a warning with an impulse.
This is consistent with a previous study. Confessore et al. (2022) had a similar introduction method and found a significant decrease in impulses and warnings [
24], further confirming a gradual introduction is beneficial in virtual fence adaptation. The method of evaluating learning ability is seemingly as important as the learning process. Hamidi et al. examined different evaluation methods with regards to virtual fence learning through a gradual learning process. The study examined not only the relation between impulse and warning, but also the behavioural reaction of the animals and the virtual fence collars switch from learning mode to operant mode, finding all approaches were successful in determining virtual fence learning [
25].
Another method of optimisation to the learning process is an individual introduction rather than an introduction as a group [
26]. It is difficult for a cow in a group to adapt to the system as stimuli received by other cattle lessen the association between auditory warning and impulse. However, this method is impractical in a commercial setting [
26], as it requires separate pastures. So, a gradual introduction as a herd may be the most efficient and practical method.
For the user of the virtual fence, a gradual introduction to the system is more beneficial. The cattle adapt at a faster rate and with a stronger association between impulse and warning, thereby increasing welfare as cattle receive fewer impulses.
4.3. Standardisation of Virtual Fence Learning
Multiple parameters appear to interfere with the results of this study. Previously mentioned parameters such as the learning process and herd behaviour play a significant role in the adaptation to the virtual fence. However, other factors such as season variation, herd size, and change in pasture can impact the behaviour of cattle impeding social facilitation and interactions with a virtual fence, thereby, creating further uncertainties [
27,
28,
29].
Further studies should be conducted to determine the full effect of herd behaviour. A study could be created to analyse movement through GPS-coordinates. If the cattle remain in a close herd when interacting with the virtual fence, this suggests the cattle react as a herd rather than individually. In contrast, if the movement of the herd were generally more dispersed, cattle would have to adapt individually. This could also be tested by a nearest-neighbour test, which could be used to indicate if cattle remain as a herd.
The abovementioned parameters cause uncertainties that must be accounted for. This illustrates the limitations of virtual fence learning. When numerous unaccounted parameters influence cattle during the learning process, the effectiveness of learning decreases. This study illustrates a need for more standardised research to uncover the full scope of experienced cattle’s effect on learning, and if the learning process can be optimised further. This study demonstrated that a gradual learning process is preferred when introducing cattle to a virtual fence system when considering livestock welfare. The gradual introduction coupled with the potential of social facilitation could significantly increase the welfare of cattle. It would be interesting if these principles apply to other livestock and if the Nofence© system can be beneficial to wildlife management.
5. Conclusions
In conclusion, the adaptation to virtual fencing showed no connection between experienced cattle and decrease in impulses per warning for either the learning- or observation period. We found significant difference in both impulse and warning for gradual introduction (Investigation A) and instant learning (Investigation B), but not for instant introduction (Investigation C). However, since no significant difference were found for impulse per warning, the observed difference is not indicative of associative behaviour, and therefore the result of other behaviour. Several factors, which are unaccounted for, such as method of introduction to the virtual system, herd behaviour, seasonal variation, herd size and change in pasture, can affect results, revealing limitations for virtual fence systems and therefore it is difficult to draw a conclusion. Moreover, the gradual introduction method, which had a virtual fence line incrementally moved, were the only type of introduction that was able to increase association between warning and impulse. The two different types of instant introduction did not increase association between warning and impulse. However, more standardised experiments must be conducted to determine the effectiveness of social facilitation through experienced cattle in relation to virtual fence adaptation.
Author Contributions
Conceptualisation, P.A.S., N.S.H., M.C., A.S., R.M.D., I.F.T., M.F.A., D.B., A.K.O.A. and C.P.; methodology, P.A.S., N.S.H., M.C., A.S., R.M.D. and I.F.T.; formal analysis, P.A.S., N.S.H., M.C., A.S., R.M.D. and I.F.T.; Investigation, P.A.S., N.S.H., M.C., A.S., R.M.D. and I.F.T.; data curation, P.A.S., N.S.H., M.C., A.S., R.M.D. and I.F.T.; writing-original draft preparation, P.A.S., N.S.H., M.C., A.S., R.M.D. and I.F.T.; writing-review and editing, P.A.S., N.S.H., M.C., A.S., R.M.D., I.F.T., M.F.A., S.K.S., D.B., A.K.O.A. and C.P.; Visualisation, P.A.S., N.S.H., M.C., A.S., R.M.D. and I.F.T.; supervision, M.F.A., S.K.S., D.B., A.K.O.A. and C.P. All authors have read and agreed to the published version of the manuscript.
Funding
This research was funded by 15. Juni Fonden, Hedeselskabet and Markus Jebsens Naturpulje. We are grateful for the support, which made it possible to conduct this study.
Institutional Review Board Statement
The study was conducted according to the institutional guidelines for animal research (directive 2010/63/EU), and approved by the Danish Experimentation Animal Inspectorate of Denmark (2020-15-0201-00588, approval date: 8 July 2020) prior to the start of the study.
Informed Consent Statement
Not applicable.
Data Availability Statement
The data presented in this study are available on request from the corresponding author.
Acknowledgments
Thanks to to Dan Pode Poulsen and Michael Baun for their invaluable contributions, data collection, consulting, and ongoing information sharing. Their support was imperative in facilitating the experiment as part of the continuous testing of Nofence© virtual fencing on the Danish island of Fanø. The Wadden Sea National Park, The Municipality of Fanø, and Hedeselskabet in making this project possible. The data used in this research have been made available by ‘Projekt Virtuelt Hegn, Fanø’
www.virtuelthegn.dk
Conflicts of Interest
The authors declare no conflict of interest.
Appendix A
Pasture Maps:
Figure A1.
Fanø and the experiment locations.
Figure A1.
Fanø and the experiment locations.
Figure A2.
The pasture for investigation A during the learning period.
Figure A2.
The pasture for investigation A during the learning period.
Figure A3.
The pasture for investigation A during the observation period.
Figure A3.
The pasture for investigation A during the observation period.
Figure A4.
The pasture for investigation B during the learning period.
Figure A4.
The pasture for investigation B during the learning period.
Figure A5.
The pasture for investigation B during the observation period.
Figure A5.
The pasture for investigation B during the observation period.
Figure A6.
The pasture for investigation C during both the learning- and observation period.
Figure A6.
The pasture for investigation C during both the learning- and observation period.
Appendix B
Significant difference was found only between inexperienced cattle and experienced cattle in investigation C during the learning period (
Table A1).
Figure A7.
Boxplot with the medians (25-75% quantiles) of impulses per warning given to the cattle during the learning period. A refers to the cattle with no experienced cattle, B refers to the cattle with one experienced cow (impulses per warning marked with square for experienced cow), and C refers to the cattle with ten experienced cattle, C exp. Refers to the 10 experienced cattle in investigation C. n = sample size. The summary of each boxplot can be found in
Appendix C.
Figure A8.
Boxplot with the medians (25-75% quantiles) of impulses per warning given to the cattle during the observation period. A refers to the cattle with no experienced cattle, B refers to the cattle with one experienced cow (impulses per warning marked with square for experienced cow), and C refers to the cattle with ten experienced cattle, C exp. Refers to the 10 experienced cattle in investigation C. n = sample size. The summary of each boxplot can be found in
Appendix C.
Table A1.
Impulses per warning for experienced between inexperienced cattle during learning period. lea. = learning period. obs. = observation period. exp. = experienced. The difference in median was tested using Wilcoxon rank-sum test. Significant values are indicated with asterisk (*) when p < 0.05 for both tests.
| Comparison |
Wilcoxon rank-sum test |
| B |
0.0322 * |
| B exp. |
| |
|
| C |
0.4706 |
| C exp. |
Table A2.
Impulses per warning for experienced between inexperienced cattle during observation period. lea. = learning period. obs. = observation period. exp. = experienced. The difference in median was tested using Wilcoxon rank-sum test. Significant values are indicated with asterisk (*) when p < 0.05 for both tests.
| Comparison |
Wilcoxon rank-sum test |
| B |
0.0537 |
| B exp. |
| |
|
| C |
0.4706 |
| C exp. |
References
- van Arendonk, J.A.M.; Liinamo, A.E. Dairy cattle production in europe. Theriogenology 2003, 59, 563–569. [Google Scholar] [CrossRef] [PubMed]
- Jakes, A.F.; Jones, P.F.; Paige, L.C.; Seidler, R.G.; Huijser, M.P. A fence runs through it: A call for greater attention to the influence of fences on wildlife and ecosystems. Biological Conservation 2018, 227, 310–318. [Google Scholar] [CrossRef]
- Pokorny, B.; Flajšman, K.; Centore, L.; Krope, F.S.; Šprem, N. Border fence: A new ecological obstacle for wildlife in southeast europe. European Journal of Wildlife Research 2016, 63. [Google Scholar] [CrossRef]
- Woodroffe, R.; Hedges, S.; Durant, S.M. To fence or not to fence. Science 2014, 344, 46–48 https://wwwscienceorg/doi/101126/science1246251. [Google Scholar] [CrossRef] [PubMed]
- Vanak, A.T.; Thaker, M.; Slotow, R. Do fences create an edge-effect on the movement patterns of a highly mobile mega-herbivore? Biological Conservation 2010, 143, 2631–2637. [Google Scholar] [CrossRef]
- Brunberg, E.I.; Bøe, K.E.; Sørheim, K.M. Testing a new virtual fencing system on sheep. Acta Agriculturae Scandinavica, Section A — Animal Science 2015, 65, 168–175. [Google Scholar] [CrossRef]
- Campbell, D.L.M.; Lea, J.M.; Farrer, W.J.; Haynes, S.J.; Lee, C. Tech-savvy beef cattle? how heifers respond to moving virtual fence lines. Animals 2017, 7, 72. [Google Scholar] [CrossRef] [PubMed]
- nofence.no. Hvad er nofence? Available online: https://www.nofence.no/ (accessed on 6 November 2023).
- Campbell, D.L.M.; Lea, J.M.; Keshavarzi, H.; Lee, C. Virtual fencing is comparable to electric tape fencing for cattle behavior and welfare. Frontiers in Veterinary Science 2019, 6, 445. [Google Scholar] [CrossRef] [PubMed]
- Hamidi, D.; Grinnell, N.A.; Komainda, M.; Riesch, F.; Horn, J.; Ammer, S.; Traulsen, I.; Palme, R.; Hamidi, M.; Isselstein, J. Heifers don’t care: No evidence of negative impact on animal welfare of growing heifers when using virtual fences compared to physical fences for grazing. animal 2022, 16. [Google Scholar] [CrossRef]
- Kearton, T.; Marini, D.; Cowley, F.; Belson, S.; Lee, C. The effect of virtual fencing stimuli on stress responses and behavior in sheep. Animals 2019, 9, 30. [Google Scholar] [CrossRef]
- Brunberg, E.I. Sheep welfare in the virtual fencing system nofence. Bioforsk 2012, 7. Available online: http://hdl.handle.net/11250/2447492.
- Aaser, M.F.; Staahltoft, S.K.; Korsgaard, A.H.; Trige-Esbensen, A.; Alstrup, A.K.O.; Sonne, C.; Pertoldi, C.; Bruhn, D.; Frikke, J.; Linder, A.C. Is virtual fencing an effective way of enclosing cattle? personality, herd behaviour and welfare. Animals 2022, 12, 842. [Google Scholar] [CrossRef] [PubMed]
- Lee, C.; Henshall, J.M.; Wark, T.J.; Crossman, C.C.; Reed, M.T.; Brewer, H.G.; O’Grady, J.; Fisher, A.D. Associative learning by cattle to enable effective and ethical virtual fences. Applied Animal Behaviour Science 2009, 119, 15–22. [Google Scholar] [CrossRef]
- Keshavarzi, H.; Lee, C.; Lea, J.M.; Campbell, D.L. Virtual fence responses are socially facilitated in beef cattle. Frontiers in Veterinary Science 2020, 7, 543158. [Google Scholar] [CrossRef] [PubMed]
- Nicol, C.J. The social transmission of information and behaviour. Applied Animal Behaviour Science 1995, 44, 79–98. [Google Scholar] [CrossRef]
- Howery, L.D.; Bailey, D.W.; Ruyle, G.B.; Renken, W.J. Cattle use visual cues to track food locations. Applied Animal Behaviour Science 2000, 67, 1–14. [Google Scholar] [CrossRef] [PubMed]
- Abramson, C. I.; Kieson, E. Conditioning methods for animals in agriculture: A review. PRODUCÃO ANIMAL 2016, 1. [CrossRef]
- Bailey, D.W.; Howery, L.D.; Boss, D.L. Effects of social facilitation for locating feeding sites by cattle in an eight-arm radial maze. Applied Animal Behaviour Science 2000, 68, 93–105. [Google Scholar] [CrossRef] [PubMed]
- Marini, D.; Kearton, T.; Ouzman, J.; Llewellyn, R.; Belson, S.; Lee, C. Social influence on the effectiveness of virtual fencing in sheep. PeerJ 2020, 8, e10066. [Google Scholar] [CrossRef] [PubMed]
- Hilario, M.C.; Wrage-Mönnig, N.; Isselstein, J. Behavioral patterns of (co-)grazing cattle and sheep on swards differing in plant diversity. Applied Animal Behaviour Science 2017, 191, 17–23. [Google Scholar] [CrossRef]
- Pauler, C.M.; Isselstein, J.; Berard, J.; Braunbeck, T.; Schneider, M.K. Grazing allometry: Anatomy, movement, and foraging behavior of three cattle breeds of different productivity. Frontiers in Veterinary Science 2020, 7, 494. [Google Scholar] [CrossRef]
- von Keyserlingk, M.A.G.; Olenick, D.; Weary, D.M. Acute behavioral effects of regrouping dairy cows. Journal of Dairy Science 2008, 91, 1011–1016. [Google Scholar] [CrossRef]
- Confessore, A.; Aquilani, C.; Nannucci, L.; Fabbri, M.C.; Accorsi, P.A.; Dibari, C.; Argenti, G.; Pugliese, C. Application of virtual fencing for the management of limousin cows at pasture. Livestock Science 2022, 263. [Google Scholar] [CrossRef]
- Hamidi, D.; Grinnell, N.A.; Komainda, M.; Wilms, L.; Riesch, F.; Horn, J.; Hamidi, M.; Traulsen, I.; Isselstein, J. Training cattle for virtual fencing: Different approaches to determine learning success. Applied Animal Behaviour Science 2024, 273, 106220. [Google Scholar] [CrossRef]
- Colusso, P.I.; Clark, C.E.F.; Lomax, S. Should dairy cattle be trained to a virtual fence system as individuals or in groups? Animals 2020, 10, 1767. [Google Scholar] [CrossRef] [PubMed]
- Idris, M.; Gay, C.C.; Woods, I.G.; Sullivan, M.; Gaughan, J.B.; Phillips, C.J.C. Automated quantification of the behaviour of beef cattle exposed to heat load conditions. Animals 2023, 13, 1125. [Google Scholar] [CrossRef] [PubMed]
- Kondo, S.; Sekine, J.; Okubo, M.; Asahida, Y. The effect of group size and space allowance on the agonistic and spacing behavior of cattle. Applied Animal Behaviour Science 1989, 24, 127–135. [Google Scholar] [CrossRef]
- Monk, J.E.; Hine, B.C.; Colditz, I.G.; Lee, C. A novel protocol to assess acclimation rate in bos taurus heifers during yard weaning. Animals 2018, 8, 51. [Google Scholar] [CrossRef]
|
Disclaimer/Publisher’s Note: The statements, opinions and data contained in all publications are solely those of the individual author(s) and contributor(s) and not of MDPI and/or the editor(s). MDPI and/or the editor(s) disclaim responsibility for any injury to people or property resulting from any ideas, methods, instructions or products referred to in the content. |
© 2024 by the authors. Licensee MDPI, Basel, Switzerland. This article is an open access article distributed under the terms and conditions of the Creative Commons Attribution (CC BY) license (http://creativecommons.org/licenses/by/4.0/).
