1. Introduction
Winter wheat, as one of China’s main grain crops, plays an important role in ensuring food security [
1,
2]. Nitrogen (N) is an important nutrient that affects wheat plant growth and yield by promoting metabolism in, and growth of, the roots, stems, and leaves [
3]. However, excessive application of N fertilizer is common in agricultural production worldwide. This not only reduces the efficiency of N fertilizer use, but also causes serious environmental problems, such as surface and groundwater pollution, increased greenhouse gas (N
2O) emissions, and a reduction in biodiversity [
4,
5]. With the wheat yield increasing from 3806 kg ha
-1 in the 2000s to approximately 5880 kg ha
-1 at present [
6,
7], more N should be required to support wheat production. To optimize the N-use efficiency and enhance crop production, it is important to develop appropriate N fertilization management strategies for wheat crops in the North China Plain (NCP).
The effects of N application rates on crop growth, yield, evapotranspiration (ET), and water- and N-use efficiencies have been widely studied for different crops in various regions [
8,
9,
10]. Generally, crops’ yields increase with increasing N application, reach peak levels at the optimal N application level, and then decrease if N is applied in excess. The optimal N application level varies among different crops and different soil environments. For wheat crops, the reported optimal N application rate varies from 180 to 230 kgN·ha
-1 with the corresponding yield range from 7080 to 8860 kg ha
-1 [
4,
11]. In the NCP, the recommended N application rate ranges from 150 to 210 kg ha
-1 to achieve yields in the range of 7500 to 8500 kg ha
-1. In recent decades, published reports have indicated that the wheat yield in the NCP increased from approximately 6500 kg ha
-1 in the 2000s to 7500 kg ha
-1 in the last 5 years, and the corresponding recommended N application rates ranged from 150-210 to 180-220 kg ha
-1. Furthermore, the recommended N application rate (180-220 kg·ha
-1) as delivered by surface irrigation is higher than that recommended for delivery by sprinkler and drip irrigation (150-200 kg ha
-1) because there is less N leaching using the latter two irrigation methods. Therefore, the irrigation method should be considered when optimizing the N application rate for winter wheat.
The NCP produces 58.33% of all the wheat produced in China, and accounts for 51.2% of the national wheat cultivation area [
7]. However, the water resources in the NCP account for only 6% of the total in China [
12]. The large amount irrigation water pumped from groundwater results in a decline in the groundwater level by approximately 1 m per year, which has caused serious environment problems and is unsustainable for agricultural and economic development [
13,
14]. The sprinkler fertigation system can simultaneously supply water and nutrients to crops, which maximizes the availability of both to plants, thereby improving both water- and fertilizer-use efficiencies [
15,
16]. The area of land irrigated by sprinkler systems in the NCP is 3.37 million hectares at present, and is expected to increase in the next 10 years because of implementation of the “High-level Farmland Construction Project” in China. With more widespread use of the sprinkler irrigation method in the NCP, the sprinkler fertigation system will be increasingly used for wheat crops. Therefore, it is urgent to understand the responses of N uptake and growth to N application under sprinkler fertigation conditions.
The aims of this study, which was conducted over two winter wheat seasons, were as follows: (1) To explore the effects of different N application rates and splitting strategies of topdressing N on winter wheat growth, yield, and water- and fertilizer-use efficiencies; (2) to analyze the relationships between N application and the N splitting strategy in terms of their effects on wheat yield and N-use efficiency; and (3) to identify the optimal N application rate and splitting strategy to achieve high winter wheat yield and N-use efficiency.
2. Results
2.1. Meteorological Conditions
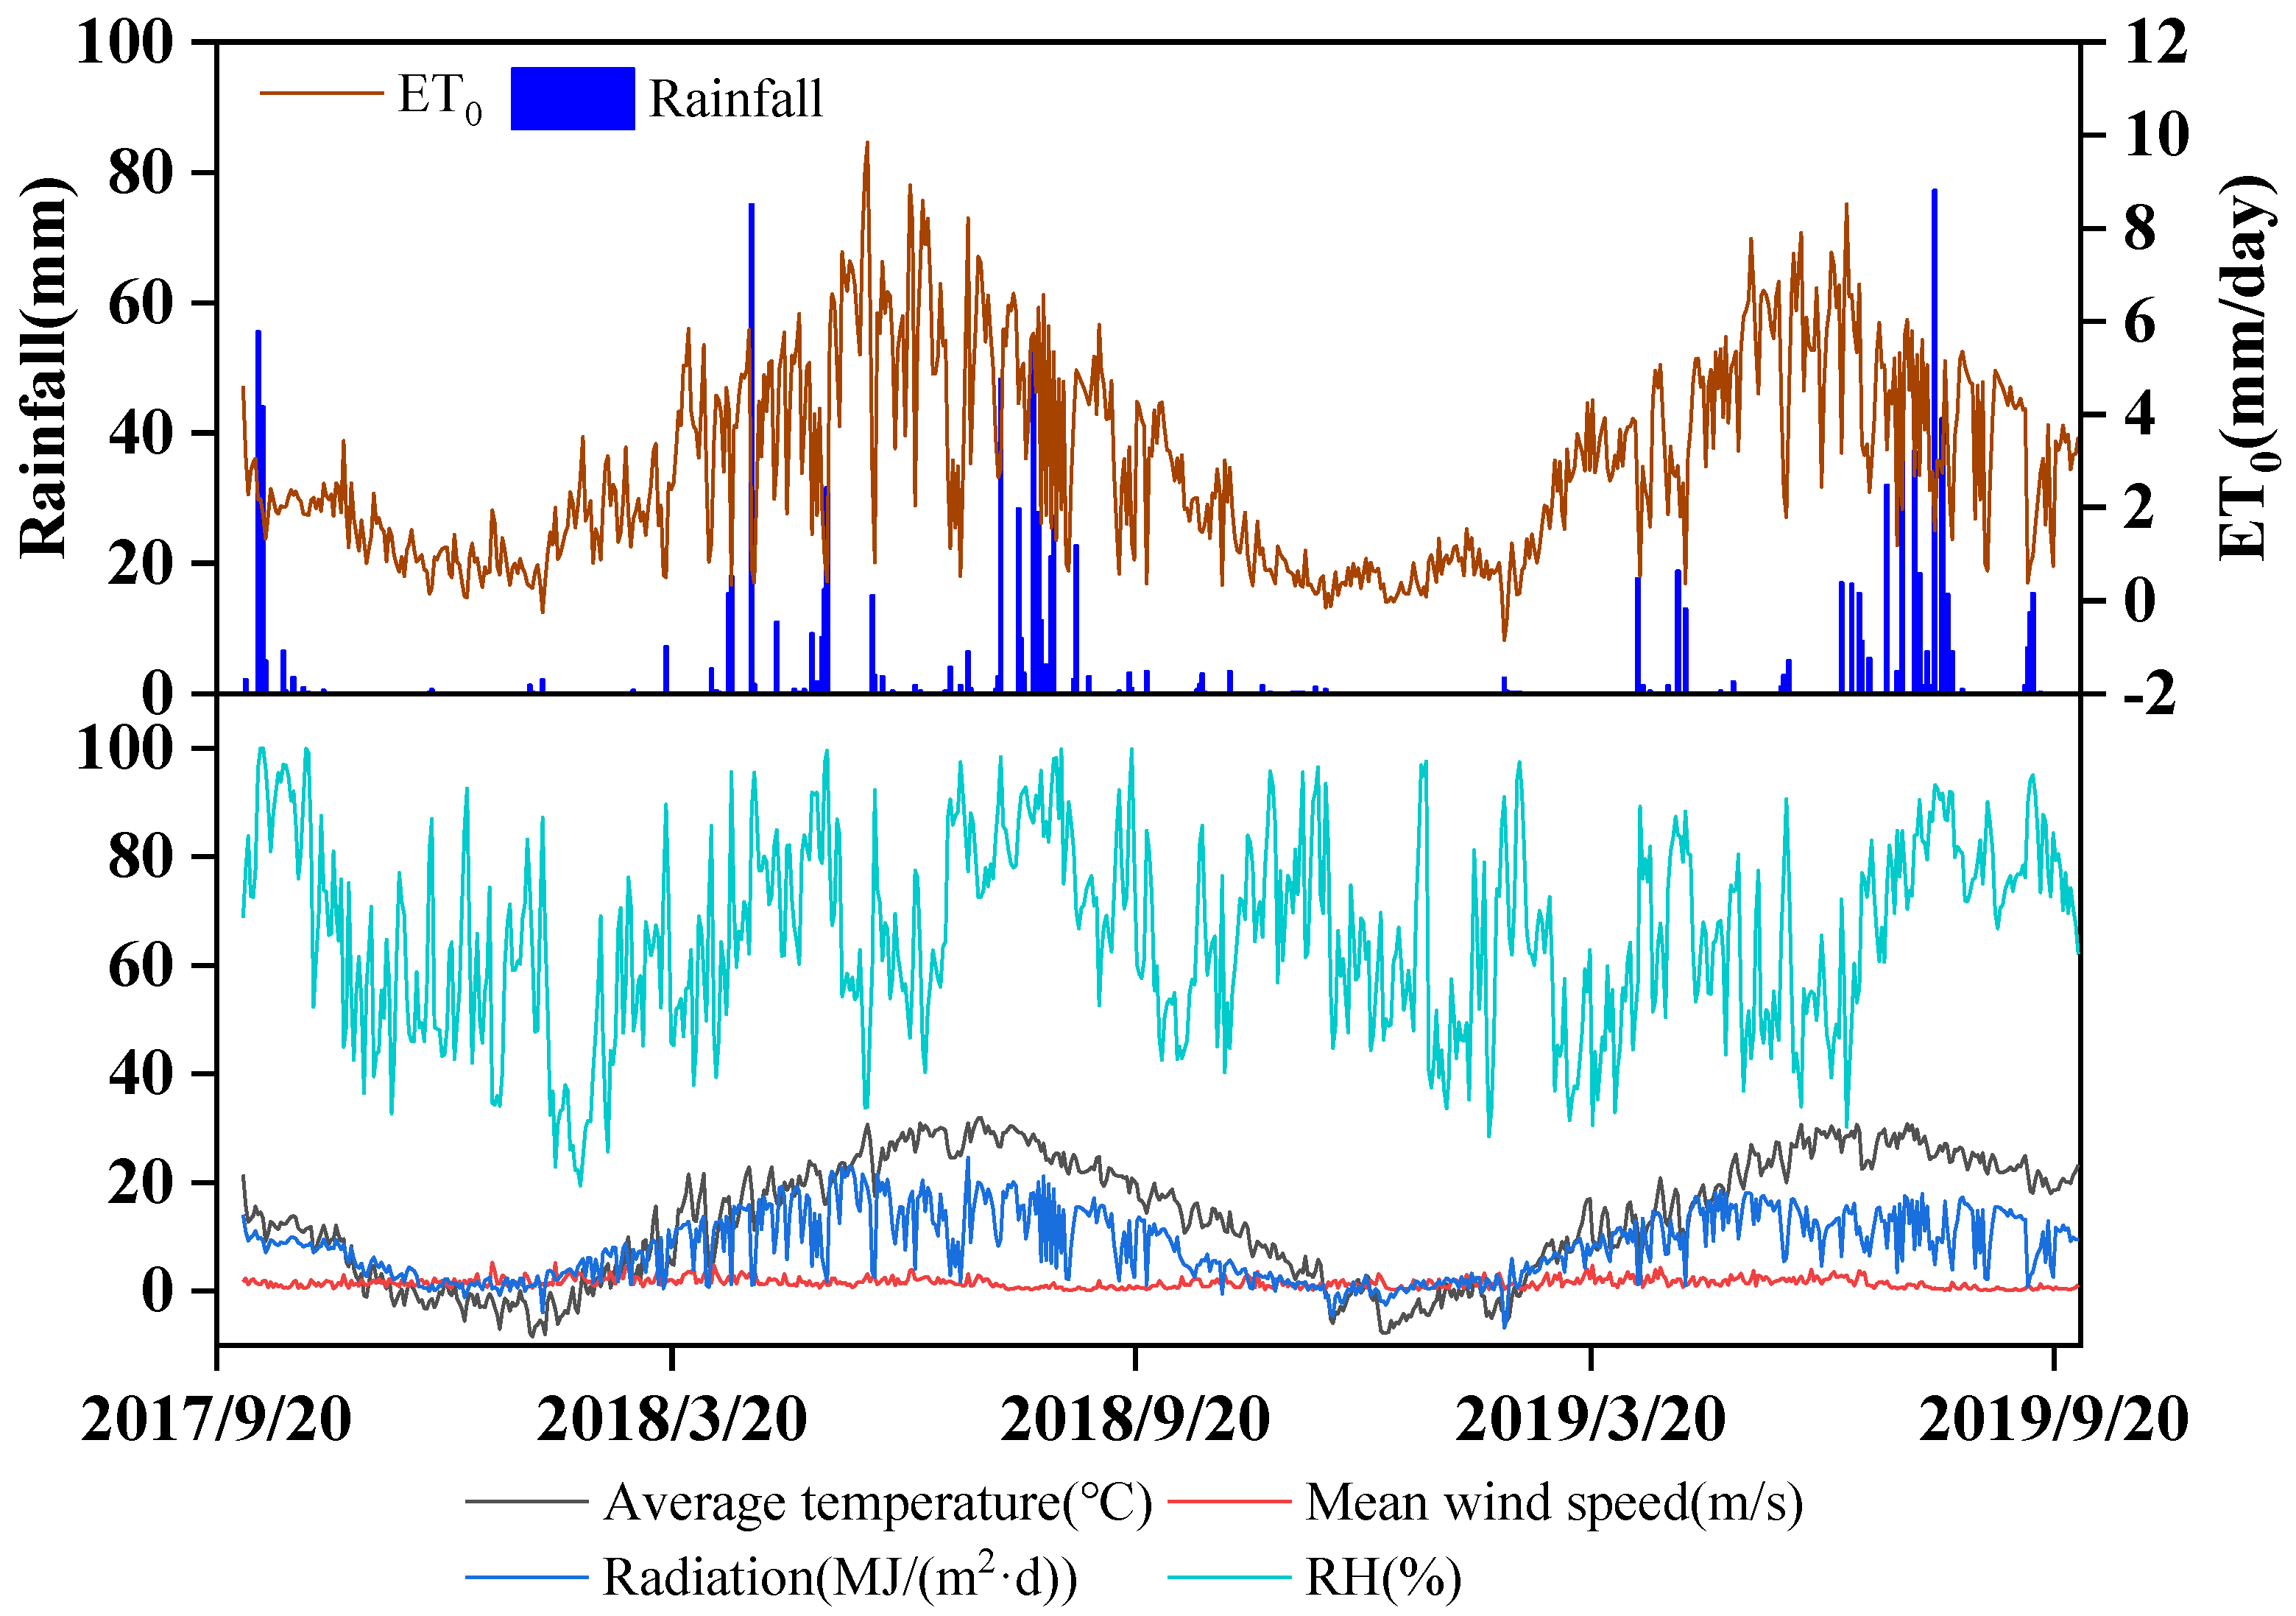
The climatic conditions from October in 2017 to October in the 2019 are summarized in
Figure 1. In the two experimental wheat growing seasons (from October to June of the following year), there were clear seasonal curves of air temperature, radiation, wind speed, and reference crop evapotranspiration (ET
o). The seasonal rainfall amounts were 248.0 mm and 79.8 mm in the 2017-2018 and 2018-2019 wheat seasons, respectively. The seasonal ET
os were 606 mm and 490 mm, and high daily ET
o generally occurred in May with a mean of 4.91 mm·day
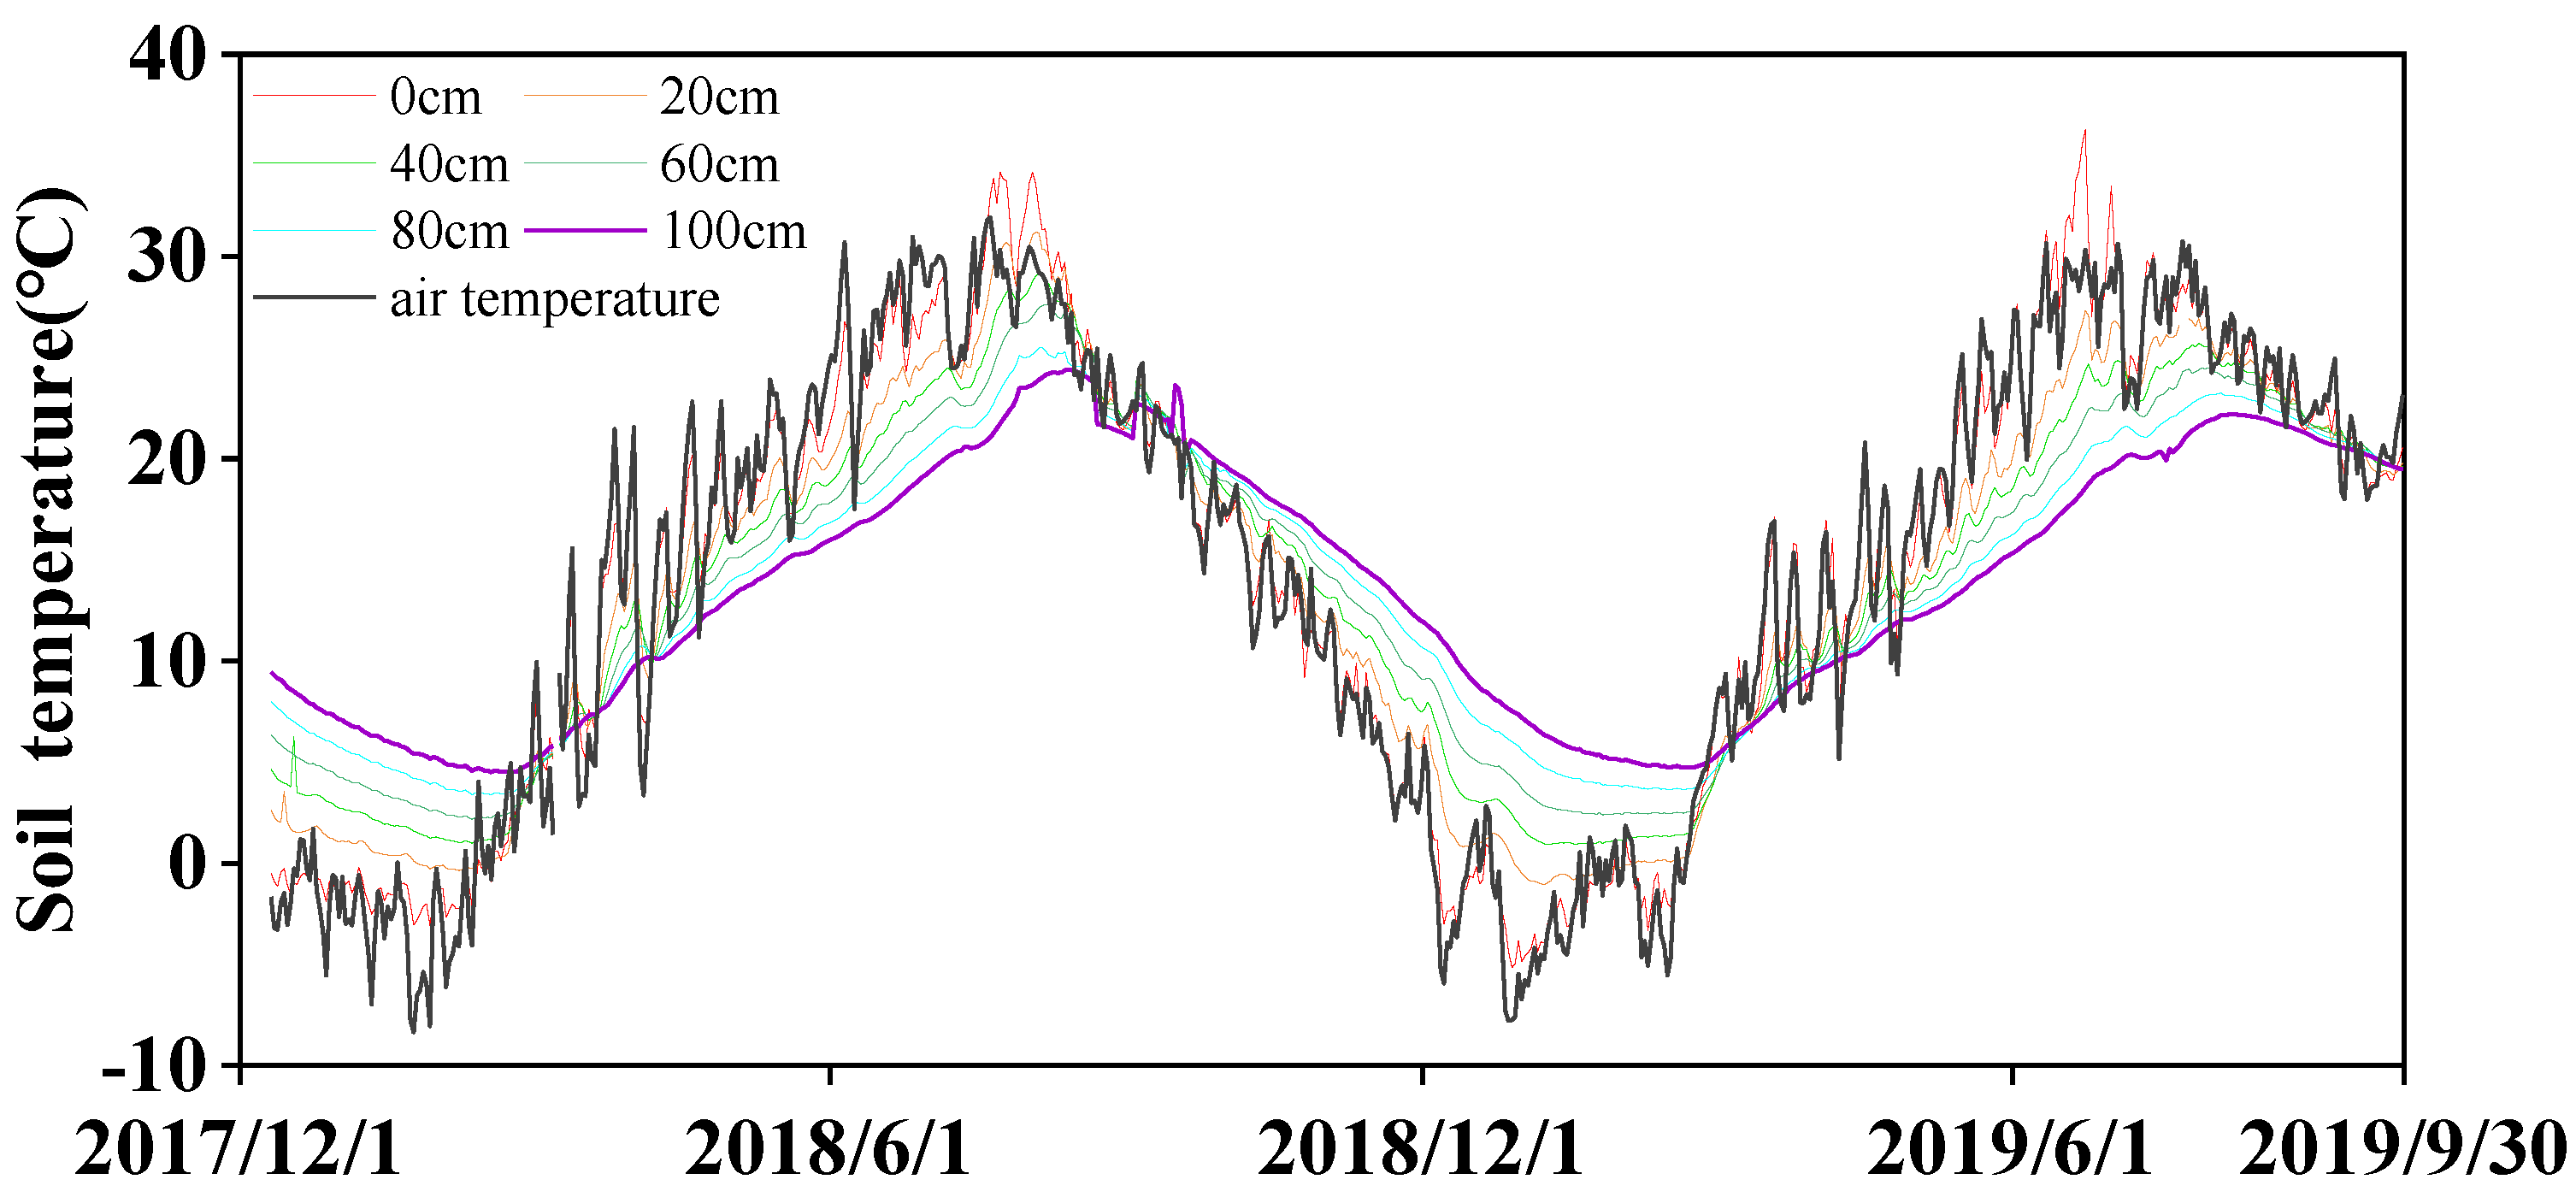
-1. During winter (from November to February), the soil temperature increased with depth (
Figure 2), while it decreased with soil depth from March to June.
2.2. Temporal and Spatial Distribution of Soil Water Content
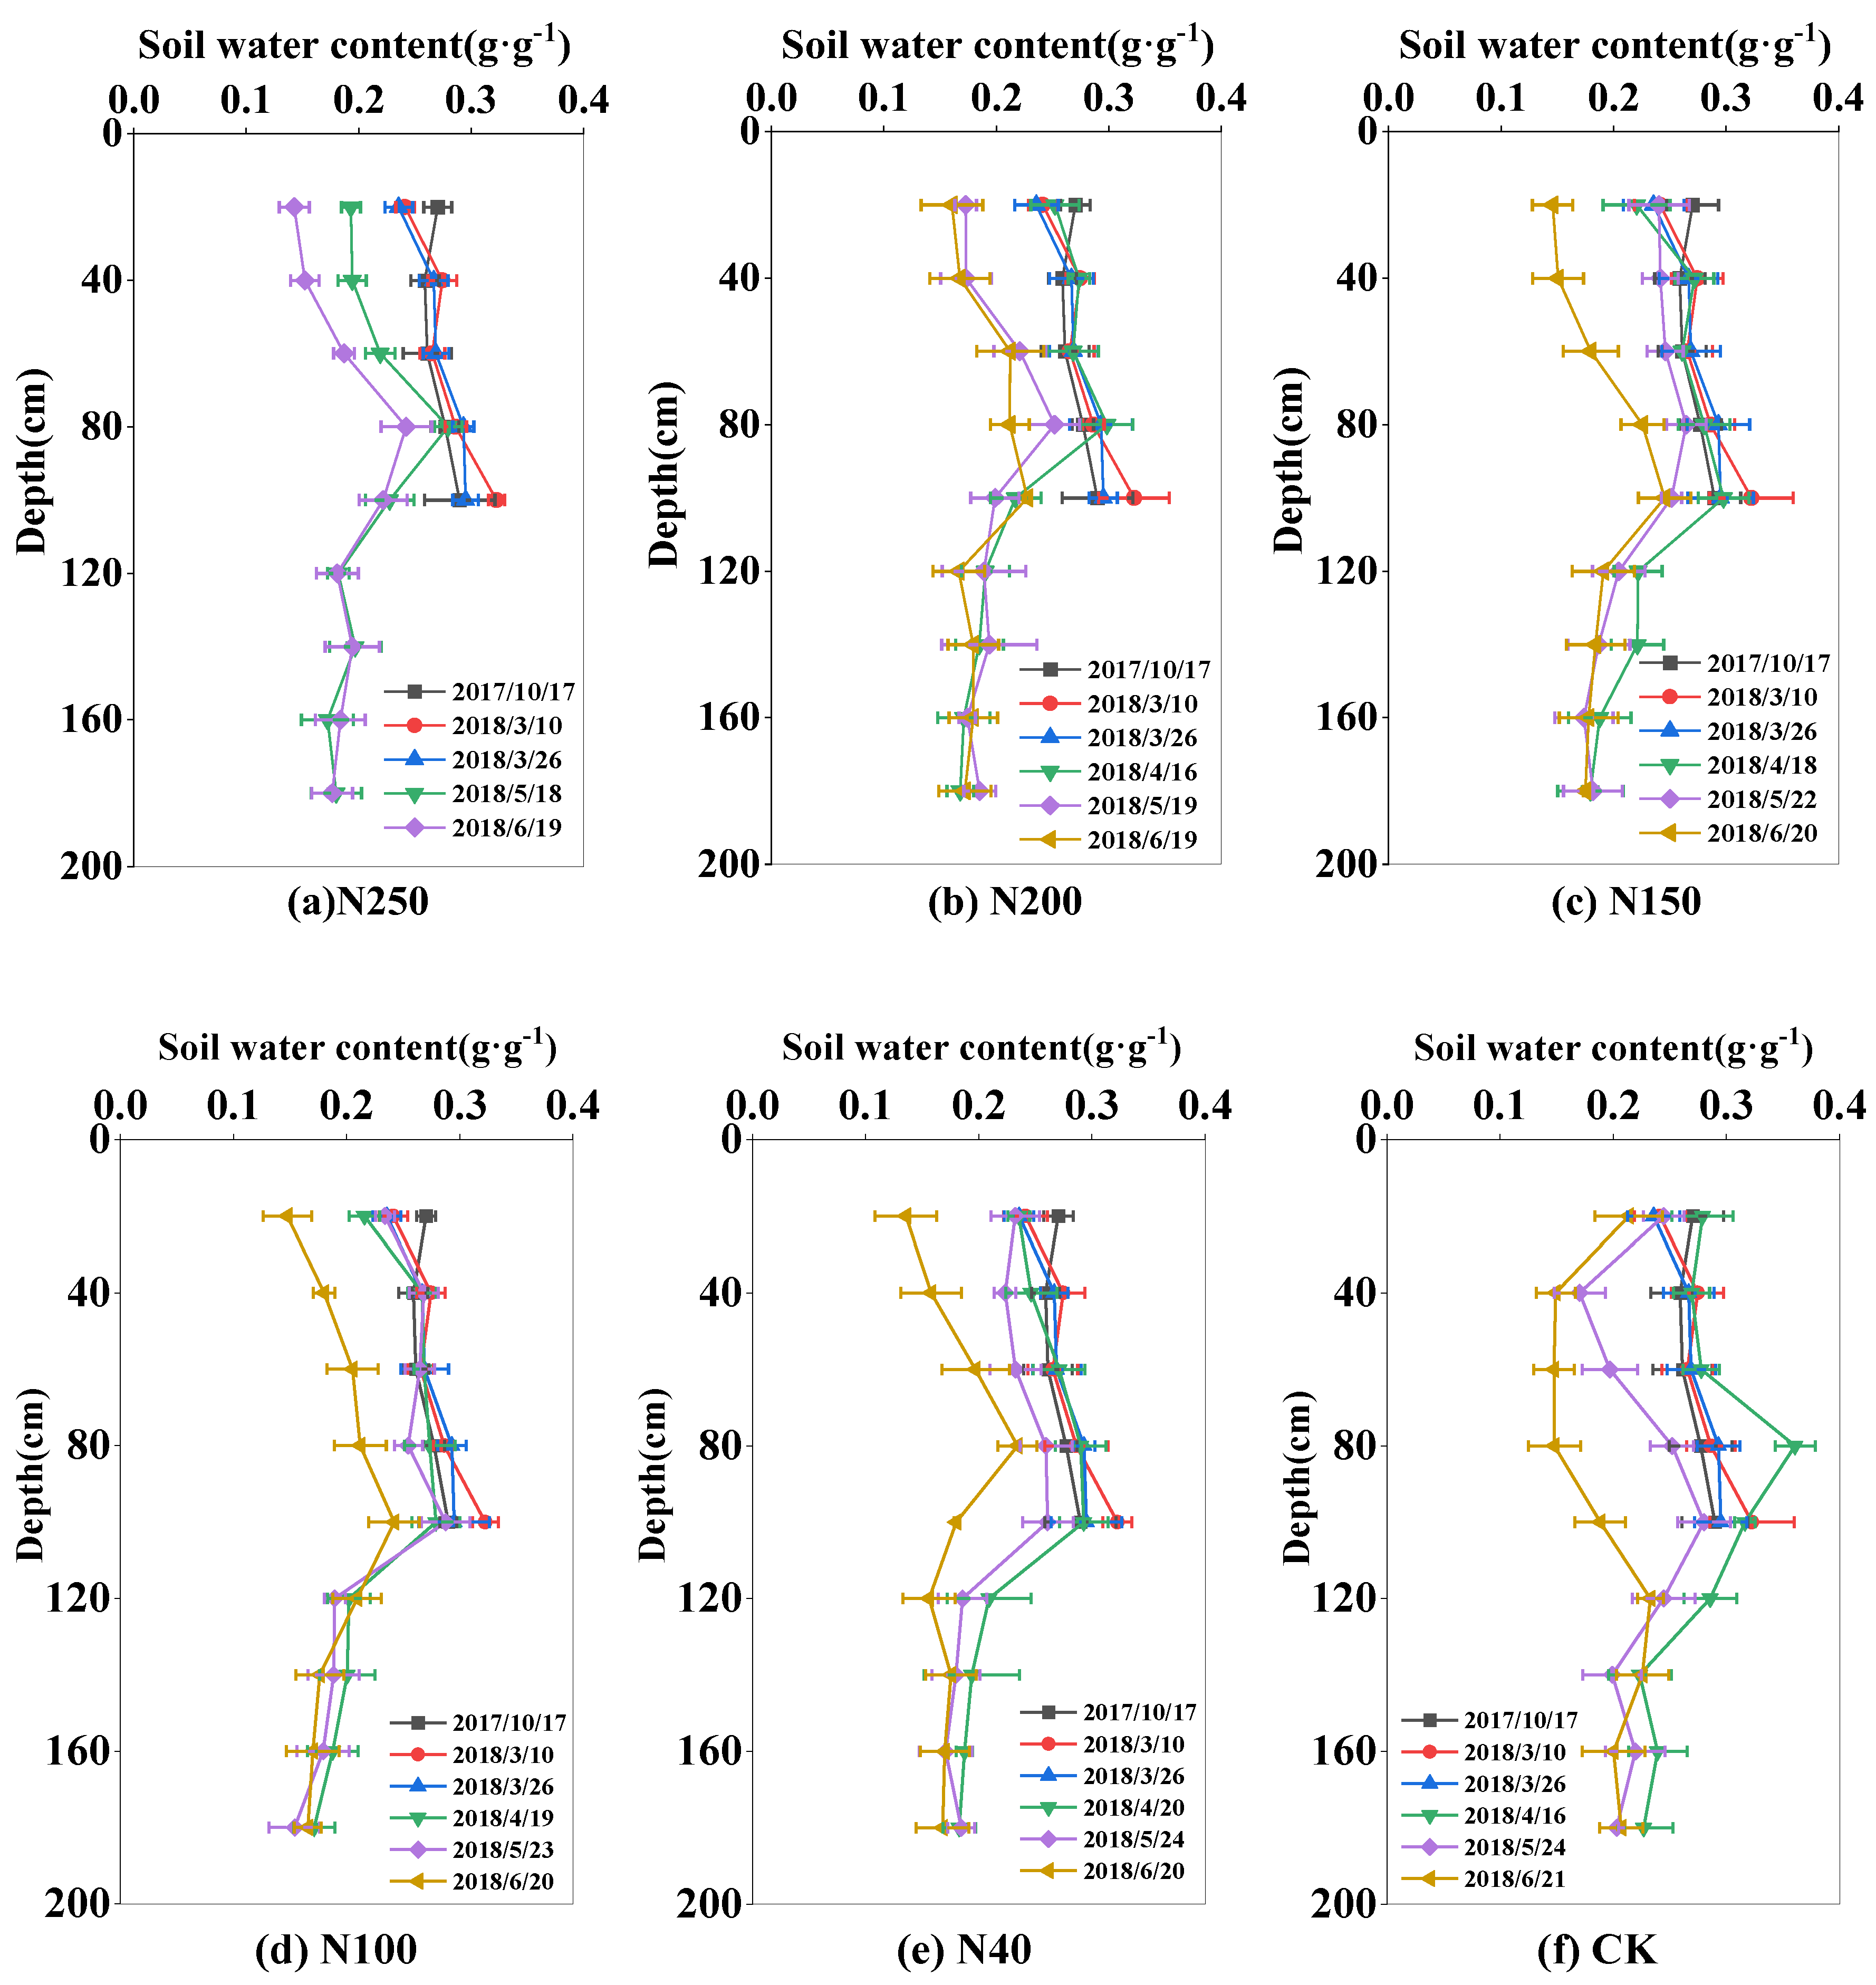
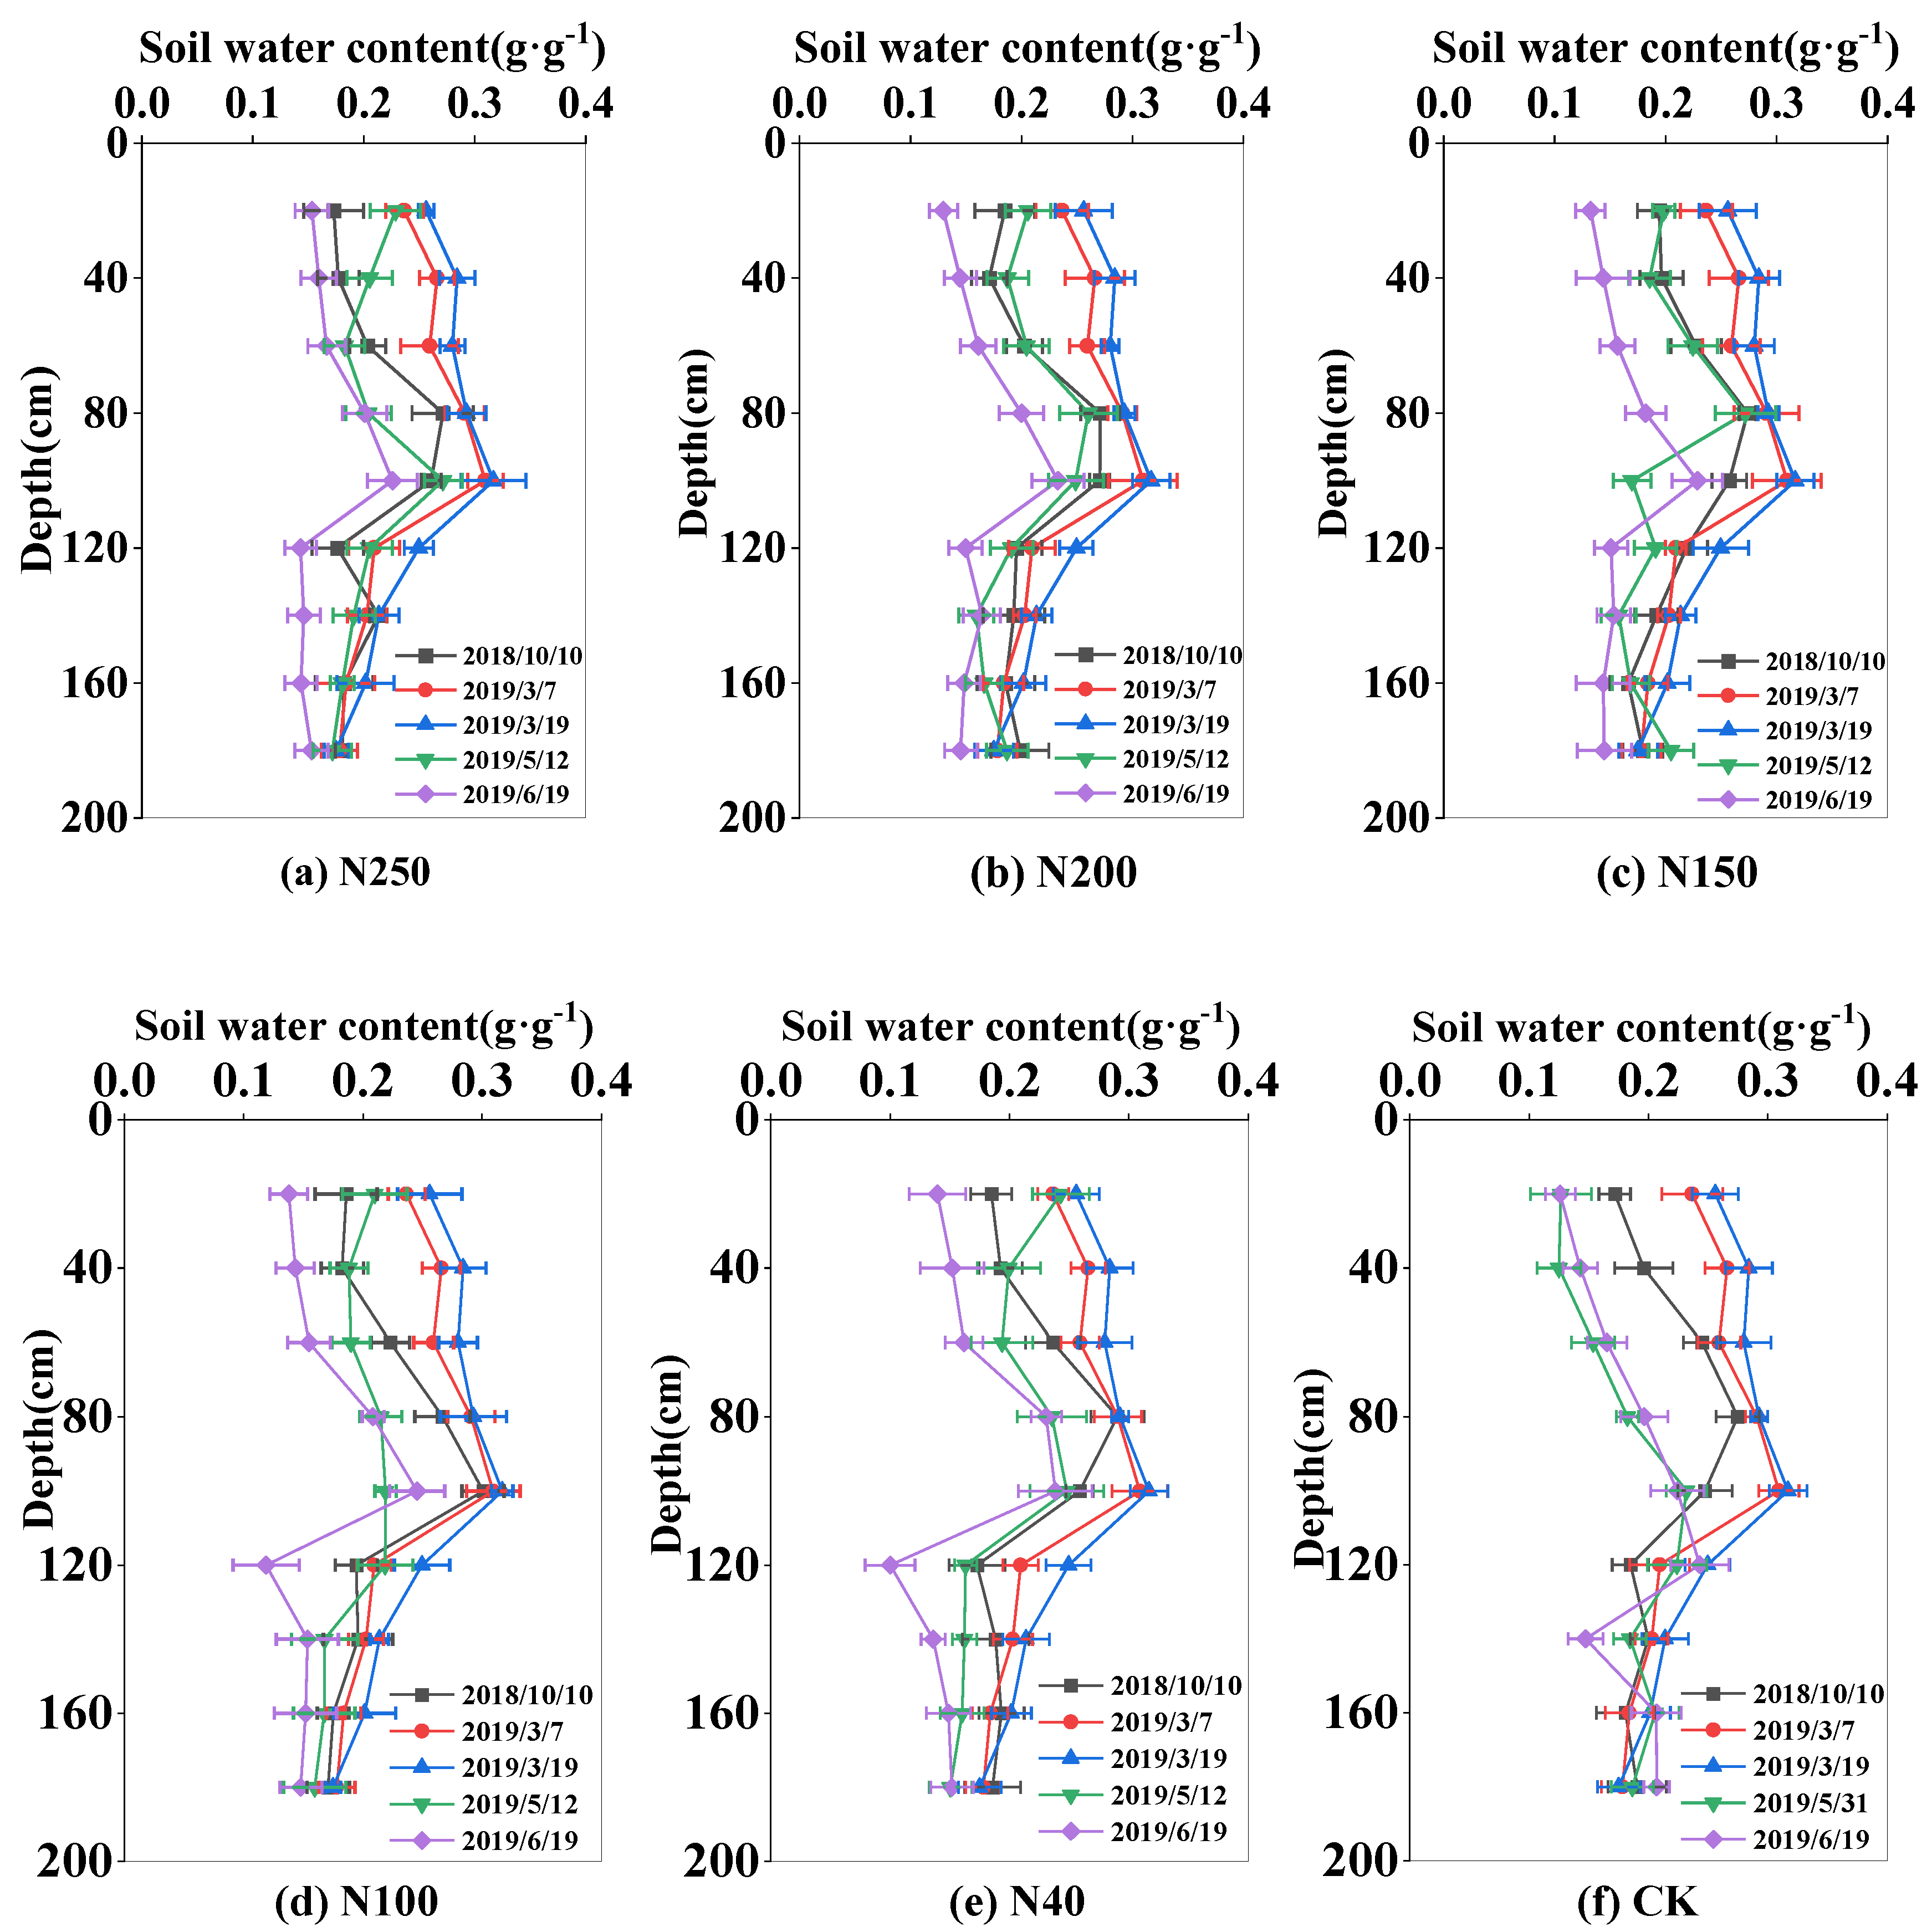
The soil water content varied greatly during the whole wheat growth season because of crop ET, rainfall, and irrigation. The soil water content was highest before sowing (0.26-0.29 g·g
-1) and lowest at wheat harvest (0.15-0.21 g·g
-1). In 2017 and 2018, the soil water storage in the 0-180 cm soil layer was 562.6 mm and 580 mm in the sowing period in October of 2178 and 2018, respectively, and 424.2 mm and 401 mm in the harvest period in June of 2018 and 2019, respectively (
Figure 3 and
Figure 4).
Within the 0-180 cm soil layer, the soil water content showed wider variation in the 0-100 cm soil layer (0.2-0.3 g·g-1) than in the 100-180 cm soil layer (0.17-0.2 g·g-1). The larger variation in soil water content in the upper 100 cm soil layer was mainly because of water uptake by roots, and irrigation and rainfall events. However, in the CK field, the fluctuation of soil water content in the 0-100 cm was very large during the growing season, ranging from 0.15 to 0.3 g·g-1. At harvest, the soil water content in the 0-100 cm soil layer in the CK field was 0.17 g·g-1, lower than that (0.2 g·g-1) in the sprinkler fertigation treatments.
In the two seasons, the mean soil water contents in the 0-100 cm soil layer in the five N treatments (N250, N200, N150, N100, and N40) were 0.25, 0.25, 0.25, 0.26, and 0.25 g·g-1, respectively, in 2017-2018, and 0.23, 0.23, 0.23, 0.23, and 0.24 g·g-1, respectively, in 2018-2019. There were no significant differences (P>0.05) in seasonal soil water content among the five treatments, mainly because the irrigation depth was equal among all the treatments. During most of the growth period, the soil content in the CK field was close that in the N treatments. However, at harvest in 2018, the soil water content in the 0-100 cm soil layer was 0.2 g·g-1 in the CK field, which was 20% lower than that in the N treatments.
2.3. Temporal and Spatial Distributions of Nitrate-N Content
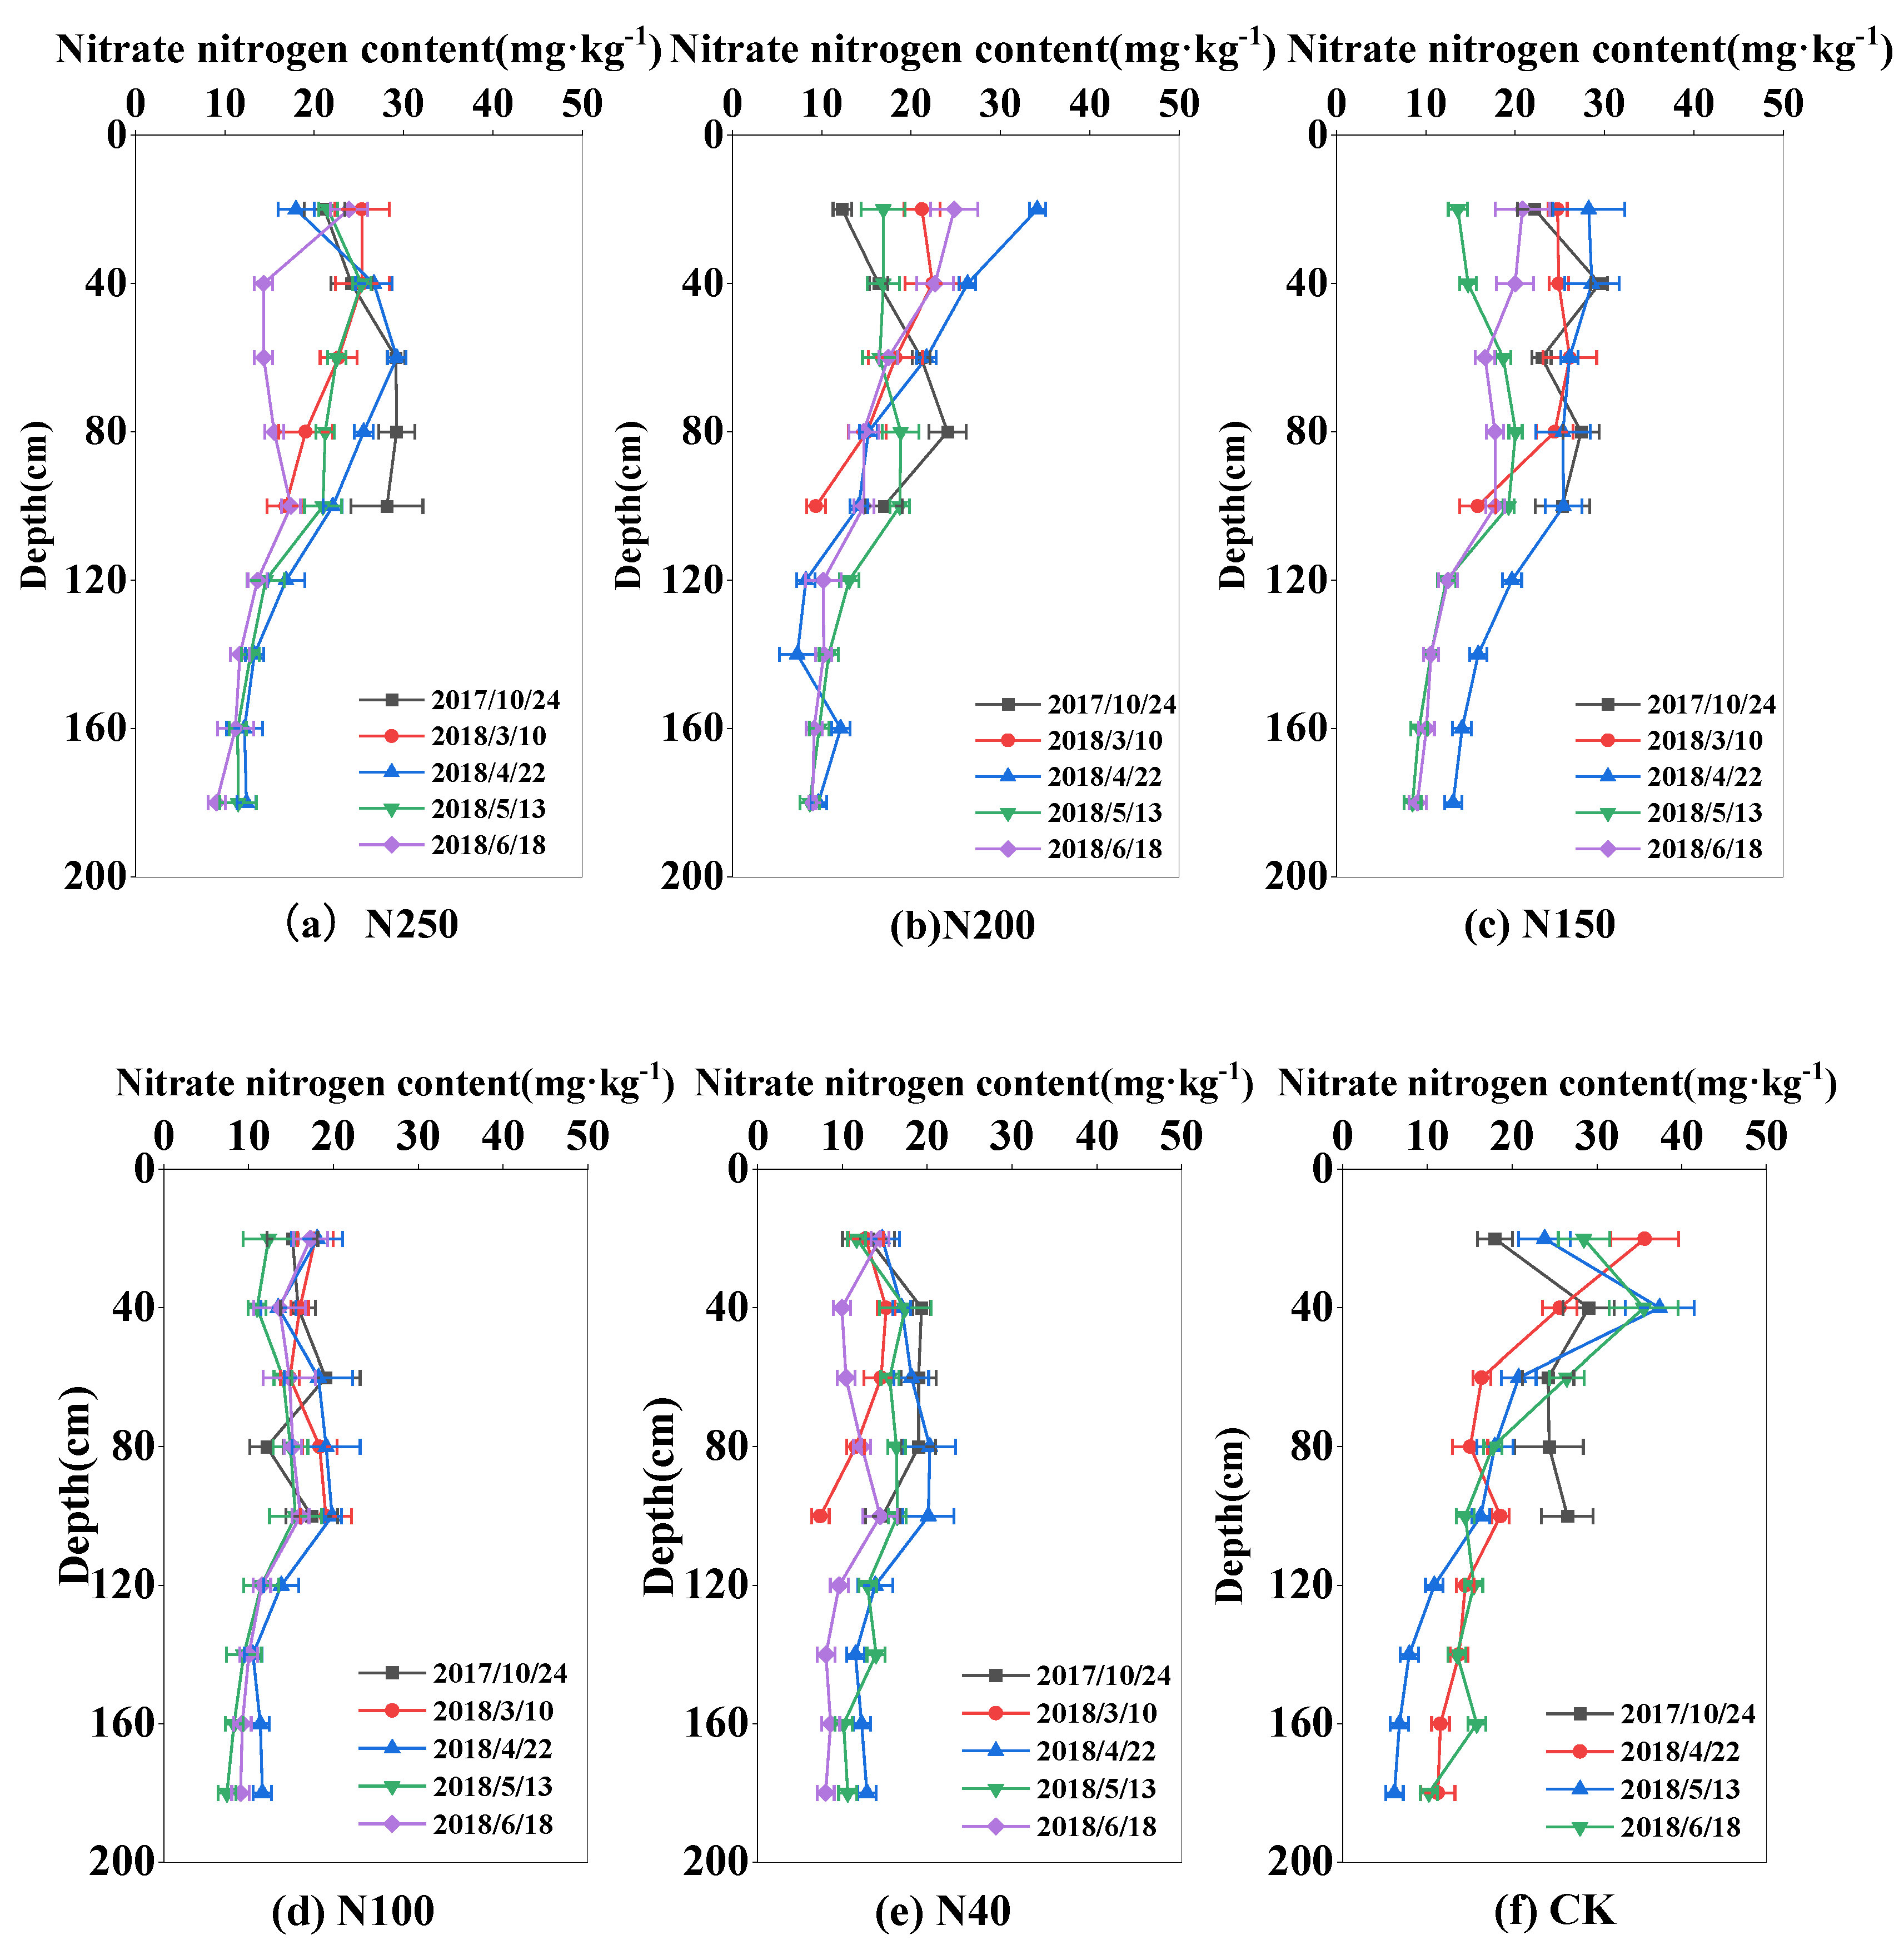
The soil nitrate-N content in the experimental field was high at the beginning of the experiment in October 2017, decreased during the wheat growing period, and reached the lowest level at harvest. At the beginning of the experiment, the nitrate-N content was highest at 60 cm soil depth (42.06 mg·kg
-1), and the mean value in the 0-100 cm soil layer was 30.43 mg·kg
-1, with total nitrate-N storage in the 0-100 cm soil layer of 425 kg ha
-1. During the wheat regreening period in March, the mean nitrate-N content in the 0-100 m soil layer decreased to 18.38 mg·kg
-1, then varied from 17.25 to 28.51 mg·kg
-1, and reached the lowest level of 8.02-24.83 mg·kg
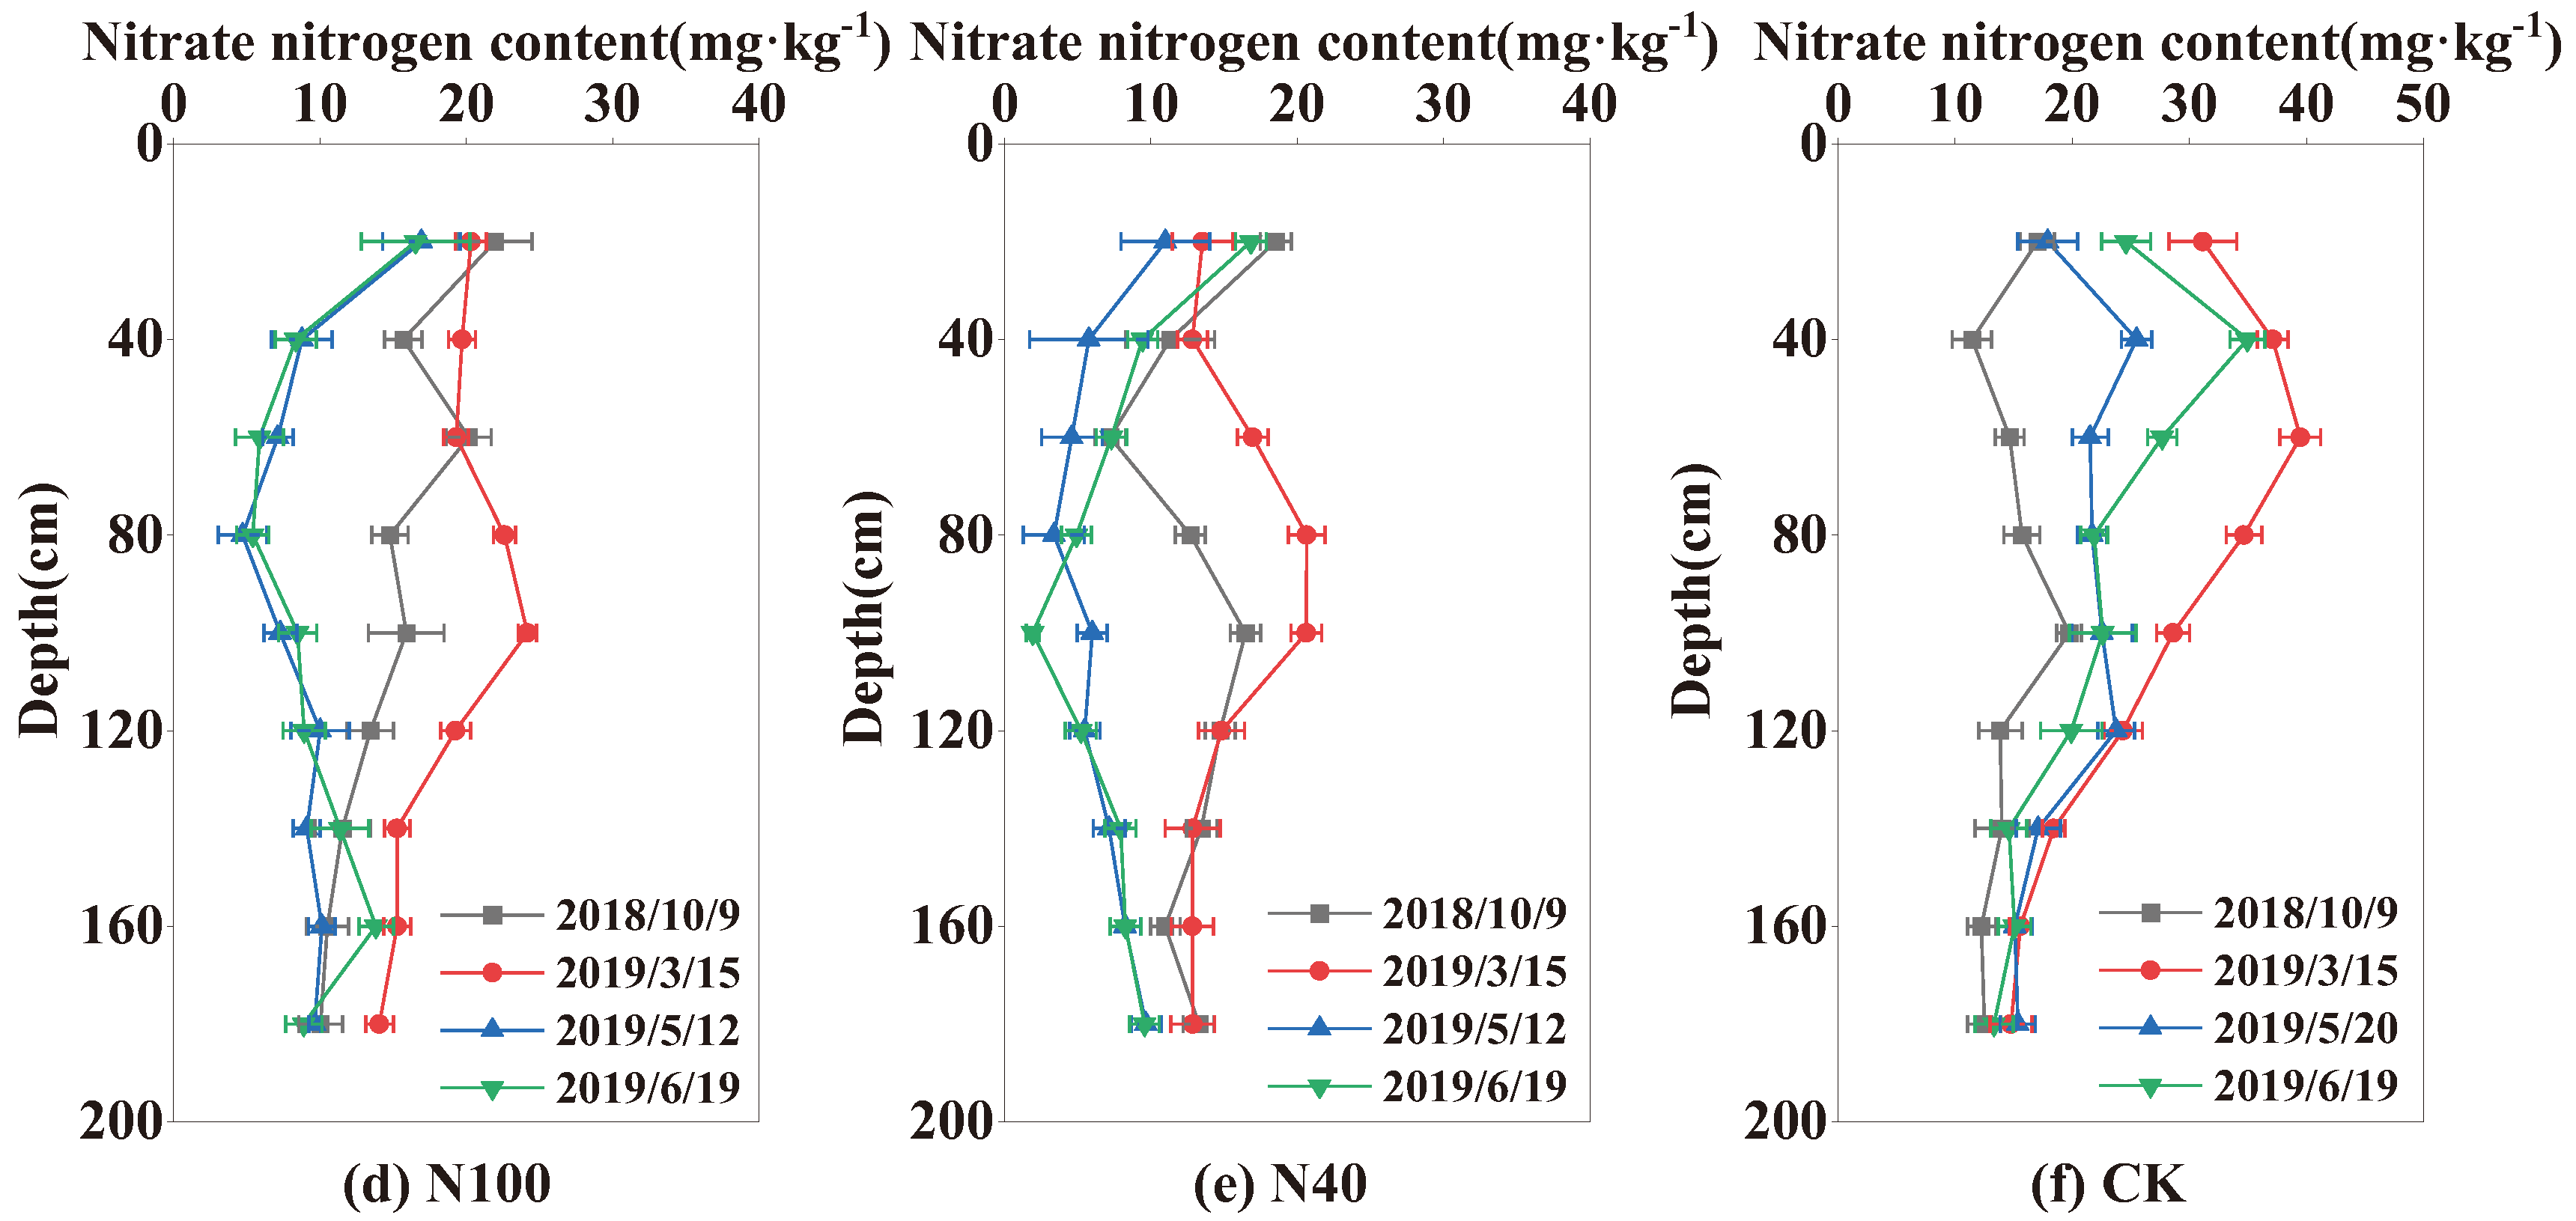
-1 at harvest in 2018. A similar pattern of change in the nitrate content was observed in the 2018-2019 season (
Figure 5 and
Figure 6). The nitrate-N content in the 0-100 cm soil layer showed clear changes, especially in the 0-60 cm soil layer, where most plant roots were located. The soil nitrate-N content was generally lower in the 100-180 cm soil layer than in the 0-100 cm soil layer, and it changed slightly during the whole wheat growing season. The standard deviation of mean nitrate-N content in the 100-180 cm soil layer in the whole wheat growth season was 2.54 mg·kg
-1 among the five treatments across the two seasons. In the CK, the corresponding standard deviation was 8.36 mg·kg
-1 in the 0-100 cm soil layer.
The nitrate-N content in the 0-100 cm soil layer was greatly influenced by the N application rate. At wheat harvest, the mean nitrate-N contents in the 0-100 soil layer in N250, N200, N150, N100, N40, and the CK were 17.1, 18.88, 18.59, 15.42, and 12.29 mg·kg-1 respectively, in 2018; and 15.51, 12.81, 12.5, 8.94, and 8.09 mg·kg-1, respectively, in 2019. The amount of nitrate-N remaining in the soil at wheat harvest increased as the N application rate increased.
2.4. Winter Wheat Growth Indexes
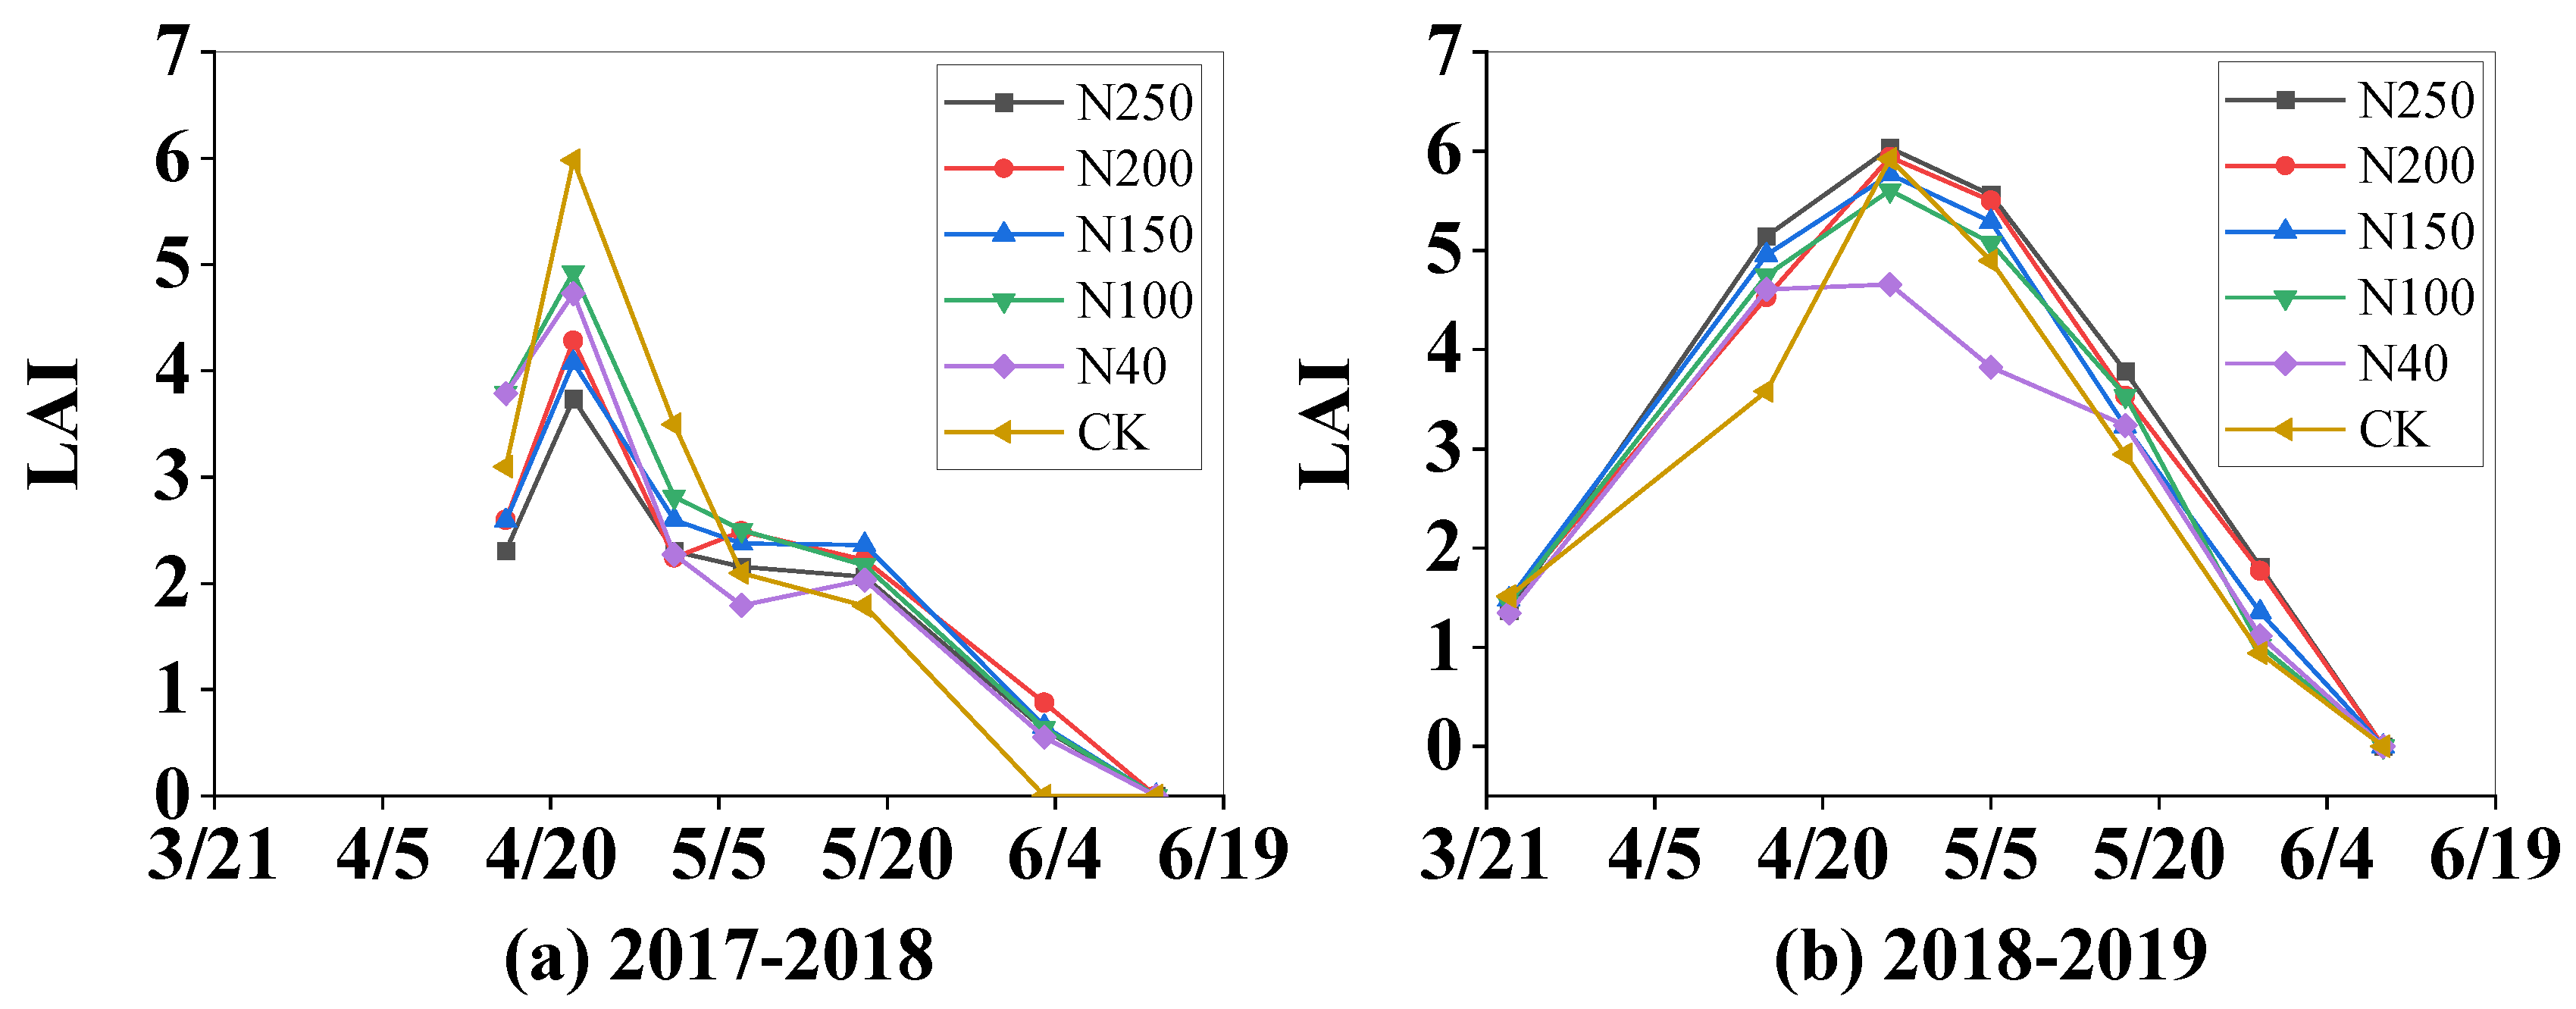
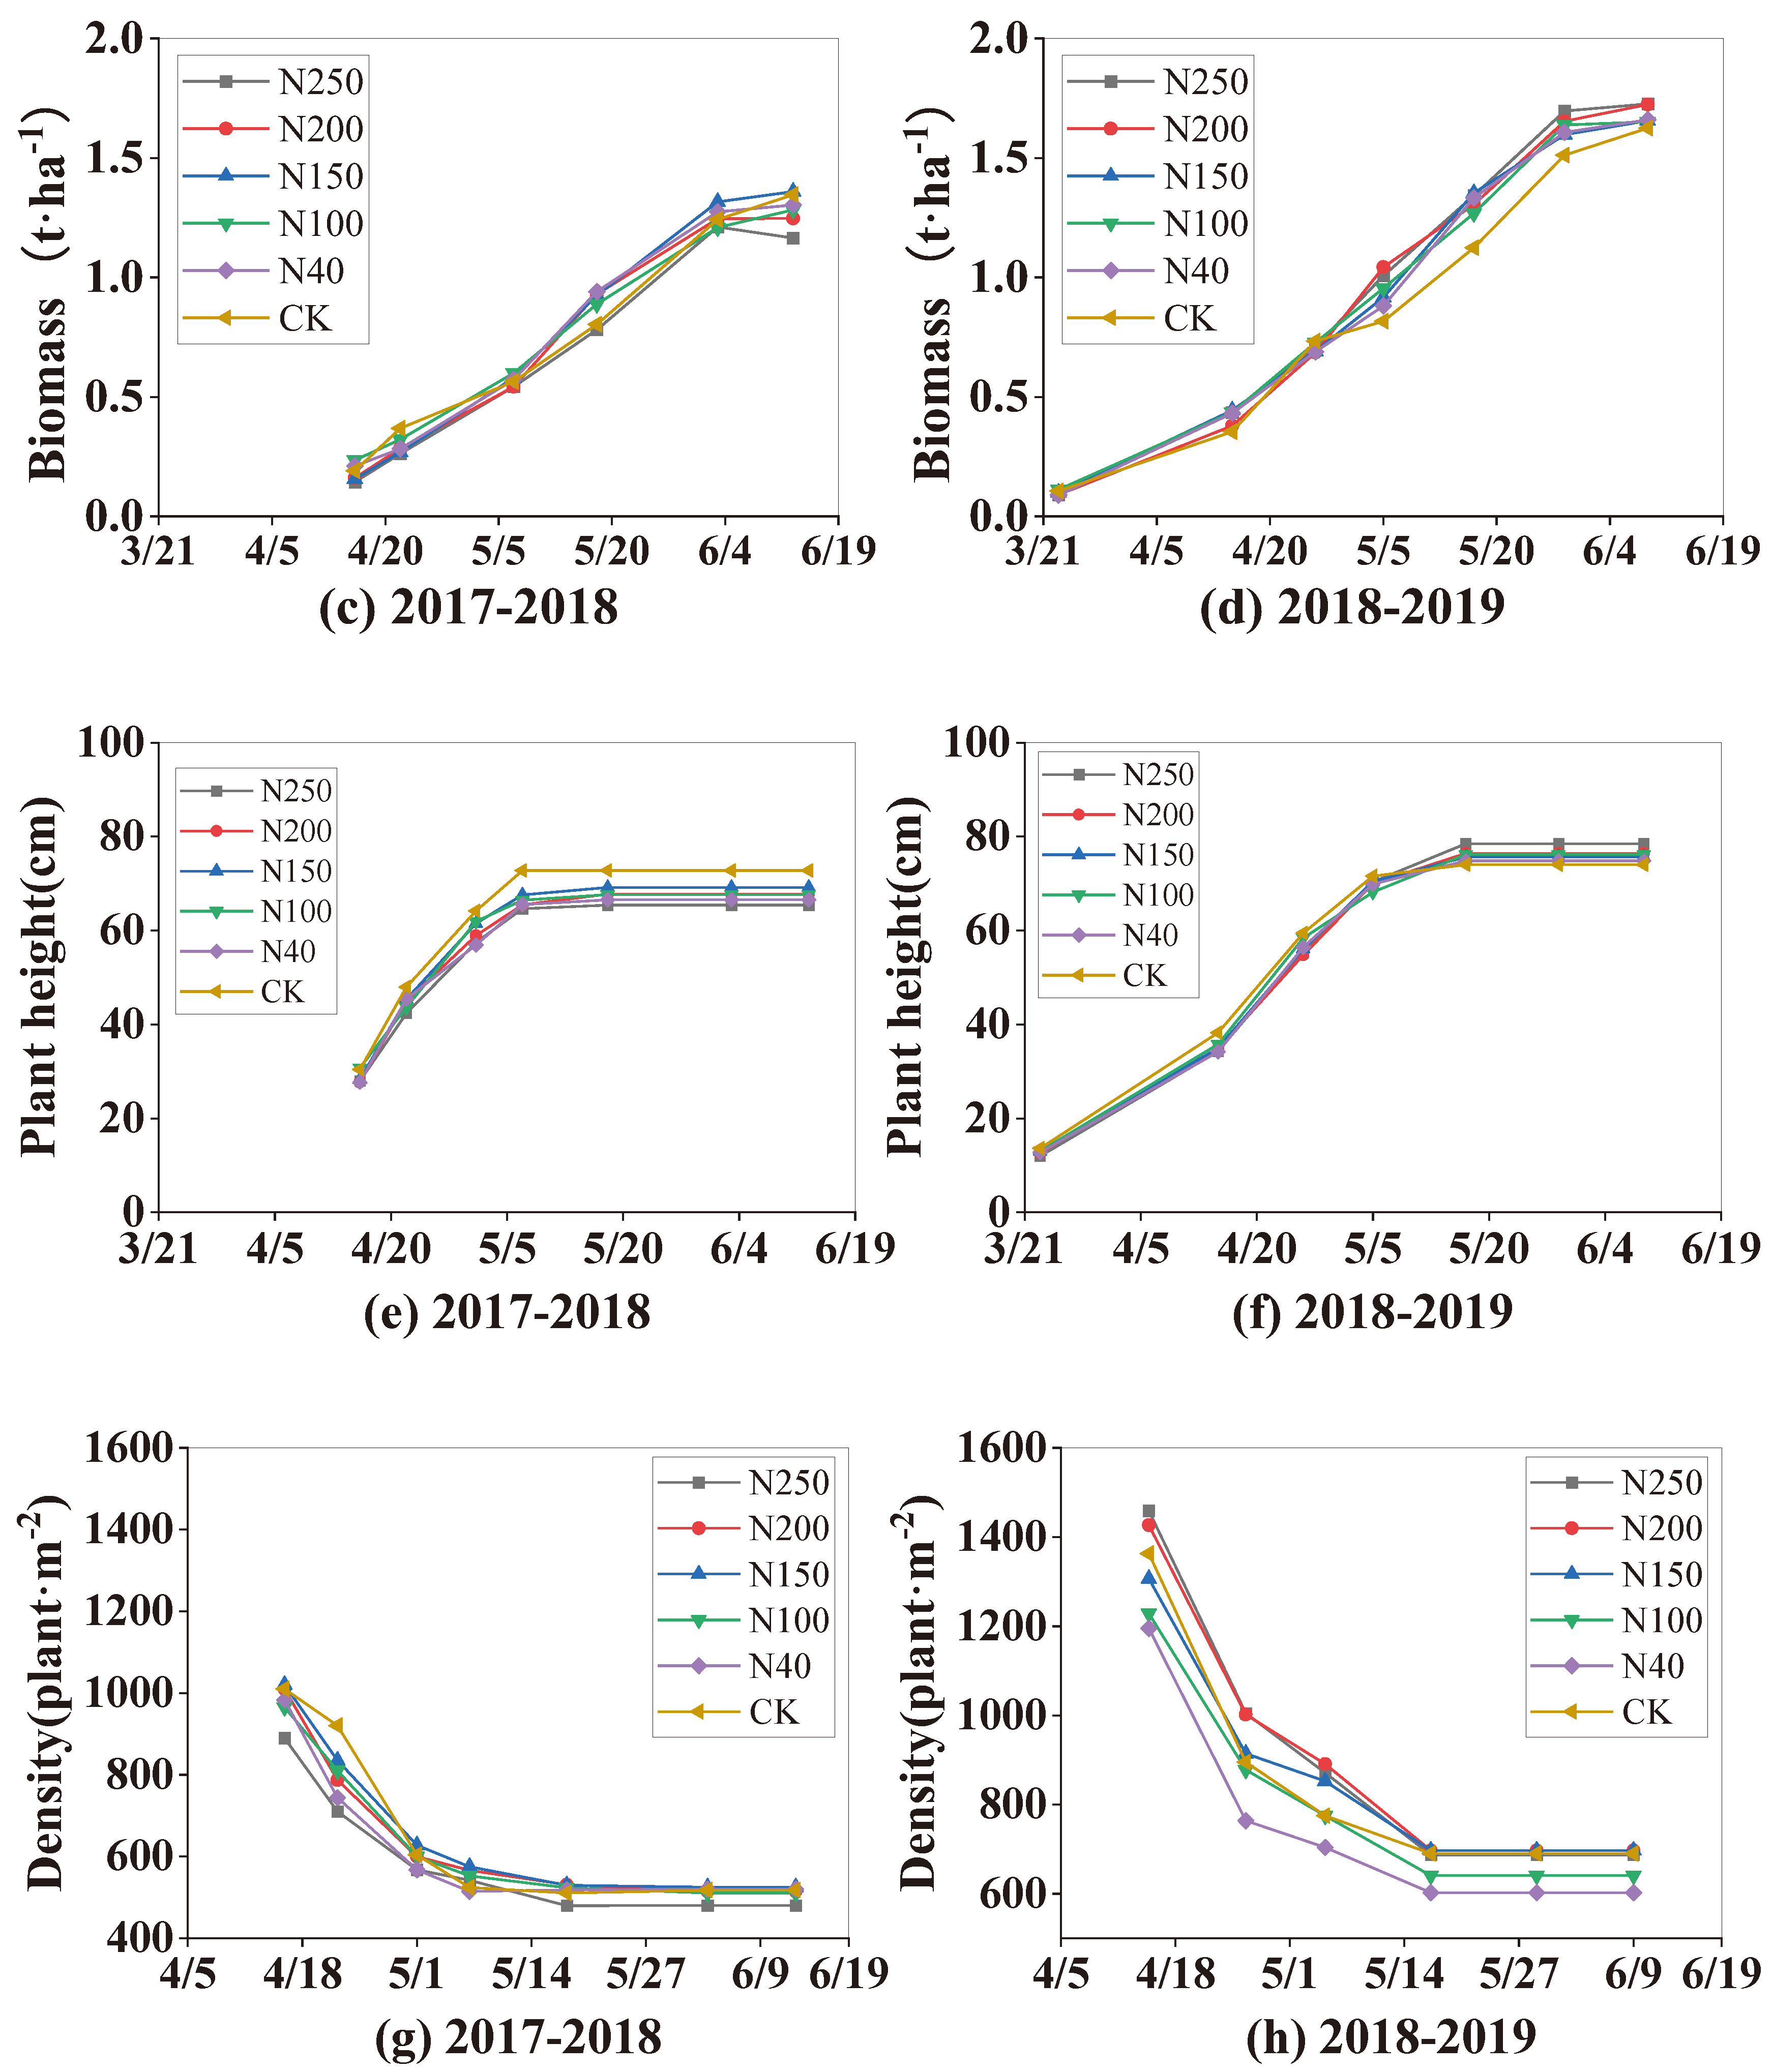
The winter wheat growth indexes, including LAI, dry biomass of above-ground plant parts, plant height, and plant density, are shown in
Figure 7. The trends in the changes of the four growth indexes in both seasons were similar among the five treatments and the CK. The four growth indexes were not significantly different among the five treatments (
P > 0.05) in the first growing season. However in the second growing season (2018-2019 season), the LAI and plant density were lowest in N40, and were significantly (P < 0.05) lower than those in the other four N treatments and the CK during the later growth period. There were significant (P < 0.05) differences in the growth indexes between the two seasons. The mean maximum LAI, biomass, plant height, and plant density among the five N treatments were 4.62, 1.28 t·ha
-1, 67.08 cm, 980 plant·m
-2, respectively, in the 2017-2018 season, but significantly higher (5.65, 1.67 t·ha
-1, 75.9 cm, and 1579 plant·m
-2, respectively) in the 2018-2019 season, showing increases of 22.3%, 30.4%, 13.2%, 61.1%, respectively, in the 2018-2019 season.
2.5. Wheat Grain Yield and Harvest Factors
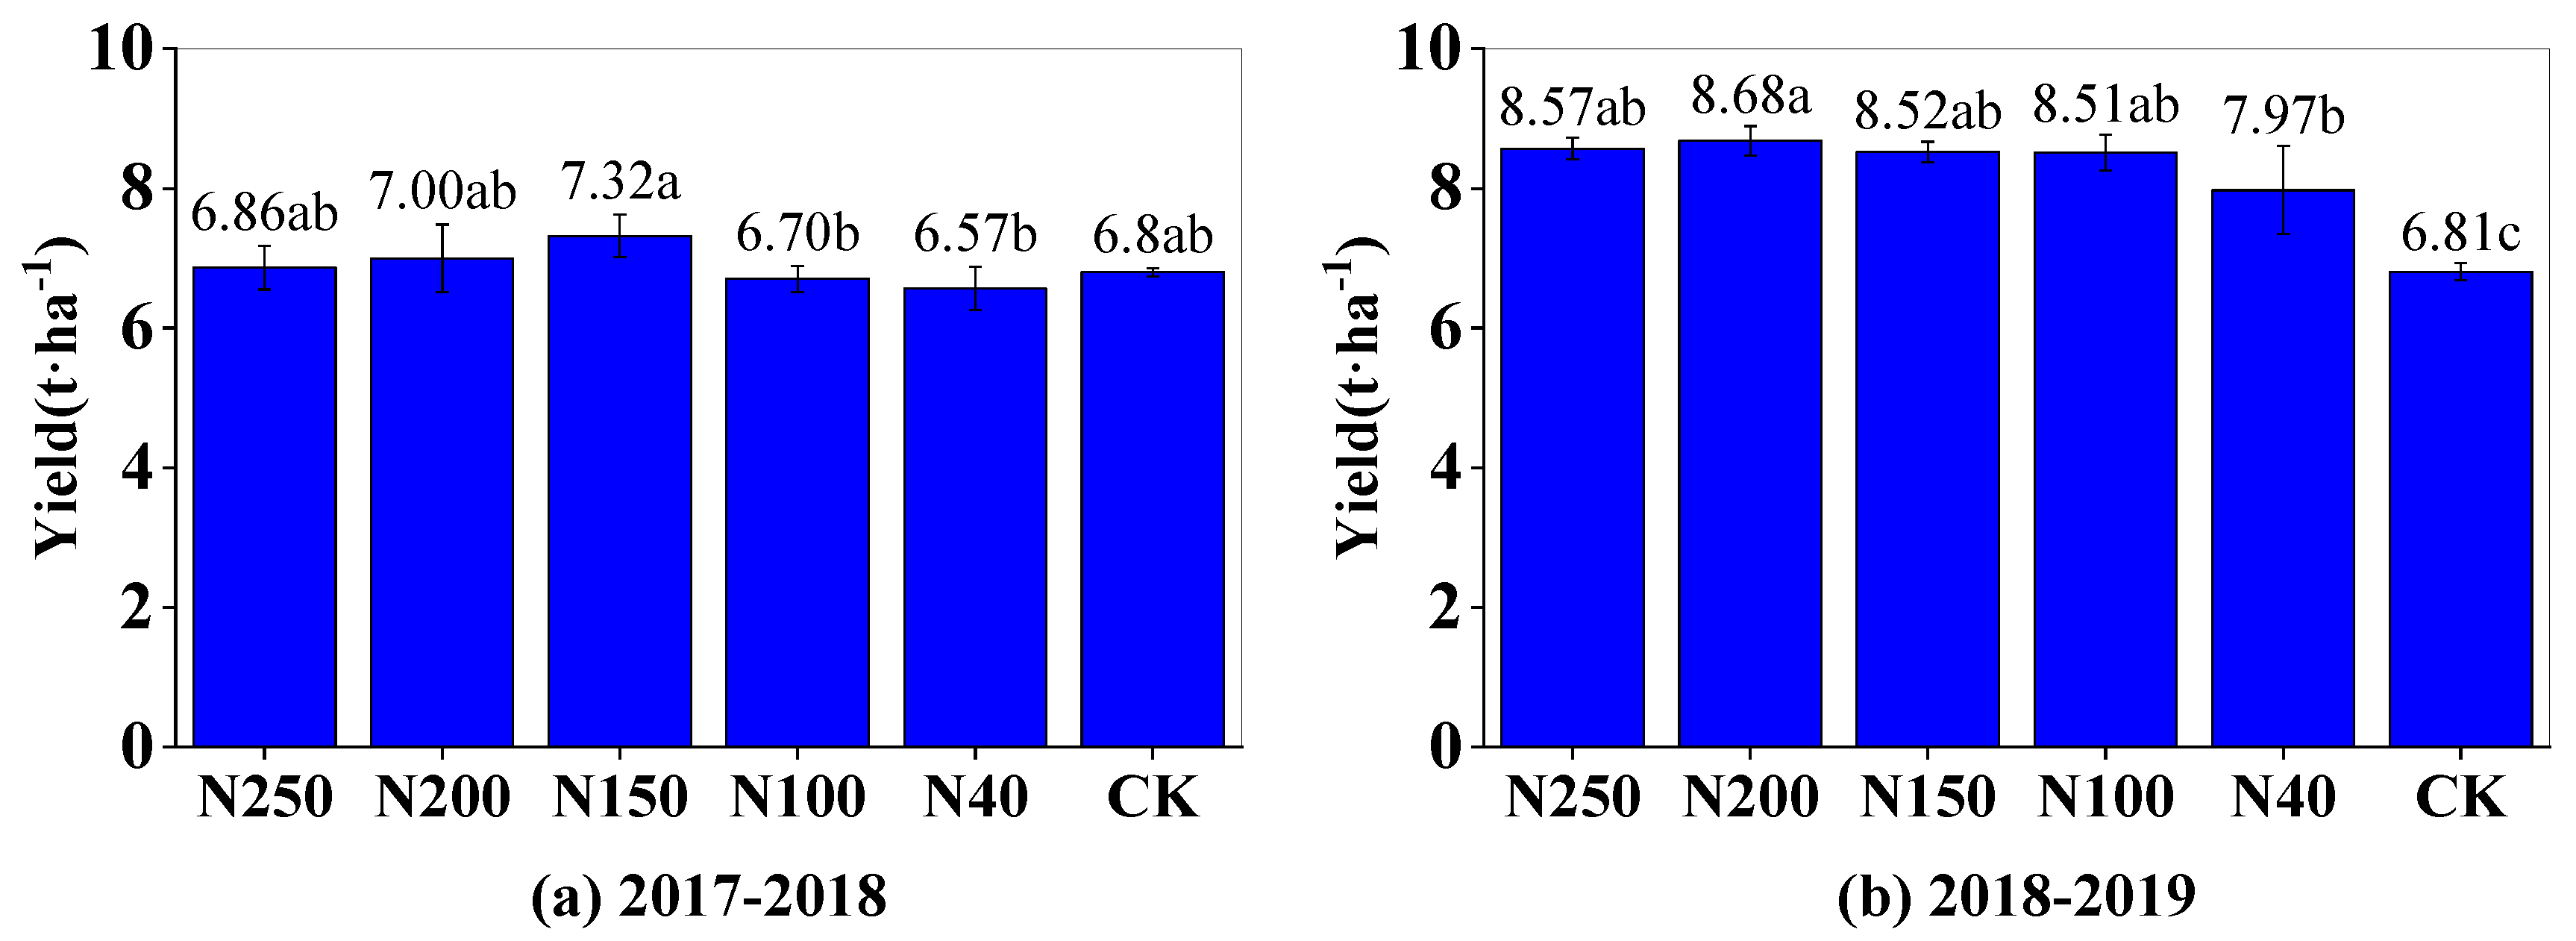
In the 2017-2018 and 2018-2019 seasons, the highest wheat yield was 8.52 t·ha
-1 in the N150 treatment and 8.68 t·ha
-1 in the N200 treatment, respectively (
Figure 8). Generally, the wheat yields were not significantly different among the N150, N200, and N250 treatments (P > 0.05). However, the yields in those treatments were significantly (P<0.05) higher than those in the N40 treatment and the CK (
Figure 8). The wheat yield in the N100 treatment was lower than those in the N150, N200, and N250 treatments, but was generally higher than those in N40 and the CK. Therefore, increasing the N application rate from 40 to 150 kg ha
-1 greatly improved wheat yield production, and but further increases in the N application rate only slightly affected wheat yield. The mean wheat yield among the five N treatments in the 2017-2018 season was 6.89 t·ha
-1, which was 18.5% lower than that (8.45 t·ha
-1) in the 2018-2019 season, indicating that there was a substantial variation in wheat yield between the two different growing seasons.
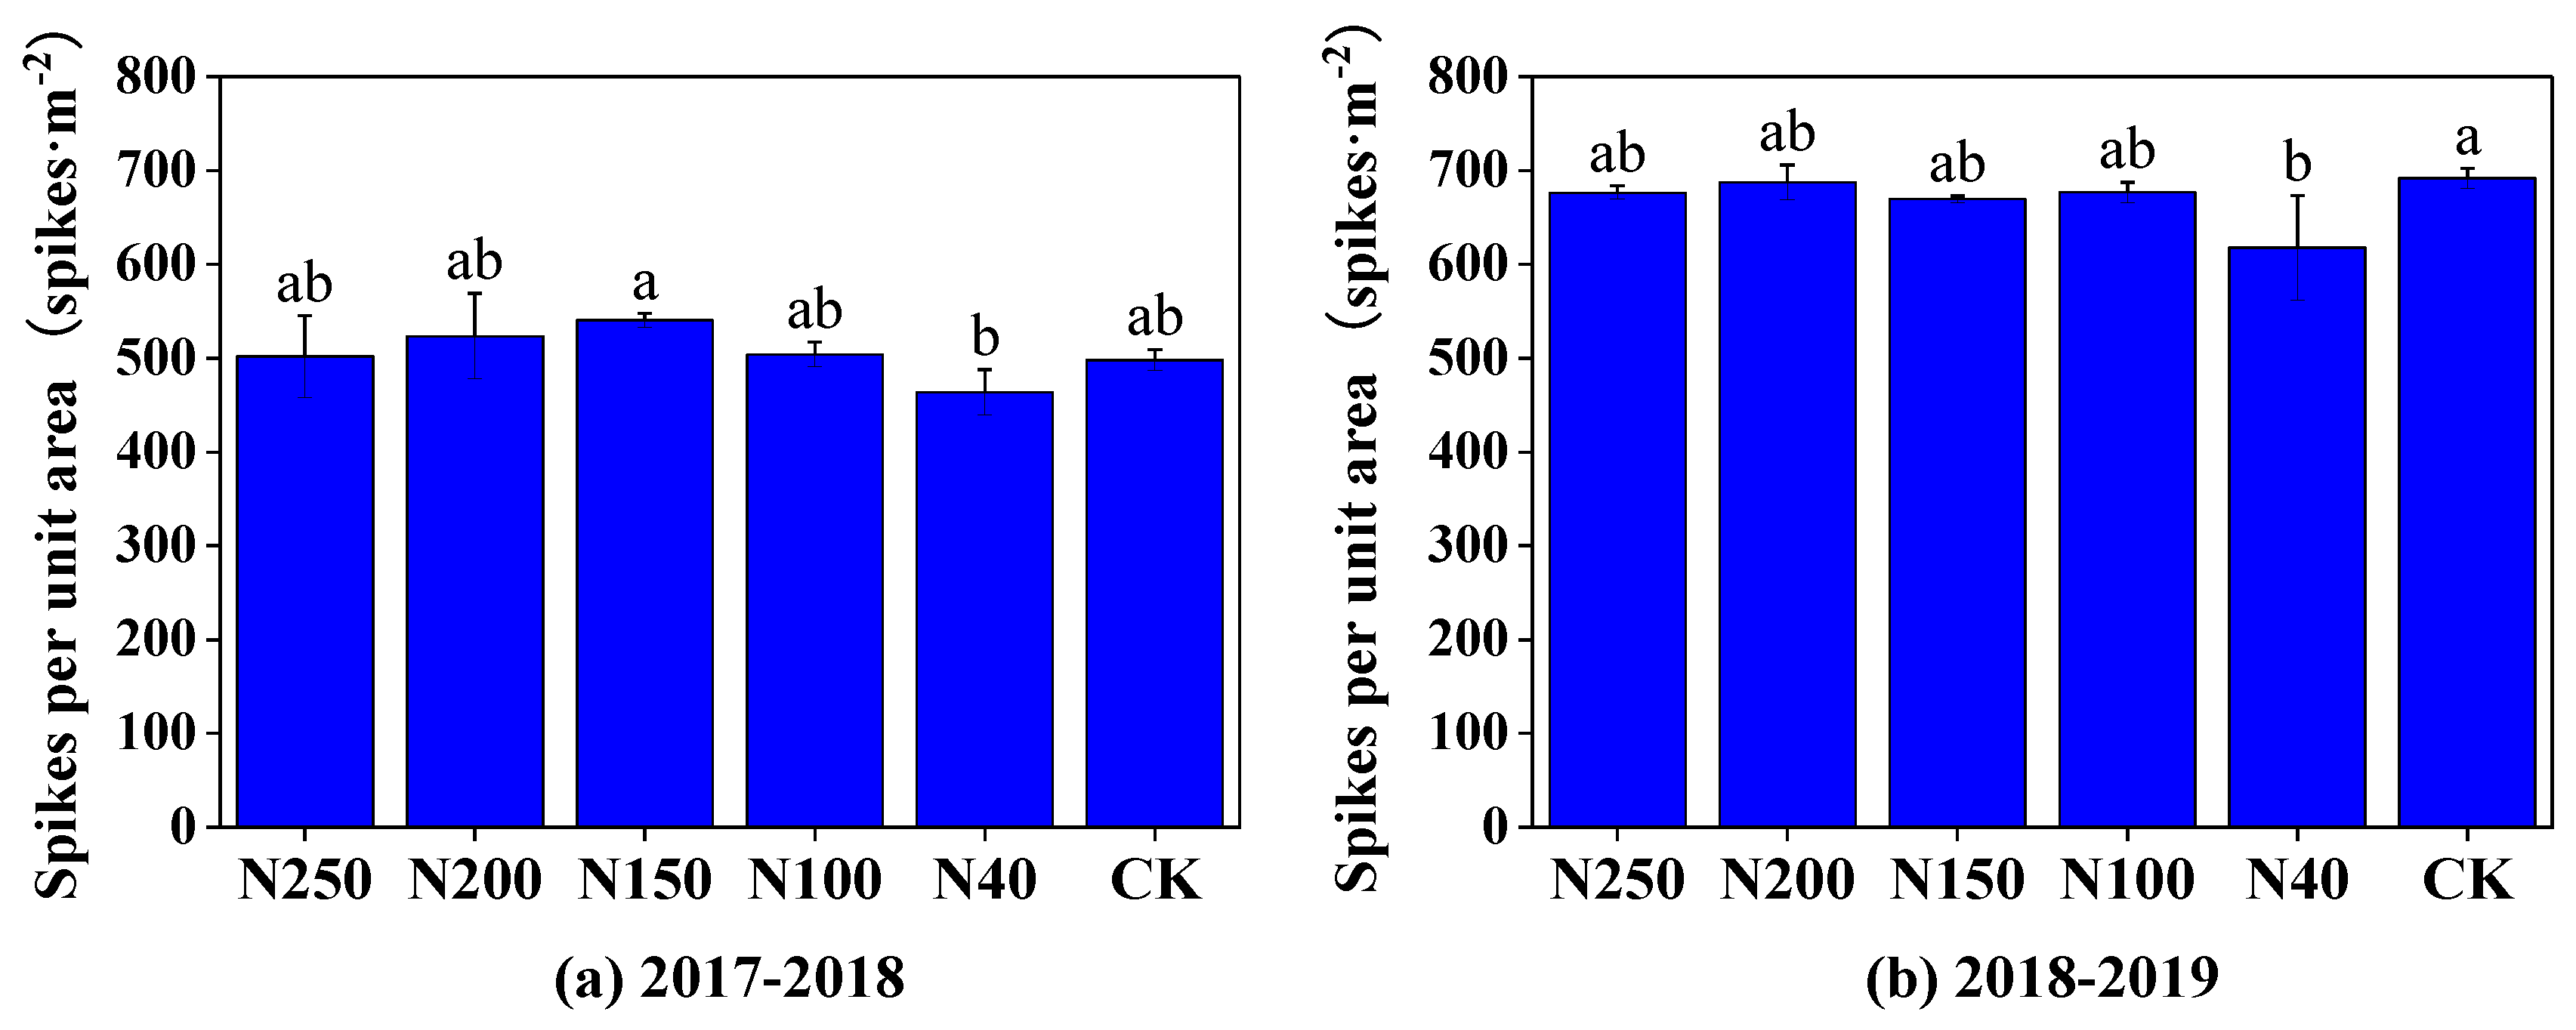
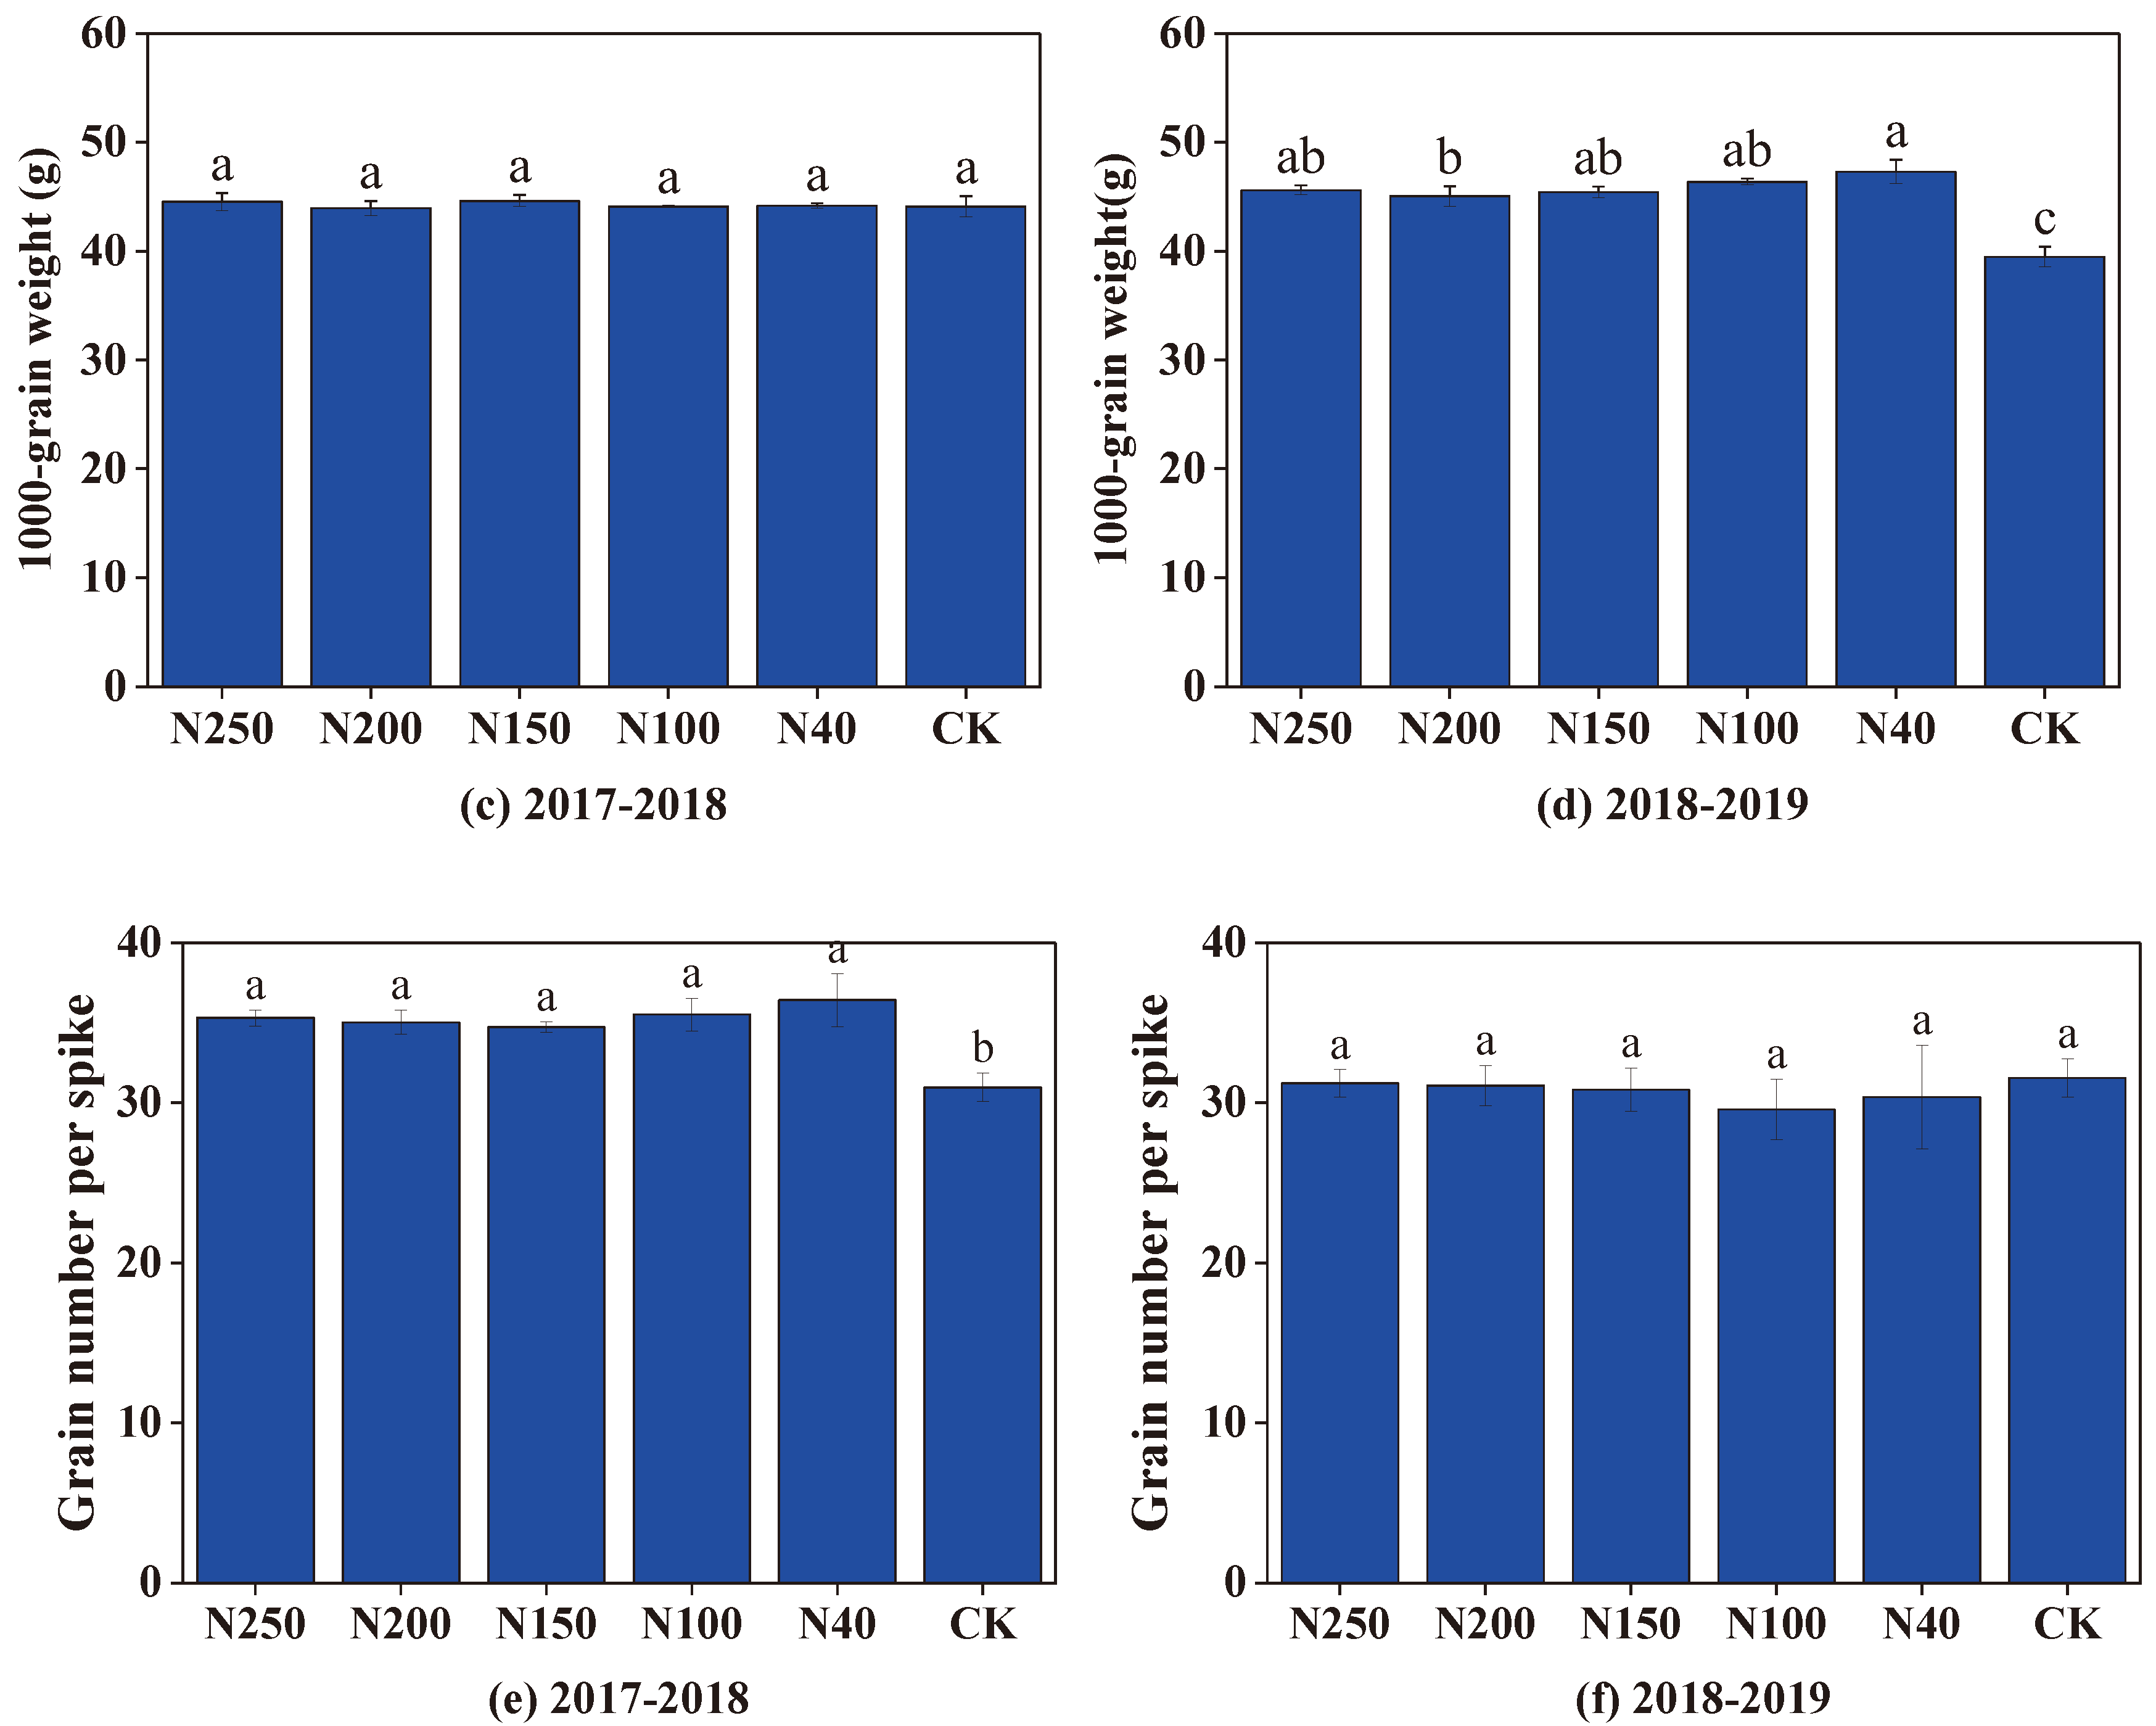
The three harvest-related factors, number of spikes per unit area, grain number per spike, and 1000-grain mass, in the two seasons are shown in
Figure 9. Generally, the number of spikes per unit area was not significantly (P > 0.05) affected by the N application rate when it was higher than 100 kg ha
-1, but was significantly (P < 0.05) reduced when the N application rate was 40 kg ha
-1 (
Figure 9a,b). The grain number per spike and 1000-grain mass were not significantly (P > 0.05) affected by the N application rate between 40 to 250 kg ha
-1 (
Figure 9c–f,). The three harvest-related factors differed substantially between the two growth seasons. Compared with the 2017-2018 wheat season, in the 2019-2019 growth season, the mean number of spikes per unit area (665 spikes·m
-2) was 31.4% higher and the grain number per spike (30.62 grains per spike) was 13.5% lower. The 1000-grain mass was similar in the two seasons; 44.27 g in 2017-2018 and 45.95 g in 2018-2019.
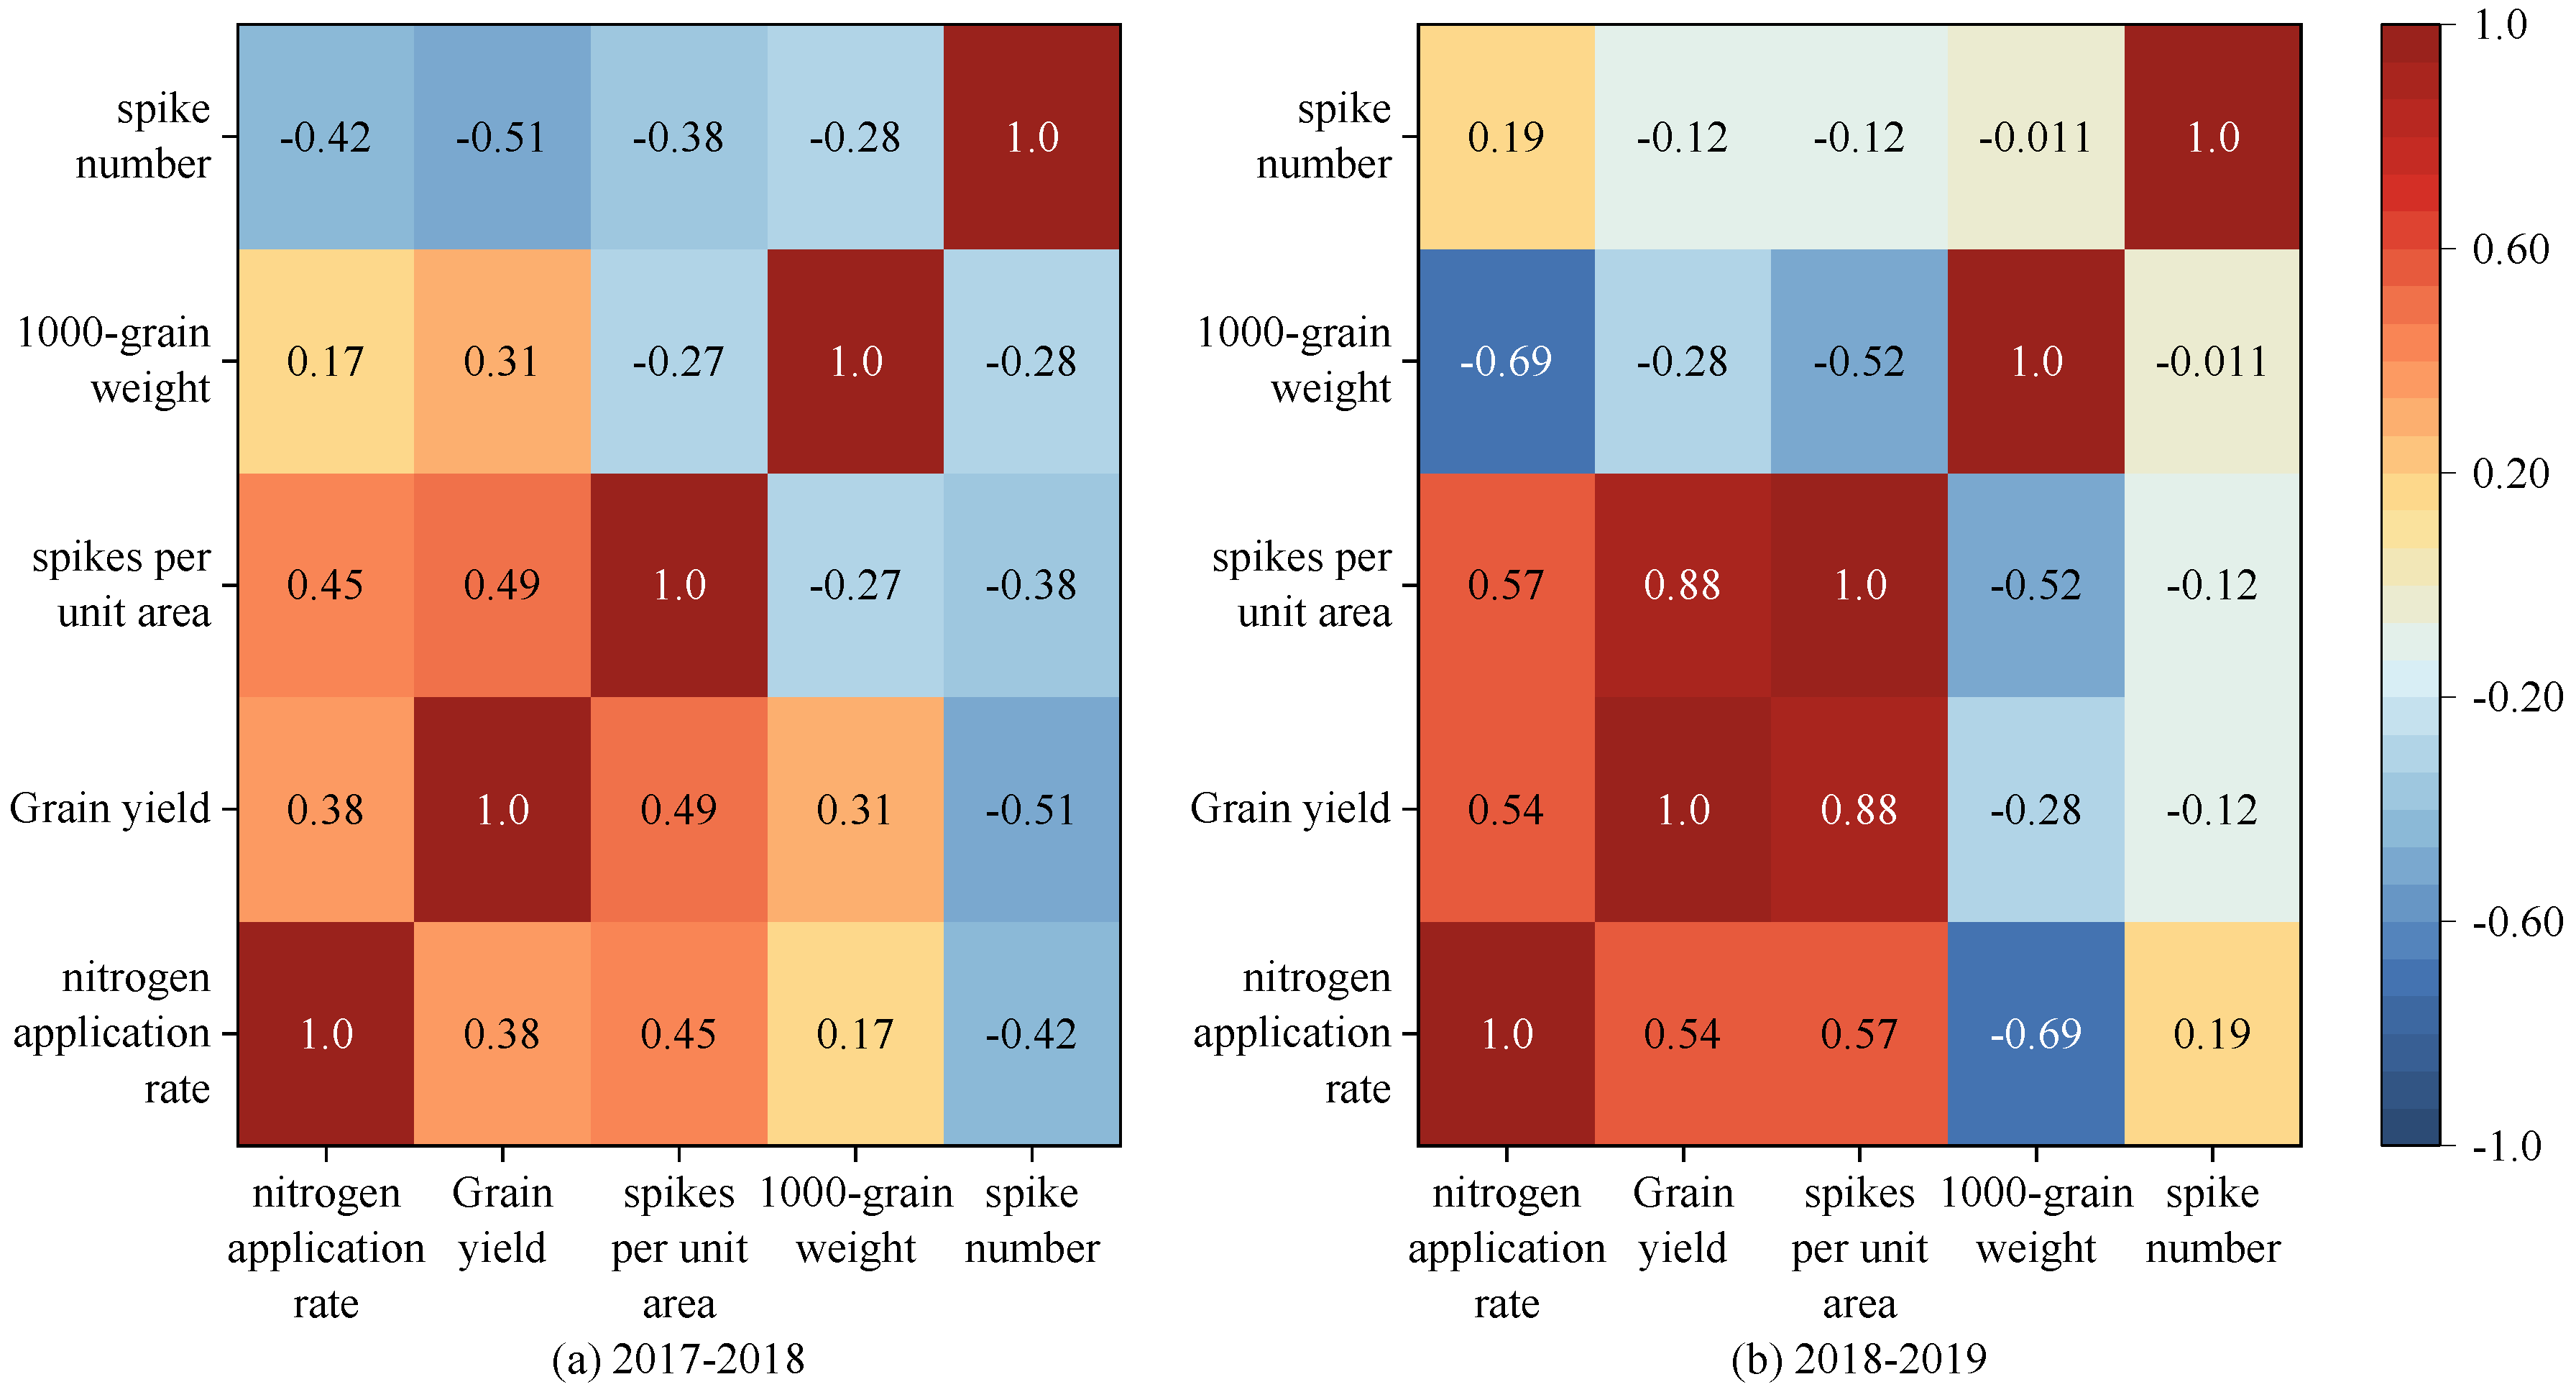
A correlation analysis was conducted to compare the results collected in the two growing seasons (
Figure 10). There was a positive correlation between the N application rate and yield, with the correlation coefficients in the two seasons being 0.38 and 0.54 (
P < 0.05). The number of spikes per unit area was positively and significantly (
P < 0.05) related to the N application rate and grain yield. The spike number was negatively related to grain yield at the 0.05 level in the 2017-2018 season, but this correlation was not significant in the 2018-2019 season. The 1000-grain weight was negatively correlated with the N application rate at the
P < 0.01 level in the 2018-2019 season, but this correlation was not significant in the 2017-2018 season. Based on these results, it can be inferred that the N application rate mainly affected the winter wheat yield by affecting the 1000-grain weight and the number of spikes per unit area.
2.6. Water- and N-Use Efficiencies
2.6.1. Crop Evapotranspiration, Water and Fertilizer Use Efficiency
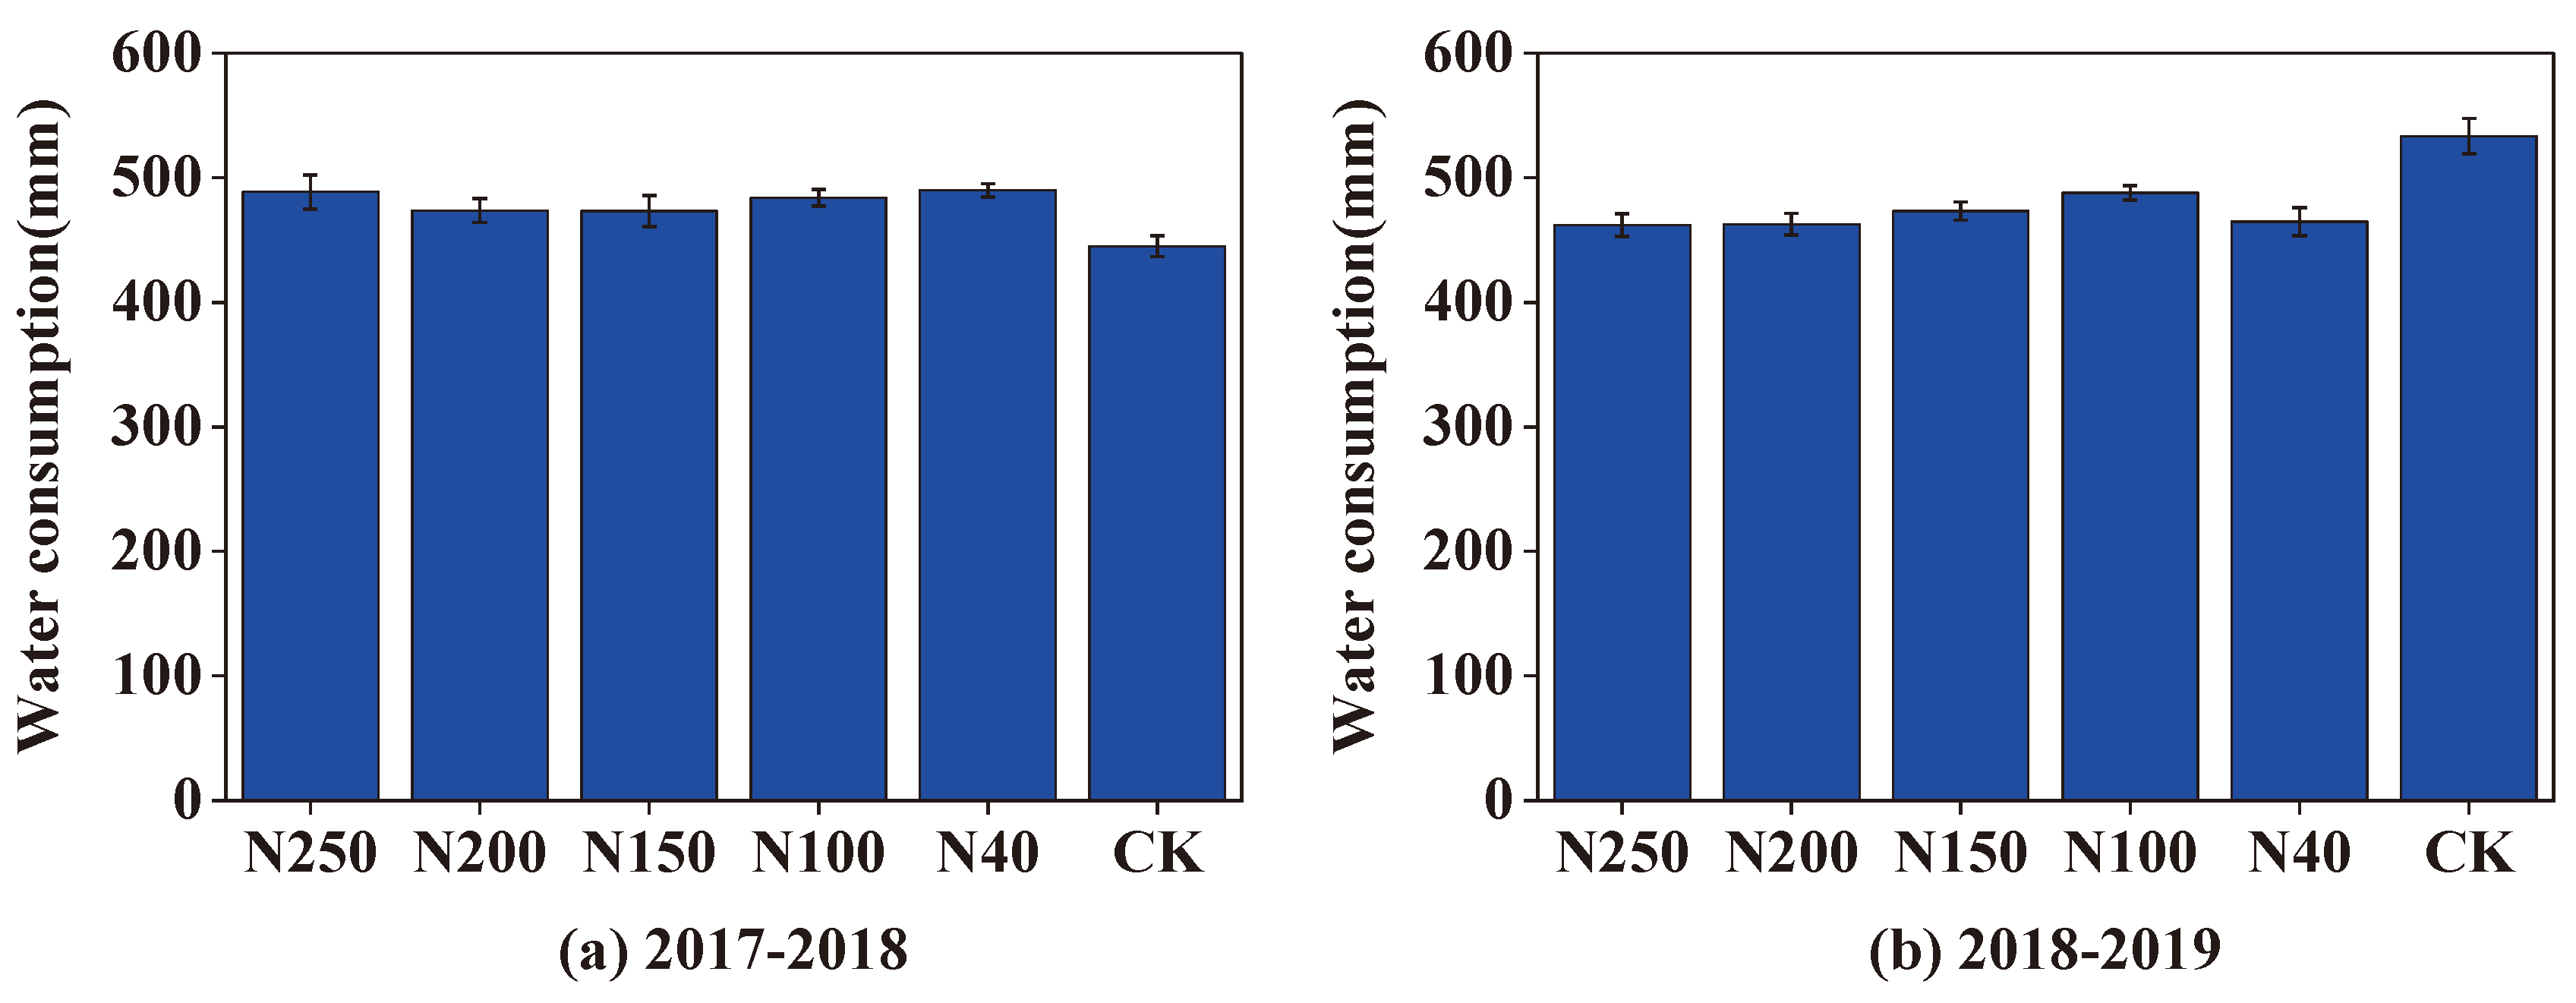
The average actual crop evapotranspiration (ET
a) of winter wheat over the five fertilization treatments was 482 mm in the 2017-2018 season and 470 mm in the 2018-2019 season. The ET
a values in the CK field in the 2017-2018 and 2018-2019 seasons were 445 and 533 mm, respectively, which were correspondingly 7.7% lower and 13.5% higher than the mean ET
a over the five N treatments (
Figure 11). Among the five N treatments, the N150 and N200 treatments had the lowest ET
a in the 2017-2018 season and the N200 treatment had the lowest ET
a in the 2018-2019 season.
The irrigation water productivity (IWP), crop water productivity (WP), and N-use efficiency for each treatment in the two seasons are listed in the
Table 1. Among the five N application treatments, N150 had the highest WP and IWP (1.55 and 3.57 kg·m
-3, respectively) in the 2017-2018 season, and N200 had the highest WP and IWP (1.88 and 2.93 kg·m
-3, respectively) in the 2018-2019 season. In general, the WP and IWP were not significantly different among N150, N200, and N250, but the WP and IWP of those treatments were significantly higher than those in the treatments with N application rates lower than 100 kg ha
-1 (
Table 1). In both seasons, N40 had the lowest WP and IWP. The WP was higher in all the N application treatments than in the CK.
The applied N productivity (ANP) ranged from 29.0 to 56.8 kg·kg-1, and generally decreased as the N application rate increased. The ANP was highest in the N40 treatment and lowest in the N250 treatment. The ANP in the CK was 25.7 and 26.4 kg·kg-1 in the 2017-2018 and 2018-2019 seasons, respectively, lower than the ANP in the five N application treatments in each corresponding season.
The values of the three indicators (WP, IWP, and ANP) were lower in the 2017-2018 season than in the 2018 -2019 season. The values of IWP, WP, and ANP in the 2018-2019 season were 46.9%-60.1%, 34.3%-46.8%, and 2.5%-18.0% higher than their corresponding values in the 2017-2018 season.
2.6.2. Crop N Uptake and Soil N Balance
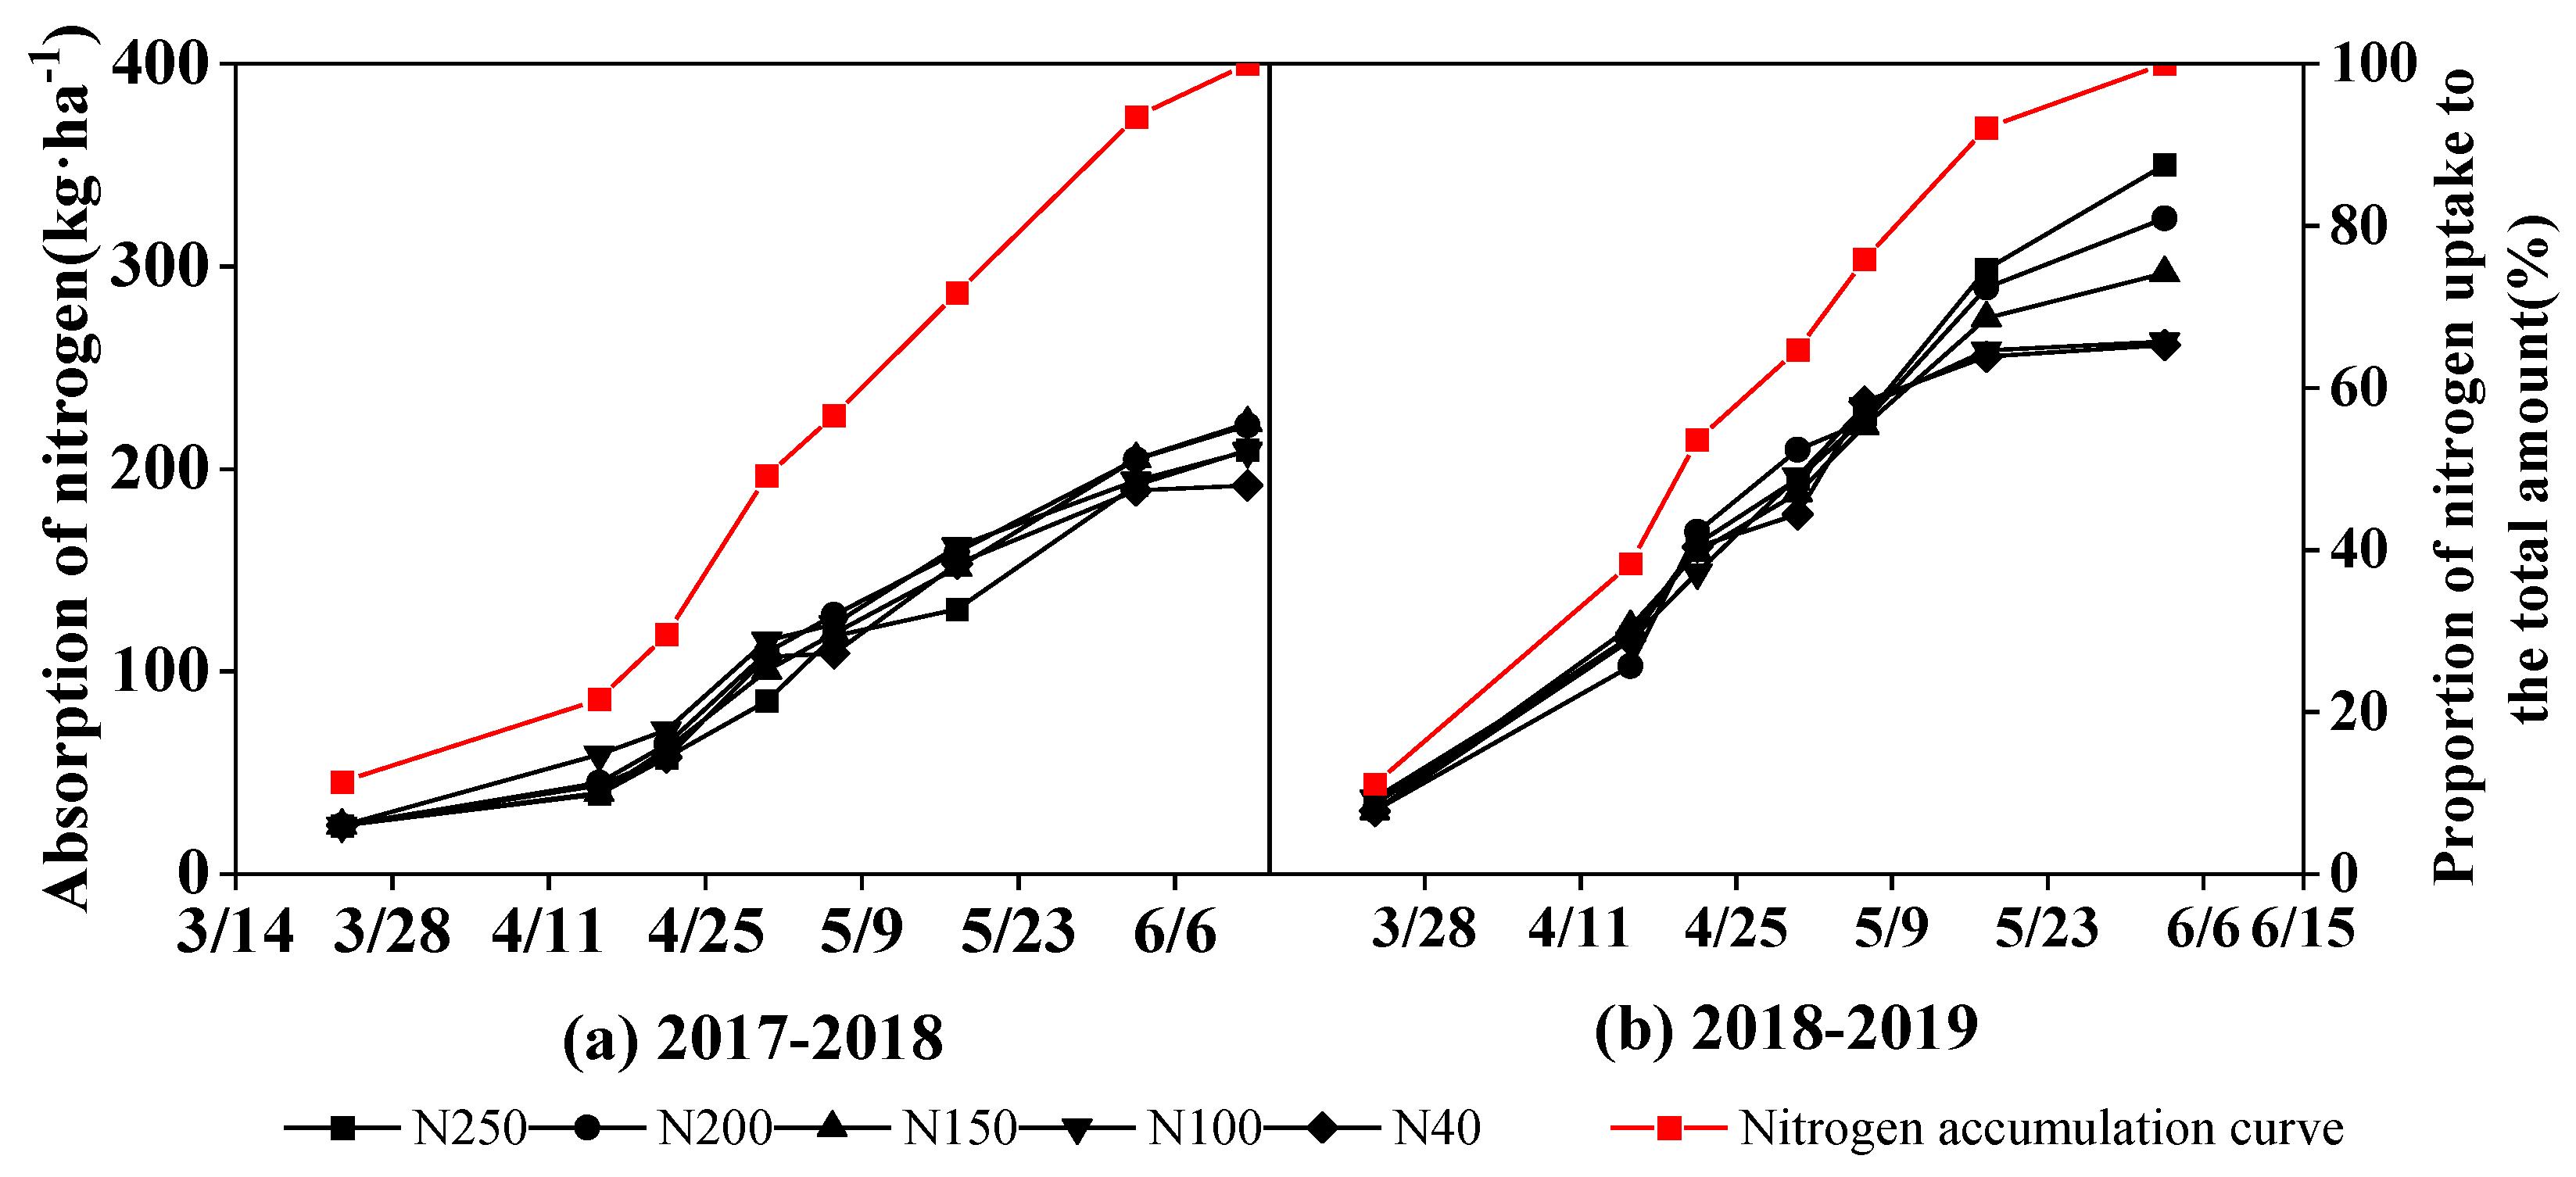
Figure 12 shows the curves of crop N uptake by biomass above the ground surface and its proportion of total N uptake during the period from regreening to harvest in the two experimental seasons. At the regreening stage, the N uptake of the wheat crop was approximately 12% of the total N uptake in the whole growth period. During the period when winter wheat grew slowly between the end of the regreening stage and the beginning of the elongation stage, the N uptake reached to 22% of the seasonal total. From the elongation stage to the middle of the grain-filling stage, the wheat plants grew quickly and the N uptake amount linearly increased. The proportion of N uptake out of the total seasonal total N uptake was 49% by the flowering stage, and 72% and 93% by the early and late grain-filling stages, respectively. From the late grain-filling stage to harvest, the N uptake increased slightly, and the total N uptake amount during this period was approximately 7% of the seasonal N uptake amount.
The mean seasonal N uptake of winter wheat in the 2017-2018 and 2018-2019 seasons was 210 and 299 kg ha-1, respectively; and the corresponding N content in the grains at harvest was 140 and 195 kg ha-1, respectively, accounting for 66.7% and 65.22% of the plant total N uptake in the two seasons, respectively. The N uptake in the first season did not differ significantly among the five treatments (P > 0.05). However in the 2018-2019 season, the highest N uptake amount was 350 kg ha-1 in the N250 treatment, followed by 323 kg ha-1 (N200), 296 kg ha-1 (N150), 262 kg ha-1 (N100), and 261 kg ha-1 (N40).
The average initial soil nitrate-N content in the 0-200 cm soil layer was 566 kg ha
-1 before sowing and 358 kg ha
-1 at harvest in 2017-2018, and 403 kg ha
-1 before sowing and 326 kg ha
-1 at harvest in 2018-2019. This indicates that after two wheat growing seasons, the soil nitrate-N content in the experimental area was effectively reduced (
Table 2). The total N content in the aboveground biomass at harvest in the N250, N200, N150, N100, and N40 treatments was 209, 221, 222, 209, and 192 kg ha
-1, respectively, in 2017-2018, and 350, 324, 297, 263, and 261 kg ha
-1, respectively, in 2018-2019. The total N uptake by wheat was higher in 2018-2019 (299 kg ha
-1) than in 2017-2018 (211 kg ha
-1). Generally, the amount of N taken up by wheat increased as the N application rate increased. The overall apparent N loss was substantially lower in 2018-2019 (13 kg ha
-1) than in 2017-2018 (153 kg ha
-1).
3. Discussion
3.1. Distribution of Soil Water and Nitrate-N under Different N Application Levels by Sprinkler Irrigation
In this study, with the optimal irrigation scheme, the soil water content in the experimental field mainly changed in the 0-100 cm soil layer, and that in the 100-180 cm soil layer remained relatively stable. This shows that winter wheat under sprinkler irrigation mainly used the soil water in the 0-100 cm soil layer. Approximately 80% of wheat roots are distributed in the 0-80 cm soil layer [
17], and water uptake by roots may result in obvious variations in soil water content in the upper 100 cm soil layer. However, in the CK field with local traditional irrigation management, the soil water content showed marked fluctuations below 100 cm soil depth, indicative of deep water seepage. The comparison of patterns in soil water content between optimized sprinkler irrigation and local water management shows that the former system results in good soil water conditions in the root zone and reduces water seepage. Similar results have been reported in other studies [
18,
19]
The distribution and transport of nitrate-N in soil are strongly affected by different N application regimes and by irrigation management. Because nitrate-N generally moves along with water flow in soil, there are great variations in soil nitrate-N in the 0-120 cm soil layer. Our results show that winter wheat in the experimental area with optimized sprinkler irrigation management mainly took up nitrate-N in the 0-120 cm soil layer (
Figure 5 and
Figure 6). Under traditional water and fertilizer management, i.e., high water and high fertilizer inputs, the amount of nitrate-N stored in the CK field was higher than that in the N treatments. Liu
, et al. [
20] investigated nitrate-N distribution and movement in wheat-maize and vegetable fields and found that high annual irrigation (260-1600 mm) and N application (1000-2000 kg ha
-1) to vegetable fields, especially under greenhouse cultivation, resulted in a nitrate-N concentration of 10-15 mg kg
-1 in the 2-6 m soil layer, which was up to 100% more than that in the wheat-maize field (6-8 mg kg
-1) with optimized sprinkler irrigation. Li
, et al. [
21] also reported that after a 4-year wheat-maize field experiment under optimal sprinkler irrigation, the applied water and fertilizer N mostly accumulated in the 0-60 cm soil layer in the winter wheat season, and the amount of nitrate-N leaching out of the root zone (0-100 cm) was negligible.
3.2. Relationship between Wheat Grain Yield and N Application
Nitrogen, as one of the essential elements required for wheat growth, plays an important role in the growth and yield production of wheat [
22]. Studies have shown that an appropriate increase in the amount of N fertilizer can improve the photosynthesis rate of wheat, promote the accumulation of above-ground dry matter mass, and thus increase wheat yield [
5,
23]. In this study, when the N application rate was lower than 200 kg ha
-1, yield and the three yield-related factors (number of spikes per unit area, grain number per spike, and 1000-grain mass) generally increased as the N application rate increased (
Figure 8 and
Figure 9). The correlation analysis between the N application rate and the three factors related to wheat yield showed that increases in the 1000-grain mass and the number of spikes per unit area were the main reasons for the increase in wheat grain yield under higher N application rates. This result is consistent with those of previous studies [
24,
25,
26]. Considering the insignificant difference in wheat yield between the N150 and N200 treatments, the optimal N application range was 150-200 kg ha
-1.
The NCP produces approximately 60% of the total wheat crop in China [
7]. It has been reported that the wheat yield in the NCP increased from 6000 kg ha
-1 in the 1990s, to 7000 kg ha
-1 in the 2000s, and then to 8500 kg ha
-1 in the 2010s (
Table 3). Similarly, the regional mean wheat yield, as listed in the national statistical database, increased from 3738 kg ha
-1 in the 1990s to 4739 kg ha
-1 in the 2000s and then 5630 kg ha
-1 in the 2010s [
7,
27]. During the same period (from the 1990s to 2010s), the recommended optimized N application rate only changed slightly, from 150-210 kg ha
-1 to 180-220 kg ha
-1 (
Table 3). The mean wheat yields in the last 30 years, as reported in published literature and the national statistical database, have increased by 41.7% and 50.6%, respectively, while the mean optimized N application reported in the literature has ranged from 150 to 200 kg ha
-1 (
Table 3). This means that the applied N productivity of wheat in the NCP has greatly improved. This may be because of new wheat varieties being cultivated, improved field pest and weed control, and optimization of water and fertilizer management [
28].
Compared with traditional surface irrigation, the sprinkler irrigation method distributes water more uniformly and precisely, establishes the optimal soil water content for crop growth, and can regulate the microclimate in the field to enhance leaf photosynthetic activity and mitigate the dry-hot-windy climate [
29]. In this study, the optimized N application rate was 150-200 kg ha
-1, and sprinkler irrigation was able to distribute water and N to the main root zone in the 0-60 cm soil layer (
Figure 3,
Figure 4,
Figure 5 and
Figure 6), which improved wheat growth and grain yields (
Figure 7 and
Figure 8). Therefore, the change from the traditional surface irrigation system to the sprinkler fertigation system could be the main reason for the increases in wheat yield and water- and N-use efficiencies in the last 30 years [
30].
Table 3.
Optimized N fertilization rates, wheat grain yields, and irrigation systems in the 1990s, 2000s, and 2010s.
Table 3.
Optimized N fertilization rates, wheat grain yields, and irrigation systems in the 1990s, 2000s, and 2010s.
| Period |
Optimized N rate
(kg ha-1) |
Wheat grain yield
(kg ha-1) |
Irrigation depth and system
(mm) |
References |
| 1990s |
180-220 |
5250-6000 |
180-200
Border irrigation |
[31,32,33,34,35] |
| 2000s |
155-210 |
6500-7000 |
180-270
Border irrigation |
[36,37,38,39,40,41,42,43,44] |
| 2010s |
150-210 |
7500-8500 |
180-230
Drip irrigation or sprinkler irrigation |
[45,46,47,48,49,50,51,52] |
| 2017-2019 |
150 - 200 |
7300-8500 |
200-250
Sprinkler irrigation |
this study |
3.3. Soil N Balance and N-Use Efficiency under Different N Application Rates with Sprinkler Fertigation
Under appropriate soil water conditions, optimal fertilizer application can improve the soil N status in the crop root zone and enhance the N-use efficiency [
53]. In another study on sprinkler fertigation in an experimental wheat field, the contents of soil water and nitrate-N greatly varied in the 0-60 cm soil layer and no water and N seepage were detected below 100-cm soil depth [
18]. Similar results were obtained in this study (
Figure 3,
Figure 4,
Figure 5 and
Figure 6). However, high levels of N and water application to a vegetable field caused nitrate-N to accumulate at 200.2% higher levels in the 0-100 cm soil layer compared with that in a wheat-maize rotation cultivation system [
54]. Ultimately, high levels of nitrate-N in the 0-100 cm soil layer can lead to high N leaching and ground water pollution [
55]. The sprinkler fertigation system accompanied by optimal sprinkler irrigation scheduling more effectively distributes water and N in the root zone, ultimately reducing N leaching and increasing the N-use efficiency [
56,
57,
58].
The N balance in soil is greatly affected by the amount of N applied, the amount of N taken up by crops, and crops’ N-use efficiency [
22,
53]. Li, Liu, Huang, Zhang and Yang [
21] investigated the accumulation of N in a wheat-maize system after a 4-year field experiment in the NCP, and reported that the nitrate-N concentration in 0-100 cm soil layer varied slightly in the 4
th year; nitrate-N leaching was negligible when N was applied at rates lower than 220 kg ha
-1 yr
-1; and the amount of nitrate-N leaching was linearly related to the amount of N applied within the range of 400-600 kg ha
-1 yr
-1. In this study, the amount of nitrate-N in soil in the root zone (the 0-100 cm soil layer) before wheat sowing decreased from 566 kg ha
-1 in the first season to 403 kg ha
-1 in the second season, and apparent N loss from soil during the whole wheat season decreased from 153 kg ha
-1 in the 2017-2018 season to 13 kg ha
-1 in the 2018-2019 season. These results show that optimal N application scheduling with the sprinkler fertigation system was helpful to reduce N losses without reducing wheat yield, and ultimately improved the N-use efficiency of winter wheat. Balanced N conditions in the root zone could provide sustainable soil fertility for crop production. With the aim of maintaining the soil N balance and sustainable wheat production, the optimal amount of N applied during the winter wheat season is recommended at 200 kg ha
-1 to achieve a wheat yield of approximately 8-9 t ha
-1.
4. Materials and Methods
4.1. Experimental Site
This field experiment was conducted during the 2017-2018 and 2018-2019 winter wheat growing seasons at the National Seed Breeding Station (NSBS) in Ningjin County, Xingtai City, Hebei Province (37°29′, 114°55′E, 26.4 m altitude), China. The station is located in the central NCP. The NCP has a continental monsoon climate, with an annual average temperature of 12.8 °C and an average frost-free period of approximately 200 days. The annual average precipitation is between 452 and 553 mm, approximately 60%-70% of which is concentrated in summer from July to September. The annual average sunshine duration is 2538 h, and the wind speed range is 2.3 - 2.7 m·s-1.
The proportions of clay, silt, and sand particles in soil at the experimental station were 10%-7%, 51%-67%, and 19%-35%, respectively. The soil texture in the 0-200 cm soil layer was silt loam and soil clay following the American classification. The field soil water holding capacity ranged from 0.36 to 0.38 cm
3·cm
-3 and the soil bulk density ranged from 1.35 to 1.77 g·cm
-3 (
Table 4).
4.2. Experimental Design
4.2.1. N Application Treatments
According to our investigations, the range of total N, phosphorus (P2O5), and potassium (K2O) fertilizers applied in the winter wheat growing season under the local traditional practice are 250-300, 100-150, and 60-100 kg ha-1, respectively. Generally, all phosphorus and potassium fertilizers are applied before sowing as basal fertilizer. Approximately half of the N fertilizer is applied as basal fertilizer, and the other half is applied once or twice after wheat regreening as topdressing fertilizer (mainly as urea). The total irrigation water in the wheat season is approximately 300 mm, of which approximately 100 mm is applied in November as over-winter irrigation, 100 mm after regreening in March, and 100 mm at the heading and grain-filling stage in late April and May. If the soil water content is so low that seed emergence is inhibited, approximately 60-80 mm water is applied to promote the emergence of winter wheat.
Based on the local N application amount of 250-300 kg ha
-1 during the whole winter wheat season, five N application treatments were established in this study: 250, 200, 150, 100 and 40 kg ha
-1, designated as N250, N200, N150, N100, and N40, respectively. The ratio of topdressing N fertilizer applied at the regreening, jointing, and grain-filling stages was 1:1:1. To ensure the growth of winter wheat at the seedling stage and overwintering stage, the amount of basal N fertilizer applied in all treatments was 40 kg ha
-1. Therefore, no topdressing N was applied in treatment N40. For the treatments N250, N200, N150, and N100, the remaining N amounts of 210, 160, 110, and 60 kg ha
-1 were applied as topdressing in three equal amounts at the regreening, jointing, and grain-filling stages. All five N treatments were replicated three times. A wheat field with local traditional water and fertilizer management, which was located on the east side of the experimental field, served as the control (CK). The specific N application rates in the treatments and CK are listed in
Table 5.
The total experimental field was 60 m wide × 200 m long. Along the long side in the South - North direction were 16 plots, each with a size of 12 m × 60 m. Among the 16 plots, plots 1-12 were used for the N250, N200, N150, and N100 treatments, and were randomly laid out in the field (
Table 5). Plots 13-16 were used for the N40 treatment, and were located on the North side of experimental field. The experimental field was irrigated using a sprinkler irrigation system. Each plot included four subplots measuring 12 m × 12 m each. Regulated angle sprinklers (model PYTK 10, Wudayunshui Co. Ltd., China) were located on 1-m high risers on the sub-laterals at intervals of 12 m. The sprinkler discharge rate was 0.9 m
3 h
-1 with a spraying radius of approximately 12 m under normal working pressure of 0.25 MPa. Three set fertilization machines were located between the mainline and laterals to apply topdressing N fertilizer. Irrigation water was pumped from groundwater with the water level approximately 40 m below the ground surface.
The winter wheat cultivar “YingBo-700,” which is recommended by local government, was sown at density of approximately 4.5 million seeds with 20-cm row spacing on October 24, 2017 and October 17, 2018. The crops were harvested on June 13, 2018 and June 9, 2019. Other field management activities, including weed and insect control, were conducted in the same way as in the other fields at the experimental station.
4.2.2. Irrigation Management
Based on the research results of our group, irrigation was first applied to a depth of approximately 40 mm after wheat regreening in the middle of March. After that, the irrigation depth was calculated as the 0.65 times the difference between the cumulative water surface evaporation from a 20-cm pan placed on the top of the canopy and rainfall between two irrigation intervals. Generally, the time interval between two irrigation events was 10-14 days and the irrigation depth was 30-40 mm per event [
16]. Topdressing N was applied to the field with sprinkler irrigation at set growth stages of winter wheat. The total irrigation depth in the five N treatments in the 2017-2018 and 2018-2019 winter wheat seasons was 204.9 mm and 296.2 mm, respectively; and the total irrigation depth in the CK in the two corresponding seasons was 191 mm and 372.3 mm, respectively.
4.3. Measurements and Methods
4.3.1. Soil Water Content and Nitrate-N Content
Soil samples were collected at 20-cm intervals in the 0-180 cm soil layer for soil water content and nitrate-N content measurements before sowing and at each growth stage. Three replicates were collected for analysis in each treatment. The soil water content was measured by the oven-drying method. For soil nitrate-N content measurement, the soil samples were first air-dried, then milled and screened through a 2-mm sieve. The sieved samples were mixed with 2 mol/L KCl solution (soil: solution: 1:5) and the mixture was shaken for 1 h on a rotary shaker (180 rev·min-1) and filtered. After adding 1 mL 1 mol/L HCl solution to the filtered extract, the mixed solution was directly analyzed to determine the concentration of nitrate-N by ultraviolet spectrophotometry (Shanghai Mapada Instruments Co. Ltd, Shanghai, China).
4.3.2. Wheat Growth Indexes
The wheat growth indexes measured in this study included crop height, plant density, leaf area index (LAI), and dry biomass of above-ground plant parts. Three 1-m rows of wheat in each treatment were selected and the number of wheat plants was counted. Then, the plant density was calculated from the mean number of wheat per 1-m row with row spacing of 0.2 m. In each treatment, three clusters of wheat with approximately 60 stems were cut at the base of the stem, then all green leaves were picked and the leaf area was measured using a leaf area instrument (model LI-3000C, LI-COR Inc., Lincoln, NE, USA). Then, the LAI was calculated from the mean leaf area per stem and plant density. The stems and all leaves collected in each treatment were dried at 105 °C for 30 min then at 70-80 °C for 24 hours to constant weight. Then, the mass of stems and leaves was measured using a 0.01-g resolution balance. These values were converted to per hectare values based on plant density. The wheat growth indexes were investigated approximately every 2 weeks. The plant height and density were not measured after heading because they did not change after this stage.
4.3.3. Grain Yield and Harvest Factors
At harvest, all wheat plants were harvested from ten 1 m × 1 m subplots in each treatment for analyses of yield- and harvest-related factors. For each sample, wheat grains were obtained by threshing and then the water content of the wheat grains was determined. The final grain yield of each treatment was obtained based on the standard water content of 12.5%. In each treatment, 20 wheat plants were selected to count the number of kernels per spike and the number of spikes. The 1000-grain weight was determined for 10 separate samples of the grains collected for yield measurement from each treatment.
4.3.4. Meteorological Indexes
Data for meteorological variables, including air temperature, air humidity, radiation, wind speed, soil profile temperature, soil surface heat flux, and rainfall were obtained from an automatic weather station deployed at the experimental station. All data were sampled at 10-s intervals and 30-min mean data were stored by a CR1000 data logger (Campbell Scientific, Inc., Logan, UT, USA). The water surface evaporation from the 20-cm pan (Model ADM7, Shonghuatianyi Co. Ltd., China) above the wheat canopy was measured daily at approximately 8:00 before sunrise.
4.4. Calculations
4.4.1. Crop Water Consumption
The soil water balance method was used to calculate crop evapotranspiration (ET
a) during the whole growth period of winter wheat. The formula is defined as follows:
where ETa is the actual crop water consumption during a period of time (mm), P0 is the effective rainfall (mm), I is the irrigation depth (mm), W is groundwater recharge (mm), R0 is the surface runoff (mm), D is the deep leakage (mm), and S is the variation in soil water storage (mm). In this study, the groundwater level was approximately 40 m lower than the ground surface, the field was flat, and irrigation water was well controlled. Therefore, the flux of W, Ro and D were taken as zero during the calculation of ETa using Eqn. (1).
4.4.2. Water- and N-Use Efficiencies
Water productivity, irrigation water productivity, and N productivity were calculated using Eqns. (2), (3) and (4), respectively, as follows:
where WP is water productivity (kg·m-3), IWP is irrigation water productivity (kg·m-3), ETa is the actual crop water consumption (mm), I is the effective irrigation amount (mm), Y is grain yield (kg ha-1), ANP is the applied N productivity, and N is the N application rate (kg ha-1).
4.4.3. Nitrogen Balance
Because the content of ammonia-N in local soil was low and the change was small [
59], it was ignored in these calculations. The following formula was used to calculate the soil N balance:
where N0 is the initial soil nitrate-N content (kg ha-1), Nfinal is the soil nitrate-N content at harvest (kg ha-1), Z is the soil depth (cm); ρ is soil bulk density (g cm-3), CNO3-N is the concentration of N03-N in soil (kg ha-1); Ncrop is the amount of N absorbed by aboveground crops (kg ha-1), Md is the dry aboveground biomass of crops (kg ha-1), Ccrop is the total N in the aboveground biomass at harvest (g kg-1); Nm is the amount of N mineralization in the CK (kg ha-1), Nir is the amount of N supplied by irrigation (kg ha-1); Nloss is the apparent N loss (kg ha-1), and Nfertilizer is the amount of N applied as fertilizer (kg ha-1).
4.5. Statistical Analyses
Microsoft Excel 2019 was used to calculate and process the data obtained in the field. Analysis of variance was performed using the original model procedure of Origin2021 (OriginLab Corporation, MA, USA) to test the effects of different N treatments on yield, and water and fertilizer-use efficiencies. Differences were determined using Duncan’s multiple range test at the 5% level of significance. Pearson’s correlation analysis was conducted to analyze the correlation between the N application rate and yield.
5. Conclusions
A field experiment was conducted over two wheat growing seasons to investigate the effect of N application on the growth and yield of winter wheat under optimized sprinkler irrigation scheduling. Using this system, the wheat grain yield was approximately 21.7% higher than that in the 1990s. The main conclusions drawn from our results are as follows:
- (1)
Both the soil water content and nitrate-N content varied greatly in the upper 100 cm soil layer but only slightly below 100 cm depth under optimized sprinkler irrigation scheduling, indicating less water seepage and nitrate-N loss. Application of N at rates lower than 150 kg ha-1 caused obvious deficits in the soil nitrate-N content, and at rates higher than 200 kg ha-1 resulted in accumulation of nitrate-N in the main root zone (0-100 cm soil layer).
- (2)
Generally, indexes of growth and yield increased as the N application rate increased, and reached maximum values at N application rates of 150-200 kg ha-1, but decreased with higher rates of N application. The application of N significantly (P < 0.05) increased the number of spikes per unit area, 1000-grain mass, and wheat yield. Because all crops were fully irrigated, the ET did not differ significantly (P > 0.05) among the treatments.
- (3)
Winter wheat yield has increased by 21.7% in the past 30 years, but the proposed optimized N application rate has remained similar during this long period of time (i.e., 220-300 kg ha-1 in the 1990s and 180-220 kg ha-1 in the 2010s), indicating that there has been a great improvement in N-use efficiency. Along with the cultivation of new varieties and improvements in pest and weed control, there have been improvements in the timely and uniform application of water and fertilizers using advanced fertigation systems such as the sprinkler fertigation system.
- (4)
Considering sustainable field development and higher N-use efficiency, an optimal N application rate of 200 kg ha-1 is recommended for high winter wheat production under sprinkler fertigation conditions in the NCP.
Author Contributions
Conception and design of experiments: H.L.; performance of experiments and analysis of data: Z.G. and K.W.; writing-review and editing: K.W. and H.L. All authors have read and agreed to the published version of the manuscript.
Funding
This work was supported by the National Nature Science Foundation of China (NO. 51939005) and the 111 Project (B18006).
Acknowledgments
We greatly appreciated the field help of Xiaopei Tang, Dongxue Feng and Wenjie Zhang.
References
- Li, H.; Wu, Q.; Zhao, Y.; Ye, Y.; Huang, Y. Effects of different formula fertilizers on population dynamics,stress resistance and grain yield of winter wheat. Soil and Fertilizer Sciences in China 2021, 300-307.
- Zou, Q.; Gu, X.; Li, Y.; Chen, P.; Cao, J. Effects of slow-release nitrogen fertilizer application ratio on yield and nitrogen fertilizer utilization efficiency of winter wheat. Journal of Water Resources and Water Engineering 2022, 33, 217-224.
- Jingjing, L. Effects of different nitrogen application rates on yield and nitrogen use efficiency of winter wheat. Agricultural engineering technology 2021, 41, 24-25. [CrossRef]
- Fuyu, W.; Guiju, C.; Leiming, S.; Ling, H.; Minmin, S.; Kao, Z.; Benzhou, Y.; Yudan, Z.; Lu, Y.; Lin, W. Effects of tillage method and nitrogen application on growth, yield and quality of wheat. Chinese Agricultural Science Bulletin 2022, 38, 20-26.
- Zhuangzhi, W.; Rui, Y.; Xiu, L.; Chengxiang, Z.; Xiaoyan, W. Effects of nitrogen application rate on wheat yield and nitrogen uptake and utilization in middle and low yield fields of Jianghan Plain. Journal of Nuclear Agricultural Sciences 2023, 37, 159-168.
- Department of Rural Economic and Social Survey, N.B.o.S. China Rural Statistical Yearbook. 2002.
- Department of Rural Economic and Social Survey, N.B.o.S. China Rural Statistical Yearbook. 2022.
- Aiquan, Z.; Fayu, S.; Rui, Z.; Baolin, Z.; Xueke, F. Study on yield and Water use efficiency of Jinmai-47 wheat under different fertilization levels. Shaanxi Journal of Agricultural Sciences 2021, 67, 1-4.
- Li, X.; Li, H.; Hao, W.; Zhang, W.; Wang, C. Impact of Drip Fertigation on Yields andWater Use Efficiency of Wheat-maize Rotation in North China. Journal of Irrigation and Drainage 2018, 37, 18-28.
- Zhang, J.; Liu, J.; Zhang, J.; Zhao, F.; Cheng, Y.; Wang, W. Effects of Nitrogen Application Rates on Translocation of Dry Matter and Utilization of Nitrogen in Rice and Wheat. Acta Agronomica Sinica 2010, 36, 1736-1742. [CrossRef]
- Qi, Z.; Lantao, L.; Lulu, Z.; Yuhong, M.; Yilun, W. Effects of nitrogen applications and seeding amount on yield, growth and ecological field characteristics of winter wheat. Acta Agronomica Sinica 2023, 49, 3100-3109.
- Huang, F.; Du, T.; Wang, S.; Mei, X.; Gong, D.; Chen, Y.; Kang, S. Current Situation and Future Security of Agricultural Water Resources in North China. Strategic Study of CAE 2019, 21, 28-37. [CrossRef]
- Feng, G.; Jin, W.; Ouyang, Y.; Huang, Y. The role of changing land use and irrigation scheduling in groundwater depletion mitigation in a humid region. Agricultural Water Management 2024, 291, 108606. [CrossRef]
- Jódar, J.; Urrutia, J.; Herrera, C.; Custodio, E.; Martos-Rosillo, S.; Lambán, L.J. The catastrophic effects of groundwater intensive exploitation and Megadrought on aquifers in Central Chile: Global change impact projections in water resources based on groundwater balance modeling. Science of The Total Environment 2024, 914, 169651. [CrossRef]
- Cai, D.; Zhou, L.; Gu, T.; Yan, H. Yield and Nitrogen Utilization of Winter Wheat under Different Nitrogen Application Frequencies with Sprinkler Irrigation System. Transactions of the Chinese Society for Agricultural Machinery 2018, 49, 278-286.
- Liu, H.; Huang, G.; Wang, M.; Yu, L.; Ye, D.; Kang, Y.; Liu, S.; Zhang, J. Sprinkler irrigation scheme of winter wheat based on water surface evaporation of a 20 cm standard pan. Transactions of the Chinese Society of Agricultural Engineering 2010, 26, 11-17.
- Xiying, Z. Crop Roots and Soil Water Use. 1999.
- Jing, B.; Shah, F.; Xiao, E.; Coulter, J.A.; Wu, W. Sprinkler irrigation increases grain yield of sunflower without enhancing the risk of root lodging in a dry semi-humid region. Agricultural Water Management 2020, 239, 106270. [CrossRef]
- Pinto, M.A.B.; Parfitt, J.M.B.; Timm, L.C.; Faria, L.C.; Concenço, G.; Stumpf, L.; Nörenberg, B.G. Sprinkler irrigation in lowland rice: Crop yield and its components as a function of water availability in different phenological phases. Field Crops Research 2020, 248, 107714. [CrossRef]
- Liu, H.; Li, Y.; Zhang, R.; Huang, G. Nitrate nitrogen distribution and movement in soil profile under intensive cropping system in Beijing. Journal of Beijing Normal University (Natural Science ) 2013, 49, 266-270.
- Li, Y.; Liu, H.; Huang, G.; Zhang, R.; Yang, H. Nitrate nitrogen accumulation and leaching pattern at a winter wheat: summer maize cropping field in the North China Plain. Environ Earth Sci 2016, 75, 1-12. [CrossRef]
- Zhao, M.; Zhou, J.; Yang, R.; Zheng, X.; Zhai, B.; Li, S. Characteristics of nitrogen accumulation, distribution and translocation in winter wheat on dryland. Plant nutrition and fertitizer science 2006, 12, 143-149.
- Kong, L.; Xie, Y.; Hu, L.; Feng, B.; Li, S. Remobilization of vegetative nitrogen to developing grain in wheat (Triticum aestivum L.). FIELD CROPS RESEARCH 2016, 196, 134-144. [CrossRef]
- Lu, D.; Lu, F.; Pan, J.; Cui, Z.; Zou, C.; Chen, X.; He, M.; Wang, Z. The effects of cultivar and nitrogen management on wheat yield and nitrogen use efficiency in the North China Plain. Field Crops Research 2015, 171, 157-164. [CrossRef]
- Lyu, B.; Fan, Z.; Chang, X.; Wang, D.; Tao, Z.; Yang, Y.; Zhang, B.; Zhao, G. Effects of Nitrogen Application Amount on Grain Yield and Processing Quality With Two Different Grain Colors in Wheat. Journal of Nuclear Agricultural Sciences 2017, 31, 1192-1199.
- Wang, L.; Wu, W.; Li, R.; Hu, J.; Yan, S.; Shao, Q.; Xu, F.; Zhang, C.; Zhou, Y.; Li, W. Effects of nitrogen rate on grain quality and nitrogen utilization of weak gluten wheat. Acta Agriculturae Zhejiangensis 2021, 33, 777-784.
- Department of Rural Economic and Social Survey, N.B.o.S. China Rural Statistical Yearbook. 2010.
- Shengwei, N.; Qiaoping, Z.; Yuting, Z.; Jidong, X.; Ning, H. Analysis on the Basis and Benchmark of Nitrogen Fertilizer Reduction during Wheat Growing Season in North China Plain. Journal of Shanxi Agricultural Sciences 2019, 47, 61-64.
- Liu, H.; Kang, Y.; Liu, S. Effects of sprinkler irrigation on the field microclimate. Chinese journal of eco-agriculture 2003, 11, 103-107.
- Zhang, Y.; Liu, Z.; Tian, S.; Bian, W.; Dong, L.; Li, R. Effects of spraying wood vinegar and organic water-soluble fertilizer on wheat resistance to dry hot wind. Soil and Fertilizer Sciences in China 2021, 234-240.
- Zeng Jianghai, W.Z., Hu Chunsheng. Integration of wheat maize double cropping system and technical system in high yield area of North China Plain. Resources Science 1998, 59-64.
- Zhikai, J.; Changjiang, K.; Lei, Z.; Yun, D. Study on the correlation between the quality of strong gluten wheat and nitrogen fertilizer application techniques. Journal of Henan Institute of Science and Technology(Natural Science Edition 2002, 20-22.
- Demotes-Mainard, S.; Jeuffroy, M.-H. Partitioning of dry matter and nitrogen to the spike throughout the spike growth period in wheat crops subjected to nitrogen deficiency. Field Crops Research 2001, 70, 153-165. [CrossRef]
- Pandey, R.K.; Maranville, J.W.; Admou, A. Tropical wheat response to irrigation and nitrogen in a Sahelian environment. I. Grain yield, yield components and water use efficiency. European Journal of Agronomy 2001, 15, 93-105. [CrossRef]
- Timsina, J.; Singh, U.; Badaruddin, M.; Meisner, C.; Amin, M.R. Cultivar, nitrogen, and water effects on productivity, and nitrogen-use efficiency and balance for rice–wheat sequences of Bangladesh. Field Crops Research 2001, 72, 143-161. [CrossRef]
- Zhenling, C. Optimization of nitrogen management in winter wheat summer maize rotation system in the North China Plain from field to regional scale. Doctor, 2005.
- Xin, L. Study on the fate of fertilizer nitrogen and nitrogen gaseous loss in winter wheat summer maize rotation system in the North China Plain. Master, 2007.
- Qian, Z.; Xiaotang, J.; Fusuo, Z. Analysis of nitrogen environmental tolerance of winter wheat/summer maize rotation system in the North China Plain. Journal of Plant Nutrition and Fertilizers 2006, 285-293.
- Ferrise, R.; Triossi, A.; Stratonovitch, P.; Bindi, M.; Martre, P. Sowing date and nitrogen fertilisation effects on dry matter and nitrogen dynamics for durum wheat: An experimental and simulation study. Field Crops Research 2010, 117, 245-257. [CrossRef]
- Karam, F.; Kabalan, R.; Breidi, J.; Rouphael, Y.; Oweis, T. Yield and water-production functions of two durum wheat cultivars grown under different irrigation and nitrogen regimes. Agricultural Water Management 2009, 96, 603-615. [CrossRef]
- Kindred, D.R.; Verhoeven, T.M.O.; Weightman, R.M.; Swanston, J.S.; Agu, R.C.; Brosnan, J.M.; Sylvester-Bradley, R. Effects of variety and fertiliser nitrogen on alcohol yield, grain yield, starch and protein content, and protein composition of winter wheat. Journal of Cereal Science 2008, 48, 46-57. [CrossRef]
- Salvagiotti, F.; Miralles, D.J. Radiation interception, biomass production and grain yield as affected by the interaction of nitrogen and sulfur fertilization in wheat. European Journal of Agronomy 2008, 28, 282-290. [CrossRef]
- Zhang, J.-H.; Liu, J.-L.; Zhang, J.-B.; Zhao, F.-T.; Cheng, Y.-N.; Wang, W.-P. Effects of Nitrogen Application Rates on Translocation of Dry Matter and Nitrogen Utilization in Rice and Wheat. Acta Agronomica Sinica 2010, 36, 1736-1742. [CrossRef]
- Zheng, B.S.; Le Gouis, J.; Daniel, D.; Brancourt-Hulmel, M. Optimal numbers of environments to assess slopes of joint regression for grain yield, grain protein yield and grain protein concentration under nitrogen constraint in winter wheat. Field Crops Research 2009, 113, 187-196. [CrossRef]
- Bai, S.; Kang, Y.; Wan, S. Drip fertigation regimes for winter wheat in the North China Plain. AGRICULTURAL WATER MANAGEMENT 2020, 228. [CrossRef]
- Si, Z.; Zain, M.; Mehmood, F.; Wang, G.; Gao, Y.; Duan, A. Effects of nitrogen application rate and irrigation regime on growth, yield, and water-nitrogen use efficiency of drip-irrigated winter wheat in the North China Plain. AGRICULTURAL WATER MANAGEMENT 2020, 231. [CrossRef]
- Castro, A.C.; Fleitas, M.C.; Schierenbeck, M.; Gerard, G.S.; Simón, M.R. Evaluation of different fungicides and nitrogen rates on grain yield and bread-making quality in wheat affected by Septoria tritici blotch and yellow spot. Journal of Cereal Science 2018, 83, 49-57. [CrossRef]
- Guo, Y.; Yin, W.; Hu, F.; Fan, Z.; Fan, H.; Zhao, C.; Yu, A.; Chai, Q.; Coulter, J.A. Reduced irrigation and nitrogen coupled with no-tillage and plastic mulching increase wheat yield in maize-wheat rotation in an arid region. Field Crops Research 2019, 243, 107615. [CrossRef]
- Rathore, V.S.; Nathawat, N.S.; Bhardwaj, S.; Sasidharan, R.P.; Yadav, B.M.; Kumar, M.; Santra, P.; Yadava, N.D.; Yadav, O.P. Yield, water and nitrogen use efficiencies of sprinkler irrigated wheat grown under different irrigation and nitrogen levels in an arid region. Agricultural Water Management 2017, 187, 232-245. [CrossRef]
- Sandhu, O.S.; Gupta, R.K.; Thind, H.S.; Jat, M.L.; Sidhu, H.S.; Yadvinder, S. Drip irrigation and nitrogen management for improving crop yields, nitrogen use efficiency and water productivity of maize-wheat system on permanent beds in north-west India. Agricultural Water Management 2019, 219, 19-26. [CrossRef]
- Wang, H.; Zhang, Y.; Chen, A.; Liu, H.; Zhai, L.; Lei, B.; Ren, T. An optimal regional nitrogen application threshold for wheat in the North China Plain considering yield and environmental effects. Field Crops Research 2017, 207, 52-61. [CrossRef]
- Zhang, M.-m.; Dong, B.-d.; Qiao, Y.-z.; Shi, C.-h.; Yang, H.; Wang, Y.-k.; Liu, M.-y. Yield and water use responses of winter wheat to irrigation and nitrogen application in the North China Plain. Journal of Integrative Agriculture 2018, 17, 1194-1206. [CrossRef]
- Guo, Z.H.; Liu, P.Z.; Luo, W.H.; Wang, R.; Li, J. Effects of water limiting and nitrogen reduction on nitrogen use and apparent balance of winter wheat in the Guanzhong Plain, Northwest China]. Ying yong sheng tai xue bao = The journal of applied ecology 2021, 32, 4359-4369. [CrossRef]
- Hongling, Q.; Zhang, Z.; Lu, J.; Zhu, Y.; Webster, R.; Liu, X.; Yuan, H.; Hou, H.; Chen, C.; Wei, W. Change from paddy rice to vegetable growing changes nitrogen-cycling microbial communities and their variation with depth in the soil: Microbial communities' response to change of land use. European Journal of Soil Science 2016, 67. [CrossRef]
- Severini, E.; Magri, M.; Soana, E.; Bartoli, M.; Faggioli, M.; Celico, F. Irrigation practices affect relationship between reduced nitrogen fertilizer use and improvement of river and groundwater chemistry. Agricultural Water Management 2023, 289, 108564. [CrossRef]
- Rodrigues, G.C.; Paredes, P.; Gonçalves, J.M.; Alves, I.; Pereira, L.S. Comparing sprinkler and drip irrigation systems for full and deficit irrigated maize using multicriteria analysis and simulation modelling: Ranking for water saving vs. farm economic returns. Agricultural Water Management 2013, 126, 85-96. [CrossRef]
- Zaccaria, D.; Oueslati, I.; Neale, C.M.U.; Lamaddalena, N.; Vurro, M.; Pereira, L.S. Flexible delivery schedules to improve farm irrigation and reduce pressure on groundwater: a case study in southern Italy. Irrigation Science 2010, 28, 257-270. [CrossRef]
- Lv, G.; Kang, Y.; Tai, Y.; Liu, B. Effect of Irrigation Methods on Soil Temperature Distribution in Winter Wheat Field. Journal of Irrigation and Drainage 2012, 31, 48-50,65.
- Liang, Z.; Li, J.; Cao, X.; Tang, Y.; Mo, F.; Nangia, V.; Liu, Y. Responses of wheat nitrogen uptake and utilization, rhizosphere bacterial composition and nitrogen-cycling functional genes to nitrogen application rate, planting density and their interactions. Applied Soil Ecology 2024, 193, 105143. [CrossRef]
Figure 1.
Climatic conditions from October 2017 to October 2019 at the field study site.
Figure 1.
Climatic conditions from October 2017 to October 2019 at the field study site.
Figure 2.
Changes of soil profile temperature from December 2017 to September 2019.
Figure 2.
Changes of soil profile temperature from December 2017 to September 2019.
Figure 3.
Spatial and temporal distribution of soil water content in the 0-180 cm soil layer in the 2017-2018 winter wheat growing season.
Figure 3.
Spatial and temporal distribution of soil water content in the 0-180 cm soil layer in the 2017-2018 winter wheat growing season.
Figure 4.
Spatial and temporal distribution in soil water content in the 0-180 cm soil layer in the 2018-2019 winter wheat growing season.
Figure 4.
Spatial and temporal distribution in soil water content in the 0-180 cm soil layer in the 2018-2019 winter wheat growing season.
Figure 5.
Distribution of nitrate-N content in the 0-180 cm soil layer in the 2017-2018 season.
Figure 5.
Distribution of nitrate-N content in the 0-180 cm soil layer in the 2017-2018 season.
Figure 6.
Distribution of nitrate-N content in the 0-180 cm soil layer in the 2018-2019 season.
Figure 6.
Distribution of nitrate-N content in the 0-180 cm soil layer in the 2018-2019 season.
Figure 7.
Seasonal patterns of growth indexes (leaf area index (LAI), dry biomass of above-ground plant parts, plant height, plant density) of winter wheat under five N application treatments and the CK in the two experimental seasons. Figures (a), (c), (e), and (g) show LAI, biomass, plant height, and plant density, respectively, in the 2017-2018 wheat season; and (b), (d), (f), and (h) show LAI, biomass, plant height, and plant density, respectively, in the 2018-2019 wheat season.
Figure 8.
Grain yield of winter wheat under different N application treatments in 2017-2018 and 2018-2019 seasons. Different letters above blue bars indicate significant differences among treatments at 0.05 level (Duncan’s multiple range test).
Figure 8.
Grain yield of winter wheat under different N application treatments in 2017-2018 and 2018-2019 seasons. Different letters above blue bars indicate significant differences among treatments at 0.05 level (Duncan’s multiple range test).
Figure 9.
Three harvest-related factors of winter wheat yield (number of spikes per unit area, 1000-grain weight, grain number per spike) under different N application treatments in the two seasons. Figures. (a), (c) and (e) show data from 2017-2018 season, and (b), (d) and (f) show data from 2018-2019 season.
Figure 10.
Correlation coefficients between N application rate, winter wheat yield, and the three harvest-related factors in the two growing seasons.
Figure 10.
Correlation coefficients between N application rate, winter wheat yield, and the three harvest-related factors in the two growing seasons.
Figure 11.
Water consumption of winter wheat plants during the growing period under different N application treatments.
Figure 11.
Water consumption of winter wheat plants during the growing period under different N application treatments.
Figure 12.
Nitrogen accumulation process in aboveground biomass after wheat regreening in the 2017-2018 (a) and 2018-2019 seasons.
Figure 12.
Nitrogen accumulation process in aboveground biomass after wheat regreening in the 2017-2018 (a) and 2018-2019 seasons.
Table 1.
Effects of different N application rates on water productivity (WP), irrigation water productivity (IWP), and applied N productivity (ANP) of winter wheat crops.
Table 1.
Effects of different N application rates on water productivity (WP), irrigation water productivity (IWP), and applied N productivity (ANP) of winter wheat crops.
| Treatment |
2017-2018 |
2018-2019 |
| WP (kg·m-3) |
IWP
(kg·m-3) |
ANP (kg·kg-1) |
WP (kg·m-3) |
IWP
(kg·m-3) |
ANP (kg·kg-1) |
| N250 |
1.41bc |
3.35c |
29.05e |
1.86a |
2.89a |
34.27e |
| N200 |
1.48ab |
3.42b |
37.03d |
1.88a |
2.93a |
43.41d |
| N150 |
1.55a |
3.57a |
51.62c |
1.80b |
2.88a |
56.78c |
| N100 |
1.39c |
3.27d |
70.94b |
1.74c |
2.87a |
85.11b |
| N40 |
1.34c |
3.2e |
178.22a |
1.72c |
2.69a |
199.37a |
| CK |
1.63a |
3.79a |
25.76e |
1.28d |
1.83b |
26.39f |
| Average |
1.41 |
3.36 |
47.20 |
1.86 |
2.85 |
54.89 |
Table 2.
Nitrogen balance during the 2017-2018 and 2018-2019 growing seasons of winter wheat.
Table 2.
Nitrogen balance during the 2017-2018 and 2018-2019 growing seasons of winter wheat.
| Seasons |
|
N balance |
N250 |
N200 |
N150 |
N100 |
N40 |
| 2017-2018 |
N input |
Initial nitrogen content |
641 |
520 |
619 |
564 |
485 |
| Nitrogen fertilizer amount |
238 |
191 |
144 |
97 |
40 |
| Irrigation water nitrogen |
14 |
14 |
14 |
14 |
14 |
| Mineralized nitrogen |
0 |
0 |
0 |
0 |
0 |
| N output |
Nitrogen absorption |
209 |
221 |
222 |
209 |
192 |
| Residual nitrogen amount |
397 |
390 |
389 |
337 |
276 |
| Apparent nitrogen loss |
286 |
113 |
166 |
129 |
72 |
| 2018-2019 |
N input |
Initial nitrogen content |
414 |
425 |
428 |
404 |
346 |
| Nitrogen fertilizer amount |
250 |
200 |
150 |
100 |
40 |
| Irrigation water nitrogen |
18 |
18 |
18 |
18 |
18 |
| Mineralized nitrogen |
45 |
45 |
45 |
45 |
45 |
| N output |
Nitrogen absorption |
350 |
324 |
297 |
263 |
261 |
| Residual nitrogen amount |
484 |
371 |
348 |
237 |
187 |
| Apparent nitrogen loss |
0 |
0 |
0 |
66 |
0 |
Table 4.
Soil particle distribution, soil texture, and bulk density in the 0-200 cm soil layer.
Table 4.
Soil particle distribution, soil texture, and bulk density in the 0-200 cm soil layer.
| Depth (cm) |
Soil particle distribution (%) |
Soil texture* |
Bulk density |
| Clay |
Silt |
Sand |
g·cm-3
|
| 0-20 |
9.7 |
61.2 |
29.1 |
Silty loam |
1.35 |
| 20-40 |
9.8 |
61.8 |
28.4 |
Silty loam |
1.39 |
| 40-60 |
13.9 |
67.0 |
19.2 |
Silty loam |
1.44 |
| 60-80 |
16.9 |
54.7 |
28.5 |
Silty loam |
1.47 |
| 80-100 |
14.5 |
51.0 |
34.6 |
Silty loam |
1.58 |
| 100-120 |
13.3 |
67.6 |
19.1 |
Silty loam |
1.77 |
| 120-140 |
12.4 |
61.1 |
26.5 |
Silty loam |
1.75 |
| 140-160 |
10.7 |
56.0 |
33.3 |
Silty loam |
1.70 |
| 160-180 |
11.1 |
57.7 |
31.2 |
Silty loam |
1.68 |
| 180-200 |
11.8 |
61.9 |
26.3 |
Silty loam |
1.69 |
Table 5.
Planned N application rates at different growth stages in each area (kg ha-1).
Table 5.
Planned N application rates at different growth stages in each area (kg ha-1).
| Treatments |
N fertilizer amount |
Base fertilizer |
Regreening stage |
Jointing stage |
Grouting stage |
| N250 |
250 |
40 |
70 |
70 |
70 |
| N200 |
200 |
40 |
53 |
53 |
53 |
| N150 |
150 |
40 |
37 |
37 |
37 |
| N100 |
100 |
40 |
20 |
20 |
20 |
| N40 |
40 |
40 |
0 |
0 |
0 |
| CK |
250 |
110 |
70 |
70 |
0 |
|
Disclaimer/Publisher’s Note: The statements, opinions and data contained in all publications are solely those of the individual author(s) and contributor(s) and not of MDPI and/or the editor(s). MDPI and/or the editor(s) disclaim responsibility for any injury to people or property resulting from any ideas, methods, instructions or products referred to in the content. |
© 2024 by the authors. Licensee MDPI, Basel, Switzerland. This article is an open access article distributed under the terms and conditions of the Creative Commons Attribution (CC BY) license (http://creativecommons.org/licenses/by/4.0/).
