1. Introduction
With the concept of clean production and sustainable development deepening in various industries. The geotechnical engineering industry is also seeking a low-carbon, environmentally friendly and sustainable development path. As China's infrastructure construction continues to develop in cold regions with extreme weather and harsh conditions[
1,
2,
3,
4]. Geotechnical engineering in high-altitude and cold regions is met with major obstacles due to the specific conditions of low temperature, low pressure, F-T cycle, and fragile ecology[
5,
6,
7,
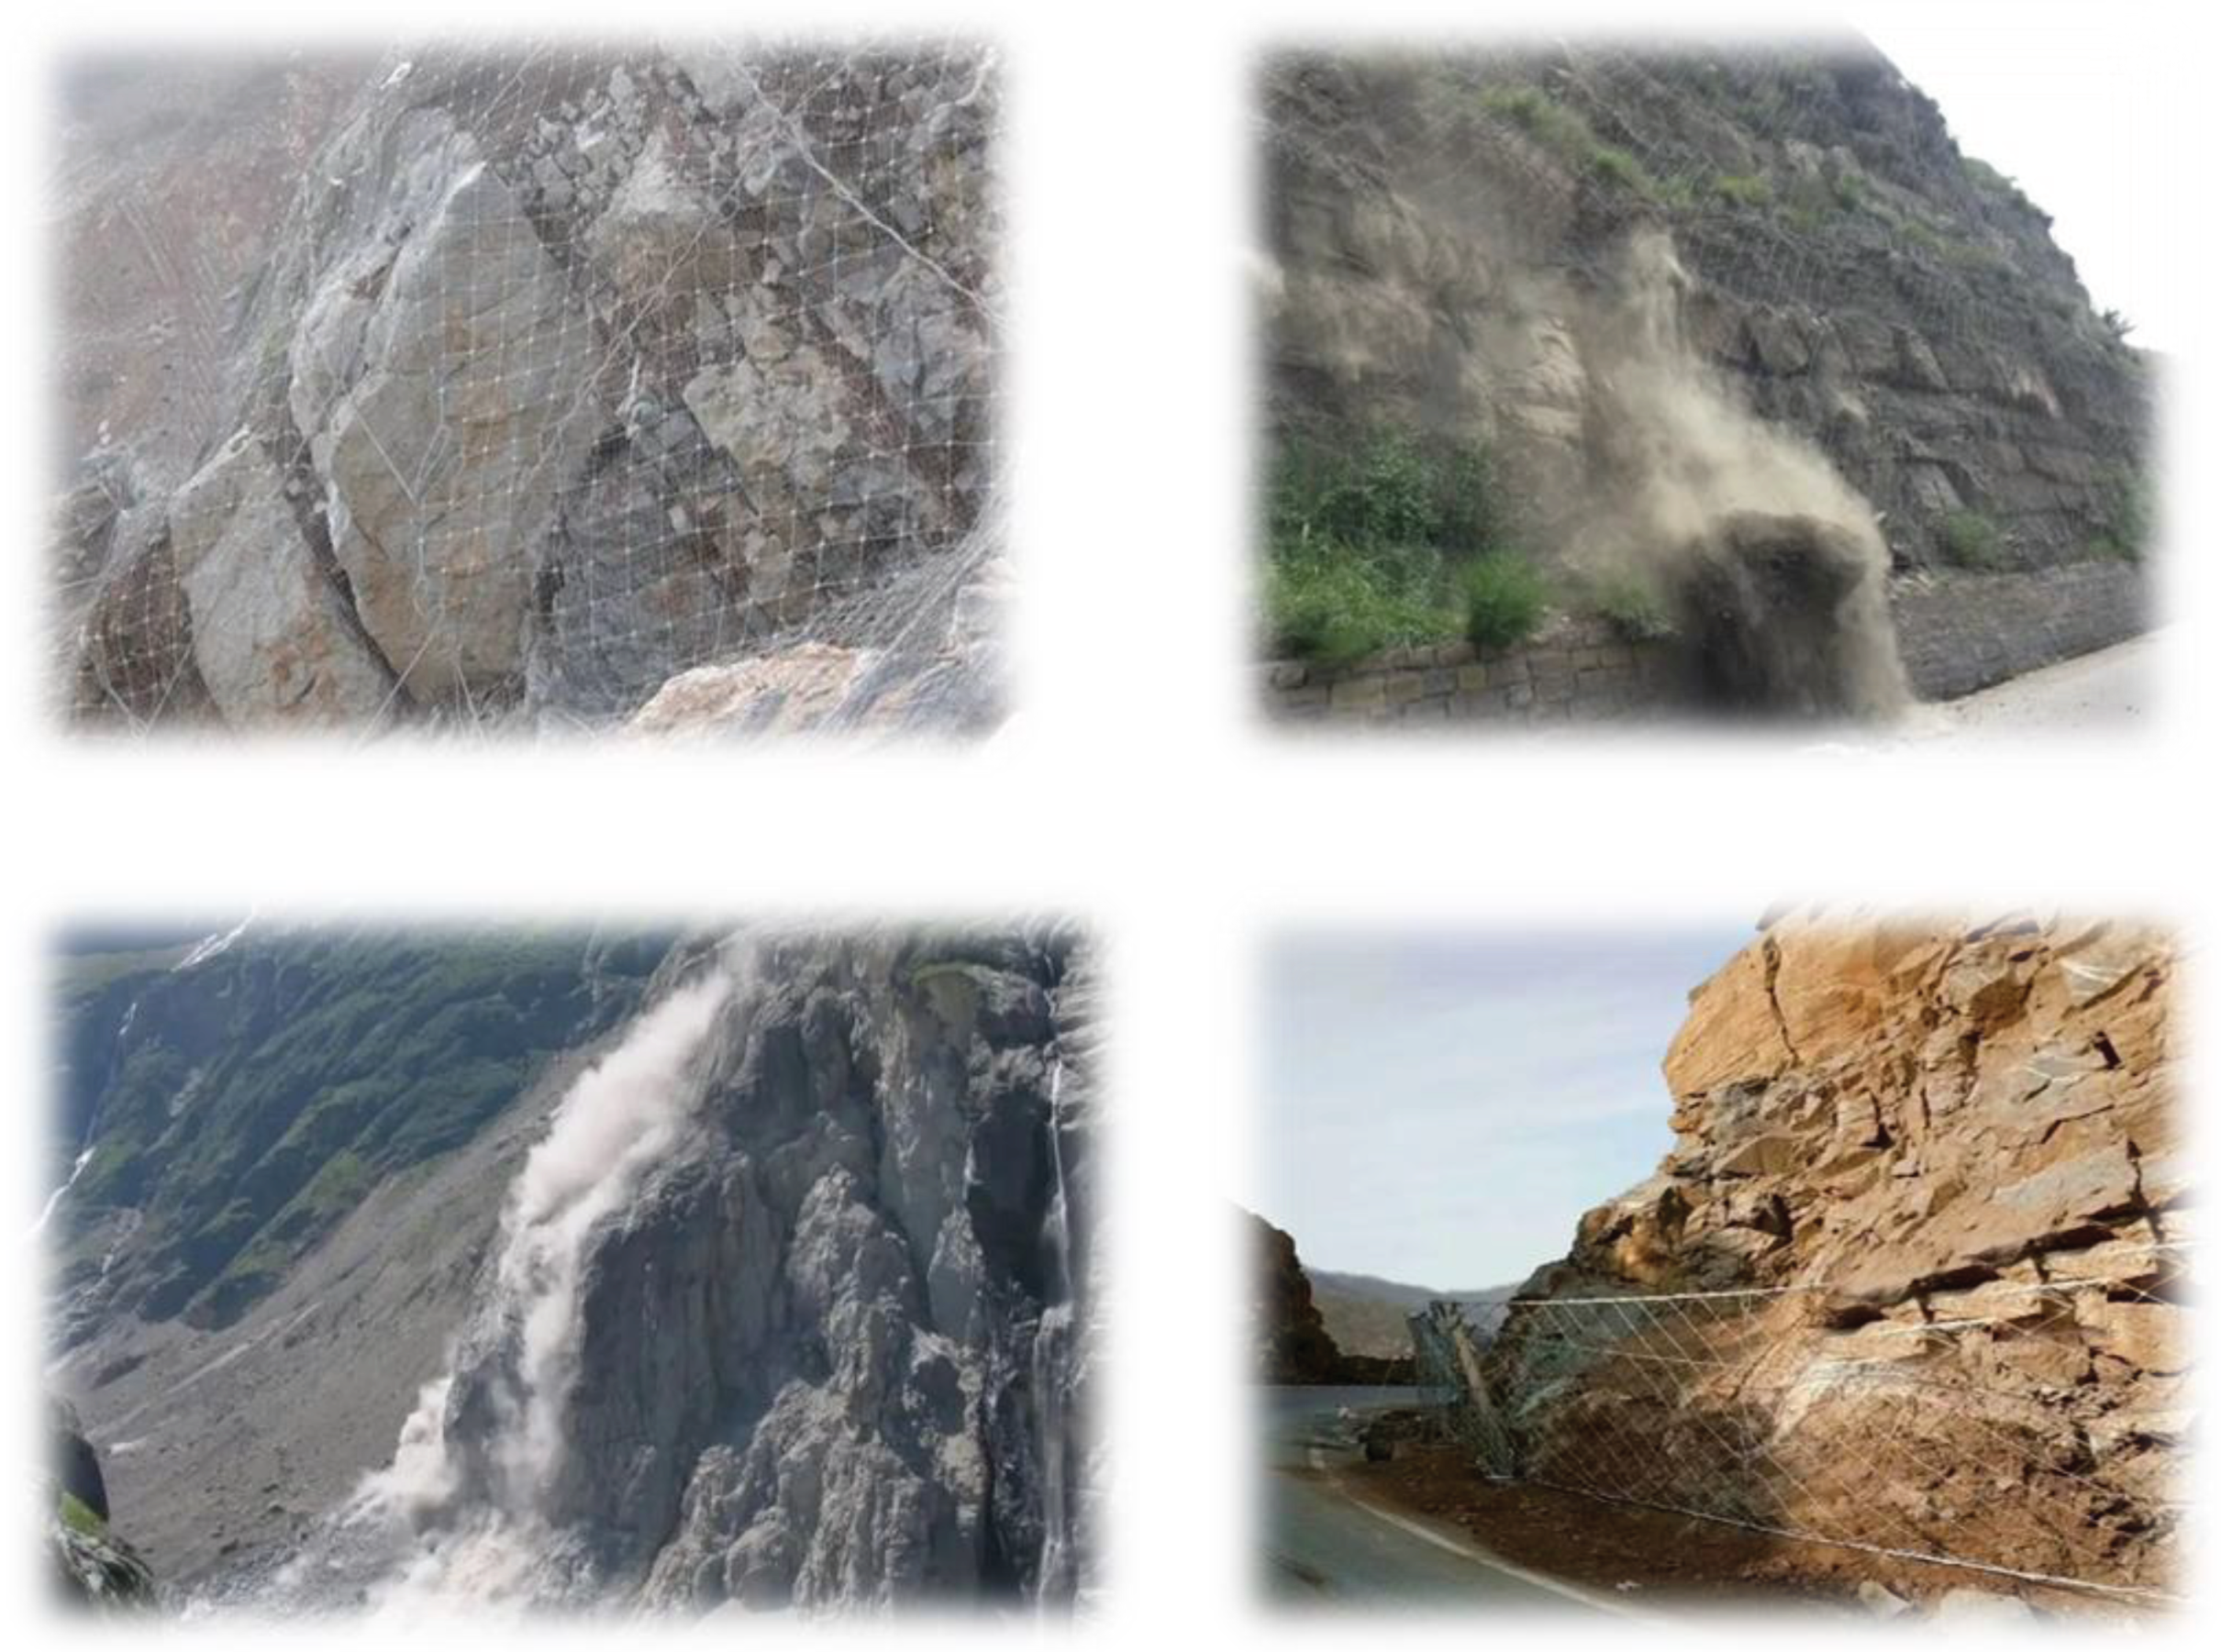
8]. This is especially evident in the susceptibility of rock slopes to damage. Under the erosion of F-T cycles, the water-ice phase transition of rock slopes in cold areas causes the cracks to gradually expand until they finally coalesce, resulting in the instability and collapse of rock slopes, as shown in
Figure 1. Therefore, it is particularly important to effectively reduce meltwater and rainfall into the cracks and joints of rock slopes and to enhance the stability and F-T resistance of the slope[
9,
10,
11].
At present, the most commonly used reinforcement methods for rock slope failure are hanging nets, anchors, shotcrete, etc. as shown in
Figure 2. However, these methods are aimed at reinforcing the slope under a normal temperature environment, and the reinforcing effect of rock slope under F-T environment is limited. It is a good choice to fill the cracks and joints of rock slopes with mortar [
12]. This method can prevent melt water from flowing into the cracks between rock masses, thereby improving the integrity, strength, stiffness and F-T resistance of rock and soil[
13,
14].
However, one of the main problems of the filling method is to use a large amount of cement and sand, but the current unsustainable exploitation and non-renewable natural sand have led to less time for sand[
15,
16]. Excessive exploitation of river sand has led to riverbed deterioration, water level decline, and riverbed erosion, which have contributed to the country's unsustainable development[
17]. To keep up with the pace of sustainable development goals, stabilize the supply of sand and gravel market, and promote the healthy and orderly development of the industry. As a mitigation strategy, actively promoting the alternative use of sand sources has attracted a lot of attention, and numerous studies had conducted the alternative utilization of different sand sources and achieved fruitful results to determine its feasibility in different situations[
18,
19,
20,
21,
22]. Furthermore, the continuing expansion of decertified is a key source of a variety of environmental issues, China is one of the countries with the largest desert coverage. The expansion of desertification in China, caused by human activities, is rapidly growing. The issue is particularly severe in Northwest China and is hindering sustainable development[
23]. Aeolian sand (AS) is a hazard and a resource, which has the advantages of large reserves and low prices [
24]. In today's advocacy of local conditions, and local materials, if we can apply AS to project projects, it will not only inhibit desertification and reduce the losses caused by desertification but also promote the alternative use of sand sources, which is conducive to protecting the environment [
25,
26].
Significant findings have been made regarding the use of AS as a partial substitute for river sand. Based on its physical and chemical composition, Padmakumaret et al.[
27], Seif[
28], and Zhang et al.[
29] believed that AS will be the fine aggregate in concrete and other mortar materials. According to research conducted by Al-Harthy et al.[
30] and Li et al.[
31], incorporating a suitable amount of AS can enhance the mechanical property of concrete. The compressive strength of concrete initially rises and then declines as the AS content increases. However, the research conducted by Luo et al.[
32] and Seif[
28] demonstrated that AS has a negative impact on the mechanical properties of concrete, causing a decrease in strength as the AS content rises. The varying impact of laws can be attributed to the differences in the source, composition, and properties of AS. The research by Dong et al.[
33] demonstrated that the inclusion of AS in concrete causes changes in the arrangement of hydration product particles, resulting in a dual effect on the frost resistance of concrete. The F-T damage mechanism has been studied by Li[
34] and Bai et al.[
35] using SEM, and their results indicate that increasing the AS proportion in concrete can enhance its frost resistance.
Through the use of nuclear magnetic resonance (NMR), Zou et al.[
36] investigated the development of F-T pores in AS concrete. Their results indicated that AS has the potential to alter the pore arrangement of concrete, leading to variations in its strength and resistance to frost. Through a multi-scale investigation, Bai et al.[
37] and Li et al.[
38,
39] examined the mechanical properties of AS concrete under F-T and analyzed how AS affects concrete's frost resistance at the microscopic level. Existing studies have revealed that the improved frost resistance of concrete with AS can be attributed to its unique physical and chemical properties, such as its small particle size and high-water absorption rate. These characteristics alter the porosity and pore structure of the concrete, ultimately affecting moisture transmission and saturation levels. Therefore, using AS as a cement mortar admixture has potential advantages in technology, economy, and ecology.
In this paper, the influence of replacing river sand with AS as a filler mortar aggregate on the microstructure and shear properties of the mortar-rock interface were investigated under F-T cycles. Therefore, F-T cycle, NMR and shear tests were carried out on grouts with different proportion of AS. Finally, for the grout-rock interface, the F-T damage mechanism and the shear failure mechanism were revealed.
2. Materials and Methods
2.1. Materials and Characterization
The main components used to fill the body in this experiment are cement, river sand, AS, and mixing water. Cement selection Ji-Dong PO42.5 ordinary Portland cement, volume stability qualified.
Table 1 and
Table 2 display the primary physical-mechanical property and chemical makeup of cement. River sand from Xi'an sand factory in Shaanxi Province procurement. AS is gathered from the Maowusu Desert in Yulin in Shaanxi Province.
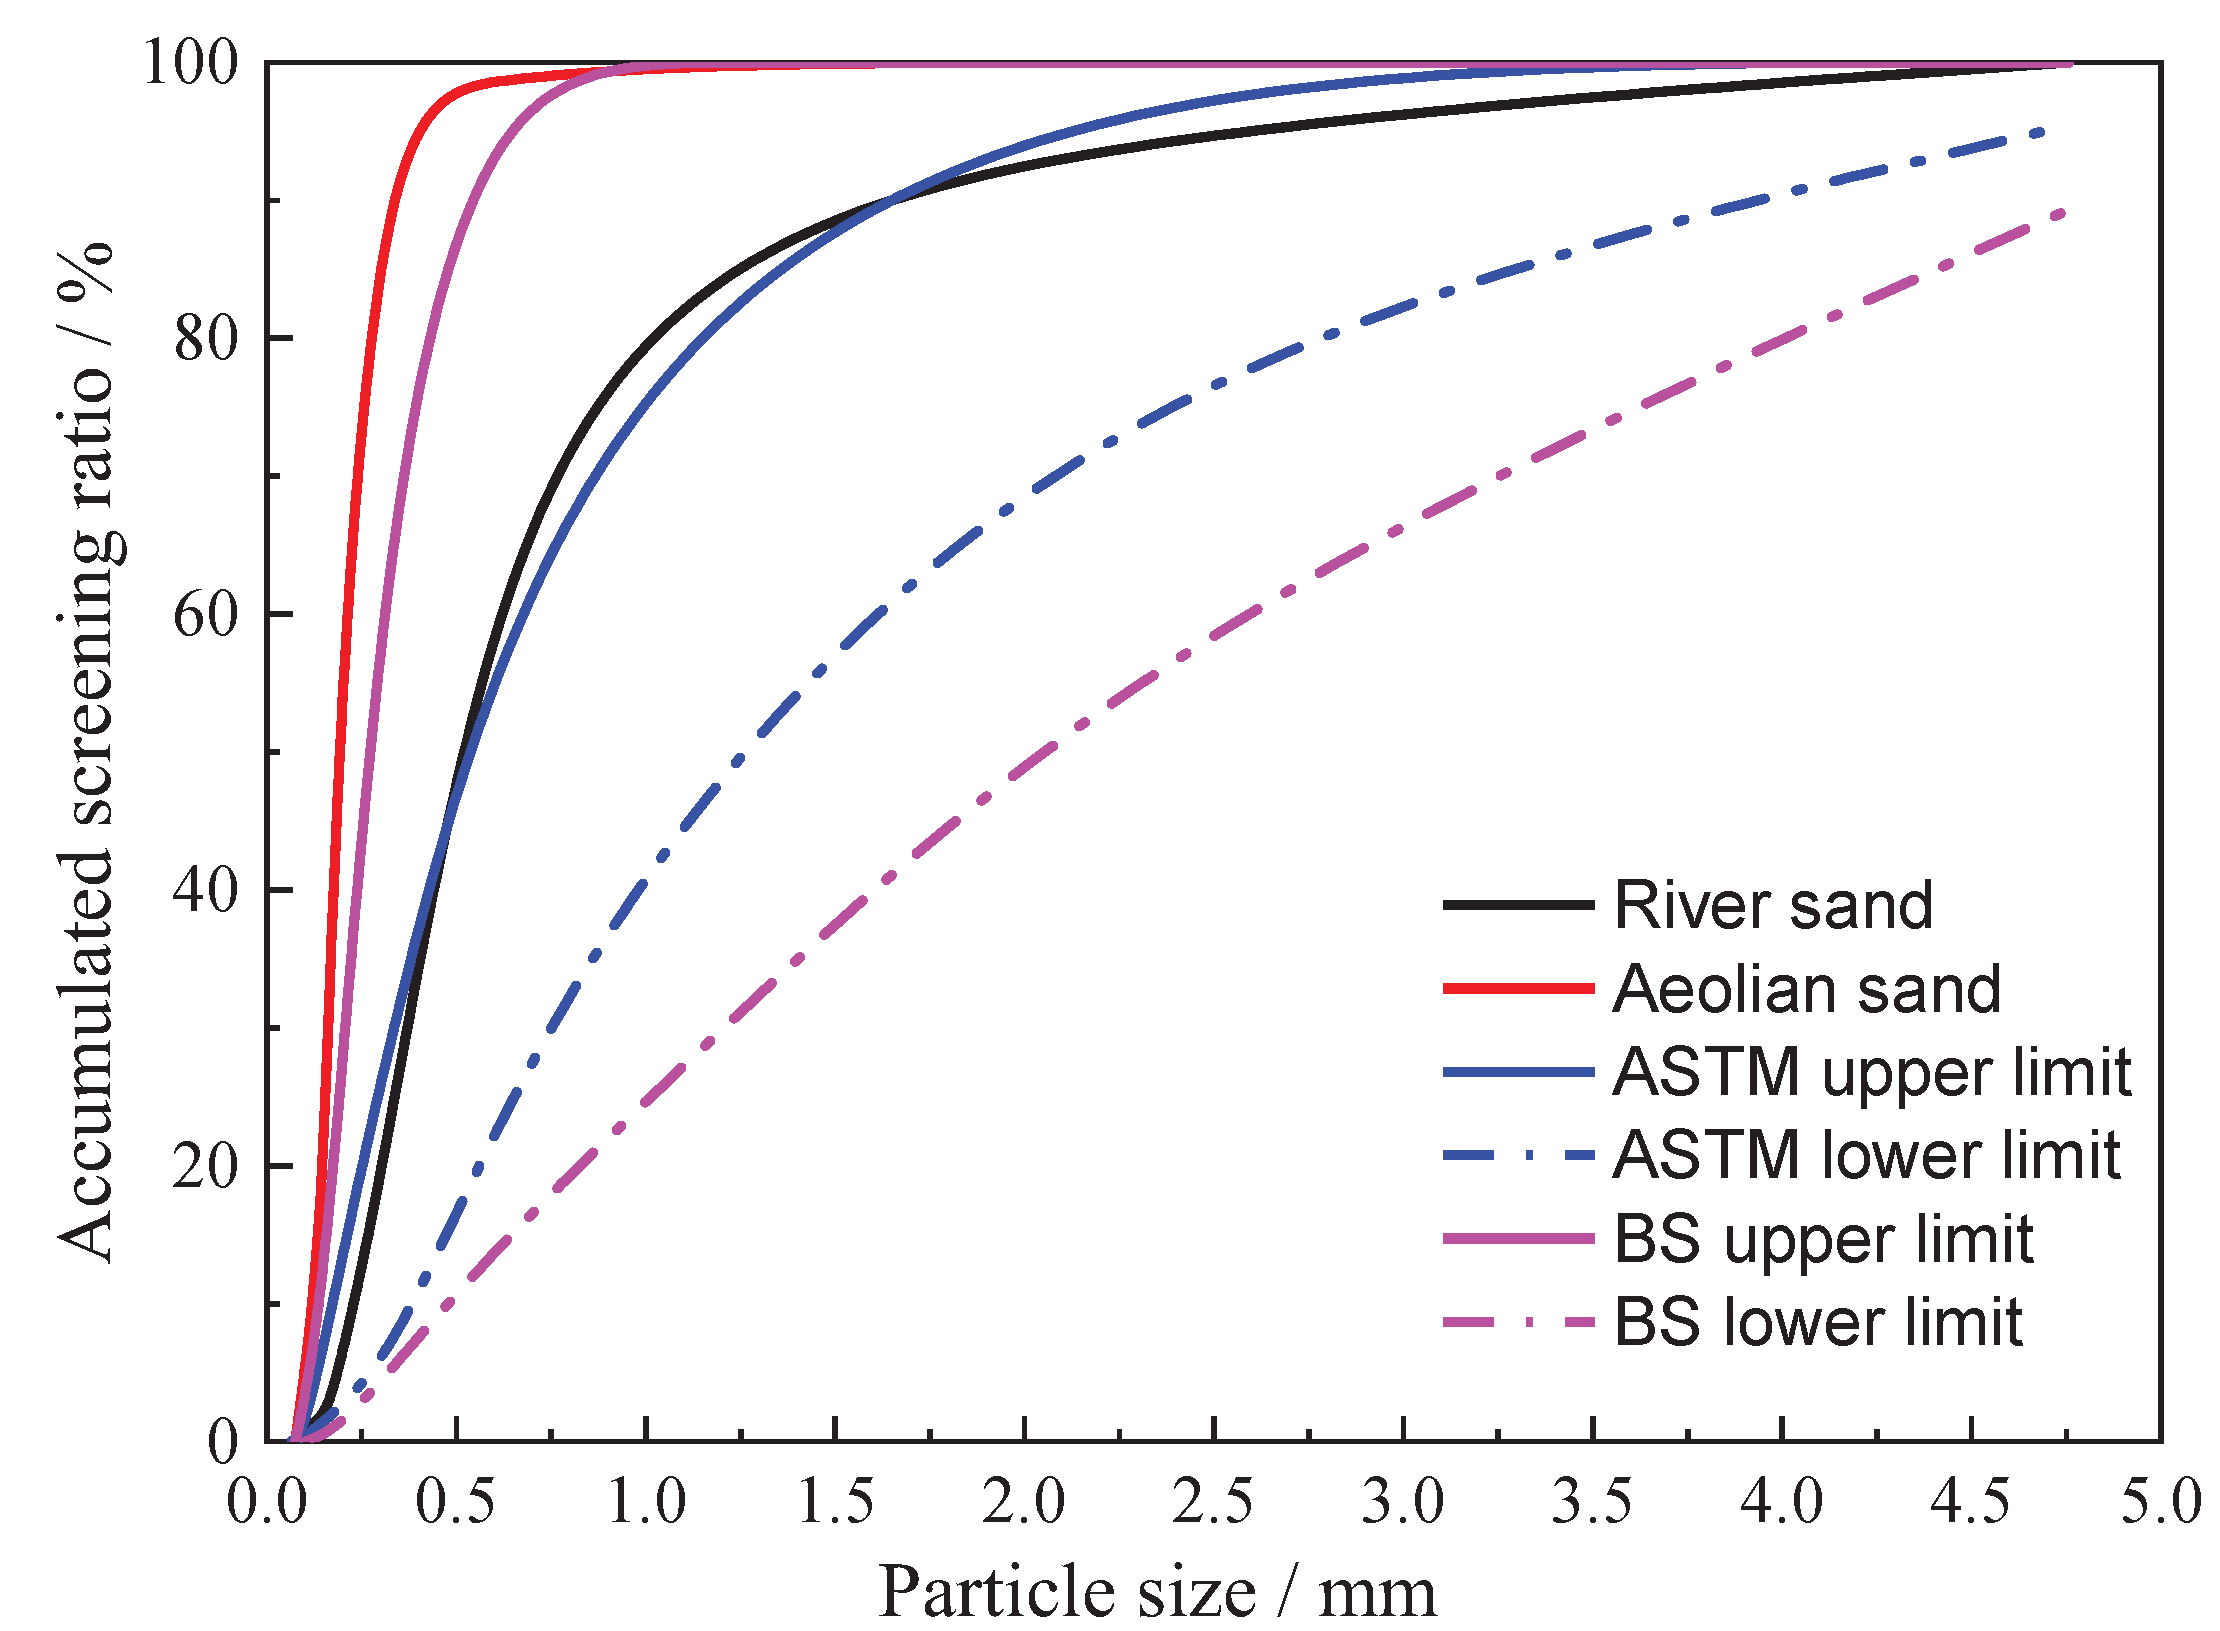
Figure 3 displays the gradation curves for both river sand and AS. The main physical indexes and chemical components are shown in
Table 3 and
Table 4. Compared with the gradation range recommended by national standard JGJ52-2011 [
40], American standard ASTM C33/C33M-13 [
41] and European standard BS 886 [
42], the river sand's gradation is acceptable. AS grain diameter concentrated in the 0.1-0.6mm, belongs to the fine sand range, making the two standards not met.
2.2. Specimen Preparation
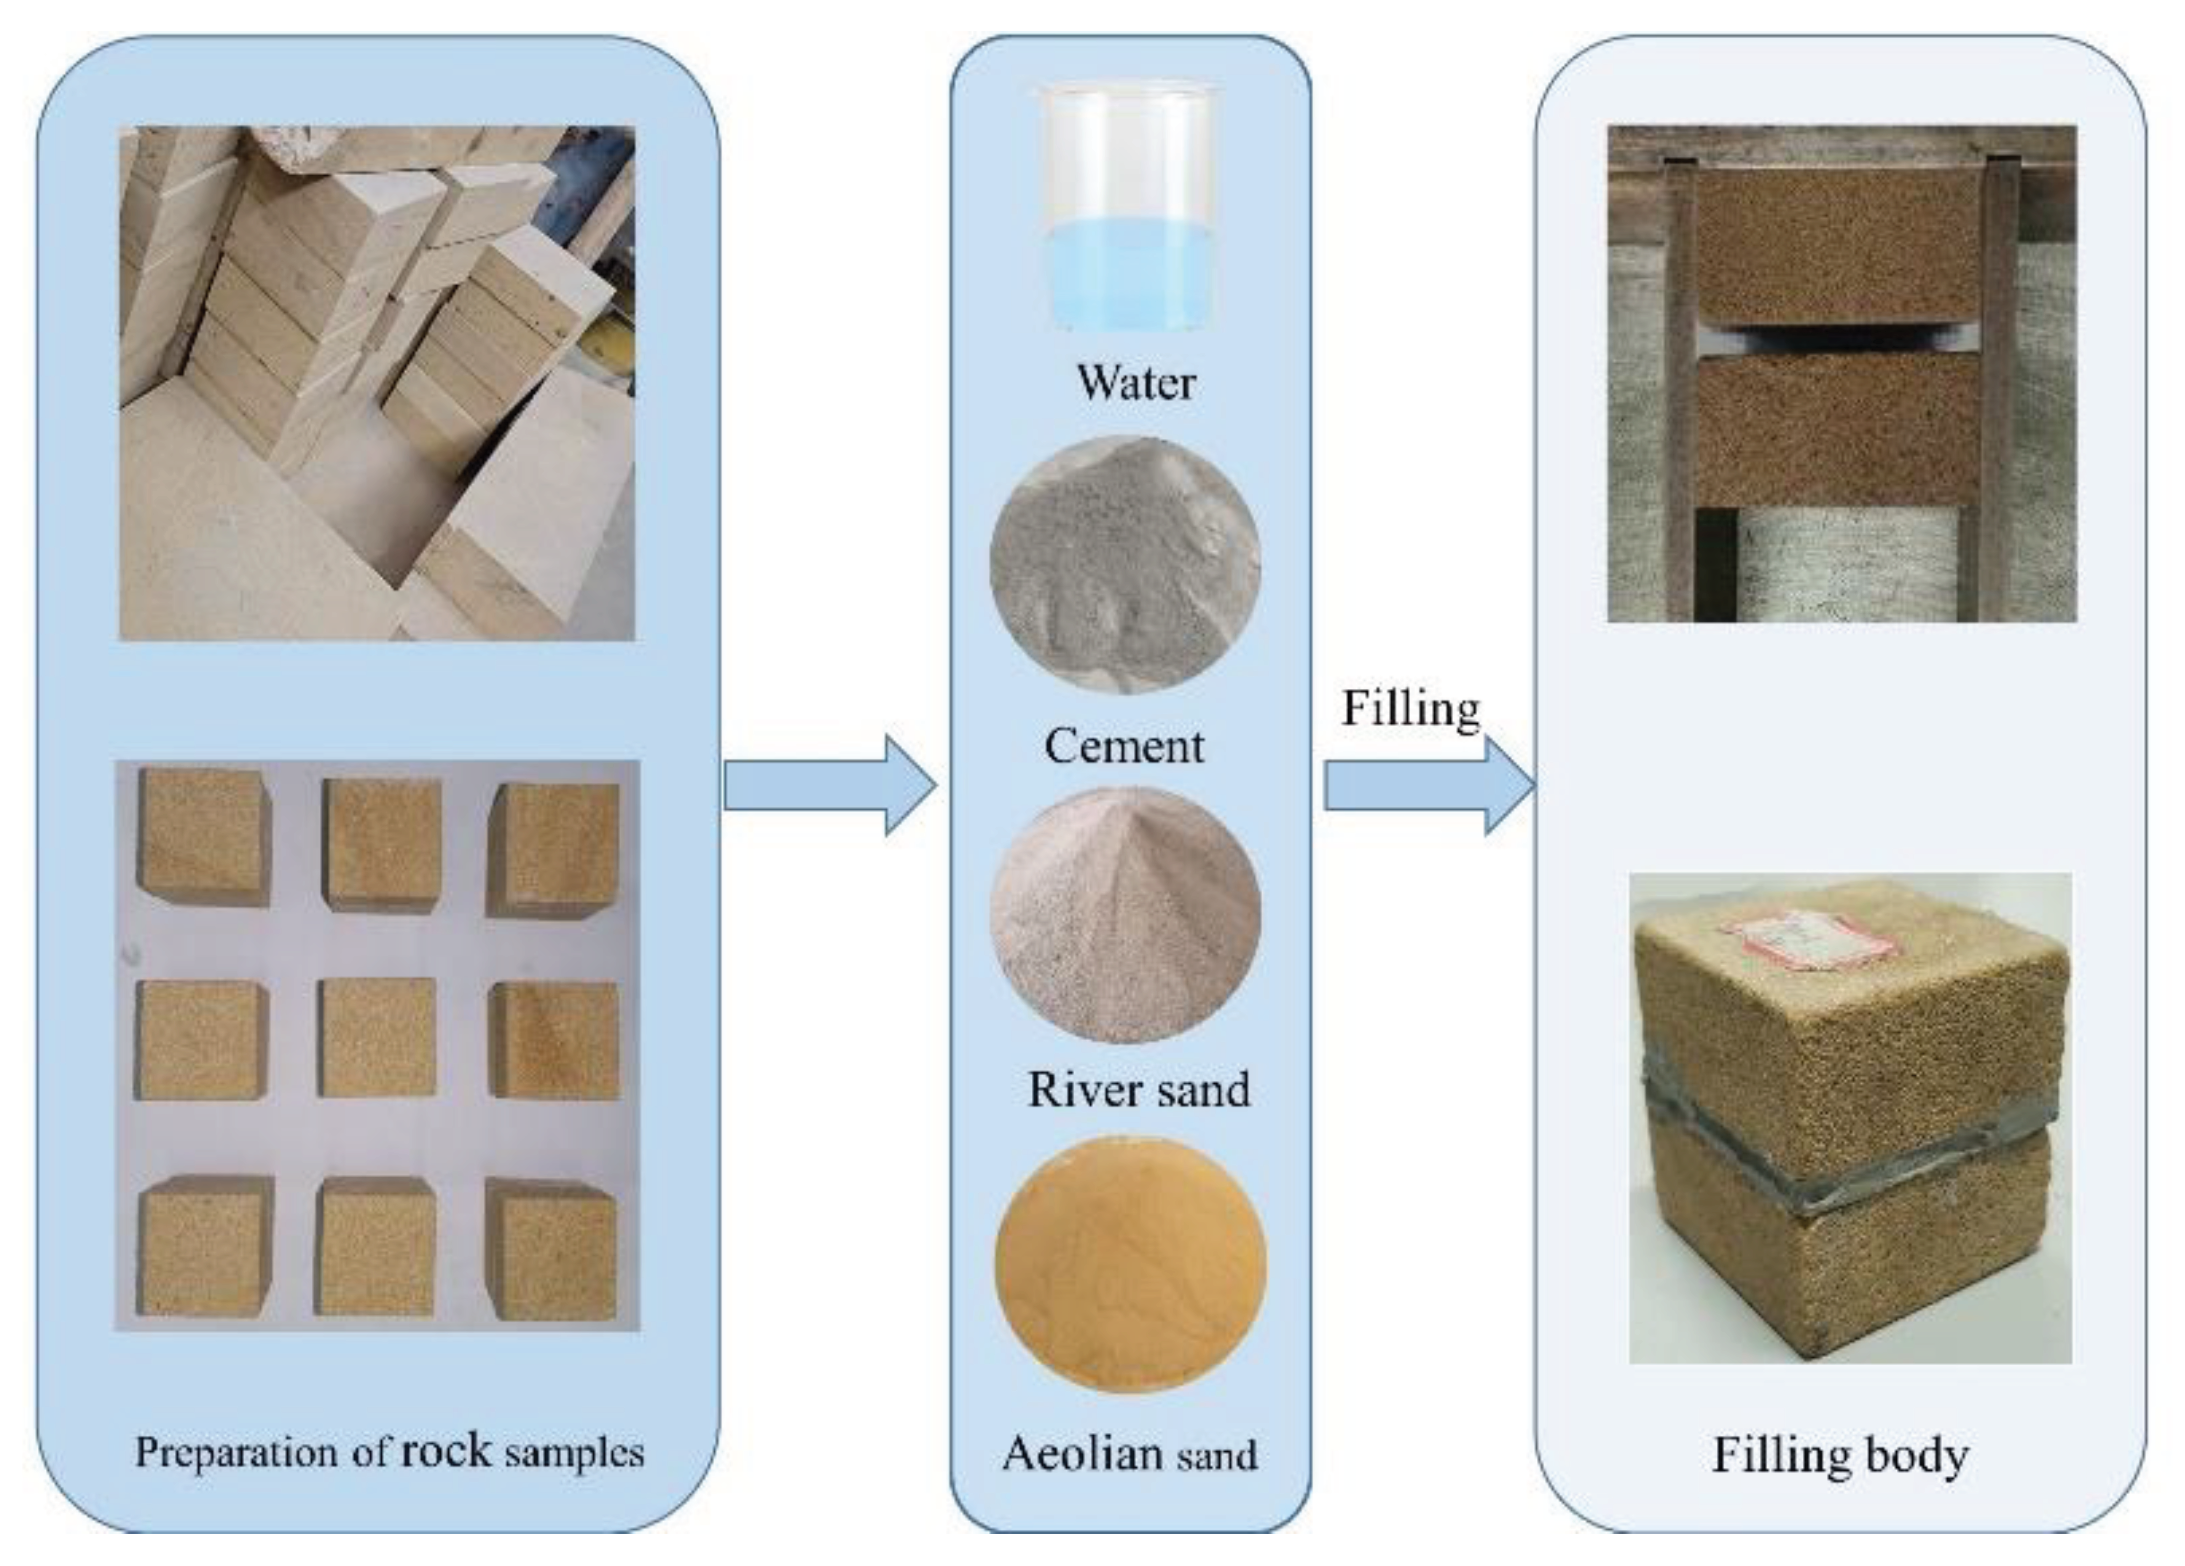
Due to the complexity of identifying the joint structure of rock specimens taken from the site, it is difficult to carry out a single-factor comparative analysis. Investigating the evolution of micro-pore structure and shear characteristics of AS mortar-filled jointed rock under F-T conditions. In this test, artificial filling joint specimens with similar properties to real joint rock were simulated by similar materials. The yellow sandstone material with good texture from the same producing area was selected and processed into a cuboid specimen (50×50× 25 mm). A regular grinding groove is performed on one end of the rock to make the surface roughness the same. The grooved ends of every two rock blocks shall be spliced in opposite directions, and the middle shall be filled with ordinary cement mortar, 15% AS replacement mortar, and 30% AS replacement mortar with a filling thickness of 5 mm. After curing for 24 hours under 20 ± 2 ℃ (temperature) and 95 ± 2% (relative humidity), remove the formwork, and cure for 7 days under the same conditions to obtain joint-filled rock specimens, as shown in
Figure 4.
The existing research suggests that an increase in AS content, within the range of 10% to 30%, leads to a higher compressive strength in mortar[
31]. Subsequent to this, relevant experiments have demonstrated a significant improvement in F-T resistance of cement mortar when AS content is at 15%. Therefore, 0 %, 15 %, and 30 % of AS proportion mortar are selected as the research object of this paper. The mortar mix ratio and material dosage are shown in
Table 5.
2.3. Test Methods
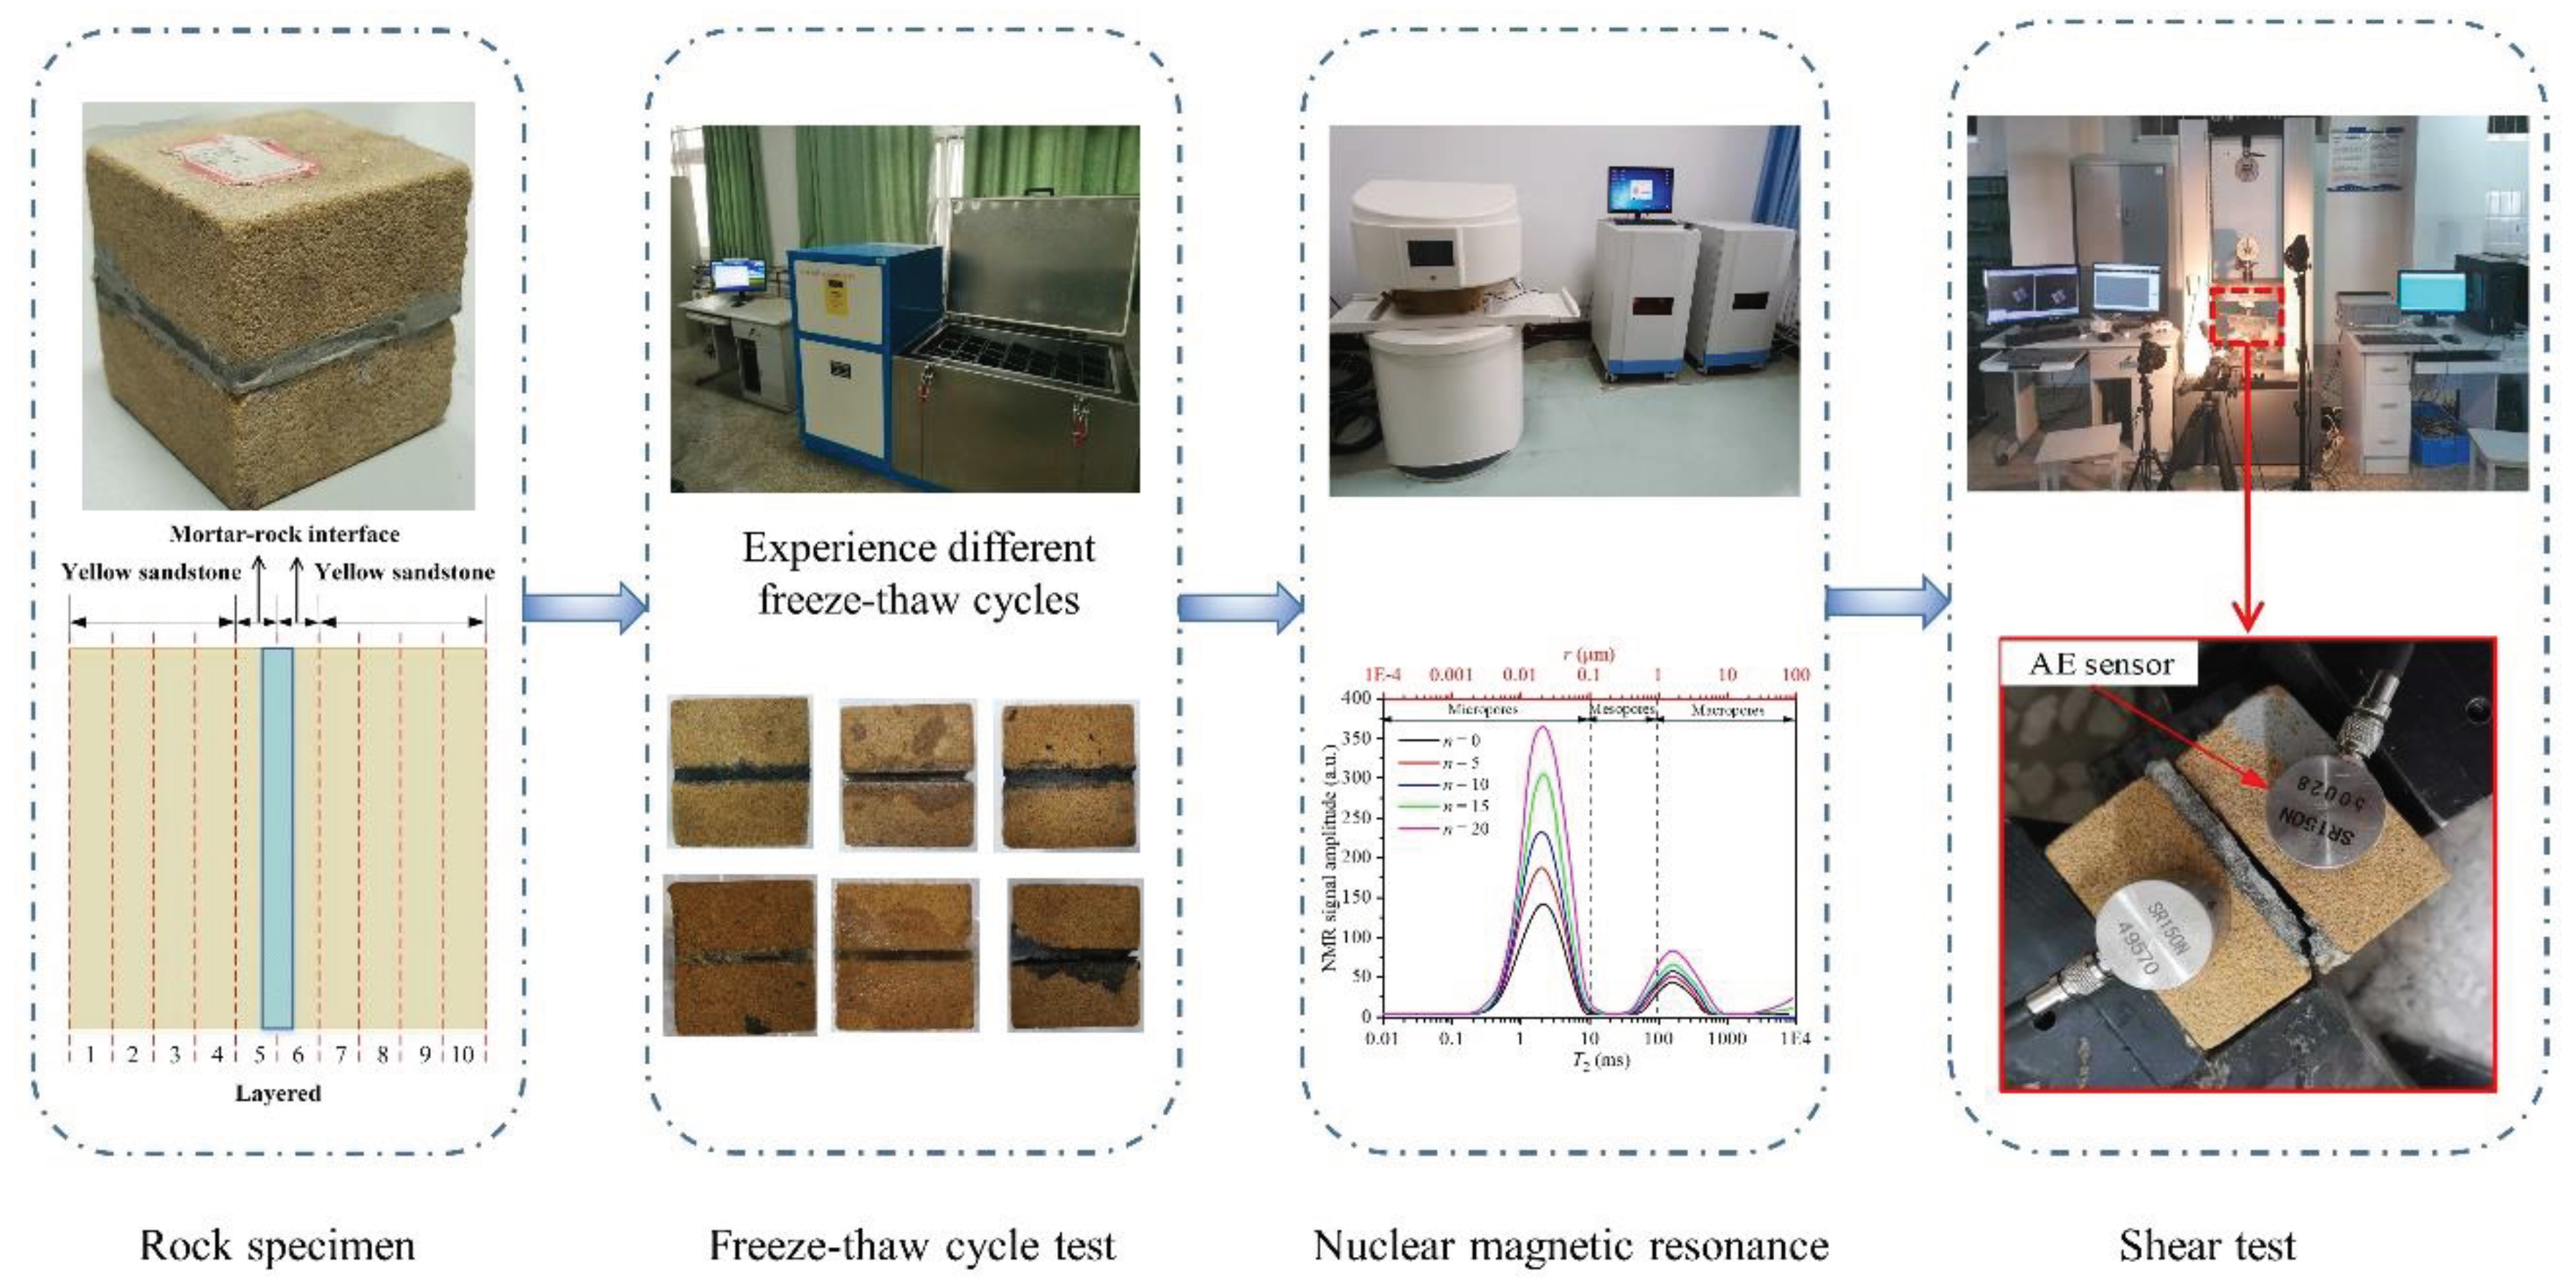
The microscopic pore structure evolution and shear properties of jointed rock filled with AS mortar under different proportions were verified through a series of laboratory tests. The detailed test process can be seen in
Figure 5.
TRD-28 testing machine is used to conducted the F-T cycle test, which can simulate the ambient temperature between 25°C to-25°C, as shown in
Figure 5. The F-T test scheme uses the core temperature of the filling consolidation body (20°C→-20°C→20°C) as a F-T cycle. The time of F-T cycle is 3.5 h, and the maximum number of F-T cycles is 20 times. The specific operation is as follows:
(1) After vacuum saturation, the grouting consolidation specimen was wrapped in a fresh-keeping film and then placed in the F-T box, as per the specified number.
(2) Altering the control parameters of the F-T machine to match the F-T cycle experiment scheme, suspending the test at 0, 5, 10, 15, and 20 intervals.
(3) Taking out the specimen, erasing the surface moisture, and recording the specimen quality and apparent F-T damage after the NMR test and shear test.
After the specific F-T cycle, the NMR scanning was performed on the filling consolidation body. The filling consolidation body divided into 10 layers was tested by an NMR scanning. As shown in
Figure 5, the 1st-4th and 7th-10th layers of the filled concretion are yellow sandstone, and the 5th and 6th layers are two mortar-rock interface layers. The fifth layer of nuclear magnetic data is selected to describe the T
2 map and pore characteristics of the specimen.
The pore structure of rock material includes pore diameter and pore distribution. The pore size plays a crucial role in the F-T damage of rock specimens. It is generally divided into micropores, mesopores and macropores, but there is no uniform division standard. The following division method is proposed to identify the pore size, that is, when the size of micropores r < 0.1 μm, corresponding to T
2 < 10 ms; the size of micropores 0.1 μm < r < 1 μm, corresponding to a T
2 value between 10 ms and 100 ms. Macropores have a radius larger than 1 μm, with a T
2 value exceeding 100 ms[
39]. Therefore, this paper divides the pore size according to the suggested method. To conduct the NMR scanning, the following process is used:
(1) The grouting consolidation specimen after vacuum forced saturation is wrapped with a preservative film to reduce the water loss of the specimen.
(2) Put the wrapped specimen into the system test bench, and adjust the position of the specimen in the test bench to ensure that the fracture surface is in the same layer.
(3) Open the NMR system, conduct overall and stratified tests on the filled consolidated specimens, and find the center frequency through the FID (Free Induction Decay) sequence to determine the SE-SPI stratification sequence parameters.
(4) After the NMR test, take out the specimen, output the overall and layered test results, and shut down the system.
After the F-T cycle and the NMR test, the shear mechanical properties of the grouting consolidation body were measured, the shear failure process was recorded, and the acoustic emission information of the failure process was collected, as shown in
Figure 5. The shear mechanical properties of mortar-rock interface with different AS proportion after F-T cycles were studied. The main test equipment is the WDW-100 testing machine, HYZ-BJ variable angle shear fixture, and high-speed image acquisition system. During the test, the shear angle is set to 45°, the loading method is managed by displacement, and the longitudinal loading rate is 0.5 mm/min. In addition, the AE information of the shear failure process of the specimen is collected, processed, and output, and the fracture evolution process of internal particles and cracks when the joint surface is filled with different AS proportions is further studied.
3. Results
3.1. Characteristics of F-T Deterioration of the Mortar-Rock Interface
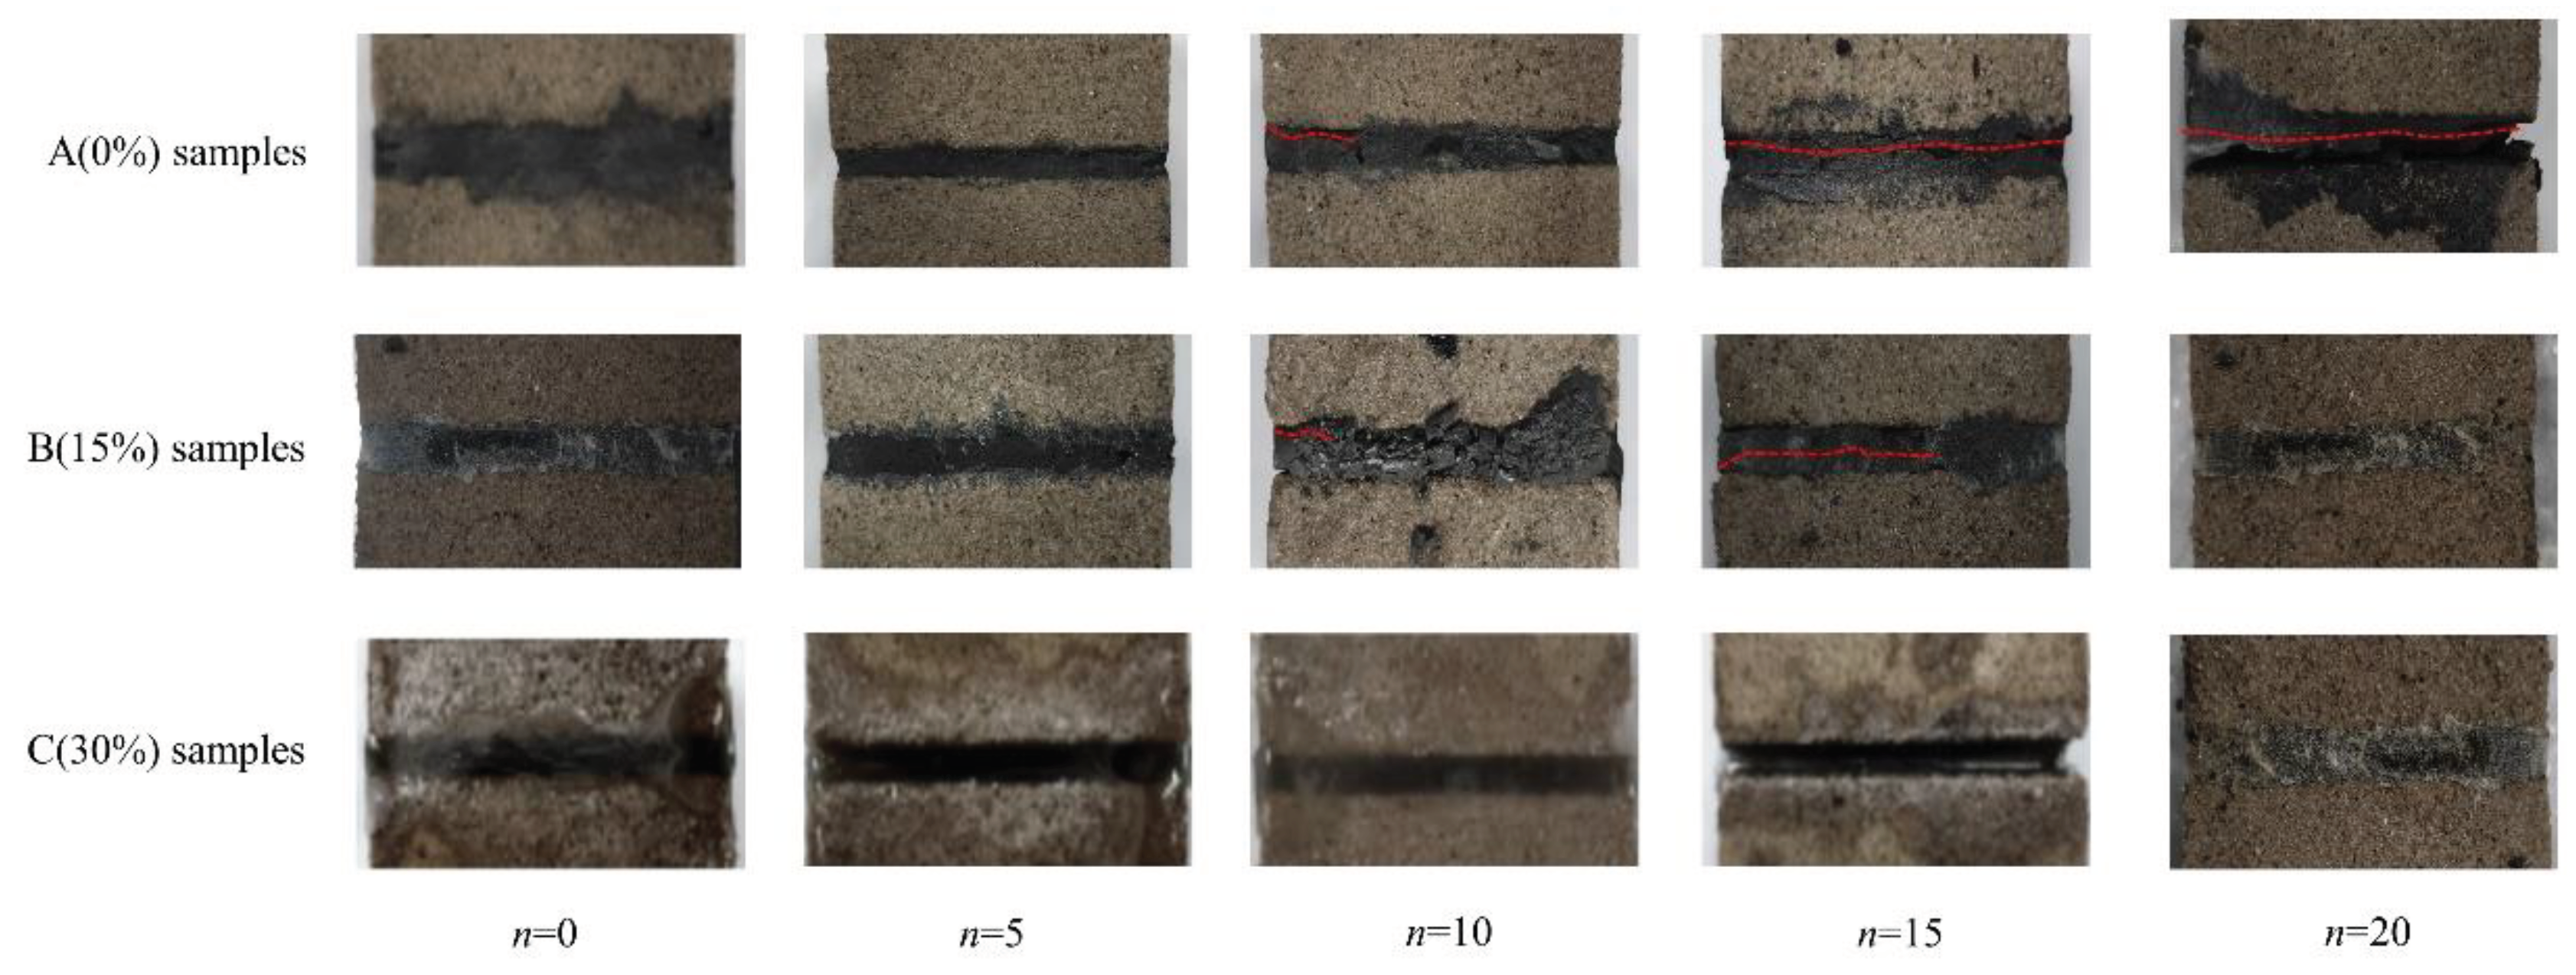
The interface deterioration morphology of the filling consolidation body under F-T cycles is depicted in
Figure 6, with varying AS proportions. With increasing F-T cycles, the interface deterioration forms of backfill with different AS proportion show different crack initiation times and extension forms. The interface of the filling body of specimen A (AS proportion of 0 %) began to crack macroscopically when the F-T was 10 times. When the F-T was 15 times, the slurry-rock interface layer appeared visible through cracks, and the crack length was about 54 mm. When freezing and thawing 20 times, the cracks in the slurry-rock interface layer are visible and the opening degree increases. In group B (AS proportion of 15 %), the interface of the filling body began to appear slight crack phenomenon after 15 times of F-T cycles. After 20 times of F-T cycles, the mortar-rock interface layer appeared to clear non-interpenetrated cracks, and the crack length was about 28 mm. Group C specimens (AS proportion of 30 %) filling body interface, the number of F-T cycles in the 0-20 times, the mortar-rock interface layer did not appear any cracks, particle spalling phenomenon. The group C specimen (AS proportion is 30 %) has the best bonding effect with yellow sandstone, and the mortar-rock interface layer has the strongest F-T resistance, followed by group B (AS proportion is 15 %), and the worst is group A (AS proportion is 0 %).
3.2. NMR Results of Mortar-Rock Interface
3.2.1. Analysis of T2 Spectrum Curve of Mortar-Rock Interface
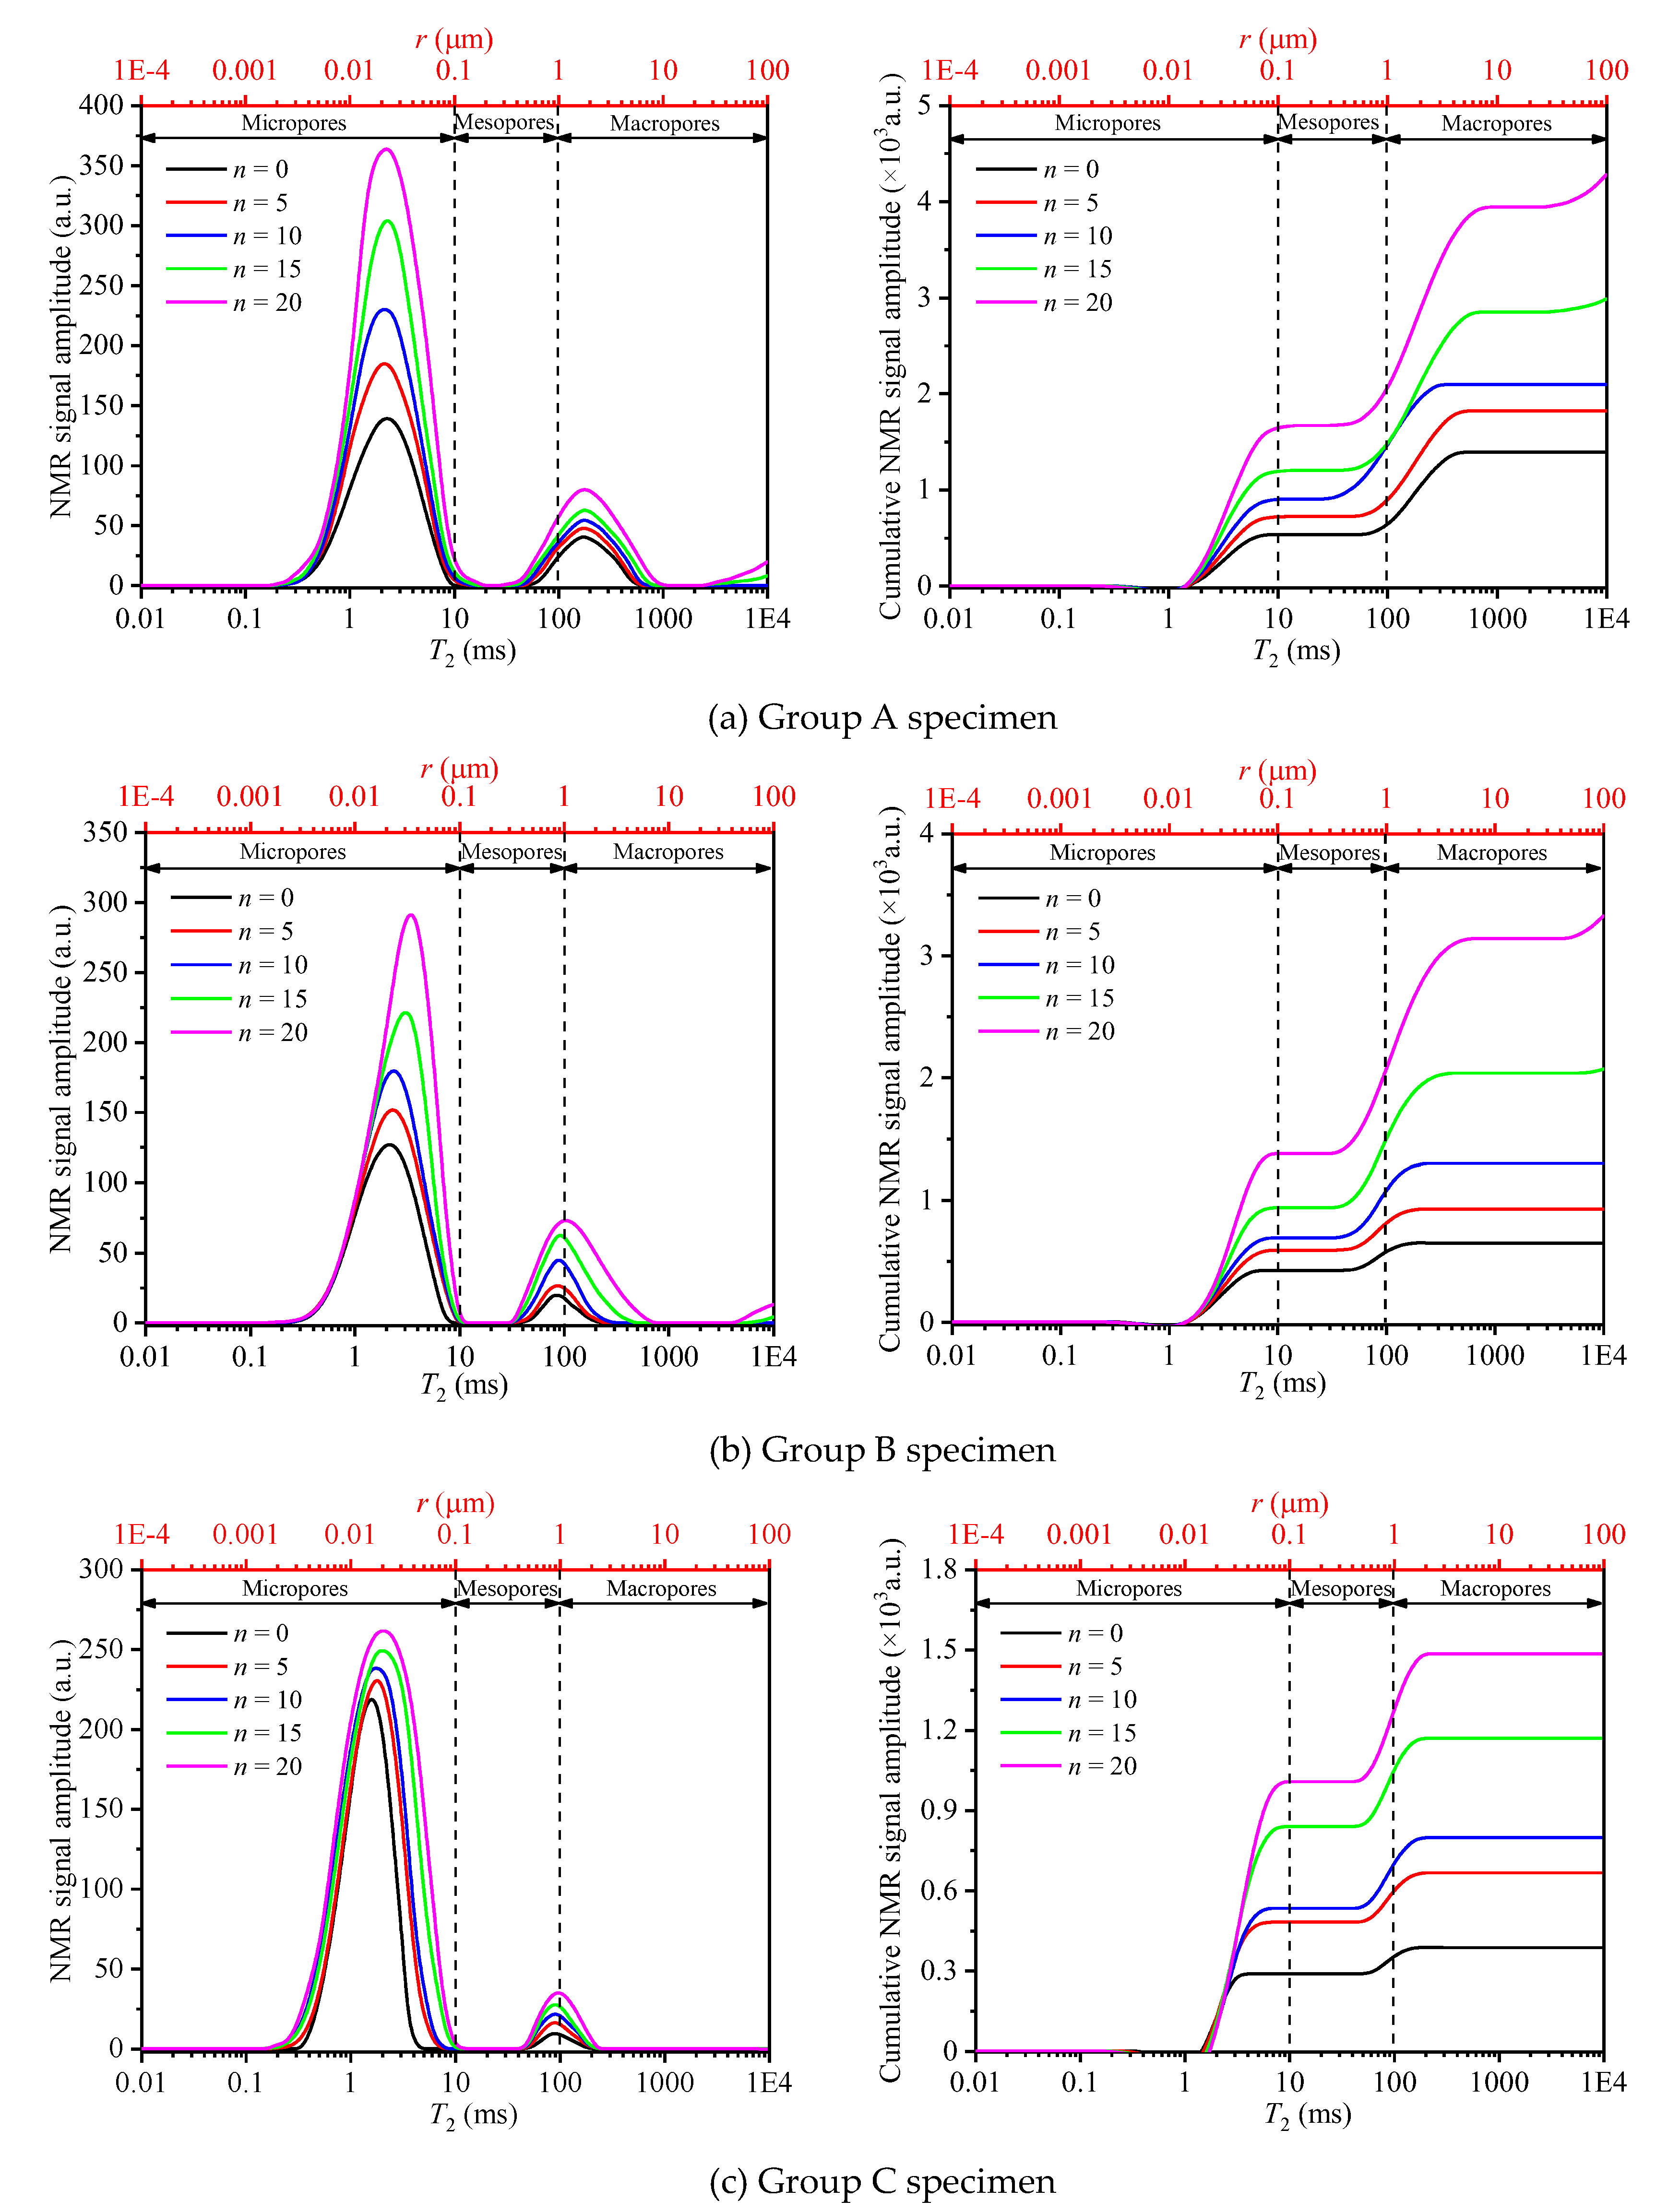
Figure 7 shows the NMR T
2 spectra of the pulp-rock interface layers of Group A, B, and C specimens after 0, 5, 10, 15 and 20 F-T cycles. The upper axis is the converted pore radius, so it can also represent the pore variation of the pulp-rock interface layers of the three types of specimens.
Figure 7 shows the T
2 spectrum change of the mortar-rock interface with different AS proportion under F-T cycles. With increasing F-T cycles, the
T2 spectrum of the mortar-rock interface still maintains a bimodal distribution and continues to grow upward, and both peaks appear to shift to the right, and the cumulative NMR signal intensity also increases. This implies that the pore size of the specimen continues to increase with increasing F-T cycles, and shows the characteristics of the transition from micropores to mesopores, the transition from mesopores to macropores, and the gradual increase of macropores. The microscopic pore evolution trends of the three types of specimens are similar, but there are differences in specific quantitative indicators[
43,
44].
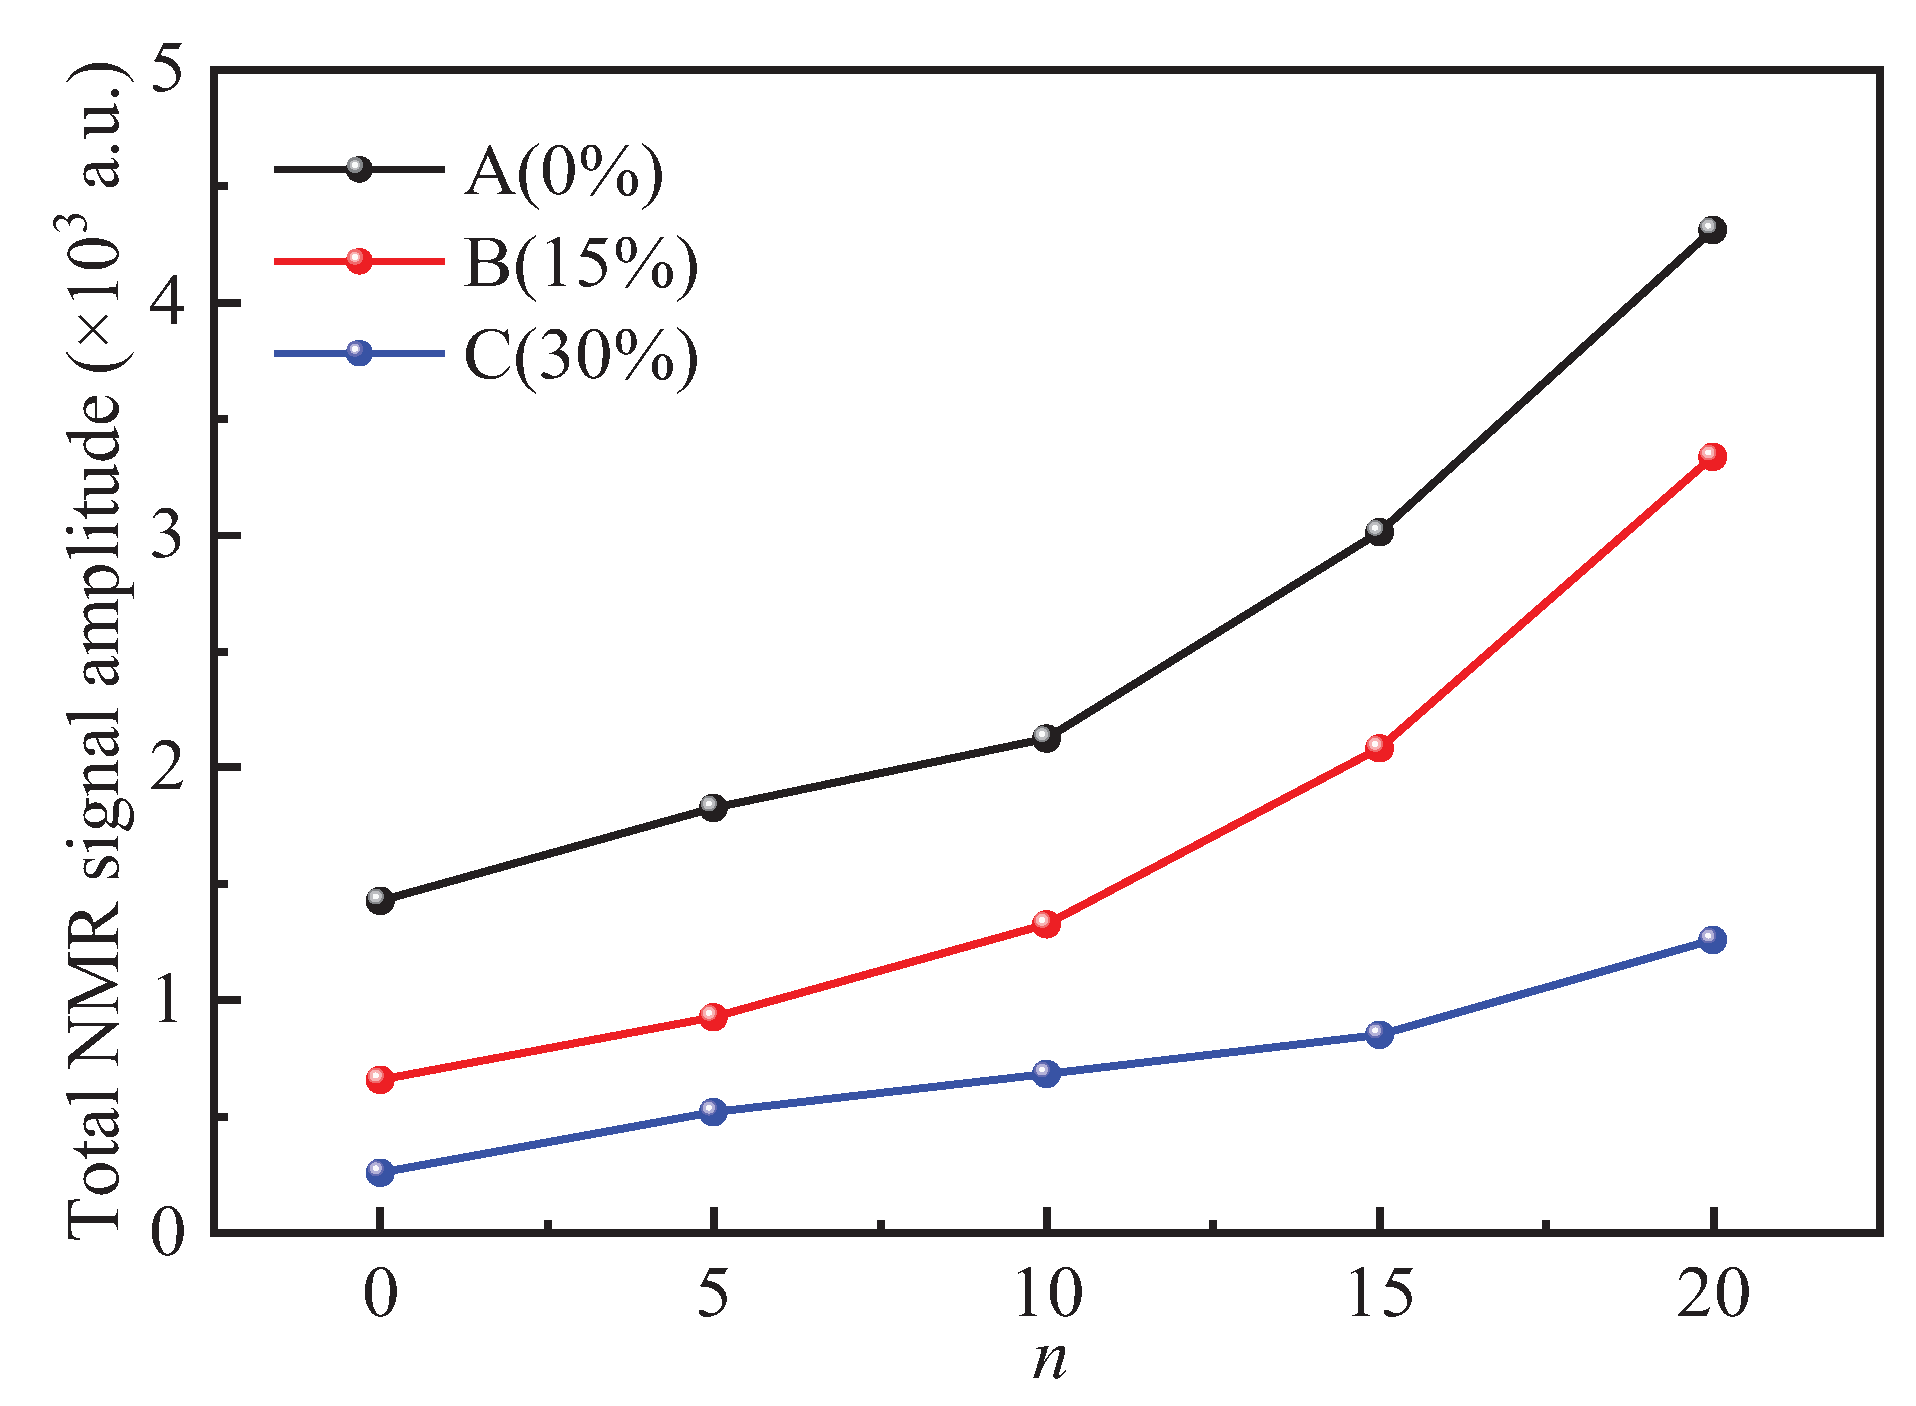
In
Figure 7(a), the cumulative NMR signal intensity of group A increases the fastest after 10 F-T cycles, that is, the A-type specimen's internal pores within the pulp-rock interface layer displayed an acceleration after 10 F-T cycles.
Figure 7 (b) shows that after 10 F-T cycles, the cumulative NMR signal intensity of group B exhibited a relatively rapid increase, with a weaker growth rate compared to group A. It can be got that the internal pore deterioration rate of the slurry-rock interface layer of group B is also lower than that of group A after 10 F-T cycles. According to
Figure 7(c), the mesopore and macropore signal intensity of group C increased less significantly during 0-20 F-T cycles compared to group A and group B. After 15 F-T cycles, the cumulative NMR signal intensity of the C-type specimen increased significantly. This implies that the internal pores of the mortar-rock interface of the group C specimen accelerated degradation after 15 F-T cycles. The above results indicate a direct correlation between the AS proportion and the F-T resistance of the AS-infused mortar. Moreover, the NMR test accurately reflects the properties of F-T degradation.
Figure 7 and
Figure 8 clearly depict that the pores within the mortar-rock interface progressively sprout and evolve throughout the entire F-T cycle, influenced by frost heave force and water migration. This evolution is evident in the increasing count of pores and the constant expansion of their sizes. With increasing AS proportion, the F-T resistance of filling mortar increases. During the initial stage of F-T cycles (the first 10 times), the pore structure of the pulp-rock interface layer exhibited gradual changes for both Group A and Group B specimens, and the emergence and development of new micropores in the interior were slow. During the later stage of F-T cycles (the final 10 iterations), the pore structure underwent rapid transformation, with a notable acceleration in the size of both newly formed pores and preexisting pores. This rapid change aligned with the macroscopic deterioration patterns observed in
Figure 6. For group C specimens, a total of 15 F-T cycles served as the accelerated threshold for the deterioration of pores within the slurry-rock interface layer.
The NMR and F-T test results clearly indicate that the introduction of an appropriate quantity of AS enhances the particle gradation and subsequently boosts the compactness of cement stone. When compared to river sand, AS exhibits smaller particle sizes, leading to an improved gradation of concrete aggregate upon proper addition. Notably, the particle sizes of AS, river sand, and stone align closely with the Horsfield dense accumulation theory and continuous gradation theory, enabling the realization of optimal particle spacing among different sizes. This optimization ultimately contributes to the enhancement of F-T performance.
3.2.2. Analysis of T2 Spectral Area of Mortar-Rock Interface
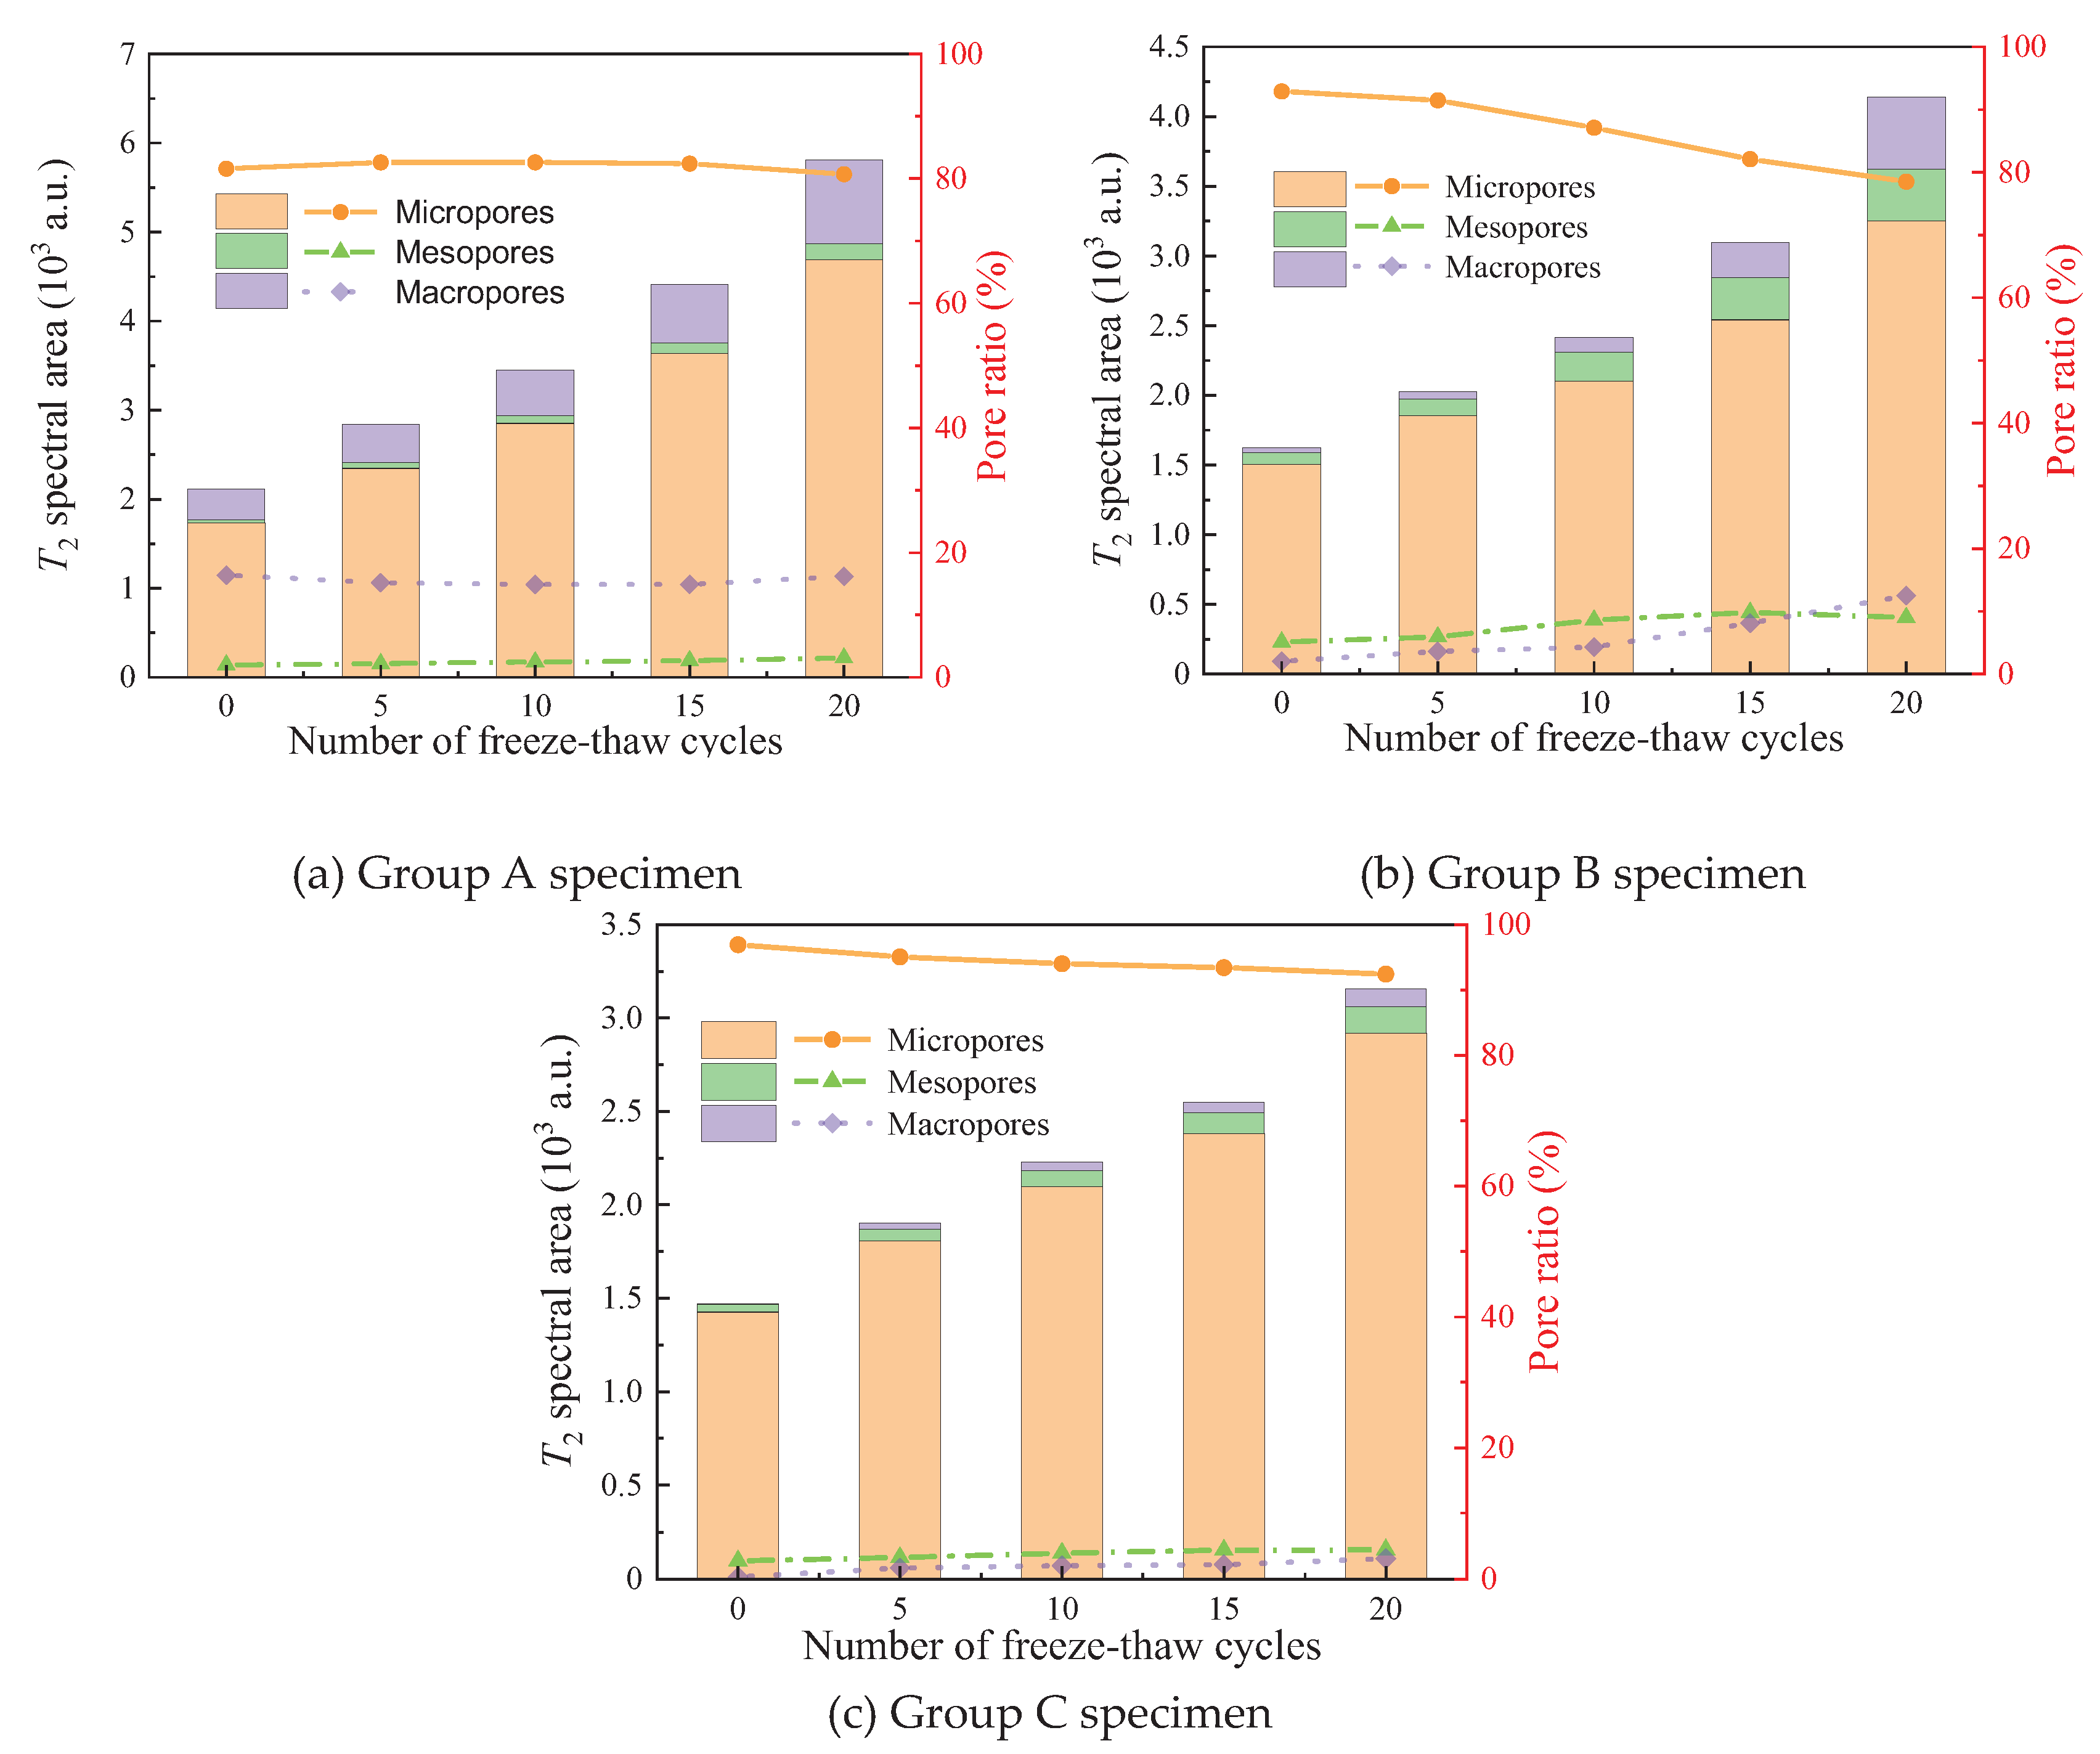
Figure 9 illustrates that, at the initial stage of F-T cycles (0 times), the T
2 total spectral areas for the three types of specimens are 2125.14, 1620.23, and 1470.39, respectively. This demonstrates that the initial pore count and pore diameter at the mortar-rock interface follow the order: group A > group B > group C. Evidently, the inclusion of AS significantly impacts the pore structure of the mortar-rock interface. As the F-T cycles increases, the T
2 total spectral area of the pulp-rock interface layer for all three types of specimens continually rises, indicating that the internal pores continue to initiate, develop, and expand. Notably, across the same F-T cycles, the T
2 total spectral area consistently follows the pattern: group A > group B > group C. This pattern positively correlates with the degree of internal pore structure development, the bonding condition of the slurry-rock interface layer, and the F-T resistance of the slurry. The evolution of the T
2 total spectral area provides microscopic evidence that the mortar-rock interface with a 30% AS proportion exhibits the strongest F-T resistance, followed by the 15% AS proportion mortar, and ordinary mortar exhibits the weakest resistance.
3.3. Shear Mechanical Properties of Mortar-Rock Interface for Filling Consolidation
In cold region jointed rock mass filling reinforcement projects, once the reinforcement has been completed, the newly formed engineering structure, consisting of mortar and rock mass, must not only withstand loads but also endure continuous F-T cycles to ensure the overall structural stability. Consequently, the characteristics of shear failure during filling consolidation are of paramount importance and are a key area of focus in both engineering design and construction.
3.3.1. Analysis of Shear Stress-Strain Curve
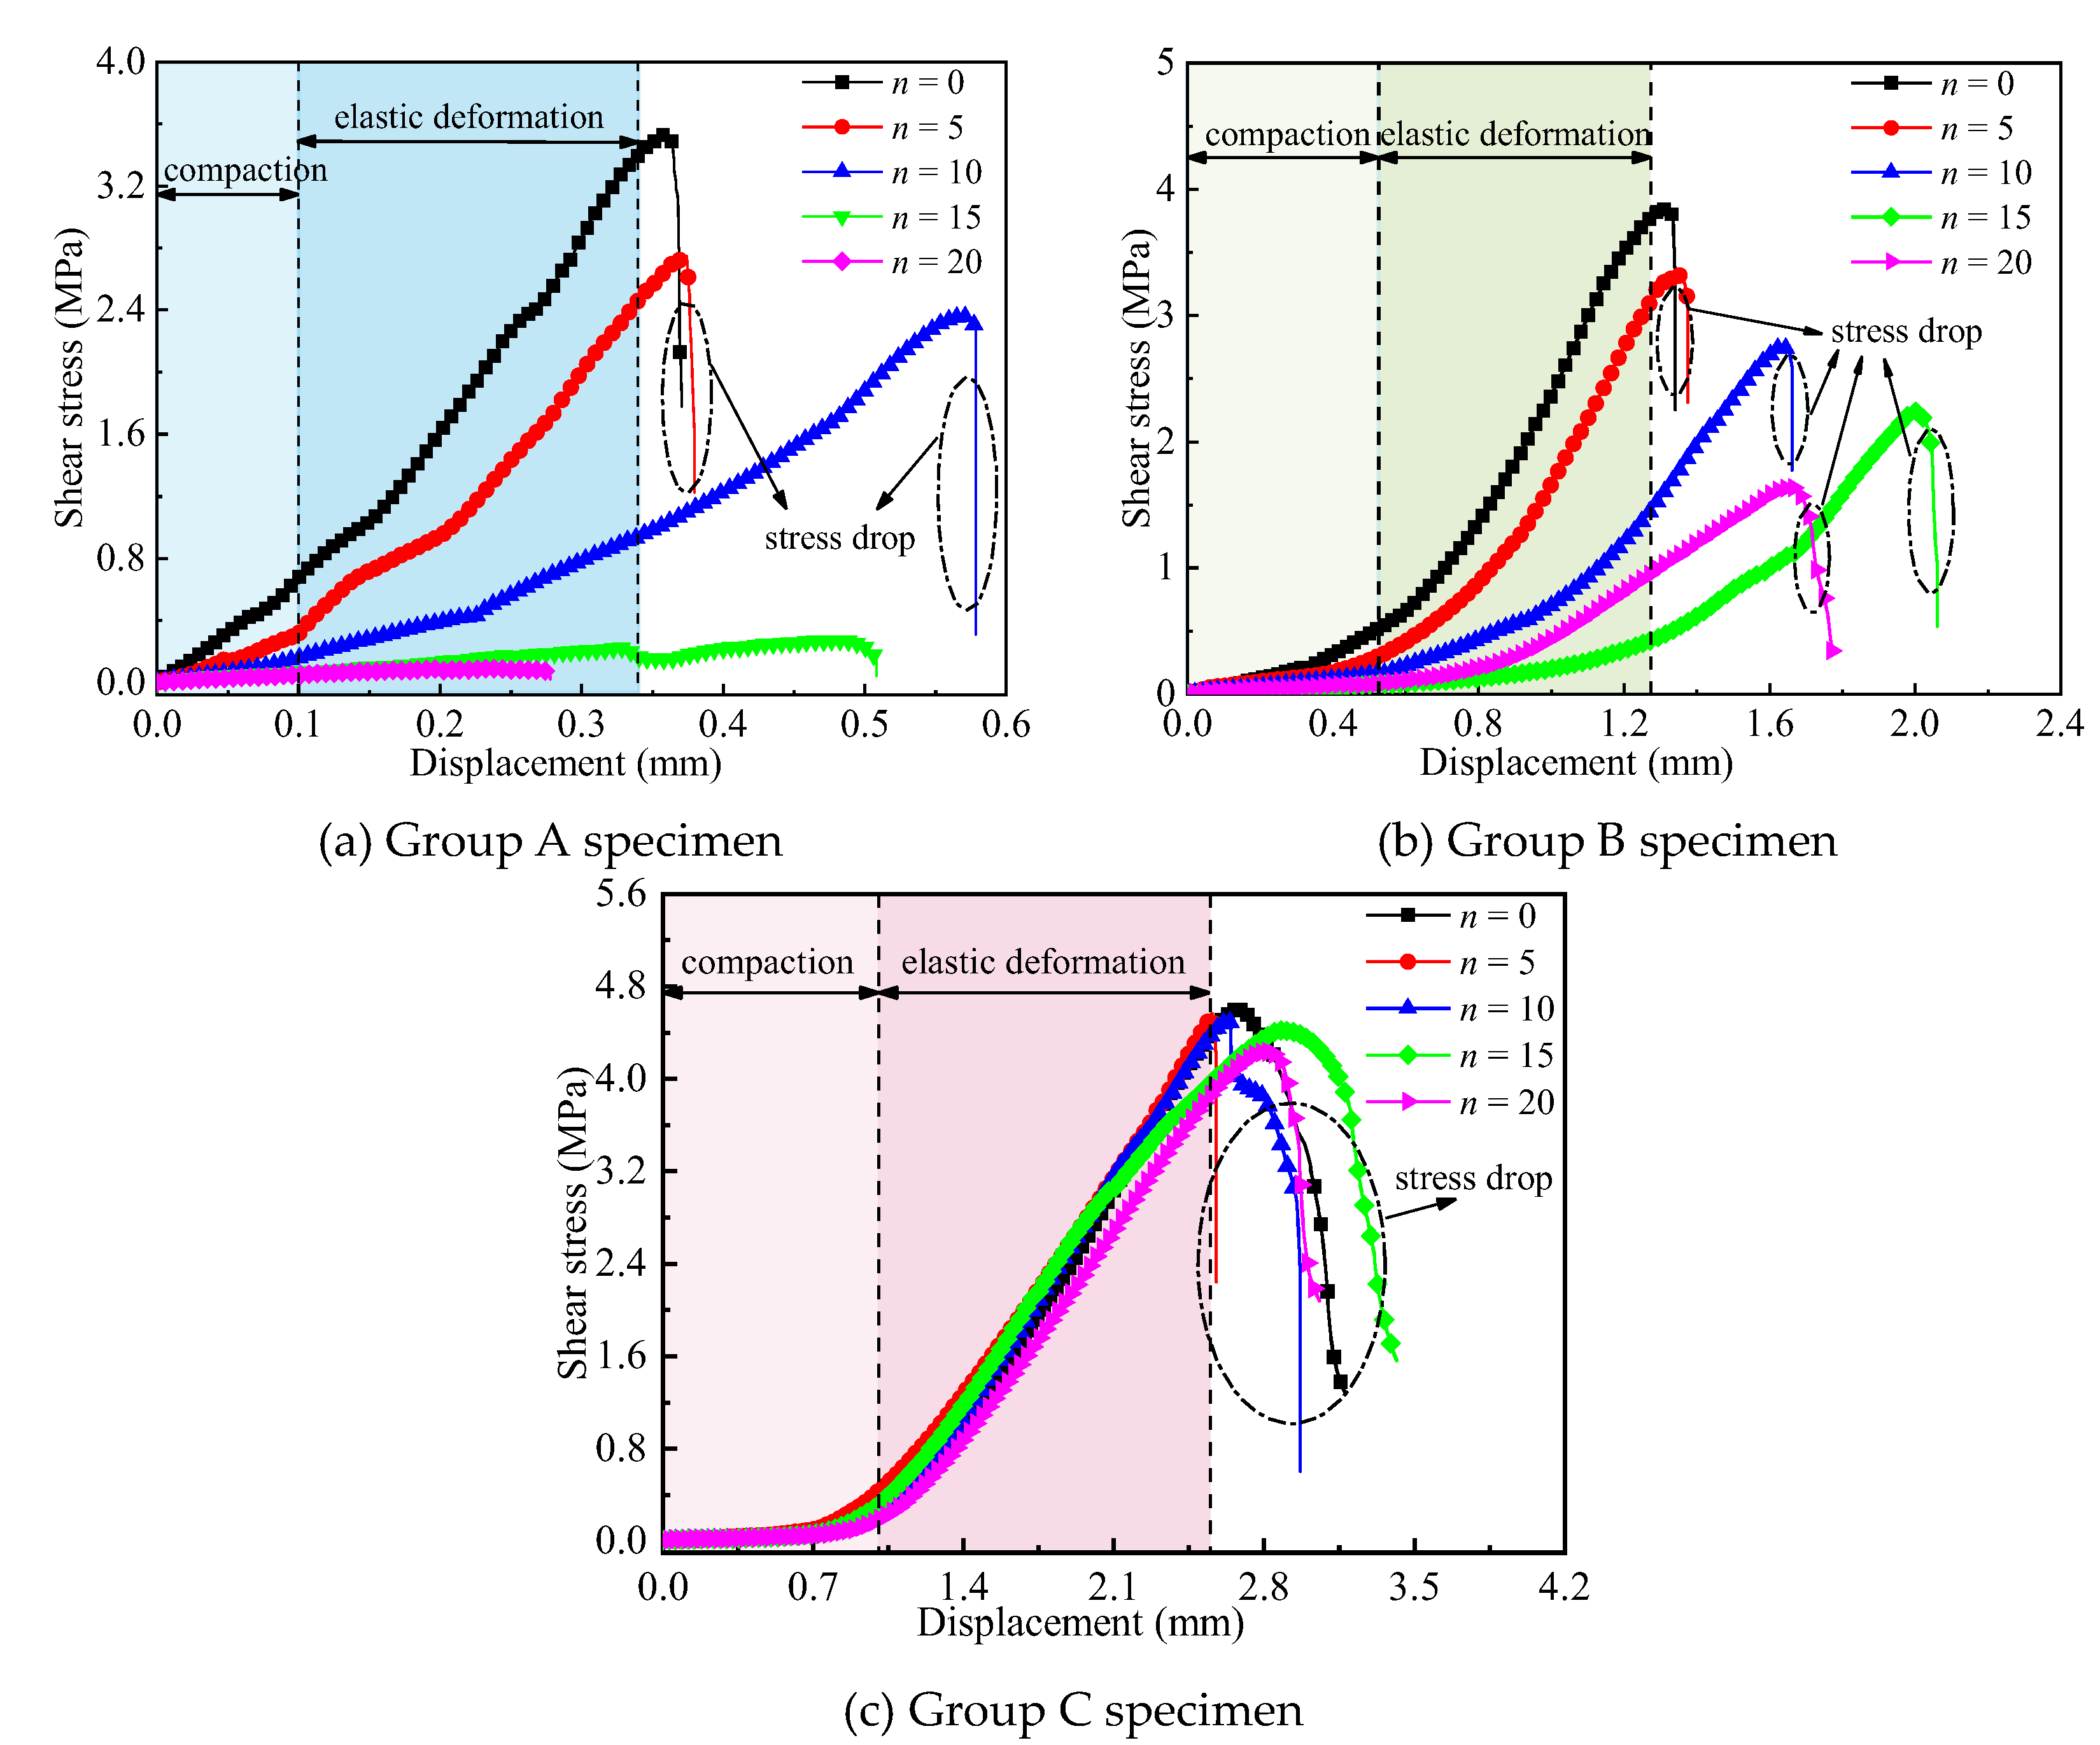
Figure 10 exhibits the shear stress-strain curves of three types of specimens across various F-T cycles. These curves reveal several common characteristics:
(1) The overall trends of the shear stress-strain curves for the three specimen types are similar, exhibiting distinct stages such as compaction, elastic deformation, peak strength, and stress drop.
(2) As the F-T cycles increases, the compaction section of the specimens becomes increasingly prominent, with the 'concave' portion of the curve becoming more evident. This indicates that the internal pores of the specimens expand continuously after undergoing F-T cycles, resulting in a noticeable compaction effect during the early stages of the shear test.
(3) The peak shear stress of the specimens gradually decreases with the increase in F-T cycles, reflecting a weakening of the specimens' shear strength due to the cycles.
(4) Regardless of the F-T conditions, all three specimen types experienced a 'stress drop' following the peak shear stress, accompanied by a distinct sound as they rapidly failed. This indicates that the specimens underwent brittle shear failure once they reached their peak strength.
Figure 10 reveals that after enduring 20 F-T cycles, the peak shear stress of group C experienced only a minimal decrease of 8.04%, whereas groups A and B saw significant reductions of 97.72% and 57.40%, respectively. This observation suggests that the mortar-rock interface of group C exhibits superior frost resistance compared to the other two mortar types. Furthermore, upon close inspection, group C's mortar-rock interface remained free of macroscopic cracks after 20 F-T cycles, with only minor F-T spalling evident in the yellow sandstone portion. Analysis indicates that the injection of mortar containing 30% AS particles into the yellow sandstone's fracture surface contributes to this resilience. Since the AS particles are relatively small, they can easily penetrate the fine pores on both sides of the fracture, enhancing the cementation strength of the consolidated body. This results in a superior cementation degree between the upper and lower structures of the yellow sandstone. In conclusion, groups A (0% AS) and B (15% AS) demonstrate improved grouting effects and frost resistance compared to group A, highlighting the beneficial effects of incorporating AS in the mortar mixture.
3.3.2. Shear Strength Analysis
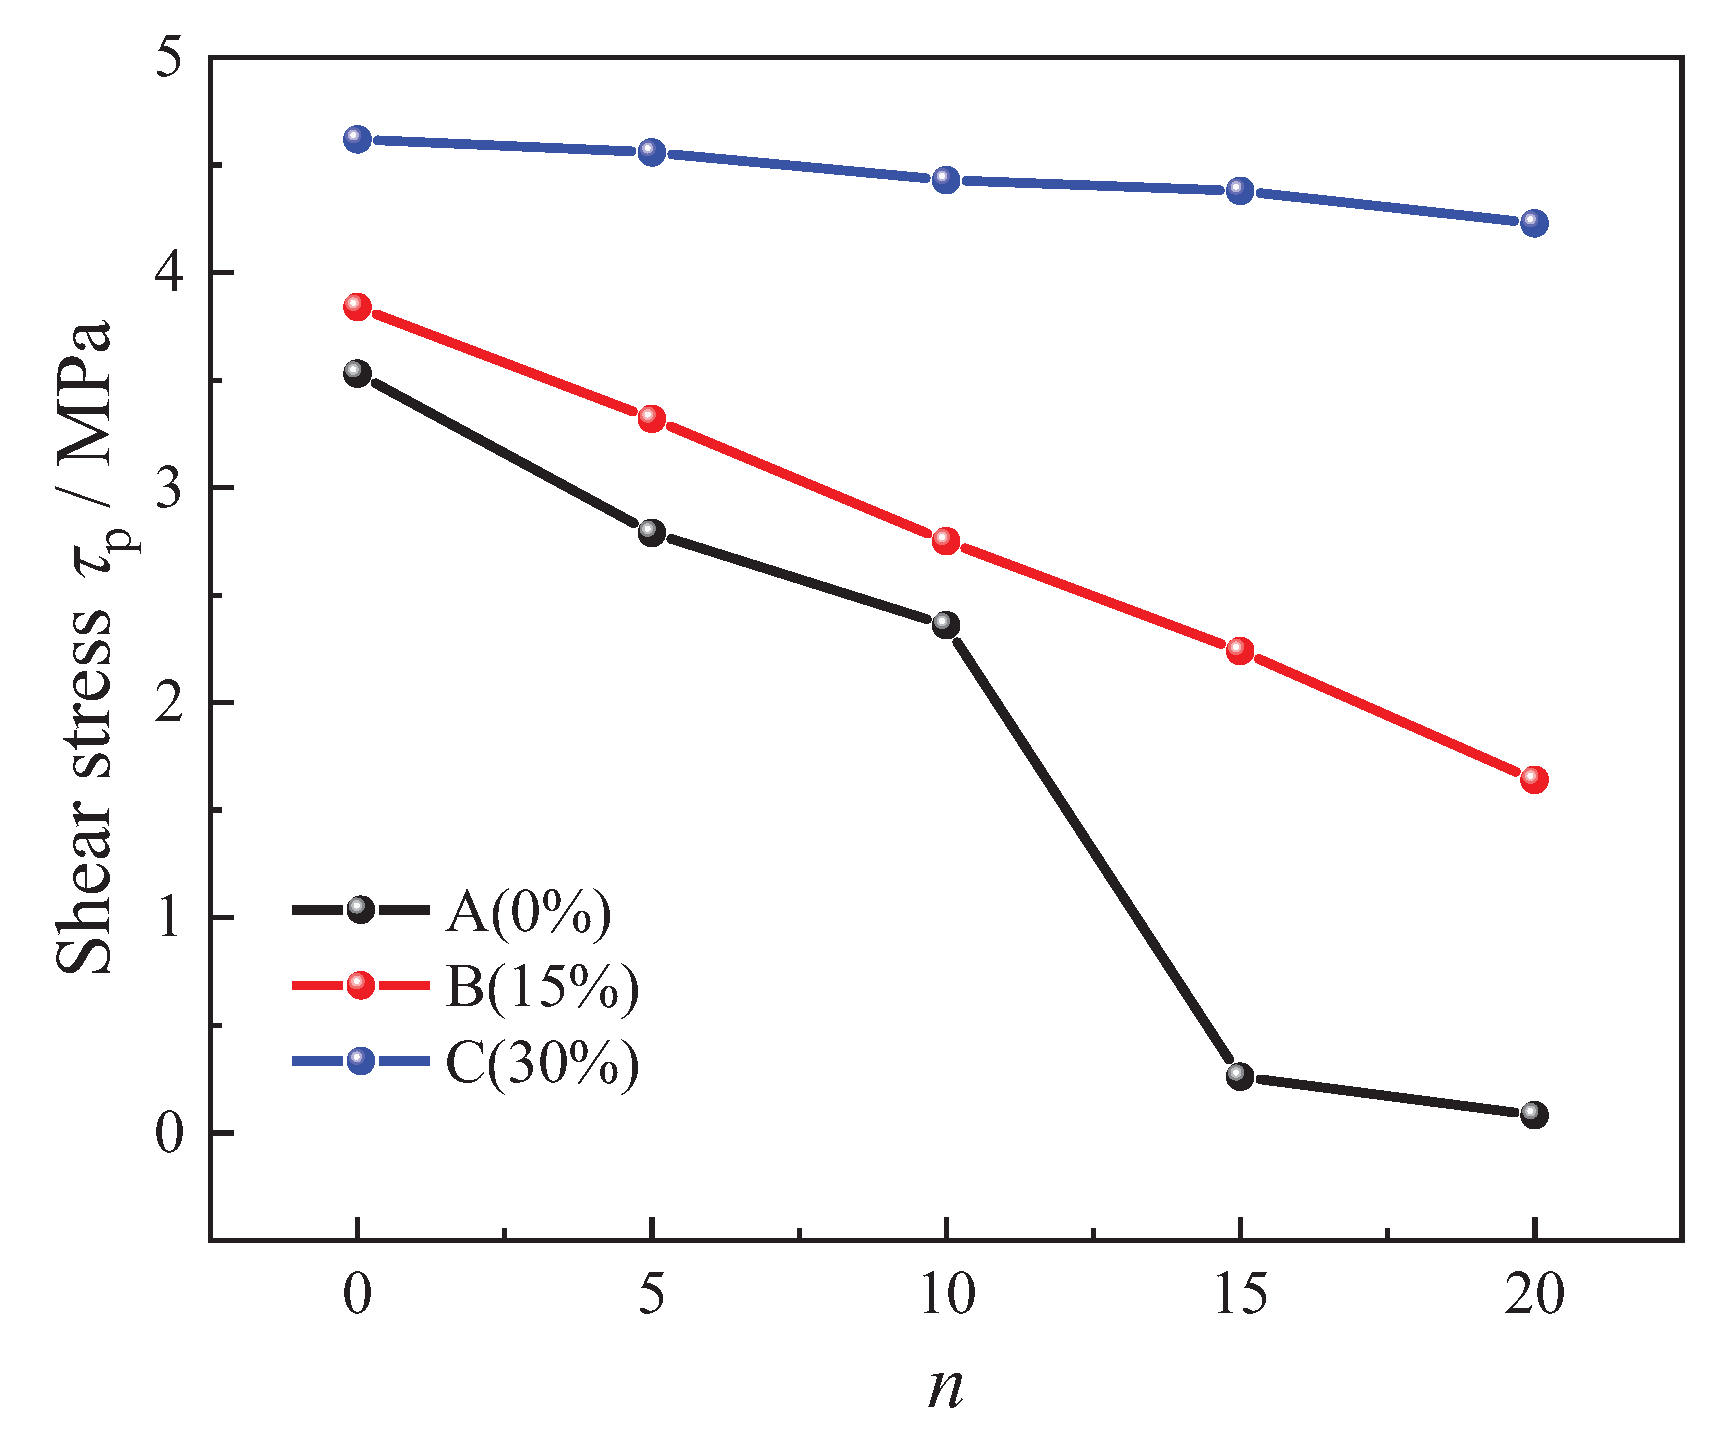
As depicted in
Figure 11, the shear strength of the mortar filling consolidation body, influenced by varying proportions of AS under F-T cycling, exhibits a distinct pattern. Initially, the shear strength of the group C specimen, with 30% AS, stands at 4.62 MPa, significantly surpassing the strengths of the other two groups. This indicates that the reinforcement effect of mortar containing 30% AS on the fracture surface of yellow sandstone surpasses both mortar with 15% AS and ordinary mortar. Throughout the F-T cycling, while the strength of group C gradually decreases, the decrement remains minimal compared to groups A and B. Notably, the epoxy resin slurry not only demonstrates the most potent grouting reinforcement among the three specimens but also exhibits the superior frost resistance. This is attributed to the 30% AS proportion, which significantly enhances the particle gradation and compactness of the mortar, ultimately boosting the consolidated strength. Moreover, the small particles of AS can penetrate even the finest pores in the yellow sandstone's fracture surface, bolstering its pore cementation ability. This ensures a tighter bond between the upper and lower structures of the sandstone, ultimately optimizing the consolidation effect and frost resistance at the mortar-rock interface.
The shear stiffness, denoted as
KS, represents the gradient of the approximately straight segment within the elastic deformation phase of the slurry-rock interface layer curve for the specimen.
KS serves as a metric for assessing the interface layer's resistance to deformation. A higher
KS value implies a reduced shear strain within a given shear stress range, and conversely, a lower value indicates a greater strain.
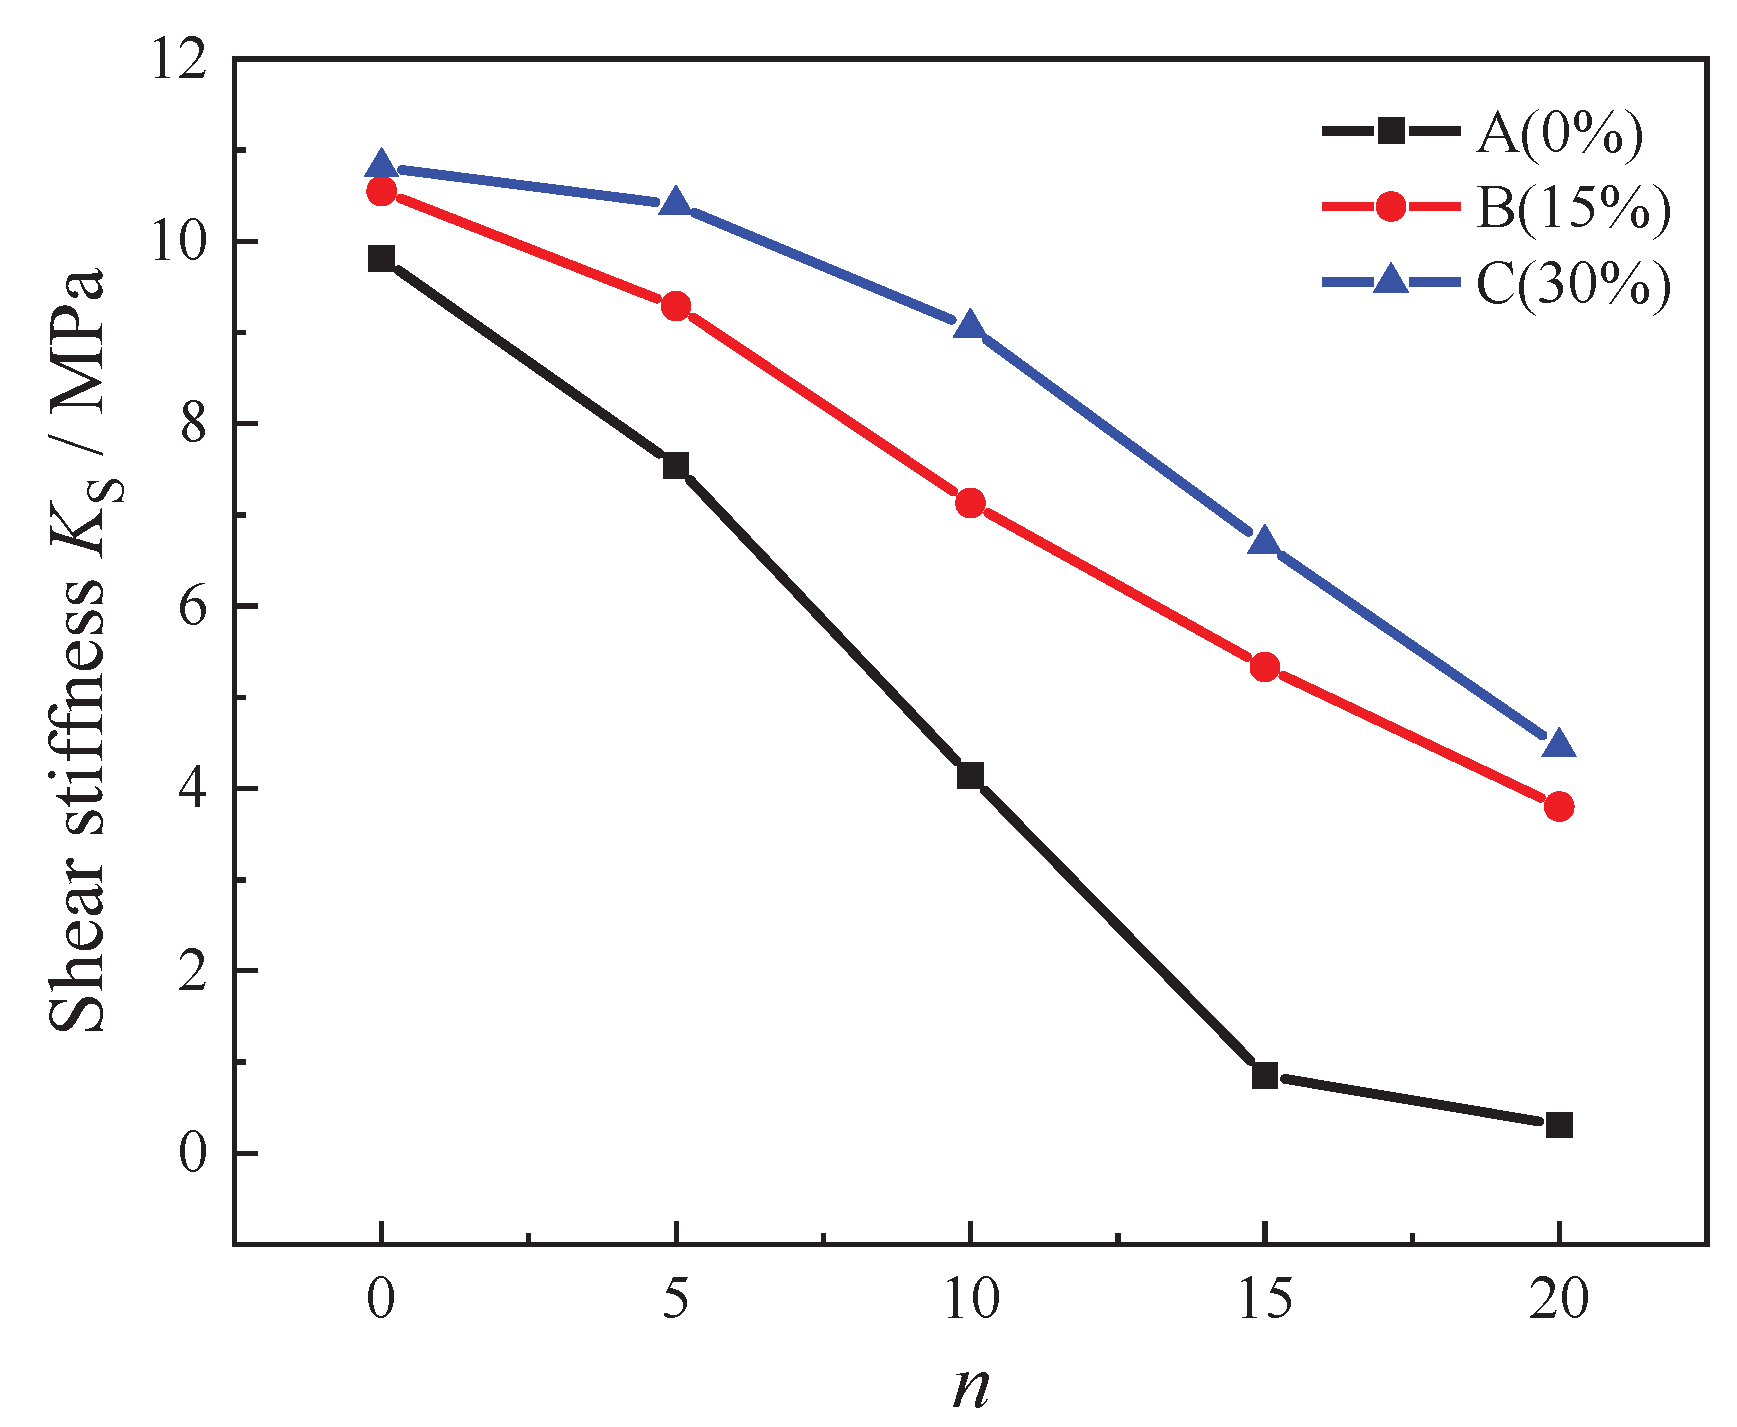
Figure 12 illustrates the
KS values for specimens in groups A, B, and C under varying F-T cycles.
Figure 12 shows that that the variation trends of shear stiffness closely resemble those of shear strength. Under the influence of F-T cycles, the shear stiffness of group C, which contains a 30% proportion of AS, surpasses that of both group B (15% AS) and group A (0% AS). This finding underscores the superior bearing capacity, deformation resistance, and resistance to F-T damage exhibited by the mortar-filling body with a 30% AS proportion.
3.3.3. Acoustic Emission Characteristics during the Shear Failure Process
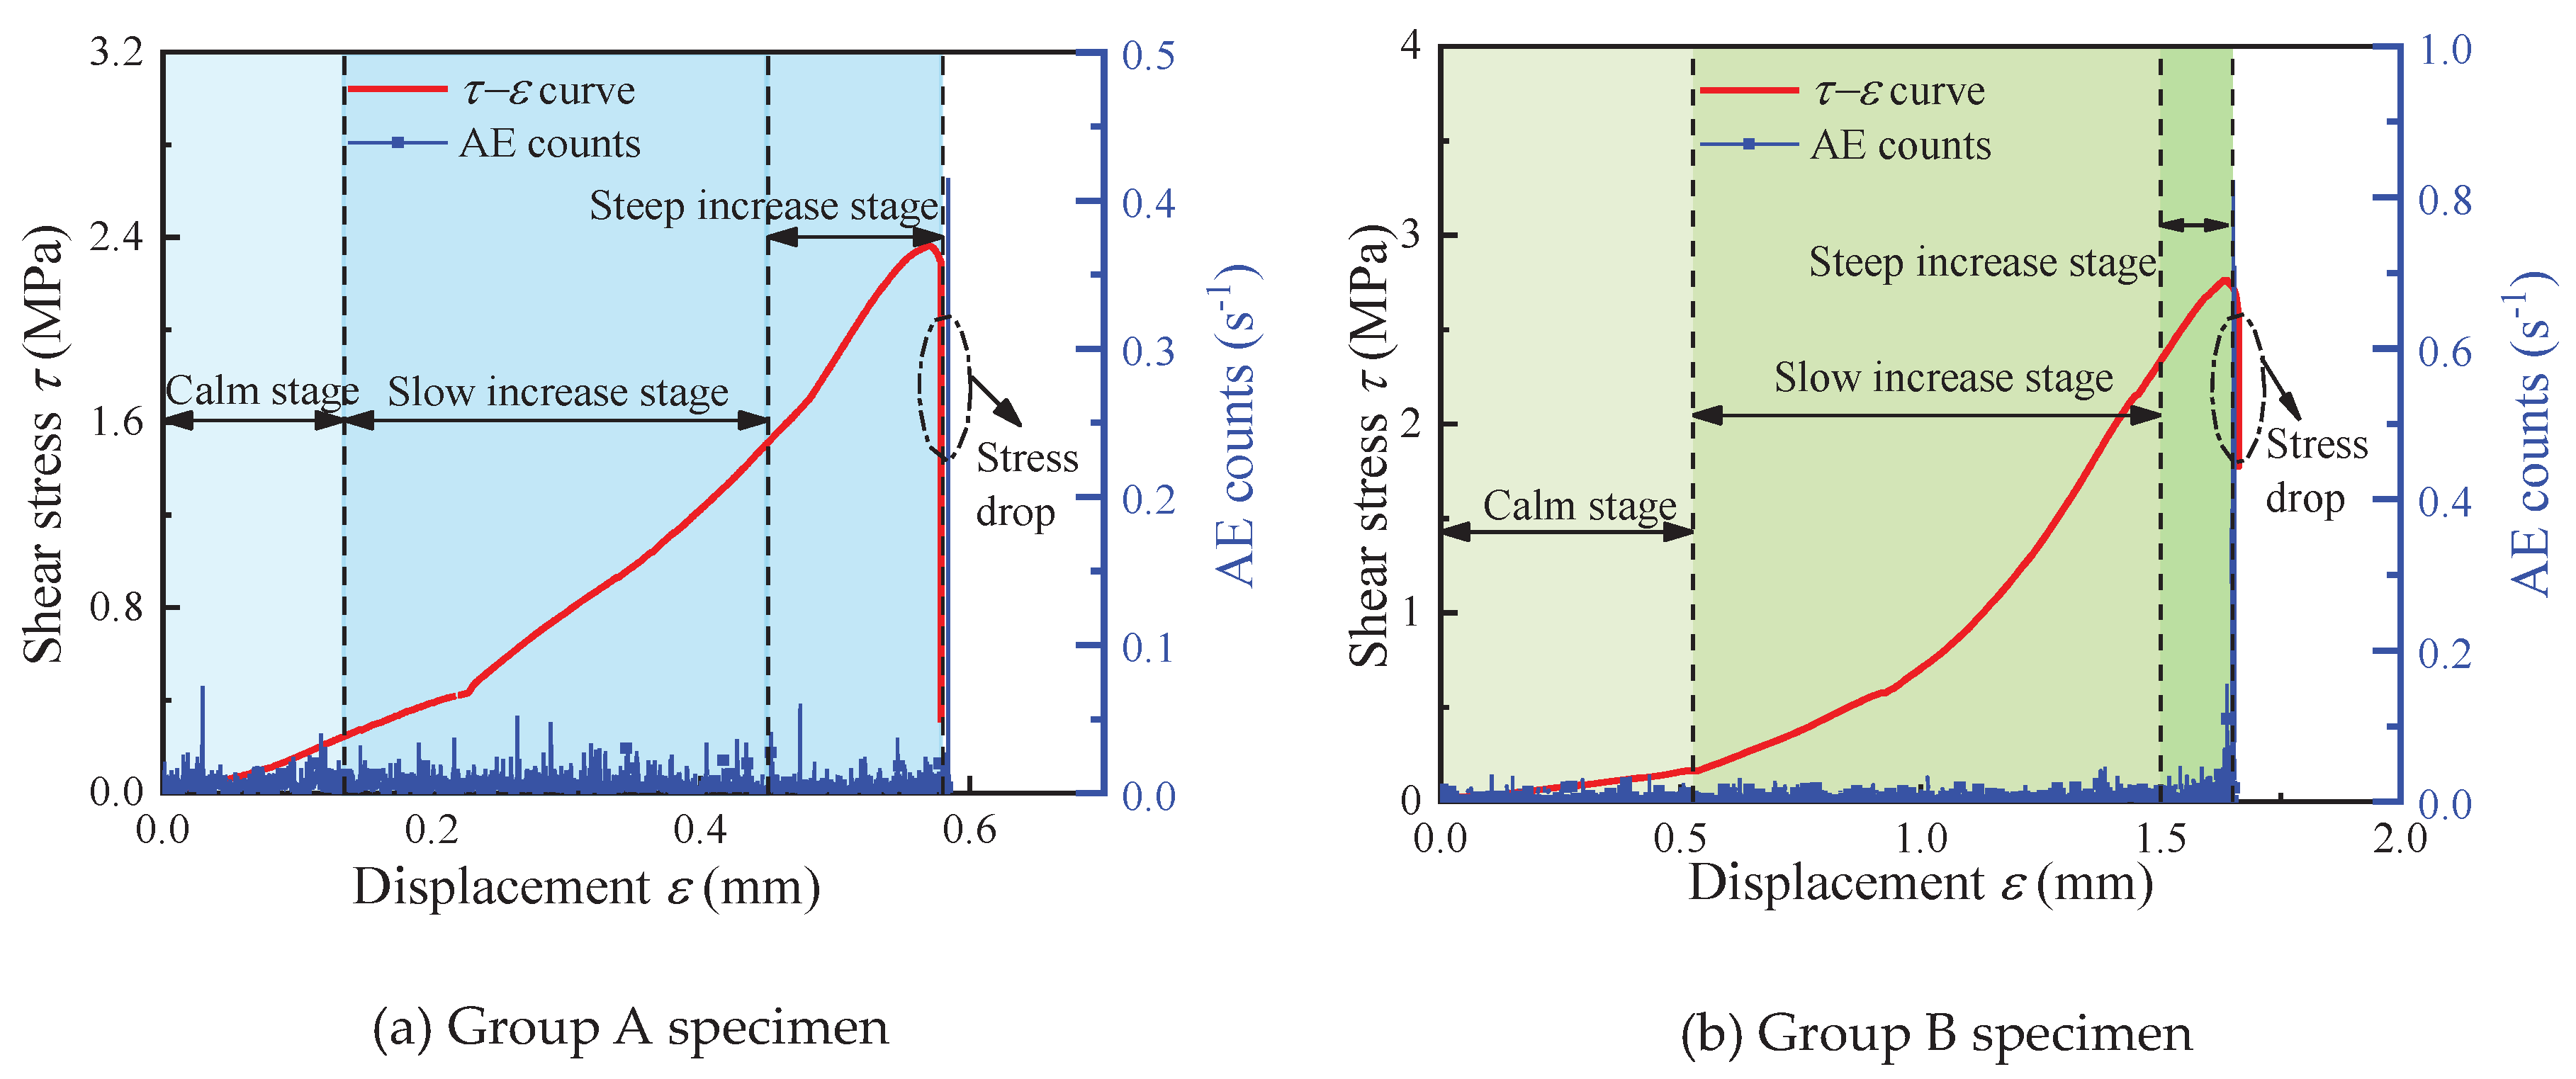
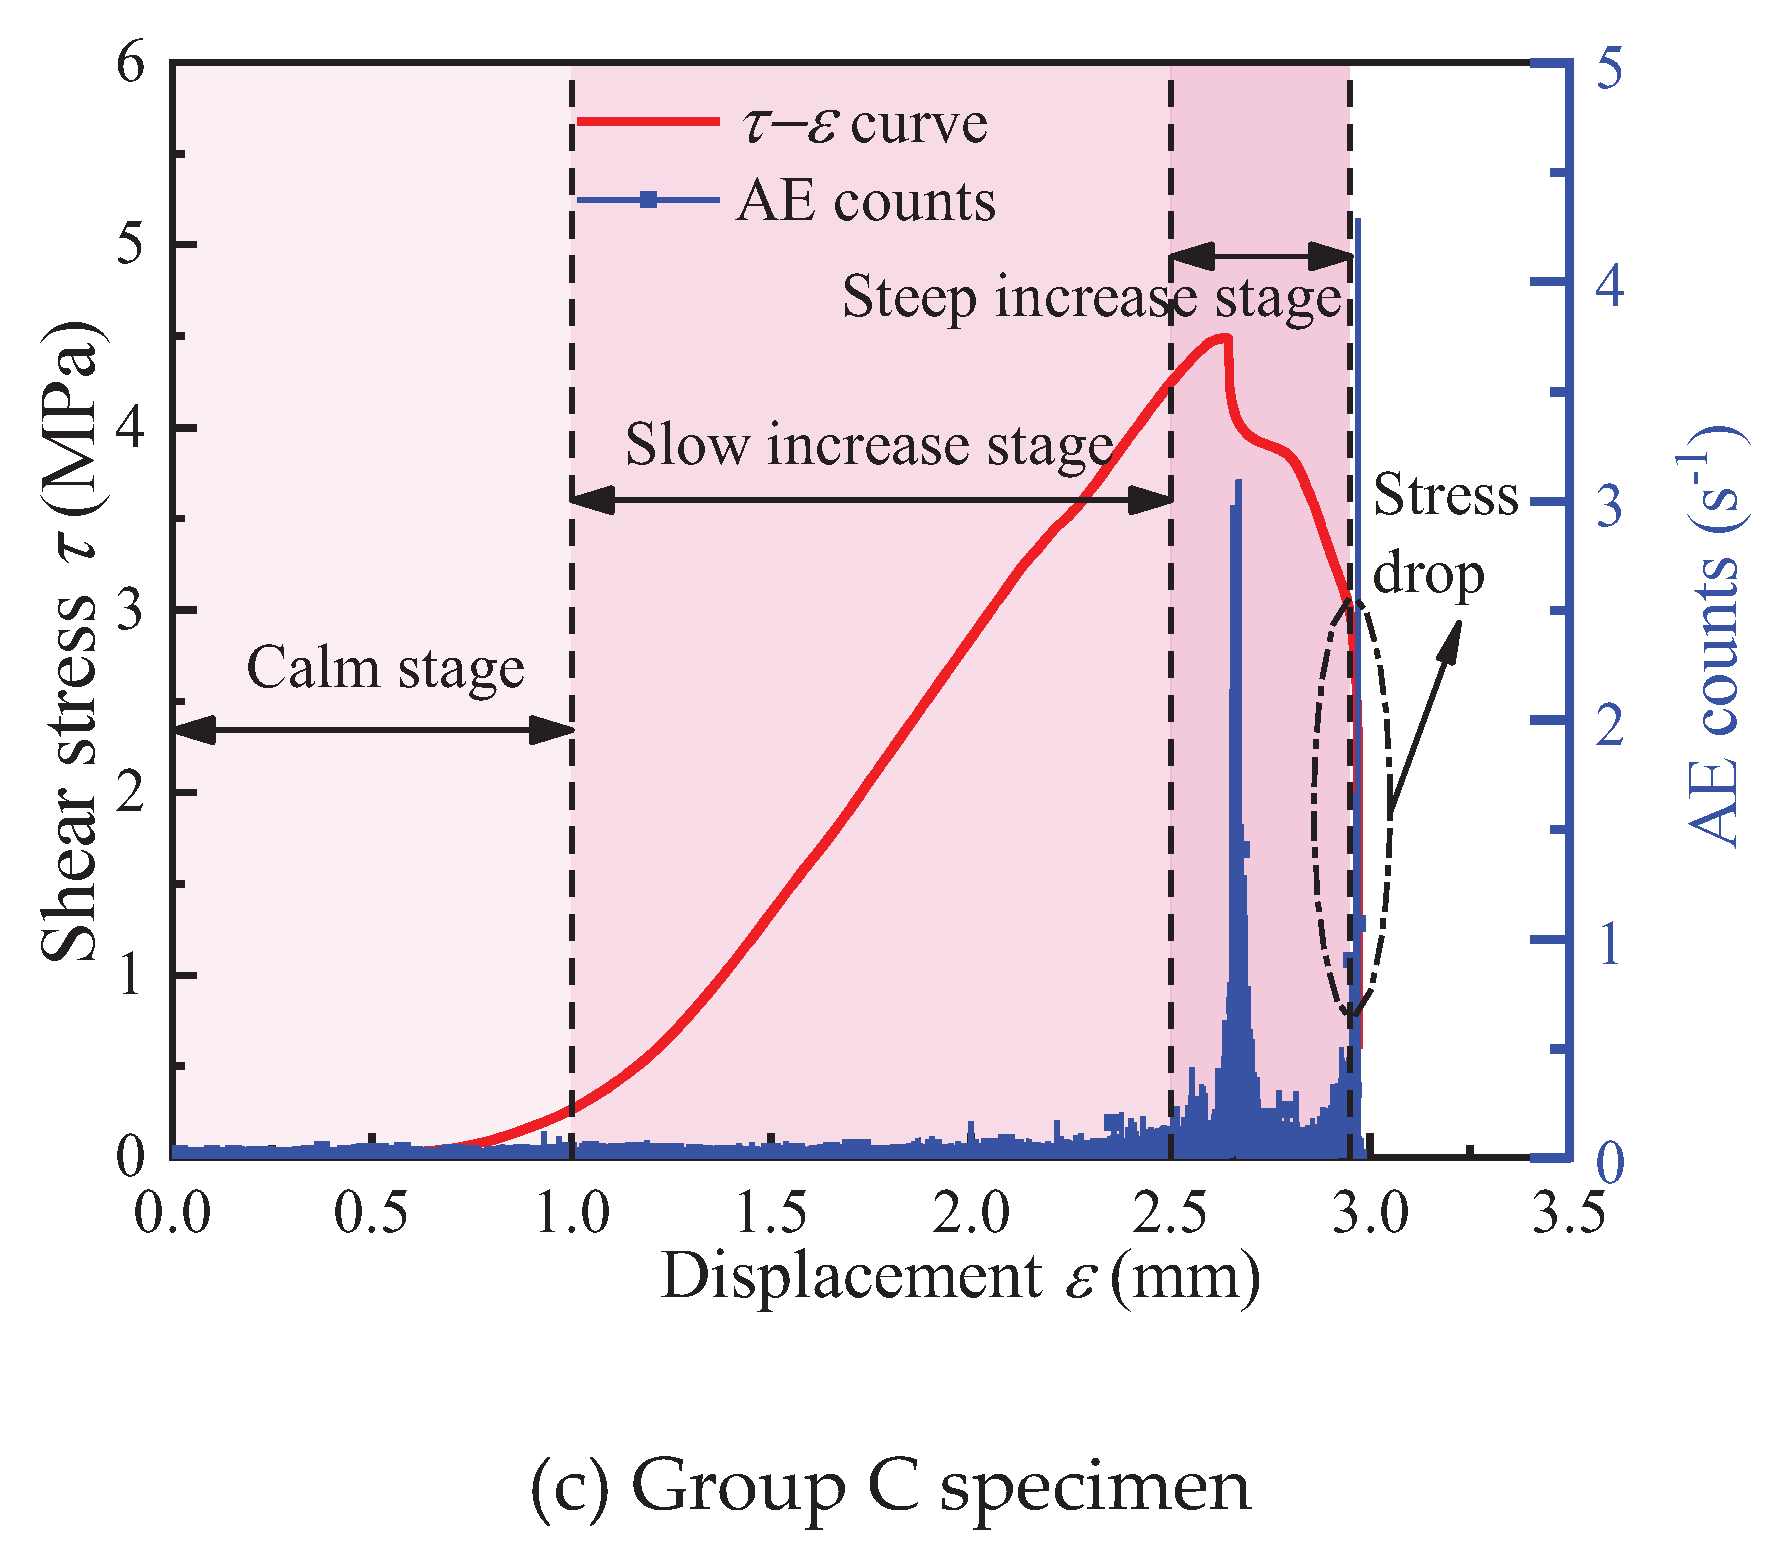
To explore the correlation between shear mechanical curves and concurrent acoustic emission (AE) parameters for mortar-filled specimens with varying proportions of aeolian sand, experiments were conducted with specimens from groups A (0%), B (15%), and C (30%) under 10 F-T cycles. These experiments allowed us to plot the relationship curves between shear stress, shear strain, and AE ringing counts for each consolidation specimen.
Figure 13 depicts the AE ringing count curves for the mortar-rock interface of specimens in groups A, B, and C, which exhibit similar trends. These curves can be broadly categorized into three distinct phases as follow.
The first phase is the calm stage, during which AE ringing counts are inactive, infrequent, and grow gradually. This stage corresponds to the energy accumulation phase where the test machine's load primarily compacts the initial pore space at the pulp-rock interface, insufficient to initiate significant pore development or crack formation.
The second phase is the slow increase phase. As the loading continues, the accumulated energy within the specimen rises, leading to the failure of slurry particle connections and the expansion of initial pores. This triggers the activation of AE ringing counts, which begin to increase gradually.
The final phase is the steep increase stage. At this point, the accumulated energy inside the specimen reaches its limit, causing rapid crack propagation and the emergence of a dominant crack. The specimen undergoes destabilization, and the shear stress experiences a "stress drop." Concurrently, the AE ringing count increases rapidly, reaching a peak ringing count close to the peak strength of the specimen.
4. Discussion
4.1. F-T Damage Mechanism of Mortar-Rock Interface
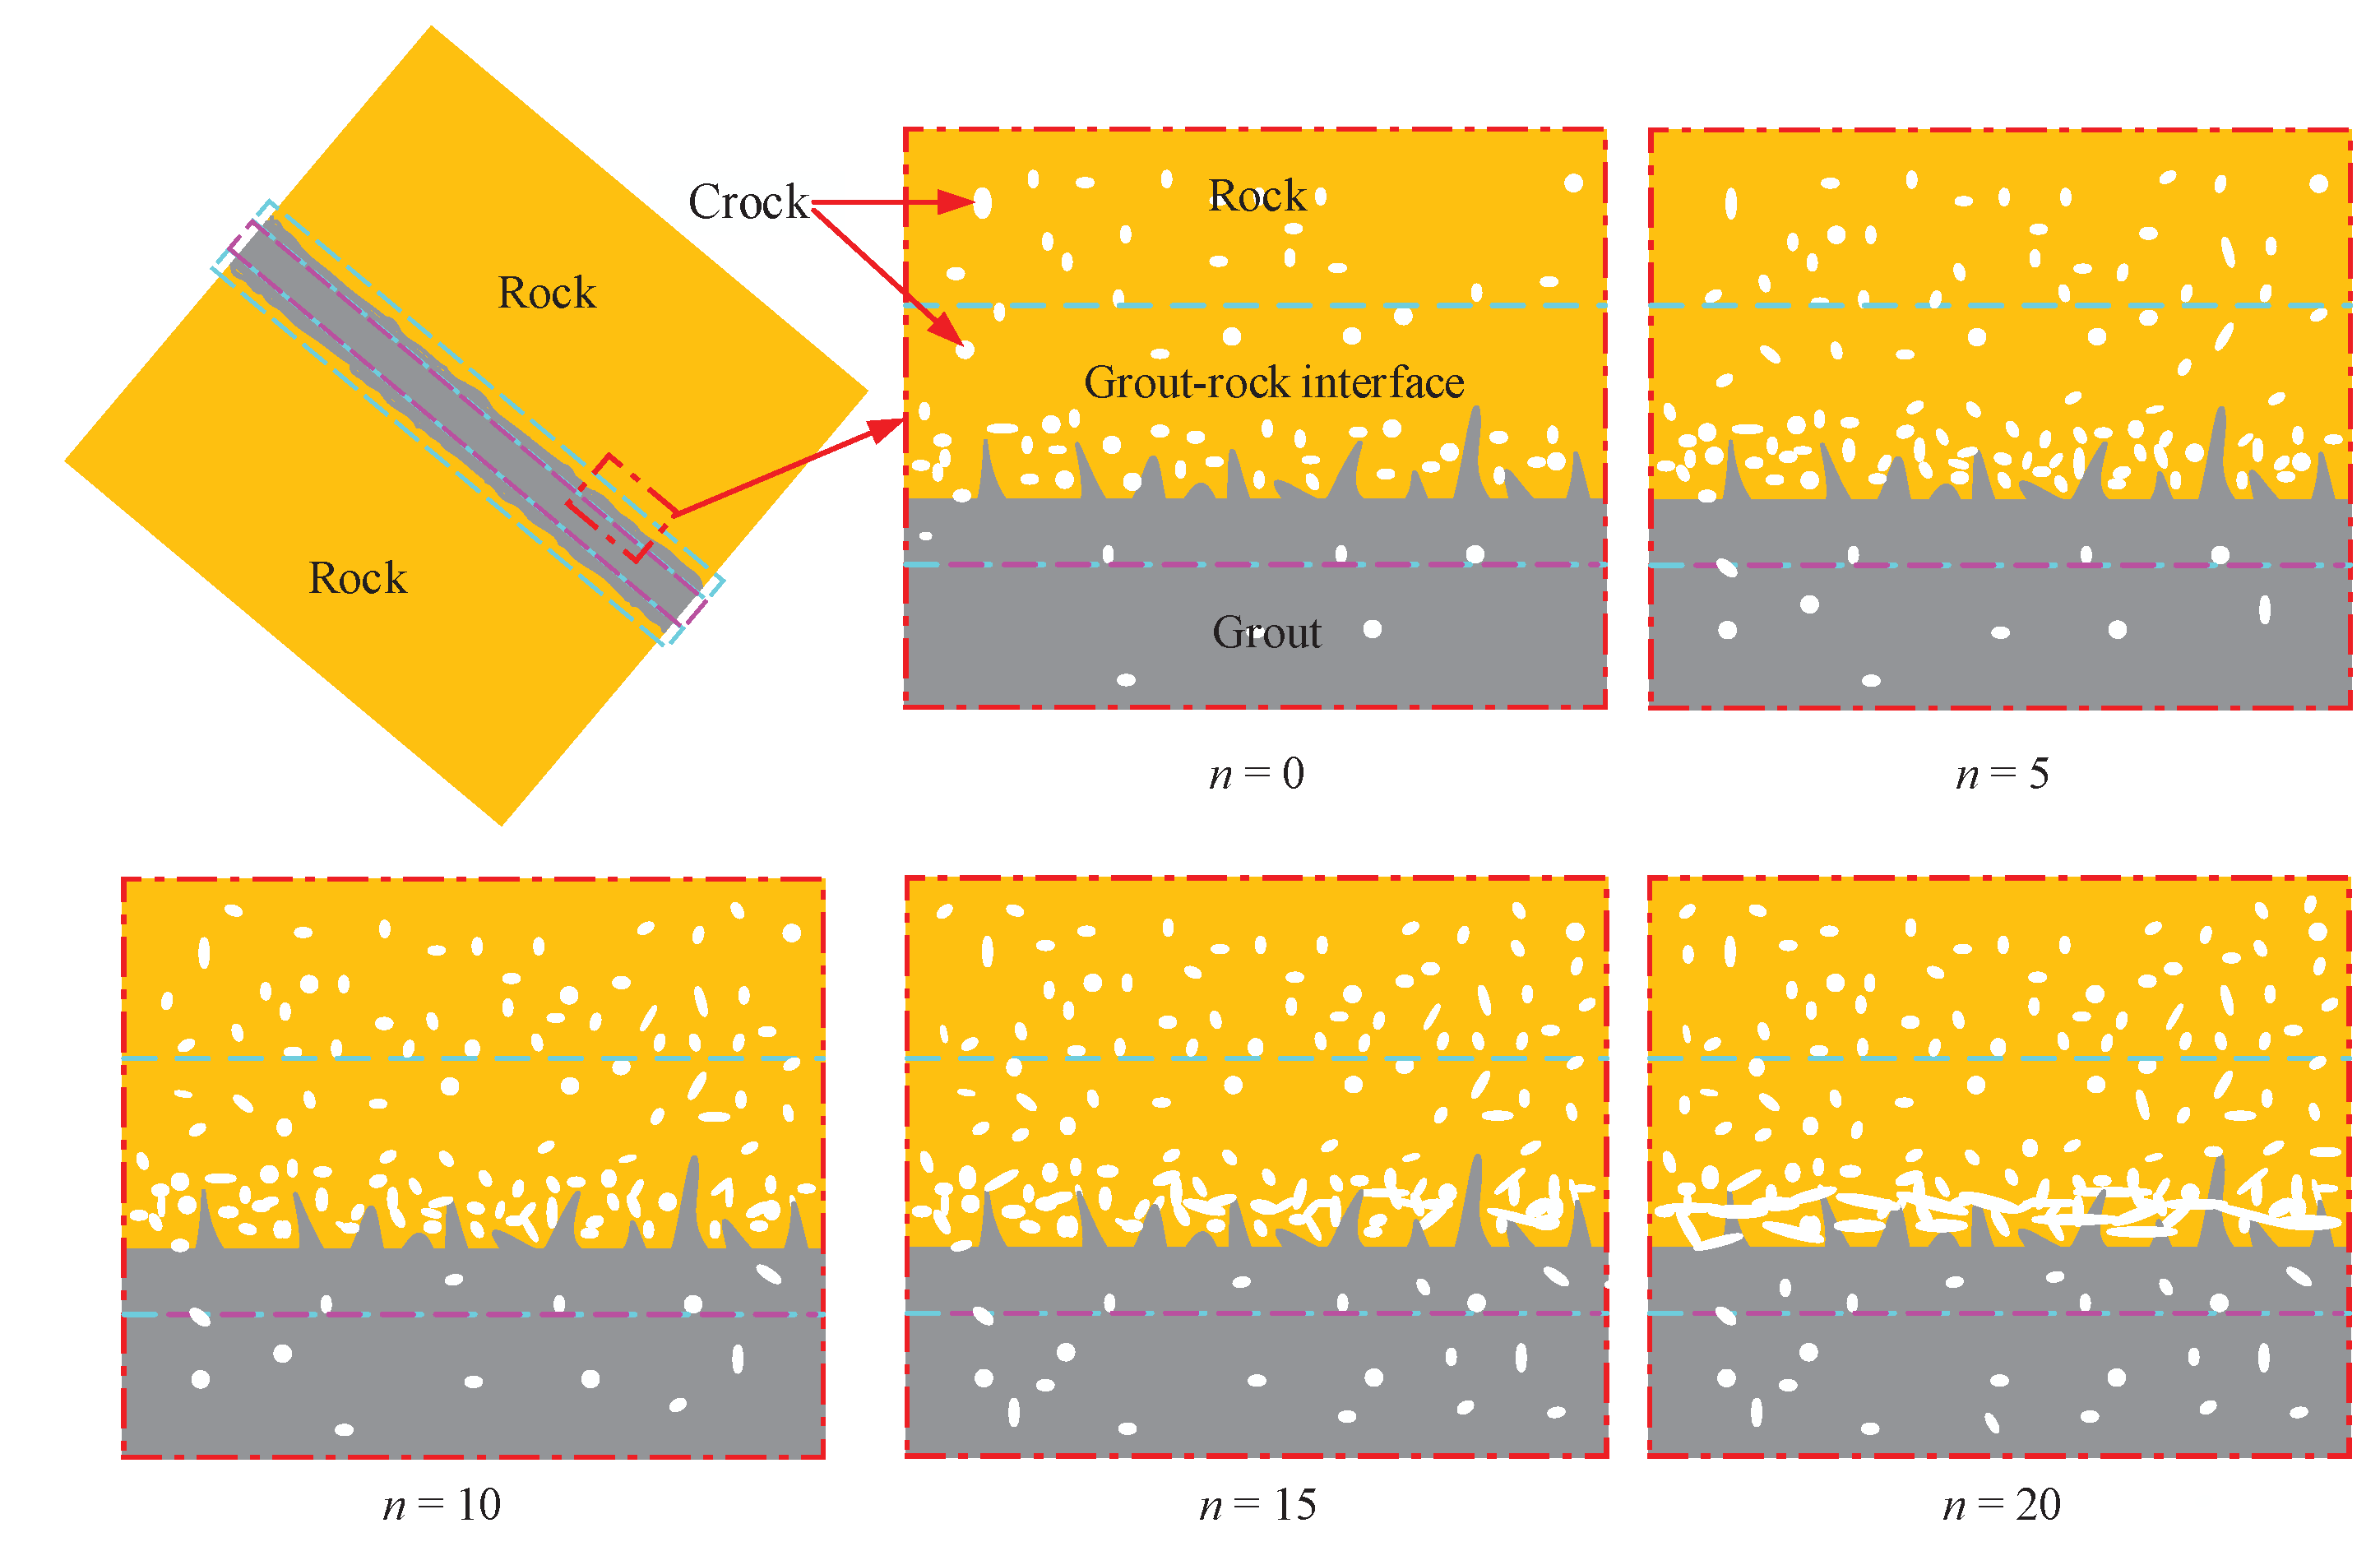
Drawing upon the observed F-T deterioration law and the micro-pore evolution law at the slurry-rock interface layer of the grouting consolidation body,
Figure 14 illustrates the micro-pore evolution diagram of the mortar-rock interface of the specimen throughout the F-T process.
The impact of F-T cycles on the mortar-rock interface varies significantly among the three types of filling mortar due to different proportions of aeolian sand (AS). For Group A, which contains no AS, the intrusion of river sand and yellow sandstone pores is weakest due to the large particle size, resulting in the weakest bonding strength at the mortar-rock interface layer. Consequently, this layer is most susceptible to crack formation and expansion.
In Group B, with a 15% AS proportion, the rounded surface and smaller particle size distribution of AS contribute to a 'ball' effect. This reduces friction between the slurry and aggregate during concrete formation, decreases the lubrication water required, enhances slurry fluidity, and facilitates slurry infiltration into sandstone pores. Consequently, the bond strength of the slurry-rock interface layer is higher, and its resistance to F-T cycle damage is stronger than in Group A specimens.
For Group C, with an optimal 30% AS proportion, the mortar effectively penetrates the fractured surface of yellow sandstone and densely cements the sandstone crystal particles. Additionally, the porosity within the mortar particles decreases, reducing the amount of slurry needed to fill pores and increasing the amount available to coat the aggregate, thereby enhancing the mortar's compactness.
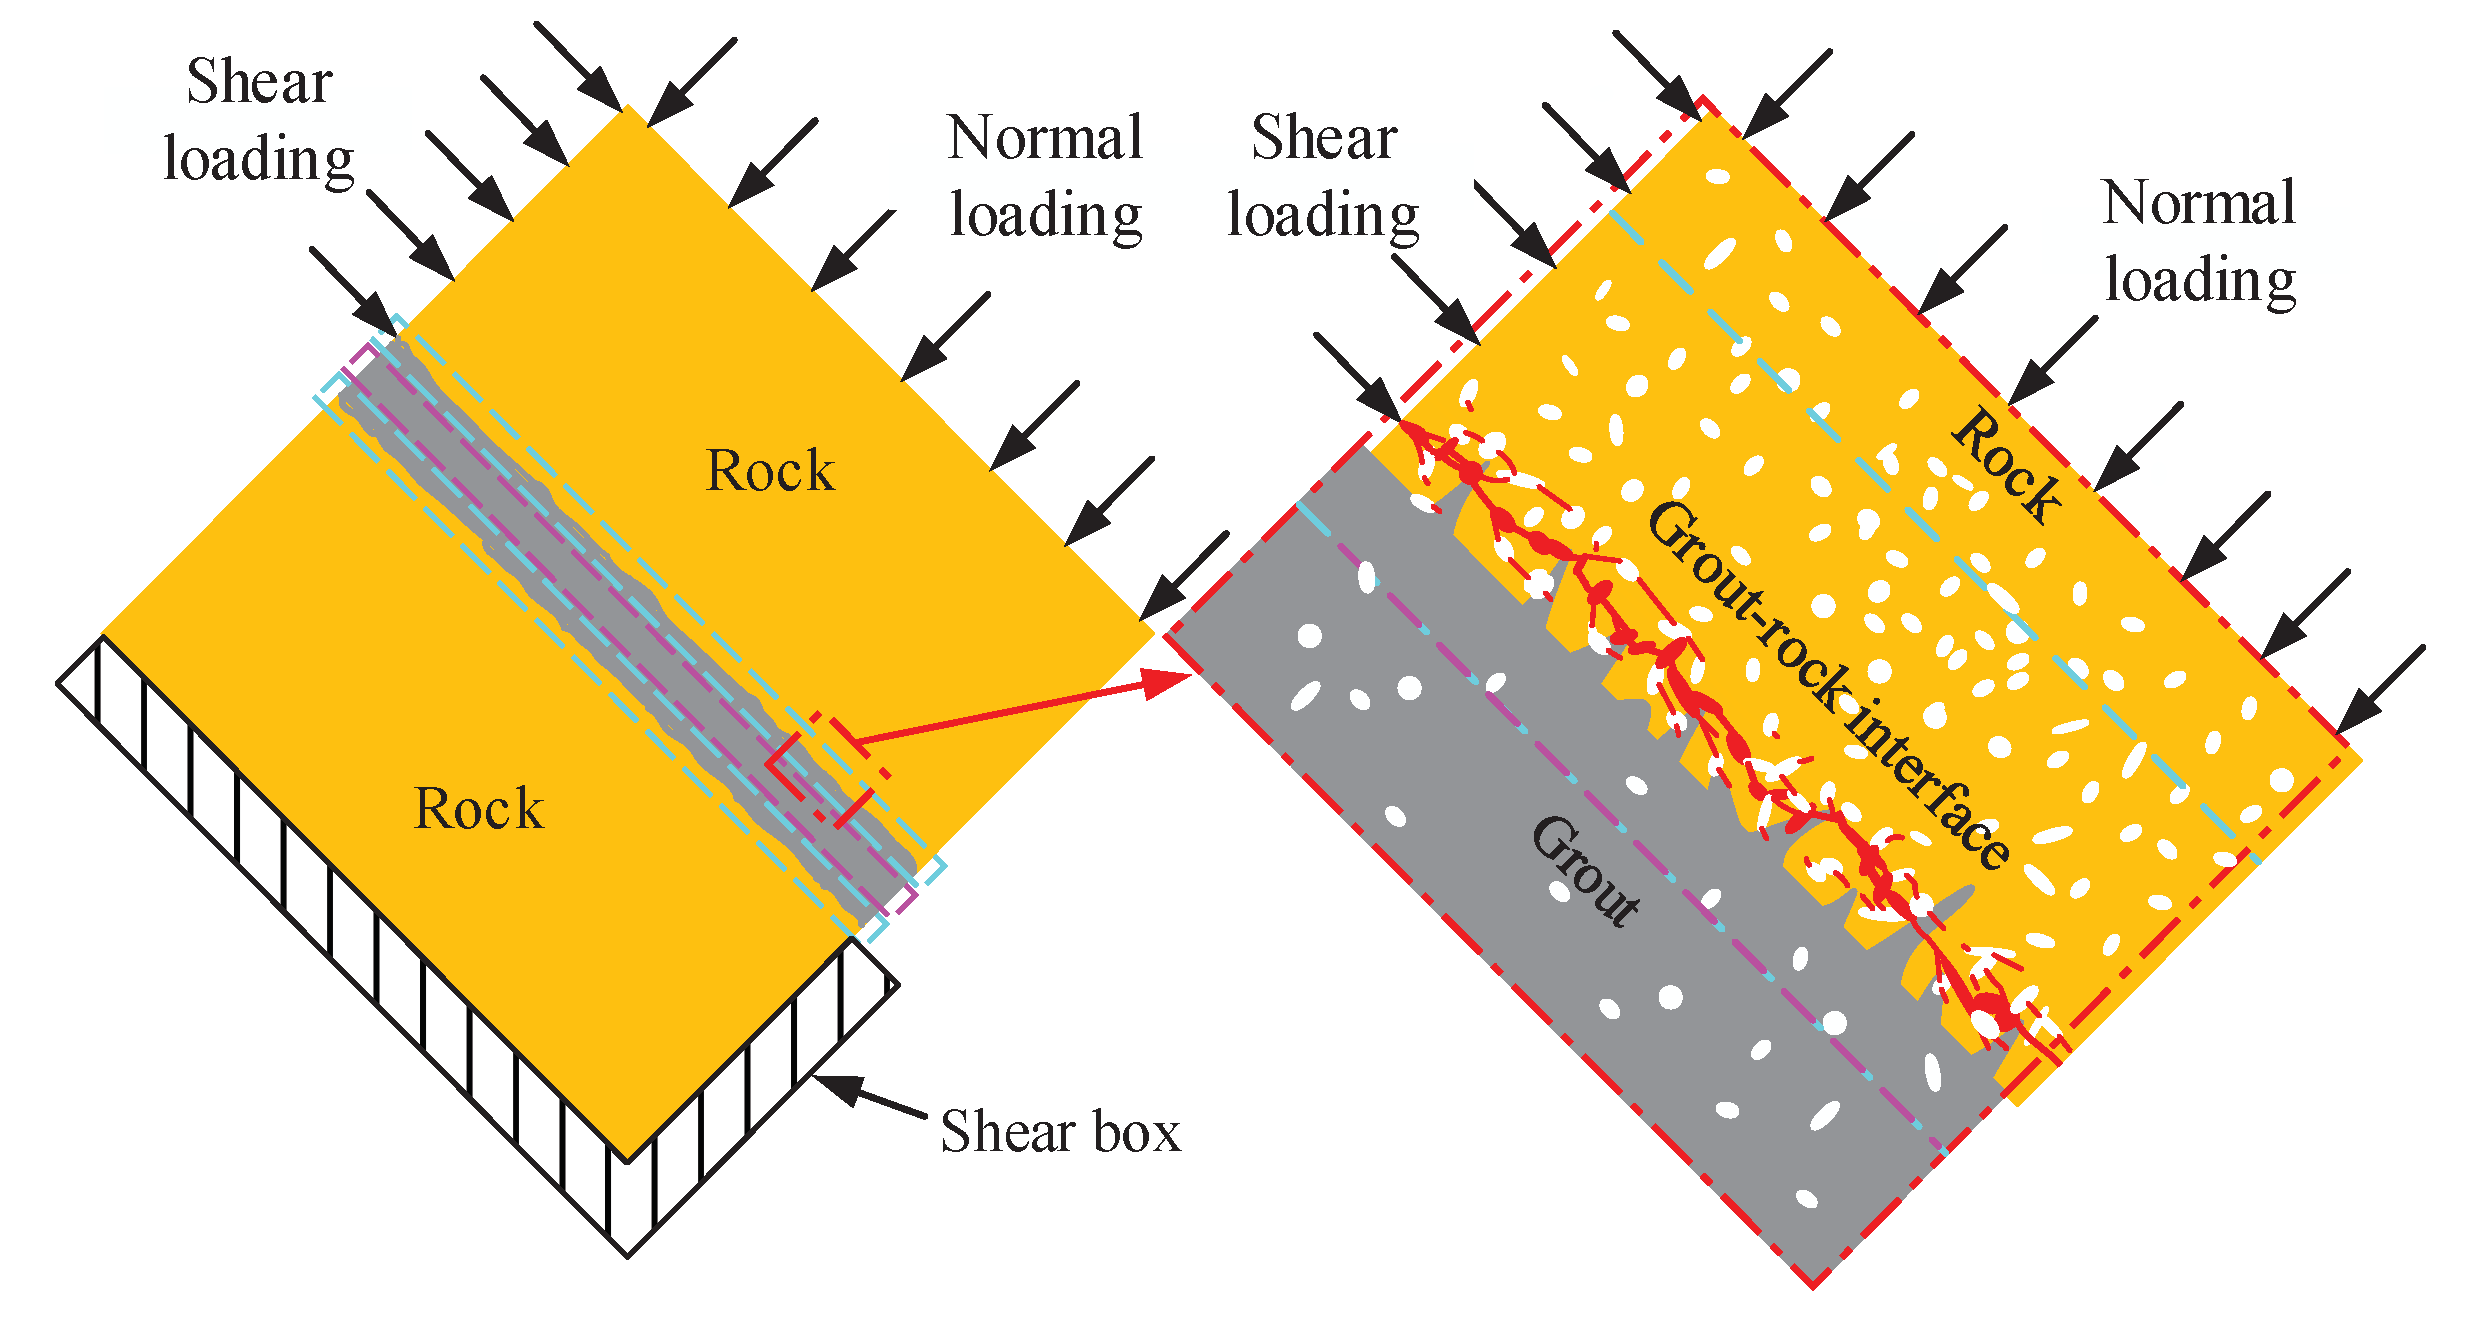
4.2. Shear Failure Mechanism of F-T Damage of Mortar-Rock Interface
Figure 15 illustrates the shear failure mechanism of the mortar-rock interface under F-T cycles. As F-T cycles persist, initial and newly formed pores within the mortar-rock interface layer continue to develop and expand, gradually leading to damage and deterioration. Under the combined action of normal and shear stresses, micro-pores within this layer are susceptible to micro-cracking at their tips, which then connect with adjacent cracks, forming micro-crack surfaces. These micro-crack surfaces propagate along the pore-rich mortar-rock interface, evolving into macro-cracks. Macro-cracks initiate at the stress-concentrated end of the mortar-rock interface layer. The macroscopic F-T cracks within the layer, along with the micro-crack surfaces under normal and shear stress, influence the propagation path of the macro-crack, ultimately leading to shear failure of the grouting consolidation body along the slurry-rock interface layer.
4.3. Strengths and Limitations
In summary, this study aims to incorporate the principles of clean production and enhance the stability of geotechnical engineering in cold regions. Rock slope deformation and failure in such environments are often triggered by F-T cycles, including relaxation, tension, and collapse. Leveraging the low cost and accessibility of AS, we designed and prepared a filling mortar material, substituting AS for a portion of river sand. This innovation not only strengthened the F-T jointed fissure slope but also reduced reinforcement costs and promoted clean production in geotechnical engineering. Although our findings indicate that an appropriate AS proportion enhances frost resistance and shear performance in mortar filling materials, there are limitations. Firstly, the range of AS proportions explored is limited, and further research into advanced clean materials that could replace cement and river sand is crucial. Secondly, durability testing of filling mortar with varying AS proportions is necessary. Finally, factors such as the pH of mixed water and the type of AS remain unexplored and will be addressed in future work.
5. Conclusions
In this study, we employed AS as a substitute for river sand in the aggregate of filling mortar. We delved into the effects of varying AS proportions on the microstructure and shear properties of the mortar-rock interface under F-T cycles. To this end, we conducted F-T cycle tests, NMR tests, and shear tests on filling mortars with different AS proportions. Based on the test results and subsequent analysis, we arrived at the following conclusions:
(1) With increasing F-T cycles, the surface of the filling consolidation body exhibited varying degrees of particle spalling, shedding, and cracking. Under an equal F-T cycles, group A (0% AS proportion) displayed the most severe F-T deterioration at the mortar-rock interface, followed by group B (15% AS proportion), and group C (30% AS proportion) exhibited the least deterioration.
(2) The T2 spectrum curve and total spectrum area changes corroborated our findings from a microscopic perspective, confirming that the mortar-rock interface with a 30% AS proportion exhibited the strongest F-T resistance, followed by the 15% AS proportion mortar, and the ordinary mortar showed the weakest resistance.
(3) The shear strength and stiffness of mortars with different AS proportions decreased with increasing F-T cycles. Under an equal F-T cycles, group C (30% AS proportion) exhibited the highest shear strength and shear stiffness, followed by group B (15% AS proportion), and group A (0% AS proportion) showed the lowest values.
(4) When the proportion of AS reaches 30%, an optimal proportion is achieved. On one hand, the integration of AS facilitates the mortar's infiltration into the fracture surface of yellow sandstone, effectively cementing the sandstone crystal particles in a compact manner. On the other hand, it minimizes the pore volume within the mortar particles, reducing the need for slurries to fill pores and increasing the amount used to coat the aggregate. This, in turn, enhances the mortar's compactness. Consequently, both the shear deformation resistance and F-T resistance of the mortar-rock interface are significantly improved.
Author Contributions
Conceptualization, Y.L. and H. Z.; Methodology, S.C.; Validation, Y.L., S.C. J.Z. and H. Z.; Formal analysis, H. Z.; Investigation, J.Z.; Resources, Y.L., S.C. J.Z. and H. Z.; Data curation, Y.L. and S.C.; Writing original draft, Y.L. and H. Z.; Writing review, S.C.; Supervision, H. Z.; funding acquisition, H. Z. All authors have read and agreed to the published version of the manuscript.
Funding
Please add: This research was funded by the National Natural Science Foundation of China, grant number 12172280 and 52274139.
Institutional Review Board Statement
Not applicable.
Informed Consent Statement
Not applicable.
Data Availability Statement
The data presented in this study are available on request from the corresponding author.
Conflicts of Interest
The authors declare no conflict of interest.
References
- Yue, J.; Ma, C.; Zhao, L.; Kong, Q.; Xu, X.; Wang, Z.; Chen, Y. Study on Deterioration of Gray Brick with Different Moisture Contents under Freeze–Thaw Environment. Materials 2022, 15, 1819. [Google Scholar] [CrossRef] [PubMed]
- Li, W.; Liu, H.; Zhu, B.; Lyu, X.; Gao, X.; Liang, C. Mechanical Properties and Freeze–Thaw Durability of Basalt Fiber Reactive Powder Concrete. Appl. Sci. 2020, 10, 5682. [Google Scholar] [CrossRef]
- Zhang, X.; Jin, J.; Liu, X.; Wang, Y.; Li, Y. Study on the Influence of Saturation on Freeze–Thaw Damage Characteristics of Sandstone. Materials 2023, 16, 2309. [Google Scholar] [CrossRef] [PubMed]
- Gołaszewski, J.; Gołaszewska, M.; Cygan, G. Performance of Ordinary and Self-Compacting Concrete with Limestone after Freeze–Thaw Cycles. Buildings 2022, 12, 2003. [Google Scholar] [CrossRef]
- Liu, Q.; Huang, J.; Zhang, Z.; Liu, G.; Jiang, Q.; Liu, L.; Khan, I. Effect of Freeze–Thaw Cycles on the Shear Strength of Root-Soil Composite. Materials 2024, 17, 285. [Google Scholar] [CrossRef] [PubMed]
- Gao, H.; Lu, J.; Zhang, Z.; Li, C.; Li, Y. Experimental Study on the Effect of Freeze-Thaw Cycles on the Mechanical and Permeability Characteristics of Coal. Sustainability 2023, 15, 12598. [Google Scholar] [CrossRef]
- Jia, P.; Mao, S.; Qian, Y.; Wang, Q.; Lu, J. The Dynamic Compressive Properties and Energy Dissipation Law of Sandstone Subjected to Freeze–Thaw Damage. Water 2022, 14, 3632. [Google Scholar] [CrossRef]
- Li, Y.; Zhai, Y.; Liang, W.; Li, Y.; Dong, Q.; Meng, F. Dynamic Mechanical Properties and Visco-Elastic Damage Constitutive Model of Freeze–thawed Concrete. Materials 2020, 13, 4056. [Google Scholar] [CrossRef] [PubMed]
- Tang, L.; Li, G.; Luo, T.; Jin, L.; Yu, Y.; Sun, Q.; Li, G. Mechanism of shear strength deterioration of soil-rock mixture after freeze–thaw cycles. Cold Reg. Sci. Technol. 2022, 200. [Google Scholar] [CrossRef]
- Lian, S.; Zheng, K.; Zhao, Y.; Bi, J.; Wang, C.; Huang, Y.S. Investigation the effect of freeze–thaw cycle on fracture mode classification in concrete based on acoustic emission parameter analysis. Constr. Build. Mater. 2023, 362. [Google Scholar] [CrossRef]
- Mateos, R.M.; García-Moreno, I.; Azañón, J.M. Freeze–thaw cycles and rainfall as triggering factors of mass movements in a warm Mediterranean region: the case of the Tramuntana Range (Majorca, Spain). Landslides 2011, 9, 417–432. [Google Scholar] [CrossRef]
- Sari, M.; Yilmaz, E.; Kasap, T. Long-term ageing characteristics of cemented paste backfill: Usability of sand as a partial substitute of hazardous tailings. J. Clean. Prod. 2023, 401. [Google Scholar] [CrossRef]
- Gao, J.; Xu, C.; Xi, Y.; Fan, L. Degradation of Mechanical Behavior of Sandstone under Freeze-Thaw Conditions with Different Low Temperatures. Appl. Sci. 2021, 11, 10653. [Google Scholar] [CrossRef]
- Kong, X.; Cui, S.; Wang, G.; Hu, W.; Liang, Y.; Zhang, Z. Evolution Law and Mechanism of Freeze–Thaw Damage of Cement-Stabilized Weathered Sand. Coatings 2022, 12, 272. [Google Scholar] [CrossRef]
- Bendixen, M.; Best, J.; Hackney, C.; Iversen, L.L. Time is running out for sand. Nature 2019, 571, 29–31. [Google Scholar] [CrossRef] [PubMed]
- Wang, P.; Li, S.; Li, J.; Zhou, H.; Ma, P.; Tian, Y.; Yuan, C.; Feng, X. Seepage behavior and mechanical properties of two kinds of polyurethane/water glass in combined grouting experiment. Tunn. Undergr. Space Technol. 2023, 136. [Google Scholar] [CrossRef]
- Best, J. Anthropogenic stresses on the world’s big rivers. Nat. Geosci. 2019, 12, 7–21. [Google Scholar] [CrossRef]
- Shen, W.; Wu, J.; Du, X.; Li, Z.; Wu, D.; Sun, J.; Wang, Z.; Huo, X.; Zhao, D. Cleaner production of high-quality manufactured sand and ecological utilization of recycled stone powder in concrete. J. Clean. Prod. 2022, 375. [Google Scholar] [CrossRef]
- Shen, W.; Liu, Y.; Wang, Z.; Cao, L.; Wu, D.; Wang, Y.; Ji, X. Influence of manufactured sand’s characteristics on its concrete performance. Constr. Build. Mater. 2018, 172, 574–583. [Google Scholar] [CrossRef]
- Xu, W.; Wen, X.; Wei, J.; Xu, P.; Zhang, B.; Yu, Q.; Ma, H. Feasibility of kaolin tailing sand to be as an environmentally friendly alternative to river sand in construction applications. J. Clean. Prod. 2018, 205, 1114–1126. [Google Scholar] [CrossRef]
- Xiao, J.; Qiang, C.; Nanni, A.; Zhang, K. Use of sea-sand and seawater in concrete construction: Current status and future opportunities. Constr. Build. Mater. 2017, 155, 1101–1111. [Google Scholar] [CrossRef]
- Singh, S.; Nagar, R.; Agrawal, V. A review on Properties of Sustainable Concrete using granite dust as replacement for river sand. J. Clean. Prod. 2016, 126, 74–87. [Google Scholar] [CrossRef]
- Liu, Q.; Zhang, Q.; Yan, Y.; Zhang, X.; Niu, J.; Svenning, J.-C. Ecological restoration is the dominant driver of the recent reversal of desertification in the Mu Us Desert (China). J. Clean. Prod. 2020, 268, 122241. [Google Scholar] [CrossRef]
- Zhang, M.; Zhu, X.; Shi, J.; Liu, B.; He, Z.; Liang, C. Utilization of desert sand in the production of sustainable cement-based materials: A critical review. Constr. Build. Mater. 2022, 327, 127014. [Google Scholar] [CrossRef]
- Torres, A.; Simoni, M.U.; Keiding, J.K.; Müller, D.B.; zu Ermgassen, S.O.; Liu, J.; Jaeger, J.A.; Winter, M.; Lambin, E.F. Sustainability of the global sand system in the Anthropocene. One Earth 2021, 4, 639–650. [Google Scholar] [CrossRef]
- Elipe, M.G.; López-Querol, S. Aeolian sands: Characterization, options of improvement and possible employment in construction – The State-of-the-art. Constr. Build. Mater. 2014, 73, 728–739. [Google Scholar] [CrossRef]
- Padmakumar, G.; Srinivas, K.; Uday, K.; Iyer, K.; Pathak, P.; Keshava, S.; Singh, D. Characterization of aeolian sands from Indian desert. Eng. Geol. 2012, 139-140, 38–49. [Google Scholar] [CrossRef]
- Abu Seif, E.-S.S. Assessing the engineering properties of concrete made with fine dune sands: an experimental study. Arab. J. Geosci. 2011, 6, 857–863. [Google Scholar] [CrossRef]
- Zhang, G.; Song, J.; Yang, J.; Liu, X. Performance of mortar and concrete made with a fine aggregate of desert sand. J. Affect. Disord. 2006, 41, 1478–1481. [Google Scholar] [CrossRef]
- Al-Harthy, A.; Halim, M.A.; Taha, R.; Al-Jabri, K. The properties of concrete made with fine dune sand. Constr. Build. Mater. 2007, 21, 1803–1808. [Google Scholar] [CrossRef]
- Li, Y.; Zhang, H.; Liu, G.; Hu, D.; Ma, X. Multi-scale study on mechanical property and strength prediction of aeolian sand concrete. Constr. Build. Mater. 2020, 247, 118538. [Google Scholar] [CrossRef]
- Luo, F.J.; He, L.; Pan, Z.; Duan, W.H.; Zhao, X.L.; Collins, F. Effect of very fine particles on workability and strength of concrete made with dune sand. Constr. Build. Mater. 2013, 47, 131–137. [Google Scholar] [CrossRef]
- Dong, W.; Shen, X.-D.; Xue, H.-J.; He, J.; Liu, Y. Research on the freeze-thaw cyclic test and damage model of Aeolian sand lightweight aggregate concrete. Constr. Build. Mater. 2016, 123, 792–799. [Google Scholar] [CrossRef]
- Li, G.F.; Shen, X.D. A Study of the deterioration law and mechanism of aeolian-sand powder concrete in the coupling environments of freeze-thaw and carbonization. J. Ceram. Soc. Jpn. 2019, 127, 551–563. [Google Scholar] [CrossRef]
- Bai, J.; Zhao, Y.; Shi, J.; He, X. Cross-scale Study on the Mechanical Properties and Frost Resistance Durability of Aeolian Sand Concrete. KSCE J. Civ. Eng. 2021, 25, 4386–4402. [Google Scholar] [CrossRef]
- Zou, Y.; Shen, X.; Zuo, X.; Xue, H.; Li, G. Experimental study on microstructure evolution of aeolian sand concrete under the coupling freeze–thaw cycles and carbonation. Eur. J. Environ. Civ. Eng. 2020, 26, 1267–1282. [Google Scholar] [CrossRef]
- Bai, J.; Zhao, Y.; Shi, J.; He, X. Damage degradation model of aeolian sand concrete under freeze–thaw cycles based on macro-microscopic perspective. Constr. Build. Mater. 2022, 327, 126885. [Google Scholar] [CrossRef]
- Li, Y.; Zhang, H.; Chen, S.; Wang, H.; Liu, G. Multi-scale study on the durability degradation mechanism of aeolian sand concrete under freeze–thaw conditions. Constr. Build. Mater. 2022, 340. [Google Scholar] [CrossRef]
- Li, Y.; Zhang, H.; Chen, S.; Wang, H.; Liu, X.; Gao, W. Influence of Aeolian Sand on Capillary Water Absorption of Concrete Under Freeze–Thaw Conditions. Int. J. Concr. Struct. Mater. 2023, 17, 1–17. [Google Scholar] [CrossRef]
- JGJ52-2011. Specification for mix proportion design of ordinary concrete. JGJ52-2011 2011, 17, 16. [CrossRef]
- ASTMC33/C33M-13. Standard specification for concrete aggregates. 2013, 17, 16. [CrossRef]
- BS882. British standard specification for aggregates from natural sources. 1992, 17, 16. [CrossRef]
- Lan, Y.; Gao, H.; Zhao, Y. Pore Structure Characteristics and Strength Variation of Red Sandstone under Freeze–Thaw Cycles. Materials 2022, 15, 3856. [Google Scholar] [CrossRef] [PubMed]
- Xiao, Y.; Deng, H.; Tian, G.; Yu, S. Analysis of Microscopic Pore Characteristics and Macroscopic Energy Evolution of Rock Materials under Freeze-Thaw Cycle Conditions. Mathematics 2023, 11, 710. [Google Scholar] [CrossRef]
Figure 1.
F-T damage diagram of alpine rock slope.
Figure 1.
F-T damage diagram of alpine rock slope.
Figure 2.
Alpine rock failure form and slope reinforcement method.
Figure 2.
Alpine rock failure form and slope reinforcement method.
Figure 3.
Gradation curves of testing sand, ASTM and BS standards.
Figure 3.
Gradation curves of testing sand, ASTM and BS standards.
Figure 4.
Specimen preparation.
Figure 4.
Specimen preparation.
Figure 5.
Experimental flow chart.
Figure 5.
Experimental flow chart.
Figure 6.
F-T damage form of mortar-rock interface.
Figure 6.
F-T damage form of mortar-rock interface.
Figure 7.
T2 spectra of slurry-rock interface layers in F-T process.
Figure 7.
T2 spectra of slurry-rock interface layers in F-T process.
Figure 8.
Variation law of cumulative NMR signal strength of three types of specimens.
Figure 8.
Variation law of cumulative NMR signal strength of three types of specimens.
Figure 9.
Evolution of total spectral area and pore size of mortar rock interface of three groups of specimens.
Figure 9.
Evolution of total spectral area and pore size of mortar rock interface of three groups of specimens.
Figure 10.
Curves of specimens with different AS proportions.
Figure 10.
Curves of specimens with different AS proportions.
Figure 11.
The variation law of shear strength of three groups of specimens under F-T cycles.
Figure 11.
The variation law of shear strength of three groups of specimens under F-T cycles.
Figure 12.
The variation law of shear stiffness KS of three groups of specimens under F-T cycles.
Figure 12.
The variation law of shear stiffness KS of three groups of specimens under F-T cycles.
Figure 13.
The τ-ε curves and acoustic emission curve of grouting consolidation body with different slurry types under 10 F-T cycles.
Figure 13.
The τ-ε curves and acoustic emission curve of grouting consolidation body with different slurry types under 10 F-T cycles.
Figure 14.
Micropore evolution diagram of mortar-rock interface layer during F-T process.
Figure 14.
Micropore evolution diagram of mortar-rock interface layer during F-T process.
Figure 15.
Mortar-rock interface layer shear failure diagram.
Figure 15.
Mortar-rock interface layer shear failure diagram.
Table 1.
Physical-mechanical property of cement.
Table 1.
Physical-mechanical property of cement.
Density
(kg·m-3) |
Initial setting-time
(min) |
Final setting-time
(min) |
Compressive strength (MPa) |
Tensile strength (MPa) |
| 3d |
28d |
3d |
28d |
| 3151 |
145 |
210 |
24.1 |
47.3 |
5.0 |
8.6 |
Table 2.
Chemical makeup of cement.
Table 2.
Chemical makeup of cement.
| Composition |
SiO2
|
Al2O3
|
CaO |
Fe2O3
|
K2O |
Others |
| Proportion (%) |
21.5 |
6.0 |
64.3 |
4.3 |
0.7 |
3.2 |
Table 3.
Physical-mechanical property of sand.
Table 3.
Physical-mechanical property of sand.
| Sand name |
River sand |
AS |
| Appearance |
 |
 |
| Bulk density (kg·m-3) |
1556 |
1564 |
| Apparent density (kg·m-3) |
2590 |
2610 |
| Fineness modulus |
2.64 |
0.87 |
| Water (%) |
0.3 |
0.5 |
| Soil (%) |
2 |
1.5 |
Table 4.
Chemical makeup of sands.
Table 4.
Chemical makeup of sands.
| Material |
SiO2 /% |
Al2O3 /% |
CaO /% |
Fe2O3 /% |
MgO /% |
Others |
| River sand |
79.57 |
6.40 |
2.97 |
7.88 |
1.07 |
1.91 |
| AS |
75.85 |
8.02 |
4.79 |
9.22 |
1.15 |
0.97 |
Table 5.
AS mortar mix and the materials consumption.
Table 5.
AS mortar mix and the materials consumption.
| Substitution rate of AS /% |
Cement
/ (kg /m3) |
Water
/ (kg /m3) |
Sand
/ (kg /m3) |
AS
/ (kg /m3) |
Water cement ratio |
| A (0) |
290 |
245 |
155 |
0 |
0.84 |
| B (15) |
290 |
245 |
131.7 |
23.3 |
0.84 |
| C (30) |
290 |
245 |
108.5 |
46.5 |
0.84 |
|
Disclaimer/Publisher’s Note: The statements, opinions and data contained in all publications are solely those of the individual author(s) and contributor(s) and not of MDPI and/or the editor(s). MDPI and/or the editor(s) disclaim responsibility for any injury to people or property resulting from any ideas, methods, instructions or products referred to in the content. |
© 2024 by the authors. Licensee MDPI, Basel, Switzerland. This article is an open access article distributed under the terms and conditions of the Creative Commons Attribution (CC BY) license (http://creativecommons.org/licenses/by/4.0/).

