Submitted:
05 June 2024
Posted:
07 June 2024
You are already at the latest version
Abstract
Keywords:
1. Introduction
2. Materials and Methods
2.1. Materials
2.2. Cell Lines and Culture Conditions
2.3. Uptake Measurement
2.4. Intracellular pH Measurement
2.5. Macropinocytosis Assay
2.6. RT-PCR
2.7. Protein Isolation and Western Blot
2.8. Assays for Lipid Radicals (Ferroptosis) and Iron
2.9. Glutathione and Lipid Peroxidation Assay
2.10. Colony-Formation Assay
2.11. MTT Assay
2.12. Chromatin-Immunoprecipitation (ChIP) Assay
2.13. Assay for Reactive Oxygen Species (ROS) with 2’,7’-Dichlorodihydrofluorescein Diacetate Staining
2.14. Statistics
3. Results
3.1. Origin and Genetic Background of Colon Cancer Cell Lines Used in This Study
3.2. Impact of p53 Deletion and KRAS-G12D Mutation on SLC38A5 Expression and Function
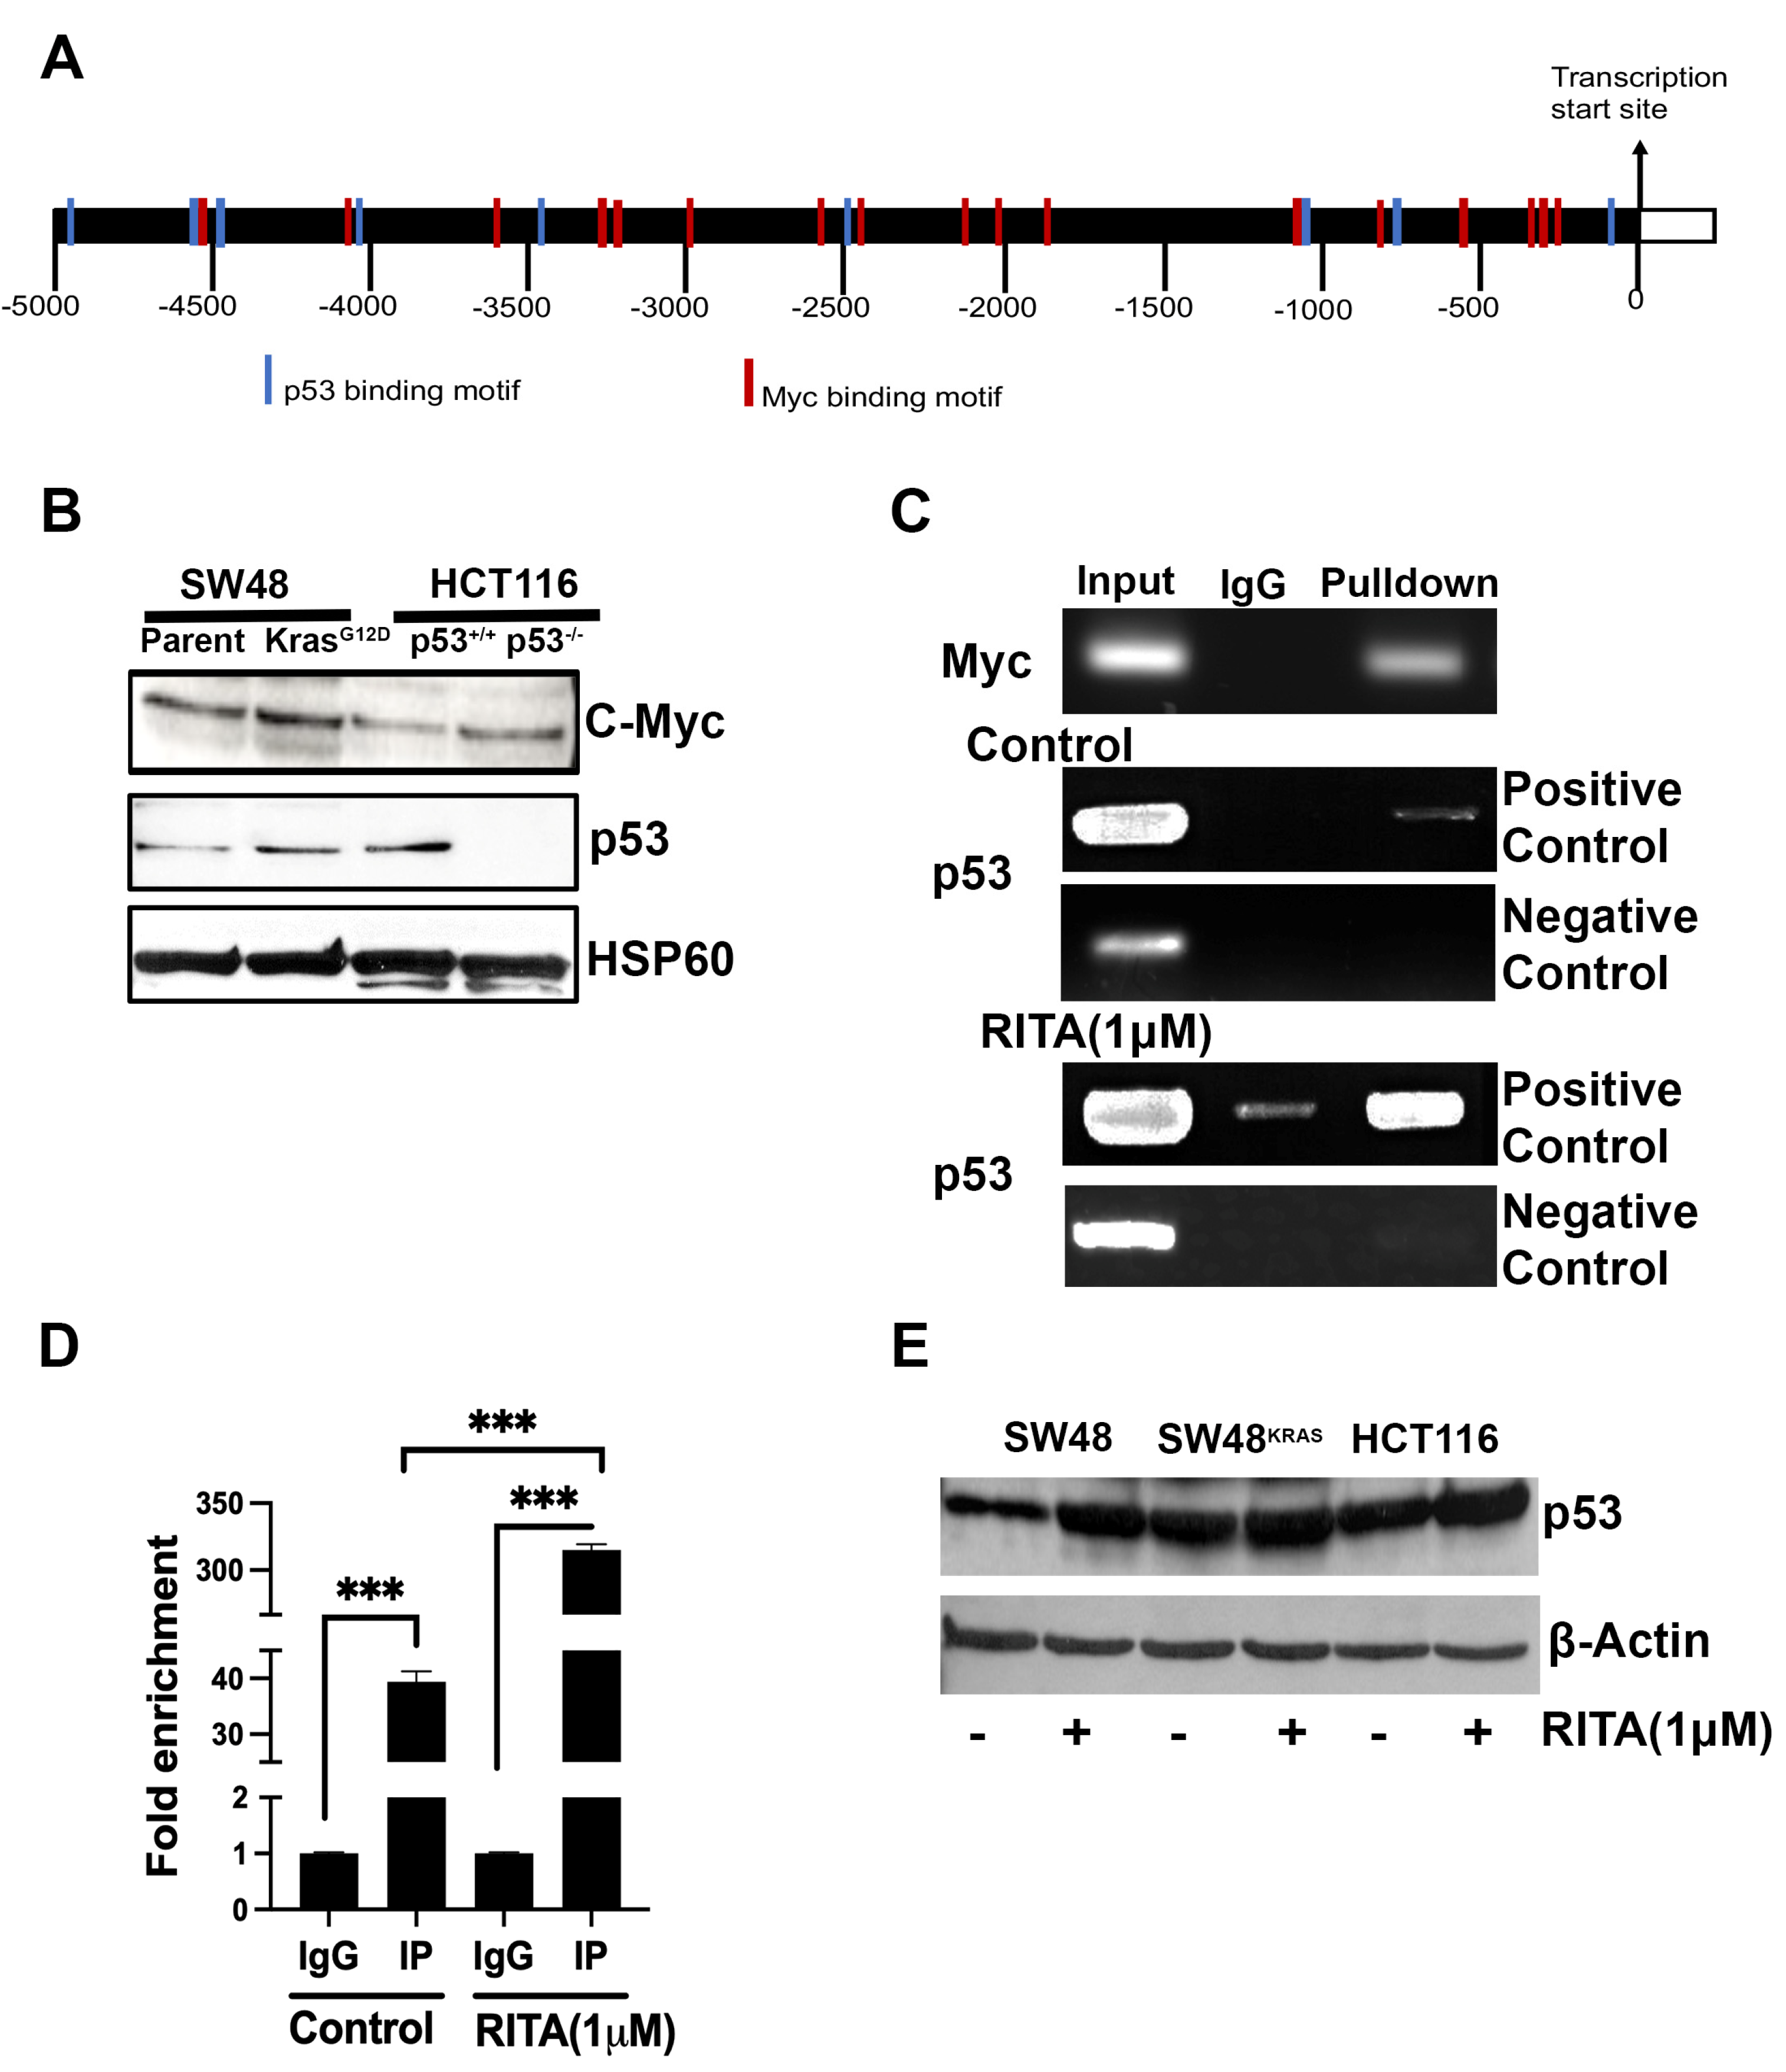
3.3. Interaction of p53 and Myc with SLC38A5 Promoter
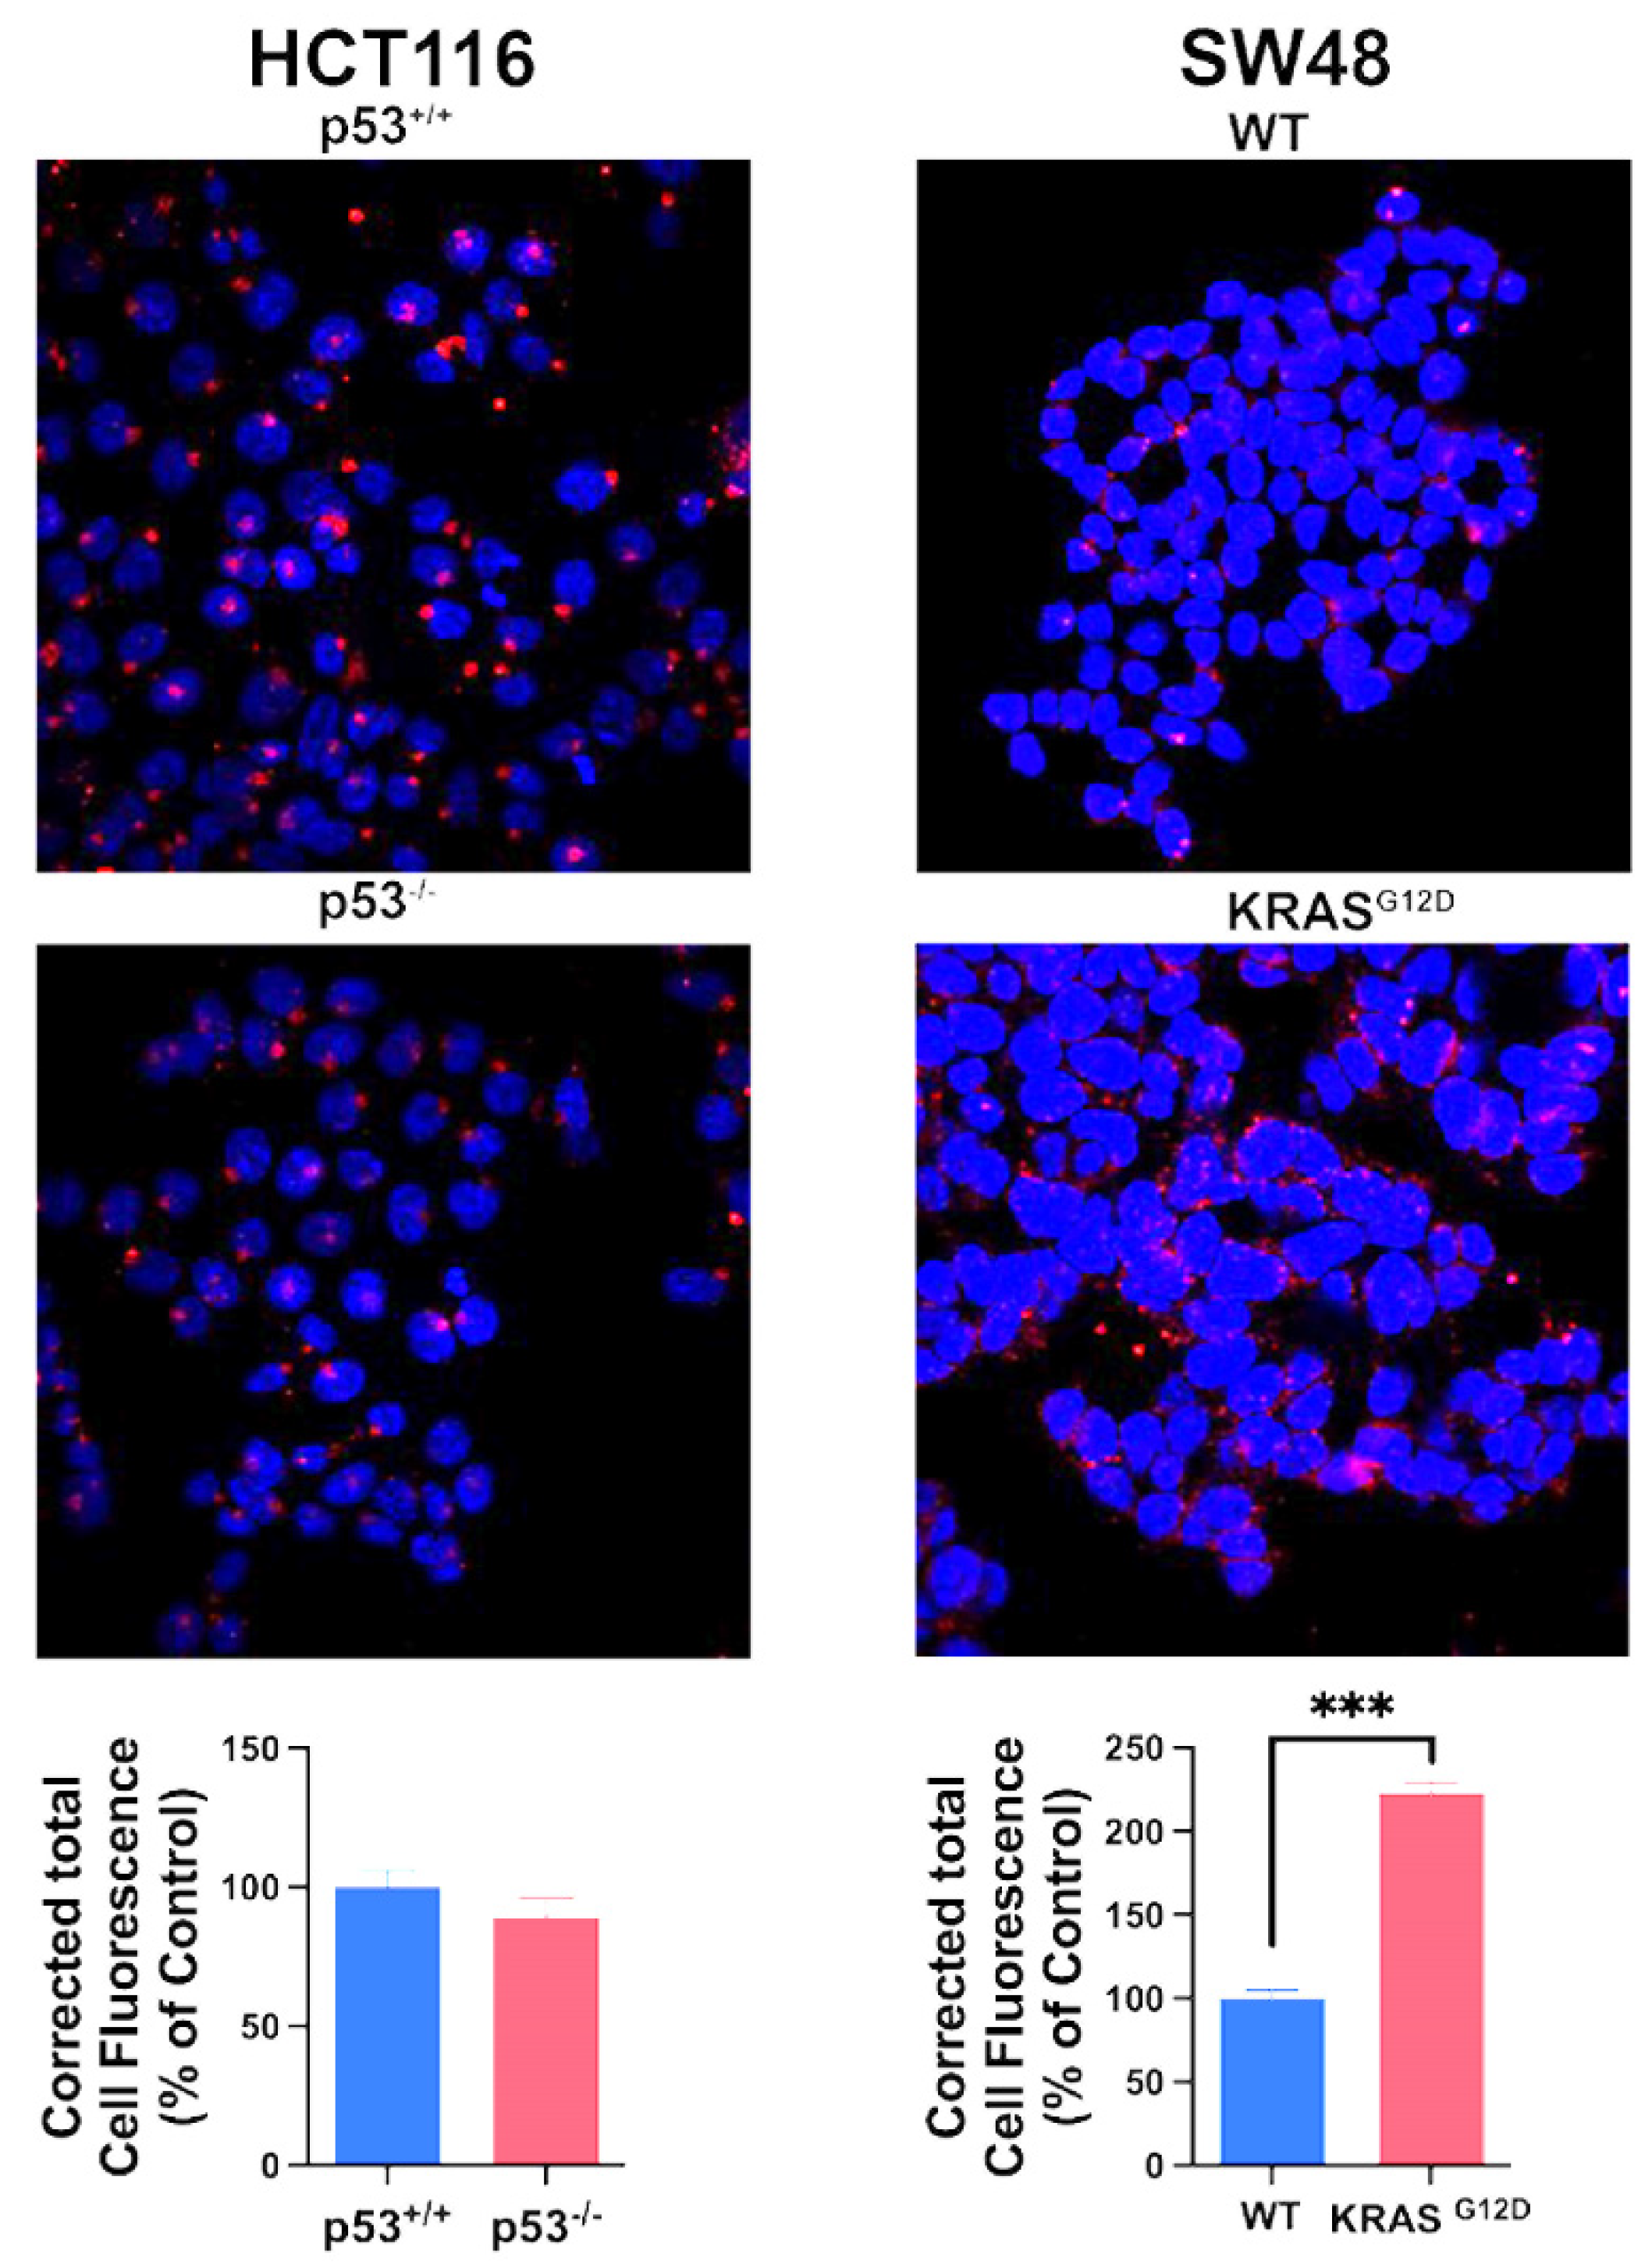
3.4. Impact of p53 Deletion and KRAS Mutation on Macropinocytosis
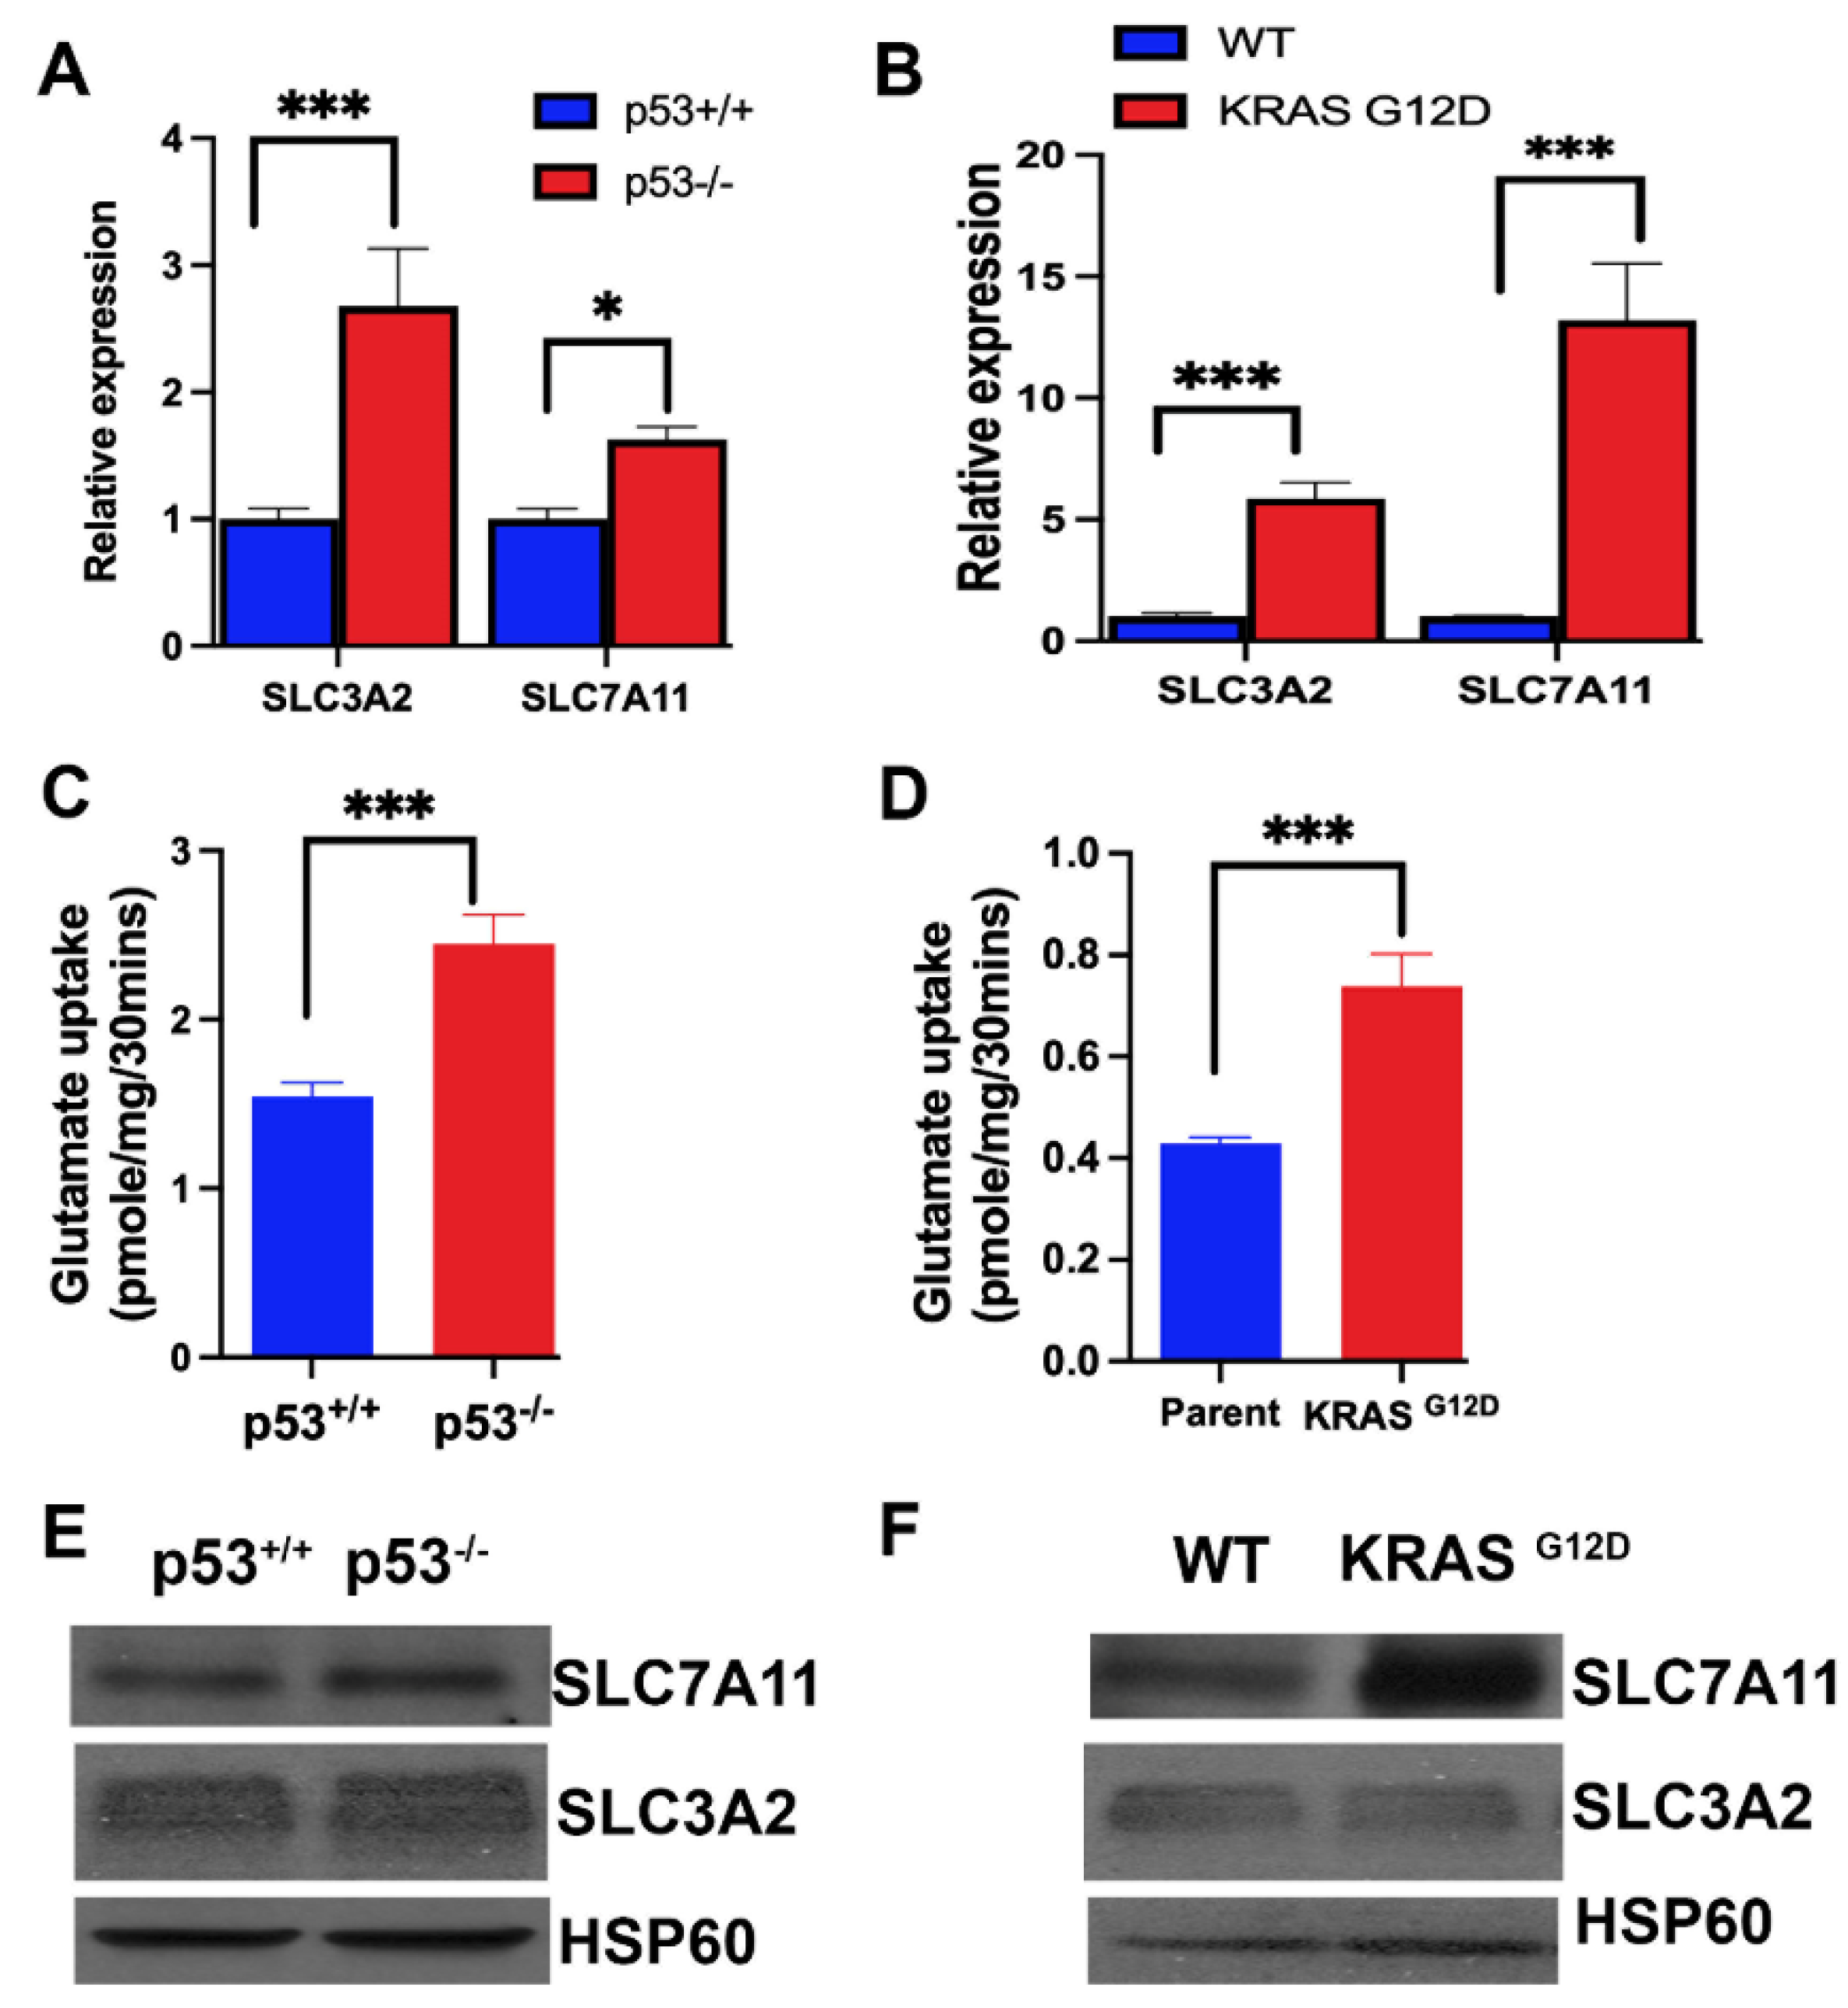
3.5. Influence of p53 Deletion and KRAS Mutation on the Expression and Function of SLC7A11
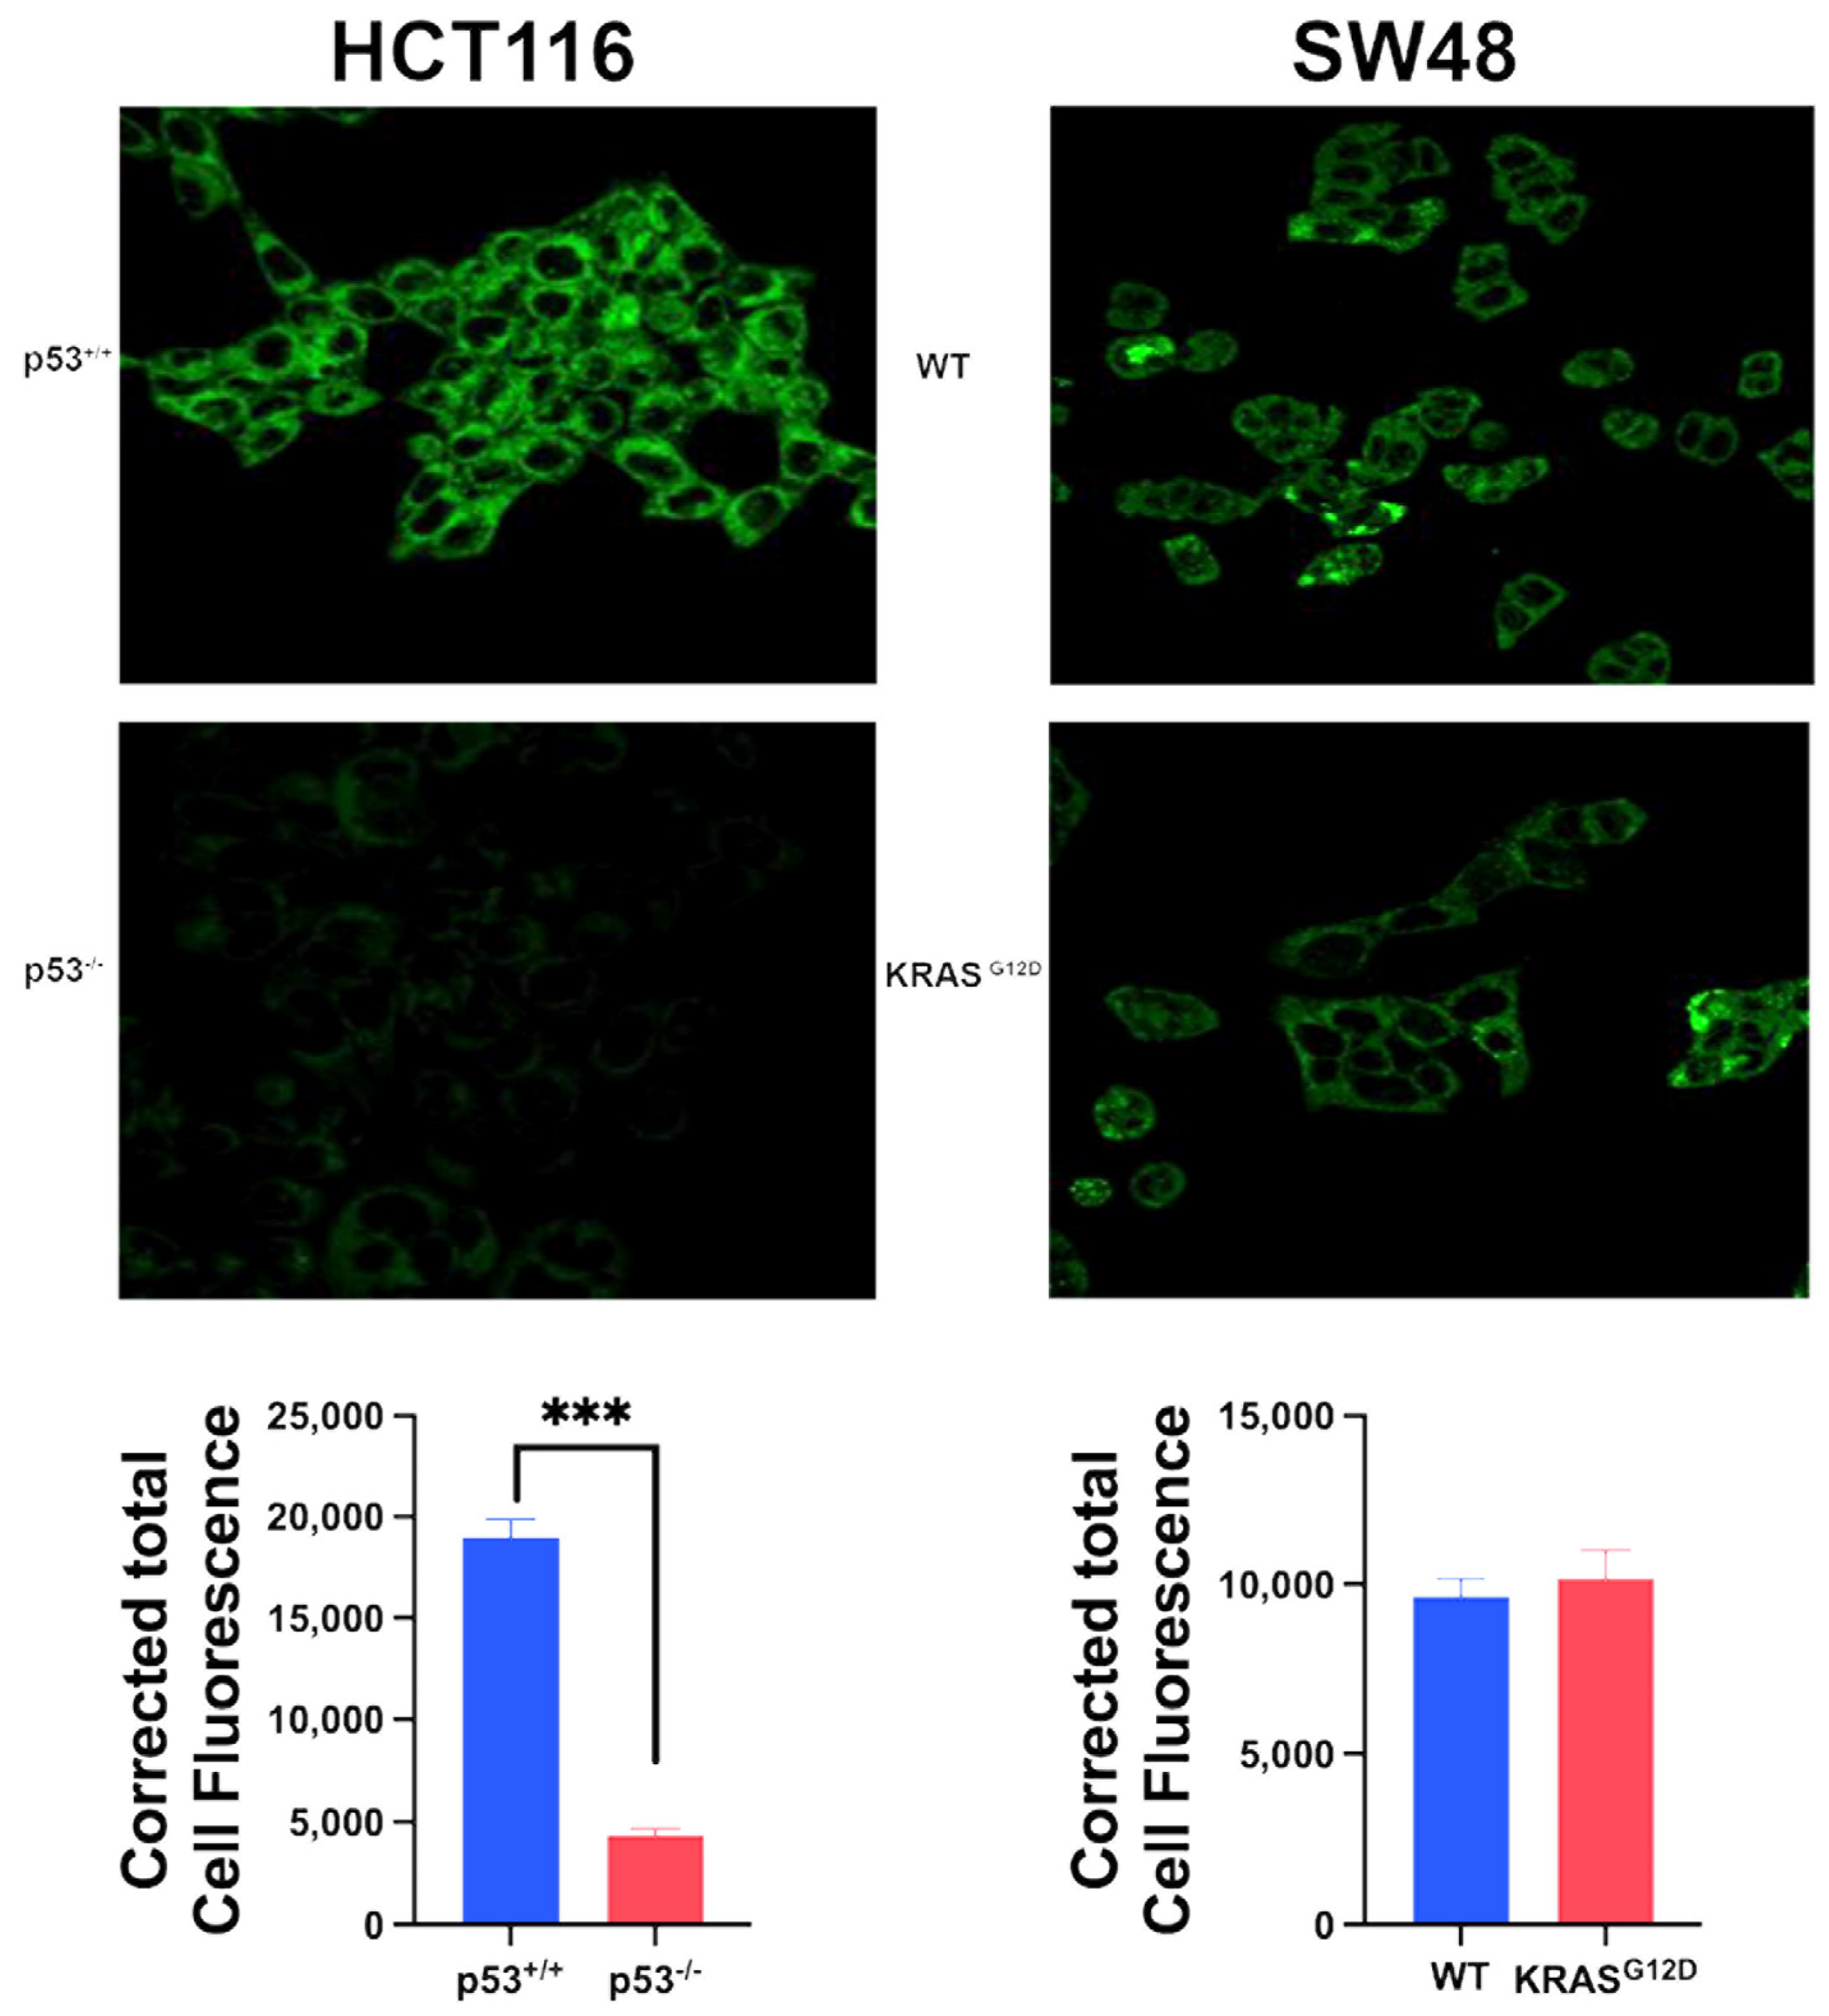
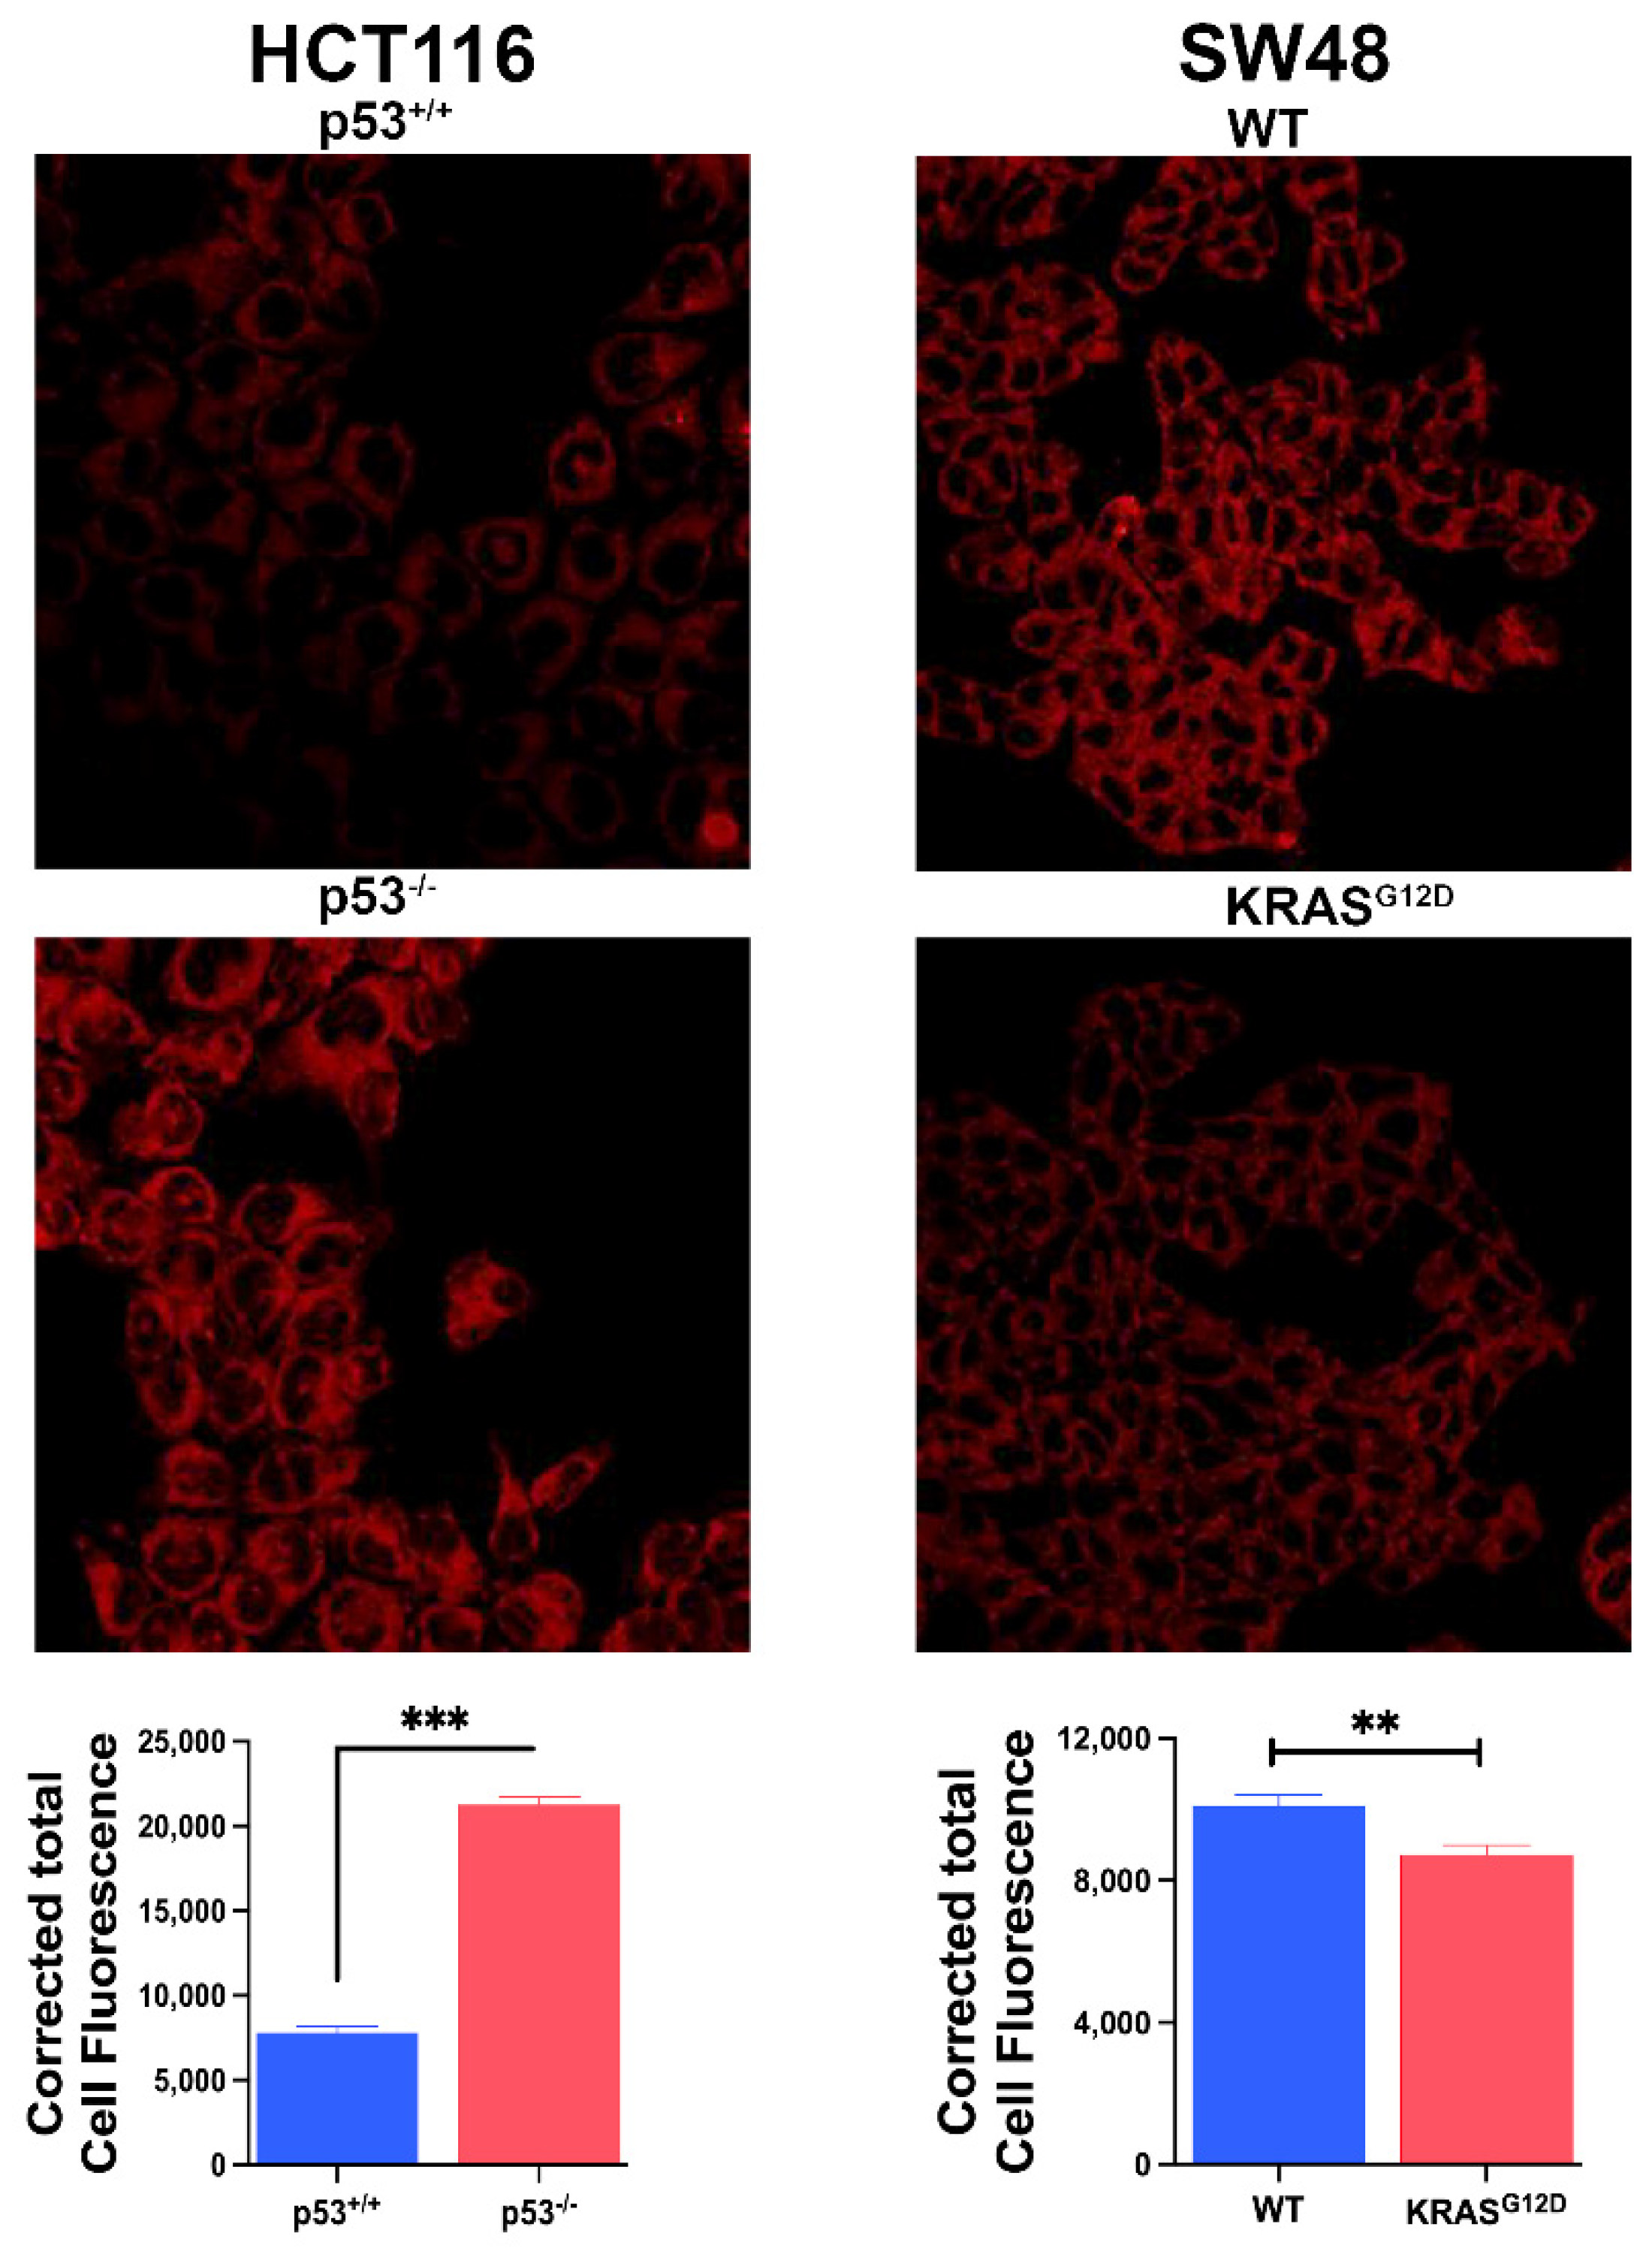
3.6. Impact of p53 Deletion and KRAS-G12D Mutation on Ferroptosis
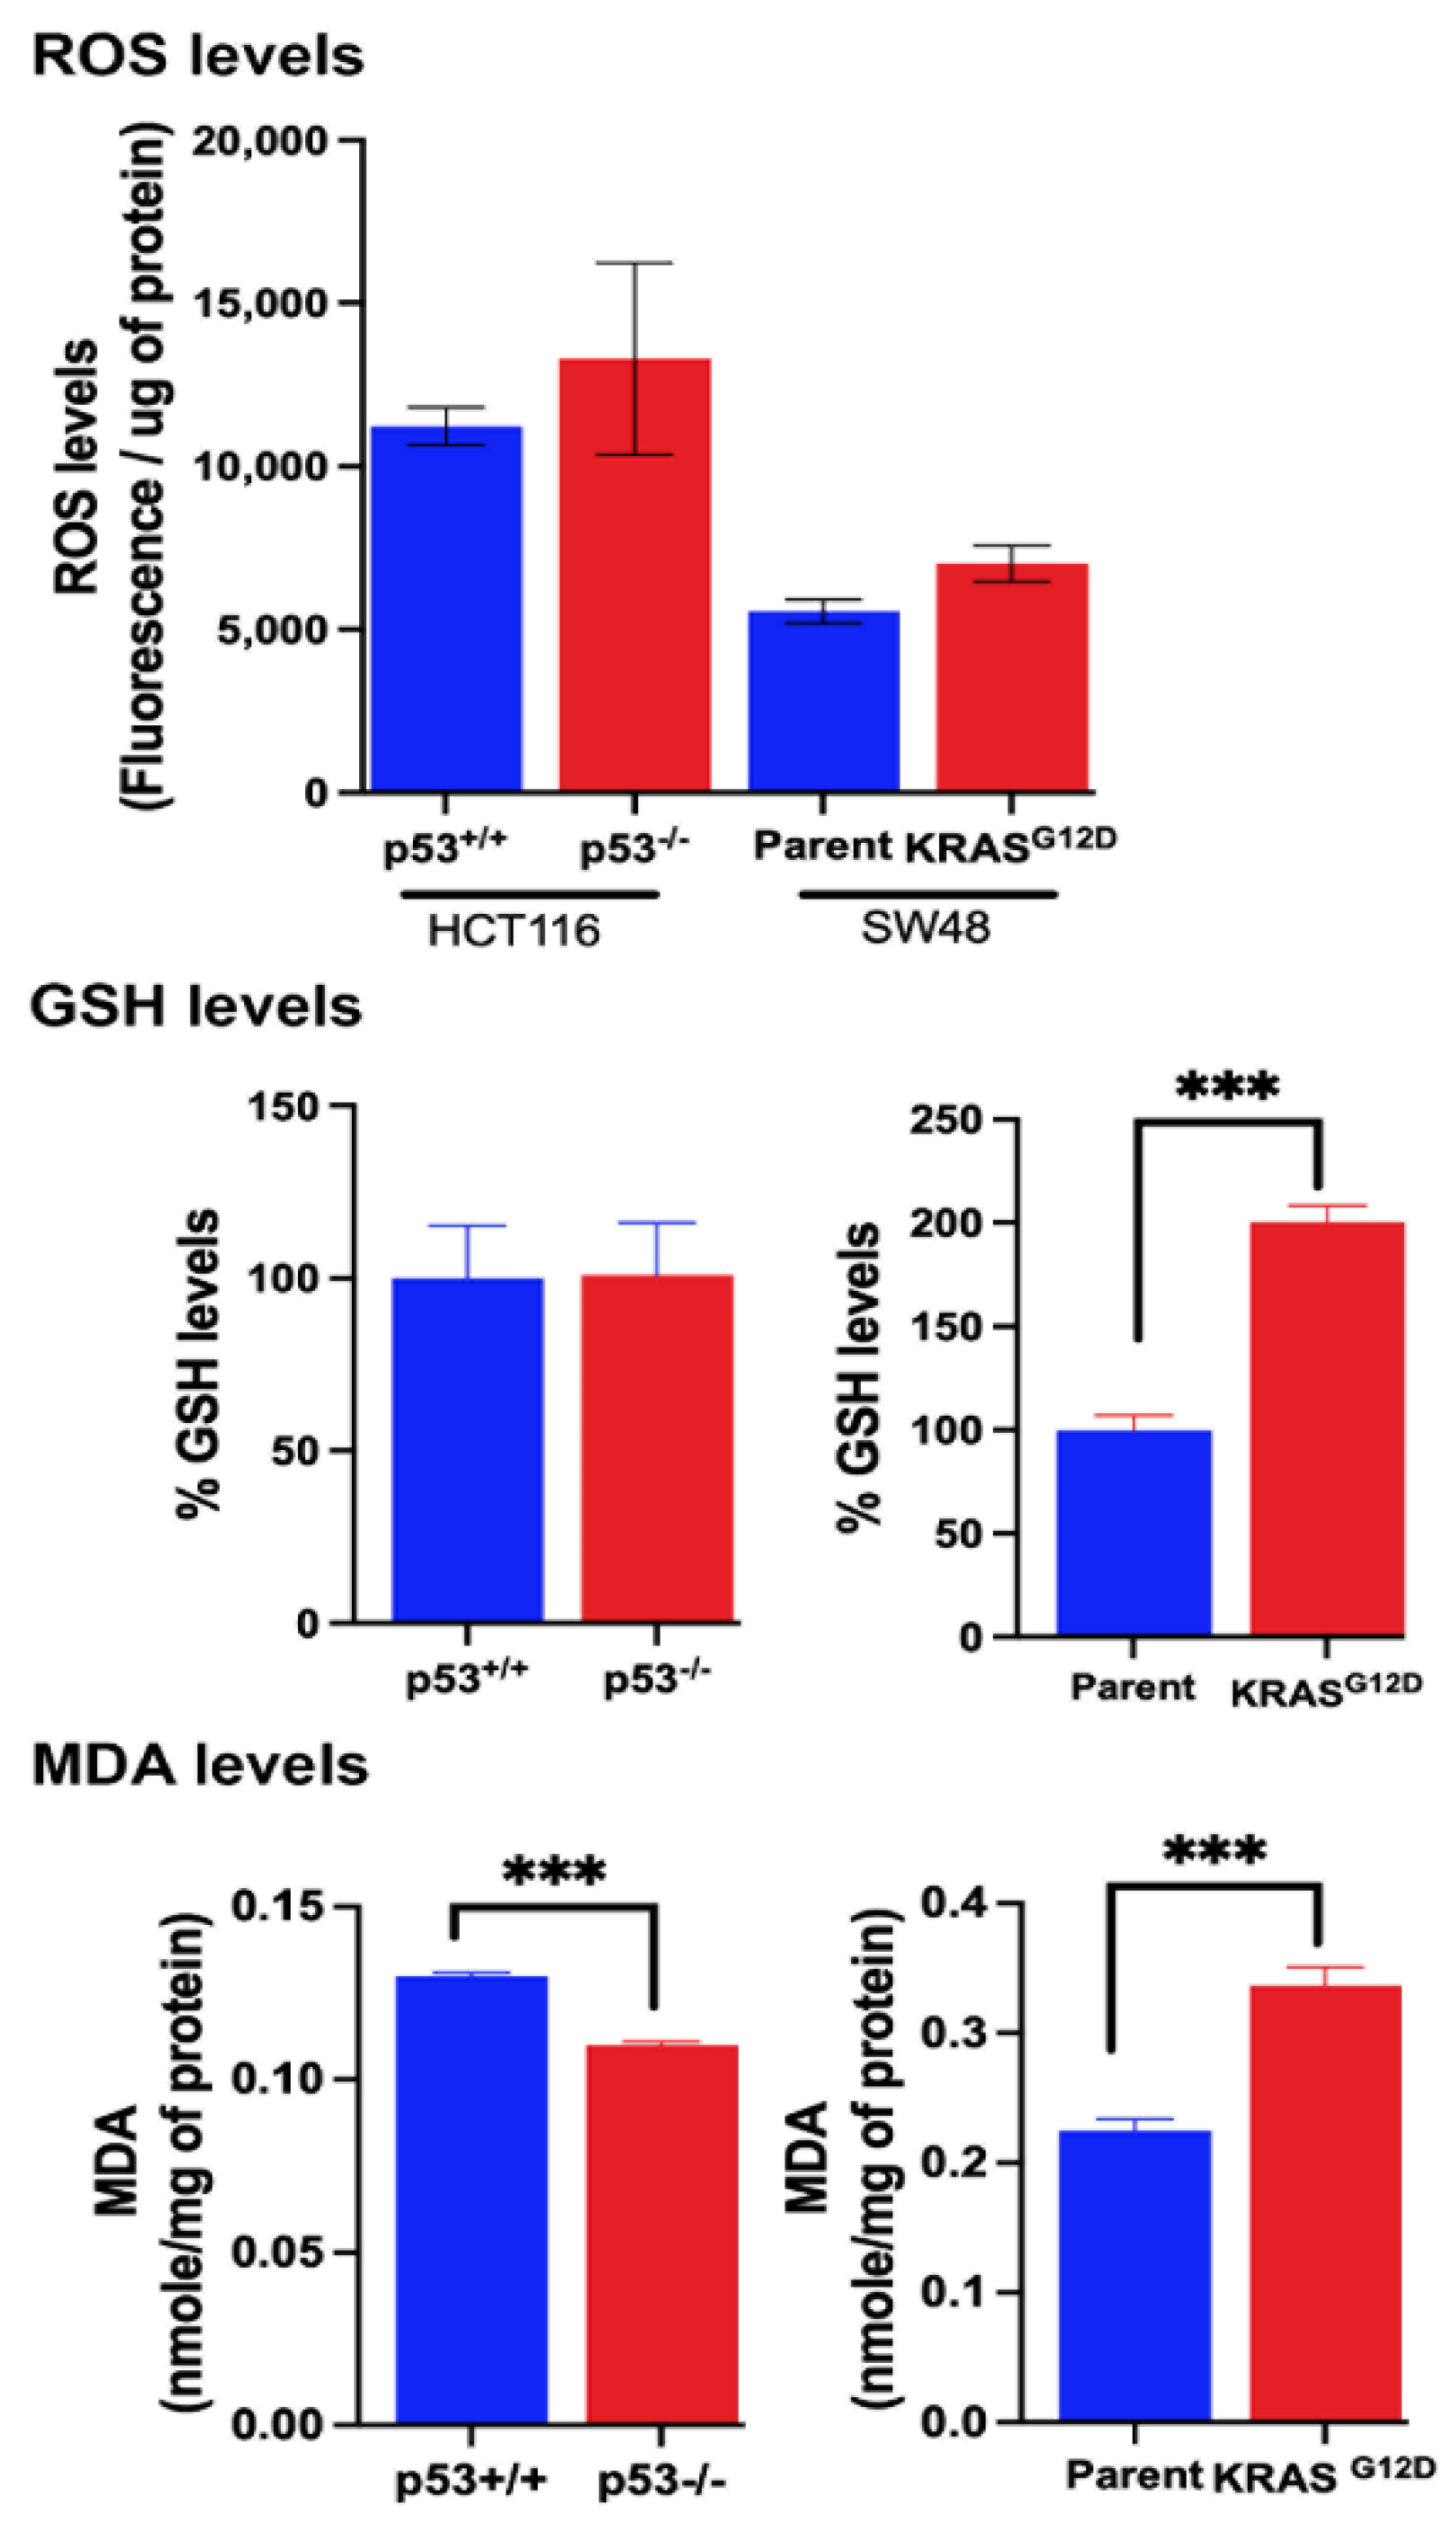
3.7. Influence of p53 Deletion and KRAS-G12D Mutation on Various Factors that are Relevant to Ferroptosis
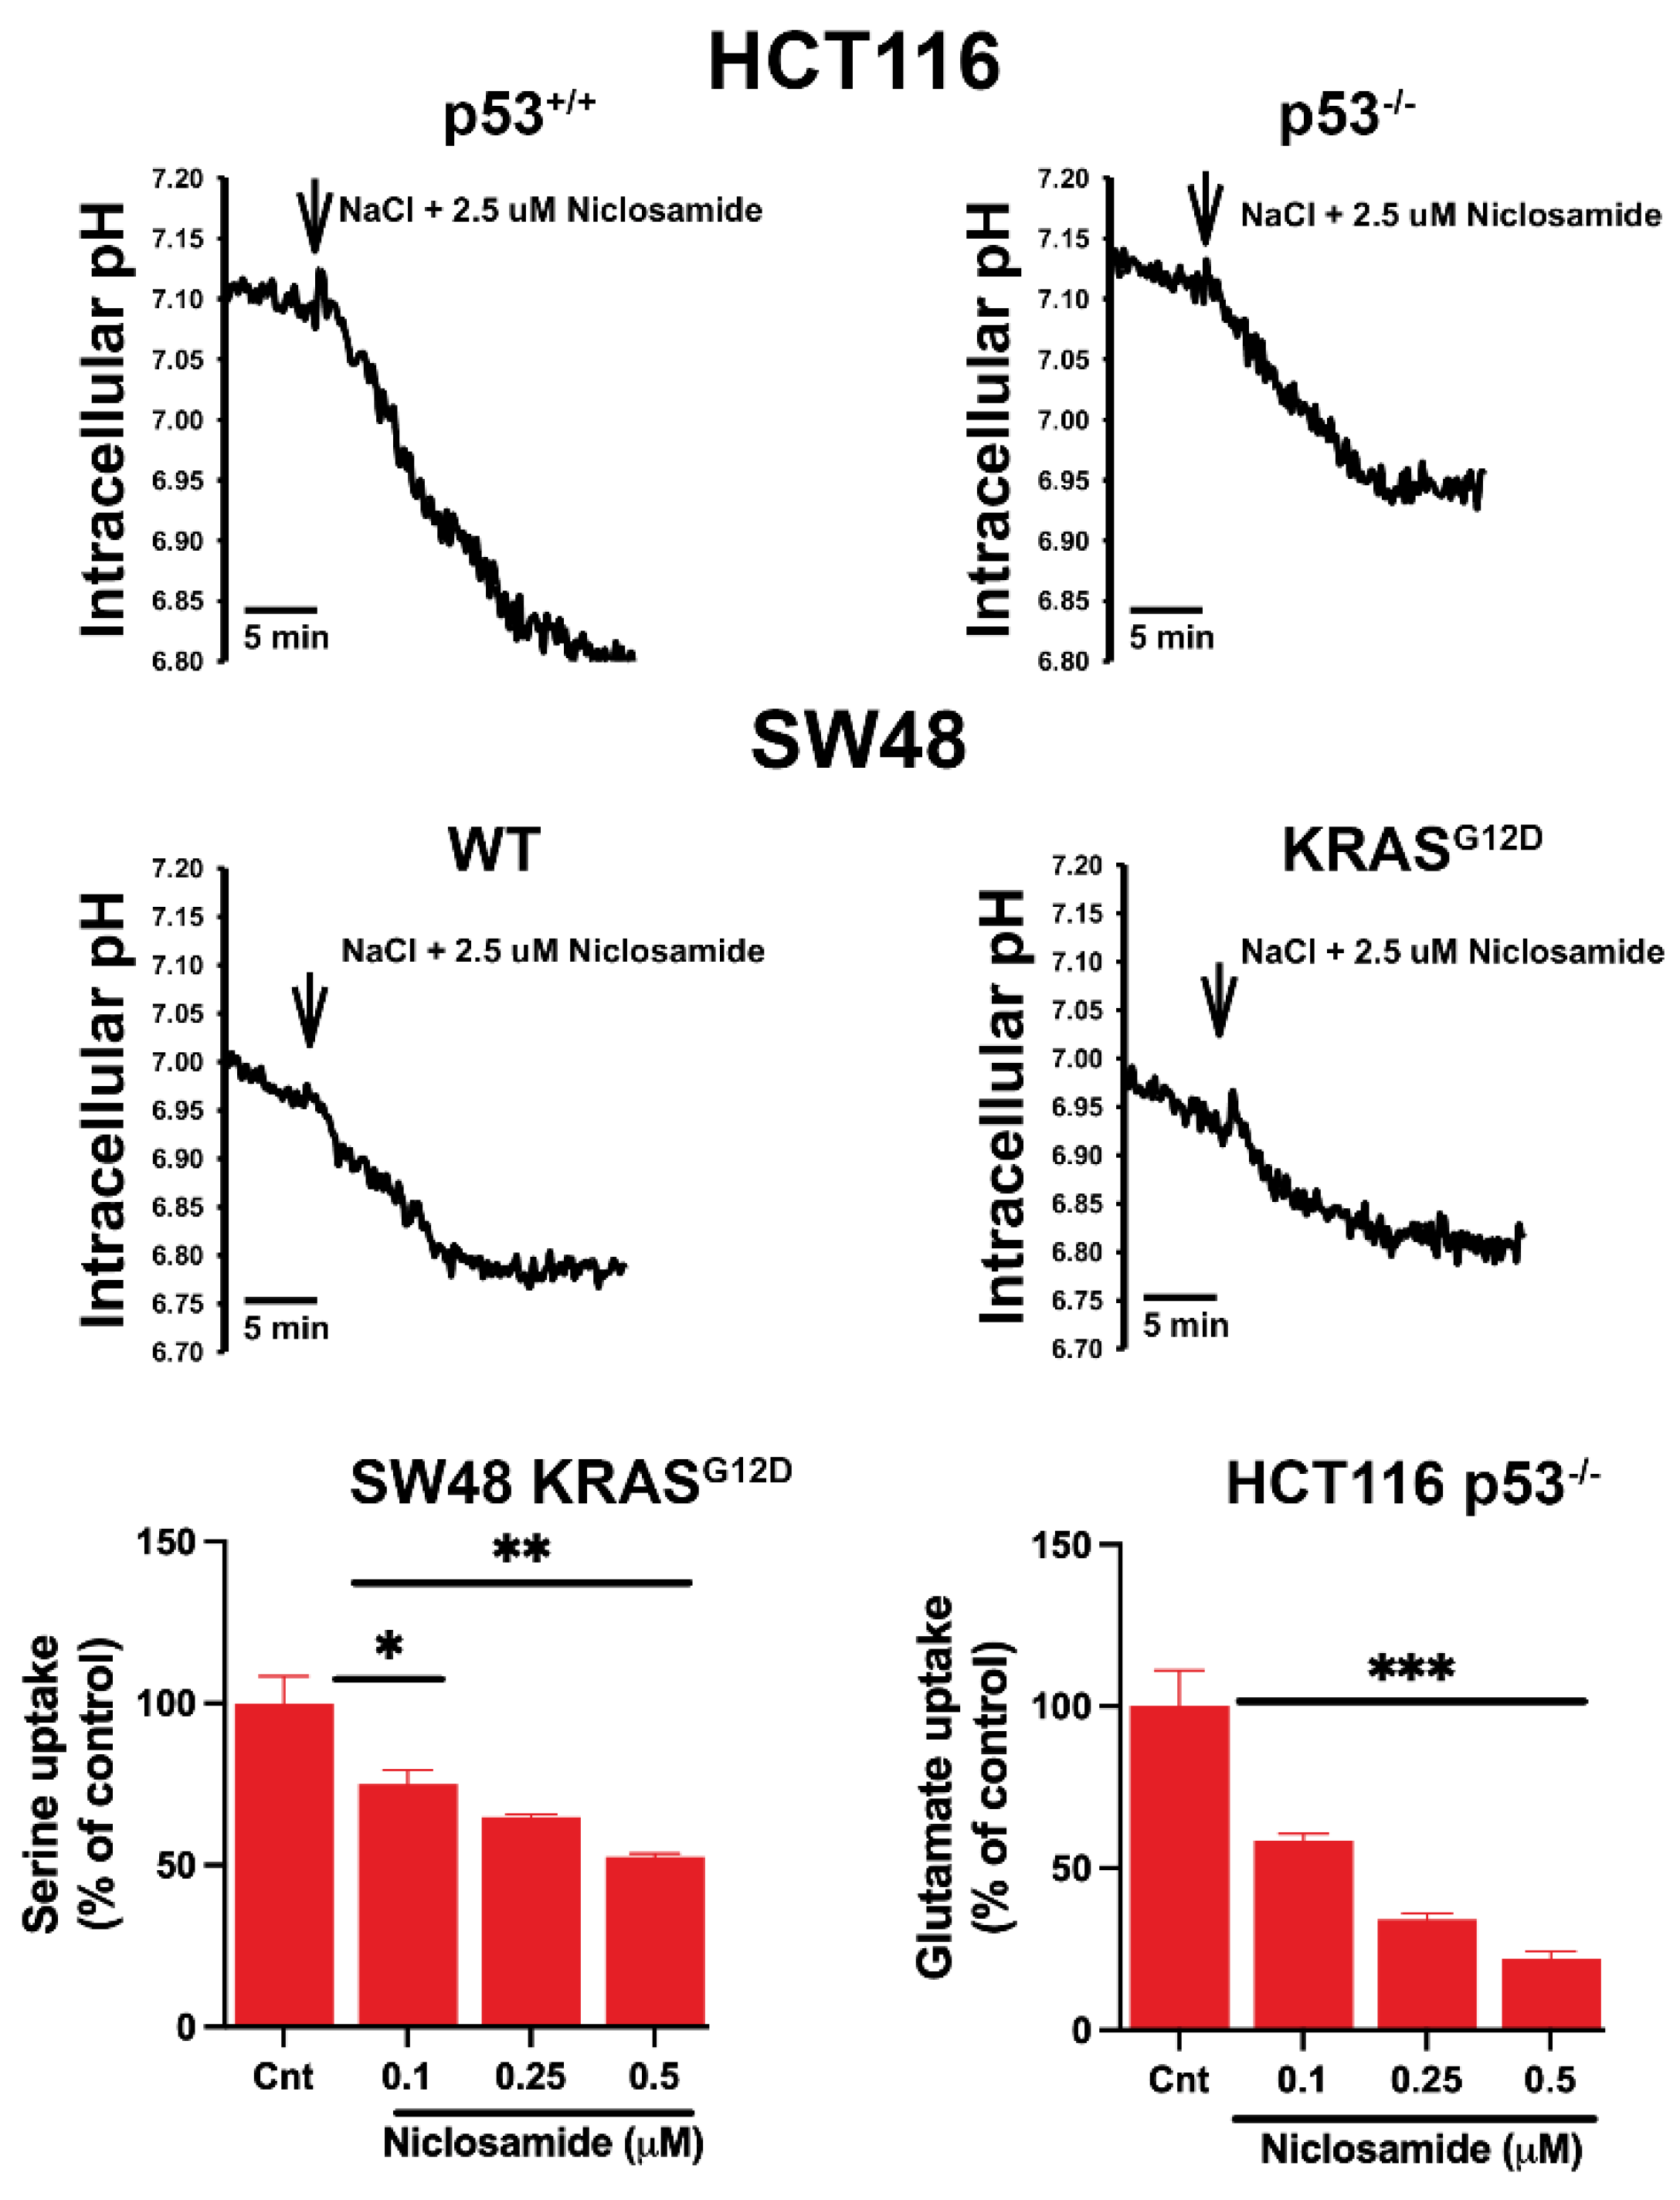
3.8. Effects of Niclosamide on Intracellular pH and the Transport Function of SLC38A5 and SLC7A11
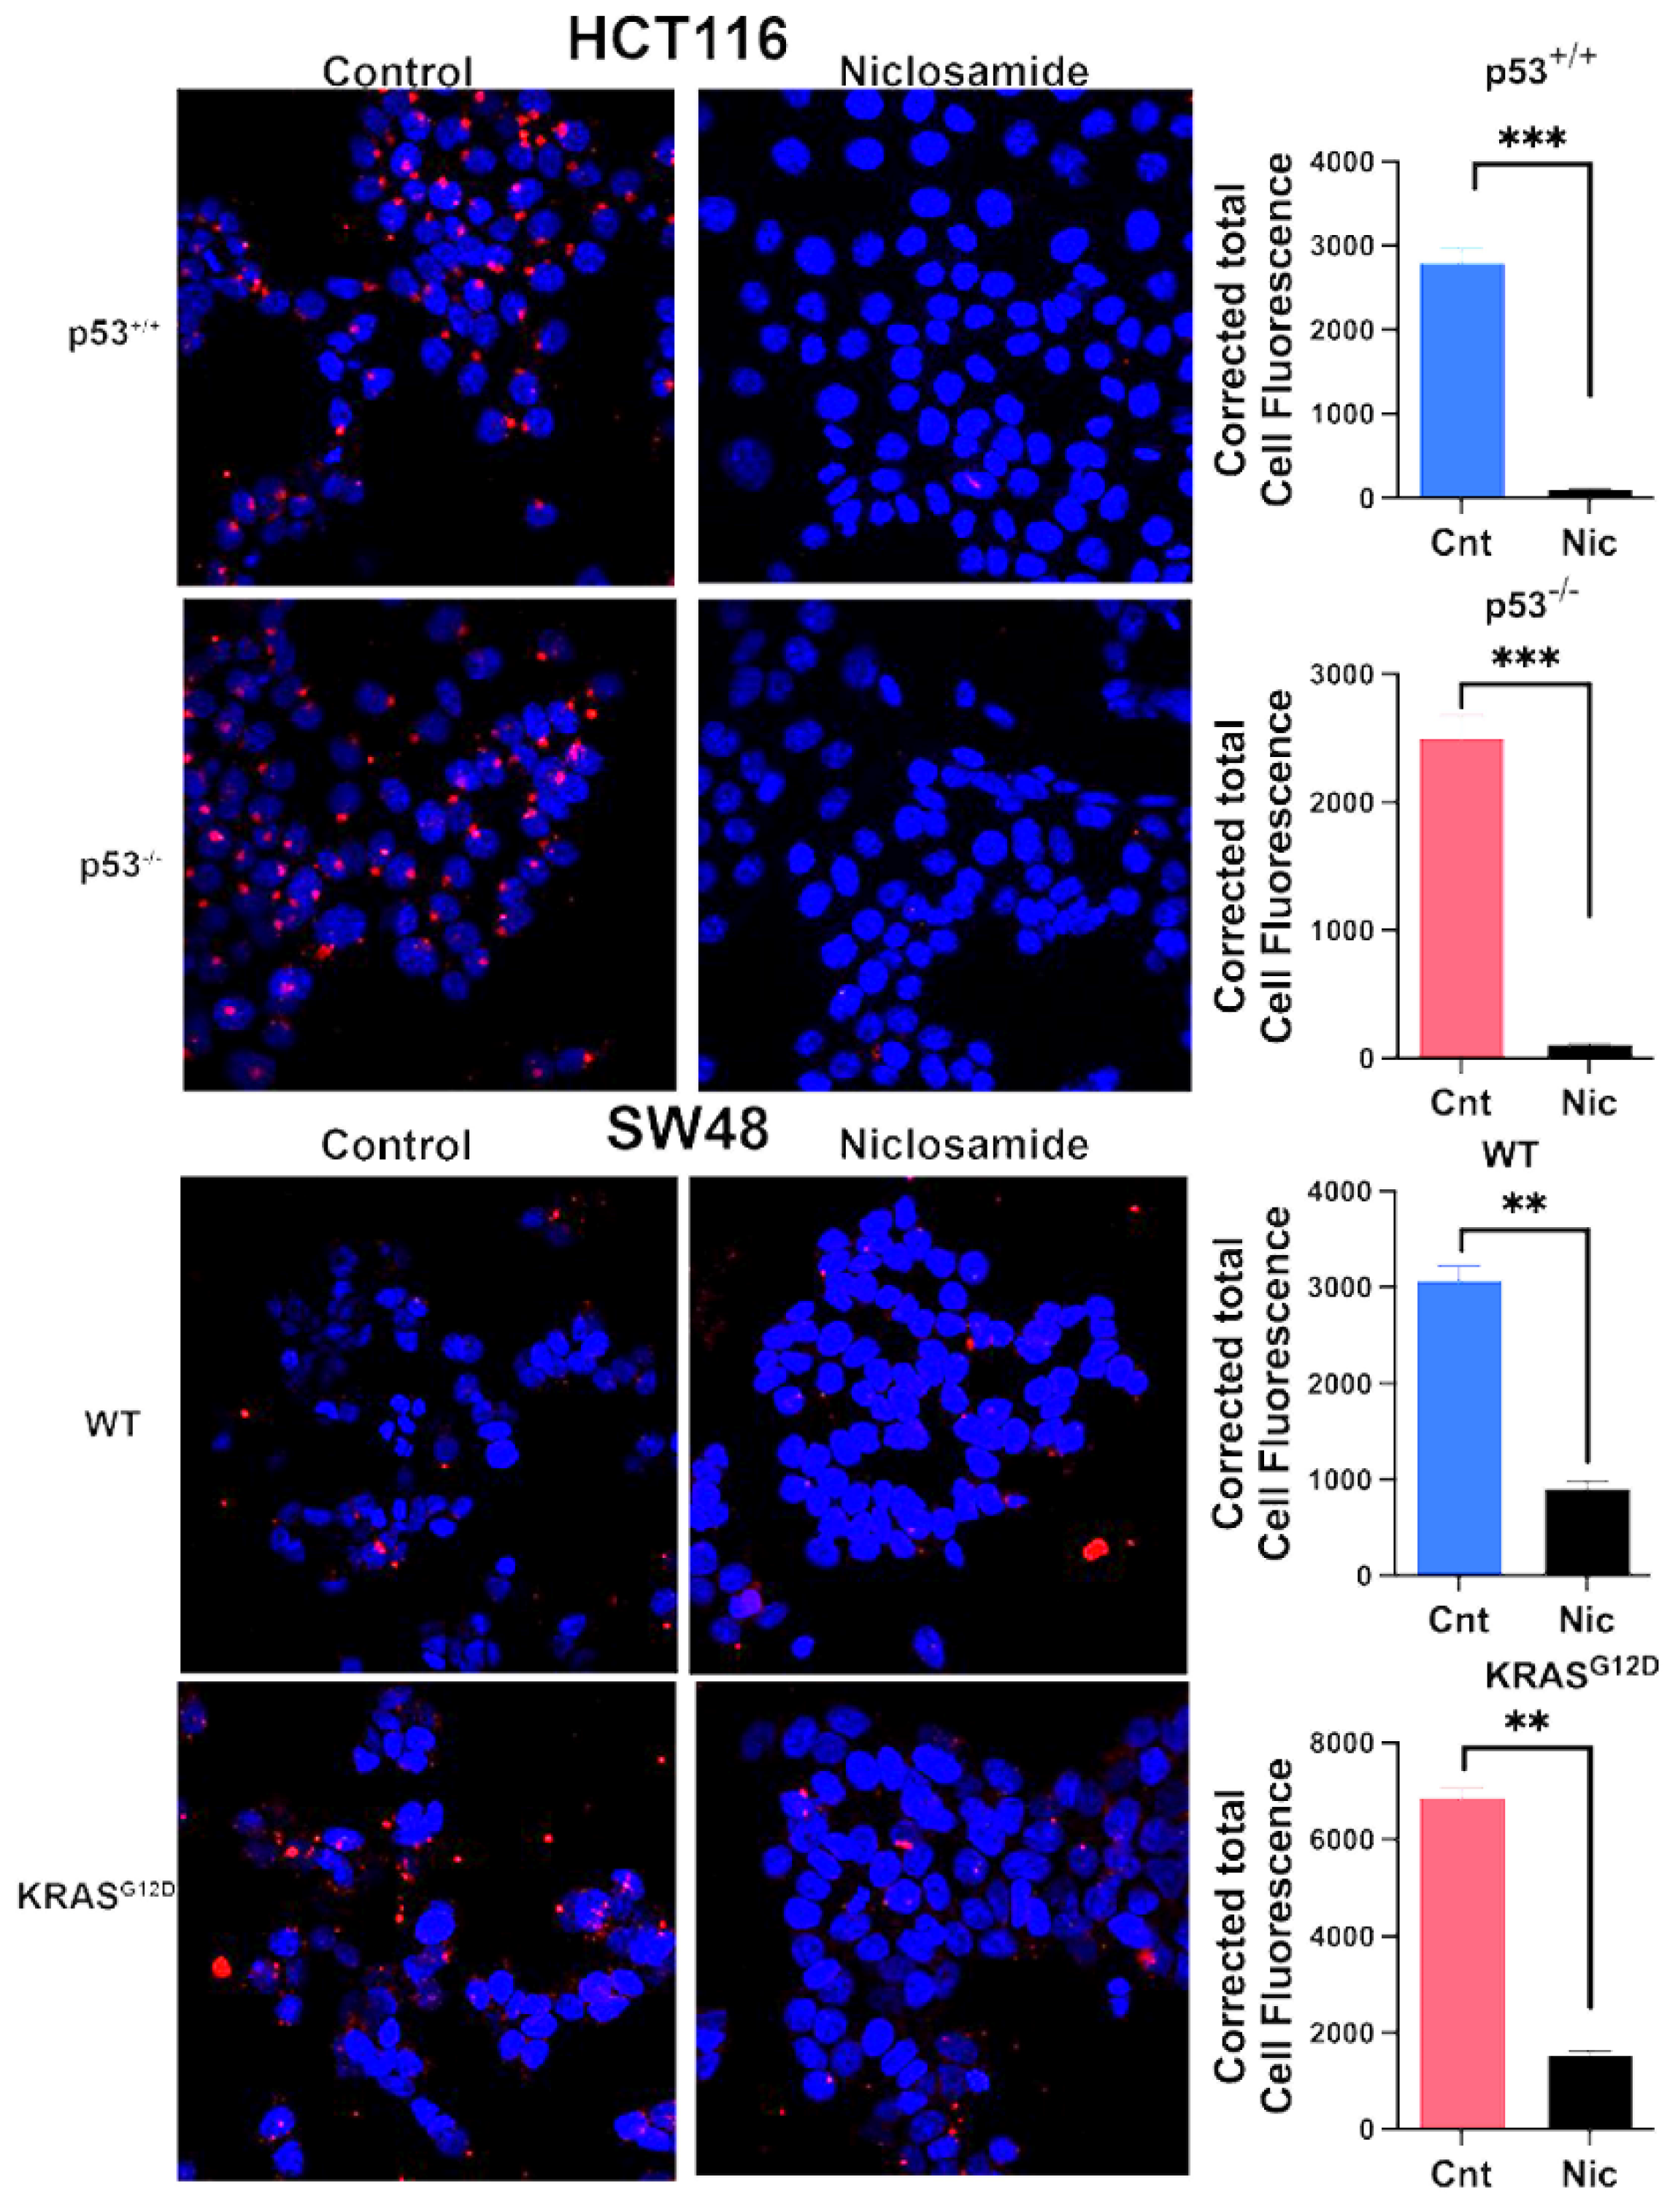
3.9. Inhibition of Macropinocytosis by Niclosamide
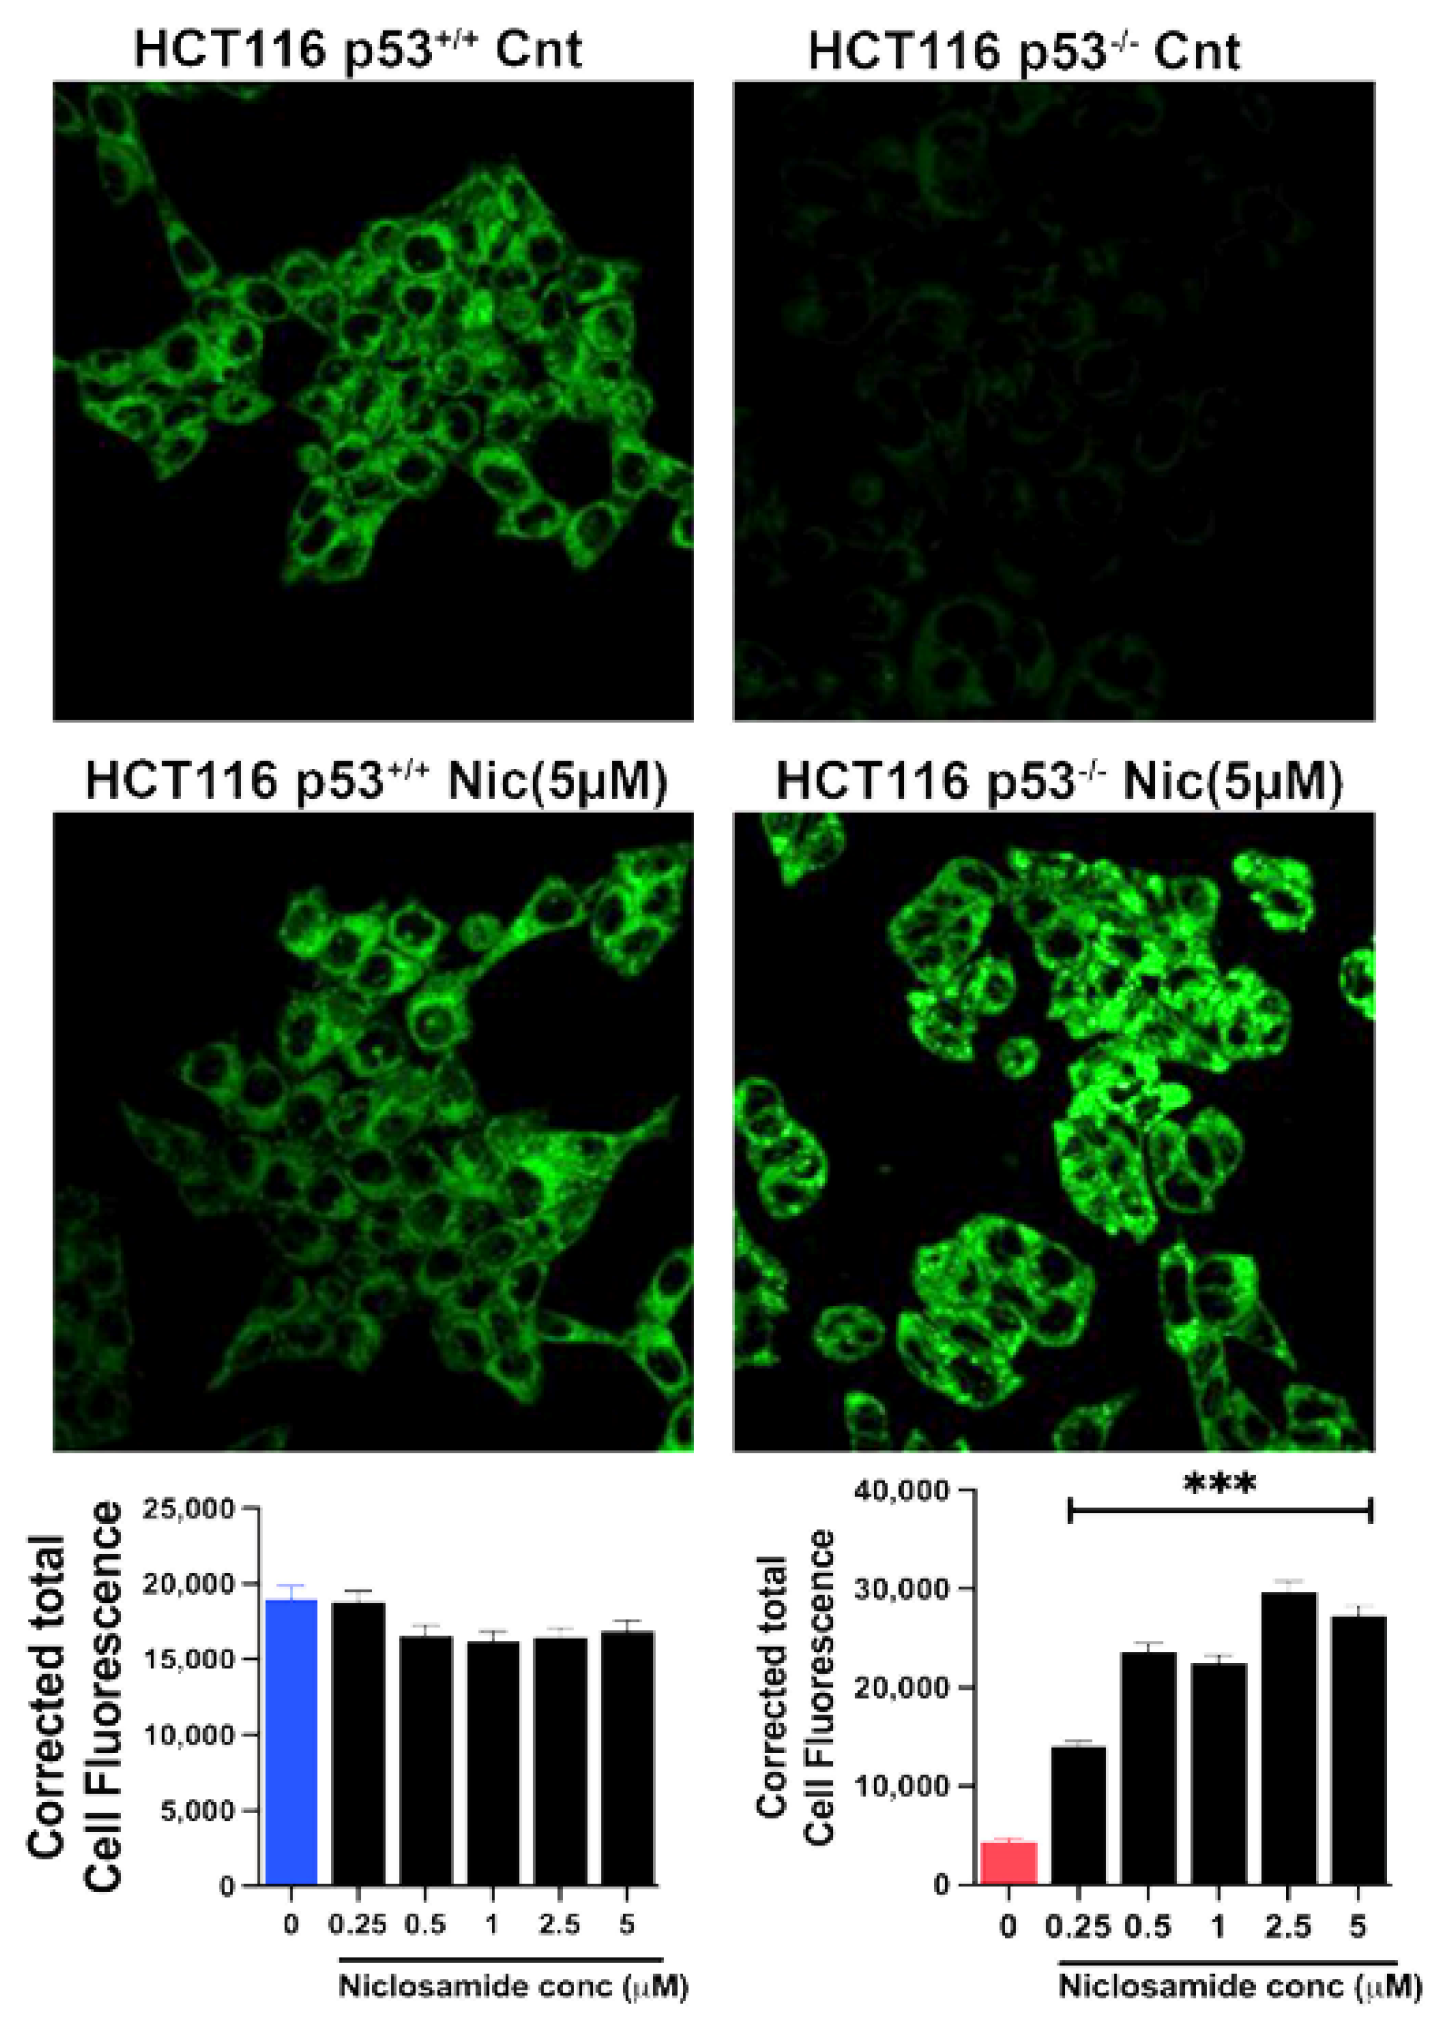
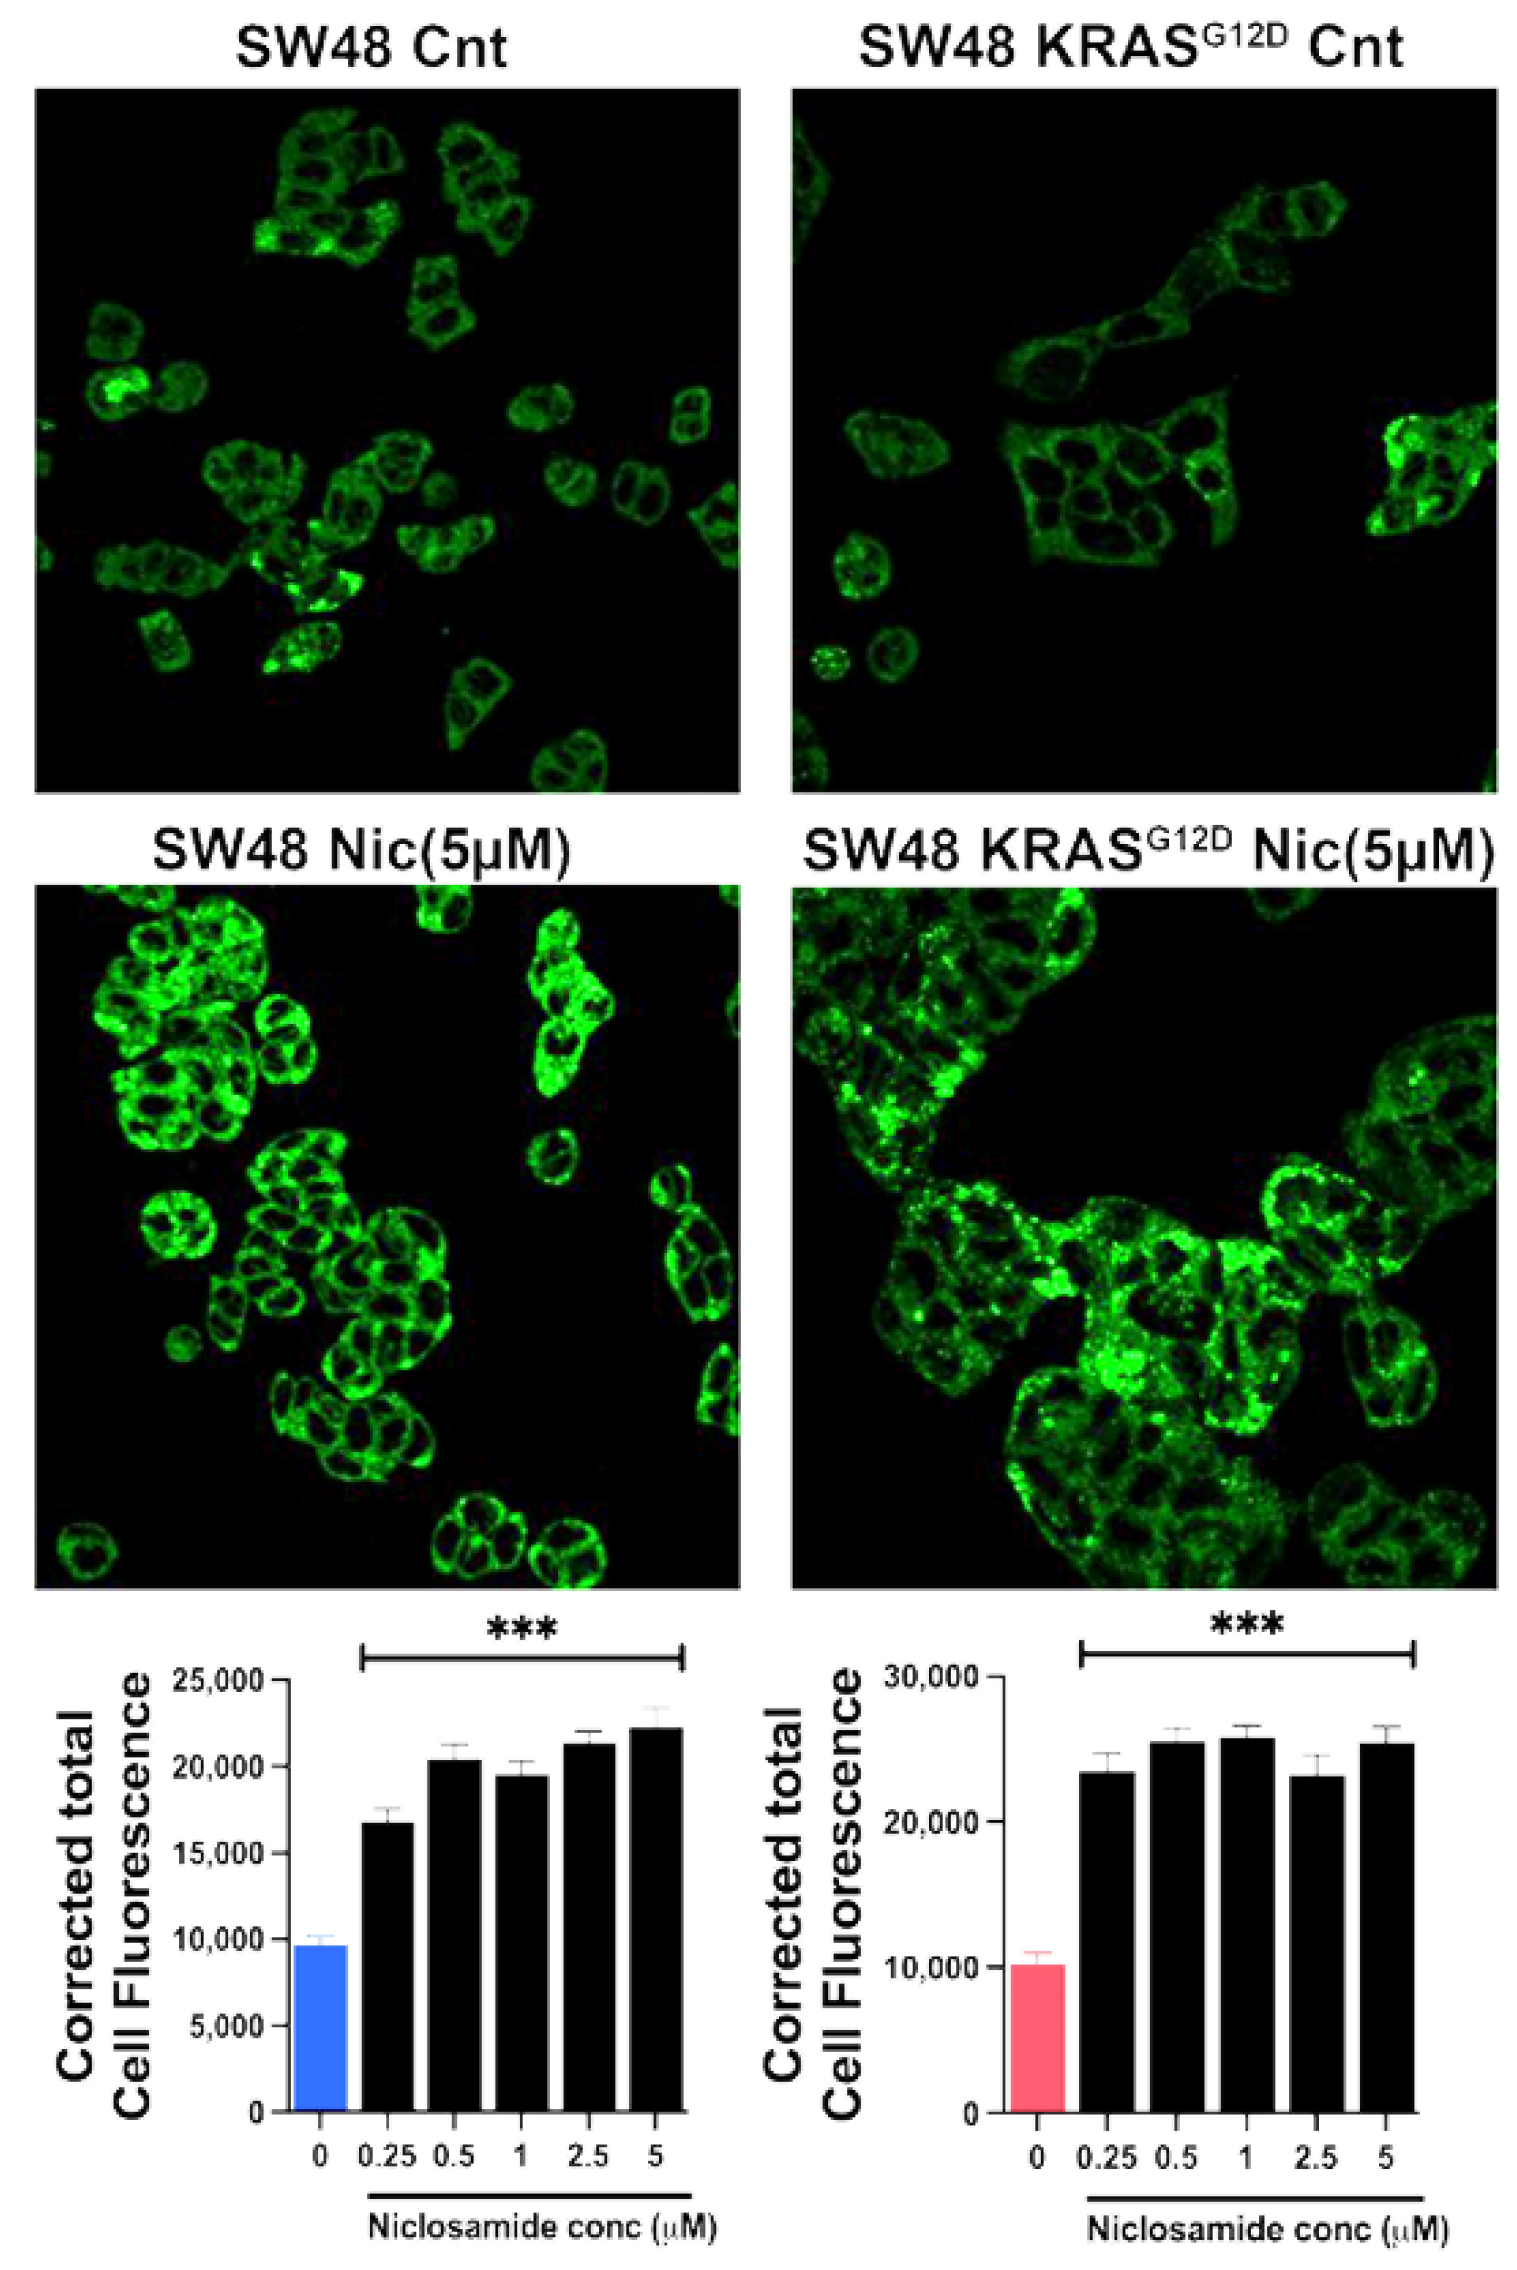
3.10. Induction of Ferroptosis by Niclosamide
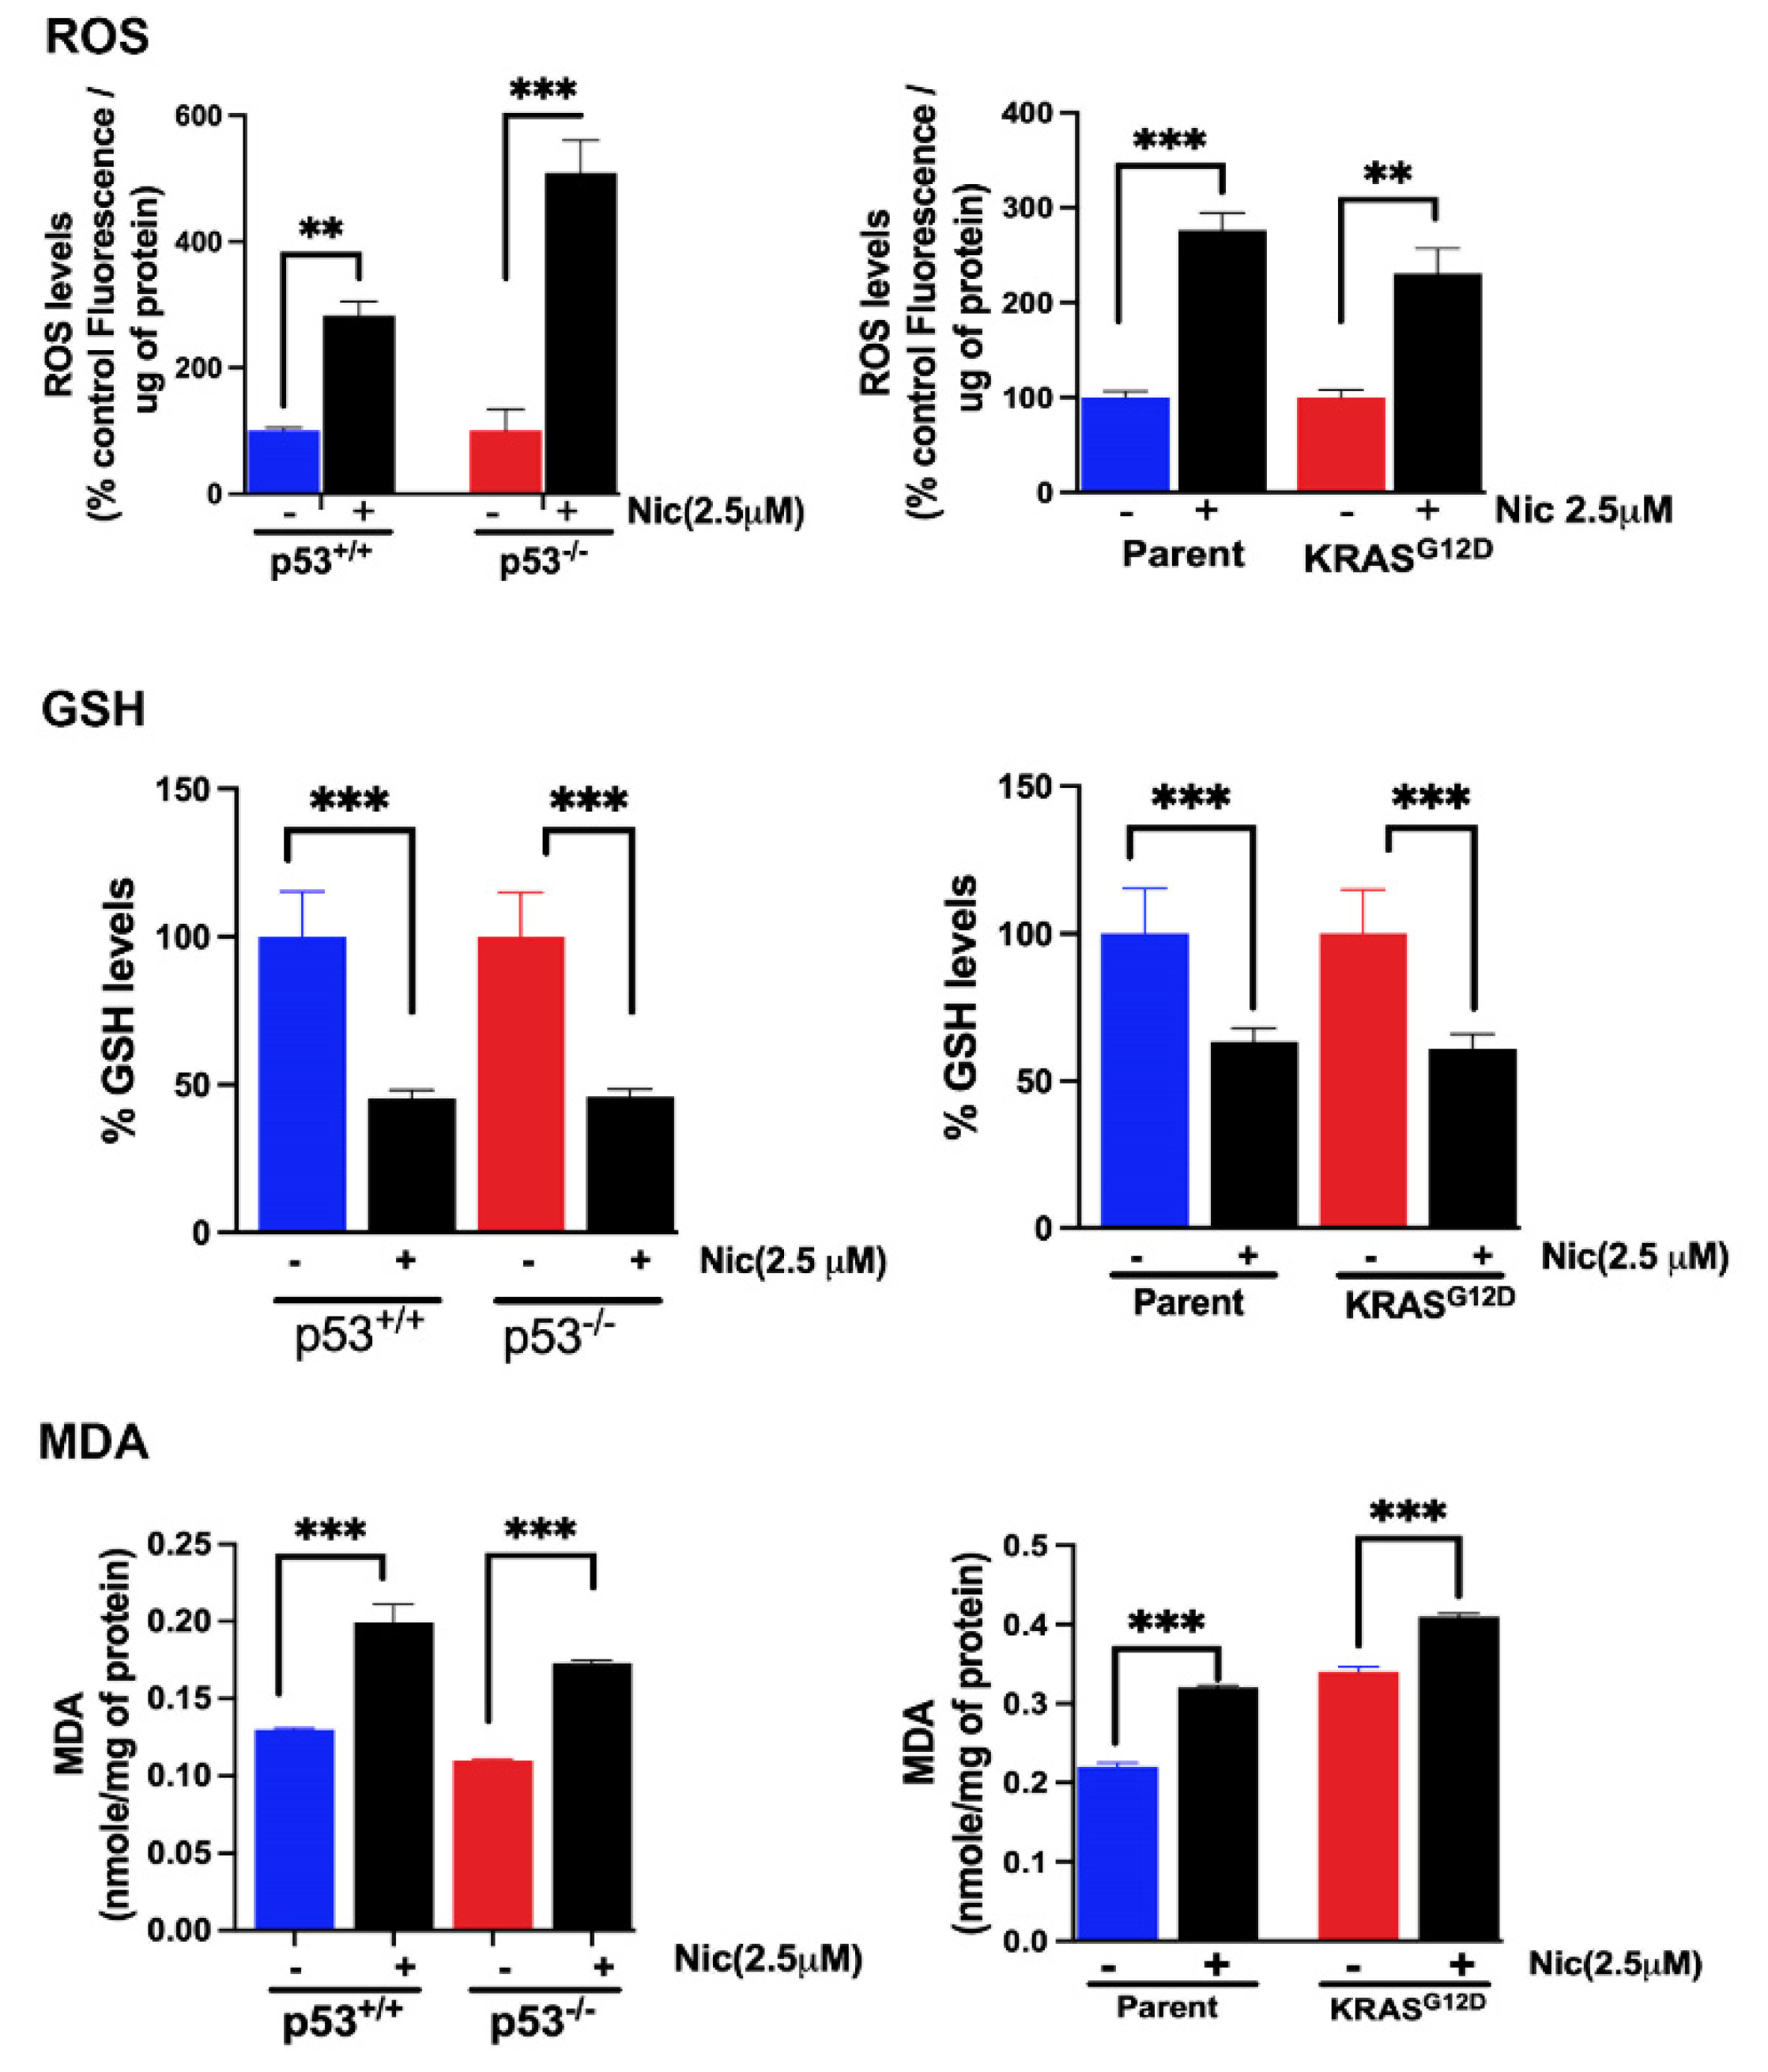
3.11. Effects of Niclosamide on Cellular Levels of ROS, GSH and MDA
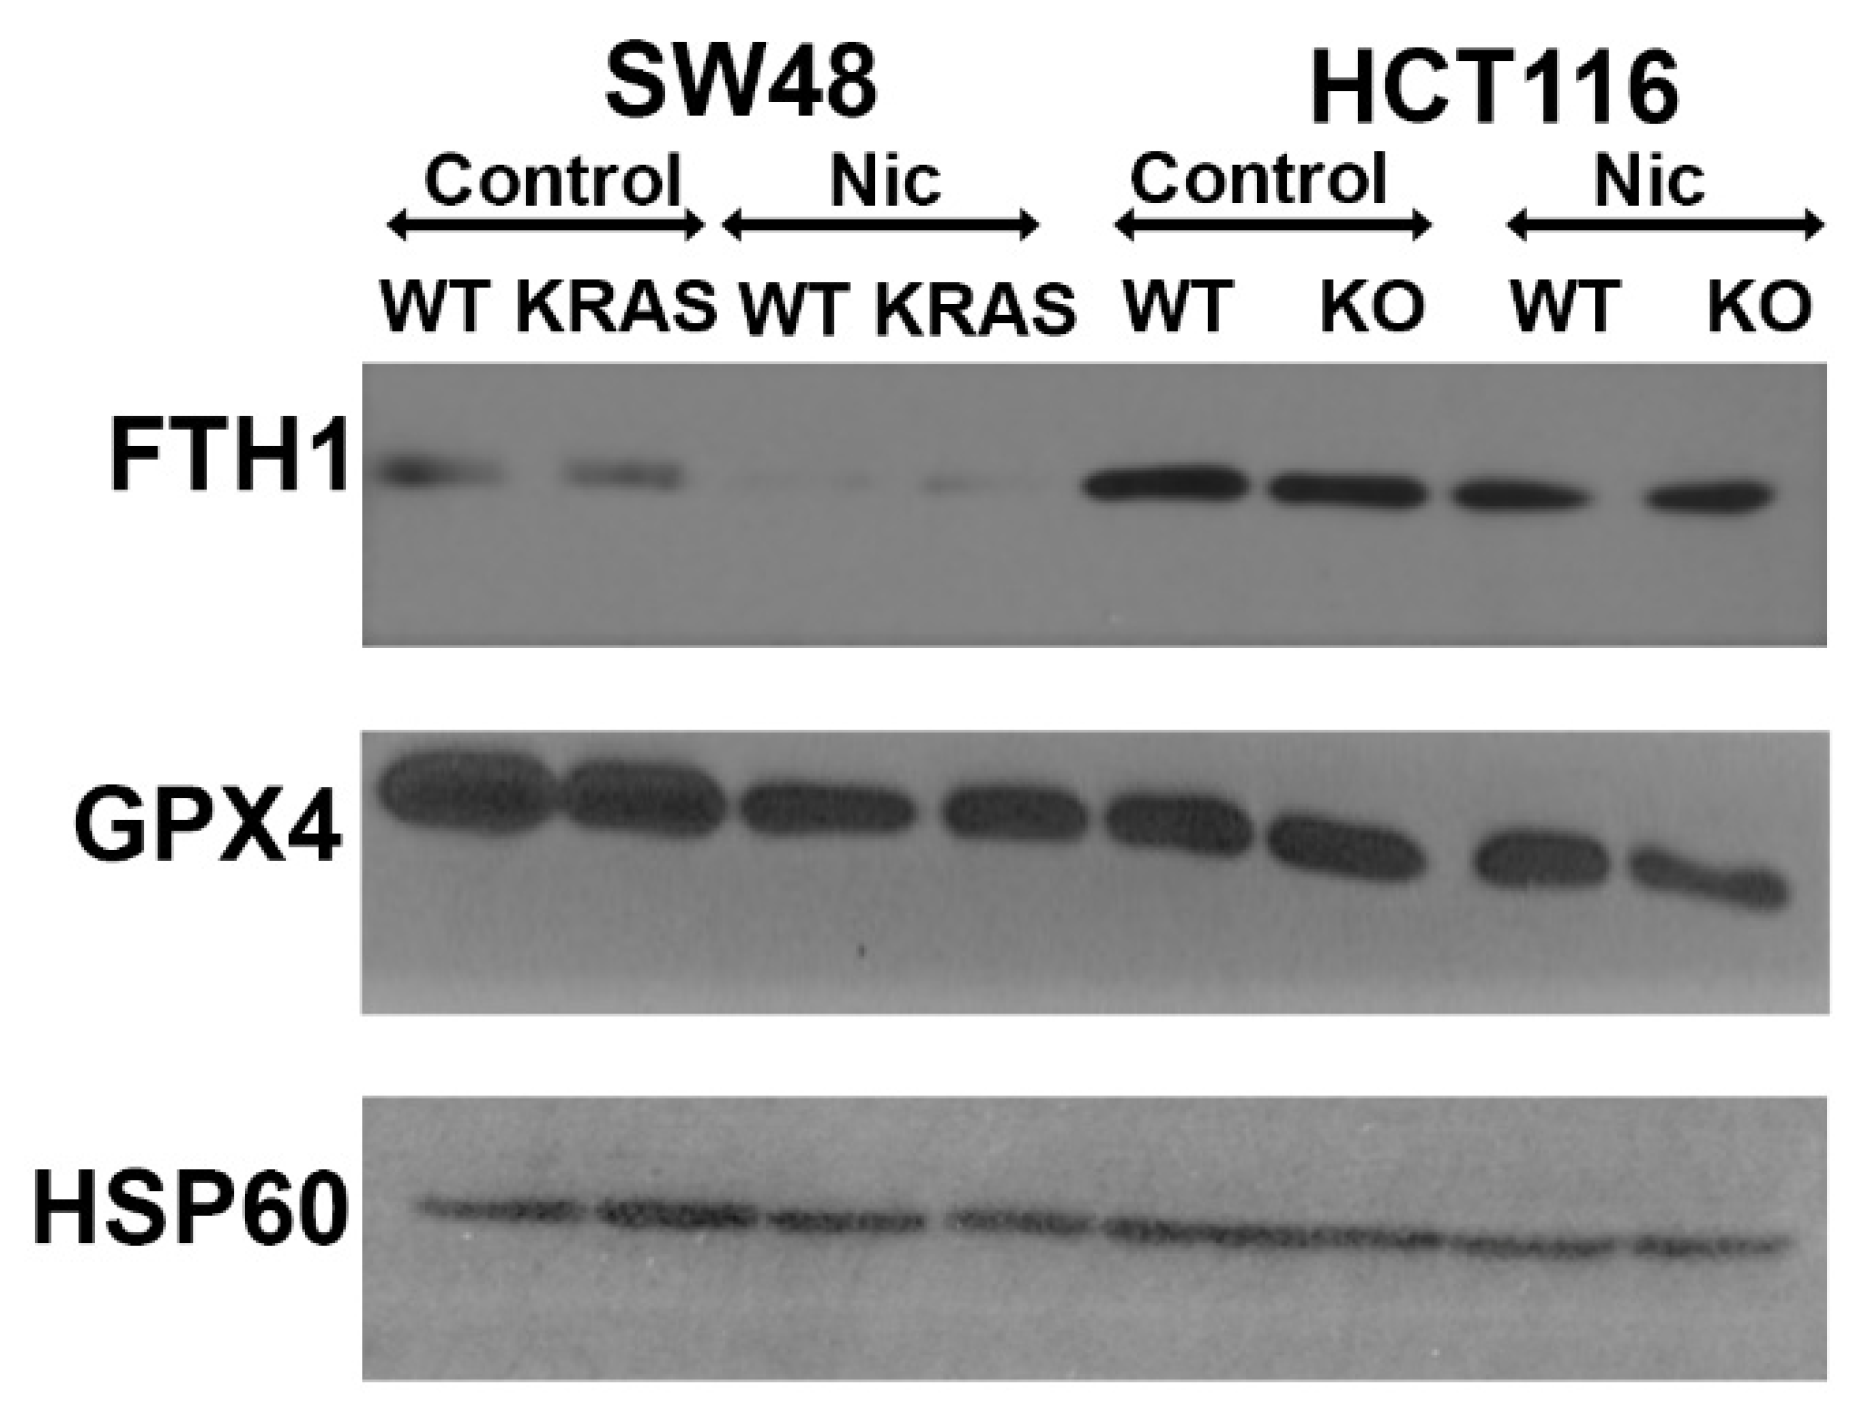
3.12. Effects of Niclosamide on Cellular Levels of Ferritin Heavy Chain and Glutathione Peroxidase
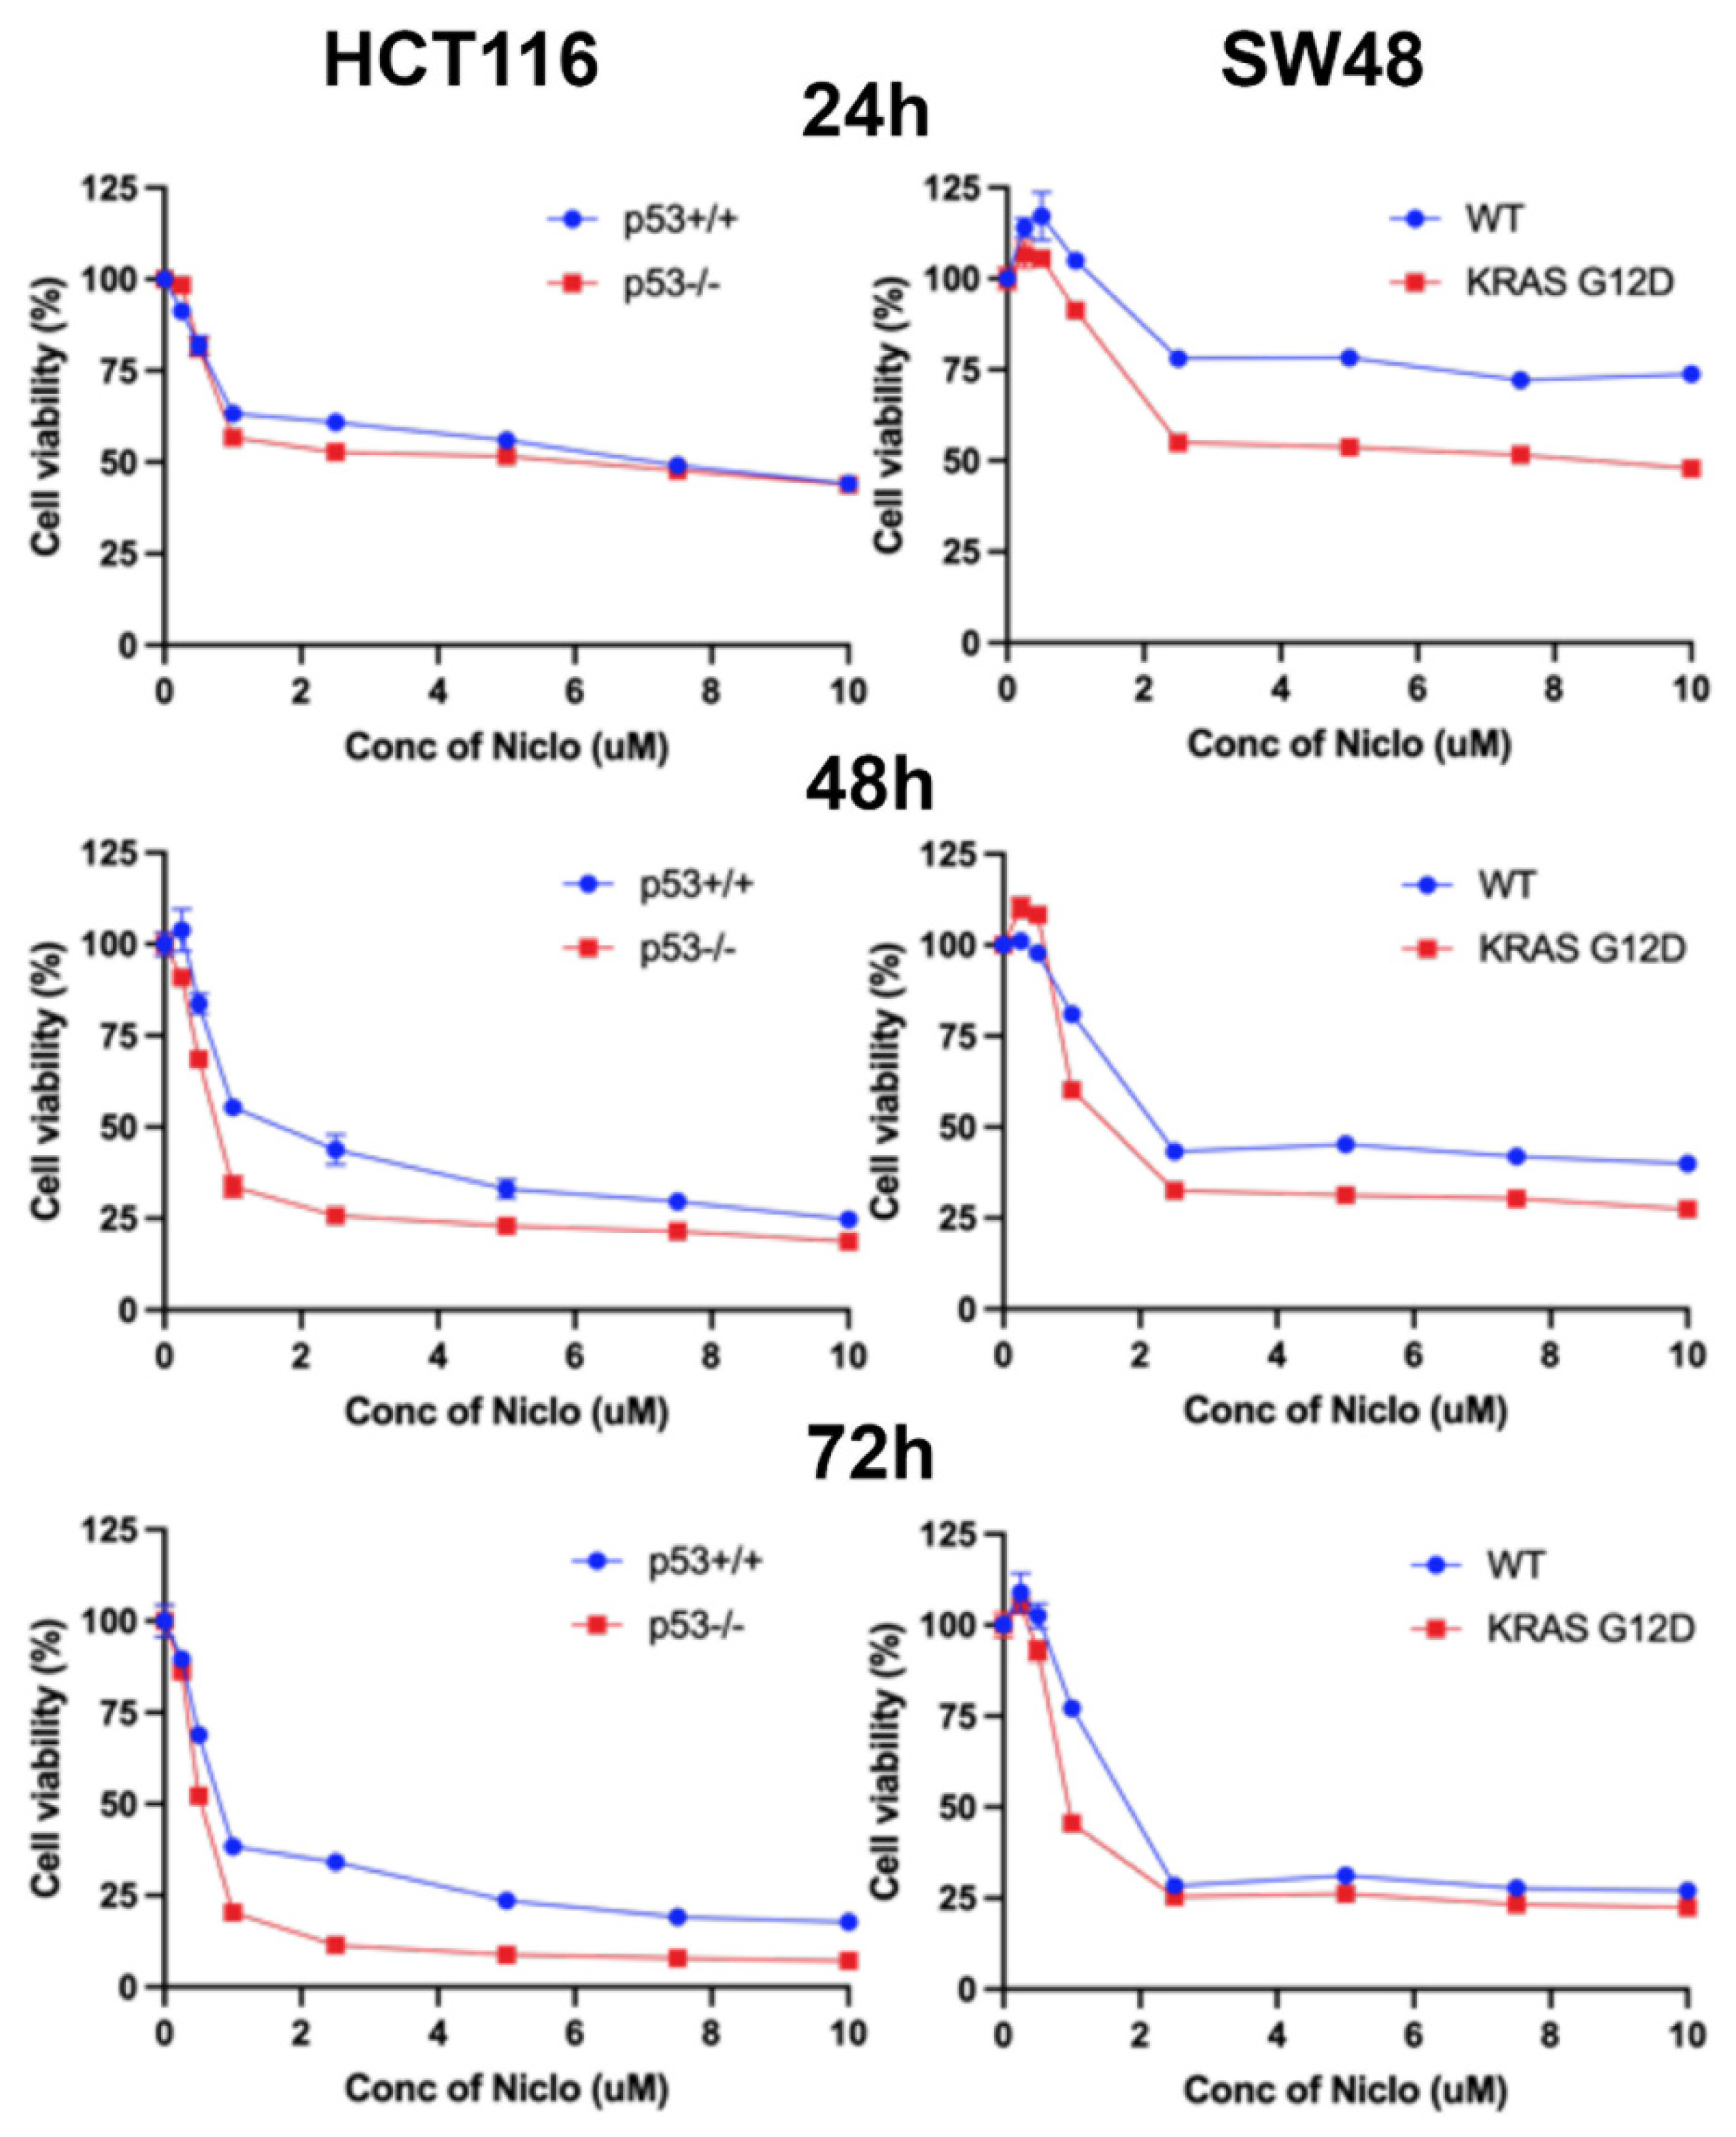
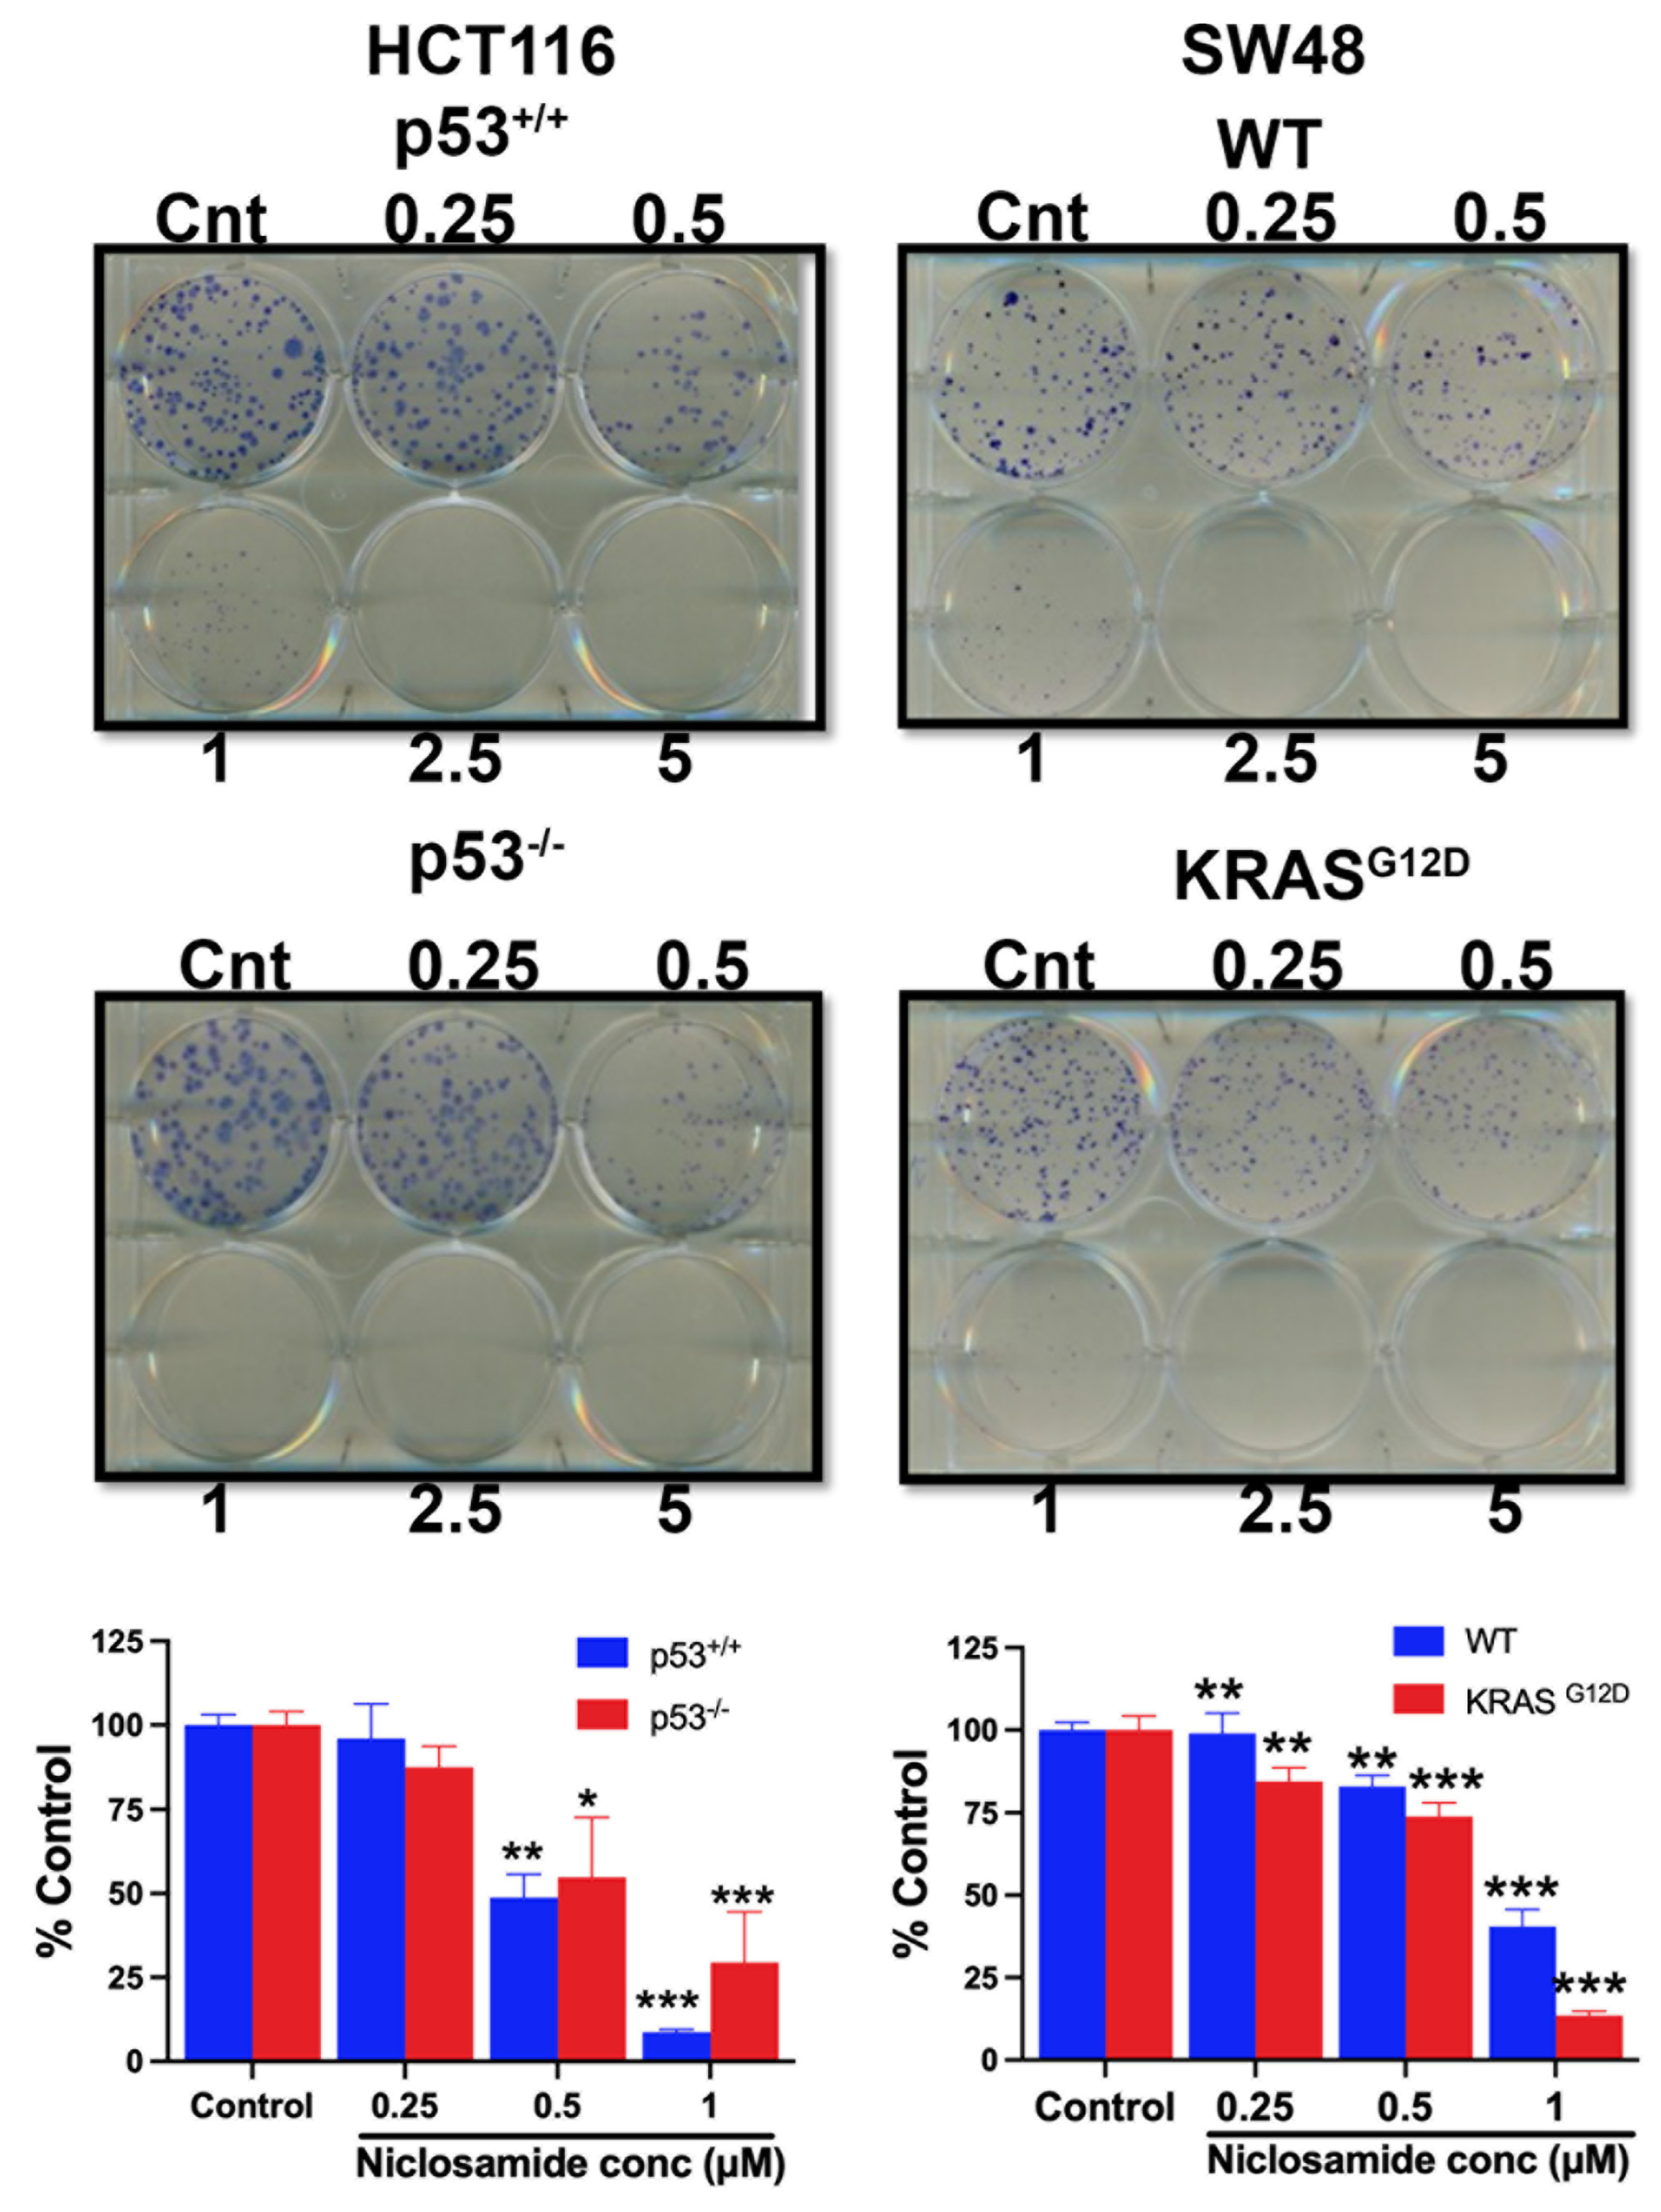
3.13. Effects of Niclosamide on Cell Viability/Proliferation and Colony Formation
4. Discussion
5. Conclusions
Supplementary Materials
Author Contributions
Funding
Institutional Review Board Statement
Data Availability Statement
Acknowledgments
Conflicts of Interest
References
- Siegel, R.L.; Wagle, N.S.; Cercek, A.; Smith, R.A.; Jemal, A. Colorectal cancer statistics, 2023. CA Cancer J. Clin. 2023, 73, 233–254. [Google Scholar] [CrossRef] [PubMed]
- https://seer.cancer.gov/statfacts/html/colorect.html.
- https://www.who.int/news-room/fact-sheets/detail/colorectal-cancer.
- Araghi, M.; Soerjomataram, I.; Jenkins, M.; Brierley, J.; Morris, E.; Bray, F.; Arnold, M. Global trends in colorectal cancer mortality: projections to the year 2035. Int. J. Cancer 2019, 144, 2992–3000. [Google Scholar] [CrossRef] [PubMed]
- Valle, L. Genetic predisposition to colorectal cancer: Where we stand and future perspectives. World J. Gastroenterol. 2014, 20, 9828–9849. [Google Scholar] [CrossRef]
- Strate, L.L.; Syngal, S. Hereditary colorectal cancer syndromes. Cancer Causes Control 2005, 16, 201–213. [Google Scholar] [CrossRef] [PubMed]
- Hryhorowicz, S.; Kaczmarek-Rys, M.; Lis-Tanas, E.; Porowski, J.; Szuman, M.; Grot, N.; Kryszczynska, A.; Paszkowski, J.; Banasiewicz, T.; Plawski, A. Strong hereditary predispositions to colorectal cancer. Genes (Basel) 2022, 13, 2326. [Google Scholar] [CrossRef] [PubMed]
- Zhong, Z.A.; Michalski, M.N.; Stevens, P.D.; Sall, E.A.; Williams, B.O. Regulation of Wnt receptor activity: Implications for therapeutic development in colon cancer. J. Biol. Chem. 2021, 296, 100782. [Google Scholar] [CrossRef] [PubMed]
- Boutin, A.T.; Liao, W.T.; Wang, M.; Hwang, S.S.; Karpinets, T.V.; Cheung, H.; Chu, G.C.; Jiang, S.; Hu, J.; Chang, K.; et al. Oncogenic Kras drives invasion and maintains metastases in colorectal cancer. Genes Dev. 2017, 31, 370–382. [Google Scholar] [CrossRef]
- Nakayama, M.; Oshima, M. Mutant P53 in colon cancer. J. Mol. Cell. Biol. 2019, 11, 267–276. [Google Scholar] [CrossRef]
- Encarnacion-Rosado, J.; Kimmelman, A.C. Harnessing metabolic dependencies in pancreatic cancers. Nat. Rev. Gastroenterol. Hepatol. 2021, 18, 482–492. [Google Scholar] [CrossRef]
- Recouvreux, M.V.; Commisso, C. Macropinocytosis: A metabolic adaptation to nutrient stress in cancer. Front. Endocrinol. (Lausanne), 2017, 8, 261. [Google Scholar] [CrossRef]
- Stockwell, B.R. Ferroptosis turns 10: Emerging mechanisms, physiological functions, and therapeutic applications. Cell 2022, 185, 2401–2421. [Google Scholar] [CrossRef] [PubMed]
- Dixon, S.J.; Stockwell, B.R. The role of iron and reactive oxygen species in cell death. Nat. Chem. Biol. 2014, 10, 9–17. [Google Scholar] [CrossRef] [PubMed]
- Timar, J.; Kashofer, K. Molecular epidemiology and diagnostics of KRAS mutations in human cancer. Cancer Metastasis Rev. 2020, 39, 1029–1038. [Google Scholar] [CrossRef] [PubMed]
- Nagy, J.A.; Dvorak, A.M.; Dvorak, H.F. Vascular permeability, angiogenesis, and stroma generation. Cold Spring Harb. Perspect. Med. 2012, 2, a006544. [Google Scholar] [CrossRef] [PubMed]
- Nagl, L.; Horvath, L.; Pircher, A.; Wolf, D. Tumor endothelial cells (TECs) as potential immune directors of the tumor microenvironment – New findings and future perspectives. Front. Cell Dev. Biol. 2020, 8, 766. [Google Scholar] [CrossRef] [PubMed]
- Broer, S. Amino acid transporters as targets for cancer therapy: Why, where, when, and how. Int. J. Mol. Sci. 2020, 21, 6156. [Google Scholar] [CrossRef] [PubMed]
- Bhutia, Y.D.; Babu, E.; Ramachandran, S.; Ganapathy, V. Amino acid transporters in cancer and their relevance to “glutamine addiction”: Novel targets for the design of a new class of anticancer drugs. Cancer Res. 2015, 75, 1782–1788. [Google Scholar] [CrossRef] [PubMed]
- Bhutia, Y.D.; Ganapathy, V. Glutamine transporters in mammalian cells and their functions in physiology and cancer. Biochim. Biophys. Acta 2016, 1863, 2531–2539. [Google Scholar] [CrossRef]
- Torti, S.V.; Torti, F.M. Iron: The cancer connection. Mol. Aspects Med. 2020, 75, 100860. [Google Scholar] [CrossRef]
- Sainkow, K. Role of iron in cancer. Semin. Cancer Biol. 2021, 76, 189–194. [Google Scholar]
- Shen, J.; Sheng, X.; Chang, Z.; Wu, Q.; Wang, S.; Xuan, Z.; Li, D.; Wu, Y.; Kong, X.; Yu, L.; et al. Iron metabolism regulates p53 signaling through direct heme-p53 interaction and modulation of p53 localization, stability, and function. Cell Rep. 2014, 7, 180–193. [Google Scholar] [CrossRef]
- Bhutia, Y.D.; Ogura, J.; Grippo, P.J.; Torres, C.; Sato, T.; Wachtel, M.S.; Ramachandran, S.; Babu, E.; Sivaprakasam, S.; Rajasekaran, D.; et al. Chronic exposure to excess iron promotes EMT and cancer via p53 loss in pancreatic cancer. Asian J. Pharm. Sci. 2020, 15, 237–251. [Google Scholar] [CrossRef] [PubMed]
- https://www.cancer.org/cancer/types/colon-rectal-cancer/treating.
- https://www.cancer.
- Chen, W.; Mook, R.A.; Premont, R.T.; Wang, J. Niclosamide: Beyond an antihelminthic drug. Cell Signal. 2018, 41, 89–96. [Google Scholar] [CrossRef]
- Andrews, P.; Thyssen, J.; Lorke, D. The biology and toxicology of molluscicides, Bayluscide. Pharamcol. Ther. 1982, 19, 245–295. [Google Scholar] [CrossRef]
- Bunz, F.; Dutriaux, A.; Lengauer, C.; Waldman, T.; Zhou, S.; Brown, J.P.; Sedivy, J.M.; Kinzler, K.W.; Vogelstein, B. Requirement for p53 and p21 to sustain G2 arrest after DNA damage. Science 1998, 282, 1497–1501. [Google Scholar] [CrossRef] [PubMed]
- Bunz, F.; Hwang, P.M.; Torrance, C.; Waldman, T.; Zhang, Y.; Dillehay, L.; Williams, J.; Lengauer, C.; Kinzler, K.W.; Vogelstein, B. Disruption of p53 in human cancer cells alters the responses to therapeutic agents. J. Clin. Invest. 1999, 104, 263–269. [Google Scholar] [CrossRef] [PubMed]
- Sennoune, S.R.; Dharmalingam-Nandagopal, G.; Ramachandran, S.; Mathew, M.; Sivaprakasam, S.; Jaramillo-Martinez, V.; Bhutia, Y.D.; Ganapathy, V. Potent inhibition of macropinocytosis by niclosamide in cancer cells: A novel mechanism for the anticancer efficacy for the anti-helminthic. Cancers 2023, 15, 759. [Google Scholar] [CrossRef] [PubMed]
- Mathew, M.; Sivaprakasam, S.; Dharmalingam-Nandagopal, G.; Sennoune, S.R.; Nguyen, N.T.; Jaramillo-Martinez, V.; Bhutia, Y.D.; Ganapathy, V. Induction of oxidative stress and ferroptosis in triple-negative breast cancer cells by niclosamide via blockade of the function and expression of SLC38A5 and SLC7A11. Antioxidants 2024, 13, 291. [Google Scholar] [CrossRef]
- Fennell, M.; Commisso, C.; Ramirez, C.; Garippa, R.; Bar-Sagi, D. High-content, full genome siRNA screen for regulators of oncogenic HRAS-driven macropinocytosis. Assay Drug Dev. Technol. 2015, 13, 347–355. [Google Scholar] [CrossRef]
- Commisso, C.; Flinn, R.J.; Bar-Sagi, D. Determining the macropinocytic index of cells through a quantitative image-based assay. Nat. Protoc. 2014, 9, 182–192. [Google Scholar] [CrossRef] [PubMed]
- Matsuoka, Y.; Yamada, K.I. Detection and structural analysis of lipid-derived radicals in vitro and in vivo. Free Radic. Res. 2021, 55, 441–449. [Google Scholar] [CrossRef] [PubMed]
- Yamada, K.I.; Mito, F.; Matsuoka, Y.; Ide, S.; Shikimachi, K.; Fujiki, A.; Kusakabe, D.; Ishida, Y.; Enoki, M.; Tada, A.; et al. Fluorescence probes to detect lipid-derived radicals. Nat. Chem. Biol. 2016, 12, 608–613. [Google Scholar] [CrossRef]
- Kim, H.; Xue, X. Detection of total reactive oxygen species in adherent cells by 2’.7’-dichlorodihydrofluorescein diacetate staining. J. Vis. Exp. 2020, 160, 10–3791. [Google Scholar]
- Yang, J.; Zhang, W.; Evans, P.W.; Chen, X.; He, X.; Liu, C. Adenomatous polyposis coli (APC) differentially regulates β-catenin phosphorylation and ubiquitination in colon cancer cells. J. Biol. Chem. 2006, 281, 17751–17757. [Google Scholar] [CrossRef]
- Ahmed, D.; Eide, P.W.; Ellertsen, I.A.; Danielsen, S.A.; Eknaes, M.; Hektoen, M.; Lind, G.E.; Lothe, R.A. Epigenetic and genetic features of 24 colon cancer cell lines. Oncogenesis 2013, 2, e71. [Google Scholar] [CrossRef]
- Berg, K.C.G.; Eide, P.W.; Ellertsen, I.A.; Johannessen, B.; Bruun, J.; Danielsen, S.A.; Bjornslett, M.; Meza-Zepeda, L.A.; Eknaes, M.; Lind, G.E.; et al. Multi-omics of 34 colorectal cancer cell lines – a resource for biomedical studies. Mol. Cancer 2017, 16, 116. [Google Scholar] [CrossRef] [PubMed]
- Proto, M.C.; Fiore, D.; Piscopo, C.; Francesschelli, S.; Bizzarro, V.; Laezza, C.; Lauro, G.; Feoli, A.; Tosco, A.; Bifulco, G.; et al. Inhibition of Wnt/β-catenin pathway and histone acetyltransferase activity by Rimonabant: a therapeutic target for colon cancer. Sci. Rep. 2017, 7, 11678. [Google Scholar] [CrossRef]
- Medico, E.; Russo, M.; Picco, G.; Cancelliere, C.; Valtorta, E.; Corti, G.; Buscarino, M.; Isella, C.; Lamba, S.; Martinoglio, B.; et al. The molecular landscape of colorectal cancer cell lines unveils clinically actionable kinase targets. Nat. Commun. 2015, 6, 7002. [Google Scholar] [CrossRef] [PubMed]
- Veettil, M.V.; Kumar, B.; Ansari, M.A.; Dutta, D.; Iqbal, J.; Gjyshi, O.; Bottero, V.; Chandran, B. ESCRT-o component Hrs promotes macropinocytosis of Kaposi’s sarcoma-associated Herpesvirus in human dermal microvascular endothelial cells. J. Virol. 2016, 90, 3860–3872. [Google Scholar] [CrossRef]
- Lin, H.P.; Singla, B.; Ahn, W.; Ghoshal, P.; Blahove, M.; Cherian-Shaw, M.; Chen, A.; Haller, A.; Hui, D.Y.; Dong, K.; et al. Receptor-independent fluid-phase micropinocytosis promotes arterial foam cell formation and atherosclerosis. Sci. Transl. Med. 2022, 14, eadd2376. [Google Scholar] [CrossRef]
- Ramachandran, S.; Sennoune, S.R.; Sharma, M.; Thangaraju, M.; Suresh, V.V.; Sneigowski, T.; Bhutia, Y.D.; Pruitt, K.; Ganapathy, V. Expression and function of SLC38A5, an amino acid-coupled Na+/H+ exchanger, in triple-negative breast cancer and its relevance to macropinocytosis. Biochem. J. 2021, 478, 3957–3976. [Google Scholar] [CrossRef] [PubMed]
- Bhutia, Y.D.; Mathew, M.; Sivaprakasam, S.; Ramachandran, S.; Ganapathy, V. Unconventional functions of amino acid transporters: Role in macropinocytosis (SLC38A5/SLC38A3) and diet-induced obesity/metabolic syndrome (SLC6A19/SLC6A14/SLC6A6). Biomolecules 2022, 12, 235. [Google Scholar] [CrossRef] [PubMed]
- Degirmenci, U.; Wang, M.; Hu, J. Targeting aberrant RAS/RAF/MEK/ERK signaling for cancer therapy. Cells 2020, 9, 198. [Google Scholar] [CrossRef]
- Song, Y.; Bi, Z.; Liu, Y.; Qin, F.; Wei, Y.; Wei, X. Targeting RAS-RAF-MEK-ERK signaling pathway in human cancer: Current status in clinical trials. Genes Dis. 2023, 10, 76–88. [Google Scholar] [CrossRef] [PubMed]
- Gimple, R.C.; Wang, X. RAS: Striking at the core of the oncogenic circuitry. Front. Oncol. 2019, 9, 965. [Google Scholar] [CrossRef] [PubMed]
- Mahauad-Fernandez, W.D.; Felsher, D.W. The Myc and Ras partnership in cancer: Indistinguishable alliance or contextual relationship? Cancer Res. 2020, 80, 3799–3802. [Google Scholar] [CrossRef] [PubMed]
- Wise, D.R.; DeBerardinis, R.J.; Mancuso, A.; Sayed, N.; Zhang, X.Y.; Pfeiffer, H.K.; Nissim, I.; Dalkhin, E.; Yudkoff, M.; McMahon, S.B.; Thompson, C.B. Myc regulates a transcriptional program that stimulates mitochondrial glutaminolysis and leads to glutamine addiction. Proc. Natl. Acad. Sci. USA 2008, 105, 18782–18787. [Google Scholar] [CrossRef] [PubMed]
- Forcina, G.C.; Dixon, S.J. GPX4 at the crossroads of lipid homeostasis and ferroptosis. Proteomics 2019, 19, e1800311. [Google Scholar] [CrossRef]
- Koppula, P.; Zhuang, L.; Gan, B. Cystine transporter SLC7A11/xCT in cancer: Ferroptosis, nutrient dependency, and cancer therapy. Protein Cell 2021, 12, 599–620. [Google Scholar] [CrossRef]
- Lee, J.; Roh, J.L. SLC7A11 as a gateway of metabolic perturbation and ferroptosis vulnerability in cancer. Antioxidants 2022, 11, 2444. [Google Scholar] [CrossRef]
- Fotiadis, S.; Kanai, Y.; Palacin, M. The SLC3 and SLC7 families of amino acid transporters. Mol. Aspects Med. 2013, 34, 139–158. [Google Scholar] [CrossRef]
- Xia, P.; Dubrovska, A. CD98 heavy chain as a prognostic biomarker and target for cancer treatment. Front. Oncol. 2023, 13, 1251100. [Google Scholar] [CrossRef]
- Li, Y.; Li, P.K.; Roberts, M.J.; Arend, R.C.; Samant, R.S.; Buchsbaum, D.J. Multi-targeted therapy of cancer by niclosamide: A new application for an old drug. Cancer Lett. 2014, 349, 8–14. [Google Scholar] [CrossRef] [PubMed]
- Hamilton, G.; Rath, B. Repurposing of anthelminthics as anticancer drugs. Oncomedicine 2018, 3, 1–8. [Google Scholar] [CrossRef]
- Laudisi, F.; Maronek, M.; di Grazia, A.; Monteleone, G.; Stolfi, C. Repositioning of anthelmintic drugs for the treatment of cancers of the digestive system. Int. J. Mol. Sci. 2020, 21, 4957. [Google Scholar] [CrossRef] [PubMed]
- Tao, H.; Zhang, Y.; Zeng, X.; Shulman, G.I.; Jin, S. Niclosamide ethanolamine-induced mild mitochondrial uncoupling improves diabetic symptoms in mice. Nat. Med. 2014, 20, 1263–1269. [Google Scholar] [CrossRef] [PubMed]
- Kauerova, T.; Perez-Perez, M.J.; Kollar, P. Salicylanilides and their anticancer properties. Int. J. Mol. Sci. 2023, 24, 1728. [Google Scholar] [CrossRef] [PubMed]
- Miotto, G.; Rossetto, M.; Di Paolo, M.L.; Orian, L.; Venerando, R.; Roveri, A.; Vuckovic, A.M.; Travain, V.B.; Zaccarin, M.; Zennaro, L.; et al. Insight into the mechanism of ferroptosis inhibition by ferrostatin-1. Redox Biol. 2020, 28, 101328. [Google Scholar] [CrossRef]
- Zilka, O.; Shah, R.; Li, B.; Angeli, J.P.F.; Griesser, M.; Conrad, M.; Pratt, D.A. On the mechanism of cytoprotection by ferrostatin-1 and liproxstatin-1 and the role of lipid peroxidation in ferroptotic cell death. ACS Cent. Sci. 2017, 3, 232. [Google Scholar] [CrossRef]
- Hollestelle, A.; Elstrodt, F.; Nagel, J.H.A.; Kallemeijn, W.W.; Schutte, M. Phosphatidylinositol-3-OH kinase or RAS pathway mutations in human breast cancer cell lines. Mol. Cancer Res. 2007, 5, 195–201. [Google Scholar] [CrossRef]
- Kim, R.K.; Suh, Y.; Yoo, K.C.; Cui, Y.H.; Kim, H.; Kim, M.J.; Kim, I.G.; Lee, S.J. Activation of KRAS promotes the mesenchymal features of basal-type breast cancer. Exp. Mol. Med. 2015, 47, e137. [Google Scholar] [CrossRef] [PubMed]
- Hui, L.; Zheng, Y.; Yan, Y.; Bargonetti, J.; Foster, D.A. Mutant p53 in MDA-MB-231 breast cancer cells is stabilized by elevated phospholipase D activity and contributes to survival signals generated by phospholipase D. Oncogene 2006, 25, 7305–7310. [Google Scholar] [CrossRef] [PubMed]
- Mathew, M.; Nguyen, N.T.; Bhutia, Y.D.; Sivaprakasam, S.; Ganapathy, V. Metabolic signature of Warburg effect in cancer: An effective and obligatory interplay between nutrient transporters and catabolic/anabolic pathways to promote tumor growth. Cancers (Basel) 2024, 16, 504. [Google Scholar] [CrossRef] [PubMed]
- Nakanishi, T.; Kekuda, R.; Fei, Y.J.; Hatanaka, T.; Sugawara, M.; Martindale, R.G.; Leibach, F.H.; Prasad, P.D.; Ganapathy, V. Cloning and functional characterization of a new subtype of the amino acid transport system N. Am. J. Physiol. Cell Physiol. 2001, 281, C1757–C1768. [Google Scholar] [CrossRef]
- Sniegowski, T.; Korac, K.; Bhutia, Y.D.; Ganapathy, V. SLC6A14 and SLC38A5 drive the glutaminolysis and serine-glycine-one-carbon pathways in cancer. Pharmaceuticals (Basel) 2021, 14, 216. [Google Scholar] [CrossRef]
- Shen, X.; Wang, G.; He, H.; Shang, P.; Yan, B.; Wang, X.; Shen, W. SLC38A5 promotes glutamine metabolism and inhibits cisplatin chemosensitivity in breast cancer. Breast Cancer 2024, 31, 96–104. [Google Scholar] [CrossRef]
- Sniegowski, T.; Rajasekaran, D.; Sennoune, S.R.; Sunitha, S.; Chen, F.; Fokar, M.; Kshirsagar, S.; Reddy, P.H.; Korac, K.; Mahmud Syed, M.; et al. Amino acid transporter SLC38A5 is a tumor promoter and a novel therapeutic target for pancreatic cancer. Sci. Rep. 2023, 13, 16863. [Google Scholar] [CrossRef]
- Kim, M.J.; Kim, H.S.; Kang, H.W.; Lee, D.E.; Hong, W.C.; Kim, J.H.; Kim, M.; Cheong, J.H.; Kim, H.J.; Park, J.S. SLC38A5 modulates ferroptosis to overcome gemcitabine resistance in pancreatic cancer. Cells 2023, 12, 2509. [Google Scholar] [CrossRef]
- Girardi, E.; Cesar-Razquin, A.; Lindinger, S.; Papakostas, K.; Konecka, J.; Hemmerich, J.; Kickinger, S.; Kartnig, F.; Gurti, B.; Klavins, K.; et al. A widespread role for SLC transmembrane transporters in resistance to cytotoxic drugs. Nat. Chem. Biol. 2020, 16, 469–478. [Google Scholar] [CrossRef]
- Ivanov, A.I. Pharmacological inhibition of endocytic pathways: is it specific enough to be useful? Methods Mol. Biol. 2008, 440, 15–33. [Google Scholar]
- Hassannia, R.; Vandenabeele, P.; Vanden Berghe, T. Targeting ferroptosis to iron out cancer. Cancer Cell 2019, 35, 830–849. [Google Scholar] [CrossRef] [PubMed]
- Rodriguez, R.; Schreiber, S.L.; Conrad, M. Persister cancer cells: Iron addiction and vulnerability to ferroptosis. Mol. Cell 2022, 82, 728–740. [Google Scholar] [CrossRef] [PubMed]
- Sivaprakasam, S.; Ristic, B.; Mudaliar, N.; Hamood, A.N.; Colmer-Hamood, J.; Wachtel, M.S.; Nevels, A.G.; Kottapalli, K.R.; Ganapathy, V. Hereditary hemochromatosis promotes colitis and colon cancer and causes bacterial dysbiosis in mice. Biochem. J. 2020, 477, 3867–3883. [Google Scholar] [CrossRef] [PubMed]
- Figuera-Losada, M.; Thomas, A.G.; Stathis, M.; Stockwell, B.R.; Rojas, C.; Slusher, B.S. Development of a primary microglia screening assay and its use to characterize inhibition of system xc− by erastin and its analogs. Biochem. Biophys. Rep. 2017, 9, 266–272. [Google Scholar] [CrossRef]
- Zhang, Y.; Tan, H.; Daniels, J.D.; Zandkarimi, F.; Liu, H.; Brown, L.M.; Uchida, K.; O’Conner, O.A.; Stockwell, B.R. Imidazole ketone erastin induces ferroptosis and slows tumor growth in a mouse lymphoma model. Cell Chem. Biol. 2019, 26, 623–633. [Google Scholar] [CrossRef]
- Barbosa, E.J.; Lobenberg, R.; Barros de Araujo, G.L.; Bou-Chacra, N.A. Niclosamide repositioning for treating cancer: Challenges and nano-based drug delivery opportunities. Eur. J. Pharm. Biopharm. 2019, 141, 58–69. [Google Scholar] [CrossRef]
- Parikh, M.; Liu, C.; Wu, C.Y.; Evans, C.P.; Dall’Era, M.; Robles, D.; Lara, P.N.; Agarwal, N.; Gao, A.C.; Pan, C.X. Phase Ib trial of reformulated niclosamide with abiraterone/prednisone in men with castration-resistant prostate cancer. Sci. Rep. 2021, 11, 6377. [Google Scholar] [CrossRef]


| Gene/Cell Line | HCT-116 | HCT-116/p53 KO | SW48 | SW48/KRAS mutant |
|---|---|---|---|---|
| APC | Wild type | Wild type | Wild type | Wild type |
| KRAS | pGly13Asp (G13D) |
pGly13Asp (G13D) |
Wild type | pGly12Asp (G12D) |
| TP53 (p53) | Wild type | Deleted | Wild type | Wild type |
Disclaimer/Publisher’s Note: The statements, opinions and data contained in all publications are solely those of the individual author(s) and contributor(s) and not of MDPI and/or the editor(s). MDPI and/or the editor(s) disclaim responsibility for any injury to people or property resulting from any ideas, methods, instructions or products referred to in the content. |
© 2024 by the authors. Licensee MDPI, Basel, Switzerland. This article is an open access article distributed under the terms and conditions of the Creative Commons Attribution (CC BY) license (https://creativecommons.org/licenses/by/4.0/).


