Introduction
The emergence of the coronavirus disease 2019 (COVID-19) pandemic sparked global responses to combat the spread of the severe acute respiratory syndrome virus 2 (SARS-CoV-2). Across these efforts, significant emphasis was placed on developing diagnostic reagents and technologies for detecting the virus. These belong primarily to two classes: Nucleic Acid Amplification Tests (NAAT) to detect the viral genome and Affinity ligands (Antibodies and Aptamers) to detect viral antigenic proteins [
1]. NAAT is generally more sensitive than antigen testing; however, the assay requirements for these tests are usually a barrier to their mass deployment. Therefore, antigen-based tests like lateral flow immunoassay (LFIA), which are easy to use and cost-effective, are preferred for point-of-care and home-based testing.
Although some time has passed since the onset of the global pandemic, the development and modification of existing and novel tests have continued to seek improvements in areas including accuracy, cost, and futureproofing against future virus variants [
2,
3].
In the United States, testing development was supported by the Radical Acceleration of Diagnostics programs (RADx) financed under Operation Warp Speed [
4]. These included programs to quickly raise US capacity (RADx-tech), ensure equitable deployment (RADx-UP), and develop the next generation of “radical” diagnostics (RADx-rad) [
5].
A primary driver for the further development of diagnostic technologies in the RADx-rad program was to develop technologies to tackle the continuing mutability of SARS-CoV-2. Regions within the structural proteins targeted by diagnostic technologies can mutate to diminish recognition or avoid it altogether. This constant mutation has allowed SARS-CoV-2 to remain a public health threat, forcing constant adaptation in tests and treatments that target evolving regions. This is exemplified by the Spike (S) protein, a common target in therapy, rapid antigen tests, and NAAT due to its outward-facing positioning on the virus’s surface. Although its accessibility and direct role in cellular binding and fusion make Spike a sensible target for recognizing functional virions, frequent mutations in several Spike regions allow it to evade detection and neutralization easily [
6,
7]. While tests can be modified to account for mutations, tests targeting variable regions of the virus remain relevant only to the specific variants they were developed against.
While variant-specific diagnostics are essential in detecting the virus’s presence and identifying which variant is causing the infection, a more broadly applicable testing method is still needed. It is crucial to trust that a negative COVID-19 test result is due to a lack of the virus rather than the test’s inability to detect an unaccounted-for variant.
An ideal diagnostic test would target an abundant protein’s region that is sufficiently general to detect the presence of any variant yet specific enough to avoid detecting other pathogens with similar presentations. Targeting an exposed protein region of the virus far less prone to mutations could allow the test to apply to past and future virus variants.
The SARS-CoV-2 nucleocapsid (N) is the most abundant structural protein [
8] with historically high conservation, making it a target for many current diagnostics [
9]. The N-protein is essential in the virus’s life cycle and is responsible for binding and packaging the viral genome into the ribonucleoprotein complex (RNP) [
10]. The protein also plays accessory roles in immune regulation by suppressing viral RNA silencing and assisting in the transcription and replication of viral mRNA [
11]. The 419-amino-acid (aa) length N-protein comprises both intrinsically disordered regions (IDRs) and regions with conserved structures, with discrete N-terminal and C-terminal domains present [
9,
12].
Most at-home COVID-19 test assays target N-protein, utilizing its abundance to offer speed and sensitivity. The protein is also highly immunogenic, allowing an overwhelming proportion of antibodies to be raised against it following infection [
9,
13]. The N-protein serves as a reasonable target due to its decreased tendency for mutation compared to other structural proteins, though it is still susceptible to mutation. It mutates at fewer amino acid positions than the Spike and Envelope (E) proteins, though it does at slightly more positions than the Membrane (M) protein [
13,
14,
15]. Despite its improved reliability, it can still mutate and subvert diagnostic recognition [
16]. For instance, mutations in its NTD or linker region can reduce the sensitivity or subvert detection from at-home rapid antigen tests [
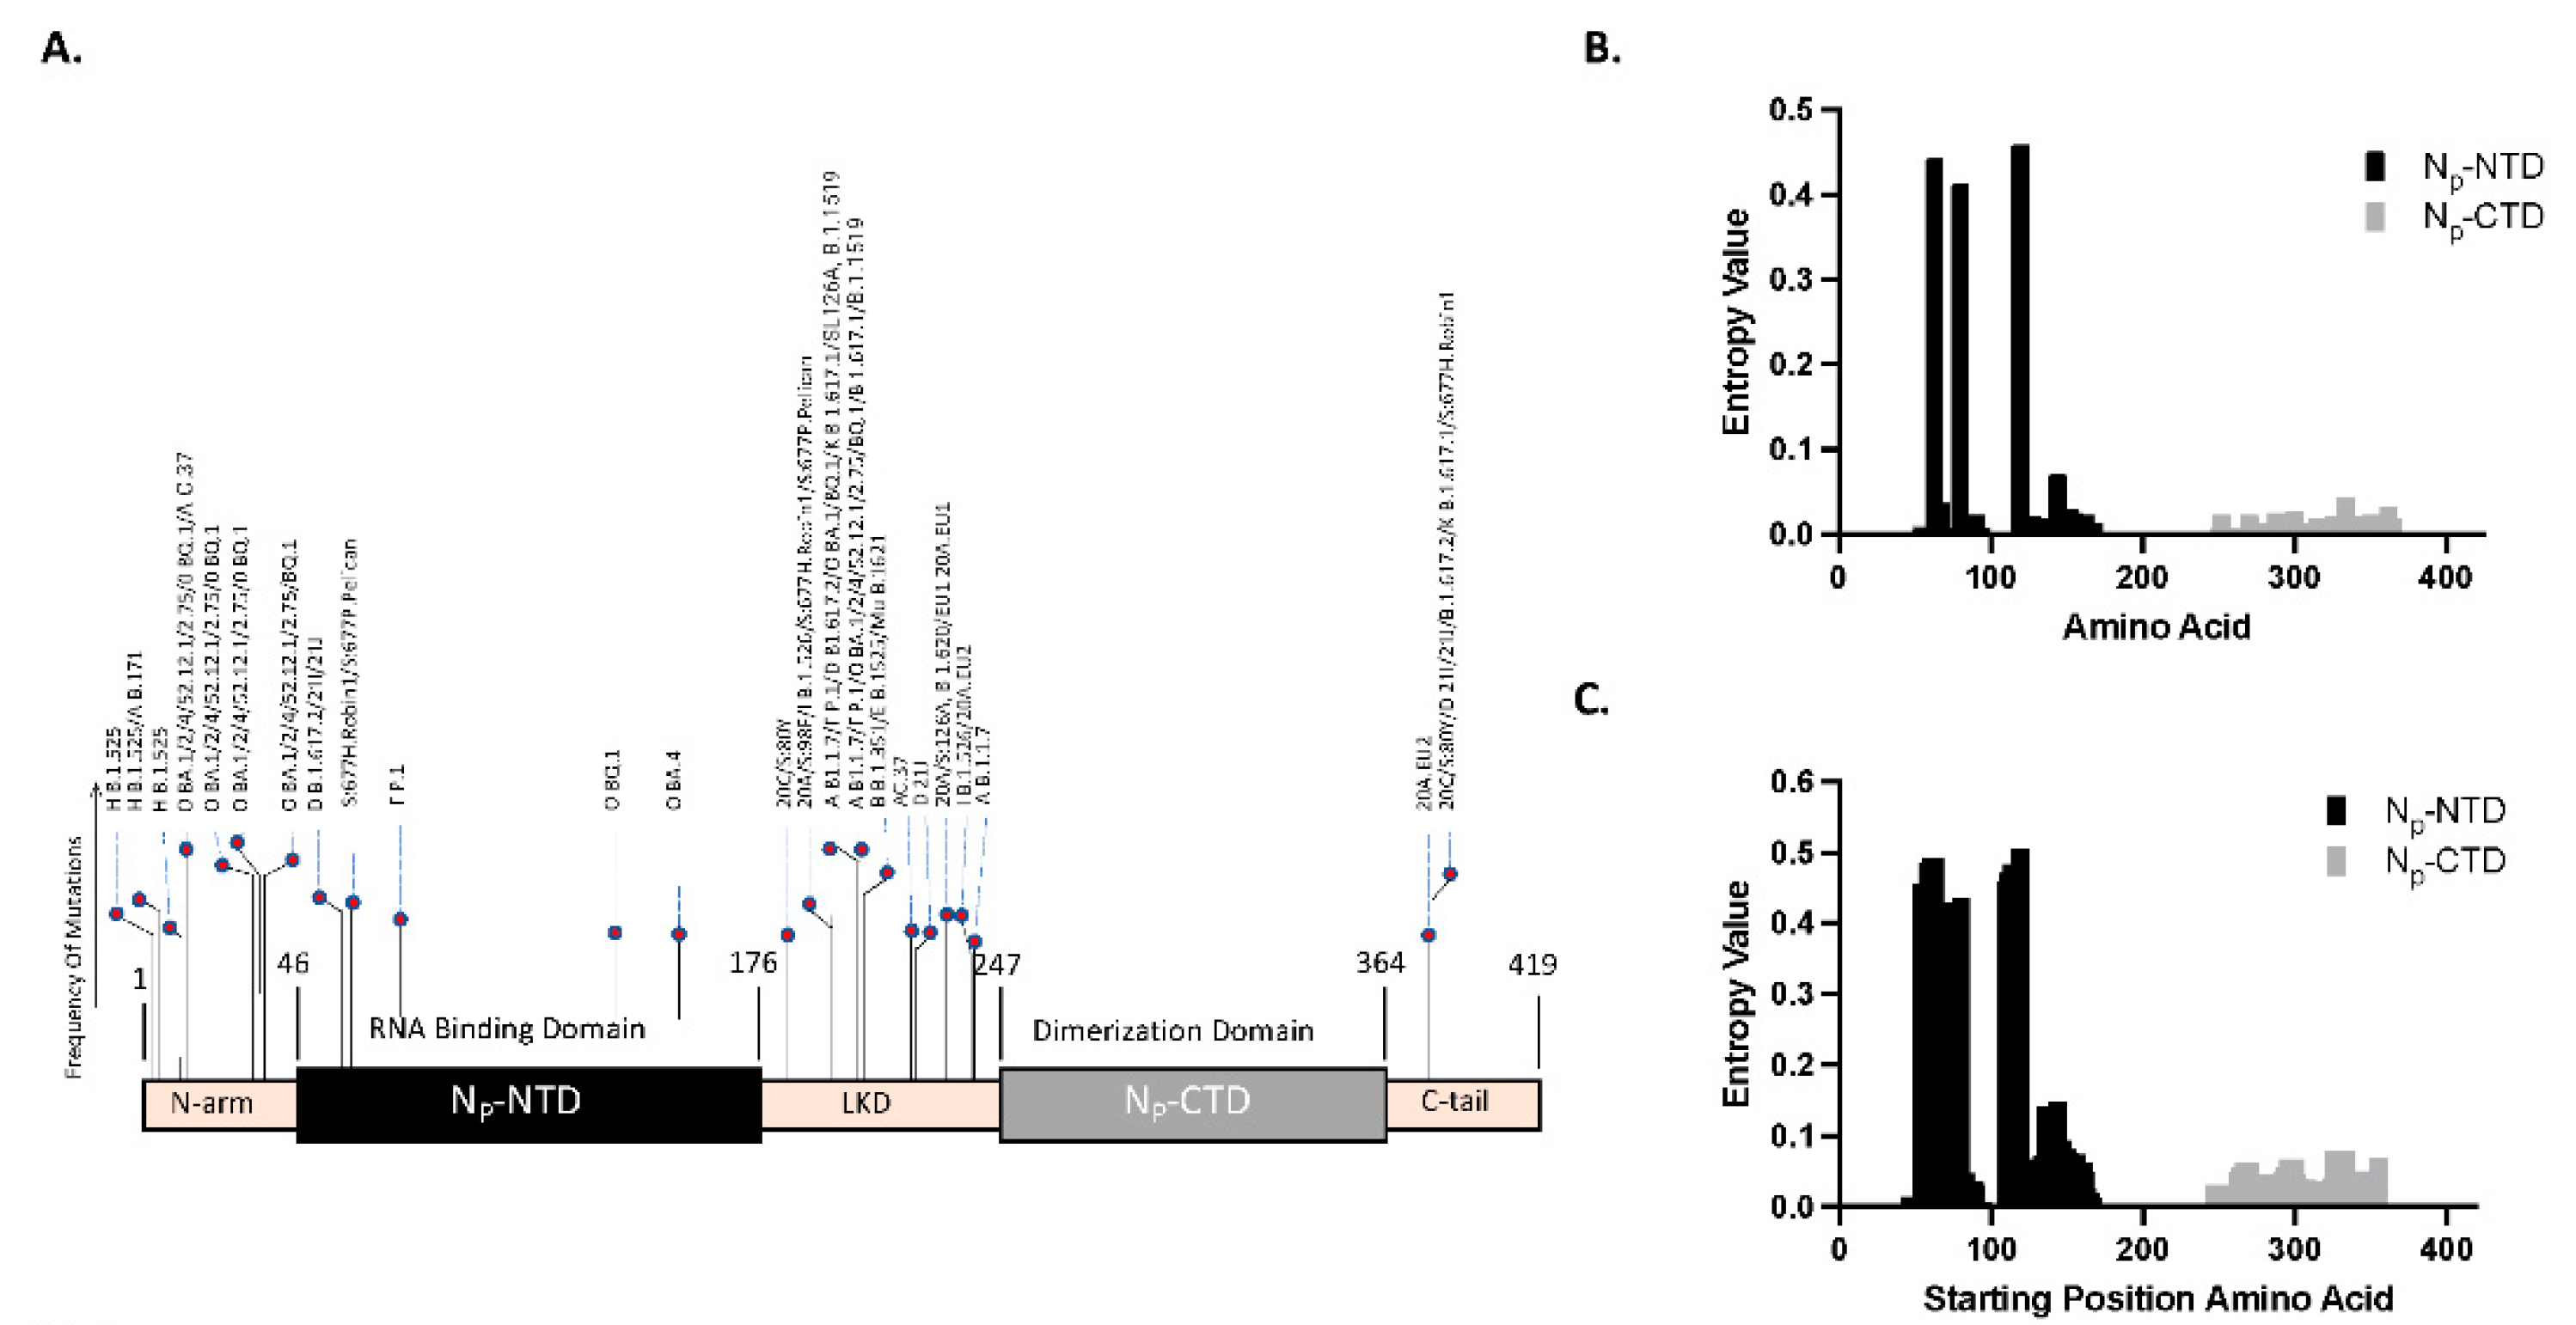
17]. If mutations in the nucleocapsid protein consistently occur in localized areas, other regions may not see frequent mutations. If areas within the N-protein are conserved between viral variants, they could serve as potential antigenic regions for antibody development in the novel, multi-variant COVID-19 assays.
Observing the mutation rate between viral variants within each open reading frame (ORF) allows for identifying specific amino acid positions or regions particularly resistant to mutation. Although many N-protein mutations have been identified within the SARS-CoV-2 variants, most N-protein mutations do not map to the CTD, indicating resistance [
18,
19]. This indicates the potential of the CTD region as a target for antibody development. These findings can be corroborated using computational methods to identify regions of lower mutability separately.
An unbiased bioinformatics approach to sequence analysis can be implemented to calculate the entropy of regions within the nucleocapsid’s genetic sequence. Regions more prone to mutation will exhibit higher entropy across viral variants, while more conserved regions will exhibit lower calculated entropic values. Low entropy regions can then serve as potential antigenic regions to produce antibodies for diagnostics.
This work describes methods developed by the Diagnostic core of the RADx-rad program to accelerate tests that are sensitive and robust to mutation while remaining specific enough for clinical utility. Two central roadblocks exist to such development. First, there is access to variants for testing that may be difficult to obtain, out of circulation, or poorly standardized; and second, the availability of tools to quickly design reagents targeting constant regions within the viral genome. To achieve this, we developed standardized, inactivated viral quality assurance panels that could be used for test development at lower levels of biohazard containment. At the same time, validating these panels themselves required rapid development and standardization of quantitative tests to both host of and evolving variants. To achieve this, we employed a hybrid bioinformatic approach that could be automated to detect invariant viral regions preserved in SARS-COV-2 in a process that can be readily generalized. We herein describe the computational approach for target selection, reagent, and antigen-based assay development, and we demonstrate its efficacy with validated VQAs employed in the RADx program.
Materials and Methods
We present a case study of targeting sub-regions of the N-protein. N-protein was chosen due to its abundance and historical use cases for antigen-based testing. The process hinges on analyzing the comparative variability of the CTD and NTD regions of the SARS-COV-2 N-protein. While individual tools allow the assessment of defining mutations [
20,
21] or amino acid variability [
22], there remain no accessible pipelines to conduct flexible variability analysis and comparison at scale quickly. We developed a workflow employing a combination of existing and new tools to facilitate this and similar exploration. This work used genomic sequence data shared via GISAID, the global science initiative [
23].
Community Sourced “Defining Mutations”: When navigating the landscape of SARS-CoV-2 mutations, a primary source of insight emerges from examining consensus SARS-CoV-2 “Defining Mutations,” accessible via the CoVariants website [
20]. These mutations signify the phylogenetic root of a variant and can be detected by examining a variant’s root node on a Nextstrain tree [
21]. A machine-readable compendium of defining mutations for each variant is also available on the CoVariants GitHub page. We began our investigation into sequence variability by examining these sources.
Shannon Entropy Diversity Metric: Mutation analysis typically incorporates one of three widely accepted metrics for quantifying uncertainty: Wu-Kabat Variability analysis [
24], Simpson’s Diversity [
25], and Shannon entropy [
26]. Here, we focus on Shannon entropy. Given a discrete random variable with M distinct realizations and
the probability of realization i, Shannon’s Information Entropy (H) is
Entropy measures the level of ‘randomness’ or ‘disorder’ within the random process and is widely used across many disciplines [
27,
28,
29,
30]. A process with high predictability and low variability has low entropy and vice versa. In biological systems, Shannon’s methods have provided a statistically sound measure of system diversity and sequence analyses [
31,
32,
33,
34]. The entropy information analysis eliminates serious bias and exhibits more stability than the Wu-Kabat and second-generation measures of diversity.
Single Amino Acid Variability: In gene sequence alignments, Shannon entropy has been used to quantify conservative locations by comparing the frequency of amino acid [
35] or nucleotide [
36] realizations at a given position. For amino acid conservation, related sequences are aligned, and entropy is estimated across the alignment for each amino acid position, j. As the total number of amino acid types is 20, we estimate the Shannon entropy at position j as
where
represents the count of amino acid i at position j, and
the total number of aligned sequences. Here, the estimated entropy
can range from 0 to 4.322. A value of 0 indicates that only one type of residue is present at that position, signifying complete conservation. On the other hand, a maximum value of 4.322 signifies complete variability, where all 20 types of residues are equally represented at that position [
37].
Epitope Windowed Shannon Entropy: In our study, we first evaluate the amino acid entropy as a point-based evaluation described above, then consider entropy over an alternate basis to concentrate on short sequences instead of individual residues. That is, we evaluate strings of amino acids that would represent the epitope binding sites. Given that the epitopes typically range in size from 4 to 12 amino acids long [
38], we chose to focus our analysis on an epitope window size of 10 amino acids. The entropy of the window centered at position j is then estimated with:
Where is the total number of possible amino acid sequences of length 10, and is the count of the jth such sequence at position i among aligned isolates.
This metric, which applies entropy to a window of 10 amino acids, was designed to more accurately gauge the impact of mutations on the linear epitope structure and subsequent antibody recognition. Our approach more faithfully represents the consequences of comprehensive changes within the linear epitope region than single-point mutation analysis.
Sample Collection and Preparation: Sequence analysis in this study used 1800 genomic sequences available on GISAID collected from 5/20/2020 to 4/5/2023. This dataset is accessible at 10.55876/gis8.240302kp, and contains 150 sequences each from the 12 WHO variants (e.g., Alpha, Beta, Gamma, Delta, Iota, Mu, Omicron, Eta, Kappa, Lambda, Epsilon, Zeta). The sequences were screened to be “complete” reads, as many genomic data in GISAID are partial sequences. Any sequences containing “no read” sections were eliminated and replaced with an alternate sample from GISAID. The complete dataset was further processed by aligning and cropping the sequences to limit the ORF portion of the N protein. This dataset was then translated into amino acid form. The entire N protein represents 419 amino acids, the NTD is 131 amino acids, and the CTD is 118 [
14]. Only the NTD and CTD amino acids were used for Shannon entropy analysis.
Statistics: For our statistical approach, we compared the Shannon entropy values extracted from the N-terminal domain (NTD) and the C-terminal domain (CTD) through a Wilcoxon rank-sum analysis. This non-parametric test is suitable for comparing two independent samples. The Wilcoxon rank-sum analysis enables us to evaluate whether the differences in the entropy values from the two regions are statistically significant, i.e., whether one region exhibits a significantly greater degree of sequence variability than the other. This approach of using a hypothesis test to compare mean entropy values has been used, e.g., to compare mutation frequency across subsequent waves of SARS-COV-2 in Pakistan [
39].
Cloning and Expression of SARS-CoV-2 Nucleocapsid (Np) protein subdomains:
The Nucleocapsid protein has two major structural and functional units: the N-terminal domain (NTD) and the C-terminal domain (CTD). The NTD (aa 46-176) is a disordered region responsible for RNA binding, achieving this through a positively charged cavity between the domain’s core and a basic β-hairpin [
9,
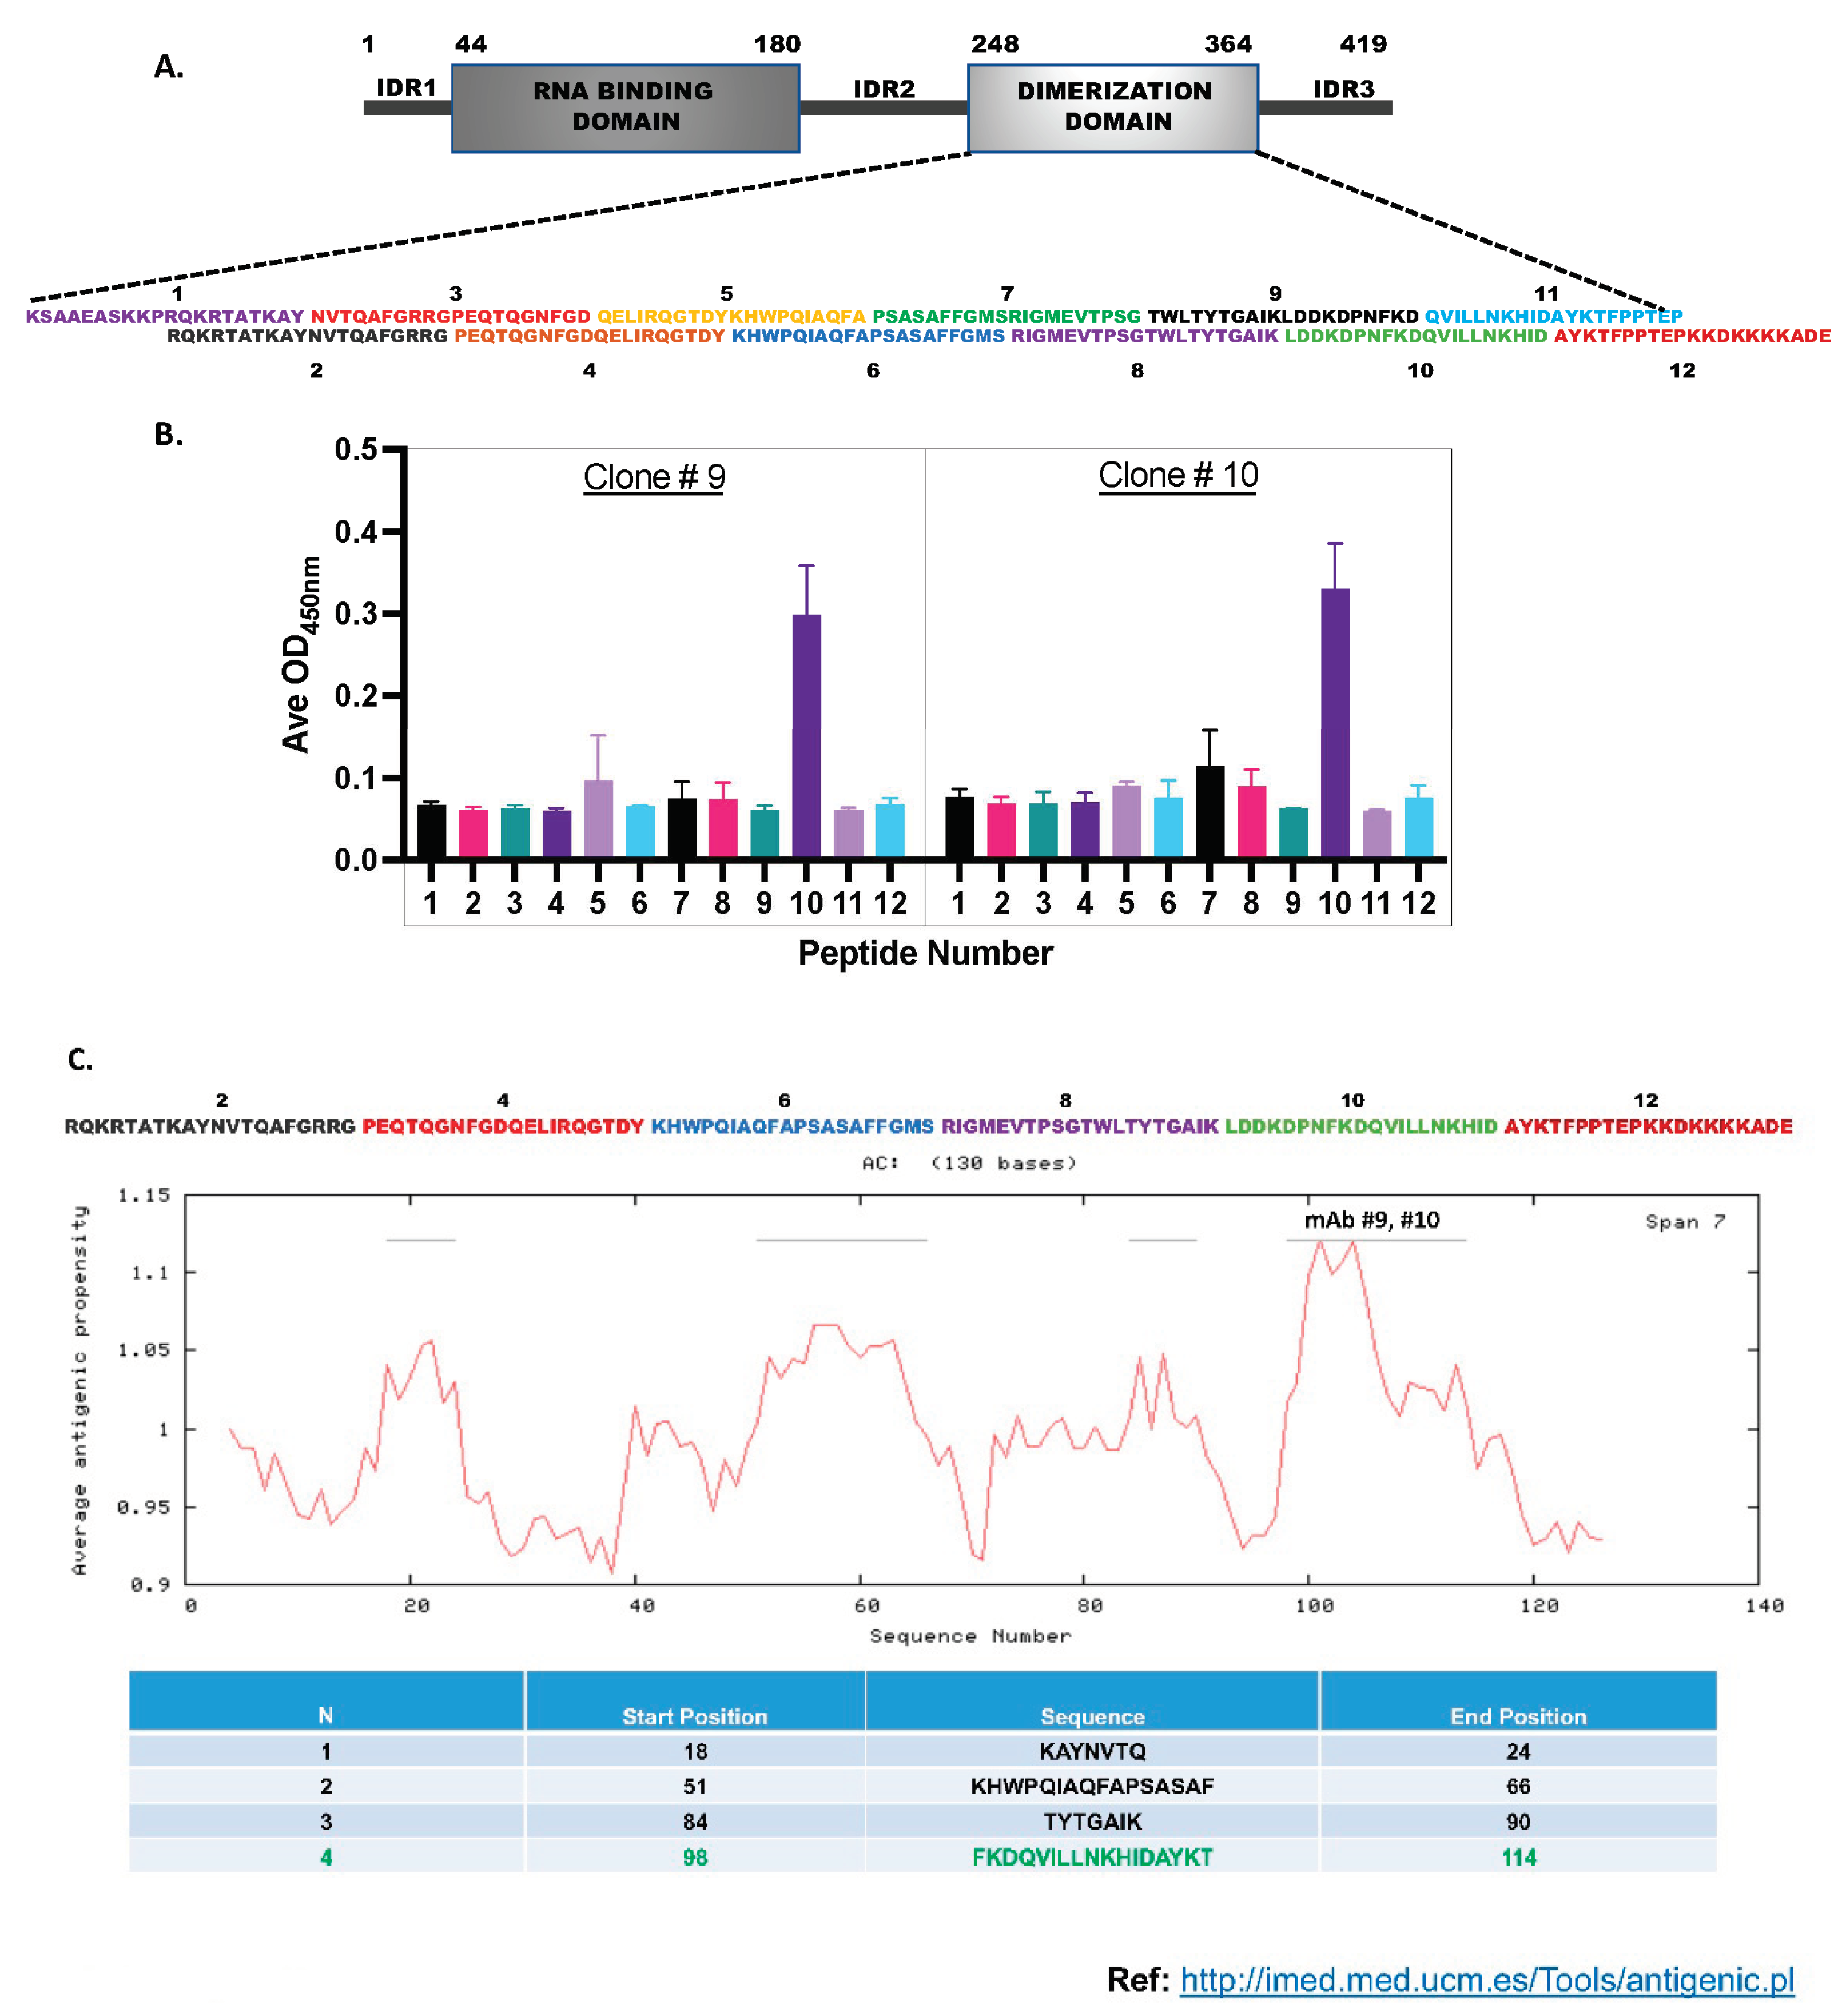
12]. The CTD (aa 247-364) is responsible for dimerization and can also bind with RNA [
12]. An IDR linker domain (LKD) (aa 177-246) connects the NTD and CTD, and each domain contains an additional N-terminal arm (aa 1-45) and C-terminal arm (aa 365-419) on its outer edges [
11]. We cloned and expressed these domains separately for this study.
The Np-CTD was expressed from the pUNO1His-plasmid vector (Invivogen). Briefly, the target portion of the Np open reading frame (ORF) expressing the residues Np-CTD (Lys248-Pro364) was PCR amplified from the pUNO1His-SARS2-N plasmid vector (4.7kb) (Invivogen. Catalog code: p1his-cov2-n) using the primers: F1- Forward primer (Xho1 overhang) and R1- Reverse primer (BamH1 overhang) and ligated to the pUNO1His-plasmid vector, using its Xho1 and BamH1 restriction sites (Supplementary Figure S1). The ligated plasmids were transformed into chemically competent bacterial cells (Subcloning Efficiency™ DH5α Competent Cells Catalog number: 18265017). Individual bacterial colonies were isolated from the Luria Broth (LB) agar plates with a Blasticidin (Invivogen, ant-bl-10p) antibiotic section. Following this, the selected clones were propagated in LB media with Blasticidin, and the plasmid DNA was isolated from the bacterial cells using DNA isolation protocol (Qiagen Miniprep kits, Cat. No. / ID: 27104).
Similarly, the N Terminal portion (Met1-Thr247) of the Np was PCR amplified from the pUNO1His-SARS2-N plasmid vector and subcloned in the pUNO1His-plasmid vector using the primers: F2- Forward primer (Xho1 overhang) and R2-Reverse primers (BamH1 overhang), using the similar method mentioned above (
Table 1)
All the primers were ordered from IDT (Integrated DNA Technologies, Inc., Coralville, Iowa). DNA sequencing was performed on the plasmid DNA vectors from selected clones to ensure the correct ORF sequences.
The clones, pUNO1His-SARS2-N, pUNO1His-SARS2-Np-CTD, and pUNO1His-SARS2- Np-NT, were transfected into HEK293 cells following the standard Lipofectamine 3000 Reagent (Invitrogen, Catalog number: L3000001) protocol for the expression of Np-Full length, Np-CTD, and Np-NT proteins, respectively:
The recombinant proteins were expressed in mammalian cells with a Carboxy terminal Histidine tag (6X-HIS) and secreted in the cell media (Conditioned media) (
Supplementary Figure S1). Protein expression was additionally verified using the Western blot (data not shown).
Cell Culture: HEK293 cells obtained from the (ATCC: CRL-1573) were grown in Dulbecco’s Modified Eagle’s Medium, DMEM (Gibco, Catalog number: 11965118) media containing 10% Fetal Bovine serum, FBS (Gibco, Catalog number: A5670701) and 1% Penicillin-Streptomycin antibiotics (Gibco, Catalog number: 15140122). VeroE6/TMPRSS2 cells (Sekisui XenoTech) are the VeroE6 cell line modified to express the serine protease TMPRSS2 under Geneticin selection. The cell line is used to produce large stocks of SARS-CoV-2 virus. The cells were grown in DMEM media with 10% Heat inactivated FBS, 2 mM Glutamine, and 1mg/ml of Geneticin (G418). Calu-3 (ATCC: HTB-55) is a lung carcinoma of human epithelial cells used to grow SARS-CoV-2. These cells were grown in DMEM with 1% non-essential amino acids, 2 mM L-glutamine, 1 mM sodium pyruvate, 1.0 g/L glucose, and 20% FBS. All cells were grown at 37ºC under standard tissue culture conditions.
Western Blots: Whole Cell lysates or the conditioned media were collected from HEK293 cells transiently expressing the Np-FL, Np-CTD, and Np-NT and subjected to the SDS-PAGE technique to resolve the proteins. The proteins were then transferred to a PVDF (Bio-Rad, Catalogue: 1620177) membrane using a gel-transfer apparatus and subjected to Western blotting using mouse monoclonal anti-nucleoprotein primary antibodies at 1:1000 dilution. HRP conjugated Goat anti-mouse (ThermoFisher Scientific Catalogue: 31430) was used as the secondary antibody at 1:1000 dilution, and the antigen-antibody complexes were detected using the ECL system (ThermoFisher Scientific Catalogue: 32209). HRP conjugated beta-tubulin (ThermoFisher Scientific Catalogue: MA5-16308-HRP) at 1:4000 dilution was used as the protein loading control.
SARS-CoV-2 isolation and culture: Culture of SARS-CoV-2 variants acquired from BEI (WA1, B.1.351, and B.1.617.2) or isolated from clinical samples (B.1.1.7, BA.1, BA.2.3, BA.2.12.1, BA.5.1, BF.7, BQ.1, and XBB.1.5). Viruses acquired from BEI were propagated on TMPRSS2-VeroE6 (XenoTech) cells as described PMID previously [
40]. Viruses from clinical samples were isolated as described previously at UC San Diego under IRBs #200477 (B.1.1.7 [
40]), #160524 (BA.1 [
41], BA.2.3 [
41], and BA.5 [
42]) and #200236X (BA.2.12.1 [
42]). BF.7, BQ.1, and XBB.1.5 were isolated as described for BA.5 under IRB #160524. Briefly, serial dilutions of the clinical sample were serially diluted in DMEM with 1x Pen/Strep + Amphotericin (Anti/Anti) and 10mM HEPES and applied to monolayers of Calu-3 or TMPRSS2-VeroE6 cells. After one hour, the media above supplemented with 2% FBS was added, and viruses were harvested when the cytopathic effect (CPE) became apparent. Passage 0 stocks were expanded on TMPRSS2-VeroE6 cells and titered by fluorescent focus assay on TMPRSS2-VeroE6 cells. All viral stocks were verified by whole genome sequencing.
All work with infectious SARS-CoV-2 was conducted in BSL3 conditions at UC San Diego following the guidelines approved by the Institutional Biosafety Committee.
Viral inactivation and VQA panel methods: Viruses isolated and propagated, as described above, were inactivated at BSL3 by UV254 irradiation. UV-inactivation was performed with 400mJ/cm2 in a UVP Crosslinker CL-3000 6.1 (Analytik Jena) in a thin layer of <4ml in a 10cm dish on a cold block so that the plate bottom is 5.5 inches from irradiation source. Culture media was similarly UV-treated as a control for downstream assays.
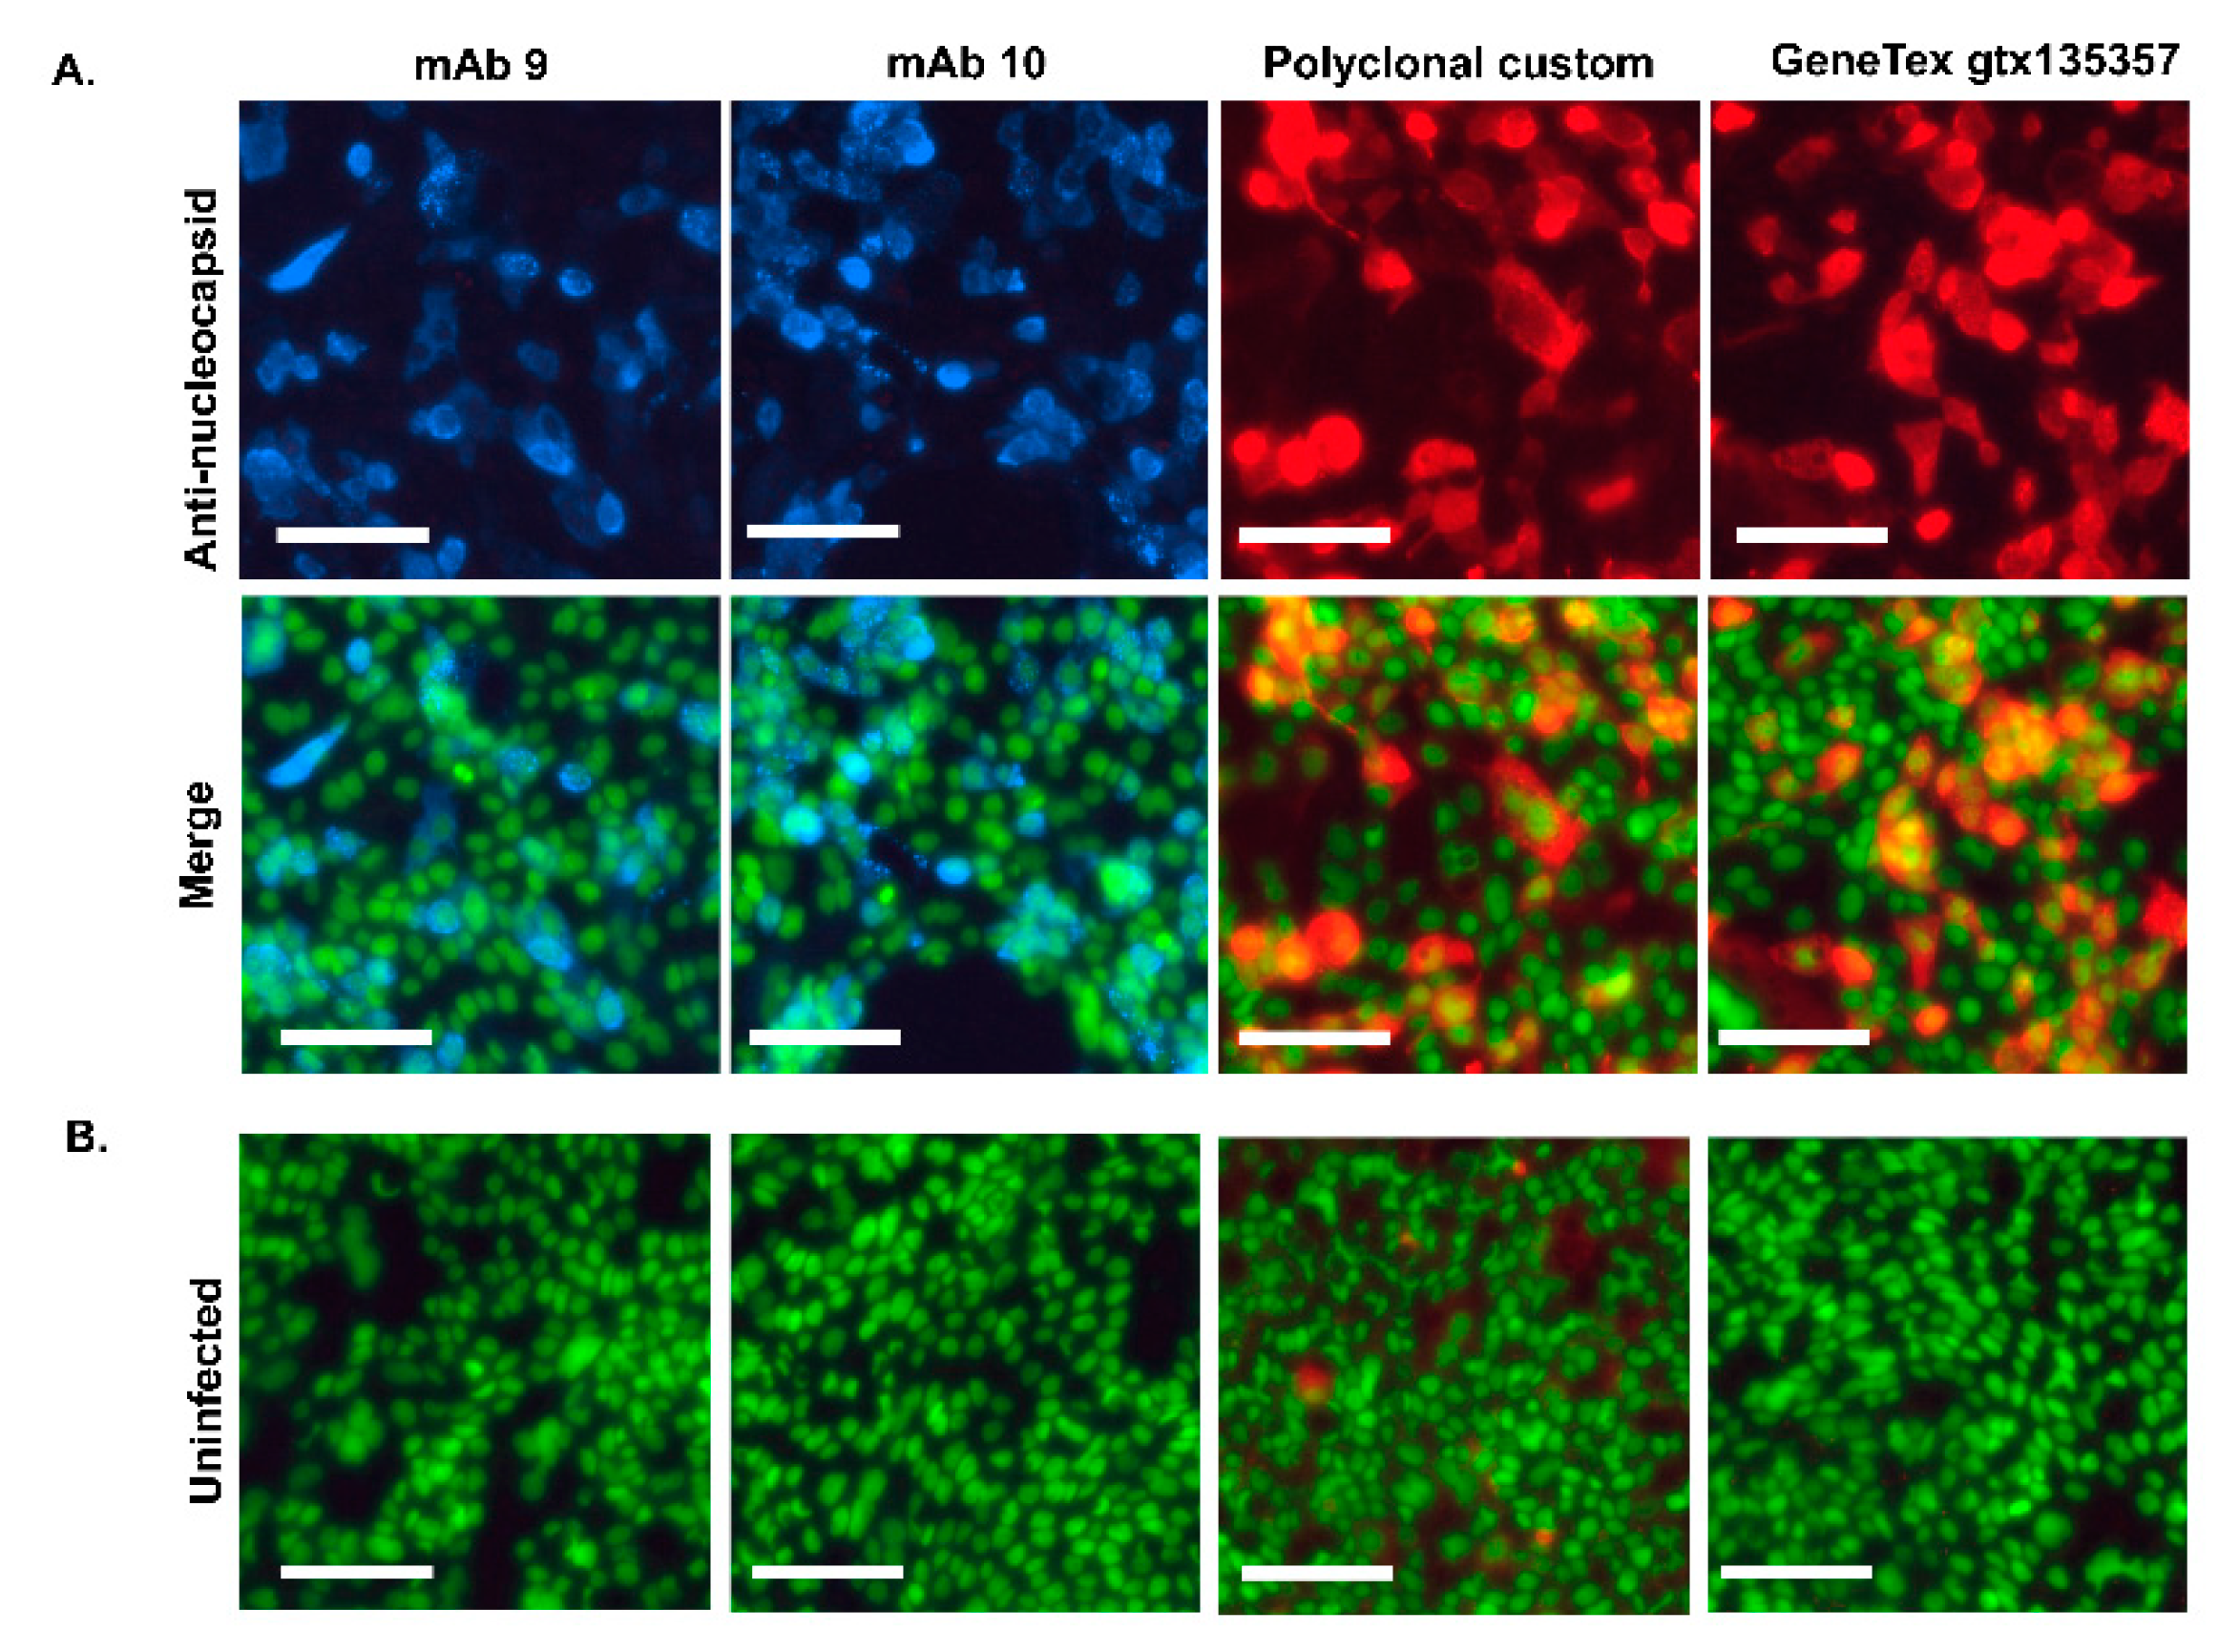
Each SARS-CoV-2 sample was confirmed inactive before removal to BSL2. Inactivation confirmation was performed by an extended culture of 10% of the volume on TMPRSS2-VeroE6 cells (or TMPRSS2-VeroE6 and Calu3 cells for variant BA.1 due to reduced infectivity of BA.1 on TMPRSS2-vero) and examination for CPE, followed by passaging of the entire volume of supernatant to new 96-well plates of cells for additional growth and staining with polyclonal nucleocapsid primary (GeneTex, #gtx135357) and AlexaFluor 594 secondary antibody. Images of whole wells were acquired and examined for positive staining. Positive and negative controls were included at each step.
Inactivated viruses were assembled into viral quality assurance panels (VQAs) by dilution in viral transport medium (VTM) (RMBio VTM-CHT-01L) or media (DMEM+ 2% FBS, 1x penicillin/streptomycin, 10 mM HEPES). Dilutions were aliquoted in pre-labeled cryotubes with coded labels and stored at -80°C until assayed.
Monoclonal and Polyclonal Antibody Production: ProMab Biotechnologies Inc. performed large-scale Np-CTD protein expression and antibody production. The Histidine tagged-Np-CTD protein was expressed in the Mammalian cell expression system (HEK293) and purified using Ni-NTA affinity column chromatography. The purified protein was resolved in SDS-PAGE and stained with Coomassie Blue (Supplementary Figure S1) to check the yield and purity of the protein. Two Rabbits and five Balb/c Mice were immunized with the protein antigen to generate the Rabbit polyclonal and Mouse monoclonal antibodies.
The mice were injected with the protein antigen five times for monoclonal antibody production, with an interval of three weeks between each injection to generate the mouse monoclonal antibodies. Next, sera collected from the mice were subjected to direct ELISA using the Np-CTD as the antigen. Based on the ELISA result, the mouse with the highest titer was carried on to hybridoma fusion. The top ten hybridoma clones (C1-C10) obtained were next tested by direct ELISA using Full-length Np. Two best-performing clones (C9 and C10) were selected for monoclonal antibody production and purification. For this, the hybridoma clone cells (C9 and C10) were first expanded in DMEM, 10% BSA media using the standard tissue culture technique. The expanded cells were then injected into the peritoneal cavity of five mice through the intraperitoneal (IP)- injection method for antibody generation. Ascites were then collected from the injected mice and purified using an IgG purification column to obtain the monoclonal antibody (mAb 9 and mAb 10).
To generate the rabbit polyclonal antibodies, two rabbits were injected with the Np-CTD protein five times, with an interval of three weeks between injections. After this, the rabbits were sacrificed, their sera were collected, and direct-ELISA was performed using Np-CTD as antigen to test the antibody titer. Then, the sera were precipitated using ammonia persulfate and purified through protein A to get the polyclonal antibody 108.
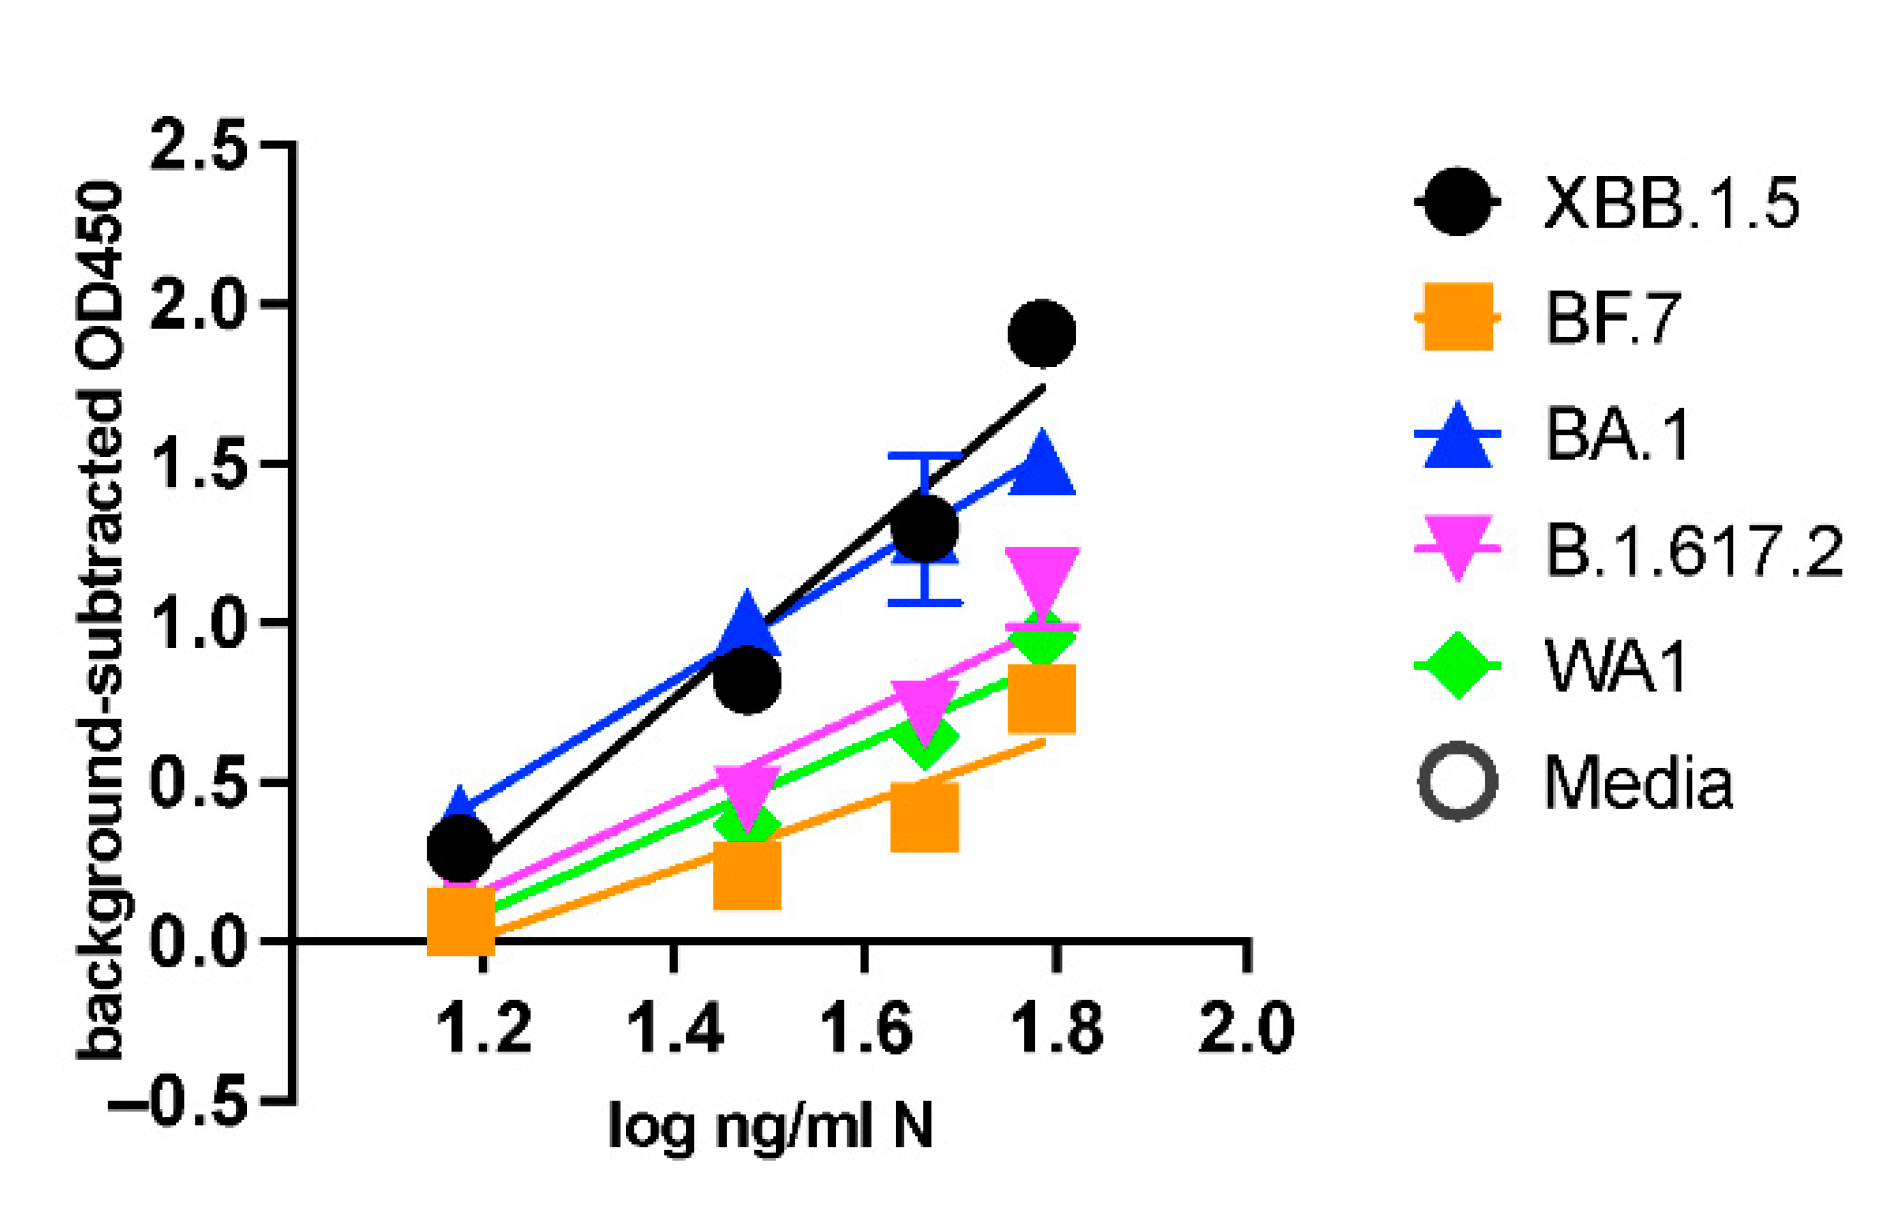
Enzyme-Linked Immunosorbent Assay (ELISA): The sandwich ELISA was developed using the Rabbit polyclonal Antibodies to capture the SARS-CoV-2 Np-antigen and the Mouse monoclonal antibodies for detection. For this, the 96-well microtiter plates (Sarstedt, Catalogue: 82.1581.100) were coated with the capture polyclonal antibodies #108 at dilution (1:1000). The antibodies were first diluted in the carbonate-bicarbonate (pH 9.4) buffer (ThermoFisher Scientific Catalogue: 28382), and 100 µL of this was added to each well. The plates were then sealed with adhesive strips and incubated overnight at 4ºC for the antibodies to bind to the microtiter wells through adsorption. The next day, the contents of the plates were discarded, and the wells were washed twice with 200 µL PBS buffer.
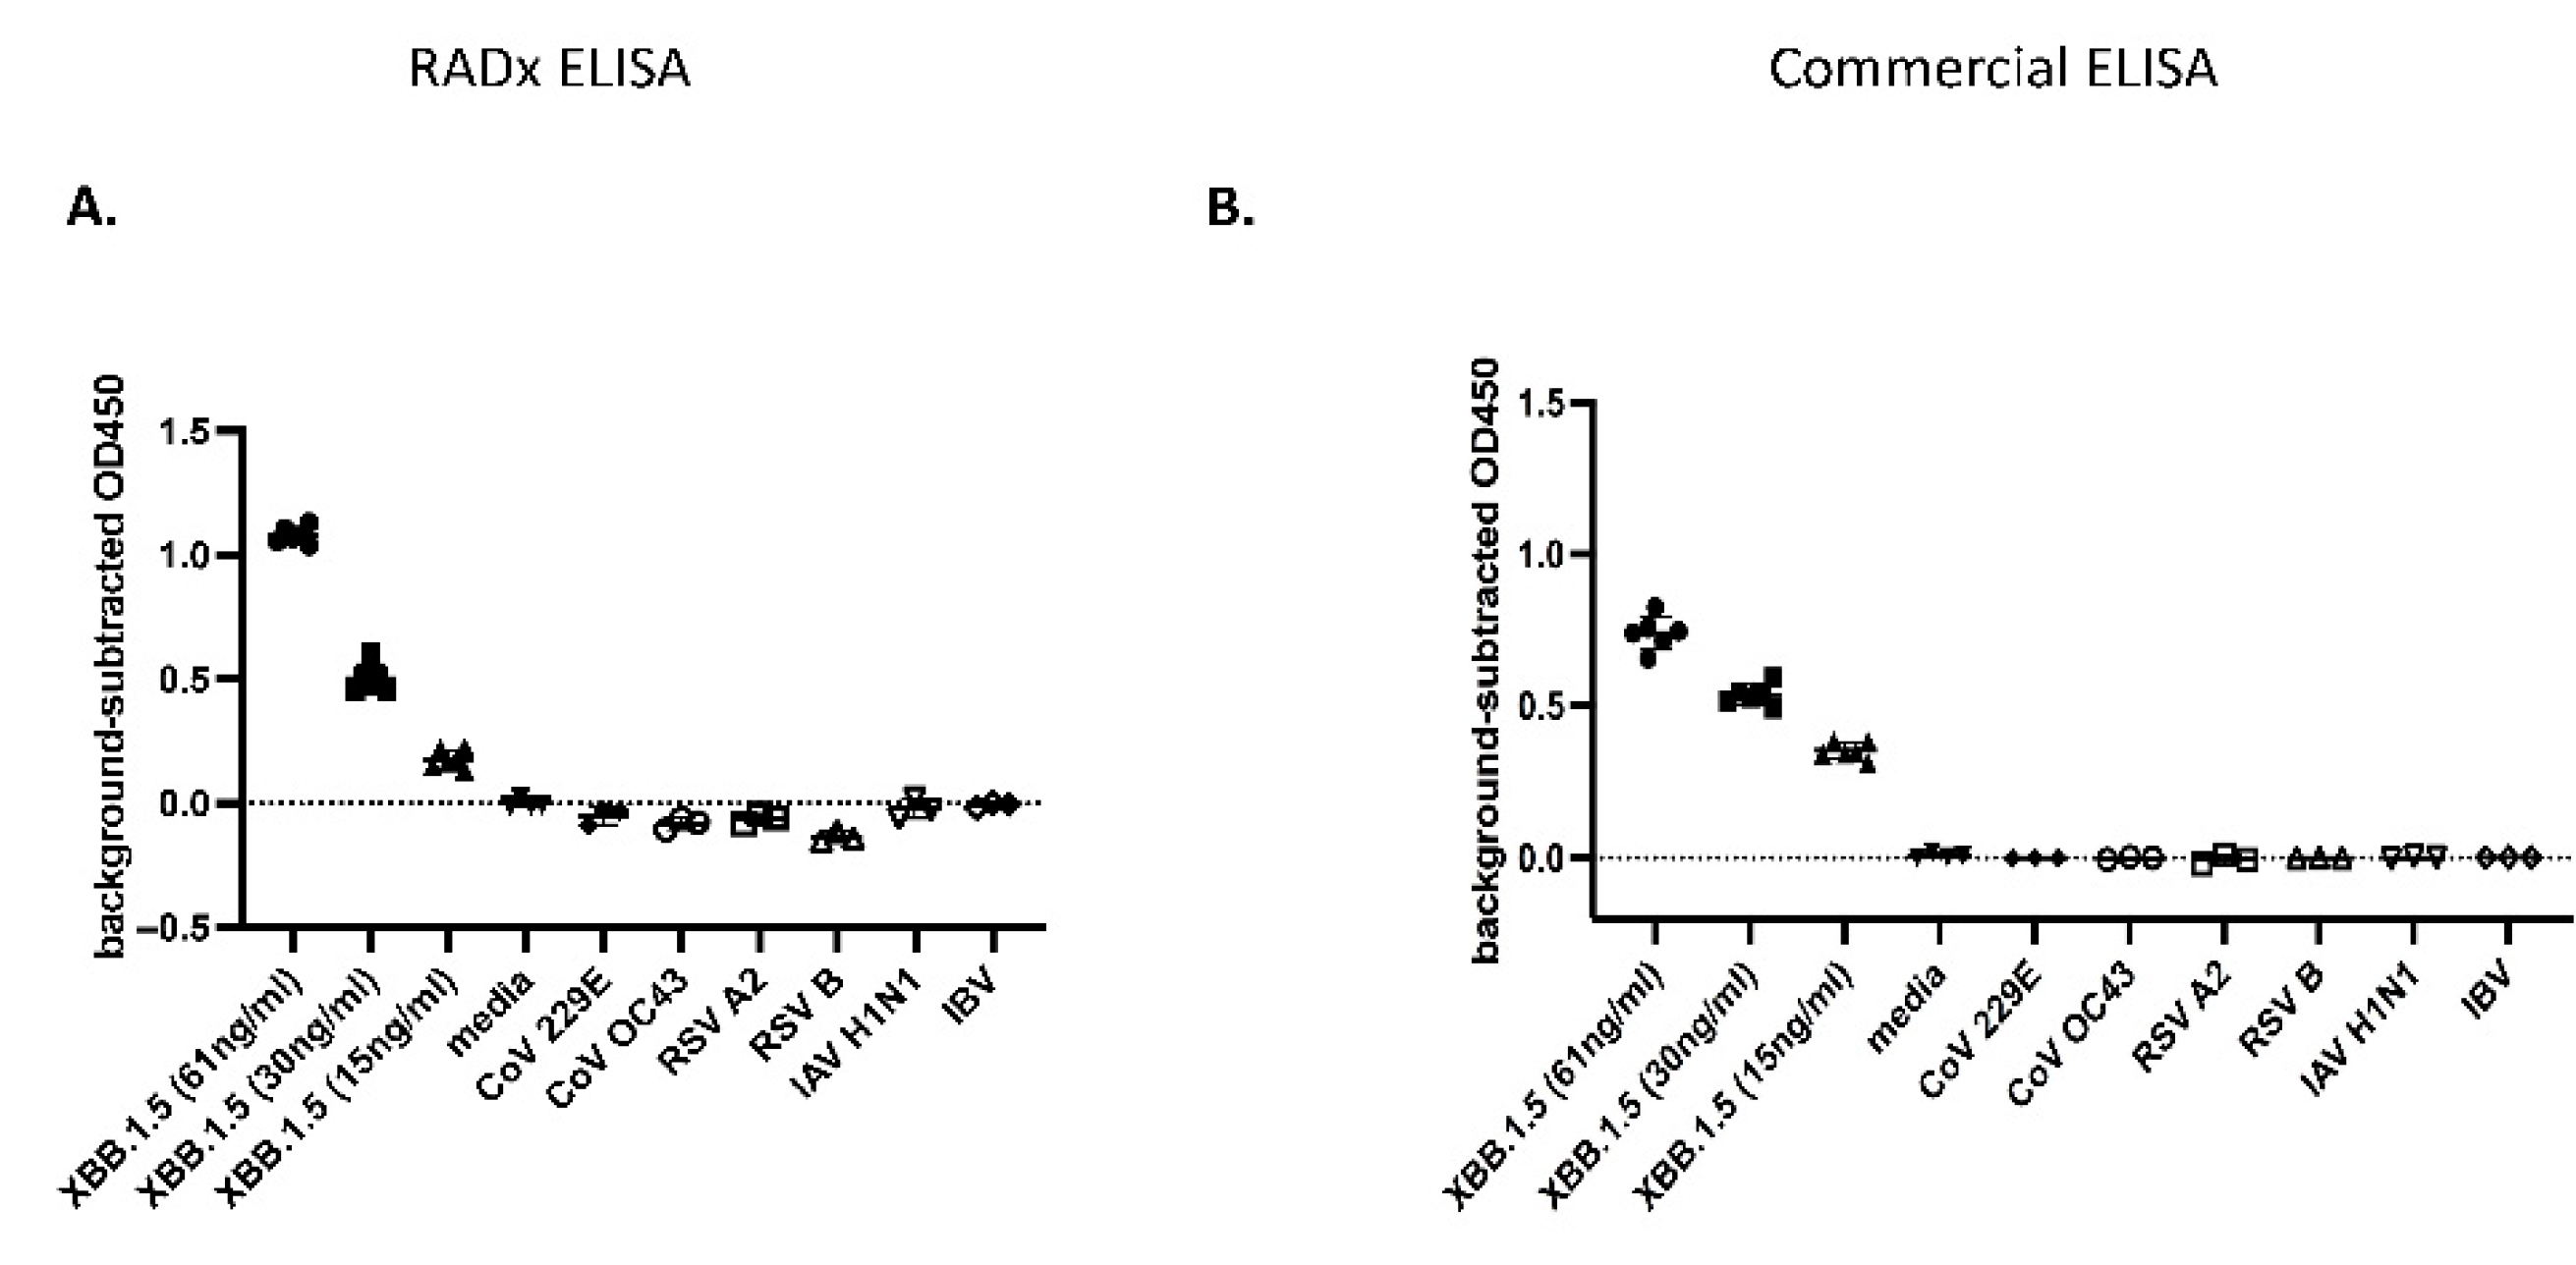
Following this, 200 µL of blocking buffer (1x PBS with 1% BSA) was added to each well, covered with adhesive strips, and incubated at room temperature for two hours. The serum albumin proteins in the blocking buffer use the remaining well-surface that is unoccupied by the antibodies and thus improve the assay’s sensitivity by reducing the background signal and increasing the signal-to-noise ratio. Next, the blocking solution is discarded, and 100 µL of the Np-antigen (recombinant full-length SARS-CoV-2 Np, AcroBiosystems: NUN-C5227) or the UV-inactivated viruses at specified concentrations, diluted in the blocking buffer, are added to the antibody-coated wells. The plates are then covered with the adhesive strip and incubated at 37ºC for 90 minutes. After this incubation, the solutions in the plates are discarded, and the wells are washed four times with 200 µL PBS buffer. Next, 100 µL of the mouse monoclonal detection antibodies (either mAb 9 or mAb10) at (1: 4400) dilutions in blocking buffer are added to each well, covered with an adhesive strip, and incubated at room temperature for two hours in a rocker. The solutions are discarded, and the wells are washed four times with 200 µL PBS buffer. The Horseradish peroxide (HRP) conjugated Goat-anti mouse secondary antibodies (ThermoFisher Scientific Catalogue: 31430) at 1:2100 dilution is added to the wells and incubated in a rocker at room temperature for one hour. Following this incubation, the wells are washed with 200 µL PBS buffer four times, and 100 µL of the 3,3′,5,5′-Tetramethylbenzidine (TMB) substrate solution (ThermoFisher Scientific Catalogue: N301) is added to each well and incubated for 15 minutes. The chromogenic substrate reaction is terminated by adding 100 µL of stop-solution (ThermoFisher Scientific Catalogue: N600), and the plates are scanned at Abs 450 nm wavelength in a Tecan Multimode microplate reader (Spark®) within 15 minutes. The stock concentration of Rabbit polyclonal antibodies (#108) was 1.3 mg/ml. The mAbs 9 and mAb 10 were at 3 mg/ml and 2.2 mg/ml concentrations, respectively.
The microtiter wells were coated with the Np-antigen at the 250 ng/ml concentration overnight at 4ºC using the above-mentioned method to check the antibody titer and select the hybridoma clones (C1-C10) using ELISA. The assay was performed by first incubating the wells with 100 µL of the cell supernatant of each hybridoma clone (1:10 dilution in blocking buffer) for two hours at 37 ºC for 90 minutes and washing four times in 200 µL PBS buffer. Goat-anti-mouse secondary antibodies (1:2100 dilution) were added to the wells and incubated for one hour at room temperature. Following this, the wells were washed, the signals were developed, and the plates were scanned at Abs 450 nm in a Tecan using the earlier method. All the ELISA was conducted in triplicates (n=3) at every concentration for statistical significance and Limit of detection (LOD) calculations.
A commercially available Np-ELISA kit (Ray Biotech, COVID-19 / SARS-COV-2 Nucleocapsid Protein ELISA Kit, Catalog Number: ELV-COVID19N) was used to compare our Np-CTD ELISA kit.
Calculations of Limit of Detection (LOD): The limit of detection is defined as the lowest concentration of an analyte in a sample that can be consistently detected with a stated probability, typically at 95% certainty. Based on the guidelines provided by the FDA’s International Committee on Harmonization, [
43] the LOD is expressed as
Where σ is the standard deviation of the blank, and S is the slope of the curve. Concurrently, the limit of quantification (LOQ), which represents the smallest amount or lowest concentration of a substance that can be determined with established accuracy, precision, and uncertainty, is calculated as
Current ELISA work on the N protein determines concentrations in ng/ml. To translate these concentrations into nanomolar (nM), the molecular weight of the N protein was calculated based on its size of 419 amino acids (46.09 kDa). Since 1 Da = g/mol, this translates to 46,090 ng/nmol. Therefore, the conversion to nM involves dividing the concentration in ng/ml by 46.09 ng.nmole/ml⋅L, allowing the analyte’s concentration to be expressed in nM.
Immunofluorescence Assay: Calu-3 cells were infected at an MOI of 0.05 and fixed with 4% formaldehyde in PBS 30 min at RT 24h later. After PBS washes, cells were permeabilized and blocked with 30 min incubation in 1% BSA and 0.1 % Triton X-100 in PBS. Cells were stained with anti-nucleocapsid primary antibody (GeneTex, gtx135357) or monoclonal and polyclonal anti-N antibodies followed by AlexaFluor 594 or 647-conjugated secondary antibody (Thermo Fisher Scientific) with nuclear counterstain Sytox Green (Thermo Fisher Scientific). Images were acquired on an Incucyte SX5 imager at 20x magnification.
