1. Introduction
Compared to traditional construction methods such as cut-and-cover, the shield construction method has significant advantages such as minimal impact on the surrounding environment, construction not restricted by terrain and topography, small footprint and wide applicability to various geological conditions. Based on these characteristics, the shield construction method has become the preferred choice for modern urban tunnel construction in soft soil areas compared to other underground construction methods, and is widely used in the construction of urban subway tunnels, river crossing tunnels, water supply pipelines, power tunnels and other urban engineering projects.
Meanwhile, there have been several major earthquakes around the world in recent decades [
1,
2,
3]. The devastation caused by earthquakes is horrific, with incalculable casualties and economic losses. Historically, structural damage from earthquakes has been rare due to the relatively small number of underground structures. As a result, traditional perceptions of the seismic performance of underground structures have been overly optimistic. However, the occurrence of the Kobe earthquake [
4,
5,
6] in Japan in 1995 raised concerns about the seismic performance of underground structures. In the Kobe earthquake, the drainage pipe system, one of the lifelines of modern cities, suffered fractures, cracks and joint separation, resulting in loss of function. Kobe's major subway stations were also badly damaged, and the subway tunnels suffered minor damage. The Chi-Chi earthquake [
7,
8,
9] in Taiwan in September 1999 and the Wenchuan earthquake [
10,
11] in May 2008 also caused some damage to underground structures[
12,
13,
14].
In the case of tunnels, even if they do not collapse completely in an earthquake, extensive damage that affects their use may be difficult to repair [
15]. Therefore, it is important to consider the seismic performance of tunnels [
15,
16,
17]to ensure their safety and to meet the seismic requirements of shield tunnels in modern society.
Numerical analysis methods are essential for studying the seismic resistance of shield tunnels [
18,
19]. With the rapid development of computer technology, numerical analysis methods have made significant progress. These methods consider a wider range of factors, allowing detailed analysis of the combined effects of various factors to better meet engineering requirements. Research on numerical methods [
20,
21] has attracted much attention from scholars around the world and has produced many results. When studying the seismic characteristics of tunnels, the use of numerical calculation methods makes it possible to simulate soil layers, tunnel linings, etc., to treat the soil, foundation and structural parts of the site as a whole calculation, to obtain the dynamic response of the structure and the soil, to consider the dynamic properties of the soil such as heterogeneity and nonlinearity, to analyse the combined effects of several factors, and to make the structural analysis more realistic, such as different seismic wave effects, different constitutive models and different terrain conditions[
22].Many studies also have proposed various indicators to measure the damage index of tunnels in earthquakes, such as lateral convergence of tunnels[
23], deformation rate[
24], joint angle[
25]., etc.
The seismic calculation methods and damage indicators of tunnels are complicated and difficult to apply in engineering design. In order to make the seismic analysis of shield tunnels widely used in the design, this paper analyses a typical underground tunnel by using the dynamic time history analysis method, establishes the relationship between internal forces and deformation of tunnels in the earthquake, and proposes the tunnel inclination, which is used to measure the dynamic response of tunnels in the earthquakes.
2. Dynamic Time-History Analysis of the Shield Tunnel
A shield tunnel section of the Metro is selected for dynamic time-history analysis of its seismic response, analysing the tunnel's internal force response, deformation response.
2.1. Model Calculation Range
To mitigate the artificial boundary surface reflection waves in dynamic calculations, the calculation Range can be increased to dissipate the reflection waves by using the inherent damping effect of the soil. However, if the computational domain is too large, it will increase the computational cost and reduce the work efficiency. By setting free field boundary conditions around the calculation model, the free field can be effectively simulated, reducing the impact of reflected waves. Therefore, the calculation area of the model should be selected reasonably. Professor Lou Menglin's research (1999) showed that when the ratio of the size of the foundation plane to the size of the structure plane is greater than 5, the dynamic calculation results tend to be stable and the effect of the lateral boundary can be ignored. The experimental results of Chen Yueqing (2001) also show that if the ratio of the size of the free field plane to the width of the model structure is greater than 2, the effect of the lateral boundary can be ignored. Based on the above principles, the width of the computational model in this example is set to 100m.
In dynamic time-history analysis, it is generally advisable to select the soil layer with a seismic shear wave velocity greater than 300 m/s as the seismic bedrock surface. The soil layers at 70m depth generally meet this condition, so the depth of the calculation model can be set to 70m.
2.2. Model Calculation Parameters
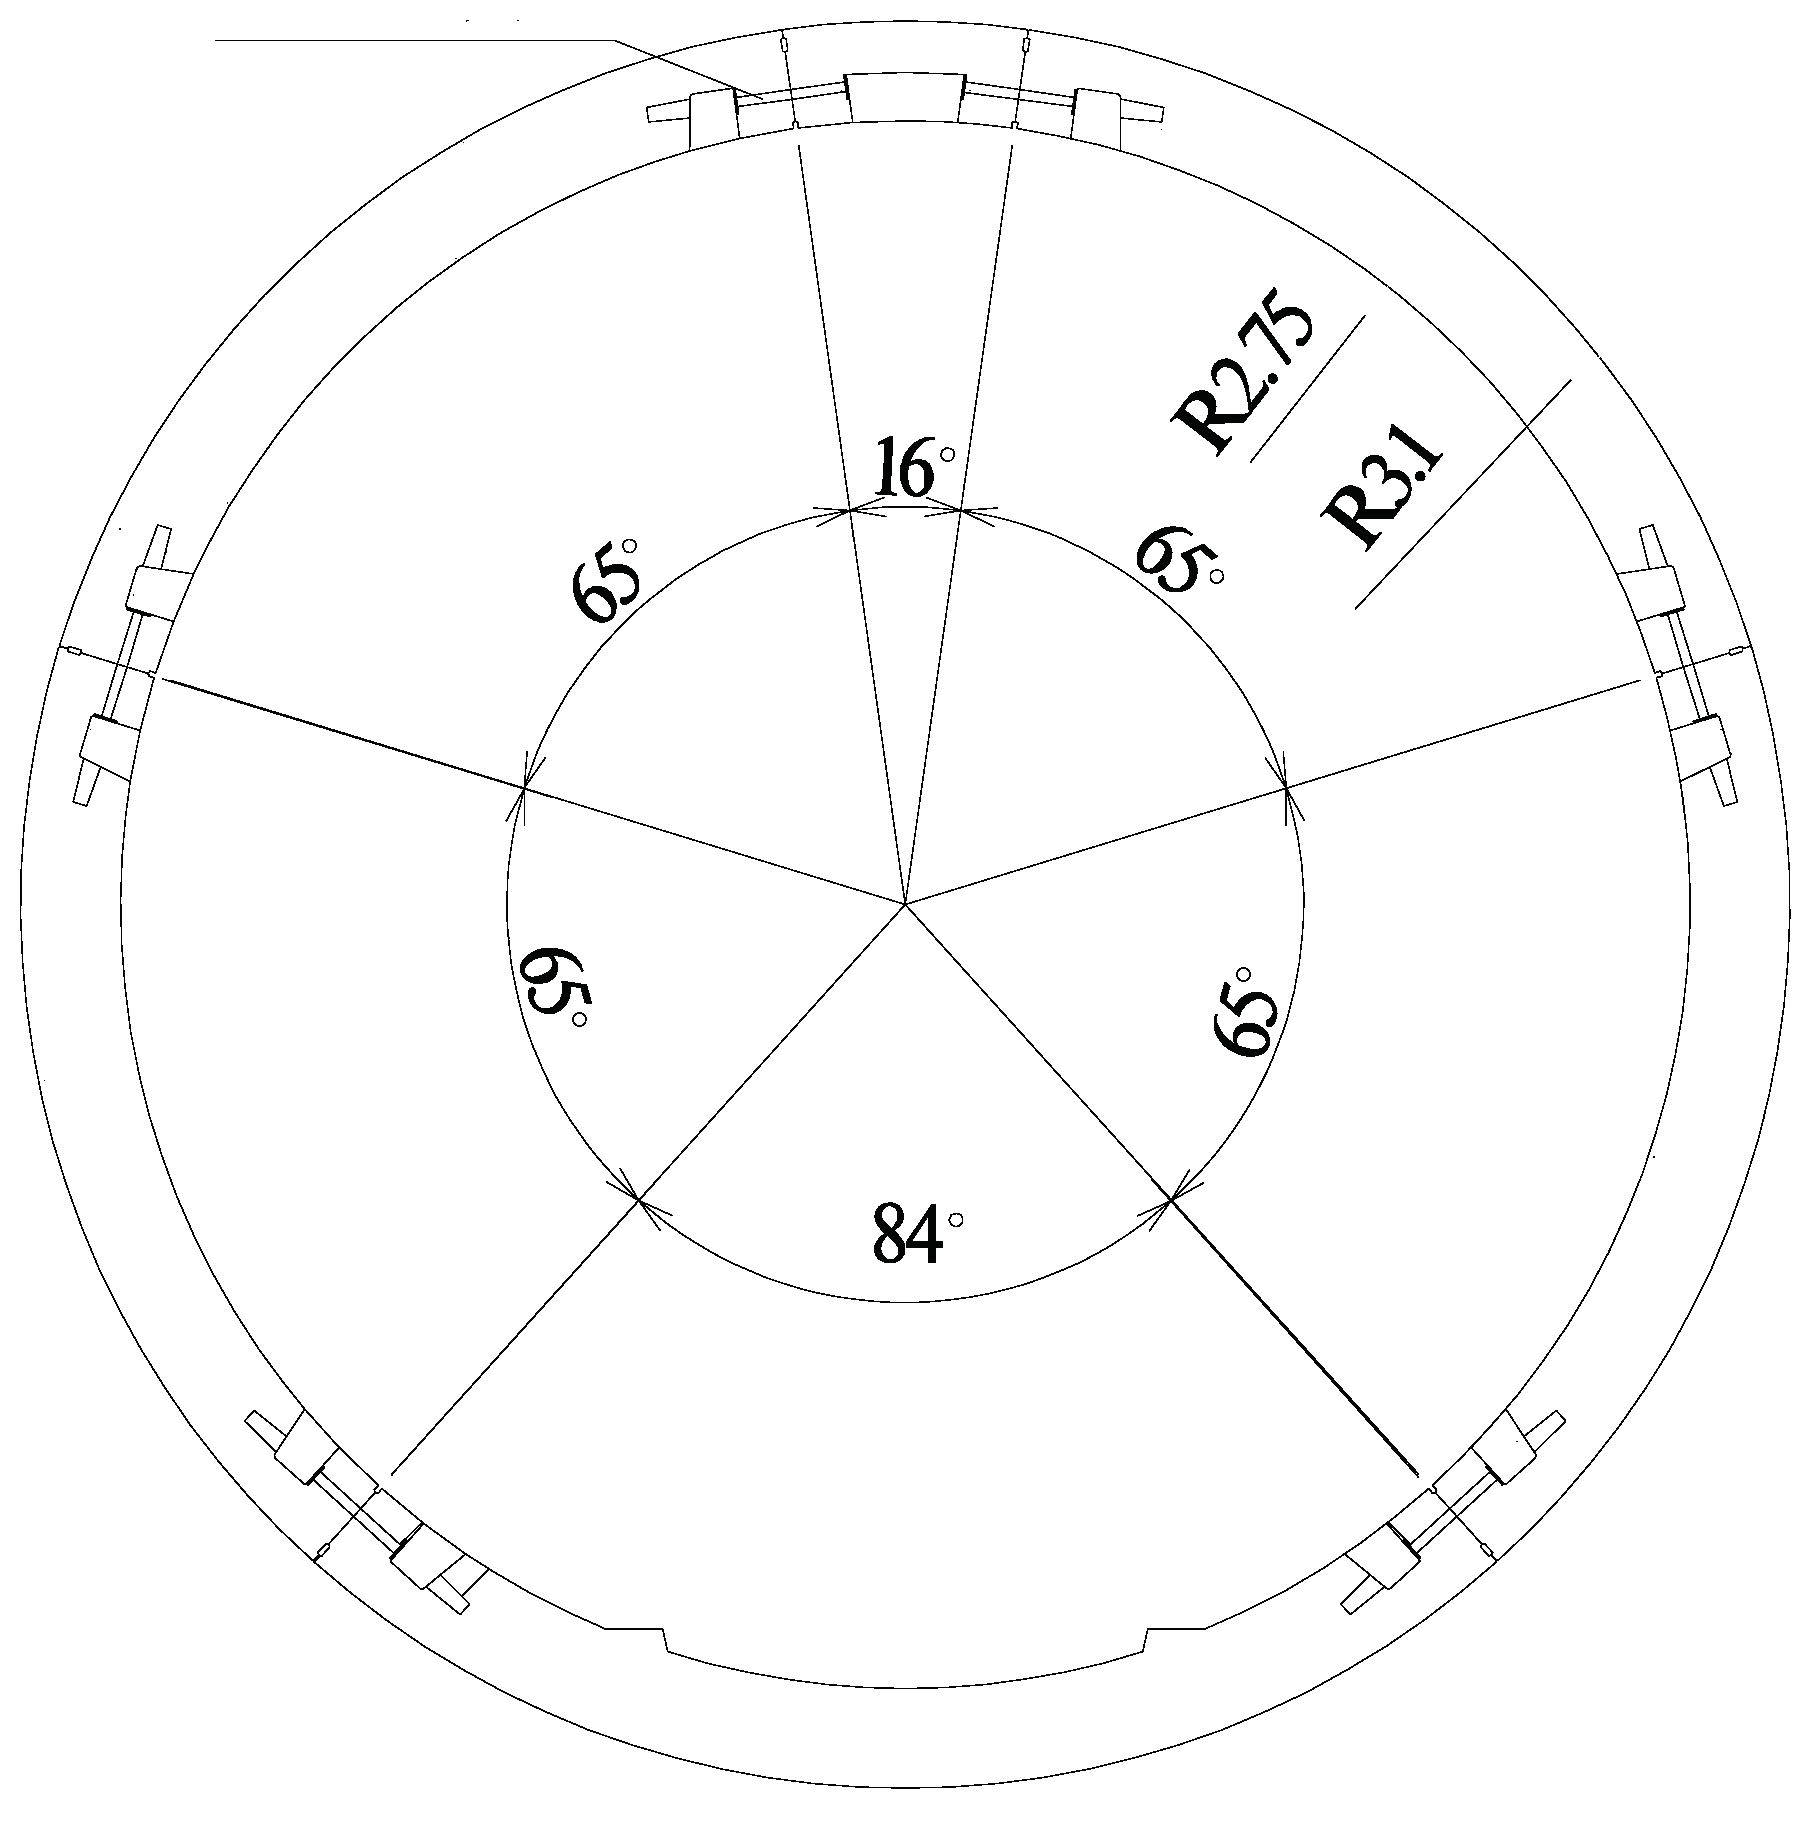
The tunnel is constructed by shield method, and the whole ring of segment is divided into one top block F (16°), two adjacent blocks L (65°), two standard blocks B (65°) and one bottom block (84°), and the blocks are connected by M30 bolts, with an outer diameter of 6.2m and an inner diameter of 5.5m, and the lining ring is as shown in
Figure 1, and the depth of burial of the center of the tunnel is -17.1m, and the soil layers through which the tunnel passes are mainly layer ④ soil and layer ⑤1 soil. The material parameters of each soil layer are shown in
Table 1.
The reinforced concrete pipe sheet is made of C50 high-performance concrete, and its material parameter indicators are shown in
Table 2.
2.2. Treatment of Seismic Waves
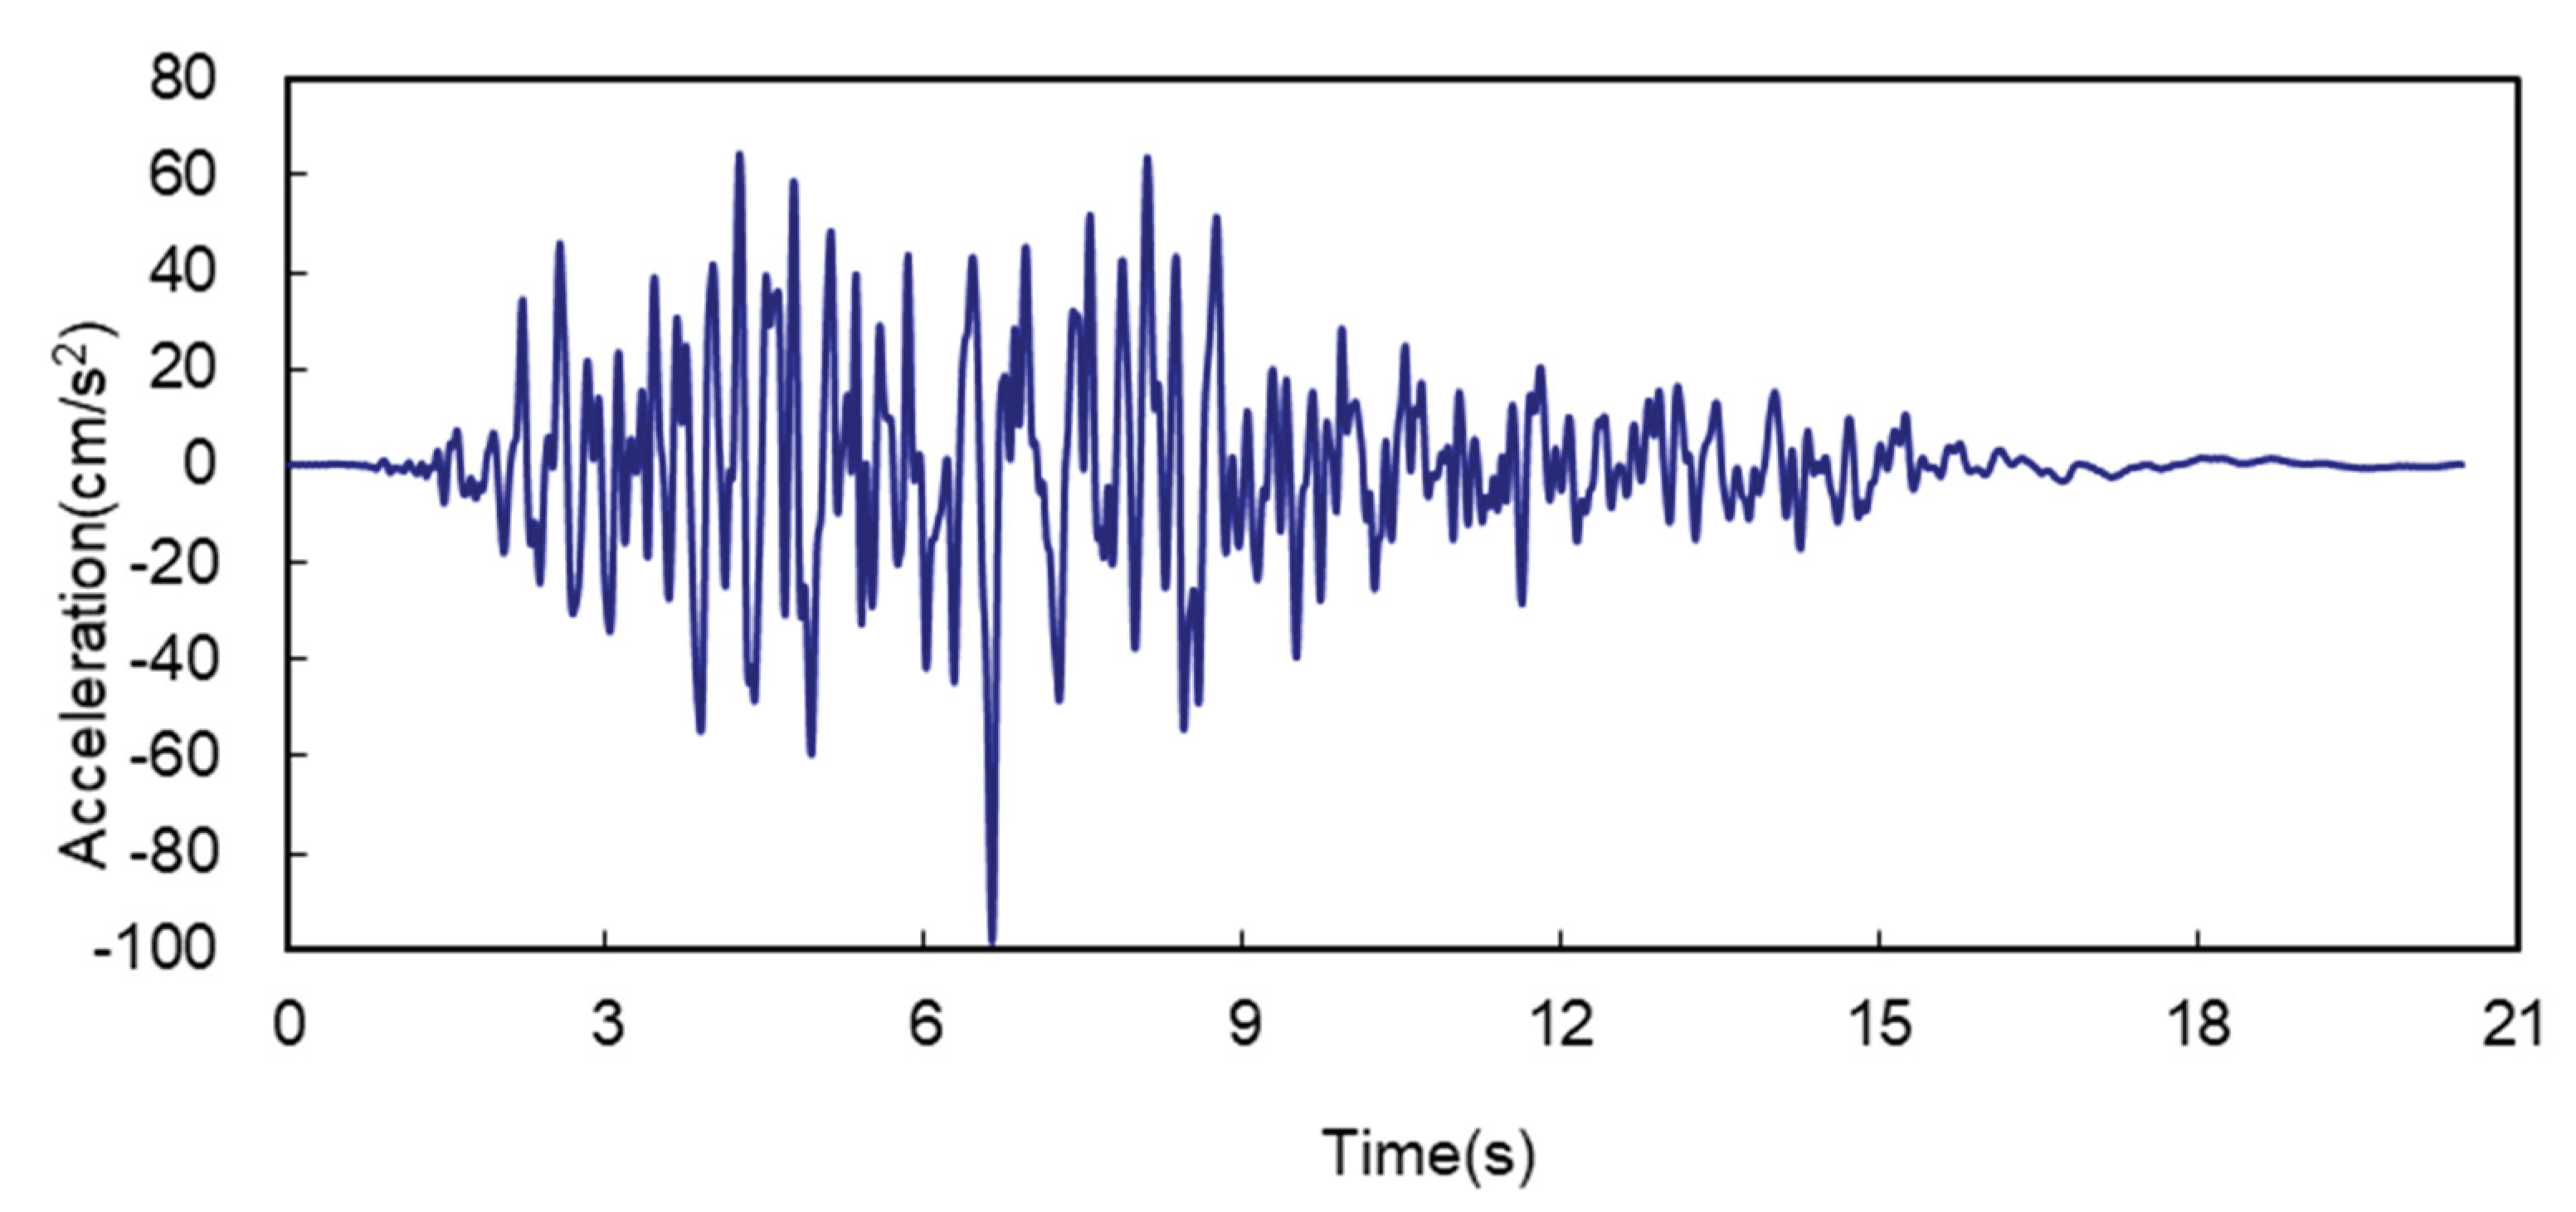
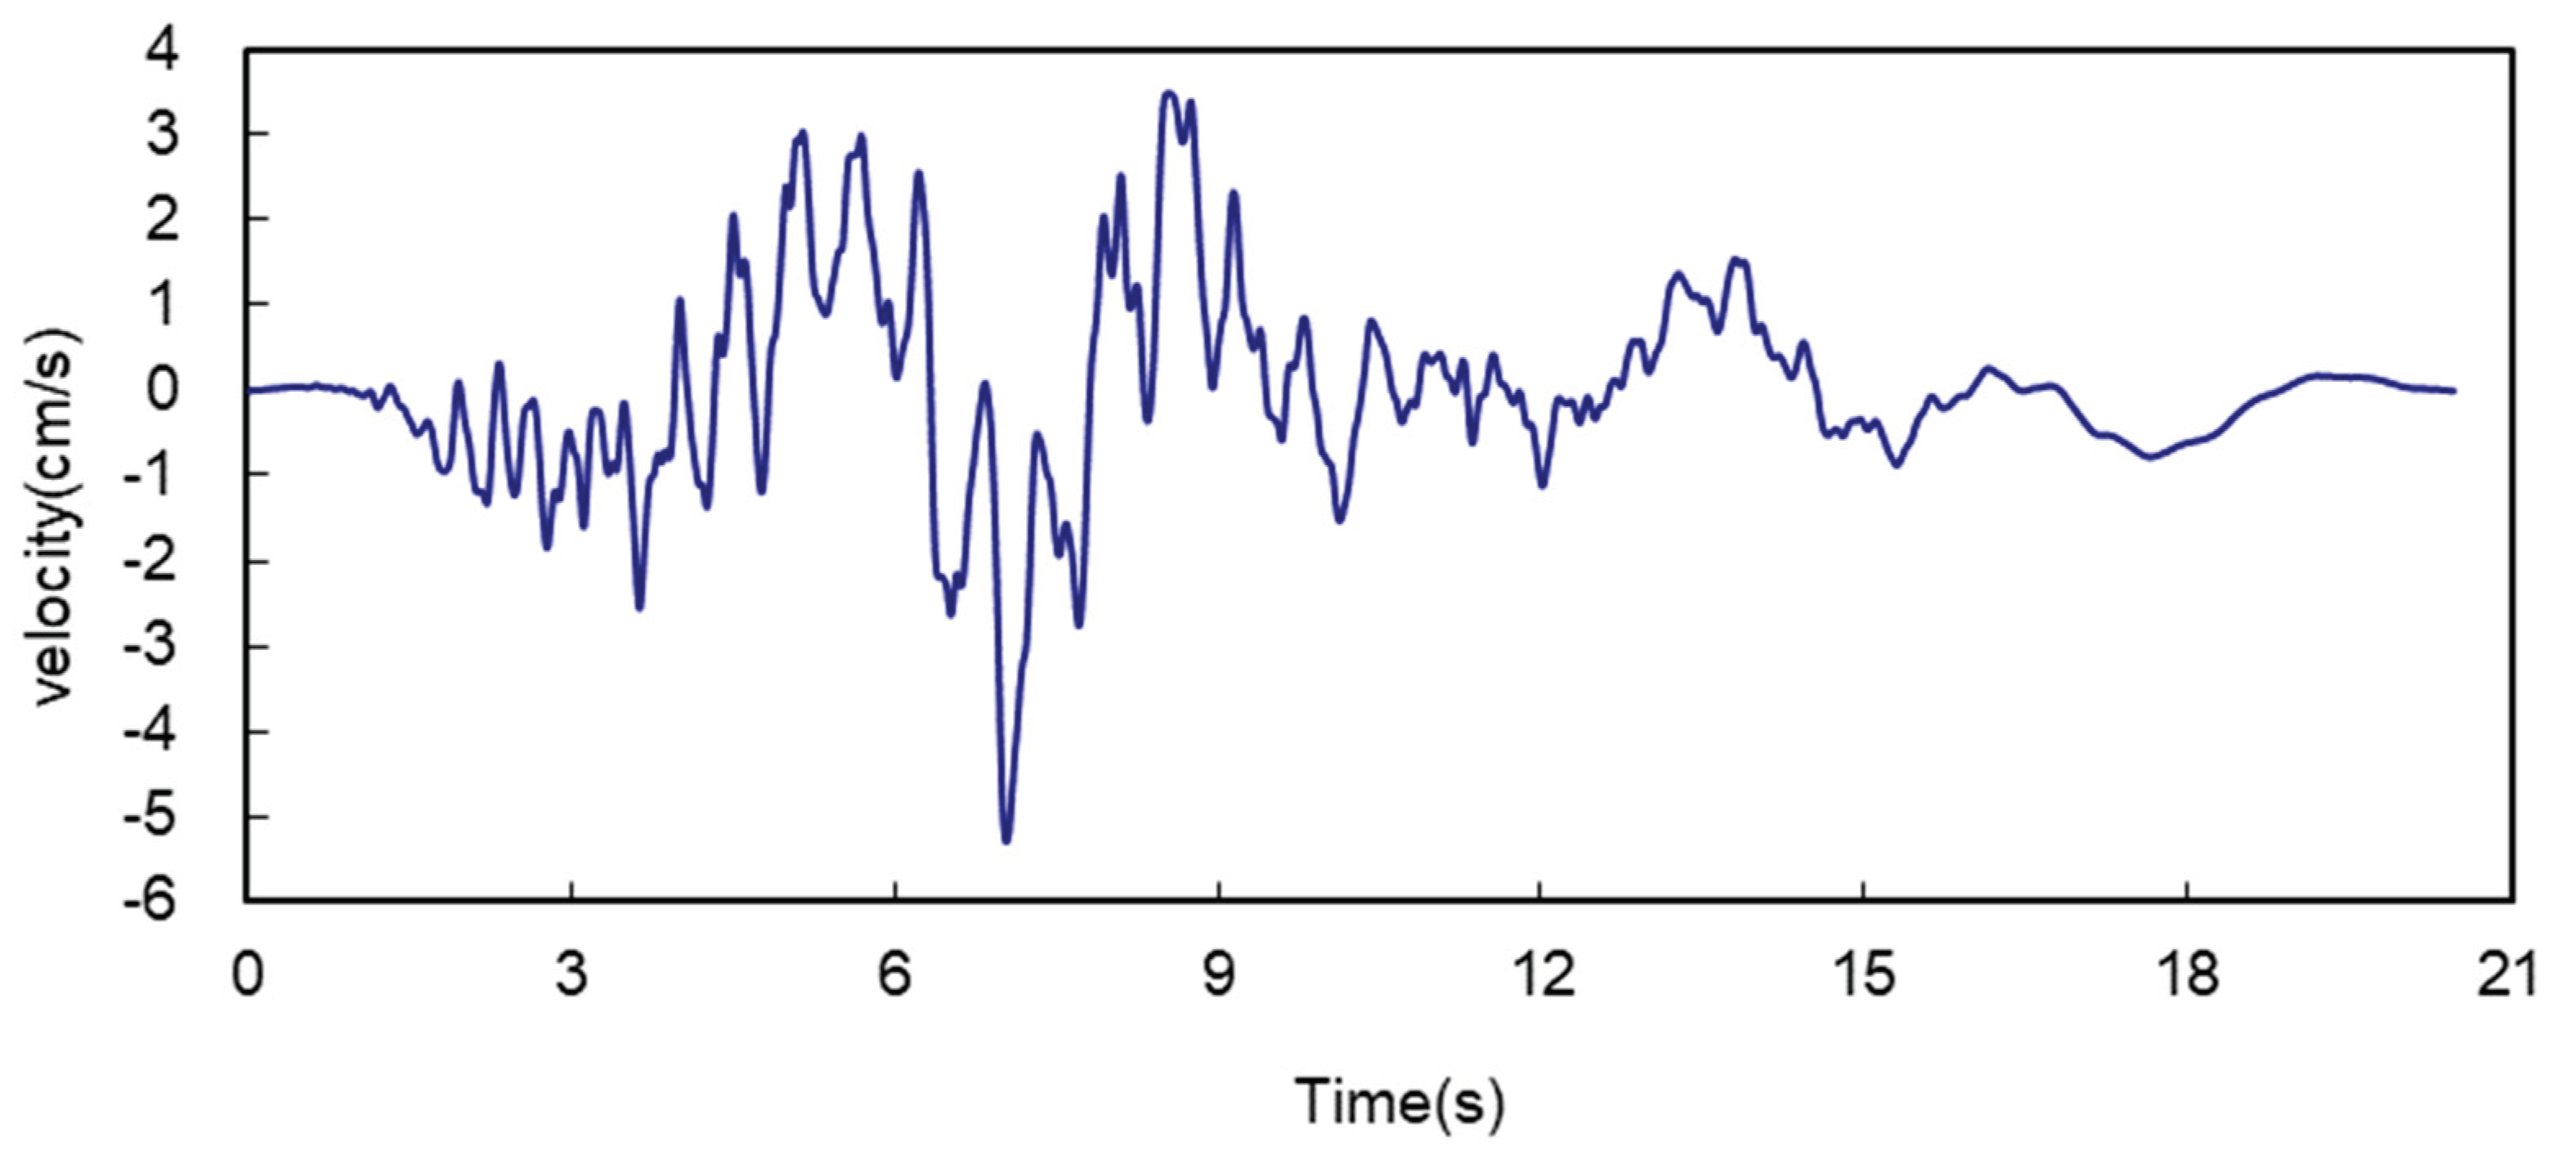
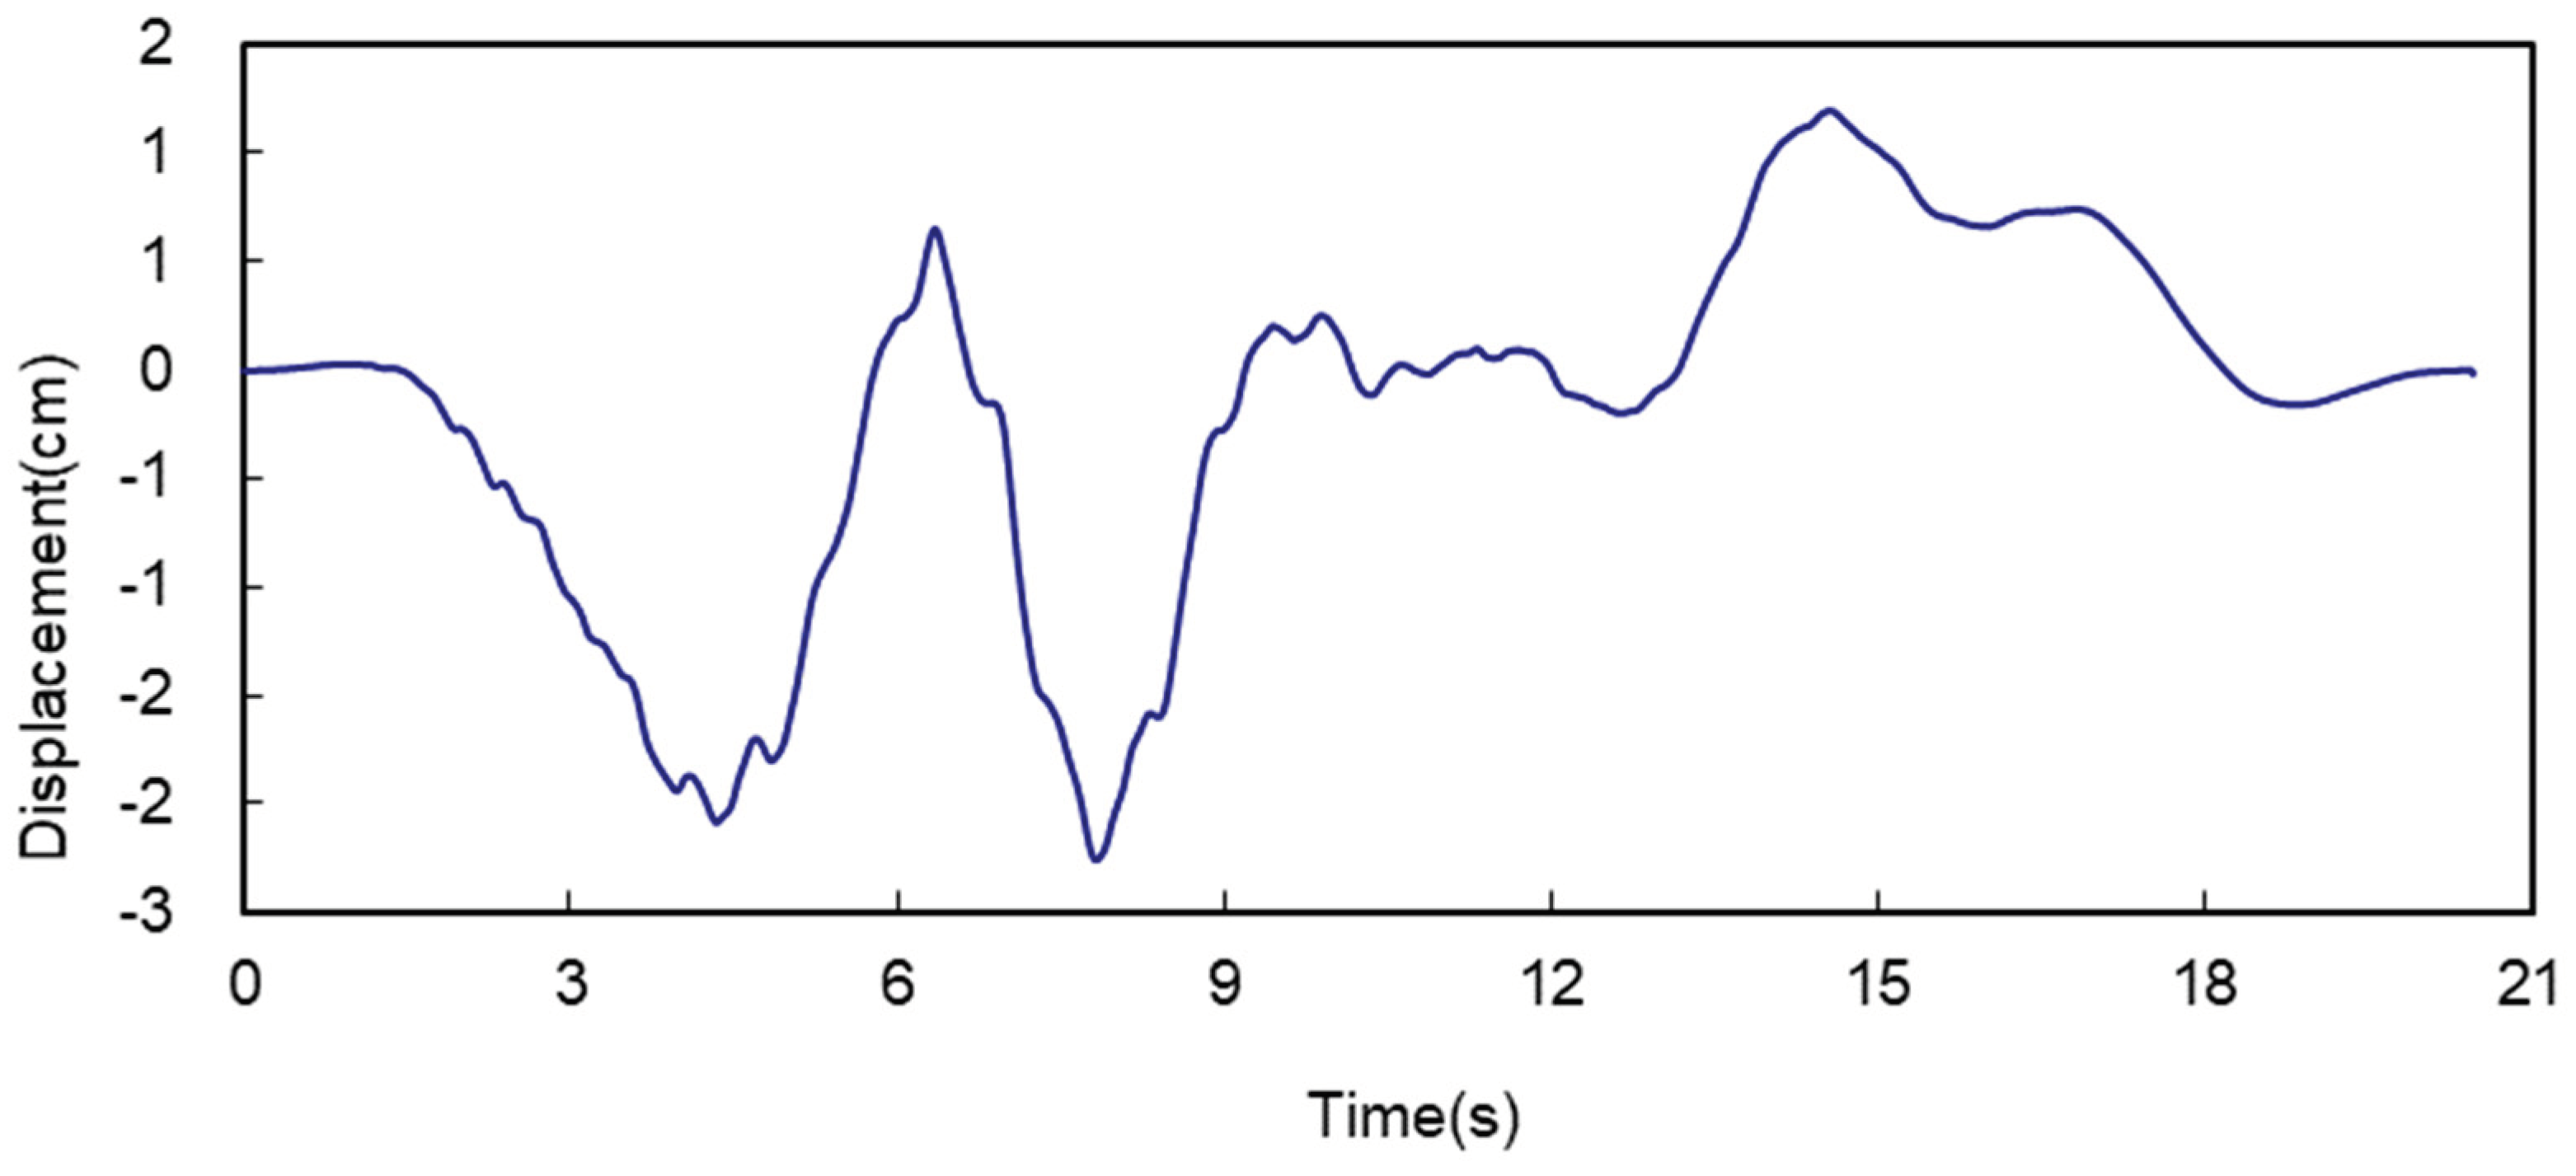
An artificial seismic wave with a maximum acceleration of 0.1 g at the surface is selected for the calculation, and in order to eliminate the residual velocity and displacement of the seismic wave, the seismic wave is baseline-corrected so that the final velocity and displacement of the seismic wave are 0. The acceleration time scale, velocity time scale, and displacement time scale of the bedrock input seismic wave used in the example are shown in
Figure 2,
Figure 3 and
Figure 4.
2.3. Division of the Grid
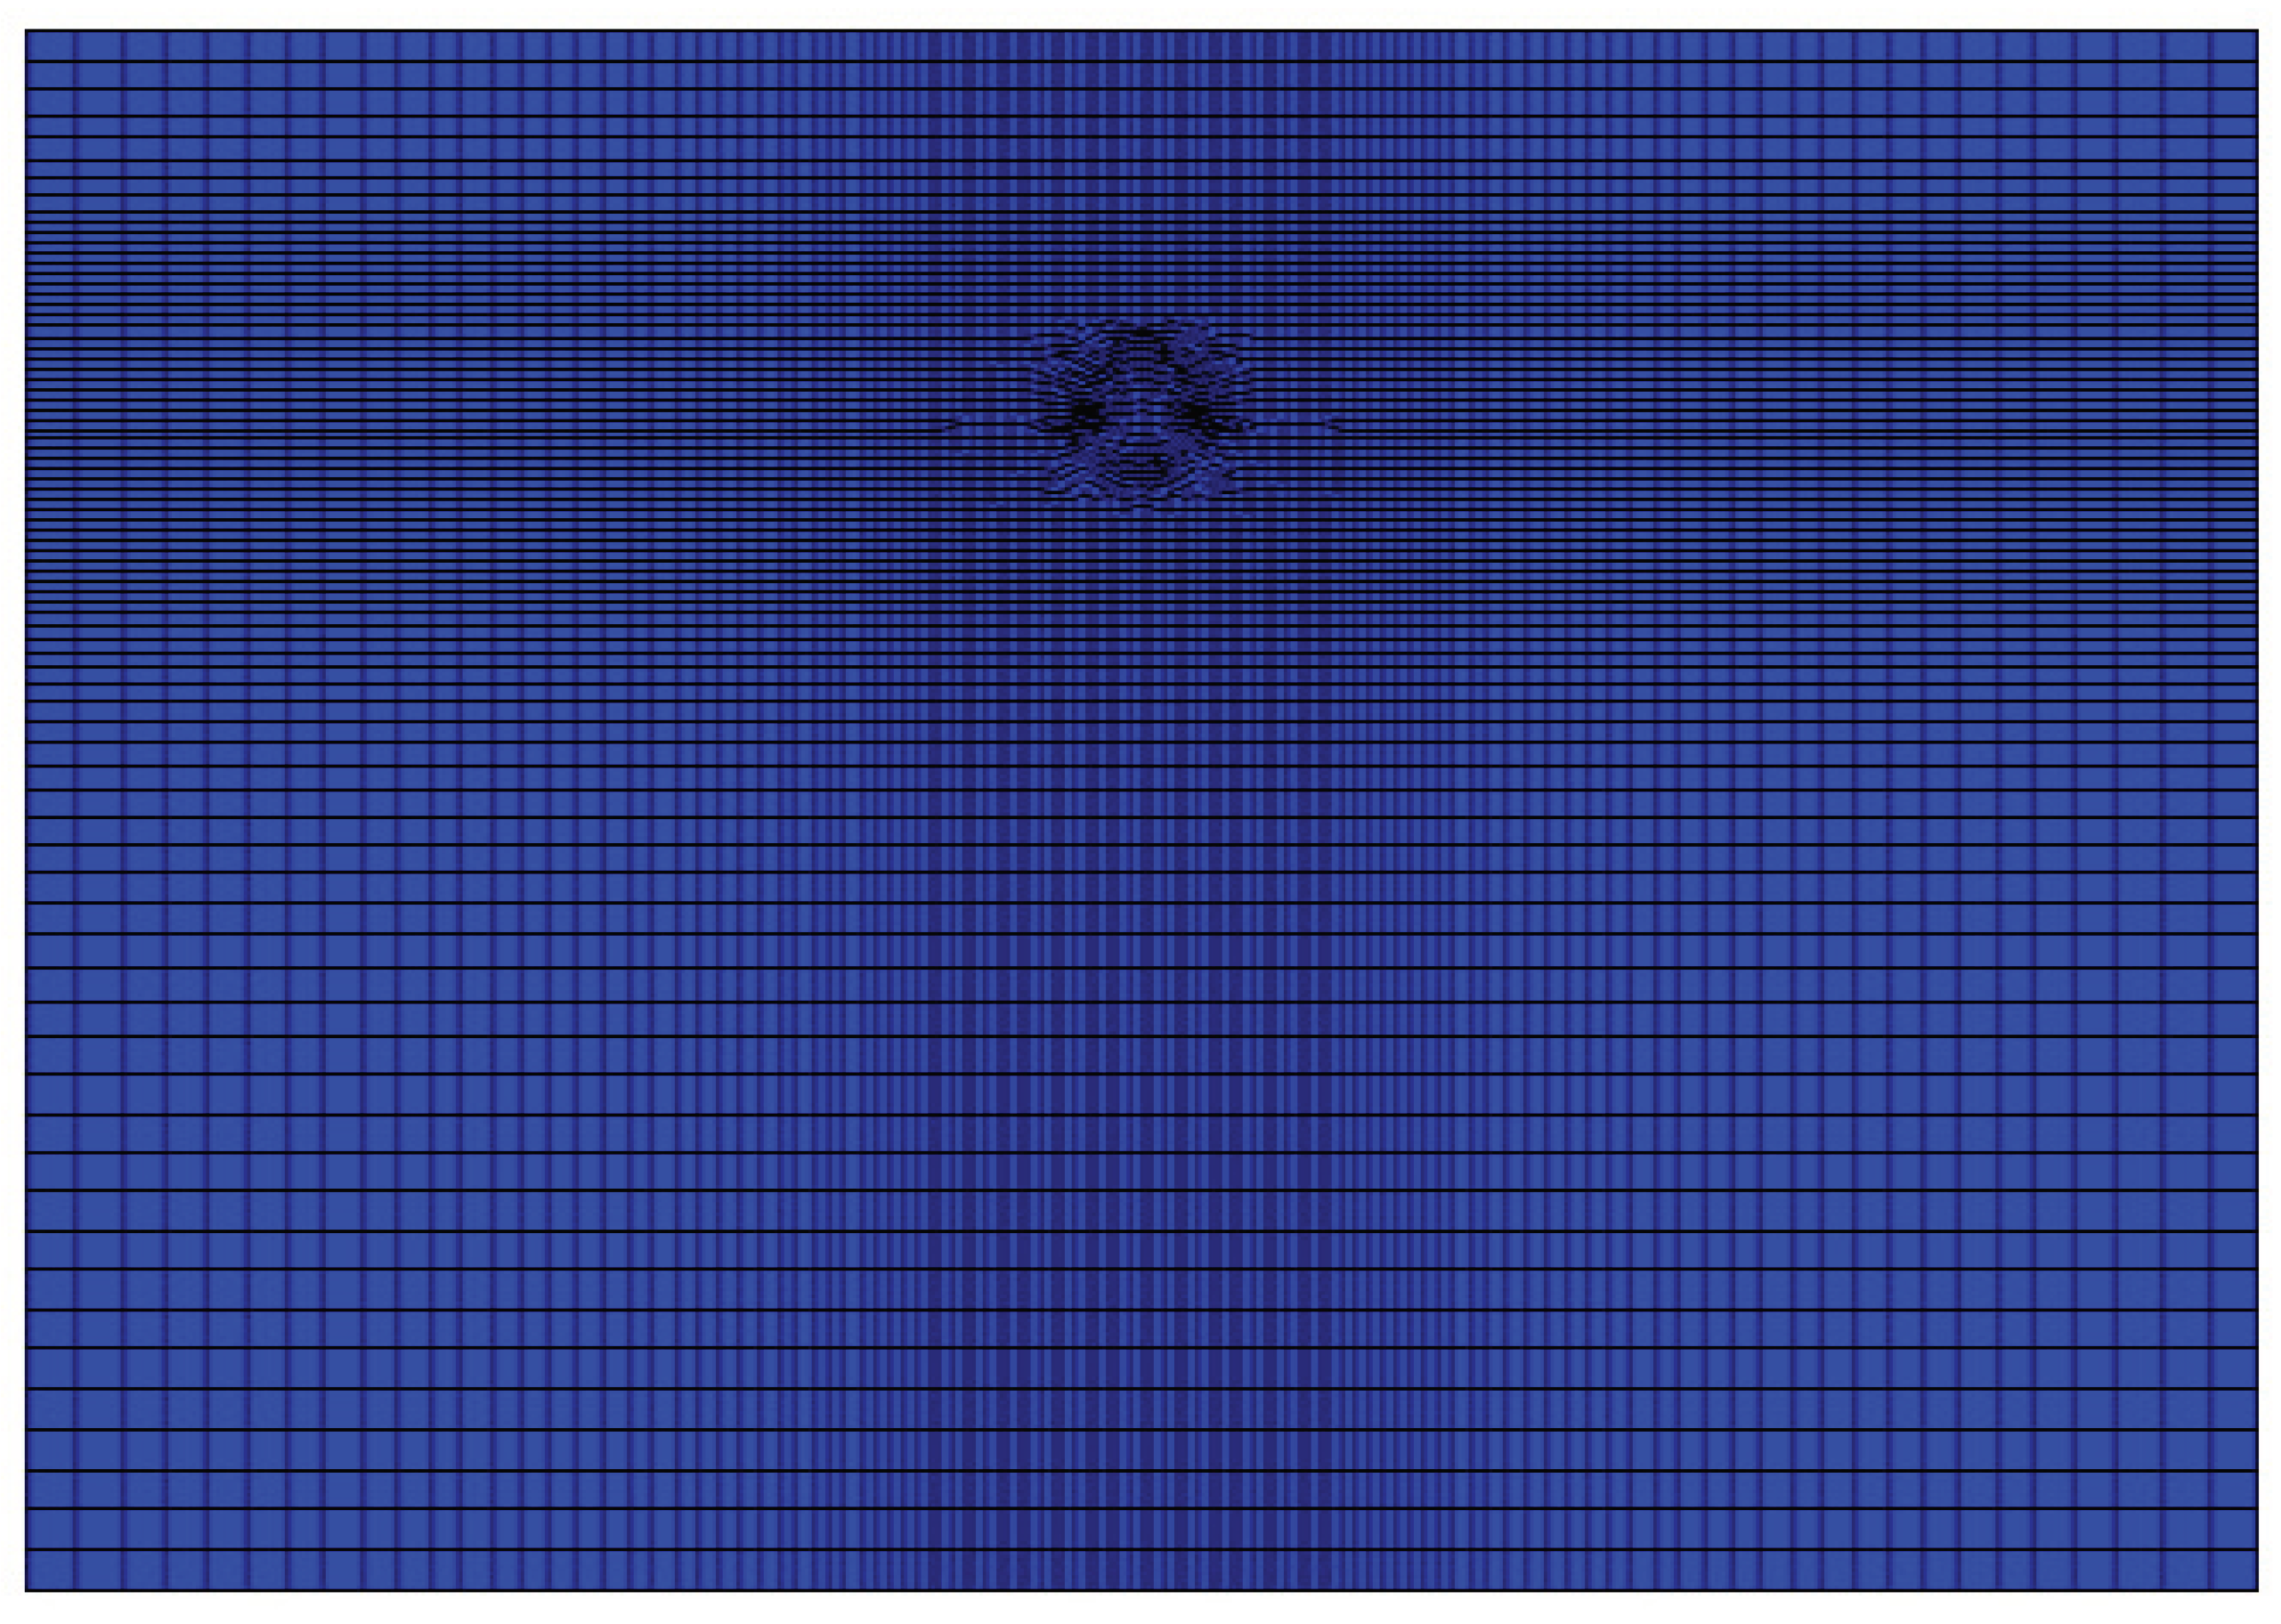
In the direction of seismic wave propagation,, the maximum grid size should be less than 1/8 of the wavelength corresponding to the highest frequency of the input waveform, and the maximum cell sizes for different soil materials and tunnels to satisfy the accuracy of the dynamic calculation are given in
Table 3. With this as a limiting condition the computational model can be meshed and the meshing is shown in
Figure 5
2.4. Tunnel Seismic Calculation Process
After the calculation model is established, the calculation can be started, and the calculation process is mainly divided into three steps:
(1) Calculation of soil gravity stress field
The bottom of the calculation model is constrained in the horizontal and vertical directions, the sides are constrained in the horizontal direction and free in the vertical direction, so that the soil body reaches equilibrium under the action of self-gravity, that is, the calculation of the soil body's self-gravity stress field is completed.
(2) Tunnel excavation analysis
Excavate the soil body in which the tunnel is located and impose the lining unit to simulate the lining after the equilibrium calculation, that is, complete the tunnel excavation calculation.
(3) Calculation of the tunnel dynamic time history
The soil body is given the corresponding damping parameters, the free field boundary is applied around the model, the viscous boundary is applied at the bottom, and the seismic effect is input at the bottom to start the calculation, and after the vibration of the model stops, the calculation reaches equilibrium, which is the completion of the calculation of the tunnel dynamic time history.
3. Analysis of the Results of Seismic Response Calculations for Metro Tunnels
3.1. Internal Force Response Analysis
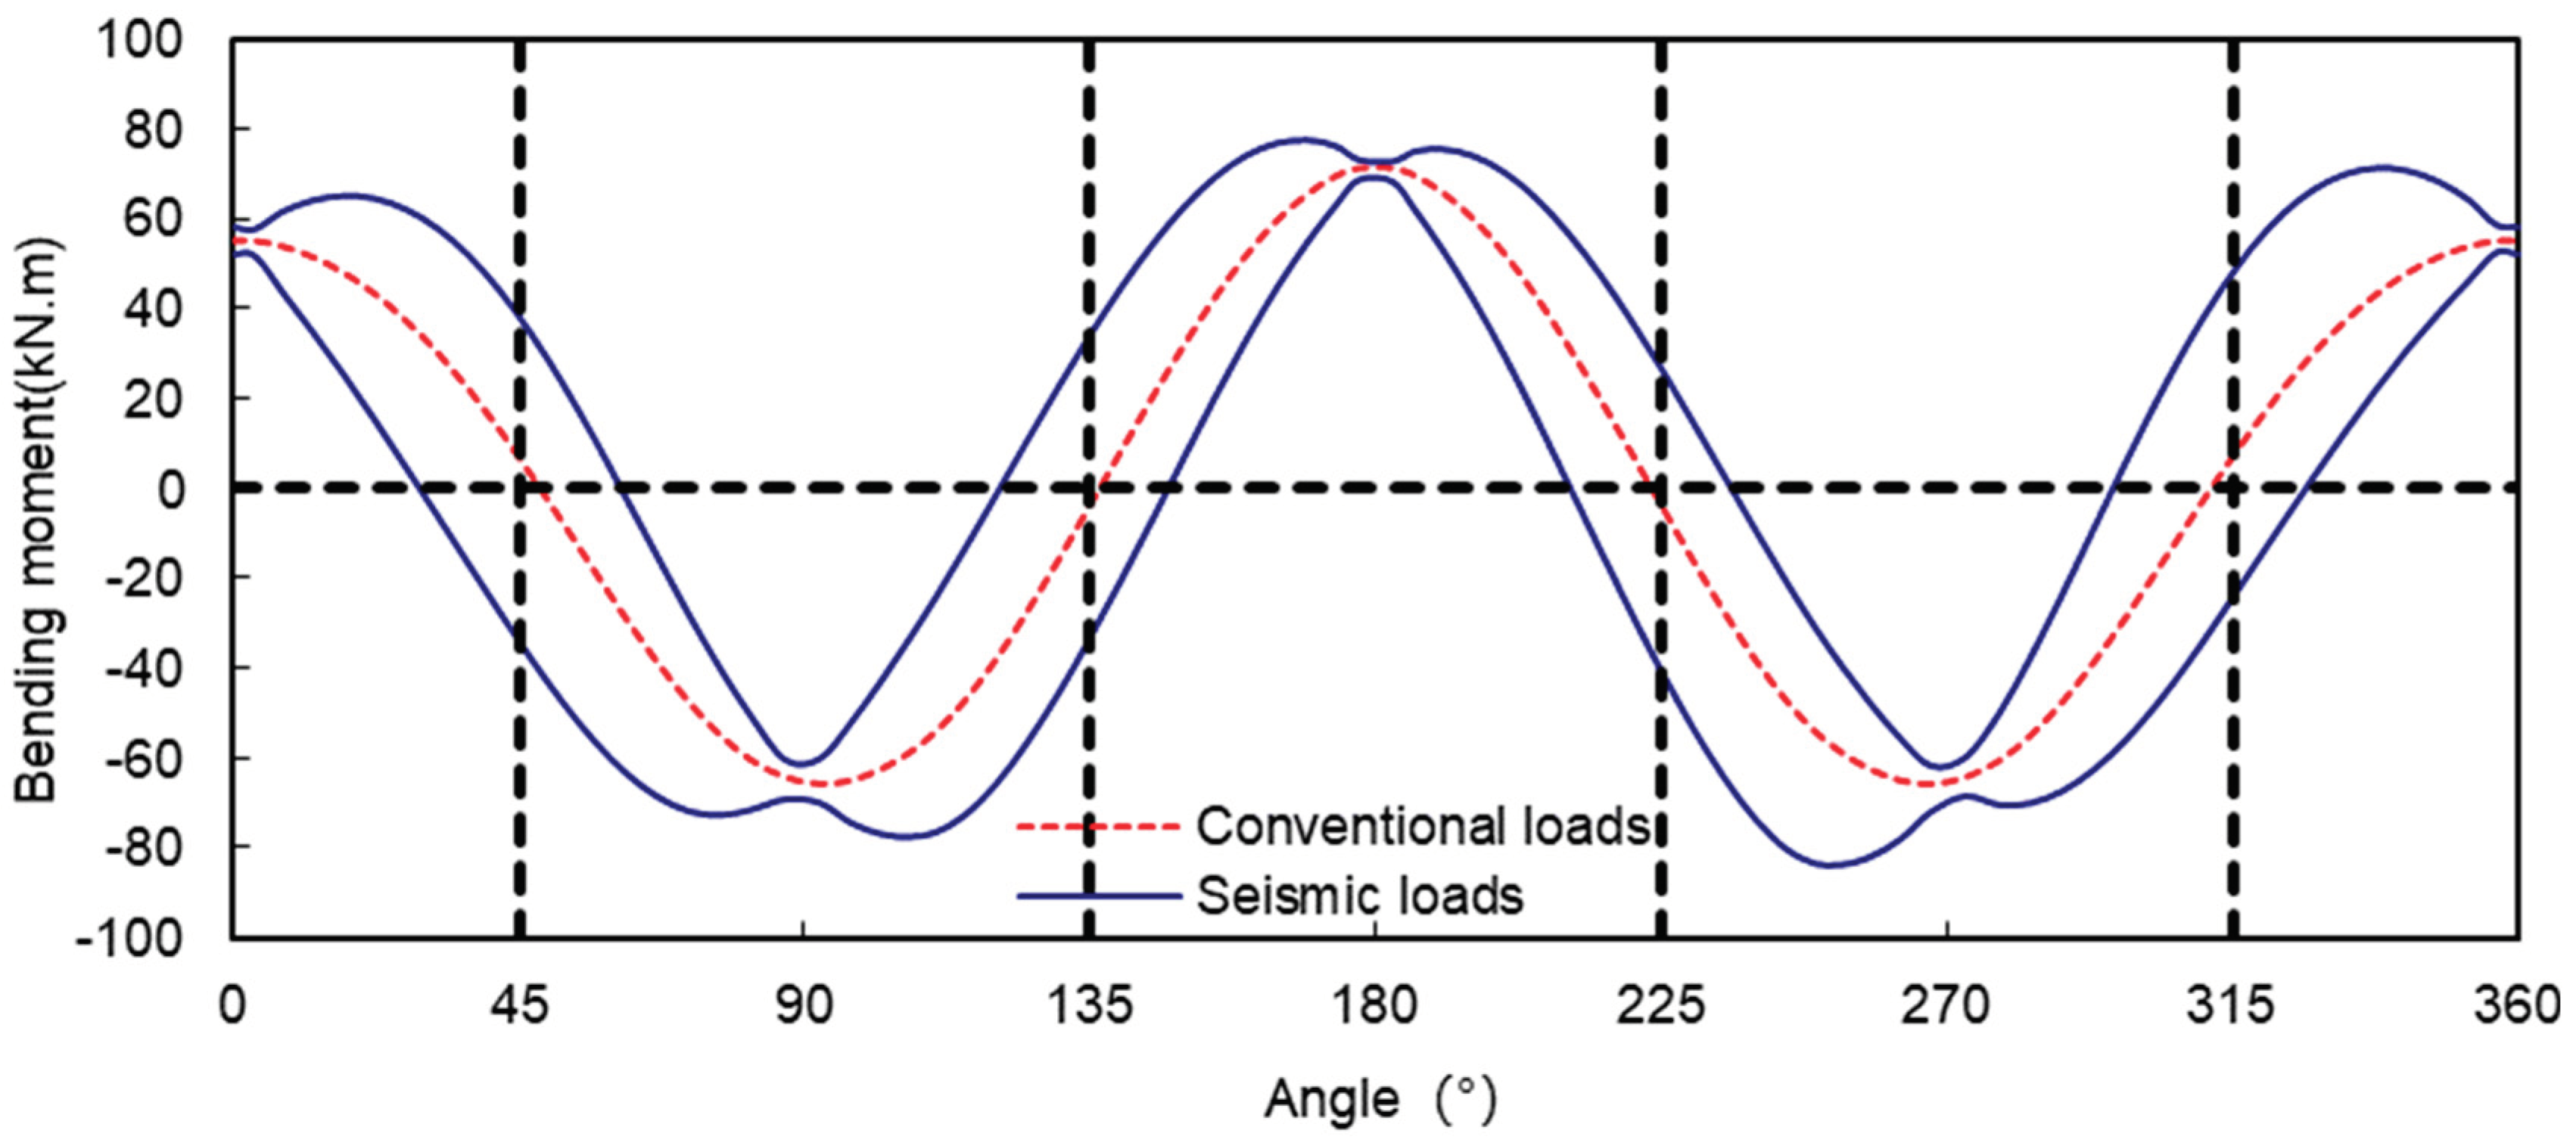
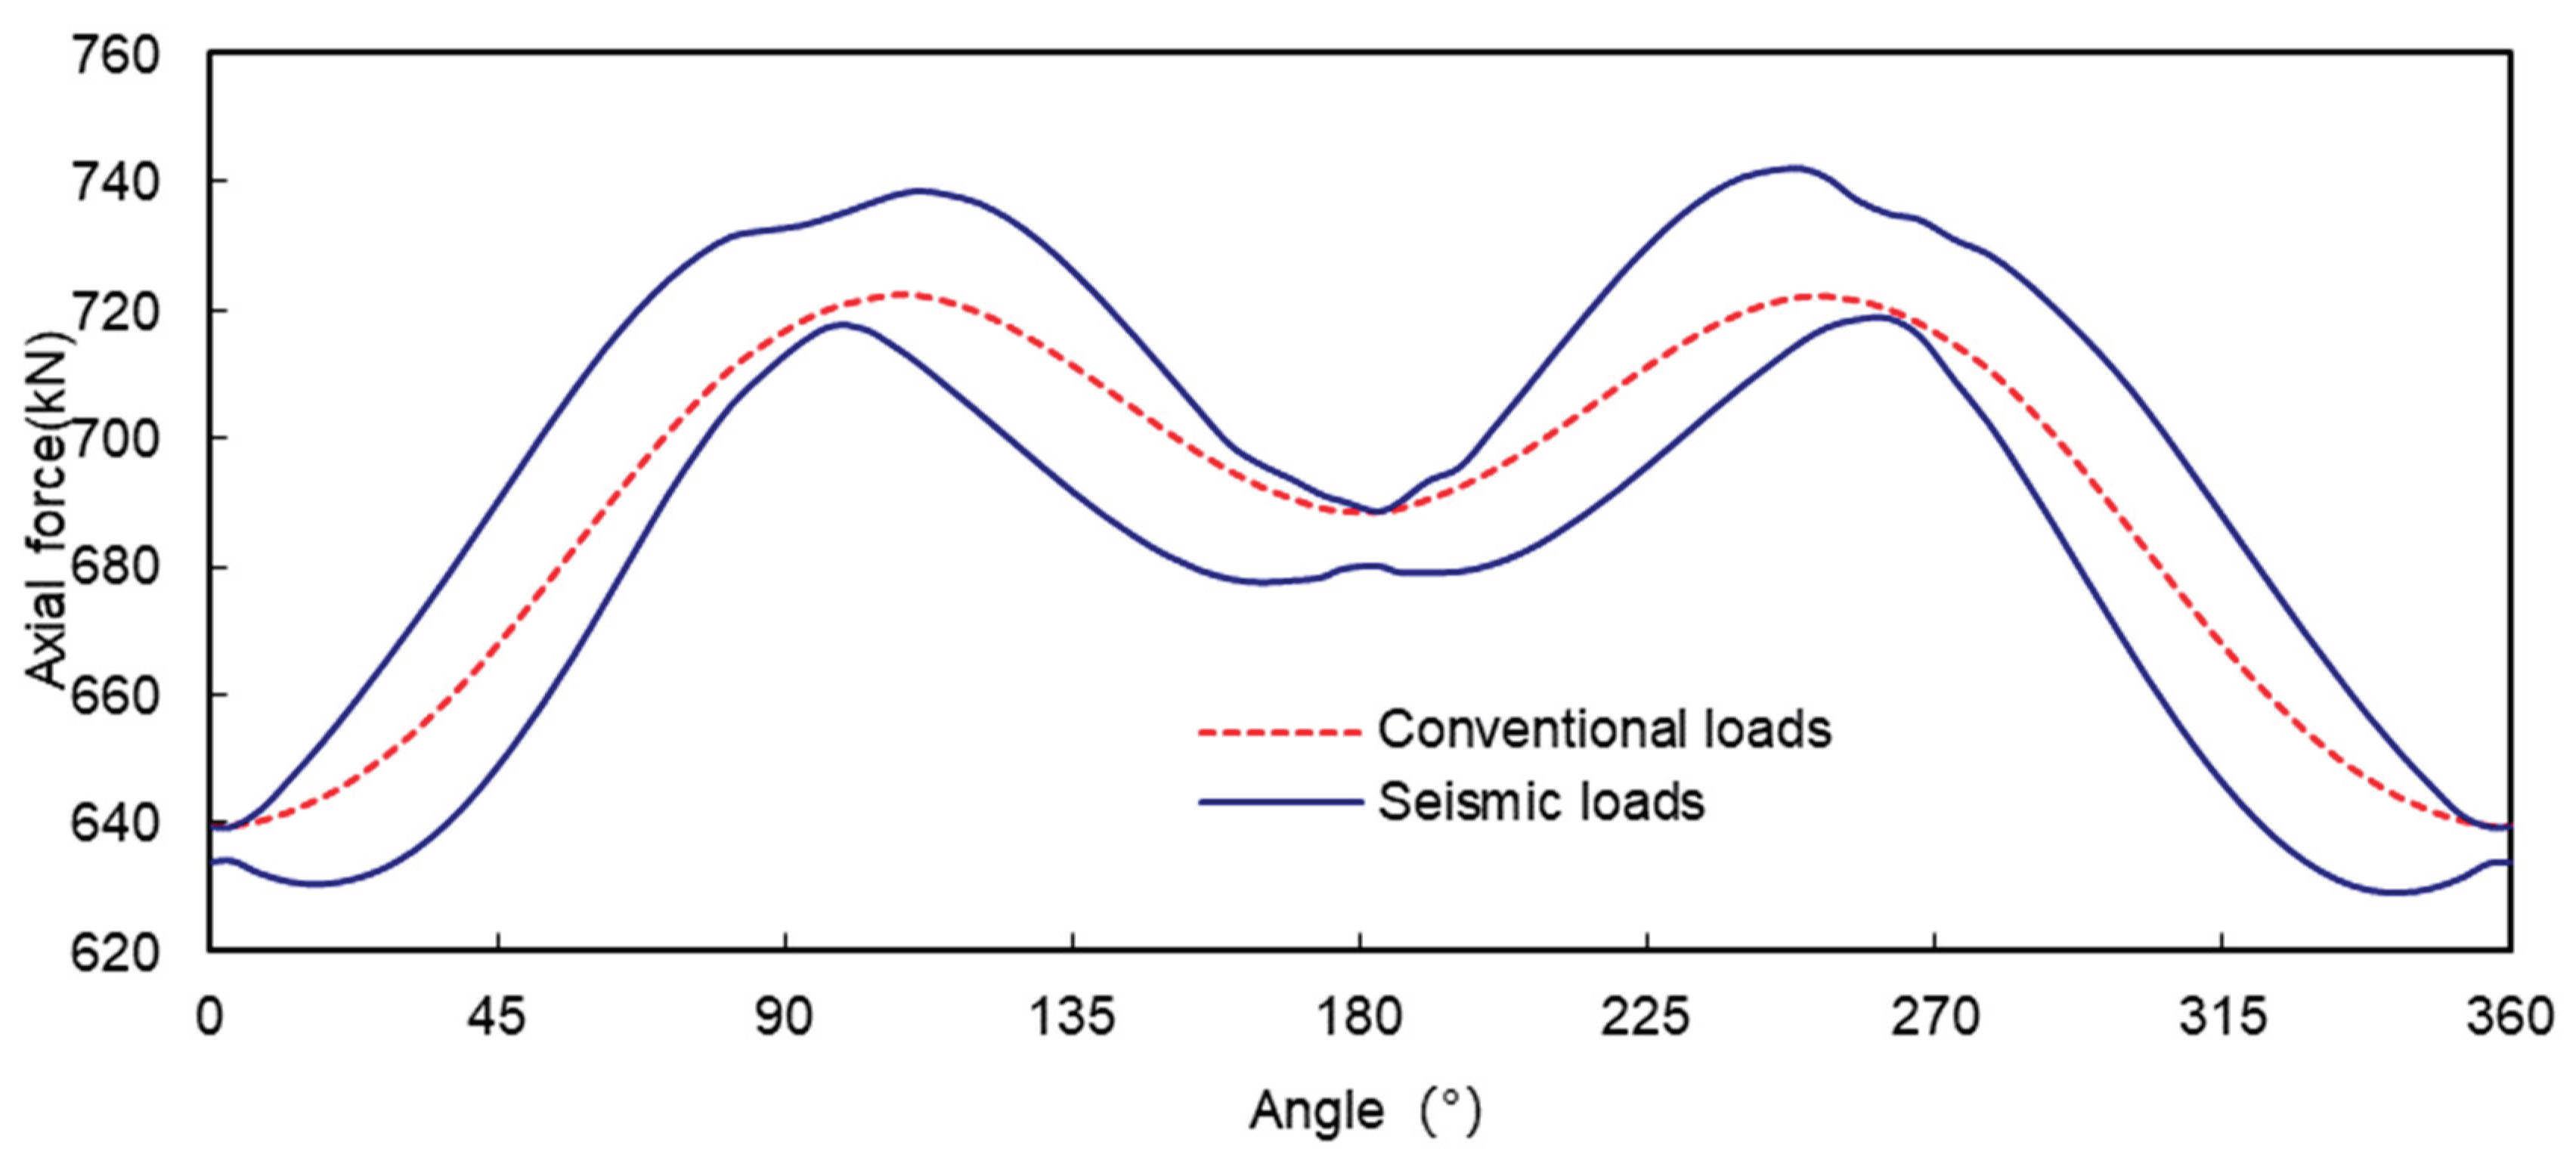
Under seismic loading, the internal force of the tunnel structure may be greater or less than under conventional loading,
Figure 6 and
Figure 7 show the envelope diagrams of the bending moment and axial force of the tunnel under seismic loading, respectively. From
Figure 6 it can be seen that the bending moments at 0°, 90°, 180° and 270° of the tunnel are greater under conventional loading, while the bending moments at these locations do not vary greatly under seismic loading, and a similar pattern can be found in Figure7, which indicates that the seismic loading does not have too great an effect on the bending moments and axial forces at 0°, 90°, 180° and 270° of the tunnel.
Table 4 shows the distribution of the extreme values of the bending moments and axial forces in
Figure 6 and
Figure 7. It is easy to see from
Table 4 that the distribution of the extreme values of the bending moments and axial forces under seismic loading is quite different from that under conventional loading, and none of them appear in the parts where the bending moments under conventional loading are large, such as at 0°, 90°, 180°, 270°, etc. The maximum values of the bending moments occur at 169°, 180°, 270°, etc. The maximum value of the bending moment occurred at 169°, which was 18.2% larger than the conventional bending moment at the corresponding location, and the maximum value of the negative bending moment occurred at 253°, which was 43.6% larger than the conventional bending moment at the corresponding location.
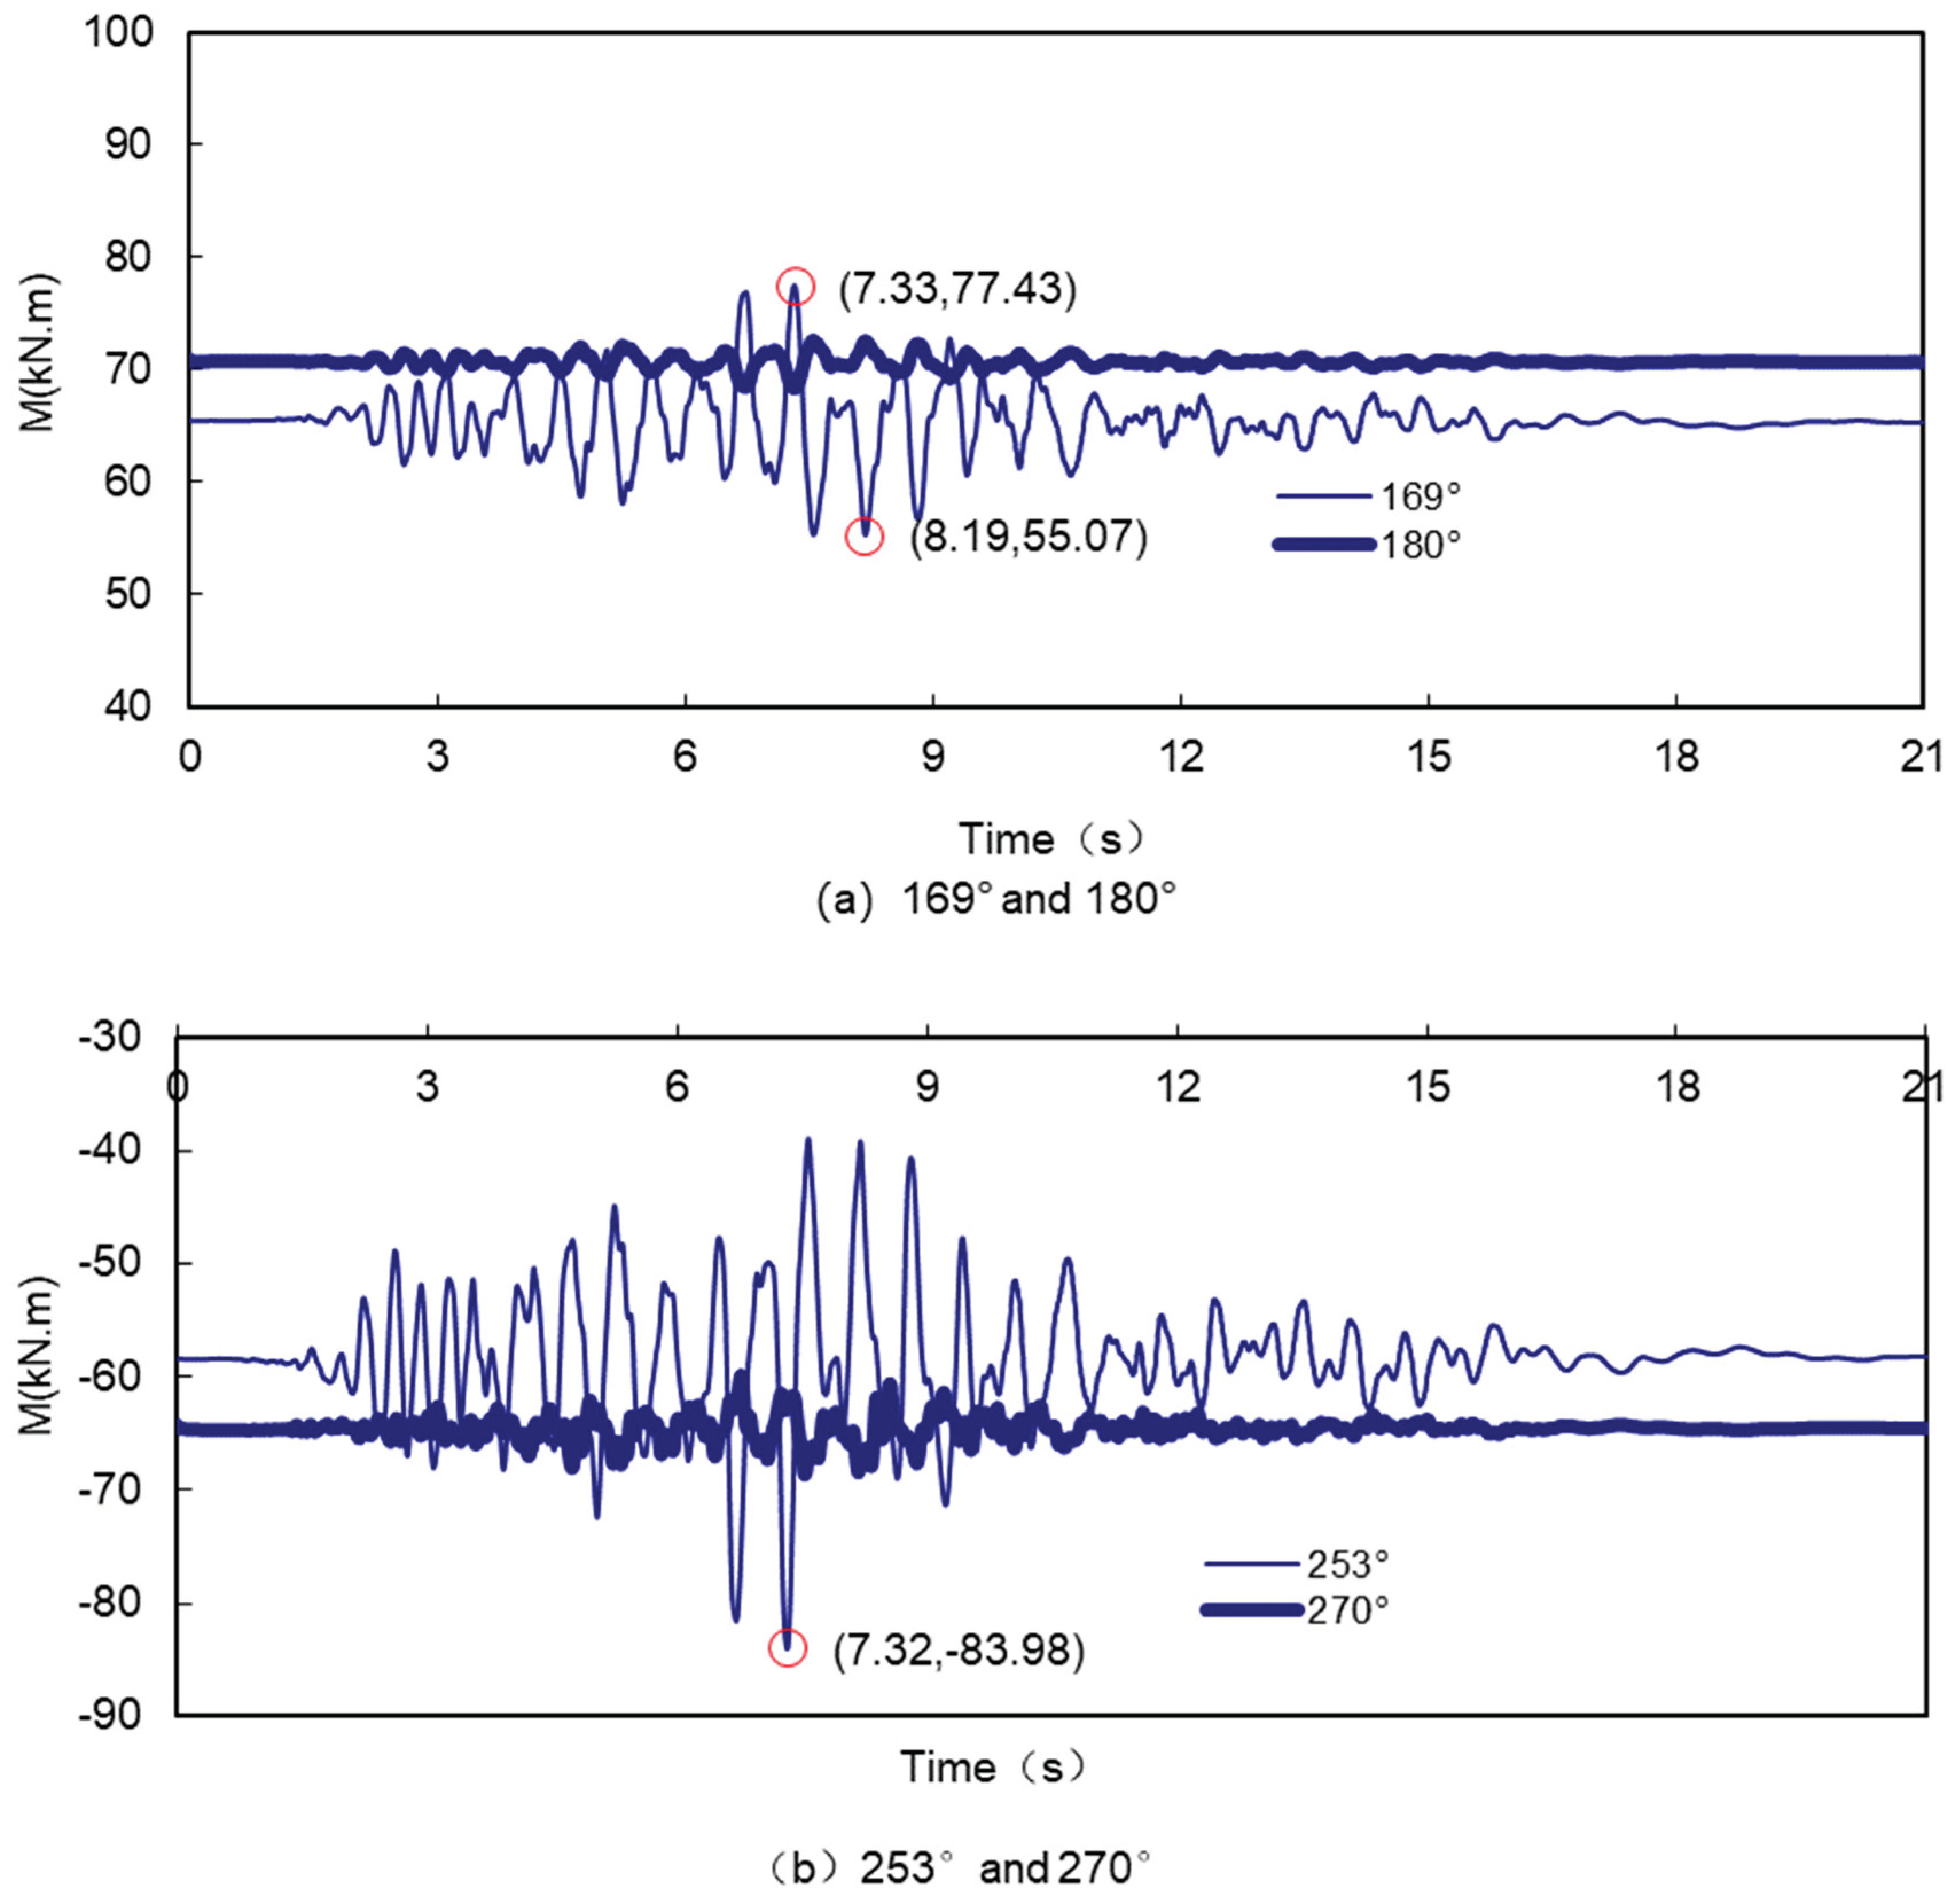
Figure 8 shows the variation of the tunnel bending moment with time under the effect of the earthquake. Consistent with the bending moment envelope shown in Figure 1.6, the tunnels at 180° and 270° are less affected by the earthquakes, with a small range of variation of less than 10kNm. The tunnels at 169° and 253° are more affected by the earthquakes, with a range of variation of about 22kNm at 169° and about 45kNm at 253°.
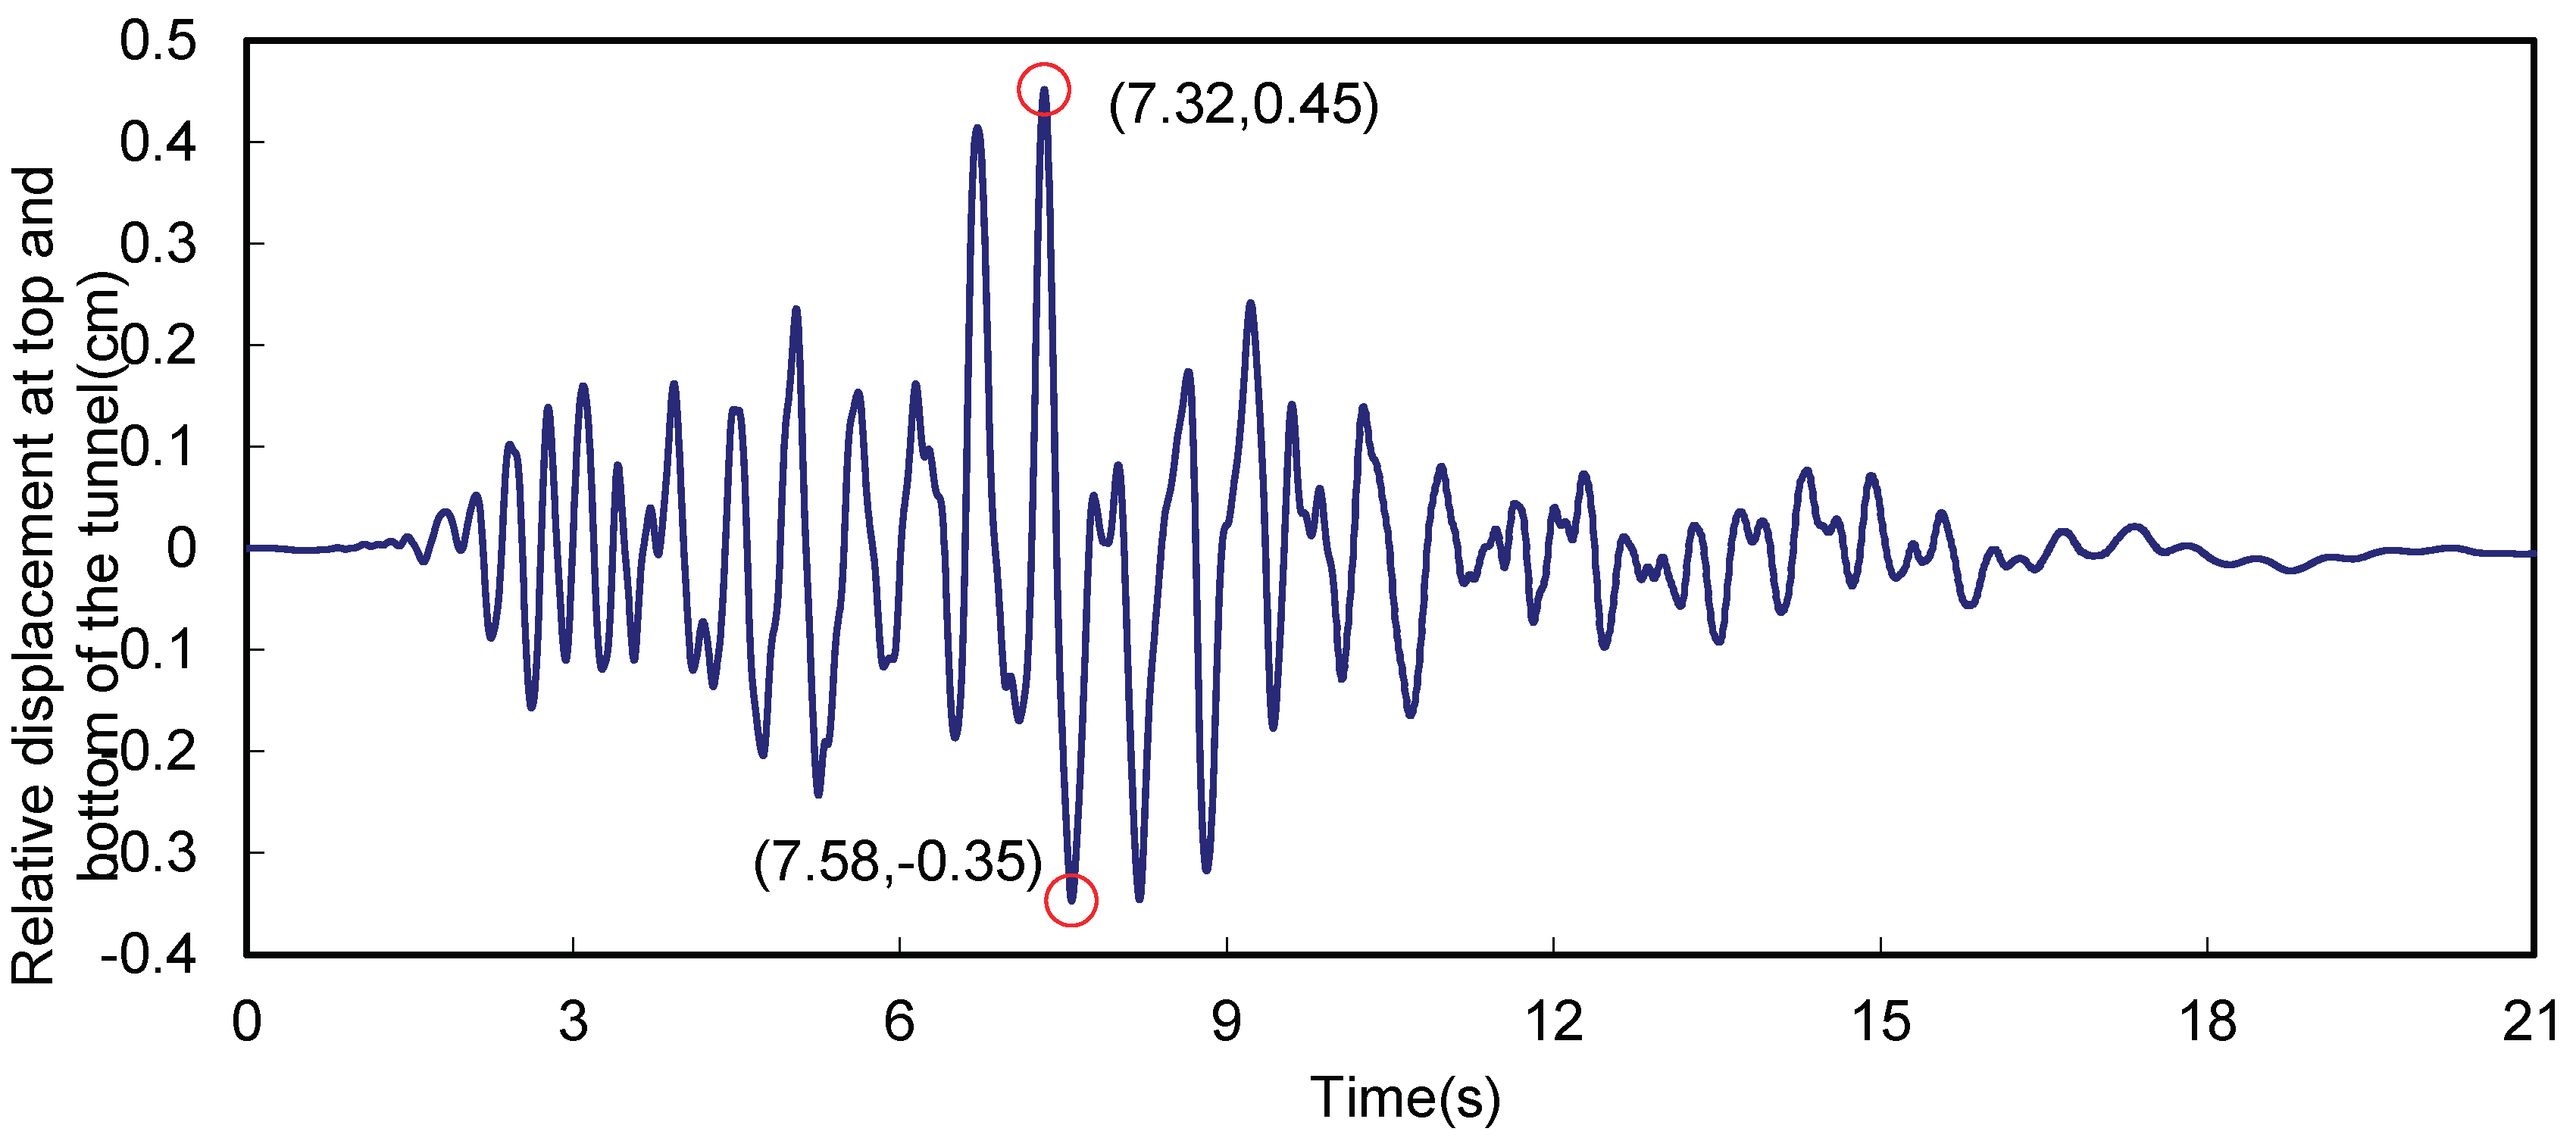
Due to the different burial depths of the top and bottom of the tunnel, there is generally a relative displacement between the surrounding soils under seismic action, and
Figure 9 shows the changes in the relative displacement of the surrounding soils under seismic action. From Figure 1.9 it can be seen that the relative displacement of the ground at the top and bottom of the tunnel reaches its maximum value in the positive and negative directions after the earthquake for 7.32 s and 7.58 s respectively, which is 0.45 cm and 0.35 cm. From the error! Reference not found. Figure 1.8 shows that, except for a few points (at 169°), the bending moment of the tunnel reaches the maximum or minimum value after the earthquake occurs at about 7.32 s and 7.58 s. This indicates to some extent that, due to the restraining effect of the soil around the tunnel, the seismic response of the tunnel is closely related to the relative displacement of the surrounding soil, and the greater the relative displacement of the soil near the top and bottom of the tunnel, the greater the bending moment generated by the tunnel. The greater the relative displacement of the ground near the top and bottom of the tunnel, the greater the bending moment generated by the tunnel.
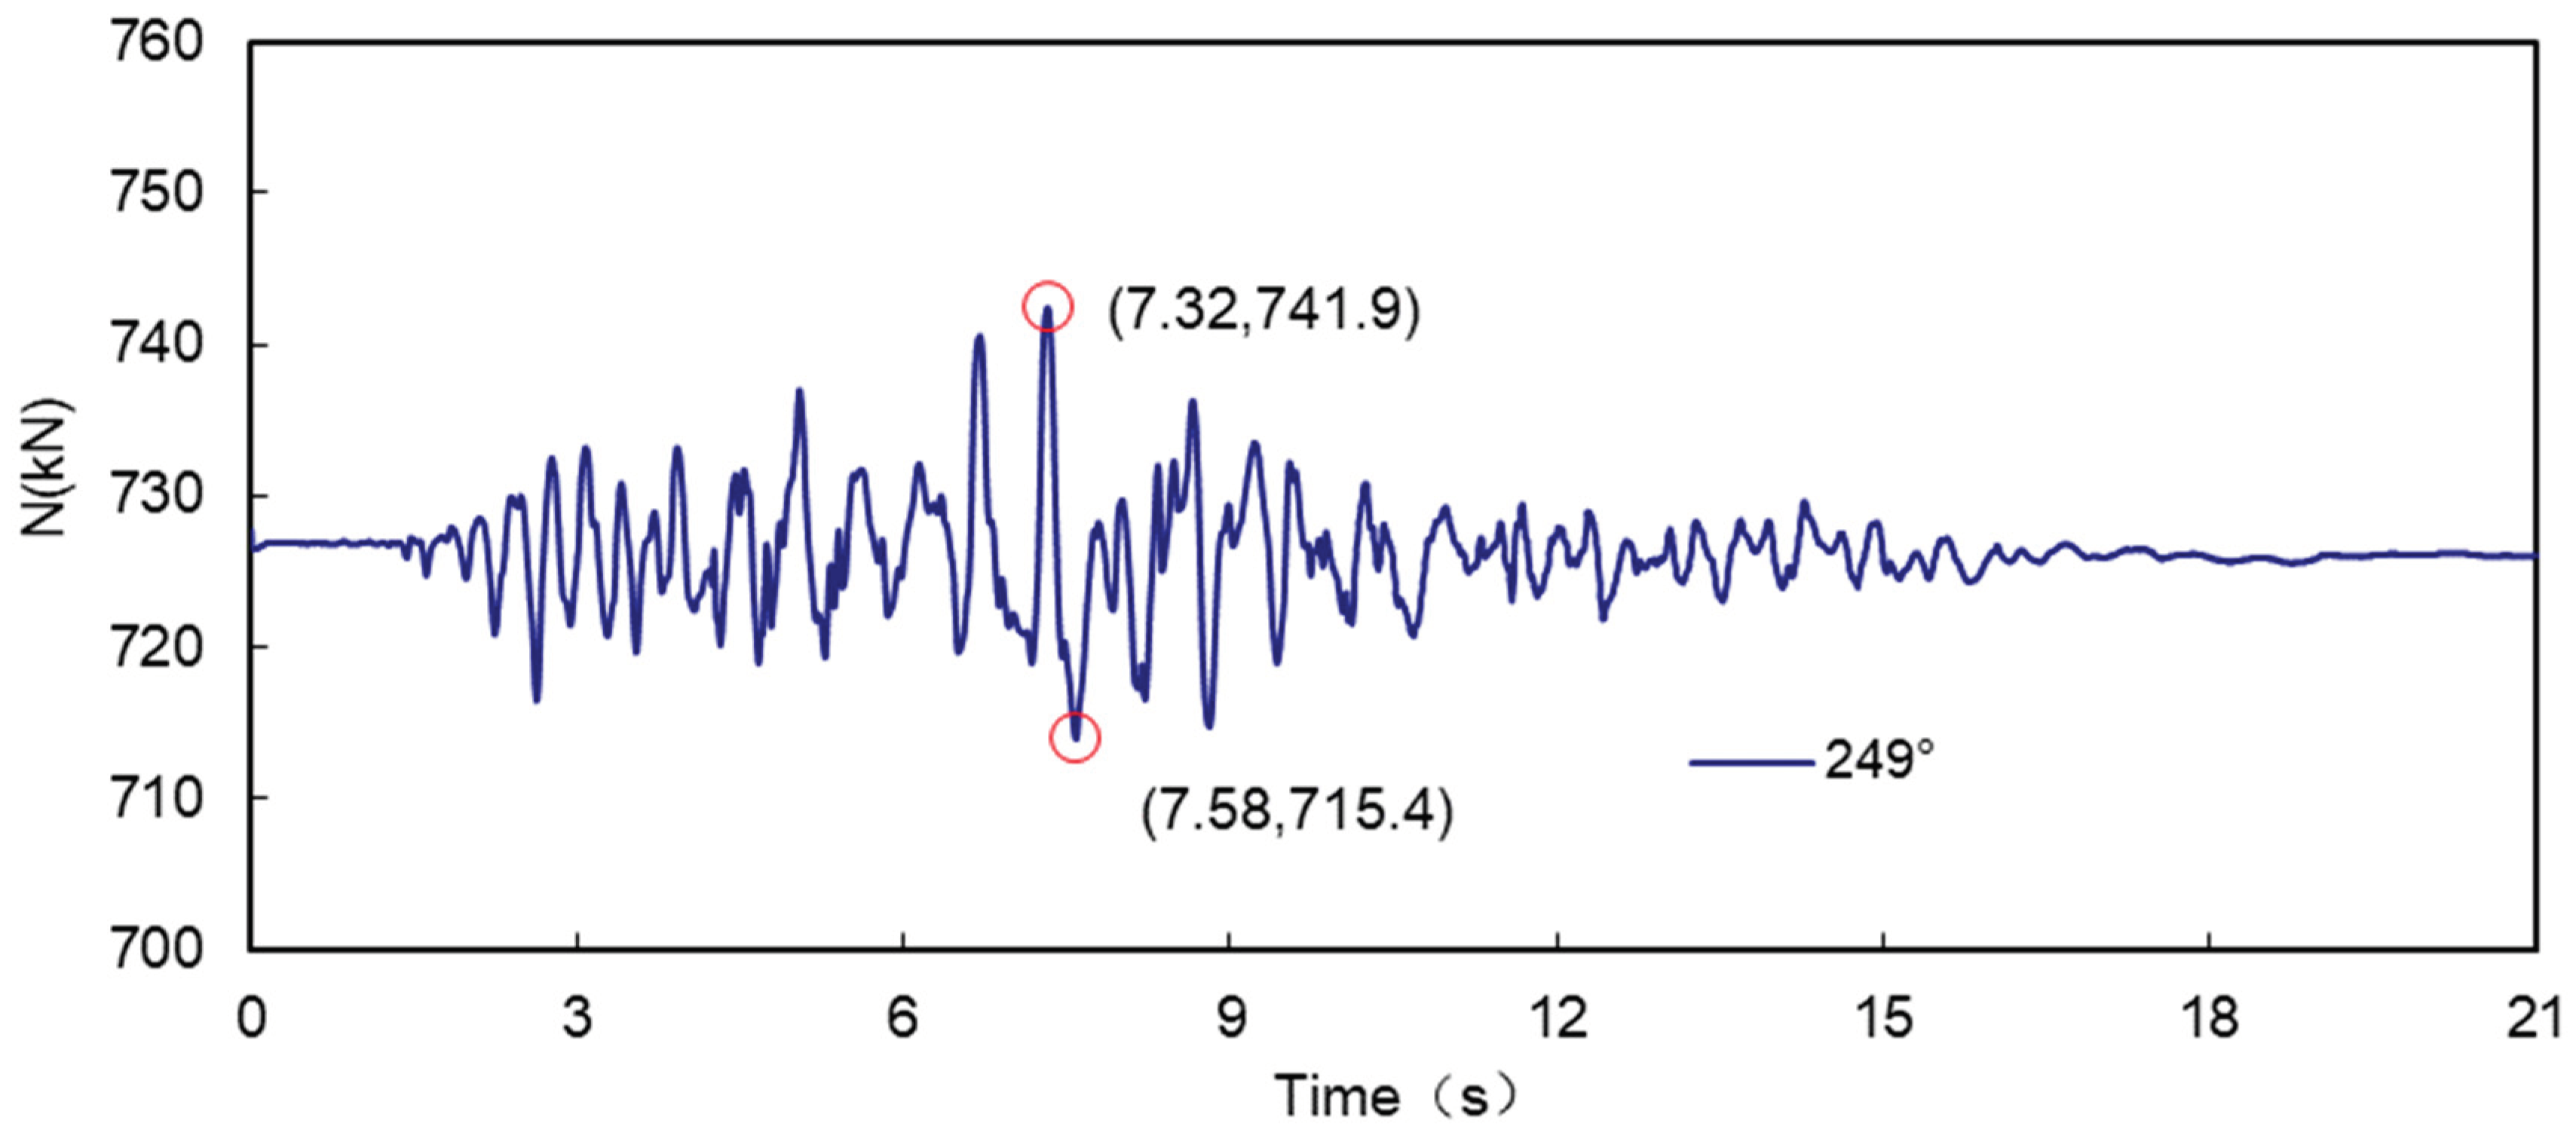
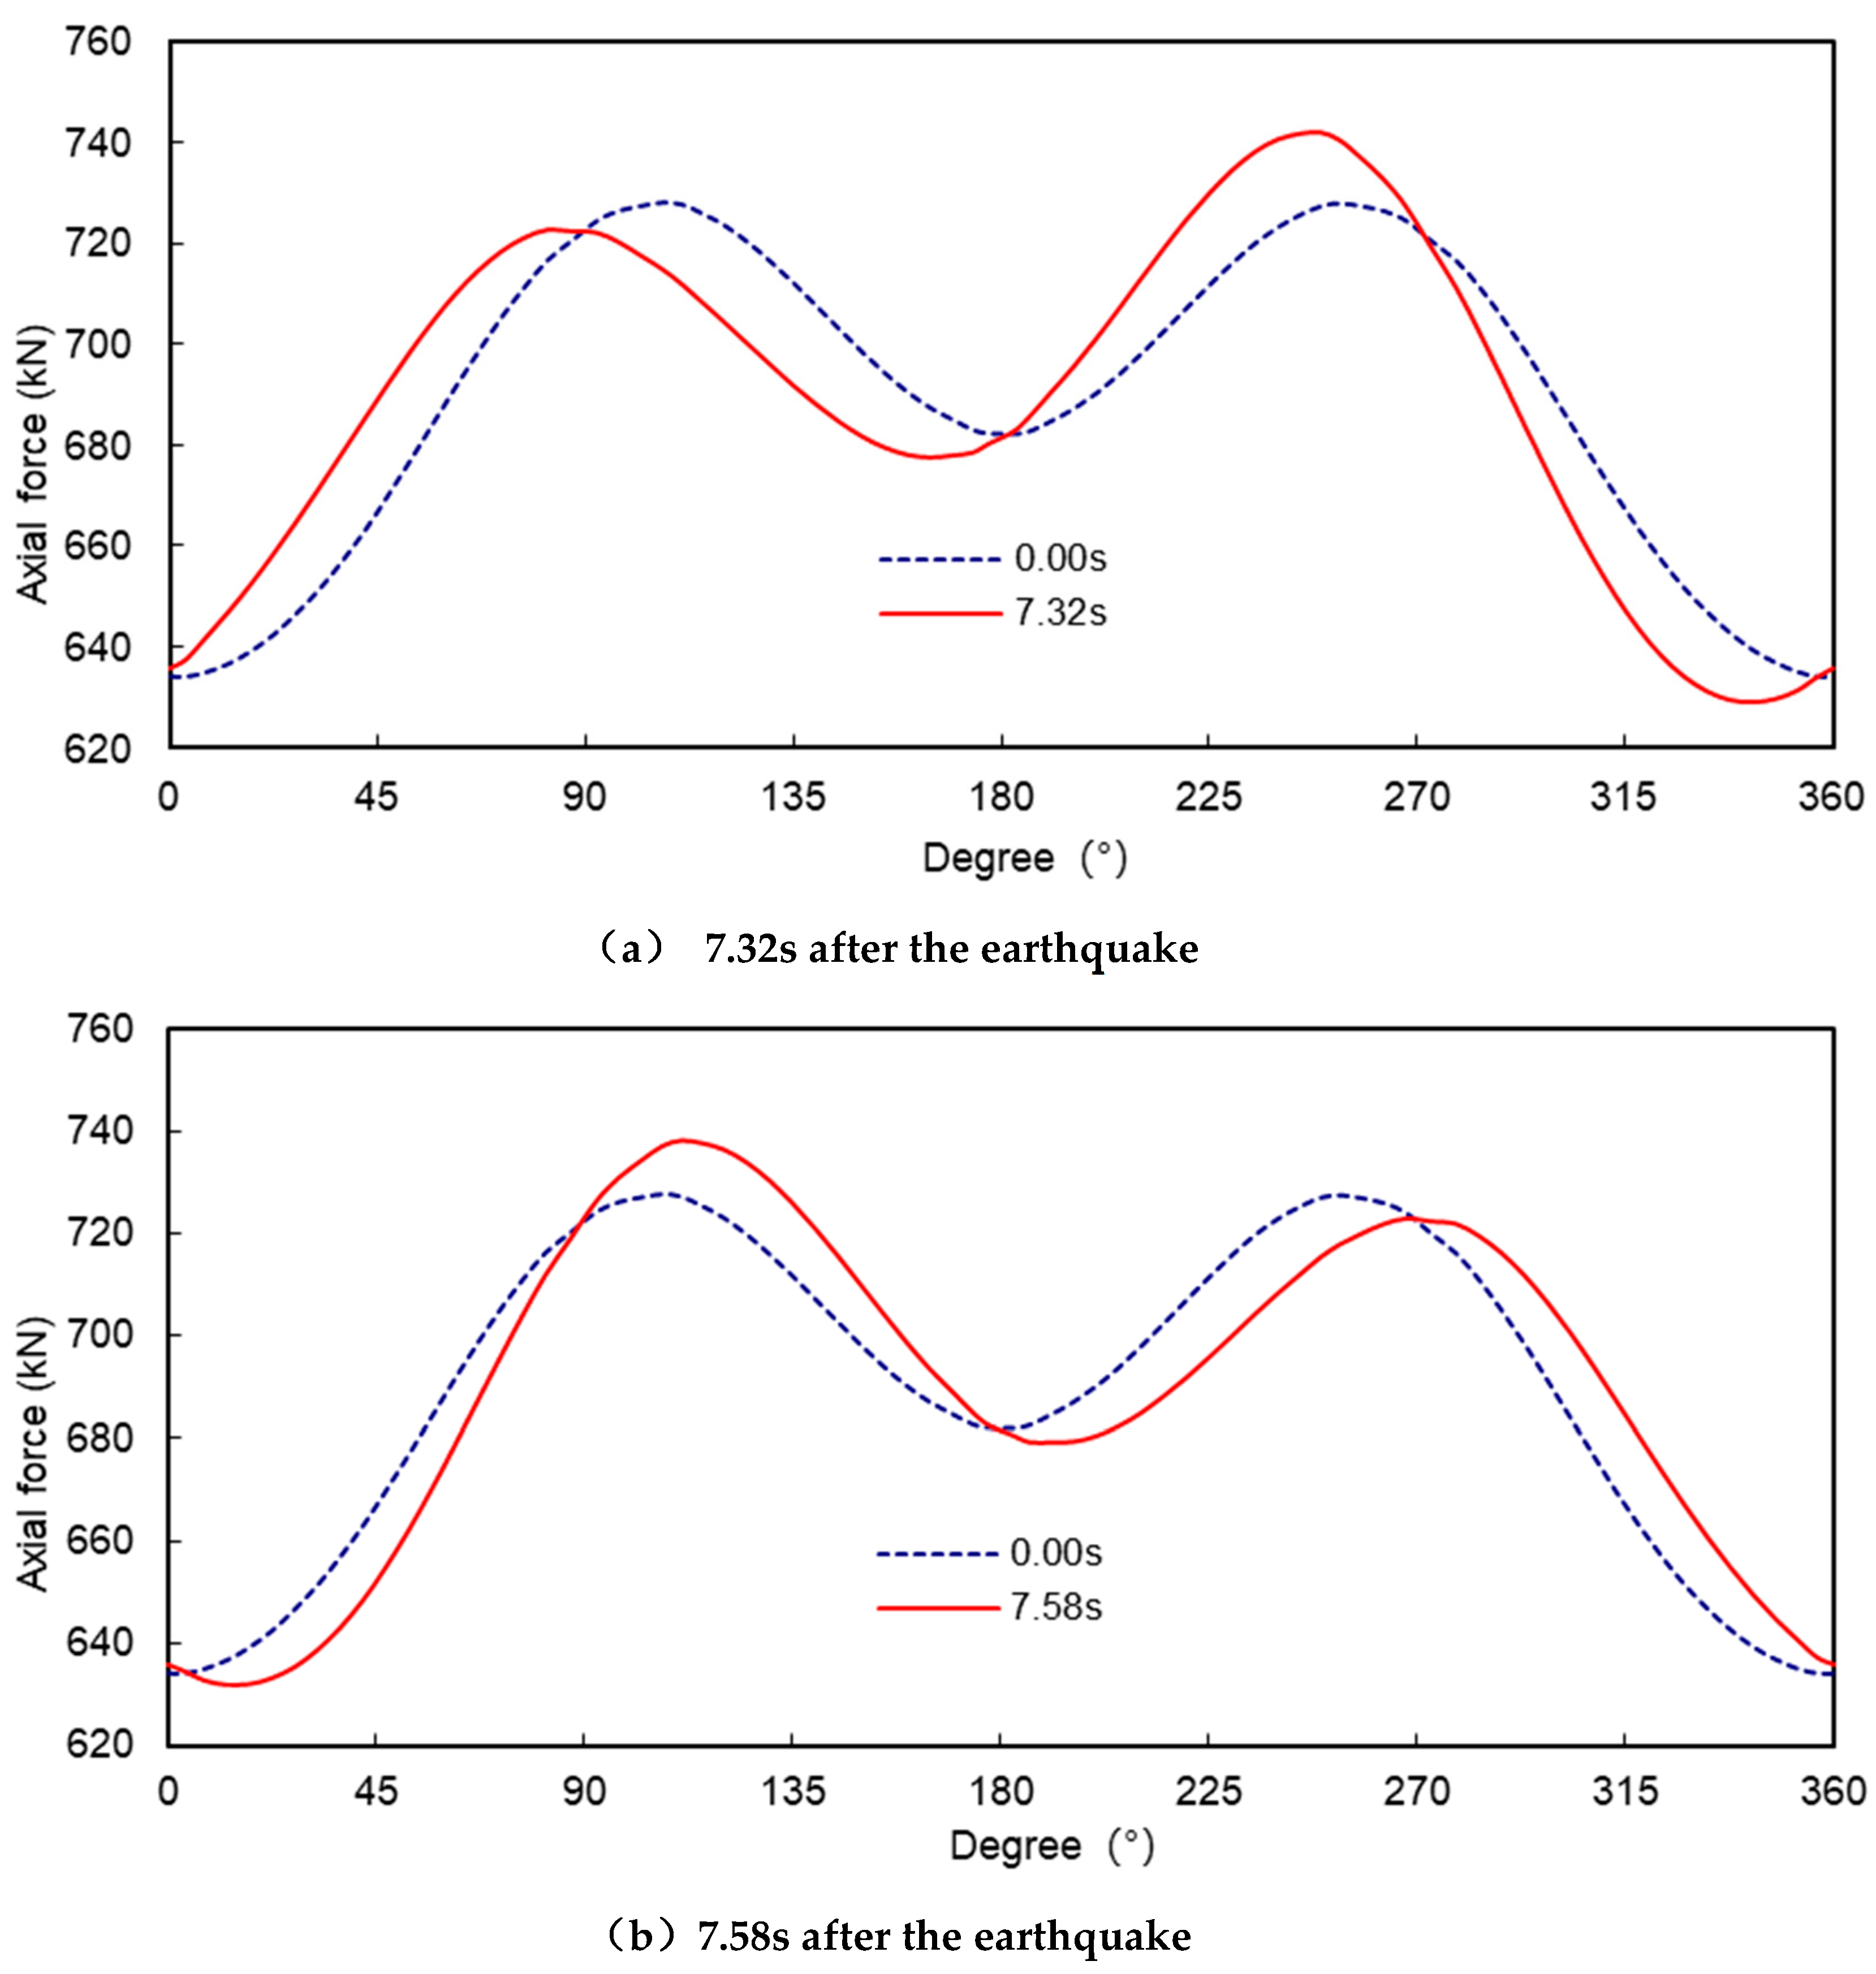
Under seismic loading, the axial force of the tunnel is relatively small compared to the bending moment, even the axial force in the largest part of the tunnel (249°) increases by only 2.7% compared to the axial force under conventional loading. Figure 1.10 shows the time history of the axial force at 249° of the tunnel, which fluctuates within a range of about 27 kN, and the maximum axial force is reached here after 7.32 s of the seismic event, which is the same time as the maximum relative displacement of the ground near the top and bottom of the tunnel. The time at which the axial force reaches its maximum is also consistent with the time at which the relative displacement of the ground near the top and bottom of the tunnel reaches its maximum, showing that the magnitude of the axial force and the relative displacement of the ground around the tunnel are also correlated.
3.2. Deformation Response Analysis
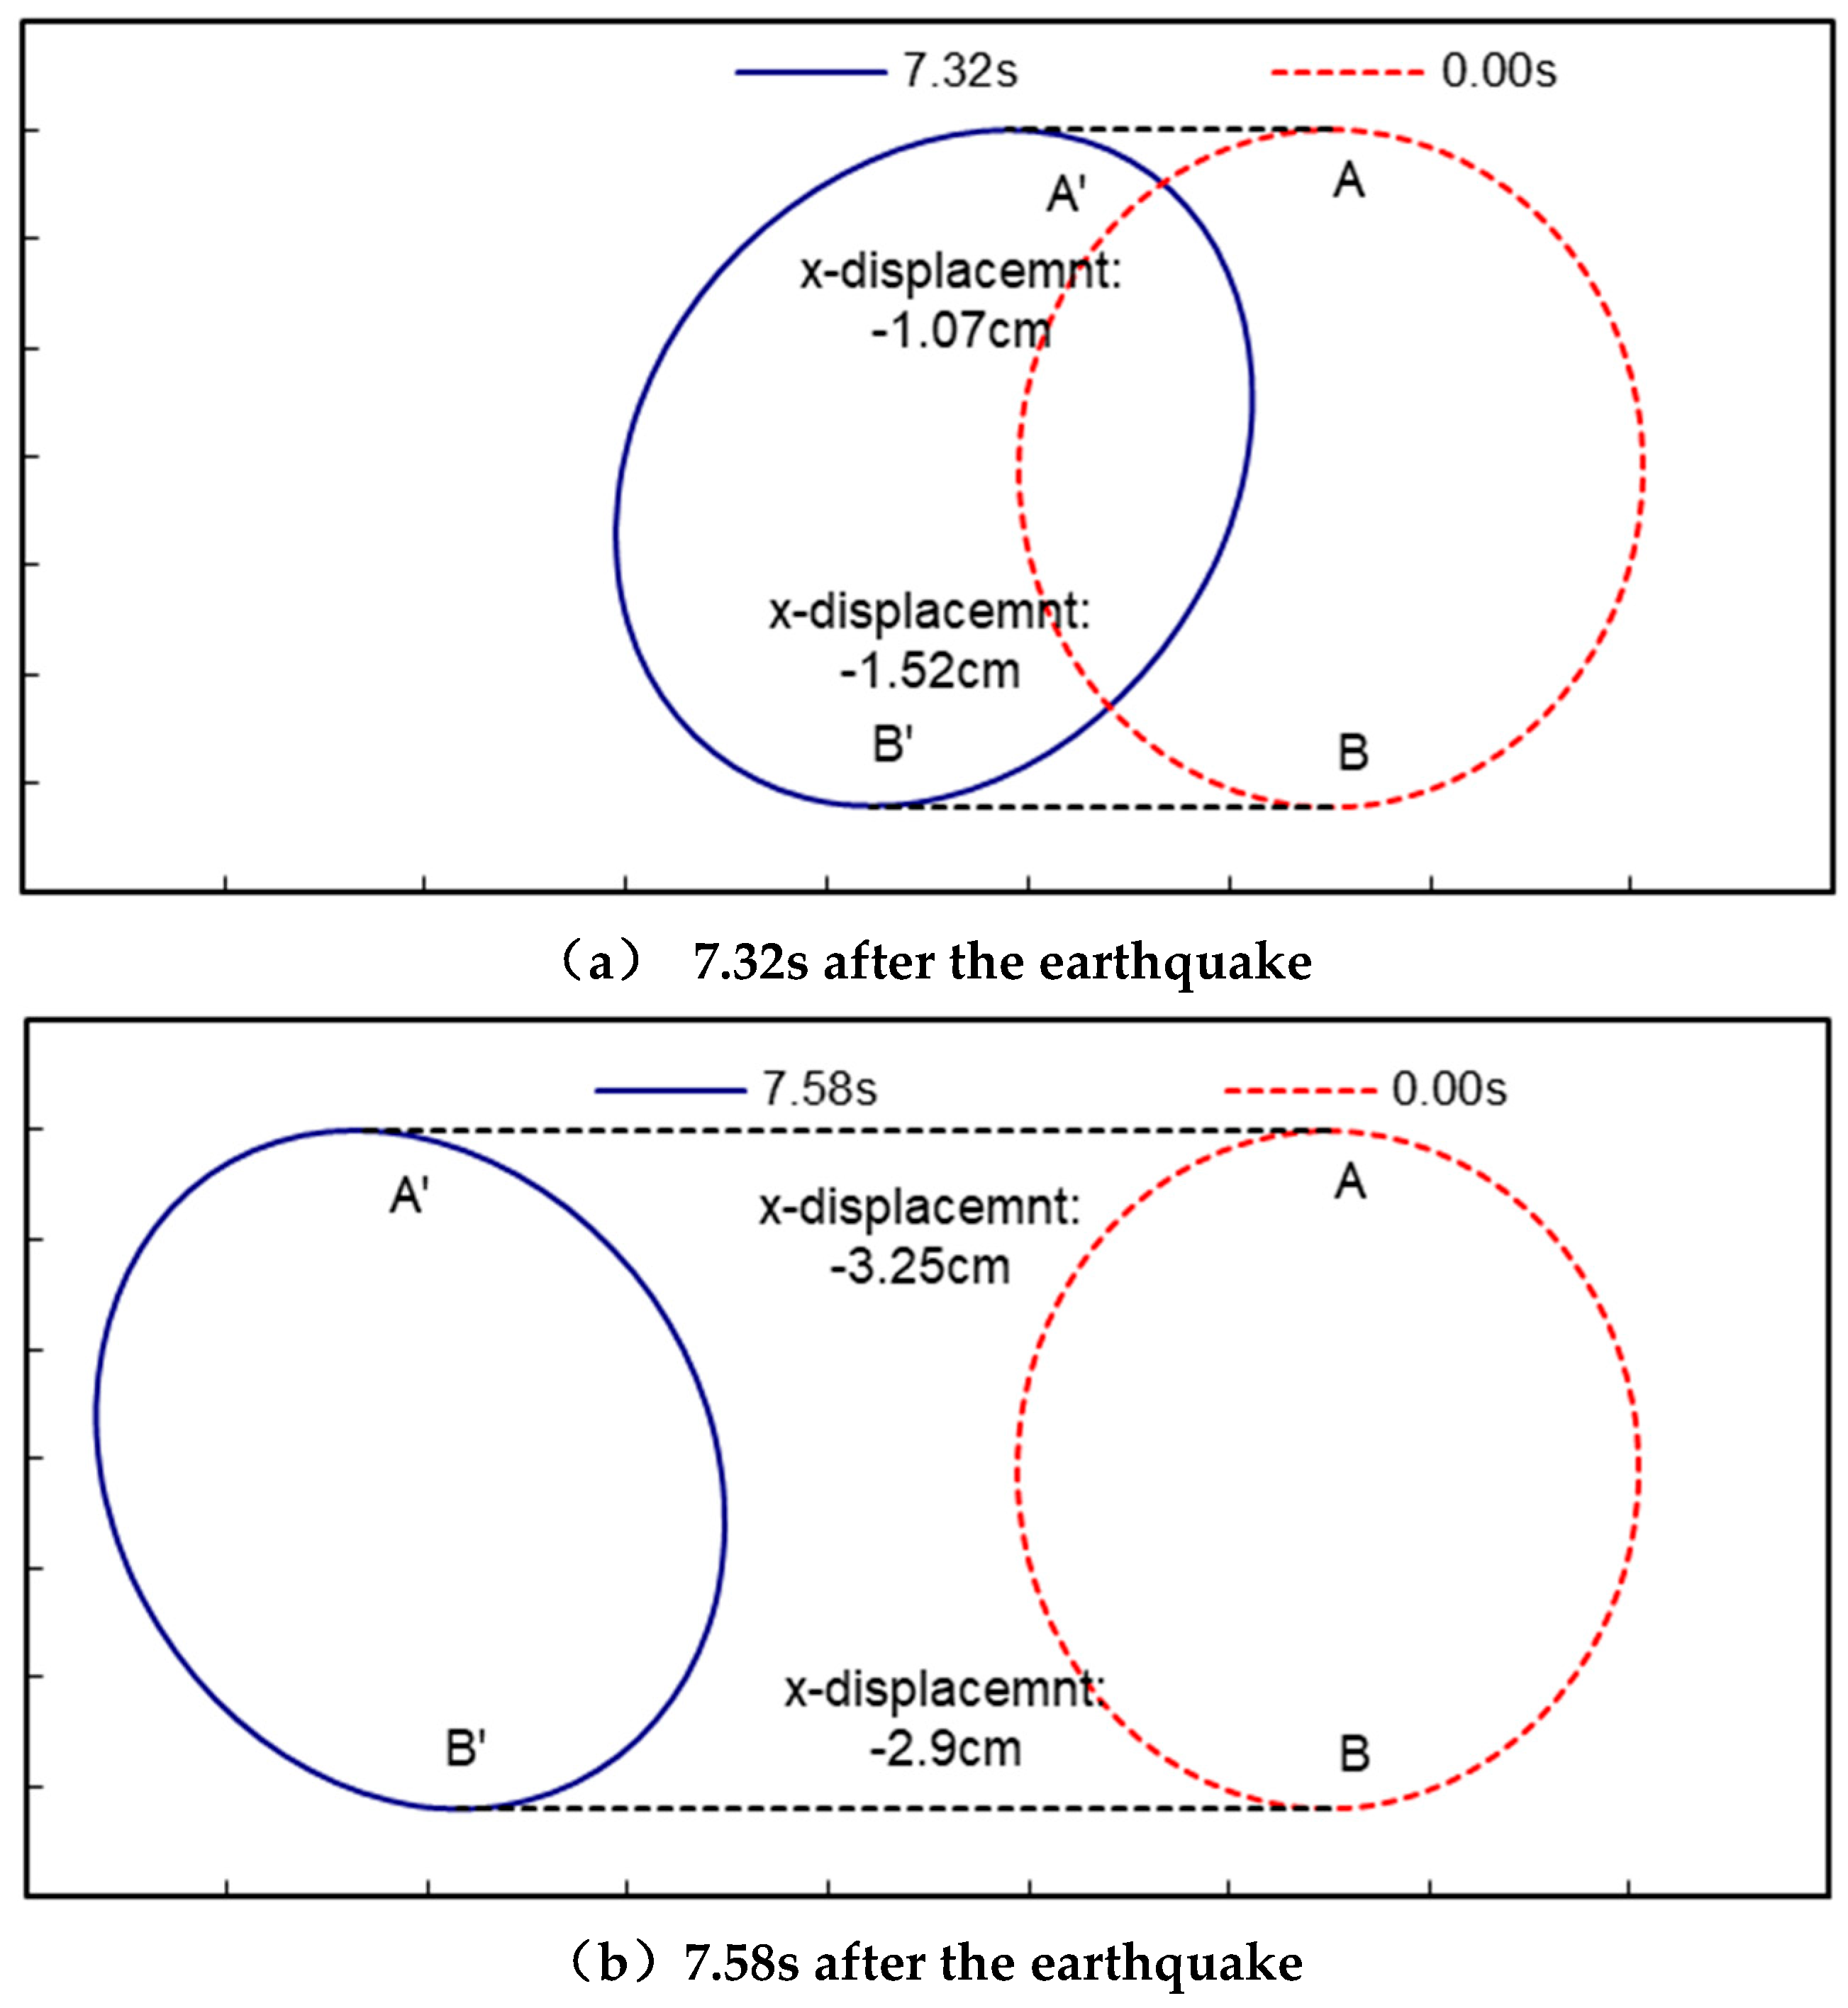
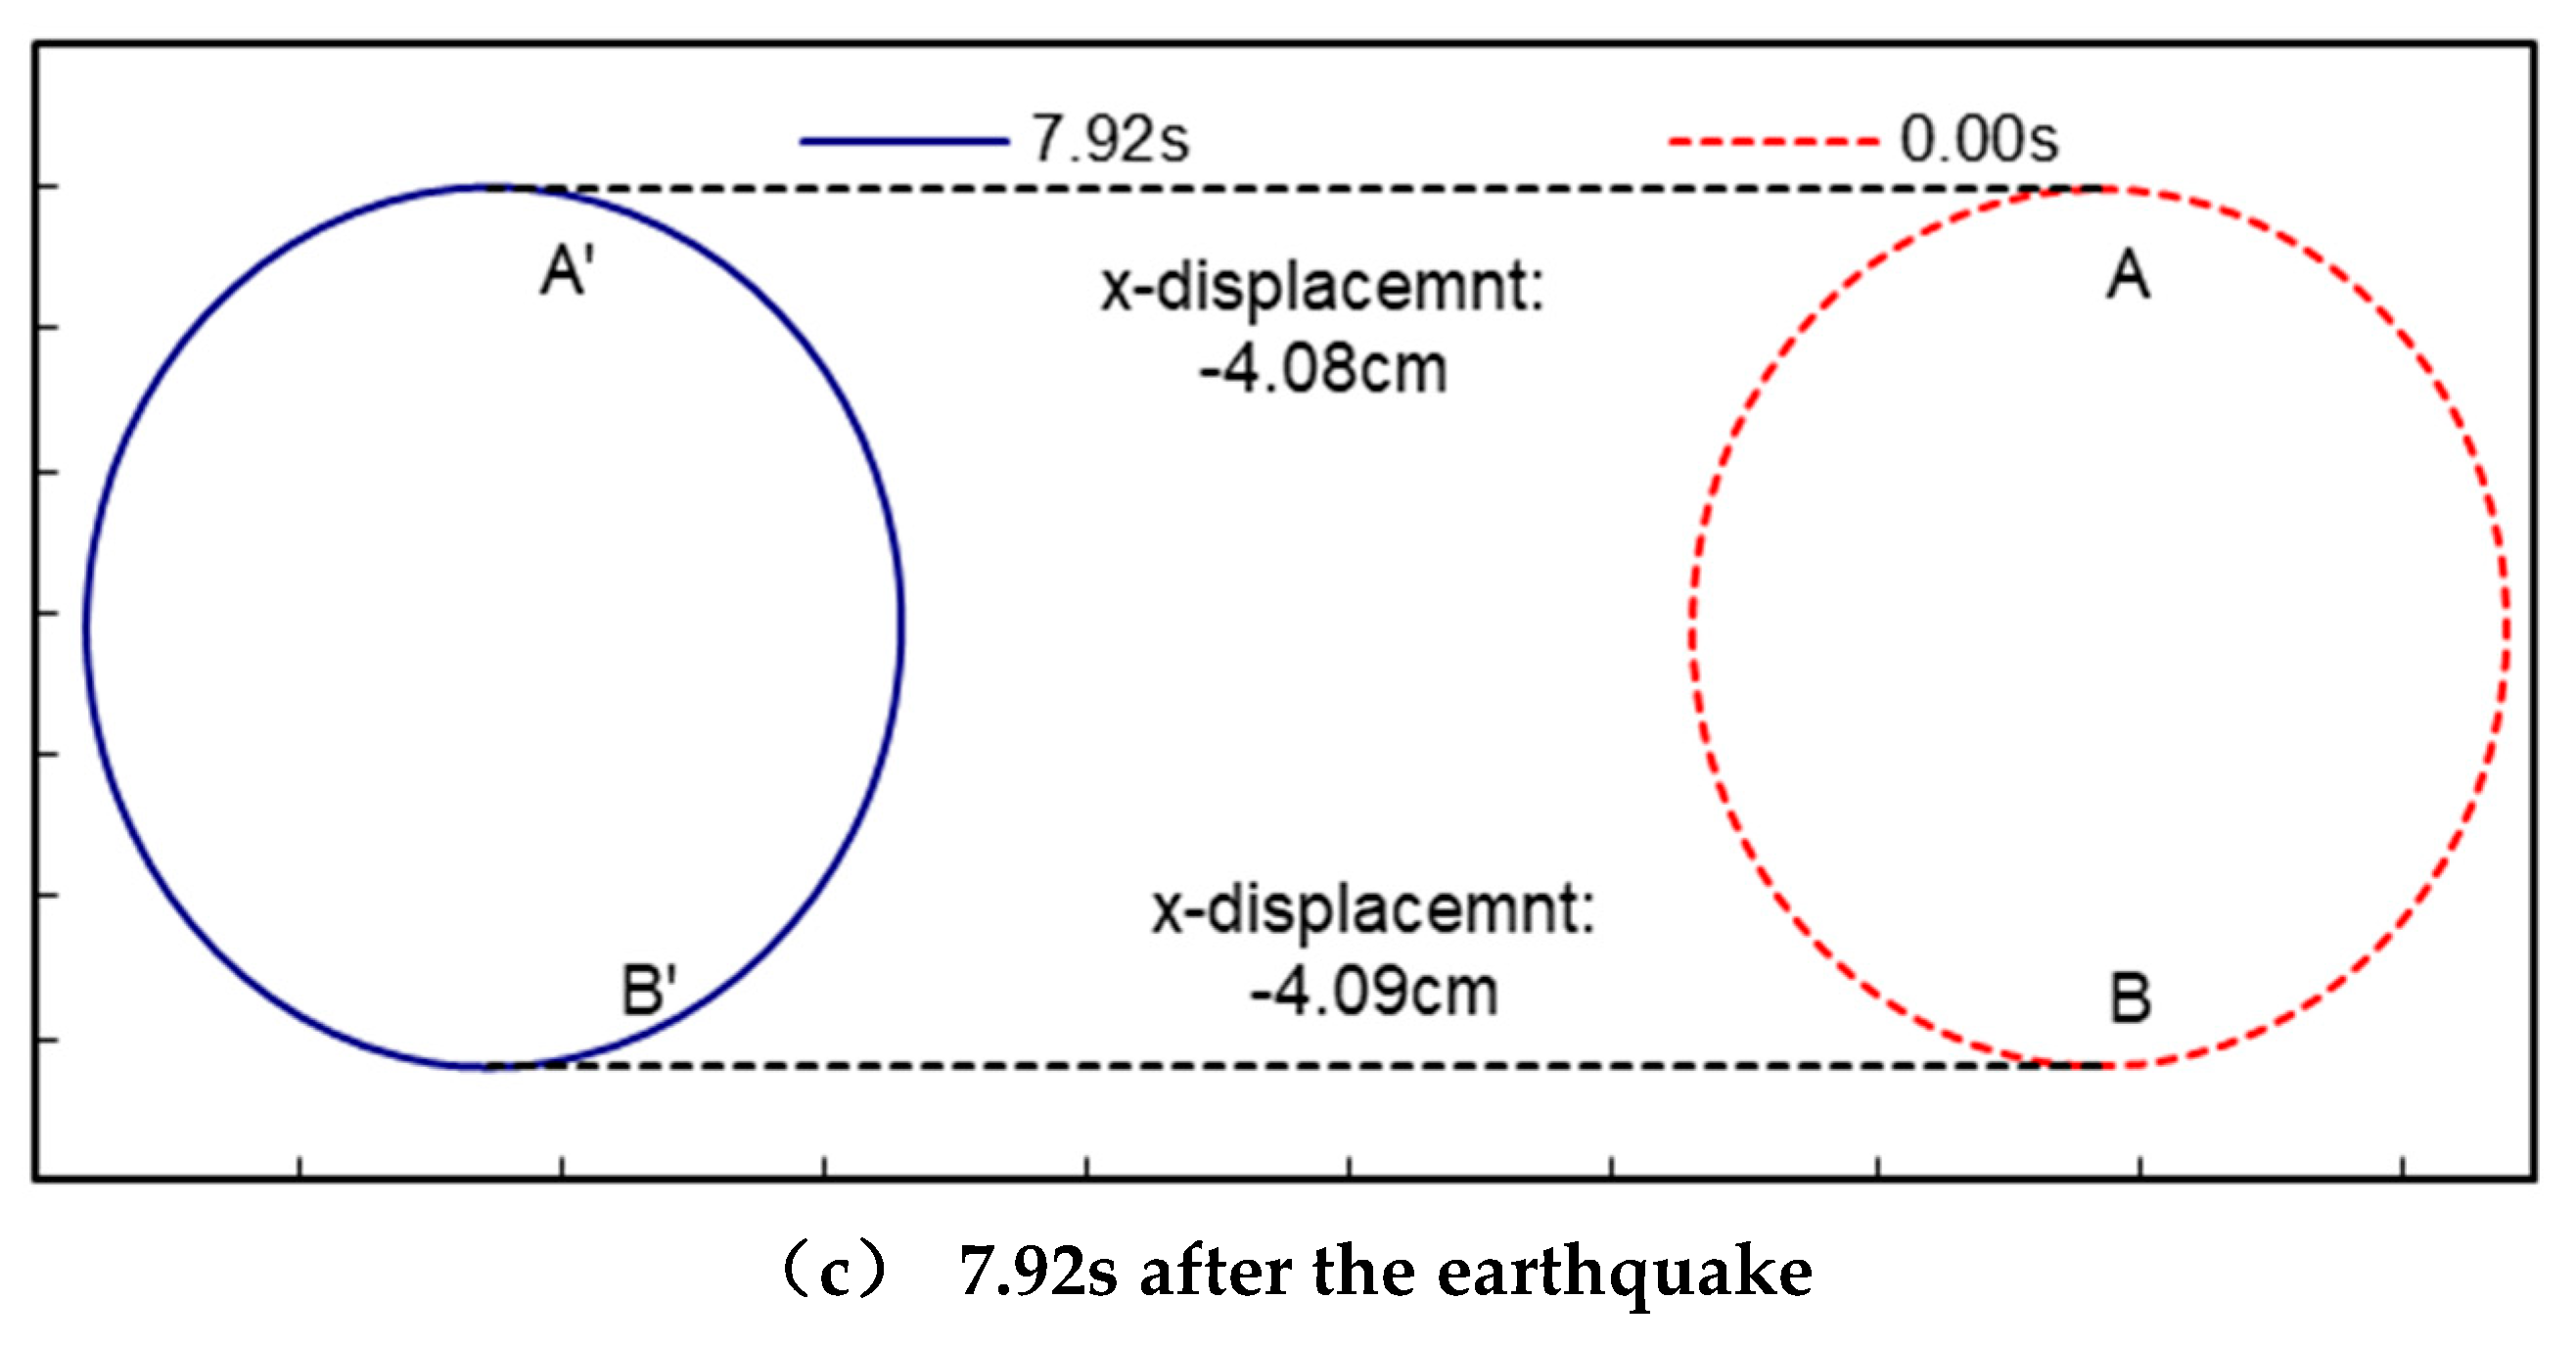
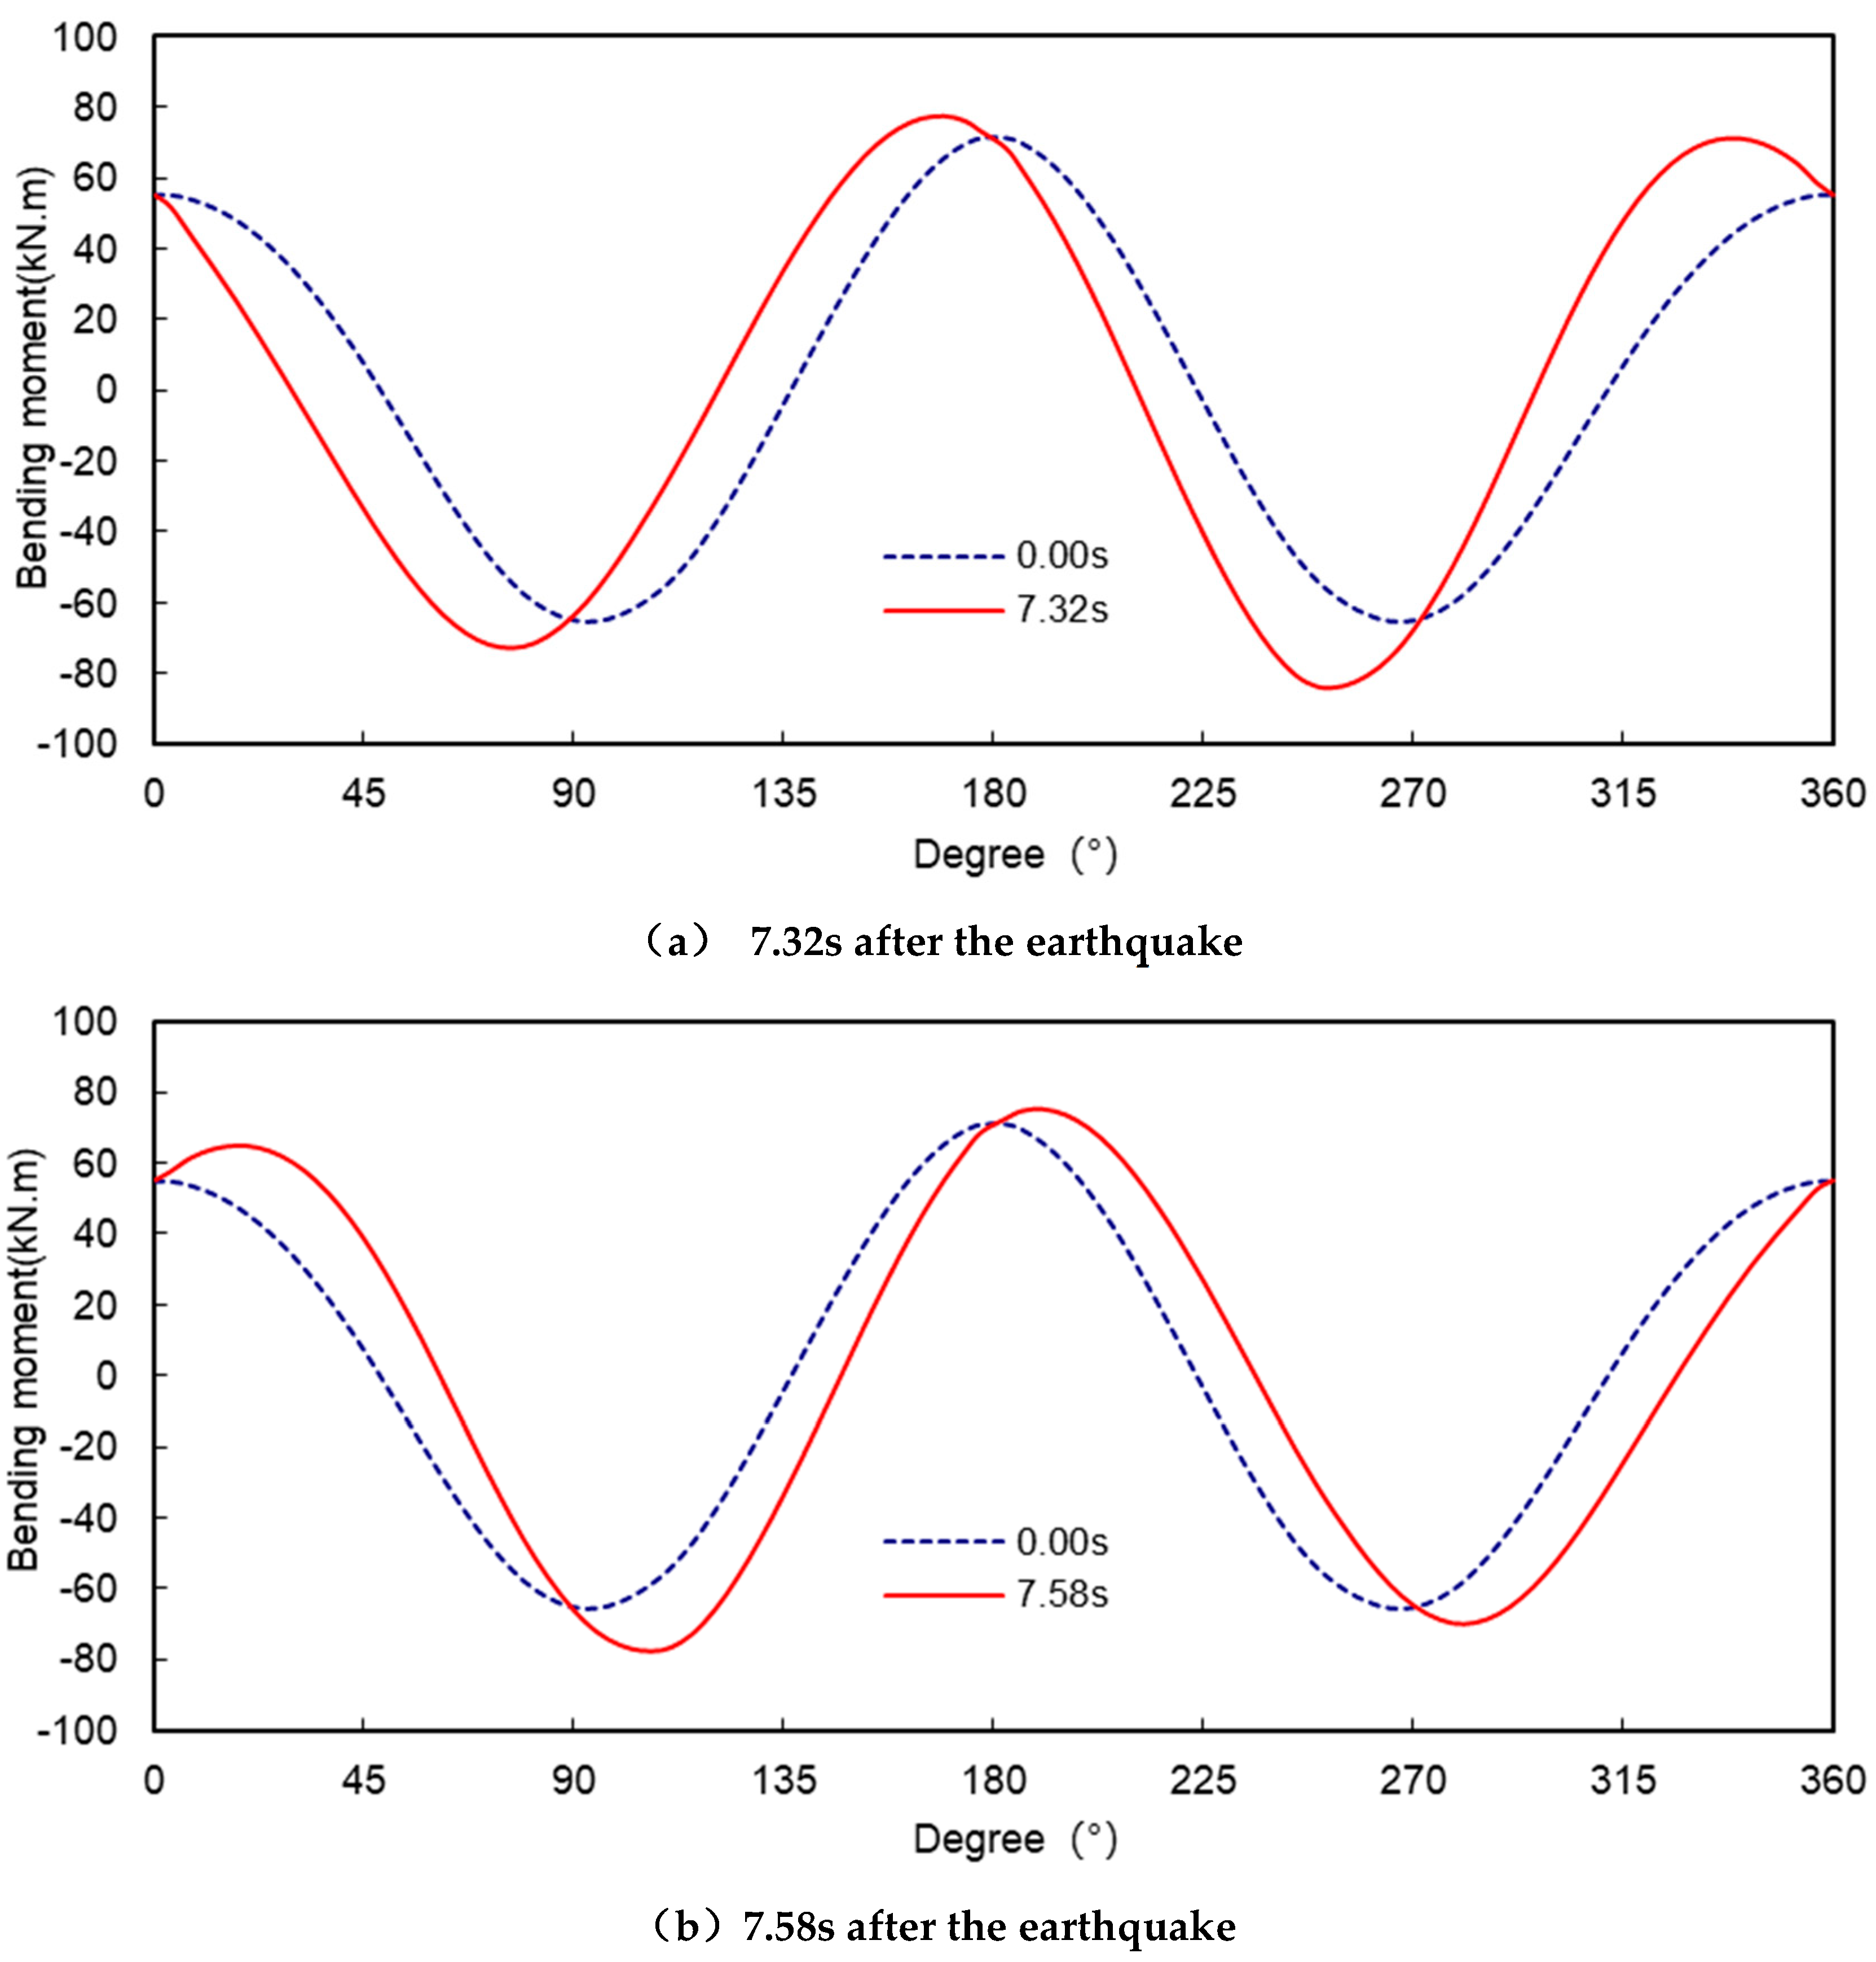
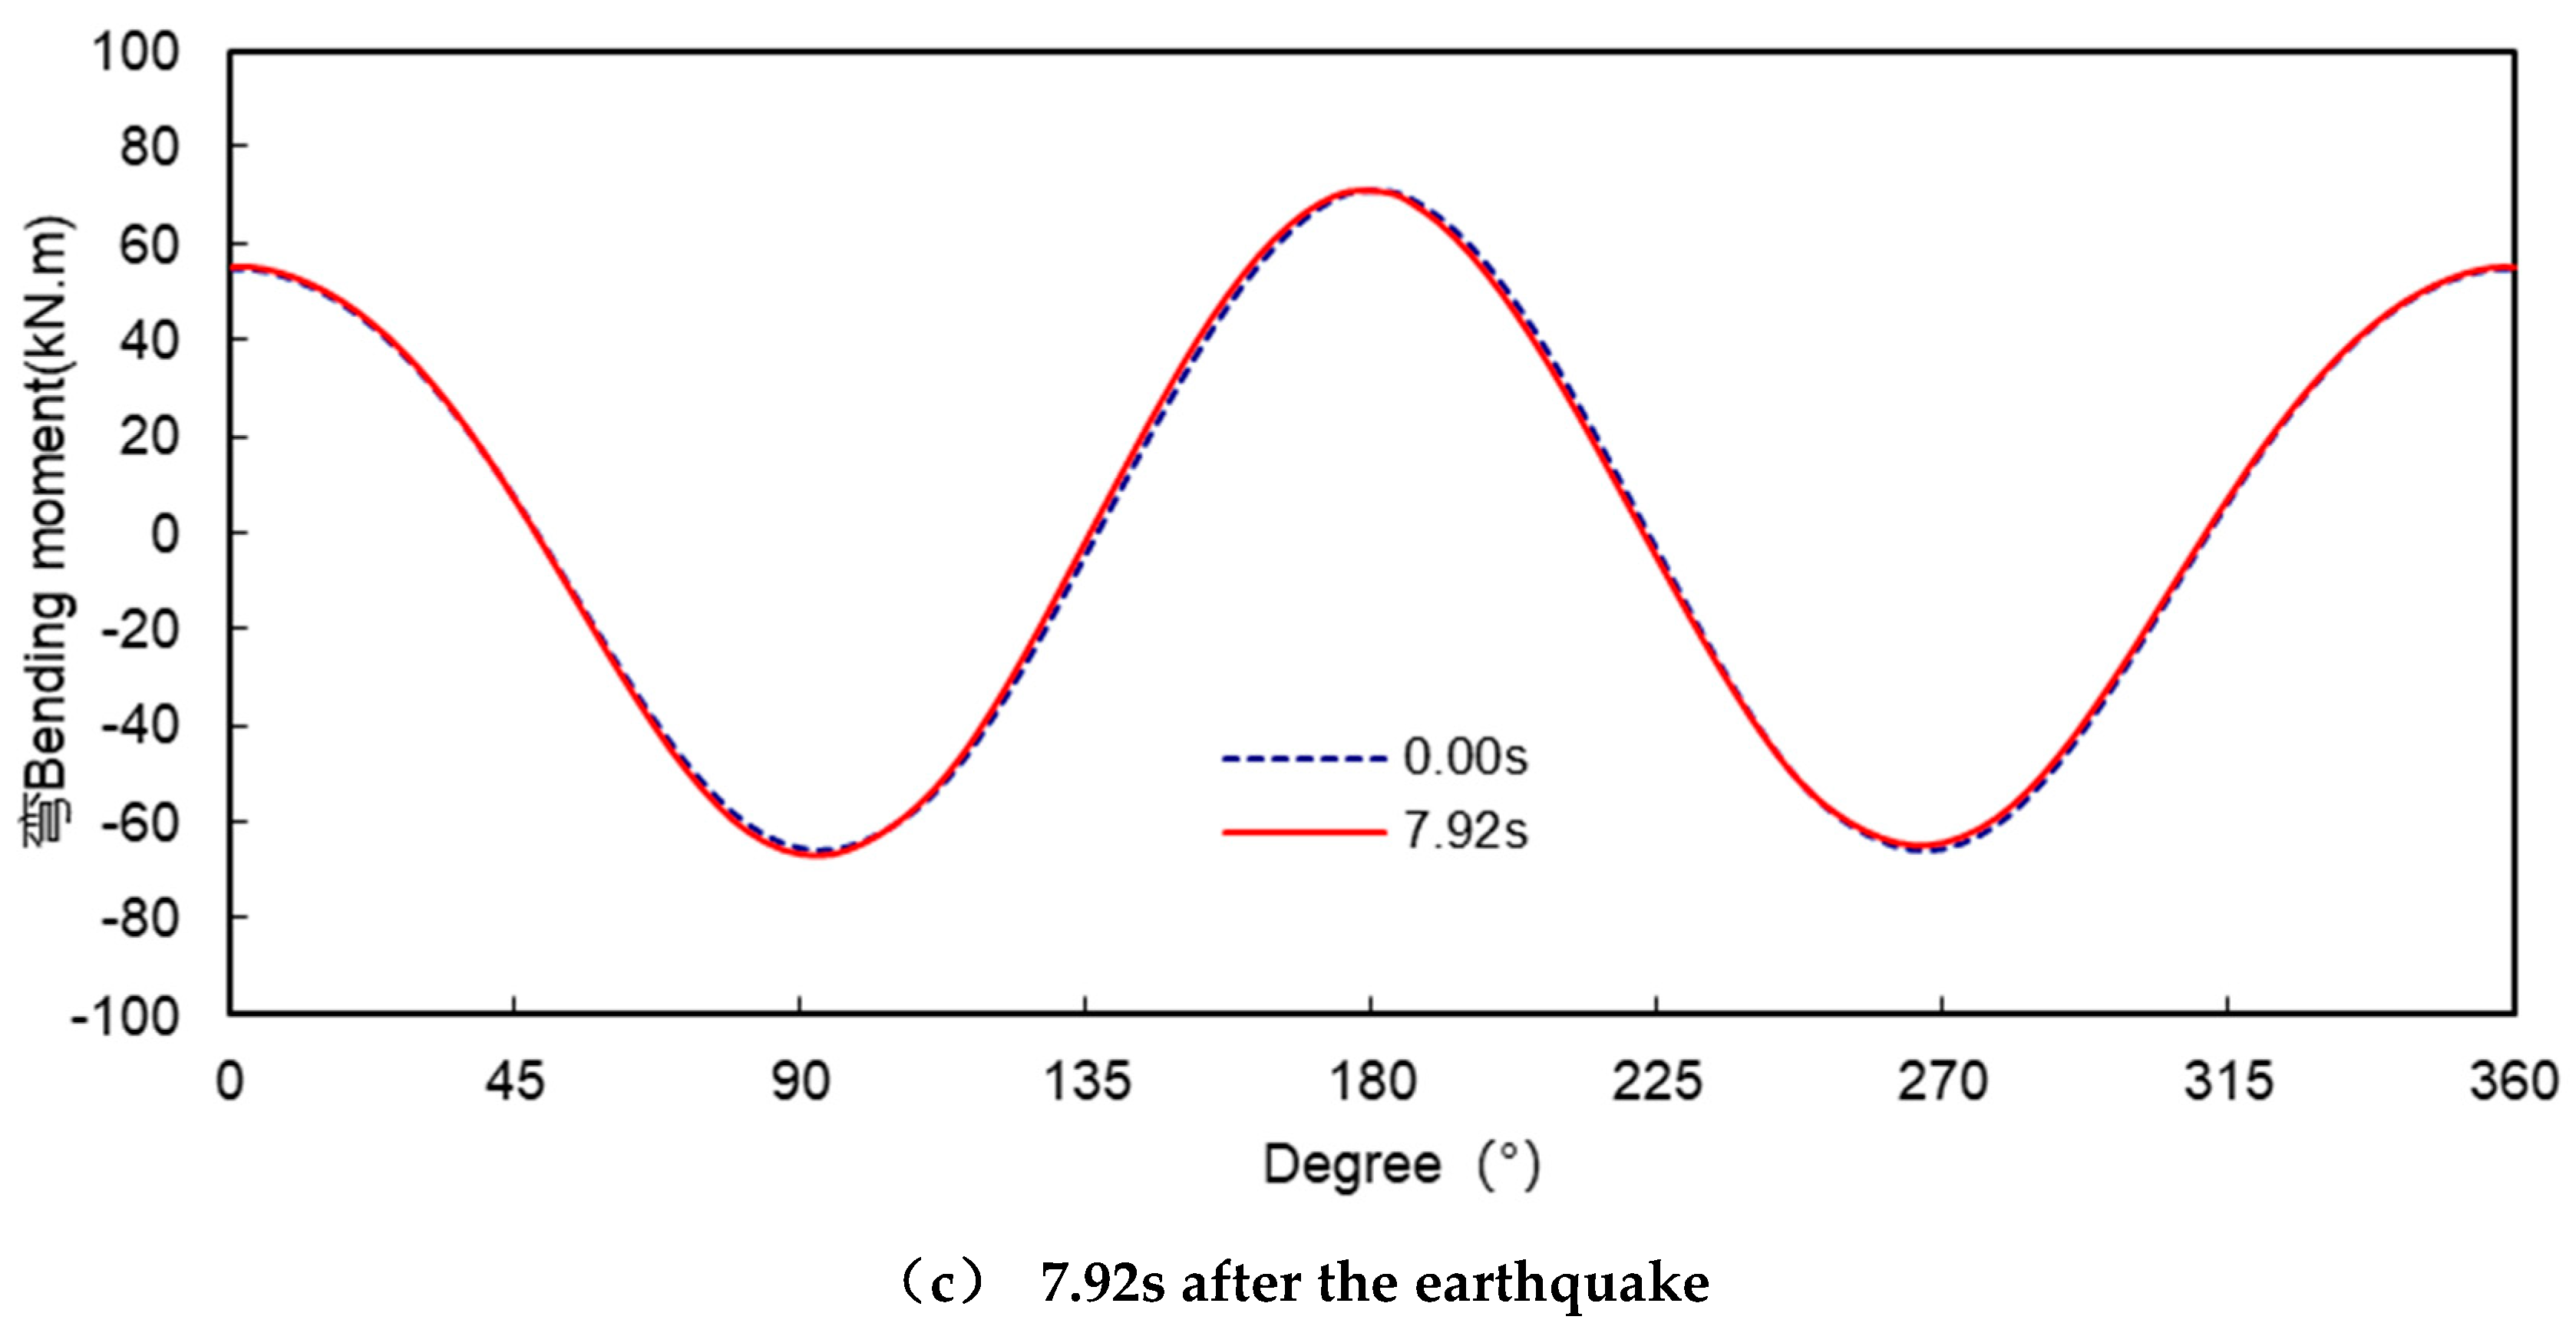
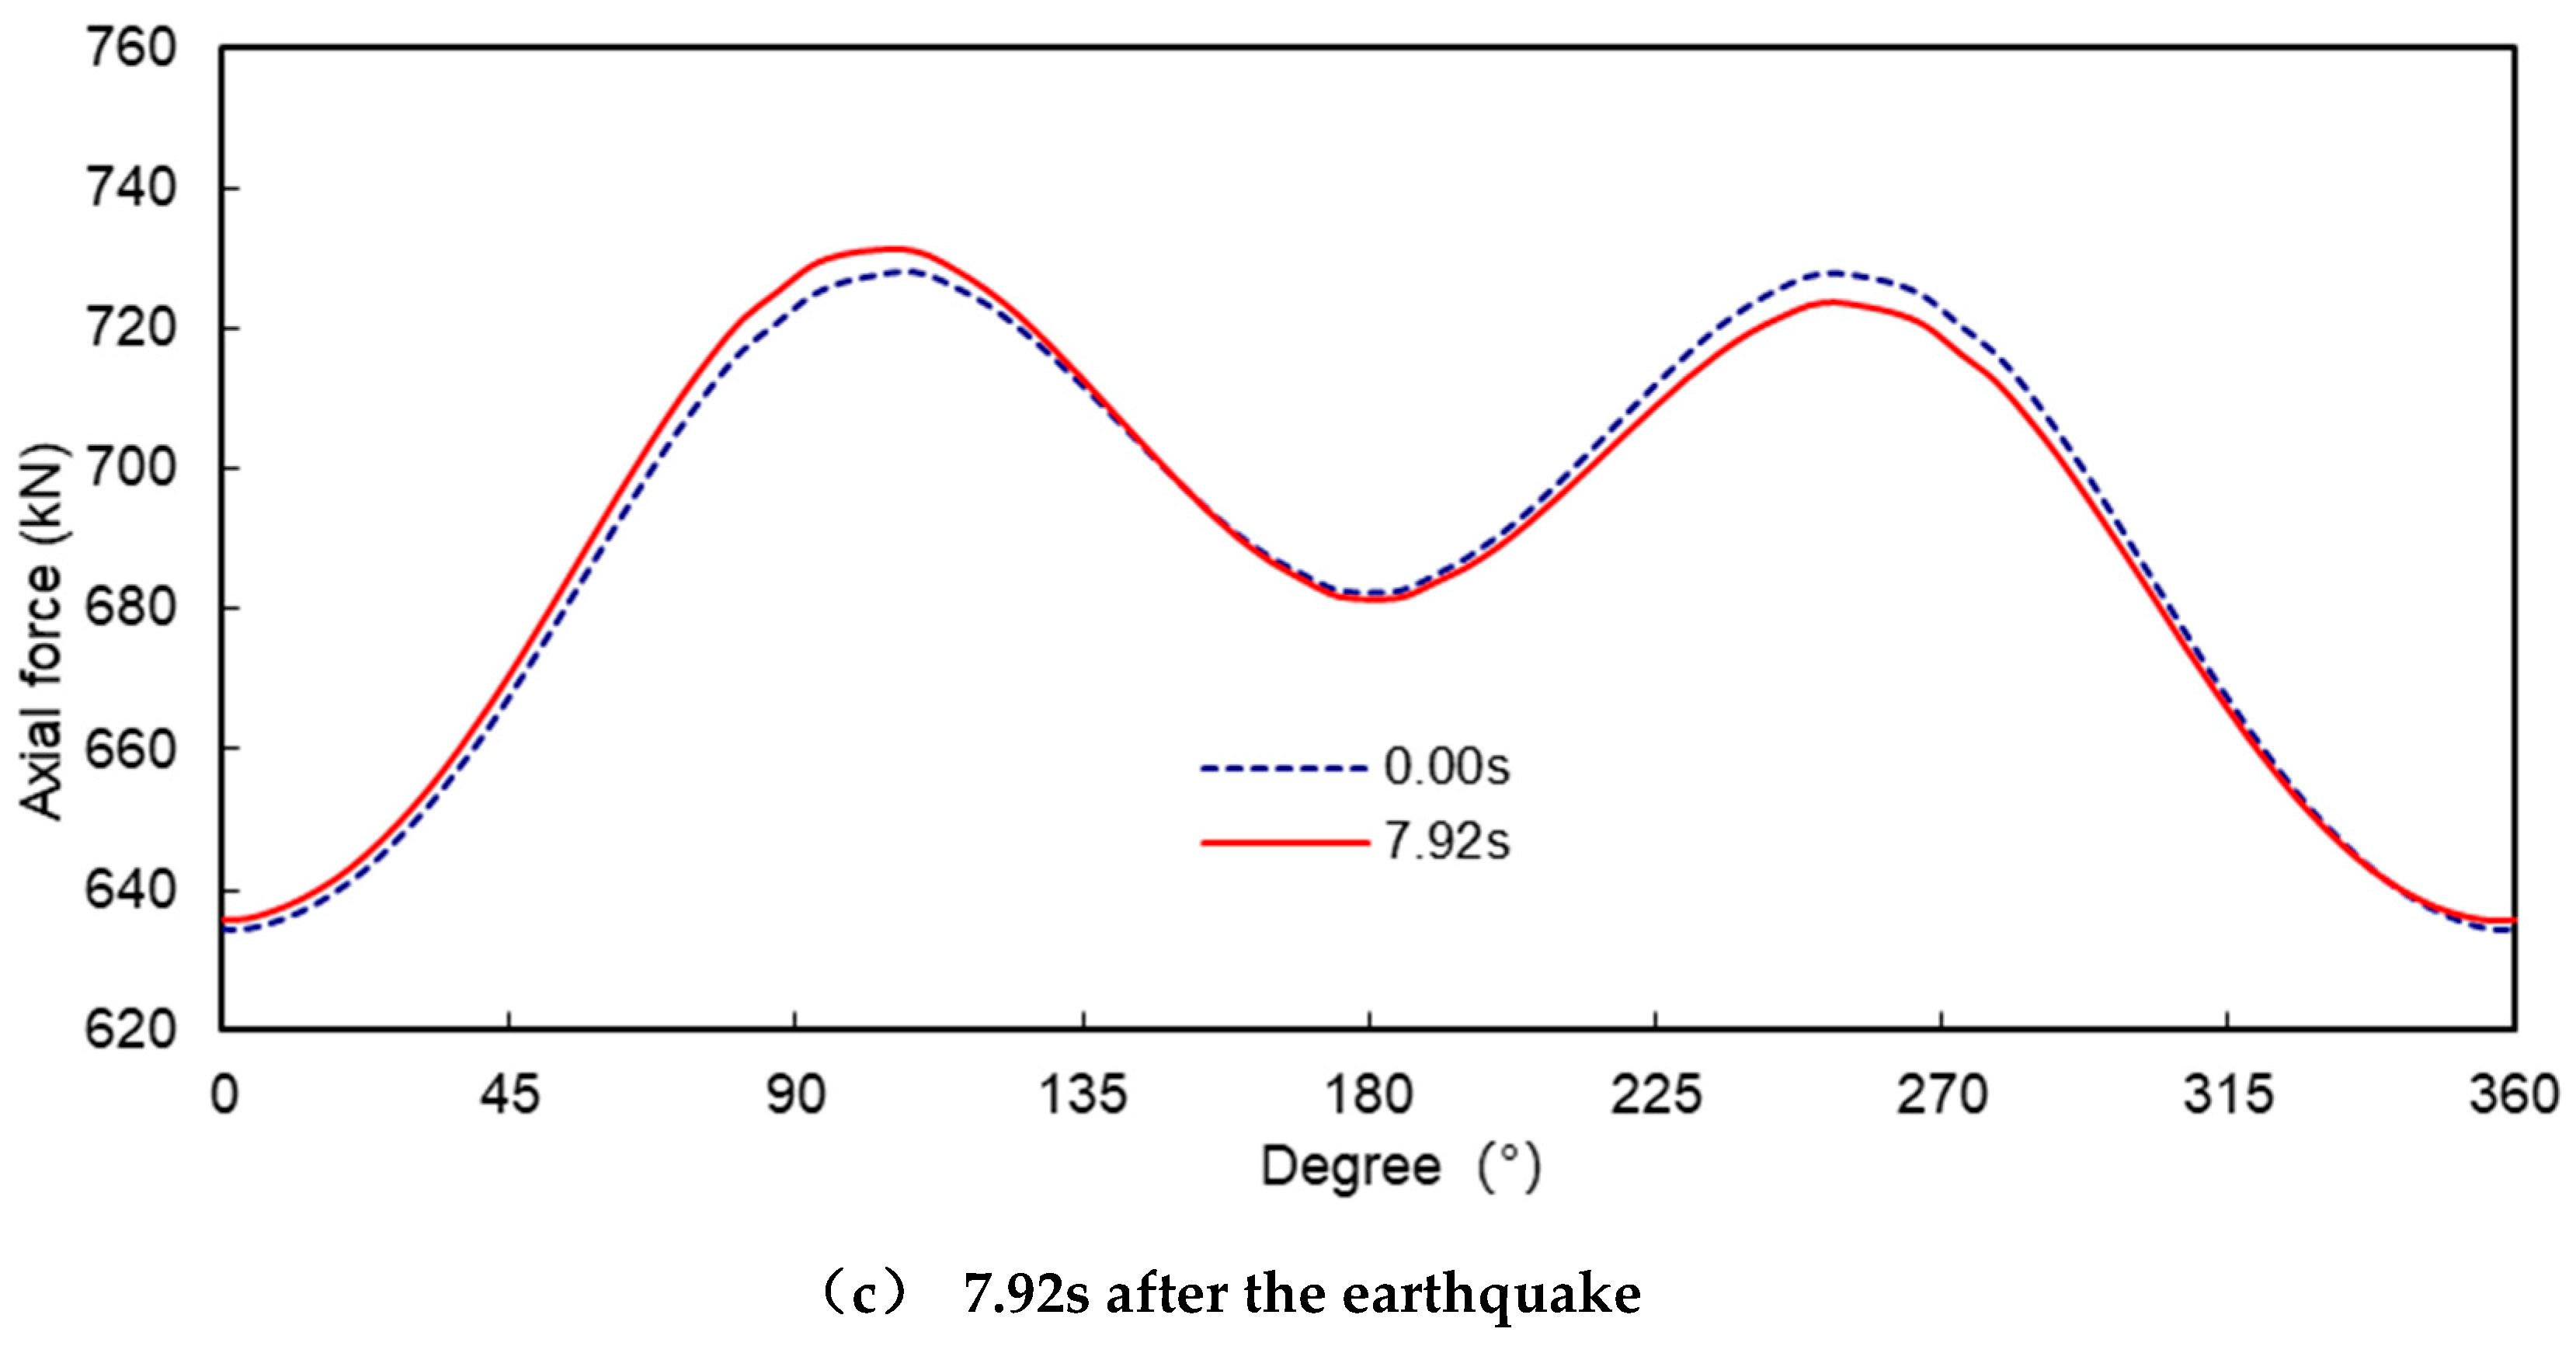
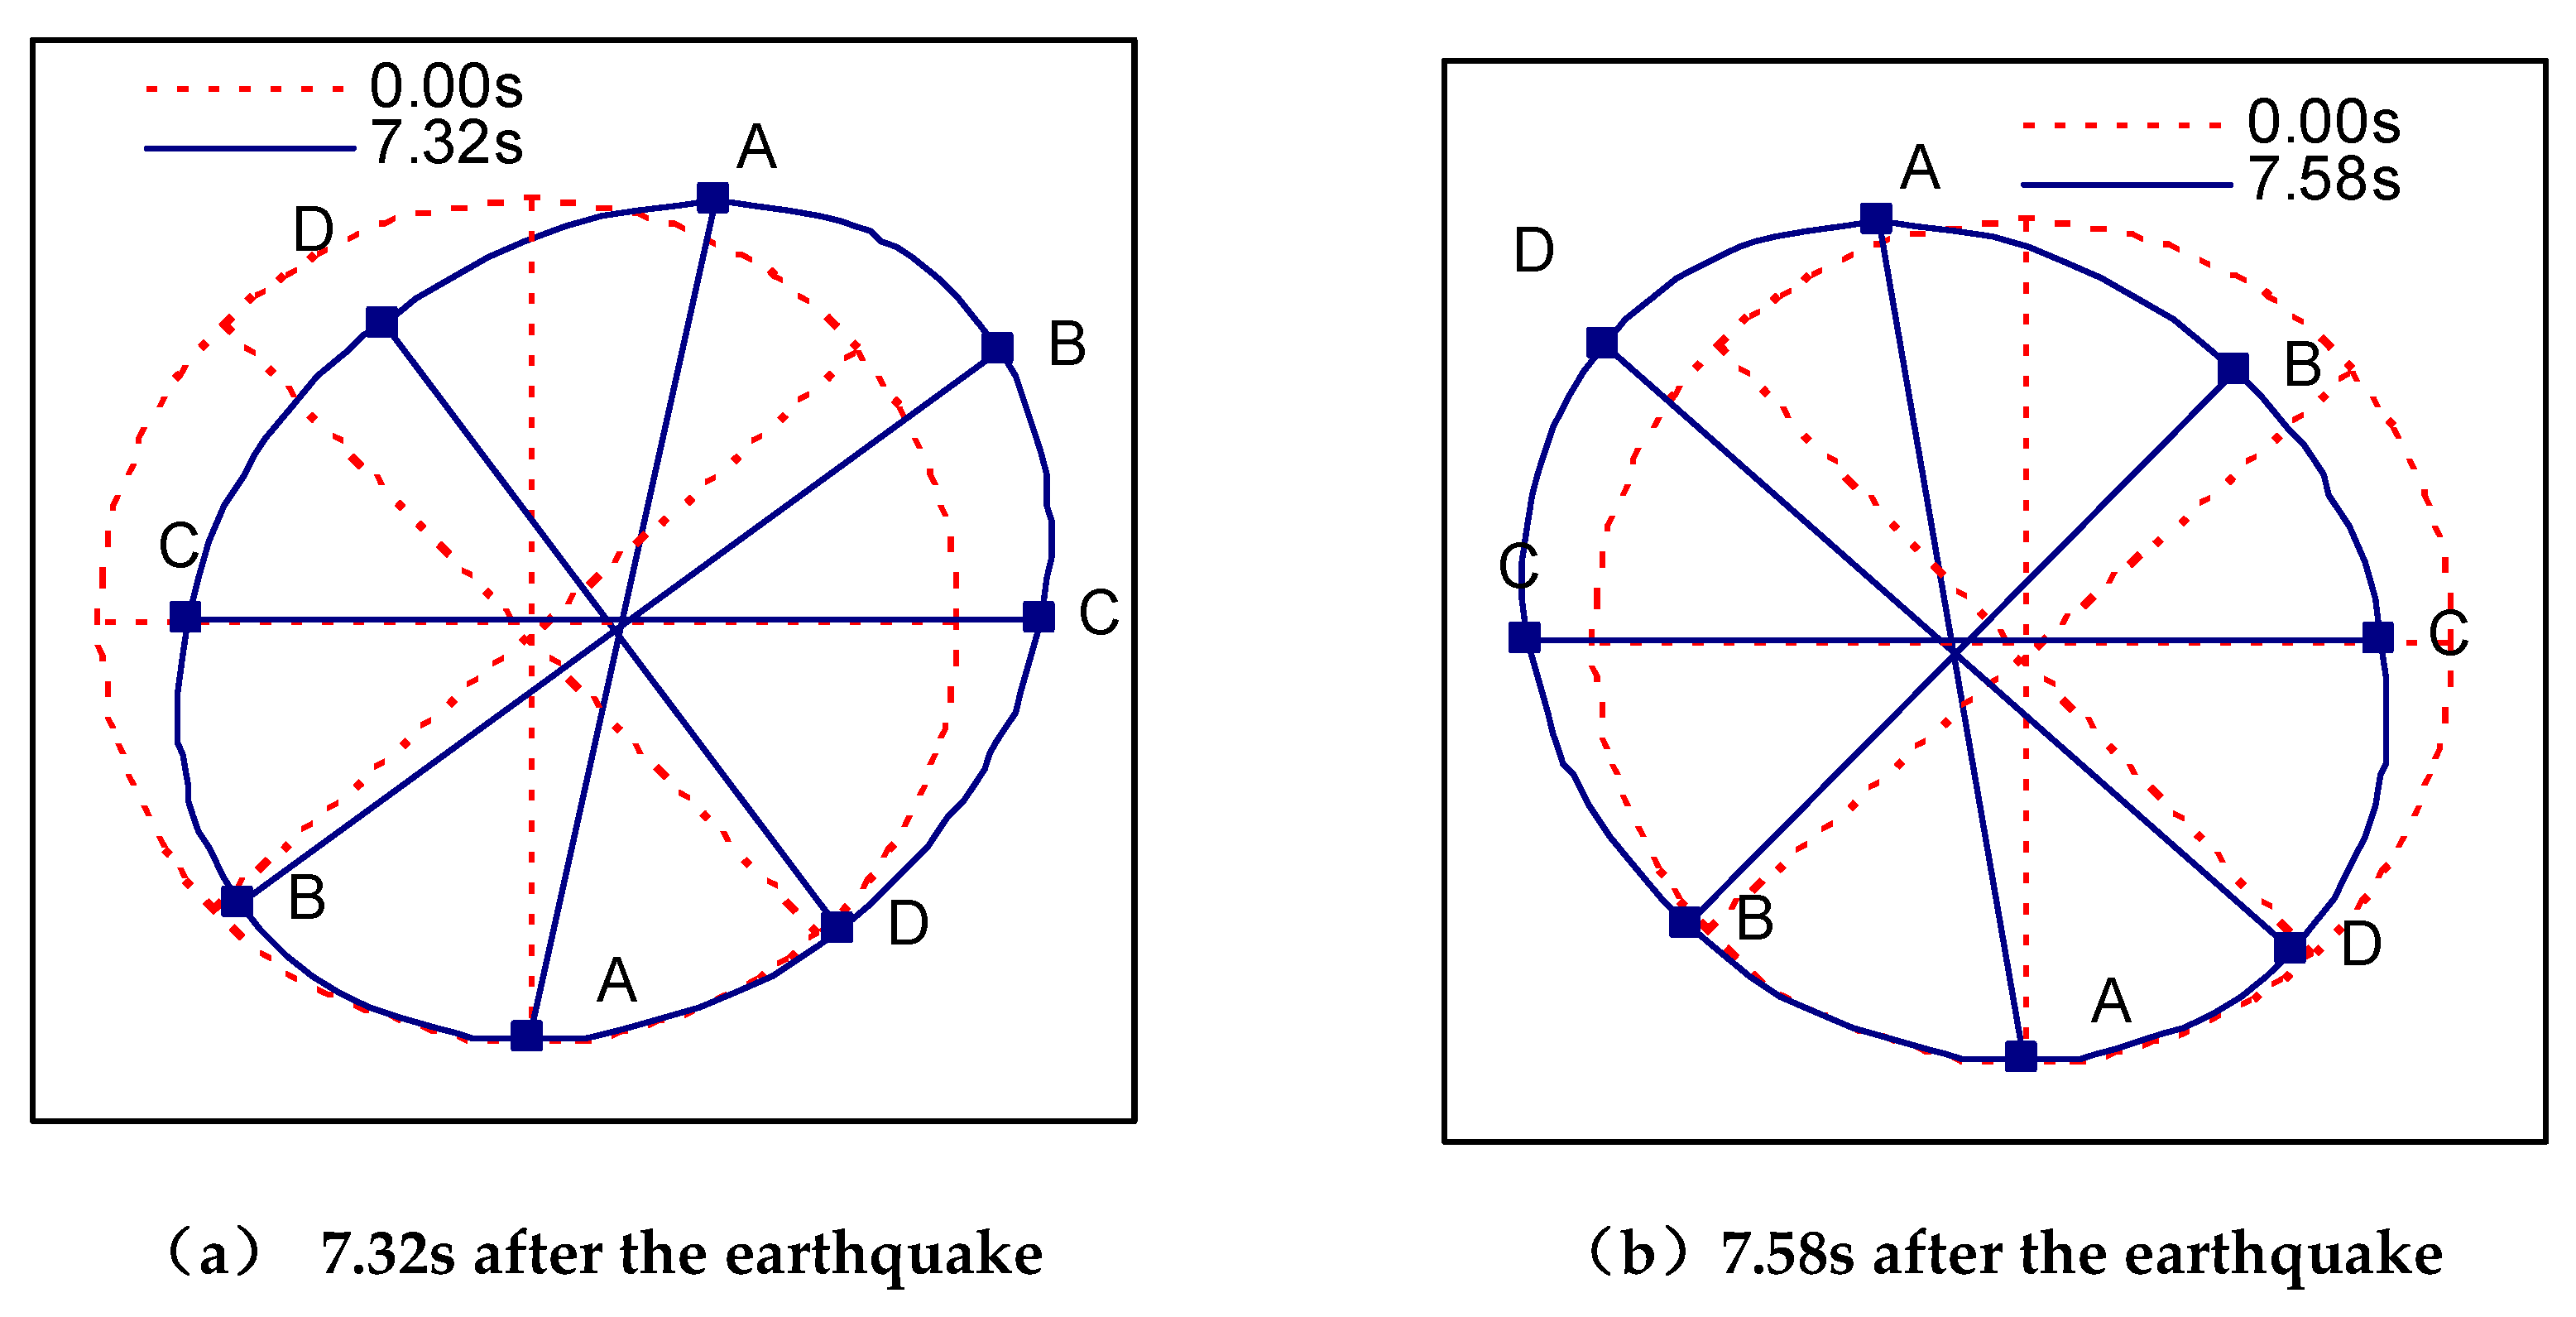
Under the action of the artificial wave, the extreme value of the internal force of the tunnel generally occurred in the vicinity of 7.32s and 7.58s after the occurrence of the earthquake. In order to further analyse the relationship between the change in the internal force of the tunnel and the displacement of the surrounding soil body under the action of the earthquake, Figure 1.11 shows the deformation of the tunnel under the action of the soil body after the earthquakes occurred at 7.32s, 7.58s and 7.92s, and the dashed circle indicates the initial state of the tunnel when the earthquake did not occur, i.e. 0.00s. The dashed circle indicates the initial state of the tunnel when the earthquake did not occur, i.e. 0.00s, and the solid line indicates the state of the tunnel after the earthquake. To make the deformation of the tunnel more visible, the displacements in the figure have been magnified by a factor of 300. Figures 1.12 and 1.13 show the changes in bending moment and axial force of the tunnel after 7.32s, 7.58s and 7.92s respectively.
As shown in
Figure 11, after the 7.32s earthquake, the x-direction displacement of the tunnel vault at point A was -1.07cm, and the x-direction displacement of the vault floor at point B was -1.52cm; after the 7. 58s, the x-direction displacements of the vault and the arch bottom were -3.25cm and -2.9cm, respectively; after the earthquake occurred 7.92s, the x-direction displacements of the vault and the arch bottom reached -4.08cm and -4.09cm, respectively. Comparing with
Figure 12 and
Figure 13, it can be seen that when the earthquake occurred at 7.32s, the total displacement of the tunnel was relatively small, but the relative displacements of each part of the tunnel were larger, the shape change was large, and the corresponding bending moment and axial force were large, while the total displacement of the tunnel was larger, but the relative displacements of each part were small, the shape change was small, and the corresponding bending moment and axial force were large. After 7.92s, the total displacement of the tunnel is larger, but the relative displacement of each part is smaller, the shape change is small, and the corresponding bending moment and axial force change are small, which indicates that the total displacement of the tunnel caused by the earthquake does not bring a large additional internal force to the tunnel, and the main reason for the change in the internal force of the tunnel is the relative displacement of each part of the tunnel.
If the bottom of the tunnel is taken as an immobile point, the displacement of other points in the tunnel relative to the bottom of the tunnel can be obtained. Figure 1.14 shows the relative displacement of the tunnel after the earthquake at 7.32 s and 7.58 s. Similarly, the dashed circle shows the initial state of the tunnel without the earthquake and the solid line shows the state of the tunnel after the earthquake, and the displacements in the figure have been magnified by a factor of 300. The lines AA, BB, CC and DD in Figure 1.14 are the diameters between 0° and 180°, 45° and 225°, 90° and 270°, and 135° and 315°, in that order. Combined with Figures 1.12 and 1.13, it can be seen that when the tunnel vault undergoes a positive x-displacement with respect to the bottom of the tunnel, the bending moments in the ranges 0° to 90° and 180° to 270° decrease while the axial forces increase, and the bending moments in the ranges 90° to 180° and 270° to 360° increase while the axial forces decrease. When the negative x-displacement of the tunnel vault occurs relative to the bottom of the tunnel, the change rule of bending moment and axial force is just the opposite, the bending moment increases and the axial force decreases in the range of 0° to 90° and 180° to 270°, and the bending moment decreases and the axial force increases in the range of 90° to 180° and 270° to 360°. These rules of change are to the tunnel diameter AA and diameter CC as the dividing line and change, indicating that there is a certain relationship between the change in the internal force of the tunnel and the change in the tunnel diameter.
In order to measure the magnitude of the deformation of the tunnel, the rate of change of the tunnel diameter can be used as a benchmark, which is defined in equation (1).
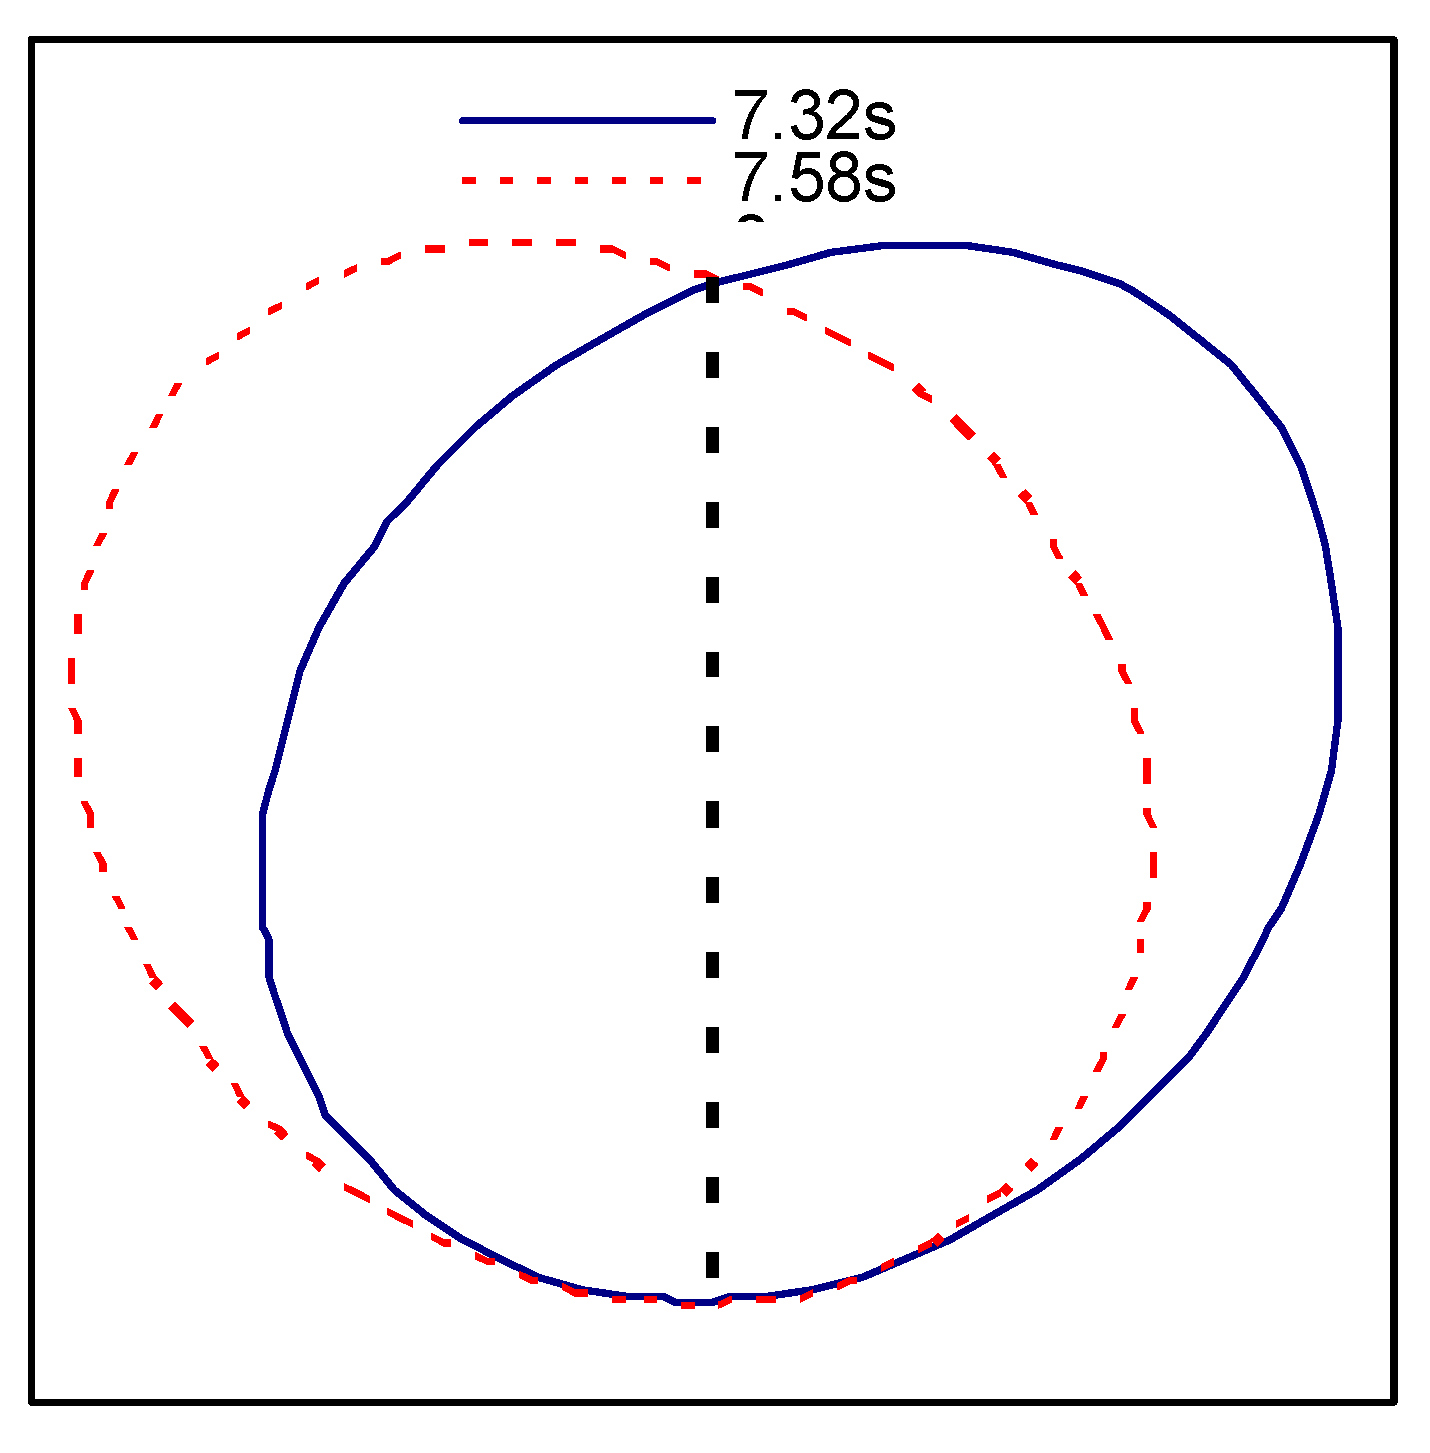
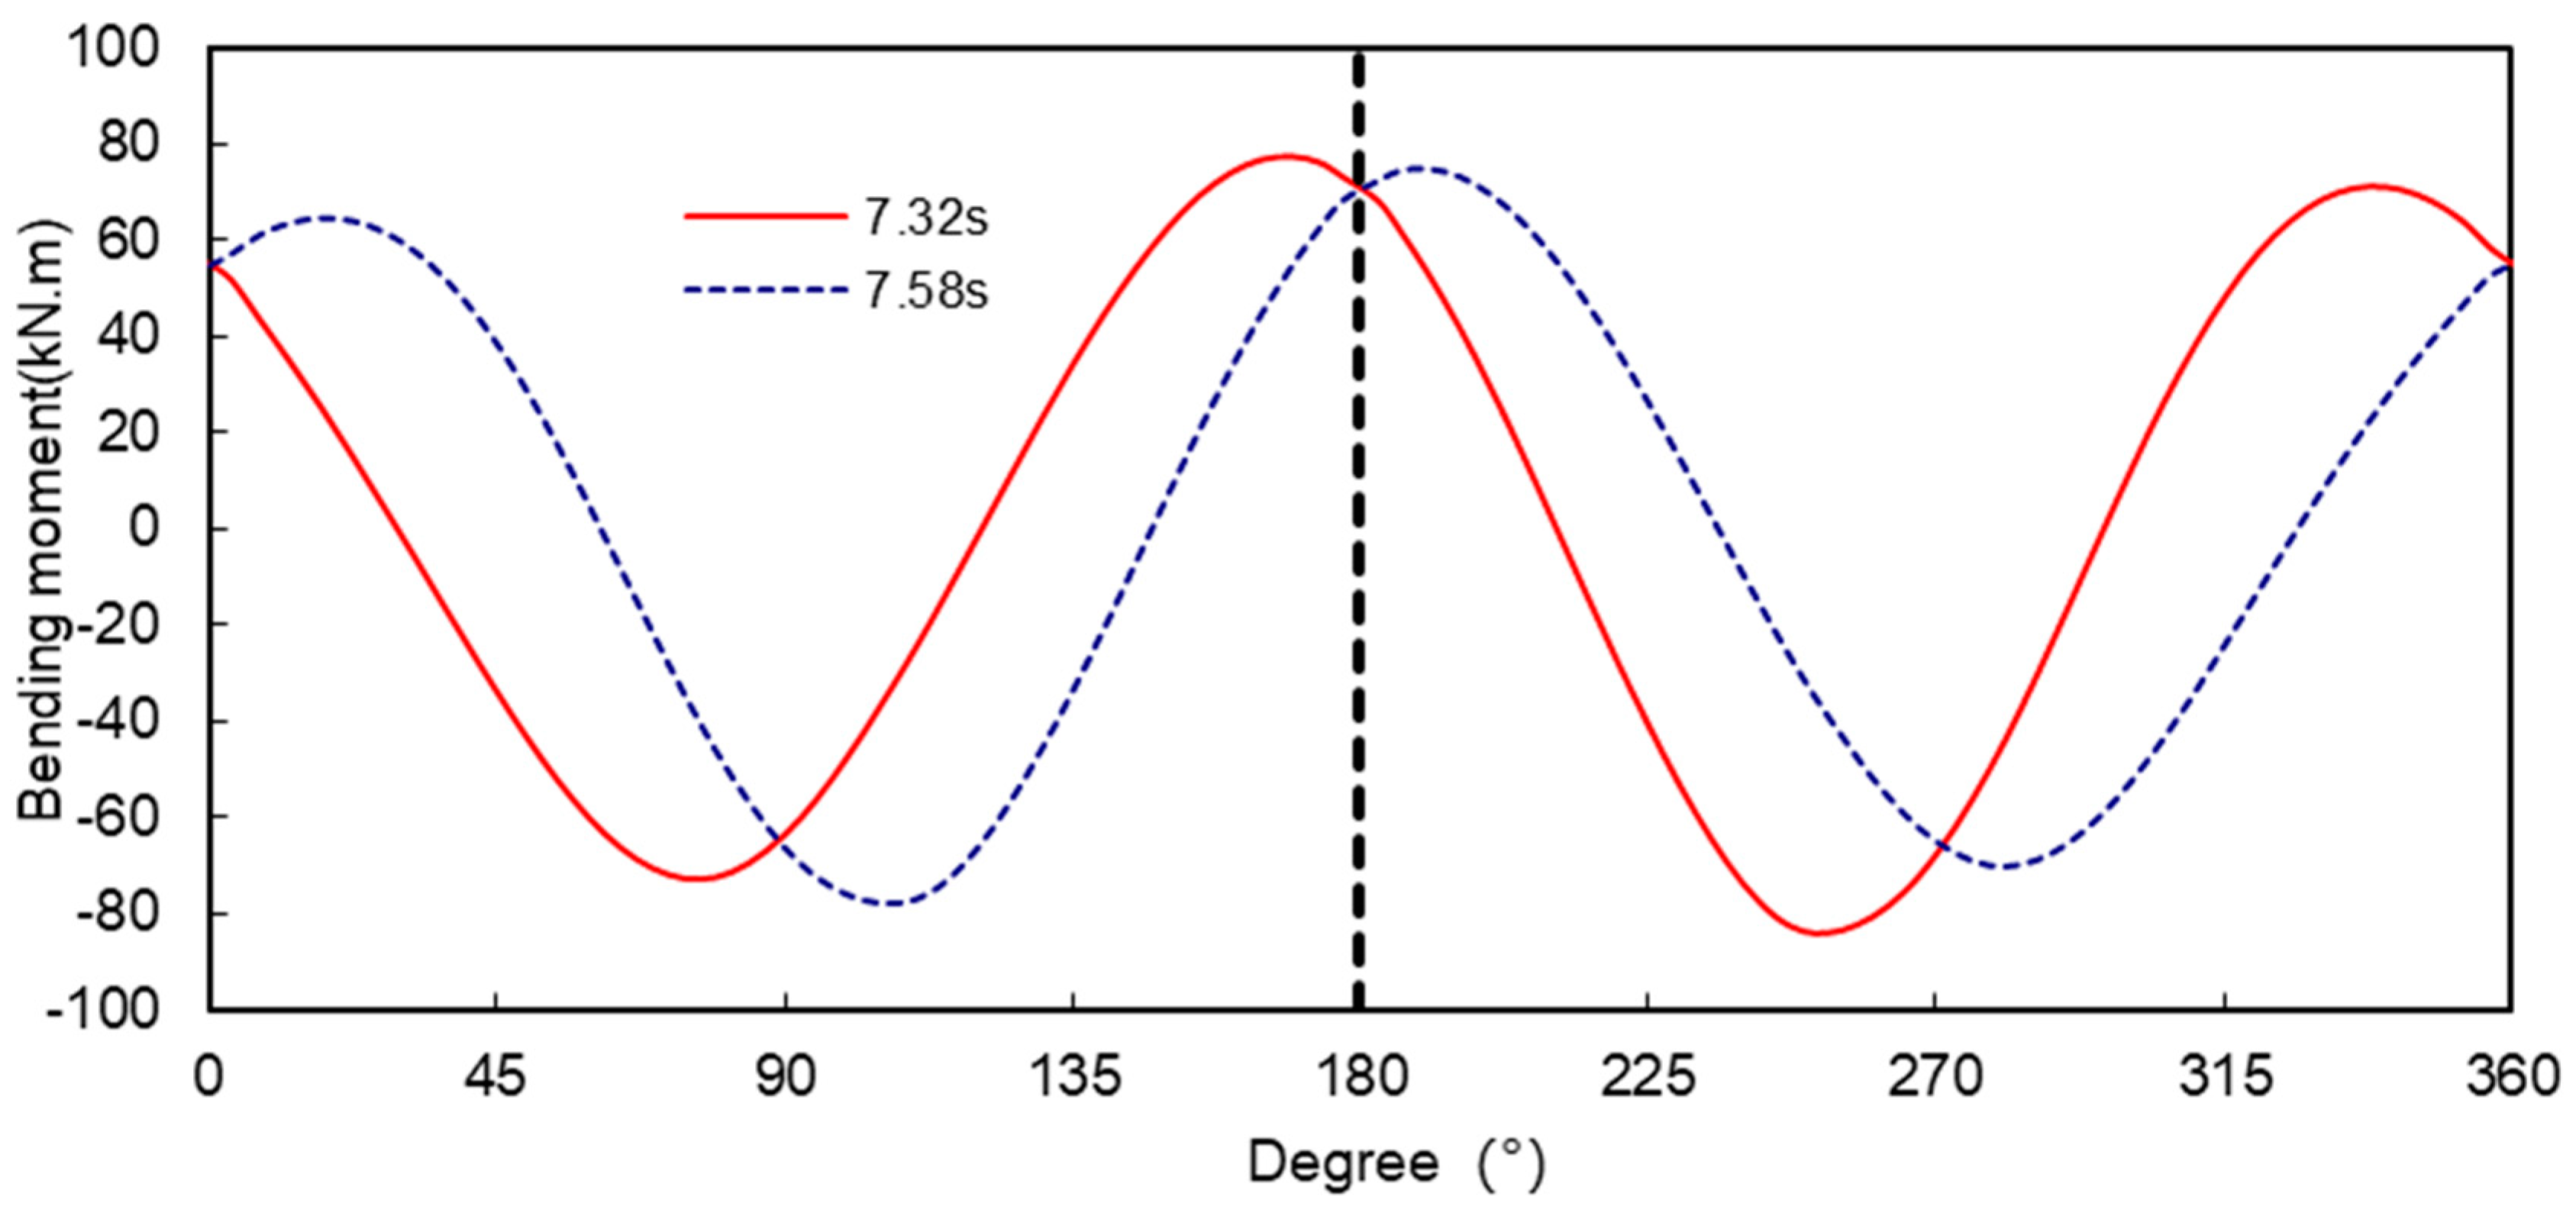
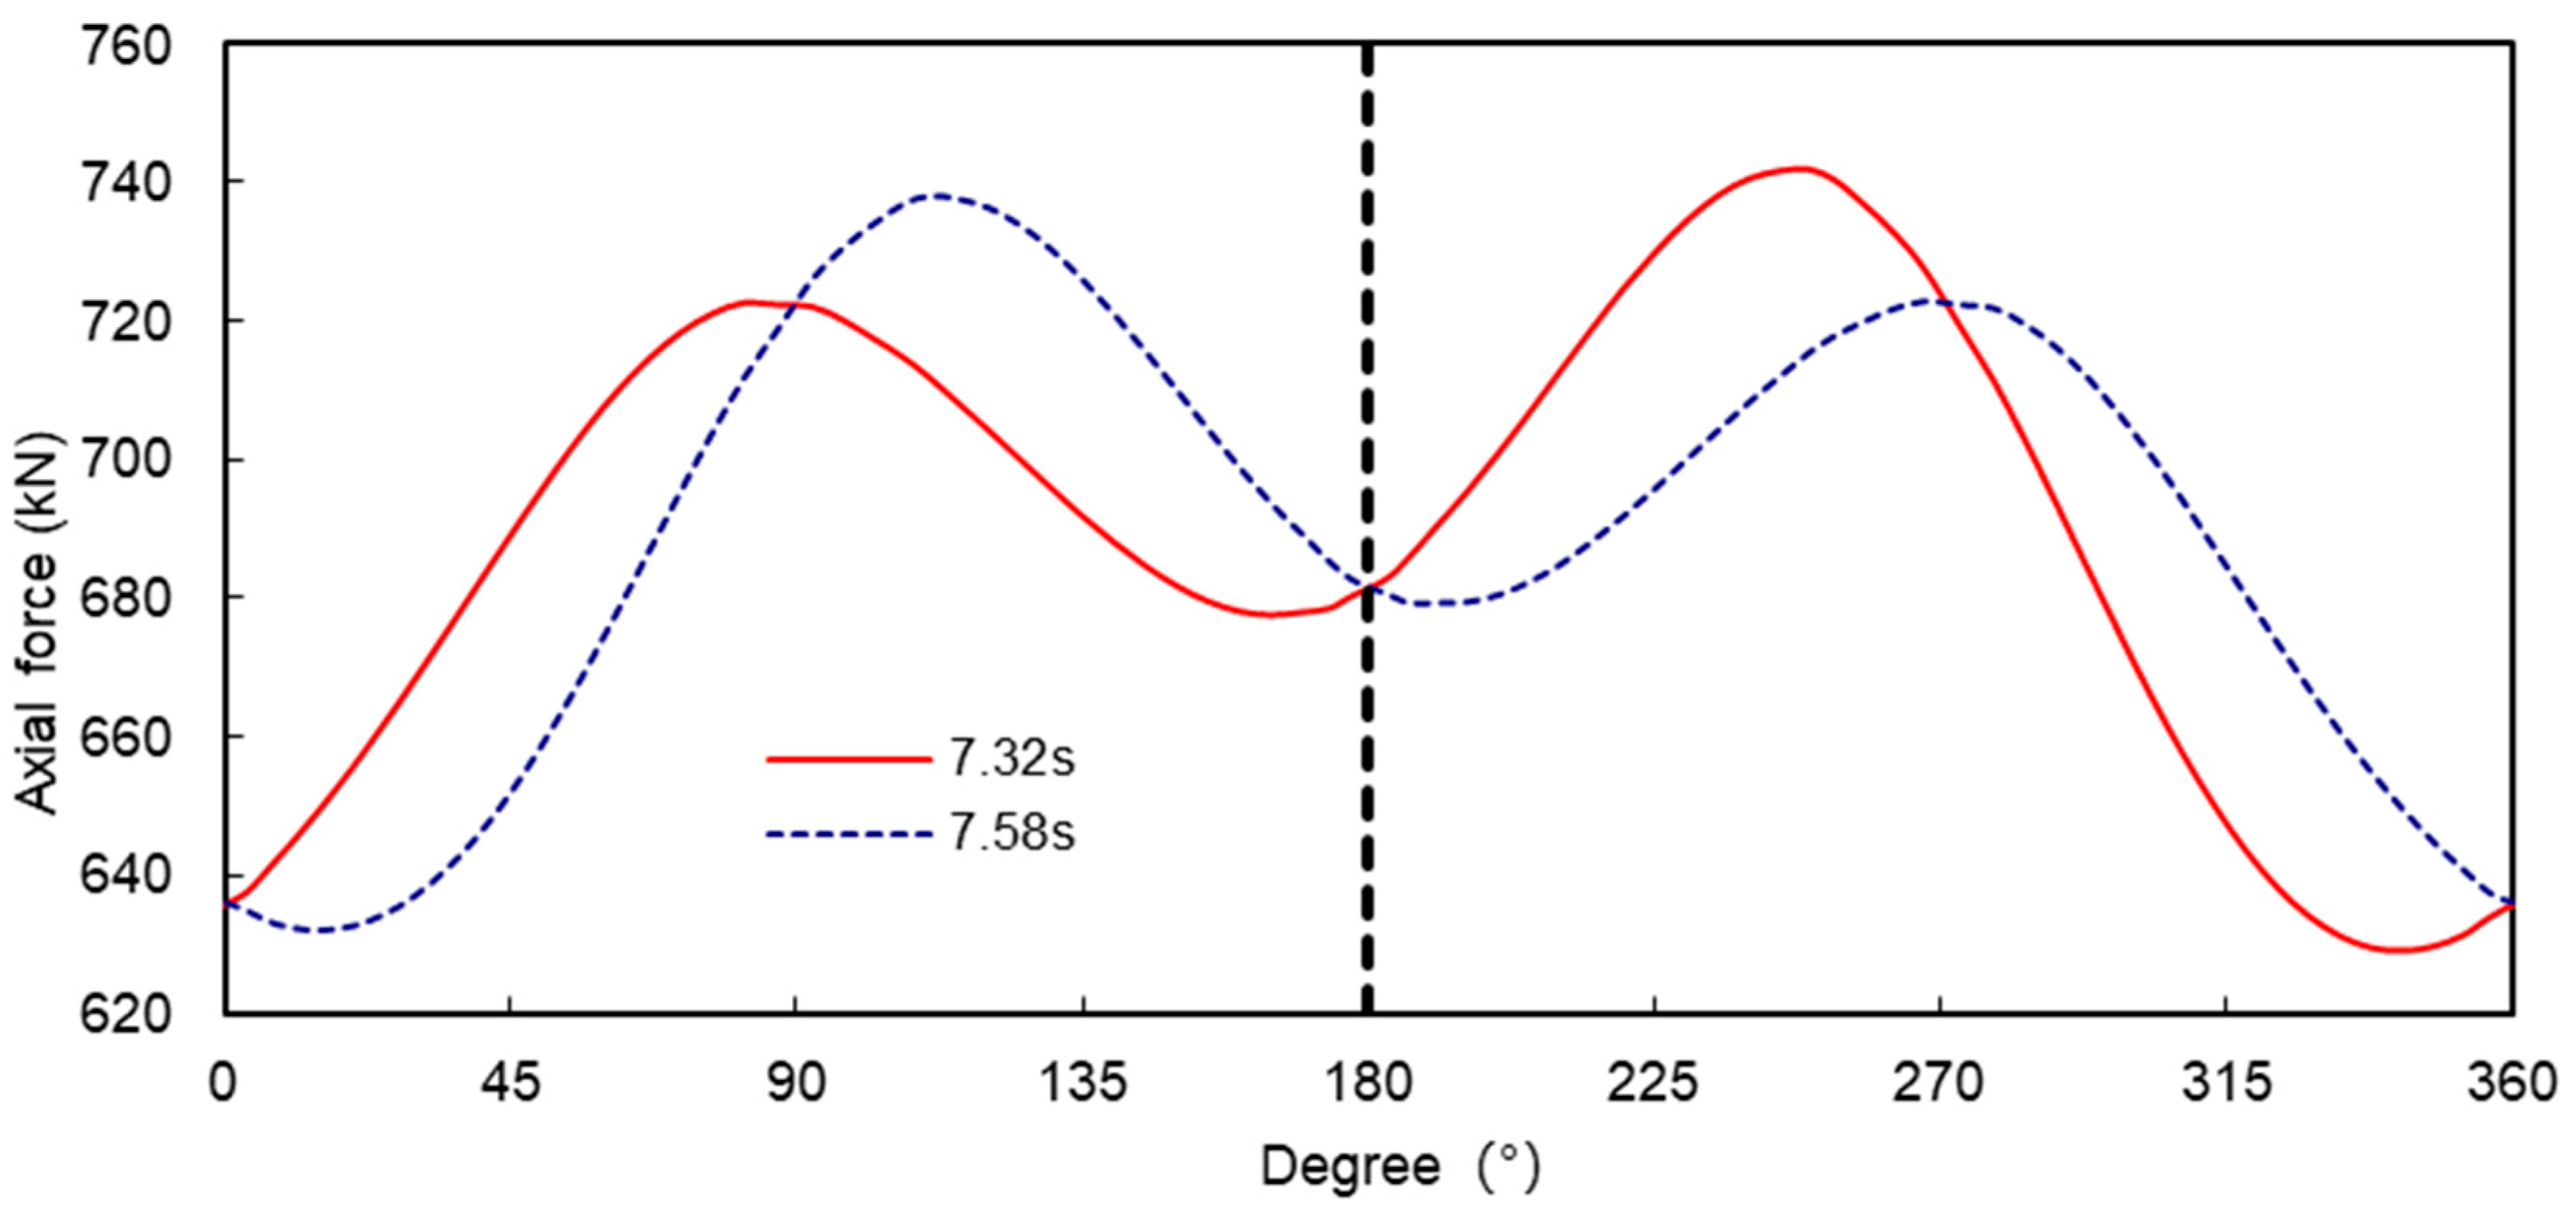
It is worth noting that the relative displacements at 7.32 s and 7.58 s of the tunnel are approximately symmetrical about the diameter from 0° to 180°, as shown in
Figure 15, and accordingly the bending moments and axial forces at the corresponding moments are also approximately symmetrical about the diameter from 0° to 180°, as shown in
Figure 16 and
Figure 17.
If the tunnel is a symmetrical structure, the direction of the relative displacement does not affect the magnitude of the internal forces in the tunnel. The magnitude of the internal forces in the tunnel is only related to the magnitude of the relative displacement, which increases the extreme value of the internal forces in the tunnel and decreases the extreme value of the internal forces in the tunnel as the relative displacement decreases. Therefore, the tunnel inclination can be considered as a measure of the seismic effect on the tunnel. The definition of tunnel inclination is given in equation (2):
where is
the tunnel inclination, is
the displacement of the top of the tunnel relative to the bottom, and
is the outer diameter of the tunnel. When the displacement of the top of the tunnel relative to the bottom is in the direction of error! Source not found. The tilt is positive when the agreed x-direction is positive, and negative when the relative displacement is negative.
3.3. Analysis of the Relationship between Internal Forces and Tunnel Inclination
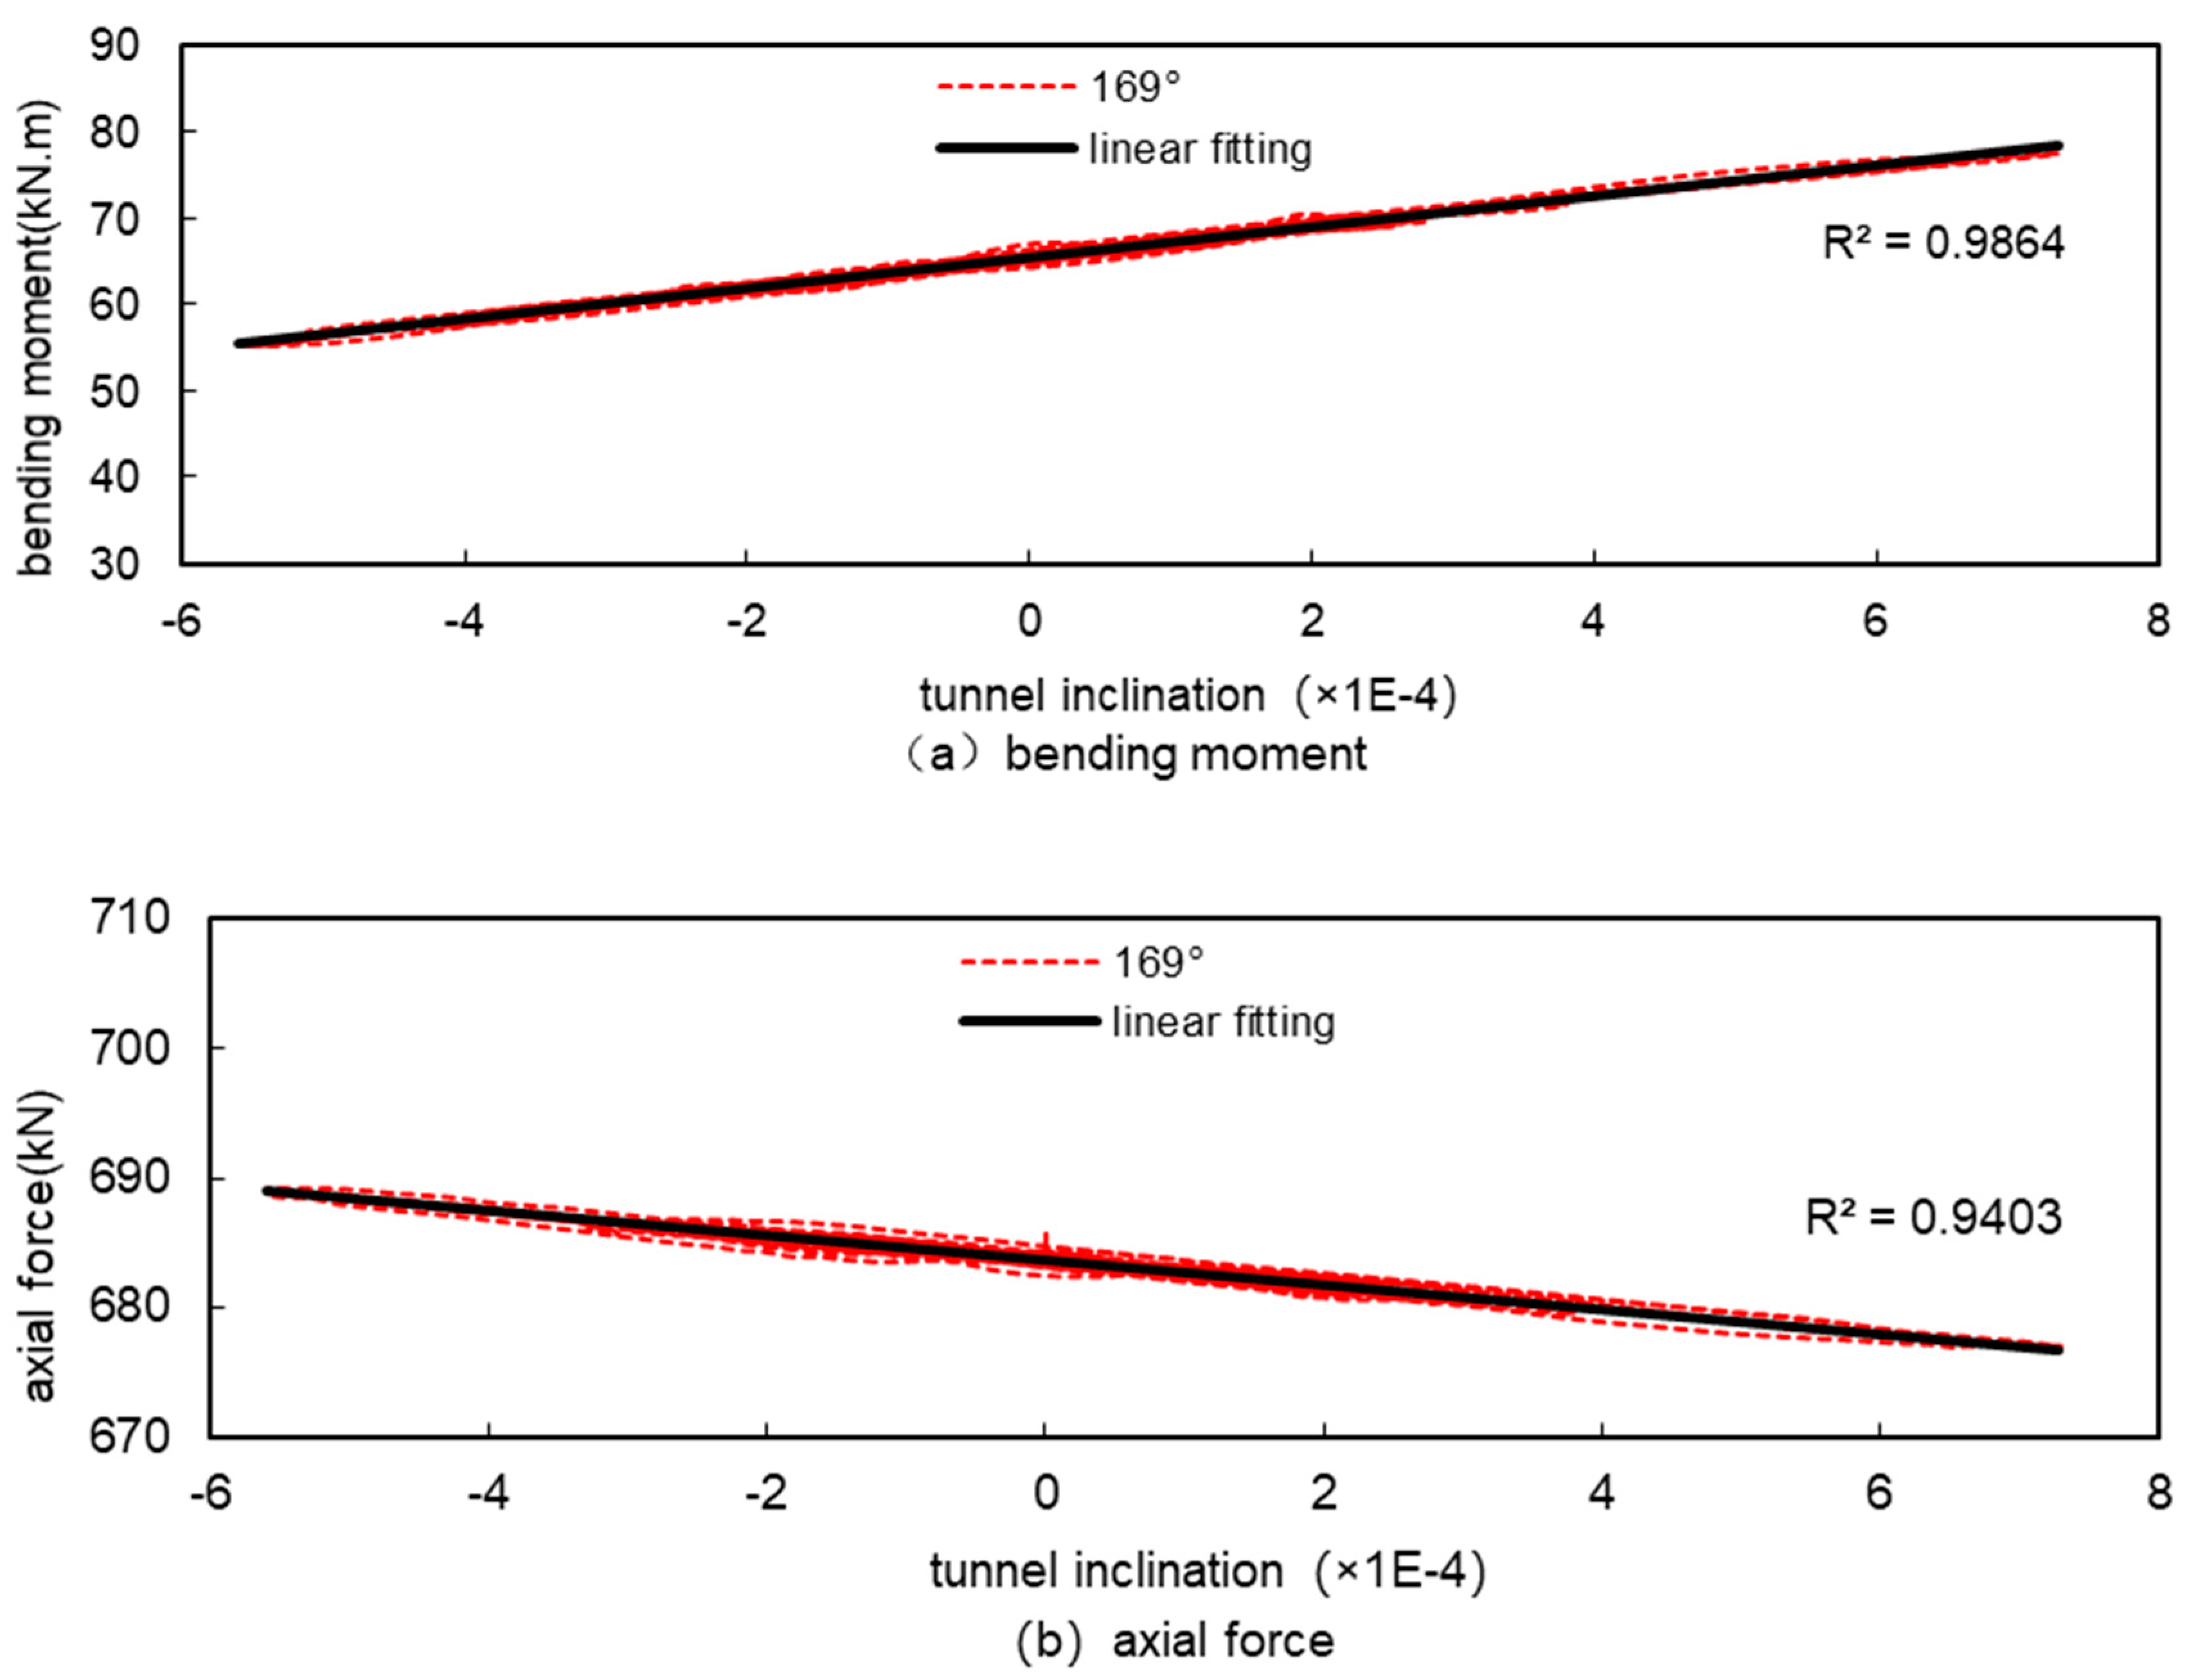
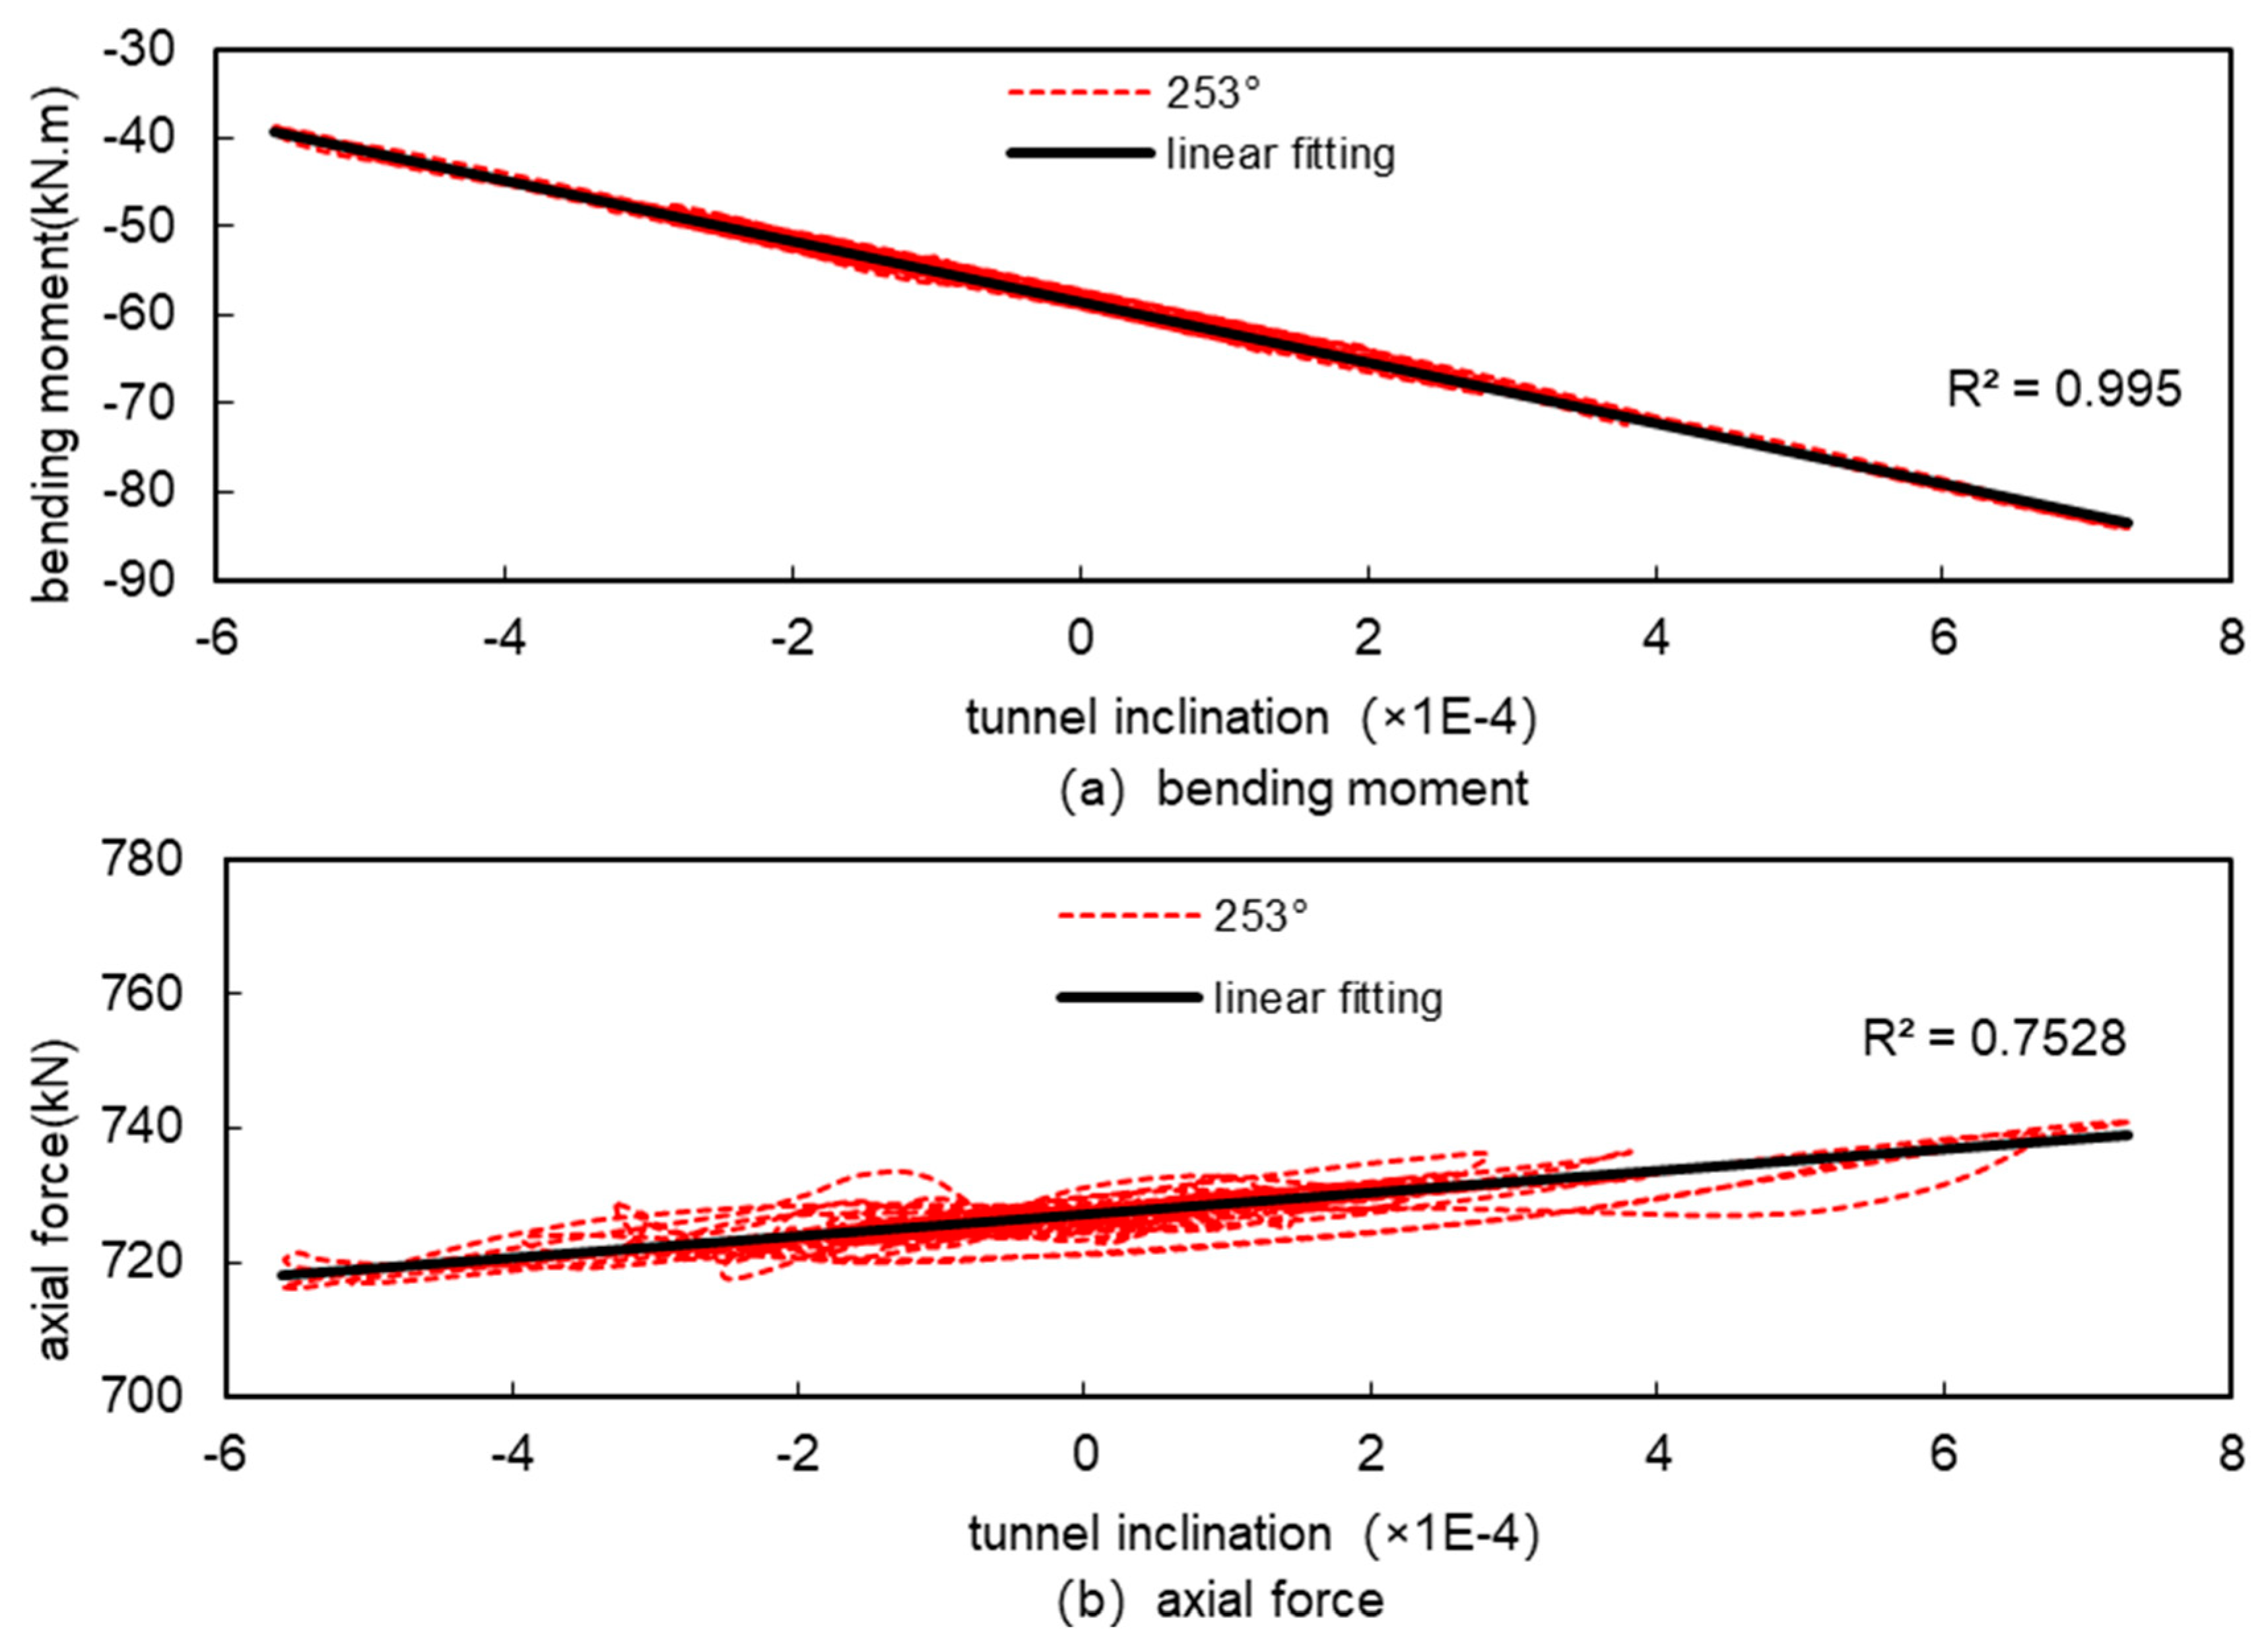
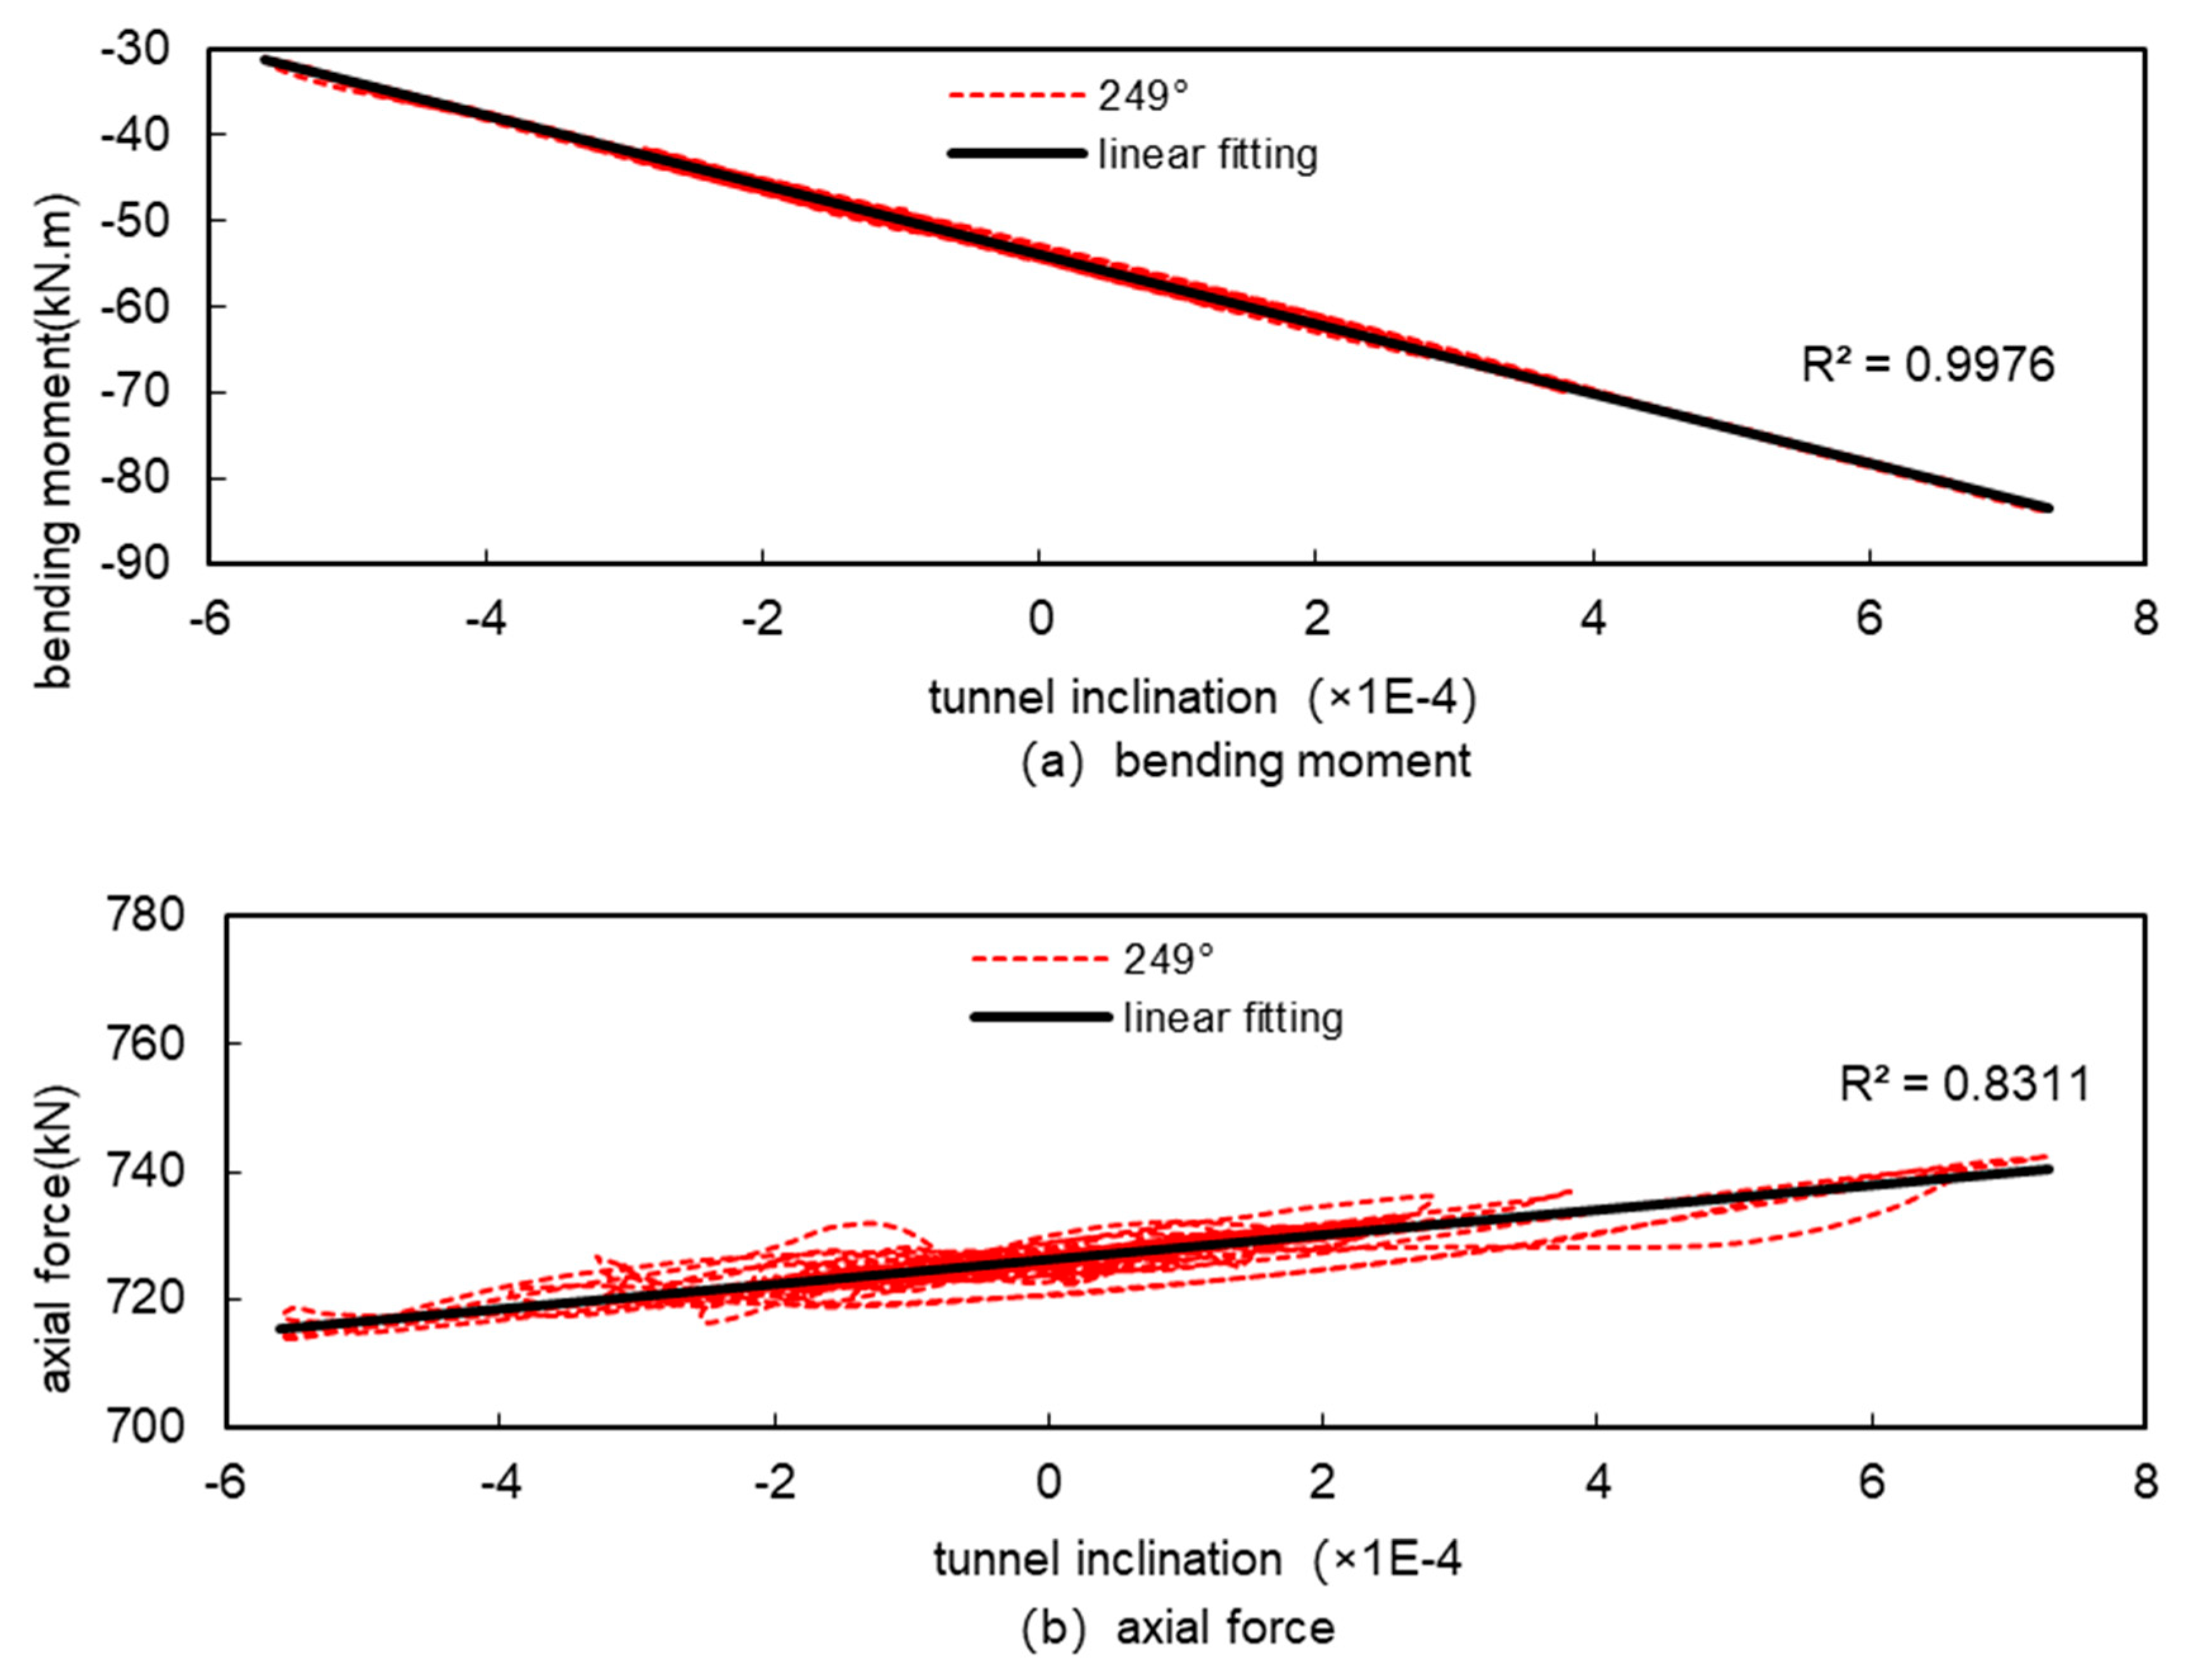
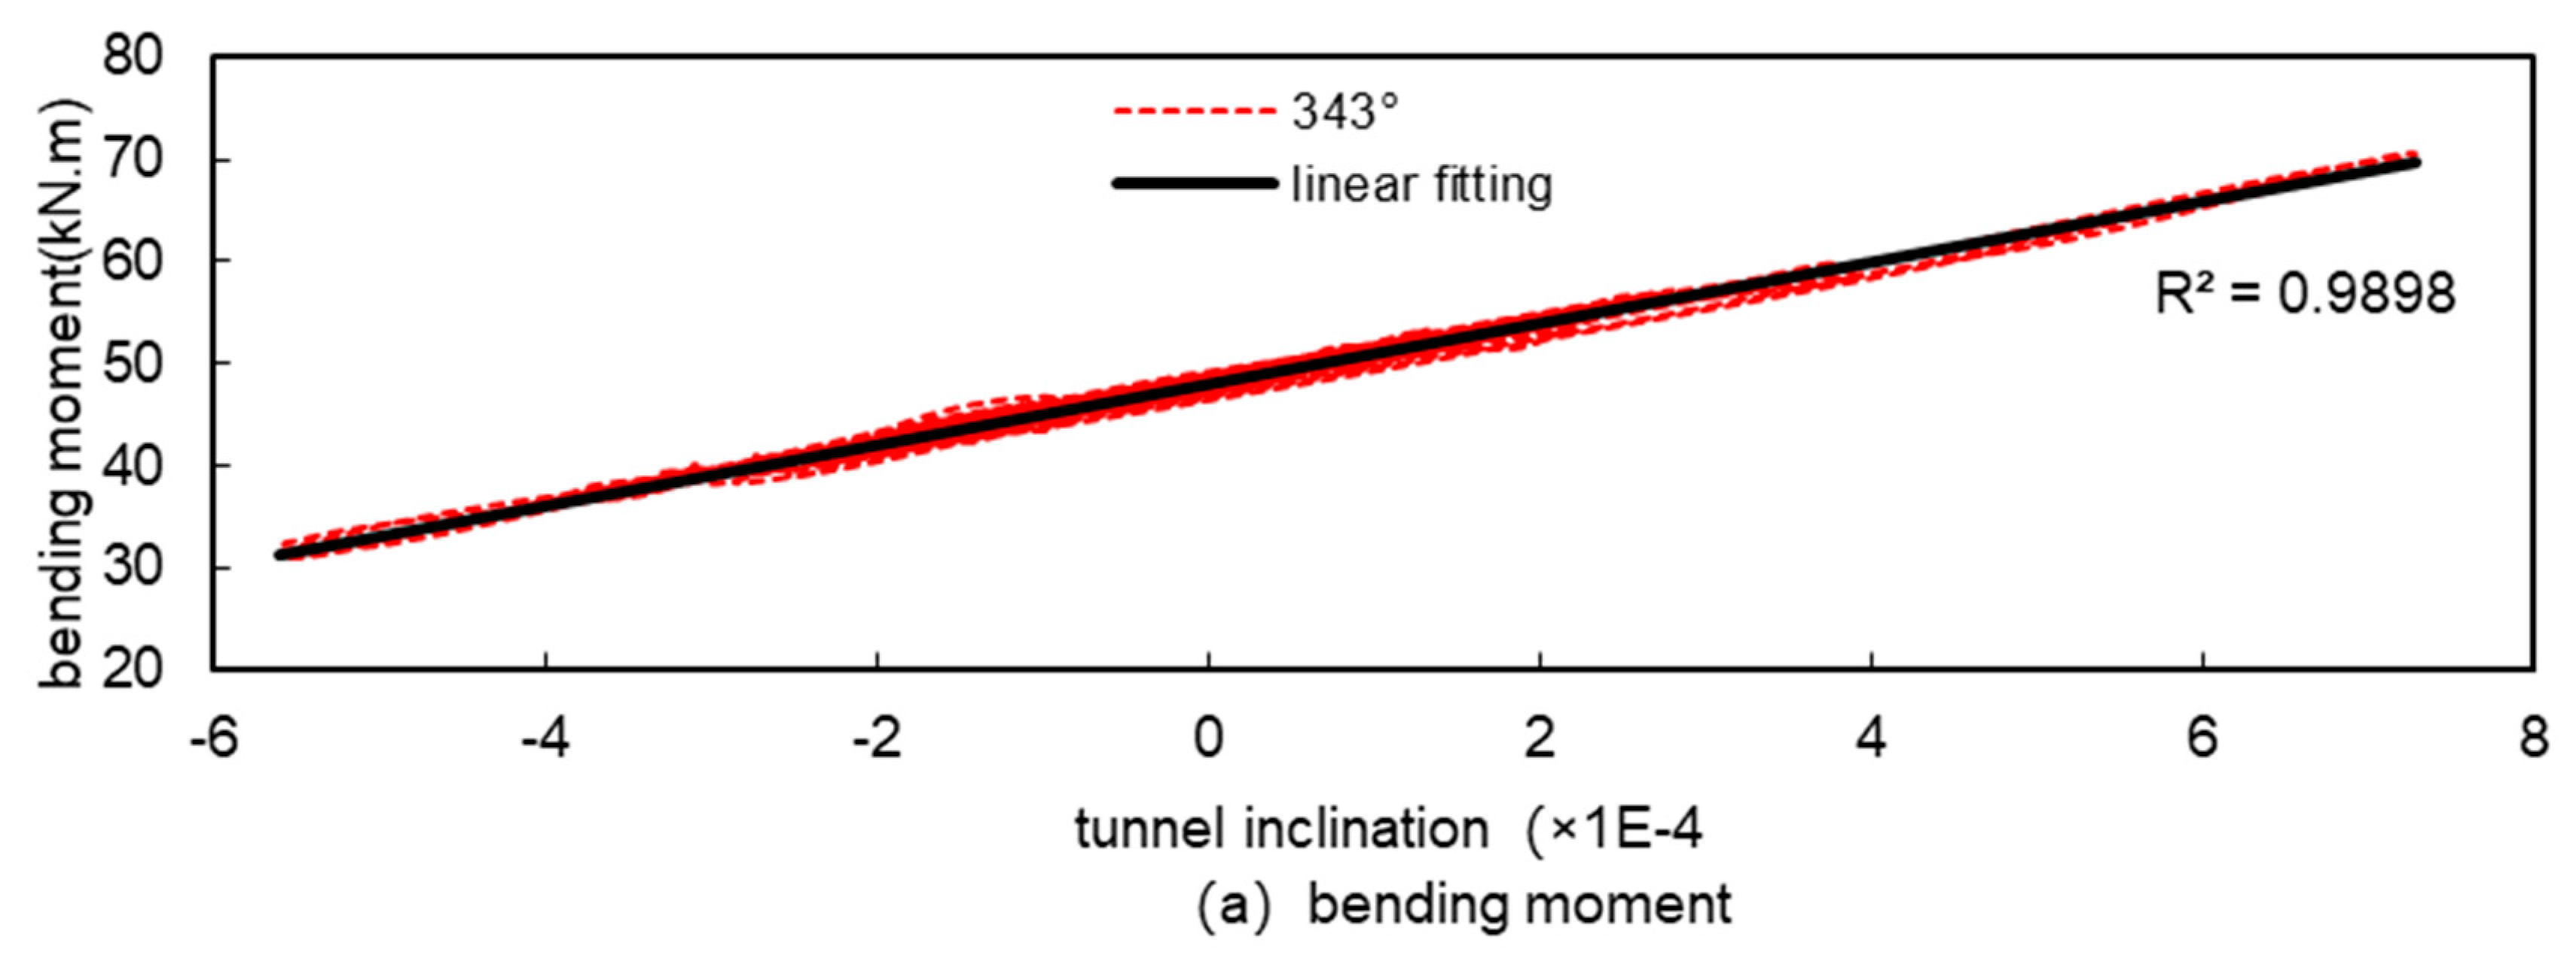
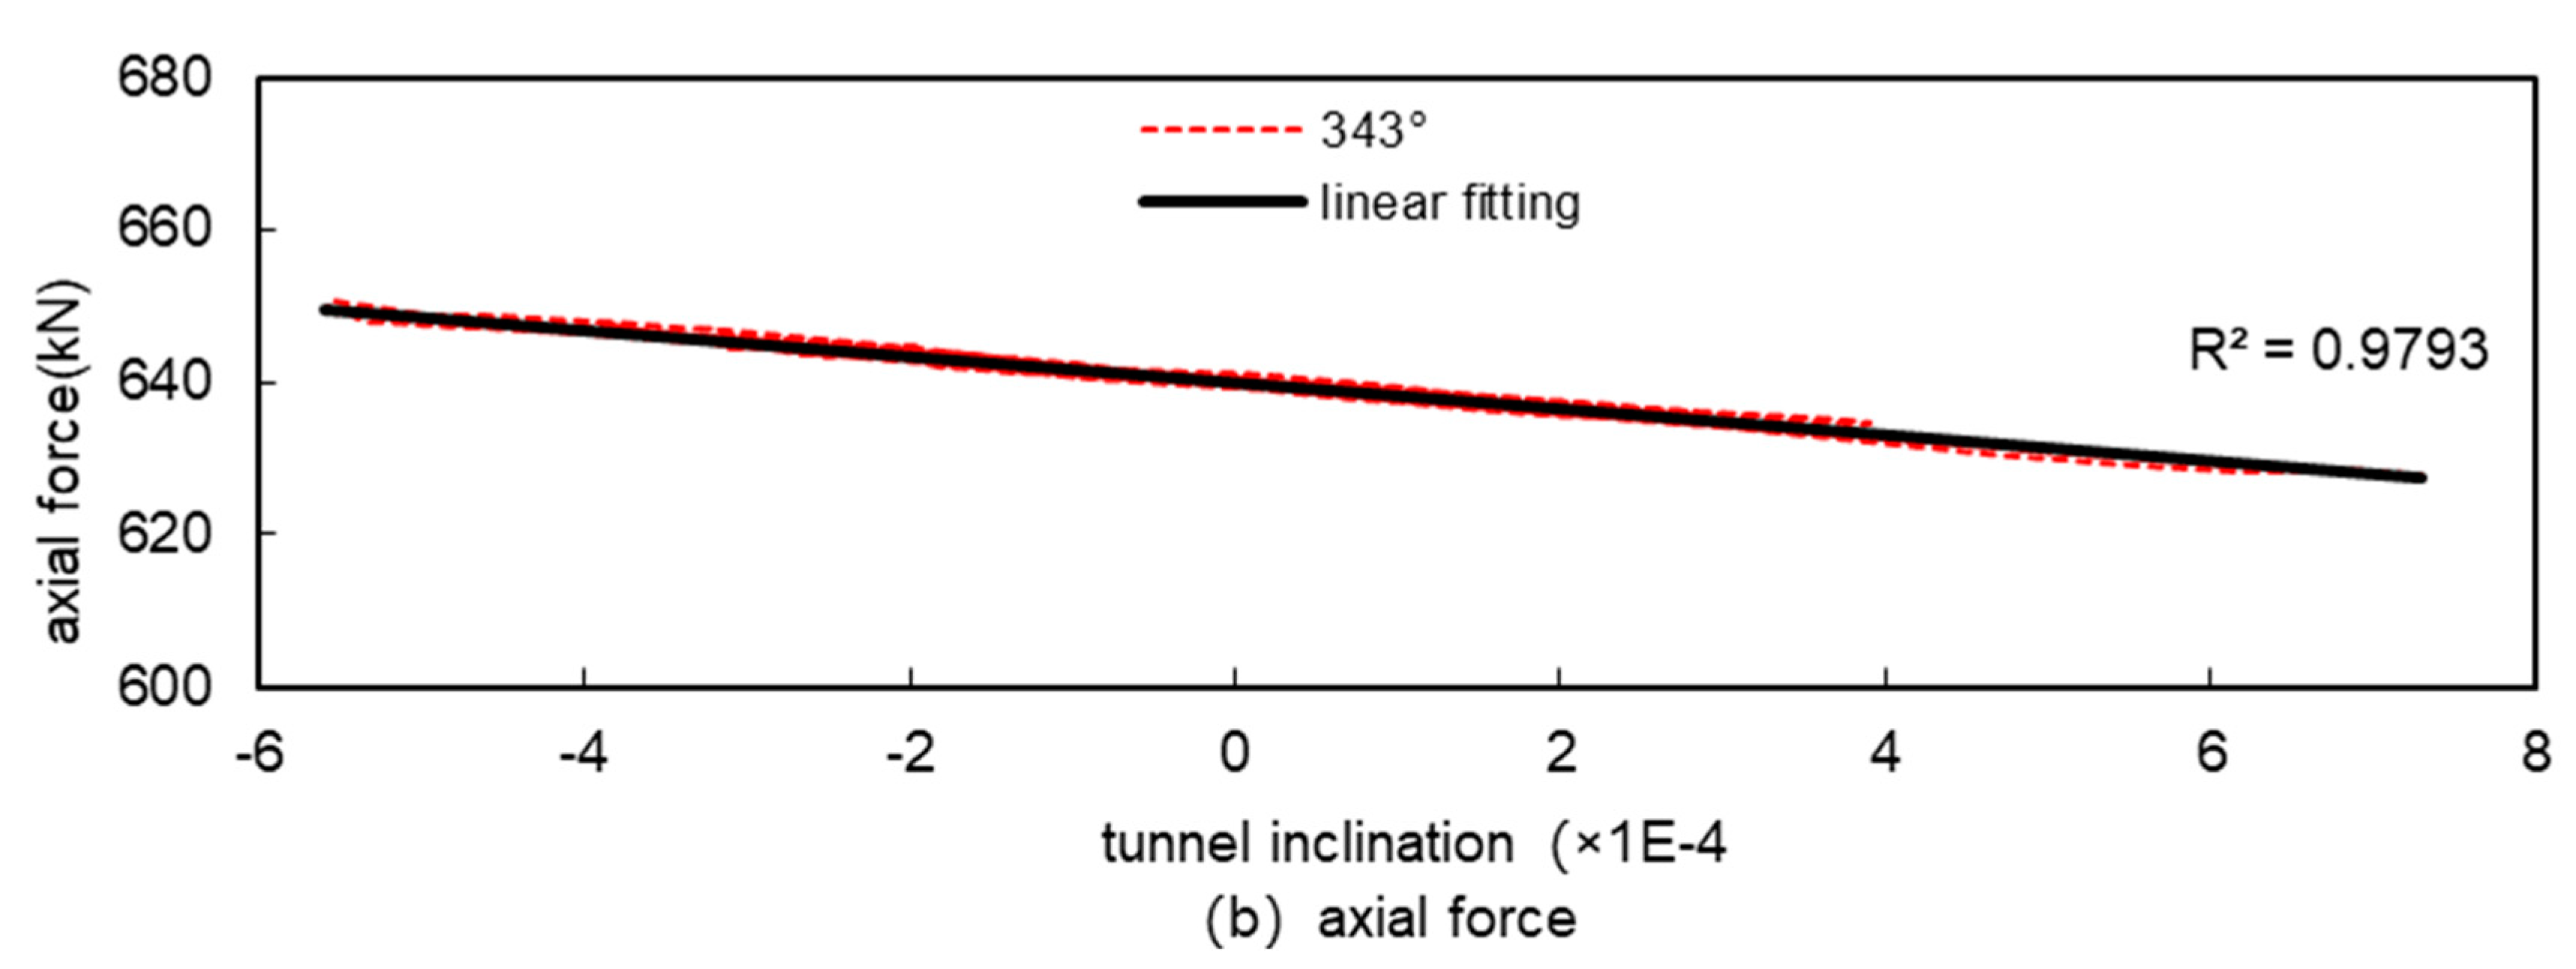
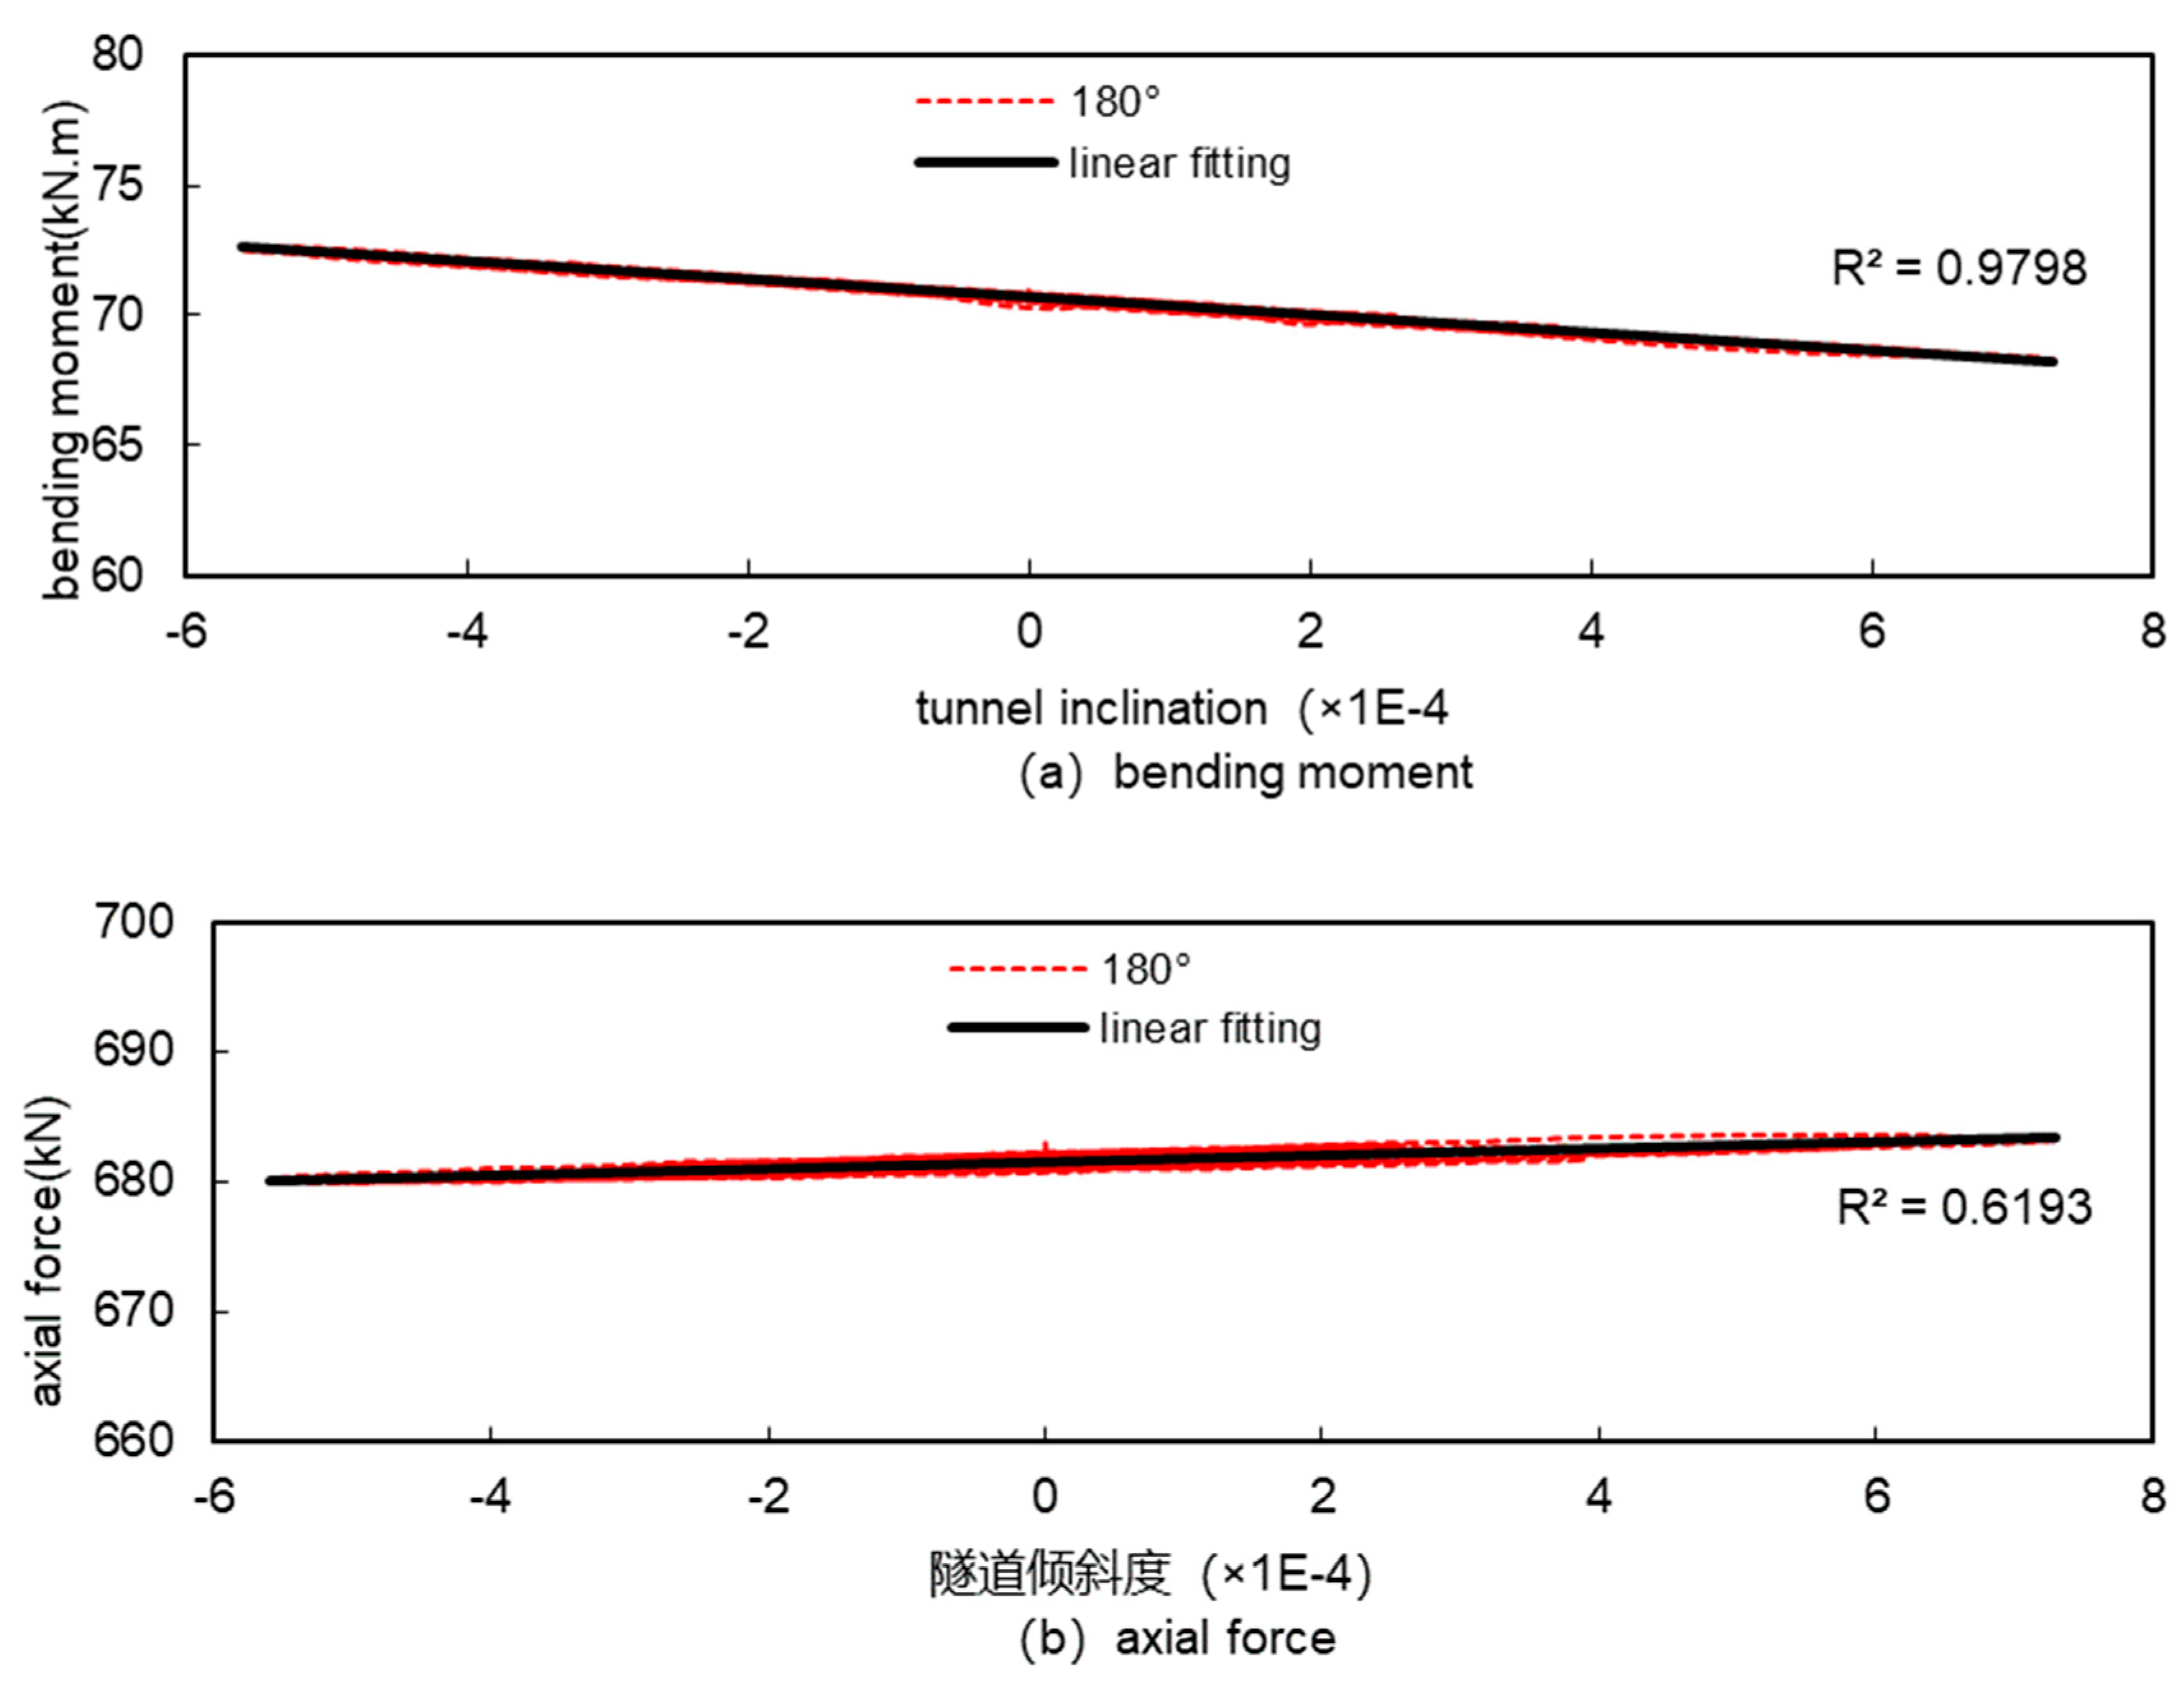
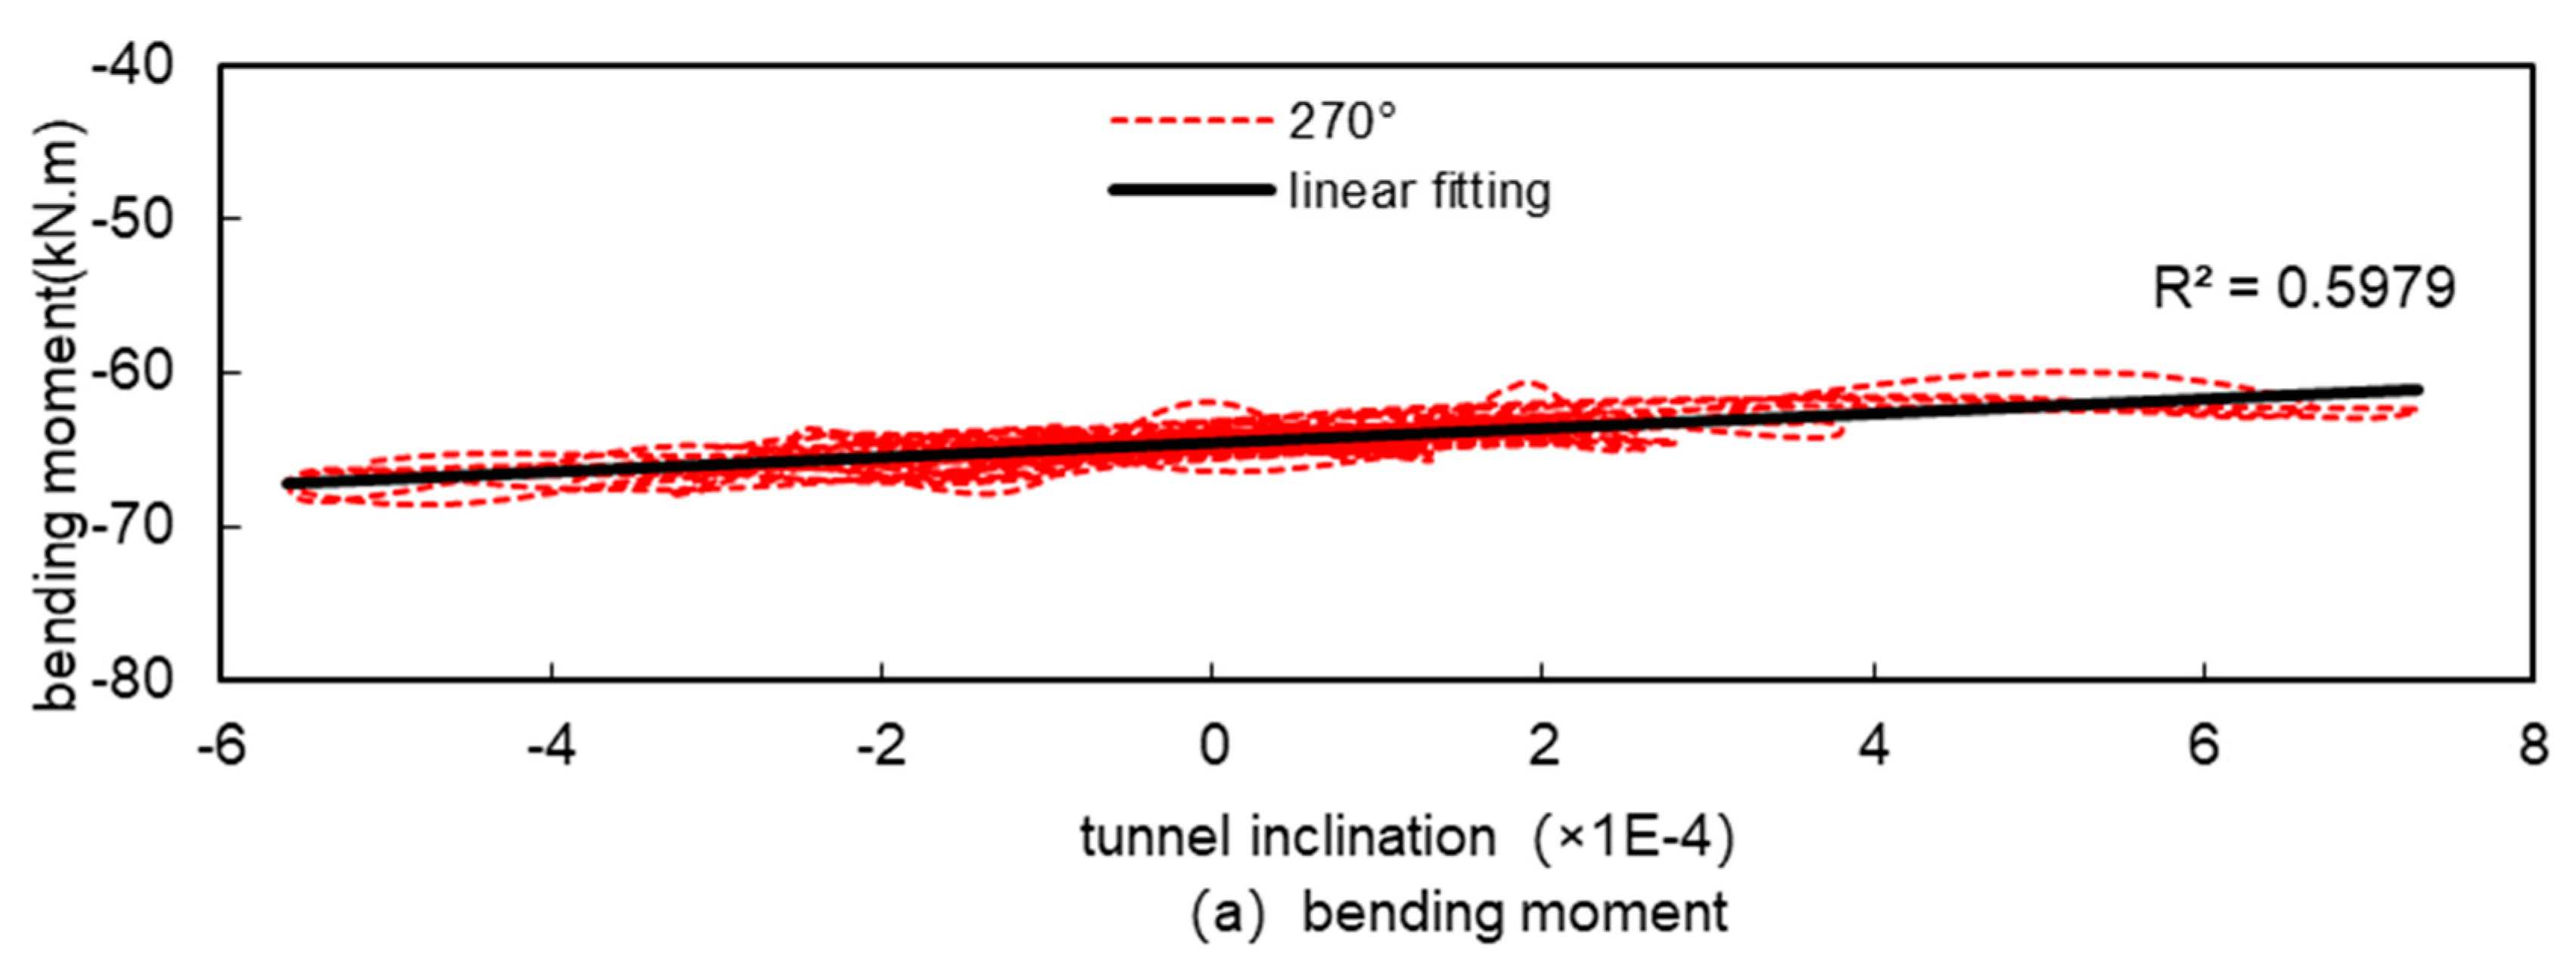
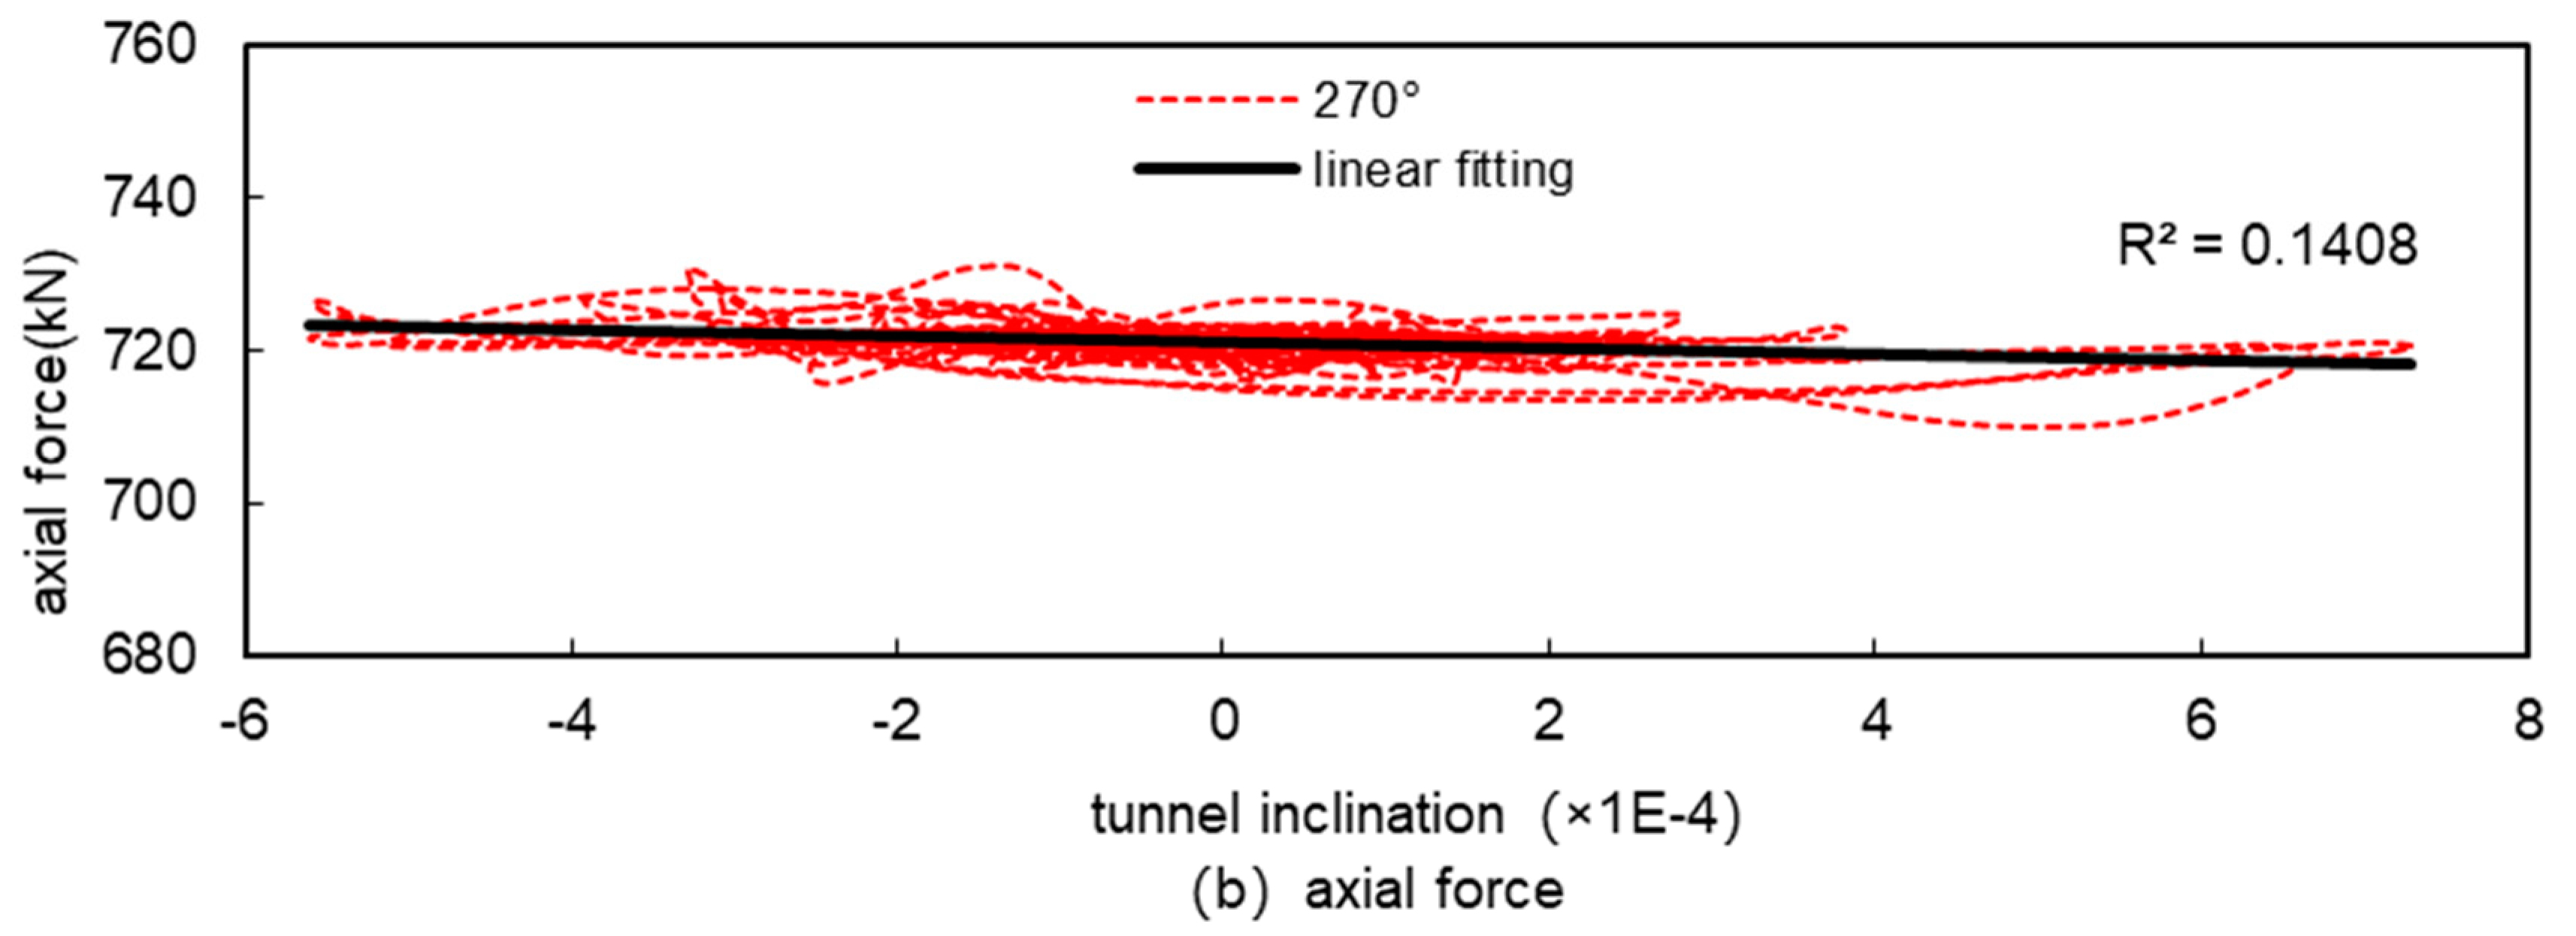
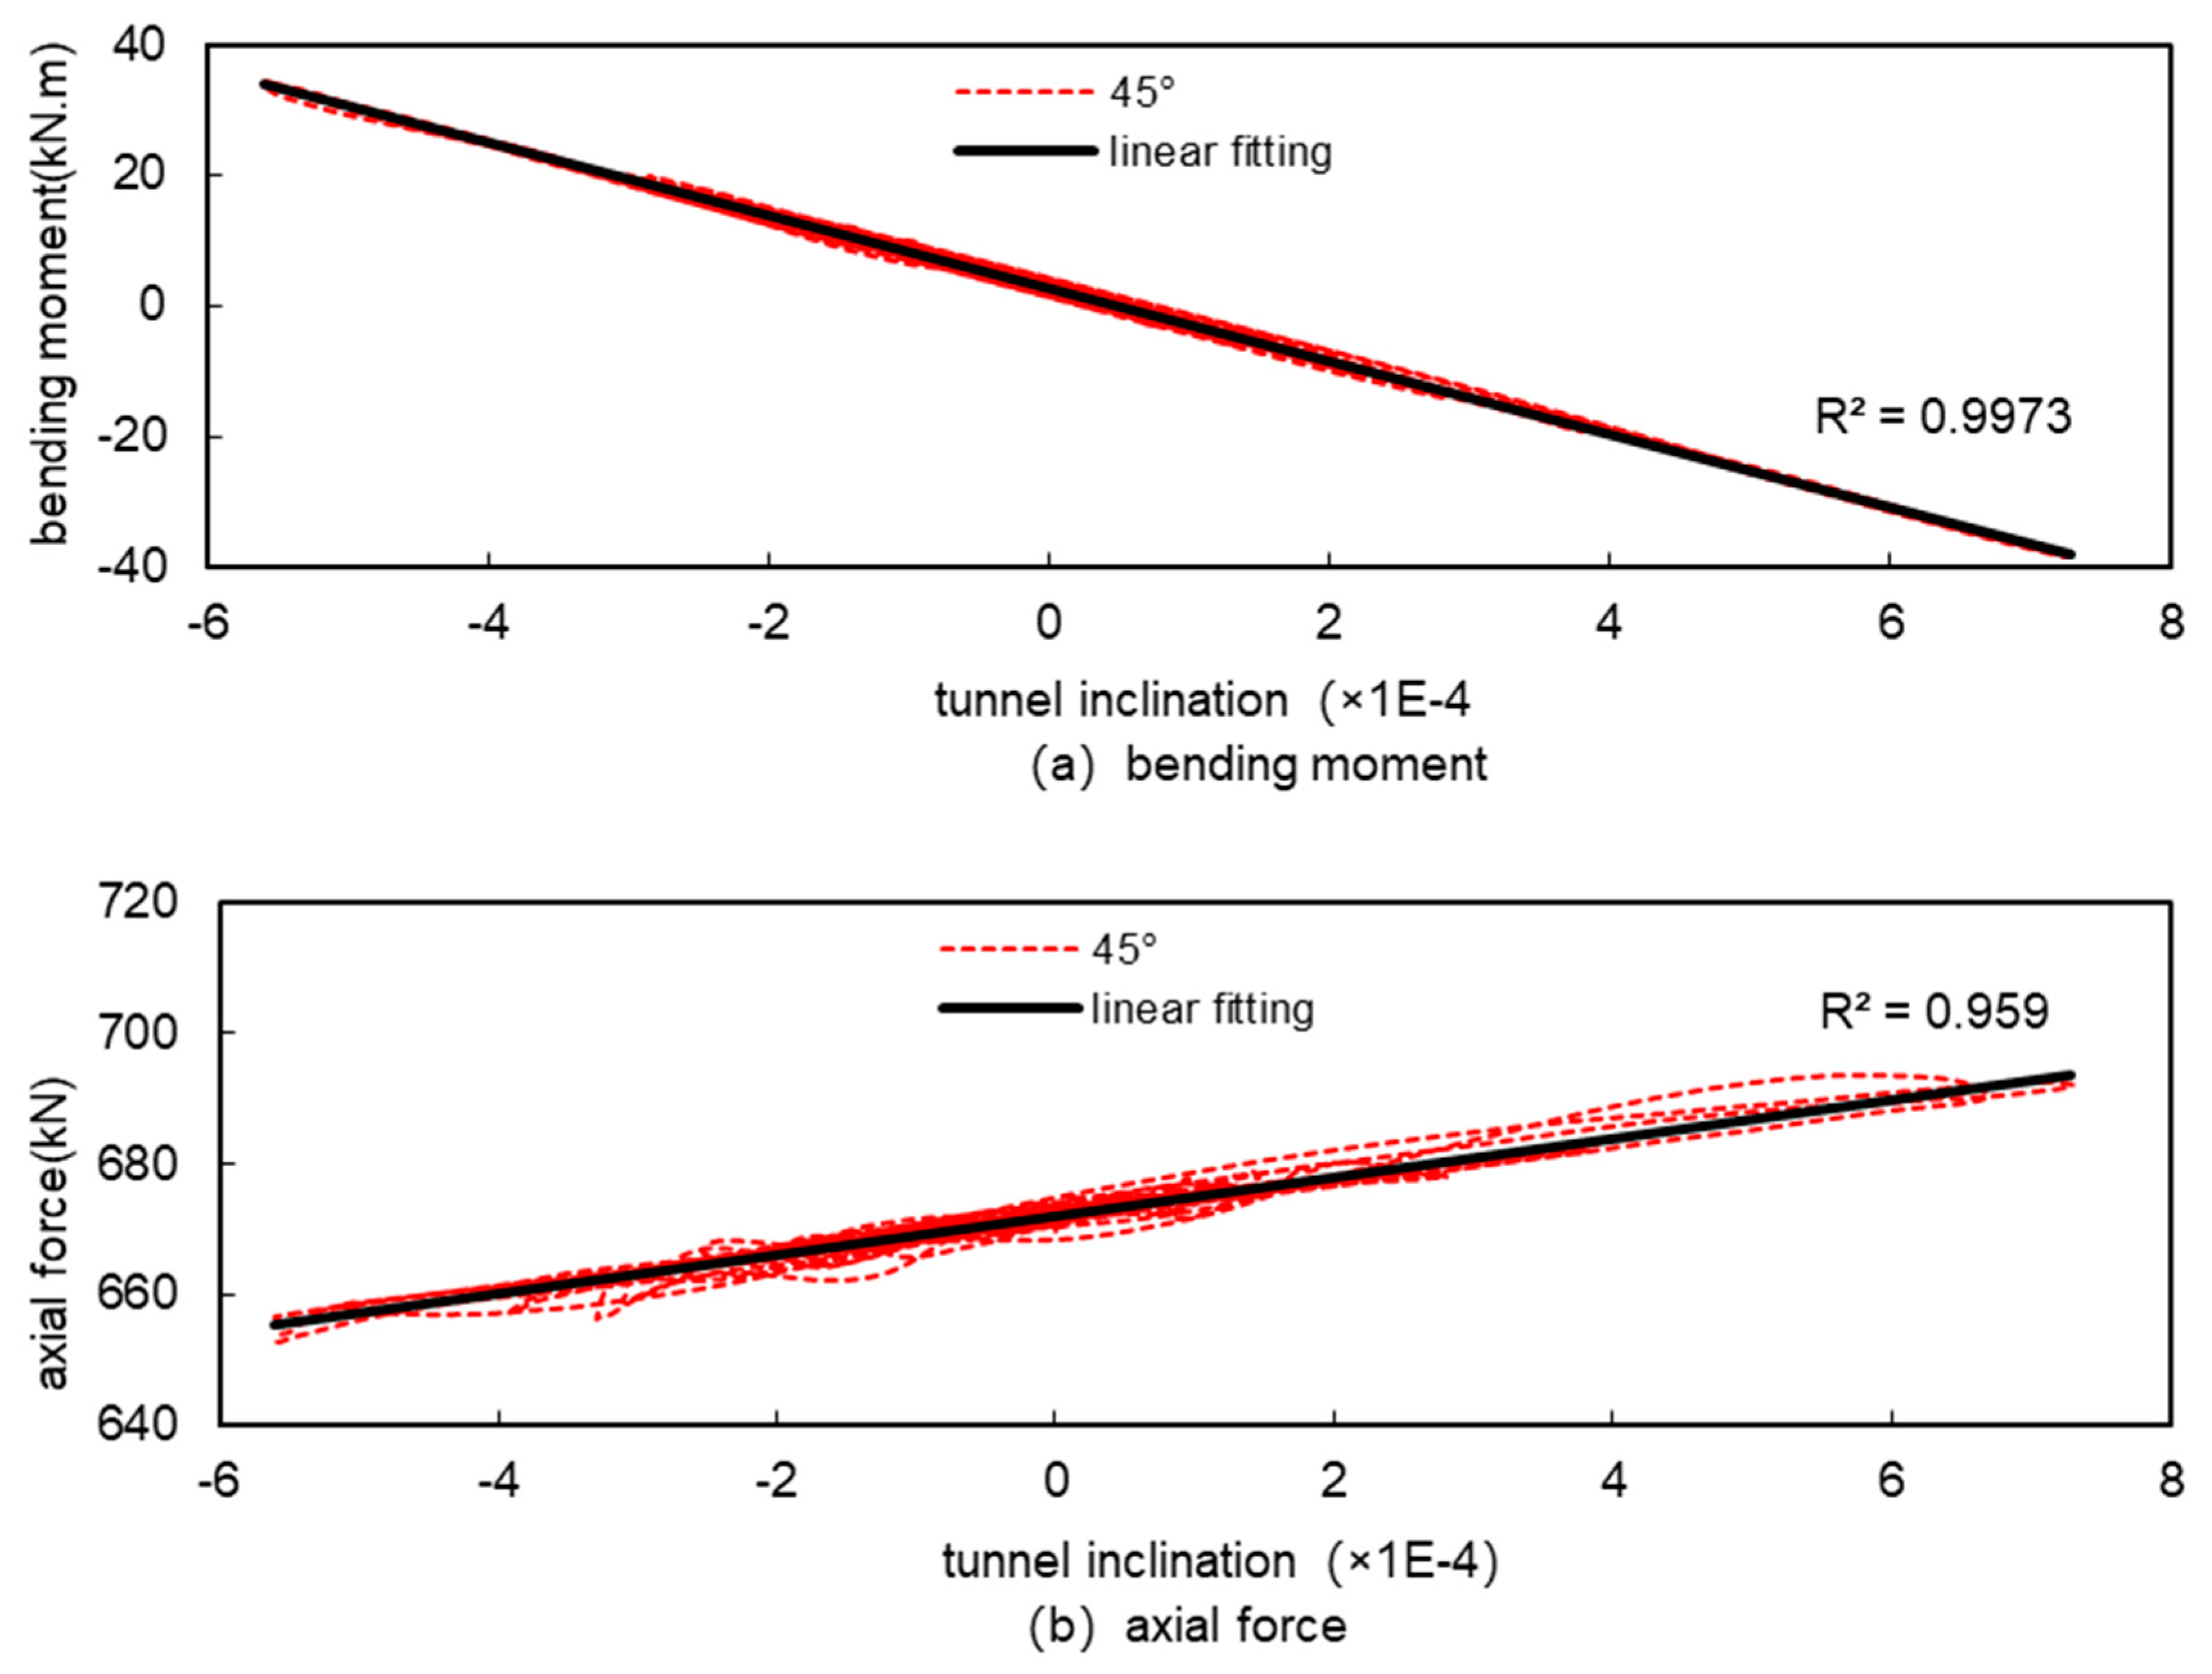
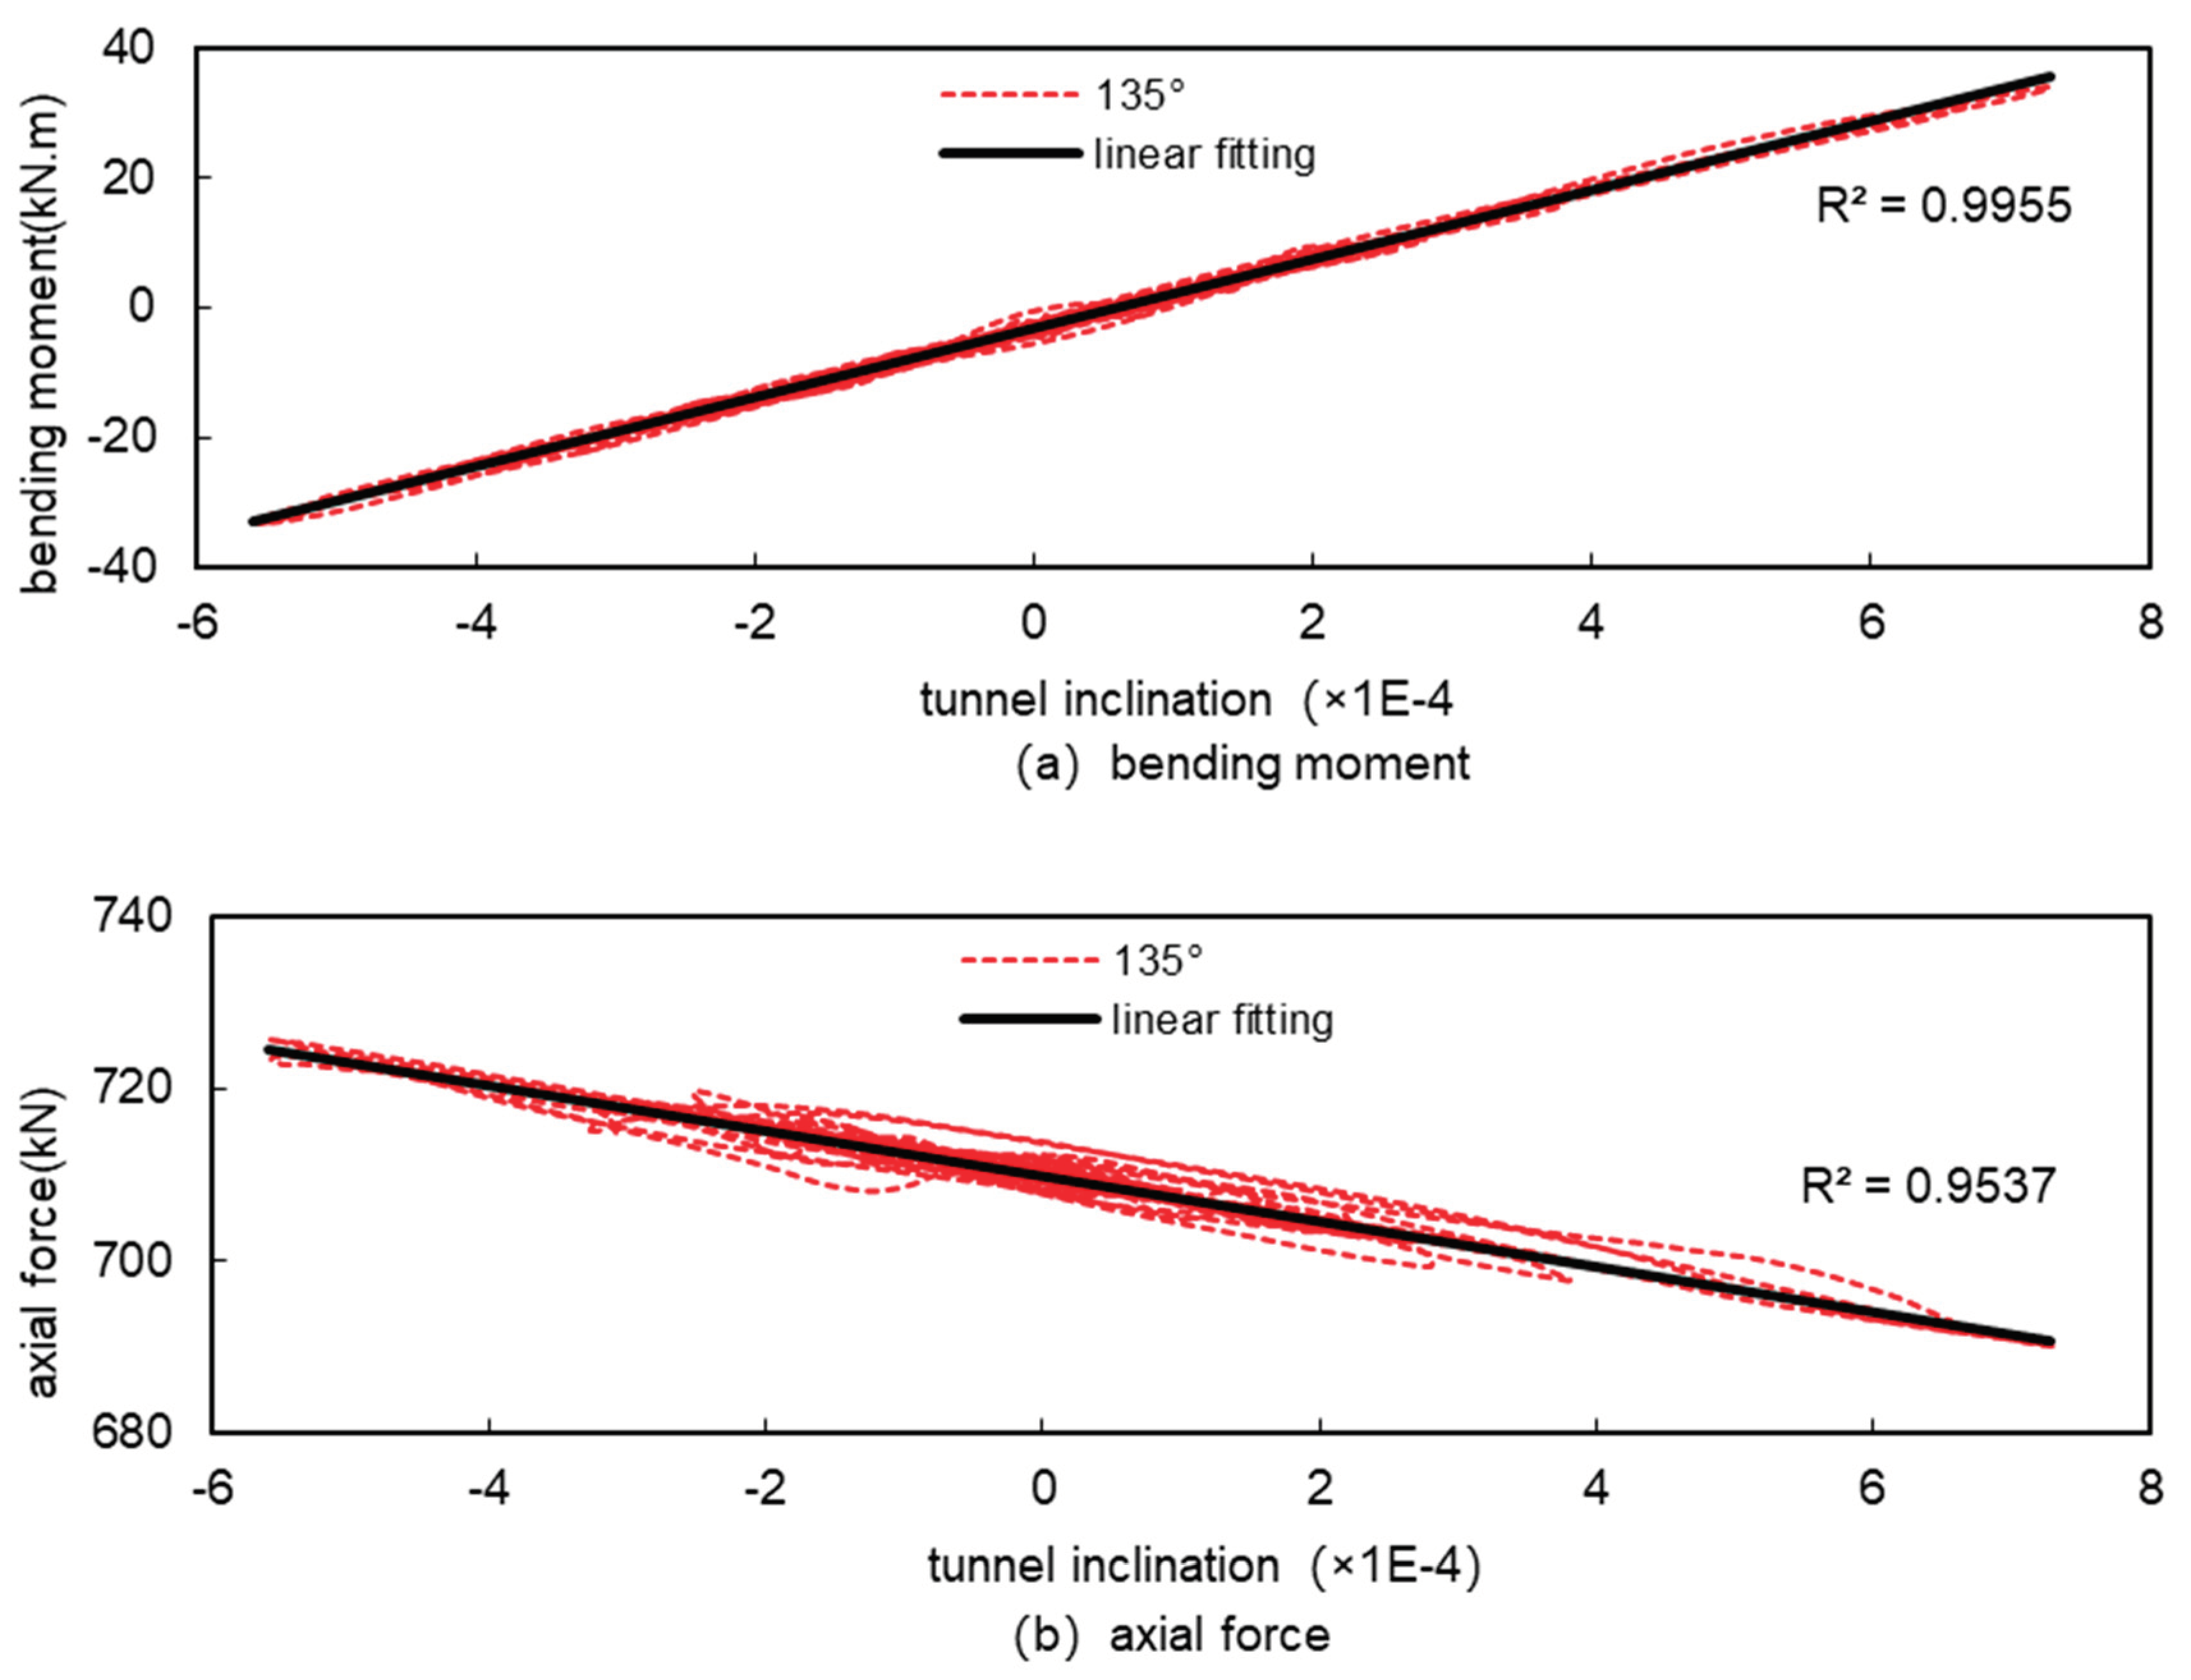
Figures 1.18 to 1.25 show the relationship between the internal forces and the tunnel inclination at various representative locations. Figures 1.18 to 1.21 show the extreme points of the internal forces in the tunnel according to Table 1.4; Figures 1.22 and 1.23 show the locations where there is little change in the internal forces under seismic action, such as the bottom of the tunnel (at 180°) and the horizontal diameter of the tunnel (at 270°); Figures 1.24 and 1.25 show the locations where the positive and negative bending moments change considerably under seismic action (at 45° and 135°). Figures 1.24 and 1.25 show the parts of the tunnel where the positive and negative bending moments change considerably under seismic action (at 45° and 135°).
From
Figure 18 to
Figure 25, it can be seen that there is a linear relationship between bending moment and inclination in all parts of the tunnel and the fit is high, and there is also a linear relationship between axial force and inclination but the fit is not as high as that of bending moment. This is because under seismic action, the magnitude of change in bending moment is relatively large, and the magnitude of change in axial force is relatively small, the local difference in bending moment is small relative to the magnitude of change, and therefore does not affect the overall fitting results, while the local difference in axial force is large relative to the magnitude of change, and then it affects the overall fitting results, and this is particularly evident at the horizontal diameter of the tunnel (270°), where the magnitude of change in the internal force is small , which has the worst fitting results. However, in general, under seismic action, the internal forces of the tunnel and the tunnel inclination basically show a good linear relationship, and it is feasible to use the tunnel inclination to measure the magnitude of the internal forces of the tunnel under seismic action.
Figure 18.
Relationship between internal forces and tunnel inclination at the maximum positive bending moment (169°) under seismic.
Figure 18.
Relationship between internal forces and tunnel inclination at the maximum positive bending moment (169°) under seismic.
Figure 19.
Relationship between internal forces and tunnel inclination at the maximum negative bending moment (253°) under seismic.
Figure 19.
Relationship between internal forces and tunnel inclination at the maximum negative bending moment (253°) under seismic.
Figure 20.
Relationship between internal forces and tunnel inclination at the maximum axial force (249°) under seismic.
Figure 20.
Relationship between internal forces and tunnel inclination at the maximum axial force (249°) under seismic.
Figure 21.
Relationship between internal forces and tunnel inclination at the minimum axial force (343°) under seismic.
Figure 21.
Relationship between internal forces and tunnel inclination at the minimum axial force (343°) under seismic.
Figure 22.
Relationship between internal forces and tunnel inclination at 180° of tunnel.
Figure 22.
Relationship between internal forces and tunnel inclination at 180° of tunnel.
Figure 23.
Relationship between internal forces and tunnel inclination at 270° of tunnel.
Figure 23.
Relationship between internal forces and tunnel inclination at 270° of tunnel.
Figure 24.
Relationship between internal forces and tunnel inclination at 45° of tunnel.
Figure 24.
Relationship between internal forces and tunnel inclination at 45° of tunnel.
Figure 25.
Relationship between internal forces and tunnel inclination at 135° of tunnel.
Figure 25.
Relationship between internal forces and tunnel inclination at 135° of tunnel.
4. Conclusions
A typical metro shield tunnel is calculated by dynamic time-history analysis, and the tunnel inclination was introduced to analyse the seismic response characteristics of metro shield tunnels under the action of artificial seismic waves, and some laws of the seismic response of metro tunnels were summarized.
(1) Under seismic action, the distribution of both bending moment and axial force of the tunnel changes, and the location of their extreme point is different from that under conventional loading.
(2) Under seismic action, the bending moment of the tunnel has a large fluctuation, while the axial force fluctuation is relatively small. Meanwhile, the bending moments at 0°, 90°, 180°, 270° and other parts of the tunnel change less under seismic action, while the bending moments at 45°, 135°, 225°, 315° and other parts of the tunnel alternate between positive and negative with a larger fluctuation.
(3) Under seismic action, the bending moment decreases and the axial force increases in the parts of the tunnel whose diameters are subjected to tension, while the bending moment increases and the axial force decreases in the parts of the tunnel whose diameters are subjected to compression.
(4) The overall levelling of the tunnel will not affect the tunnel too much, and the seismic response of the tunnel is mainly related to the relative displacement of the soil surrounding the tunnel, which increases, and the corresponding changes in internal forces and deformations of the tunnel also increase.
(5) The change of the internal force of the tunnel and the tunnel inclination show a good linear relationship, and the tunnel inclination can be introduced to measure the magnitude of the seismic response of the tunnel.
Author Contributions
Z.-Y.Y.; methodology, Z.-Y.Y ,Y.L.; software, C.C.; investigation. All authors have read and agreed to the published version of the manuscript.
Funding
This research was funded by The Technology Innovation Project of Hubei Province (Key Program,No. 2023BEB010), The Key Research and Development Program of Hubei Province (No. 2023BCB116), The Key Research and Development Program of Hubei Province (No. 2023BAB024)..
Conflicts of Interest
The authors declare no conflicts of interest.
References
- Lin Zhi, Zhu He-Hua,Yang Chao, et al. Anti-seismic Calculation for Shield Tunnels[J]. Journal of Tongji University. 2004,(05):607-611.
- Liu Jingbo Li Bin. Issues on the seismic analysis and design of subway structures [J]. China Civil Engineering Journal.2006, (06): 106-110.
- Liu Jingbo Li Bin Liu. A static elasto-plastic analysis method in seismic design of underground structures [J]. China Civil Engineering Journal. 2007.
- Zhongying He, Jianxiang Man, Yifan Song, Wen Xu, Yutao Pang,Longitudinal seismic displacement analysis of Quasi Seismic Isolation Bridge based on Energy-based Multimodal Pushover Method with and without collision,Soil Dynamics and Earthquake Engineering,Volume 177,2024,.
- Zhang, J.; Jia, J. Research on the Seismic Isolation Effect of the Ring Spring–Friction Pendulum Bearing in the Dakai Underground Subway Station. Appl. Sci. 2023, 13, 7093. [CrossRef]
- Ming-Lang Lin, Cheng-Han Lin, Chien-Hung Li, Chun-Yuan Liu, Chien-Hui Hung,3D modeling of the ground deformation along the fault rupture and its impact on engineering structures: Insights from the 1999 Chi-Chi earthquake, Shigang District, Taiwan,Engineering Geology,Volume 281,.
- Malekzadeh, M.; Shayanfar, M. Numerical Study on Seismic Behavior of Flexural Frames with Semi-Rigid Welded Steel Connections Considering Static and Reciprocating Loads: A Performance-Based Earthquake Approach. Appl. Sci. 2022, 12, 7617. [CrossRef]
- Cai, X.; Yang, C.; Yuan, Y. Hybrid Simulation of Seismic Responses of a Typical Station with a Reinforced Concrete Column. Appl. Sci. 2020, 10, 1331. [CrossRef]
- Amorosi, A.; Boldini, D.; Elia, G. Parametric study on seismic ground response by finite element modelling. Comput. Geotech. 2010, 37, 515–528.
- Ming, S.; Tao, L.; Wang, Z. Shaking Table Tests on the Seismic Response of Symmetrically Integrated Underground Stations. Symmetry 2024, 16, 232. [CrossRef]
- Wen, H.; Zhou, Z.; Li, X.; Song, D.; He, Z.; Xin, C. Evaluation of the Damping Layer between the Tunnel Lining and Surrounding Rock via a Shaking Table Test. Sustainability 2023, 15, 13244. [CrossRef]
- Chen, C.; Zou, W.; Geng, P.; Gu, W.; Yuan, F.; He, C. Study on Seismic Damage Risk Assessment of Mountain Tunnel Based on the Extension Theory. Sustainability 2023, 15, 5294. [CrossRef]
- Shen, J.; Bao, X.; Chen, X.; Wu, X.; Cui, H. Prediction of Tunnel Earthquake Damage Based on a Combination Weighting Analysis Method. Symmetry 2022, 14, 1922. [CrossRef]
- Tai-Tien Wang, On-Lei Annie Kwok, Fu-Shu Jeng. Seismic response of tunnels revealed in two decades following the 1999 Chi-Chi earthquake (Mw 7.6) in Taiwan: A review, Engineering Geology, Volume 287,2021,106090,.
- ChihChieh Lu, Jin-Hung Hwang, Damage analysis of the new Sanyi railway tunnel in the 1999 Chi-Chi earthquake: Necessity of second lining reinforcement, Tunnelling and Underground Space Technology, Volume 73,2018,Pages 48-59,.
- Jiawei Jiang, Ran Tao, M. Hesham El Naggar, Hen Liu, Xiuli Du. Seismic performance and vulnerability analysis for bifurcated tunnels in soft soil, Computers and Geotechnics, Volume 167,2024,106065,.
- Shaohua Zhang, Yong Yuan, Yusheng Yang, Chong Li, Haitao Yu,Experimental investigation of seismic performance of segmental tunnel with secondary lining under strong earthquake,Structures,Volume 60,2024,105833,.
- Qiangqiang Sun, Menghao Hou, Daniel Dias,Numerical study on the use of soft material walls to enhance seismic performance of an existing tunnel,Underground Space,Volume 15,2024,Pages 90-112,.
- Yan Zou, Yeqin Zhang, Hongqing Liu, Huabei Liu, Yu Miao, Performance-based seismic assessment of shield tunnels by incorporating a nonlinear pseudostatic analysis approach for the soil-tunnel interaction, Tunnelling and Underground Space Technology,Volume 114,2021,103981,.
- Lei Liu, Chengshun Xu, Xiuli Du, Kamran Iqbal, Longitudinal seismic response of shield tunnel: A multi-scale numerical analysis, Tunnelling and Underground Space Technology, Volume 138,2023,105163.
- Mohammad Reza Shekari, Seyed Mehrab Amiri, Mohammad Reza Zareifard, A numerical approach for coupled analysis of the seismic response of a cable-moored submerged floating tunnel, Marine Structures, Volume 83,2022,103156,.
- Peng Li, Er-xiang Song, Three-dimensional numerical analysis for the longitudinal seismic response of tunnels under an asynchronous wave input, Computers and Geotechnics, Volume 63,2015,Pages 229-243.
- Andreotti G, Lai C G. Use of fragility curves to assess the seismic vulnerability in the risk analysis of mountain tunnels[J]. Tunnelling and Underground Space Technology, 2019, 91: 103008.
- Fabozzi S, Bilotta E, Lanzano G. A numerical study on seismic vulnerability of tunnel linings[J]. Proceedings of 3rd Performance Based Design in Earthquake Geotechnical Engineering. Vancouver, Canada, 2017: 16-19.
- Moayedifar A, Nejati H R, Goshtasbi K, et al. Seismic fragility and risk assessment of an unsupported tunnel using incremental dynamic analysis (IDA)[J]. Earthquakes and Structures, 2019, 16(6): 705.
Figure 1.
Tunnel cross-section lining ring.
Figure 1.
Tunnel cross-section lining ring.
Figure 2.
Seismic wave acceleration time history.
Figure 2.
Seismic wave acceleration time history.
Figure 3.
Seismic wave velocity time history.
Figure 3.
Seismic wave velocity time history.
Figure 4.
Seismic wave acceleration time history.
Figure 4.
Seismic wave acceleration time history.
Figure 5.
Tunnel Calculation Grid.
Figure 5.
Tunnel Calculation Grid.
Figure 6.
Bending moment envelope of the tunnel under seismic.
Figure 6.
Bending moment envelope of the tunnel under seismic.
Figure 7.
Axial force envelope of the tunnel under seismic.
Figure 7.
Axial force envelope of the tunnel under seismic.
Figure 8.
Time history of tunnel bending moment under seismic.
Figure 8.
Time history of tunnel bending moment under seismic.
Figure 9.
Relative displacement of the top and bottom of the tunnel under seismic.
Figure 9.
Relative displacement of the top and bottom of the tunnel under seismic.
Figure 10.
Time history of tunnel axial force under seismic.
Figure 10.
Time history of tunnel axial force under seismic.
Figure 11.
Deformation of the tunnel under seismic.
Figure 11.
Deformation of the tunnel under seismic.
Figure 12.
Bending moment of the tunnel under seismic.
Figure 12.
Bending moment of the tunnel under seismic.
Figure 13.
Axial force of the tunnel under seismic.
Figure 13.
Axial force of the tunnel under seismic.
Figure 14.
Relative displacement of the tunnel under seismic.
Figure 14.
Relative displacement of the tunnel under seismic.
Figure 15.
Comparison of relative displacement of the tunnel under seismic.
Figure 15.
Comparison of relative displacement of the tunnel under seismic.
Figure 16.
Comparison of bending moment of the tunnel under seismic.
Figure 16.
Comparison of bending moment of the tunnel under seismic.
Figure 17.
Comparison of axial force of the tunnel under seismic.
Figure 17.
Comparison of axial force of the tunnel under seismic.
Table 1.
Soil parameters.
Table 1.
Soil parameters.
| Layer No. |
Thickness (m) |
Unit Weight γ(kN/m3) |
c (kPa) |
φ (°) |
Coefficient of Static Lateral Pressure K0
|
Shear Wave
Velocity Vs (m/s) |
| ① |
2 |
18.4 |
|
|
|
|
| ② |
10.8 |
18.5 |
4 |
29 |
0.4 |
220.4 |
| ④ |
5.5 |
17 |
13 |
10.5 |
0.55 |
161.2 |
| ⑤1
|
3.7 |
17.8 |
14 |
12 |
0.5 |
191.1 |
| ⑤2
|
9.9 |
18.2 |
4 |
28.5 |
0.4 |
194 |
| ⑤3
|
16.7 |
18.2 |
14 |
15.5 |
0.47 |
195.1 |
| ⑧ |
21.4 |
18.4 |
20 |
17.5 |
0.47 |
320 |
Table 2.
Parameters of reinforced concrete segment.
Table 2.
Parameters of reinforced concrete segment.
| Material |
Elastic Modulus (MPa) |
Poisson's Ratio |
| C50 Concrete |
3.45E+4 |
0.18 |
Table 3.
Requirements for grid size.
Table 3.
Requirements for grid size.
| Material |
Maximum Frequency of Seismic Waves (Hz) |
Shear Wave Velocity (m/s) |
Maximum Grid Size (m) |
| ② |
15 |
220.4 |
1.84 |
| ④ |
161.2 |
1.34 |
| ⑤1
|
191.1 |
1.59 |
| ⑤2
|
195.1 |
1.62 |
| ⑤3
|
195.1 |
1.63 |
| ⑧ |
320 |
2.67 |
Table 4.
The extreme values of internal forces in tunnels.
Table 4.
The extreme values of internal forces in tunnels.
|
169°
(Maximum
Positive Moment) |
253°
(Maximum
Negative Moment) |
249°
(Maximum Axial Force) |
343°
(Minimum Axial Force) |
Maximum
bending moment(kNm)
|
77.43 |
-38.94 |
-30.81 |
70.61 |
Minimum
Bending Moment
(kNm)
|
55.07 |
-83.98 |
-83.69 |
30.89 |
Conventional
bending moment(kNm)
|
65.49 |
-58.48 |
-53.98 |
47.80 |
Maximum rate of change of
bending moment
|
18.2% |
43.6% |
55.0% |
47.7% |
Maximum
axial force (kN)
|
693.50 |
740.40 |
741.90 |
651.10 |
Minimum
axial force (kN)
|
677.85 |
717.55 |
715.35 |
629.00 |
Conventional
axial force (kN)
|
690.60 |
722.30 |
722.25 |
643.90 |
| Maximum rate of change of axial force |
1.8% |
2.5% |
2.7% |
2.3% |
|
Disclaimer/Publisher’s Note: The statements, opinions and data contained in all publications are solely those of the individual author(s) and contributor(s) and not of MDPI and/or the editor(s). MDPI and/or the editor(s) disclaim responsibility for any injury to people or property resulting from any ideas, methods, instructions or products referred to in the content. |
© 2024 by the authors. Licensee MDPI, Basel, Switzerland. This article is an open access article distributed under the terms and conditions of the Creative Commons Attribution (CC BY) license (http://creativecommons.org/licenses/by/4.0/).
