1. Introduction
In the past three centuries, numerous irrigation canals and embankments have been proposed as means to utilize a variety of water for agricultural, industrial, domestic, and drainage purposes, especially in the Lower Chao Phraya plain area in Bangkok, Thailand. Pavement structures have been implemented in several nations to renovate the surfaces of these embankments in order to accommodate the increased transportation demands caused by urbanization. It is observed that the number of embankment failure cases has been increasing in the past few decades. Numerous scholarly works have investigated and determined the cause of the embankment's instability problems. Certain sources disclose that the primary cause of embankment failure may be the abrupt decline in water level in canals [
1,
2]. However, some scholars concluded that potential failure causes may include a mix of factors, including the volume of traffic loading and dredging, as well as the summertime decline of the canal's water level [
3,
4].
Nanthannanthan (1998, 2005) [
3,
4] examined several cases of the aforementioned factors through analysis using the Limit Equilibrium Method (LEM). However, in their study, traffic loading was assumed to be surcharge loading, and the water level difference was considered to be able to trigger a half reduction in the factor of safety. Sanmuang (2020) [
5] determined that the impact of cyclic rapid drawdown can reduce the factor of safety by approximately 0.05 percent to 0.10 percent per round. The present work utilizes the finite element method (FEM), limit equilibrium method (LEM), and probabilistic method to examine the changes in stress-strain soil behavior and their resulting implications. Although the variability in water level could significantly diminish the safety factor, a vehicle's cyclic loading might result in permanent strain and excessive pore water pressure, which could result in the embankment instability. Wilson and Greenwood (1974) [
6] conducted an investigation on the lacustrine clay subjected to repetitive loading. The cyclic magnitude was defined as the point at which it surpassed the undrained shear strength of the soil and did not surpass it. Wilson and Greenwood (1974) [
6] indicated that if the number of repetitive loads falls below the strength of the soil, axial strain and excess pore water pressure will be generated sharply in the initial stage, followed by the establishment of equilibrium without failure. Aside from that, the soil exhibits the same behavior as stated previously when subjected to cyclic stresses; subsequent to that, eventual failure will occur [
6]. However, there is disagreement among a number of scholars about the notion that soft clays and peats with an undrained shear strength ranging from 60% to 91% might cause failure; this cycle stress at failure is referred to as threshold stress [
7,
8,
9,
10,
11,
12]. This study provides a guarantee that failure mechanisms can be induced by soft soil in a cyclical setting.
Progressive shear failure, also known as common subgrade failure, is also one of the potential modes of embankment failure caused by repetitive vehicle axle load. The failure mechanism may arise due to the significant magnitude of the cyclic axle loading, which can squeeze the soft soil foundation layer laterally and cause it to lose its bearing capacity [
8,
13]. An extensive body of research has been devoted to examining the impact of cyclic loading on soft clay. The dynamic triaxial approach enables the simulation of different cyclic loading levels and load frequencies using the cyclic stress ratio (CSR) to determine the permanent and excess pore water pressure [
8,
11,
12,
13]. Additionally, to generate a repetitive load pattern on the soil specimen, the traffic loading can be simplified into a continuous haversine movement function [
14,
15], and some suggested that it can be simplified to the sinusoidal formula [
8,
11,
13,
16]. To forecast the axial strain trends at a specific period, Li and Selig (1996) [
17] proposed an empirical method for determining total axial strain, from which various dynamic triaxial test results with a given CSR and frequency could be extracted in order to calculate the regression equation [
13]. This method enables the prediction of axial strain trends at a given period. Furthermore, a two-dimensional (2D) finite element method (FEM) was employed to analyze the short-term deformation and plastic zones of the railway embankment subjected to the train axle load. The constitutive models utilized were the Mohr-Coulomb (MCM) and Hardening Soil Models (HSM). The findings of this investigation indicated that train axle loading could potentially lead to a decrease in the factor of safety [
18,
19].
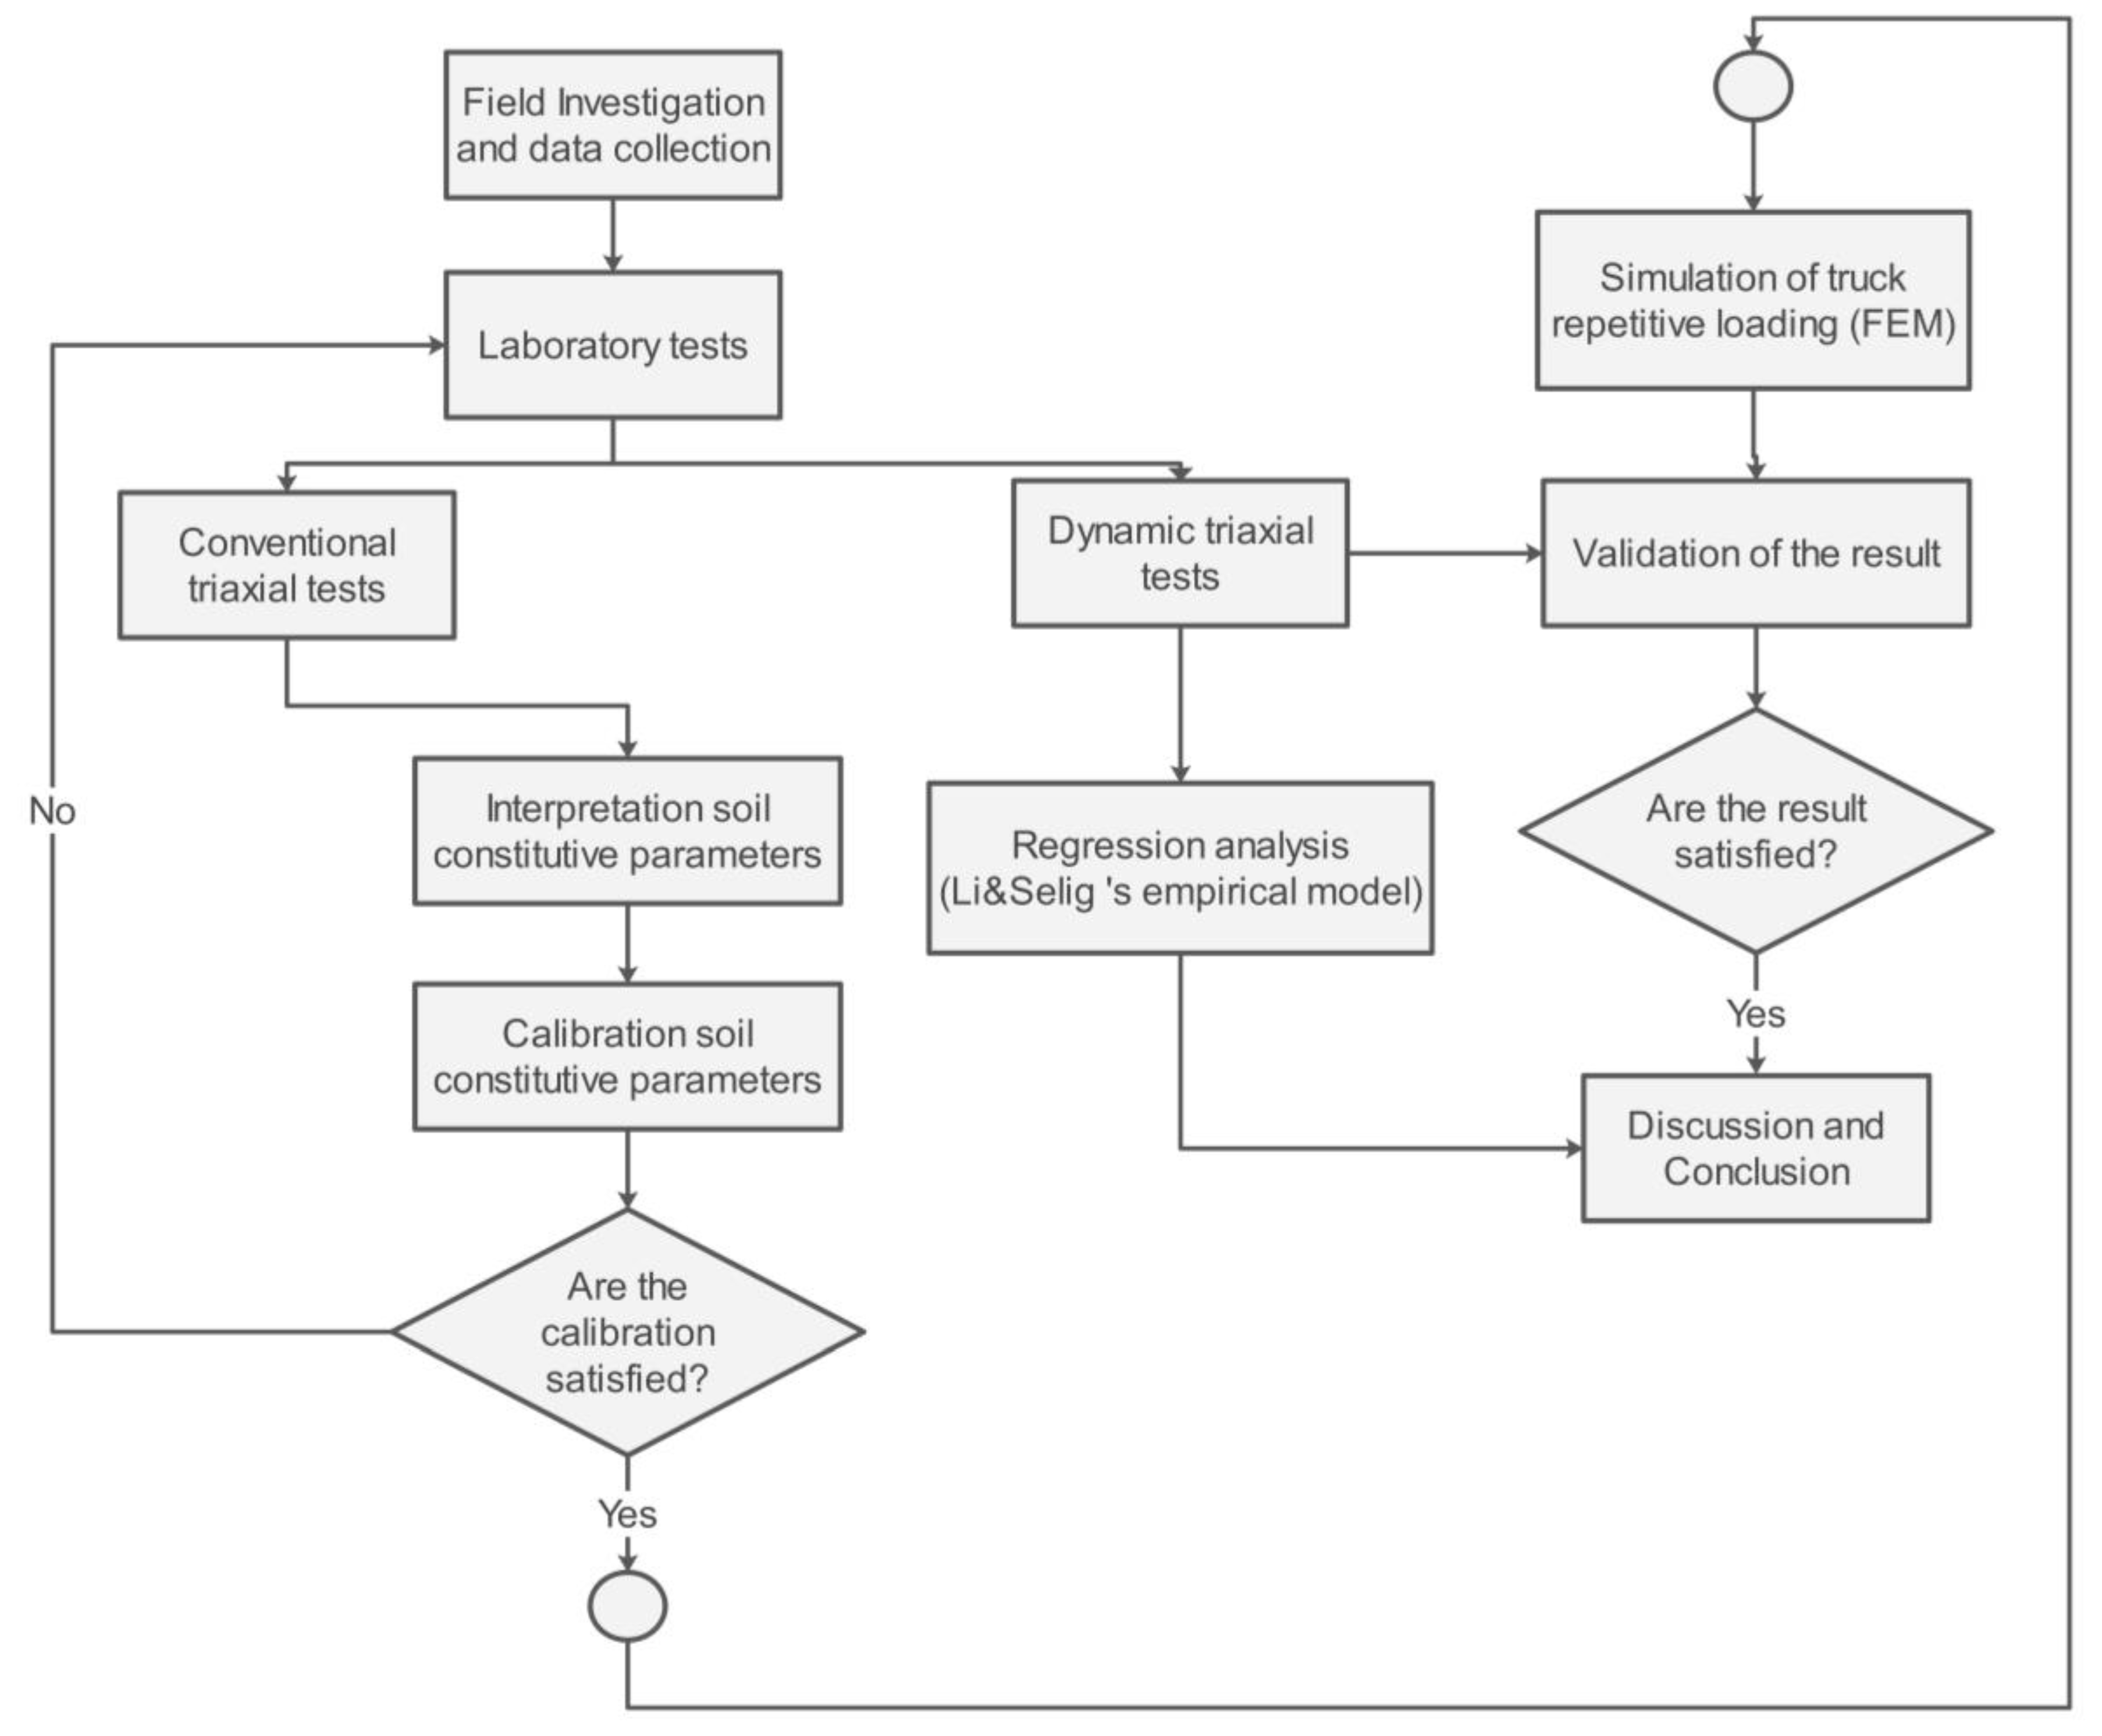
Dynamic triaxial experiments and conventional experiments were conducted in this study to assess the stability of the embankment founded on the Bangkok soft clay. The two-dimensional (2D) finite element technique (FEM) was utilized to simulate repetitive loading in haversine patterns at varied CSR and frequencies (50,000 cycle lengths). In order to estimate the long-term permanent deformation, the laboratory results were examined using a hybrid regression technique and Li and Selig's empirical framework. In addition, the laboratory results were used to calibrate and validate the soft soil constitutive models. The general methodology used in the study is illustrated in
Figure 1. The methodology consists of field investigation and data collection, laboratory tests (conventional and dynamic triaxial tests), and finite element methods for simulating the impact of traffic loading. Additionally, an empirical predicted total axial strain model with regression technique was employed to accurately capture and predict the total axial strain under specific cycle numbers and magnitudes of repeated loading. Details of each stage are provided in the following sections.
2. Literature Review
2.1. Geotechnical Characteristics of Bangkok Soft Clay
The fluctuation of sea level over the Holocene geologic era (5,000 to 3,000 years ago) has periodically impacted the deposition of the Bangkok soft clay in the lower Chao Phraya plain area; the height of the plain ranges from 0.00 to 2.00 meters above mean sea level [
20,
21,
22]. Between the middle and late Holocene, the Coriolis force caused the Bangkok soft clay to varying in thickness from 0 to 20 meters. The border and classification map of the different thicknesses of the Bangkok soft clay is illustrated in
Figure 2. According to Amornkul (2010) [
23], the soil may be divided into six distinct zones. Zone A to Zone D soft clay thickness is less than 15 m. Aside from that, zone E and F, situated on the eastern and western peripheries near the Gulf of Thailand, have the greatest thickness at over 15 meters.
2.2. Shear Strength Characteristics of Bangkok Soft Clay
Various methods exist for estimating the undrained shear strength of clay (
) under static loading conditions. Among these, the field vane shear strength test (FVT), unconfined compressive strength (UCS), direct shear test (DSS), and triaxial test are the most often used techniques. The initial pioneering investigation to examine the shear strength properties of the Bangkok soft clay from the Rangsit region using the consolidated undrained (CU) triaxial test was conducted by Moh et al. (1969) [
24]. The present investigation identifies four primary strata comprising the soft profile: the weather crust zone (OCR = 5 - 15), soft clay (OCR = 1), stiff clay (OCR = 2 - 5), and sand and gravel layers, in that order. The hardening response of the soft clay is evident in the stress and strain relationship during all test periods; the strain at failure is between 4 and 6 percent of the axial strain, and the Bangkok soft clay under triaxial environment test demonstrated no cohesion (
) and total and effective frictional angles (
) of 20°- 26° [
24,
25].
Notwithstanding the existence of numerous publications detailing the monotonic shear strength properties of soft clay, it is imperative not to overlook the behavior of soft clay when subjected to cyclic loading. Matasovic and Vucetic (1992) [
26] simulated dynamic loading on a variety of clay samples with OCR ranging from one to four and examined the observed behavior of the NC and OC clay samples. In the case of the NC clay, it is evident that the soil exhibits contractionary behavior across the entire period, leading to an increase in positive surplus pore water pressure [
7,
8,
9,
10,
11,
12,
13,
26]. On the contrary, soil that has undergone substantial over-consolidation (OCR ≥ 4) experiences dilation during many cycles, indicating negative pore water pressure formation.
2.3. Conventional and Dynamic Triaxial Approaches
2.3.1. Consolidated Undrained (CU) Triaxial Test
During that whole phase, the consolidated undrained (CU) triaxial test is executed using a framework consisting of three primary stages: saturation, consolidation, and shearing [
27,
28,
29]. During the stage of soil sample saturation, numerous options for soil saturation are feasible. The back pressure method is the prevailing and customary approach for achieving complete saturation of clay specimens. One crucial approach for monitoring the level of saturation is B-checking, which is performed using the coefficient B of Skempton's equation [
30]. In addition, the average B-values for soft and medium clay are near one (B
0.95), and the maximum B-value for stiff clay is approximately 0.91 [
28].
Following the completion of the saturation phase, the consolidation stage ensues in order to minimize the effects of soil sample dilatation. At this point, the confined pressure is often applied using either the Shansep or Recompression techniques. Bjerrum (1973) [
31] introduced the recompression technique [
31], which eliminates the expansion effect of soil by applying pressure corresponding to the overburden pressure carried by the soil in situ. In contrast, the Shansep technique was suggested for clay, which demonstrated normalized behavior; the consolidation pressure applied is between 1.50 - 4 times the maximum past pressure (
) [
28,
32]. Subsequent to that, Seah and Lai (2003) [
33] found that the recompression technique yielded an undrained shear strength that was approximately 30 percent greater than that of the Shansep technique. In addition, the volumetric strain (%) and the square root consolidation time (
) can then be obtained and plotted at specific times, which correspond to 50% (
)and 100% (
) of the primary degree of consolidation, respectively, in order to assess the rate of shearing in the subsequent phase [
34].
The soil specimen is subjected to shear loading as the final step; the strain rate, specifically pore water pressure, is the most critical control factor for acquiring a reliable result. The utilization of a rapid strain rate to apply force to the specimen may impede the dispersion of excess pore water pressure throughout the specimen, hence potentially compromising the reliability of the obtained result. In order to ascertain the dependable shearing rate, the strain at failure percentage (
) has been specified. However, several recommendations exist on the typical values of strain at failure. Head (1998) [
27] suggests that the strain for typically consolidated undisturbed clay (NC clay) falls within the range of 15 to 20 percent (CU test). Furthermore, the magic figure for the loading rate is around 0.0166 percent per minute (1%/hour) [
34], while the essential results of the CU test consist of the stress – strain response, strain – excess pore water pressure relationship, Mohr-circle diagram, and stress path. The basics and fundamentals of these diagrams can be followed in [
35,
36].
2.3.2. Dynamic Undrained (DU) Triaxial Test
The essential protocols for this examination are identical to those outlined in
Section 2.3.1 regarding the CU examination. Nevertheless, the vylastic sleeve modifies the contraction between the extension top cap and the specimen top cap to let the soil specimen be subjected to the entire dynamic stress [
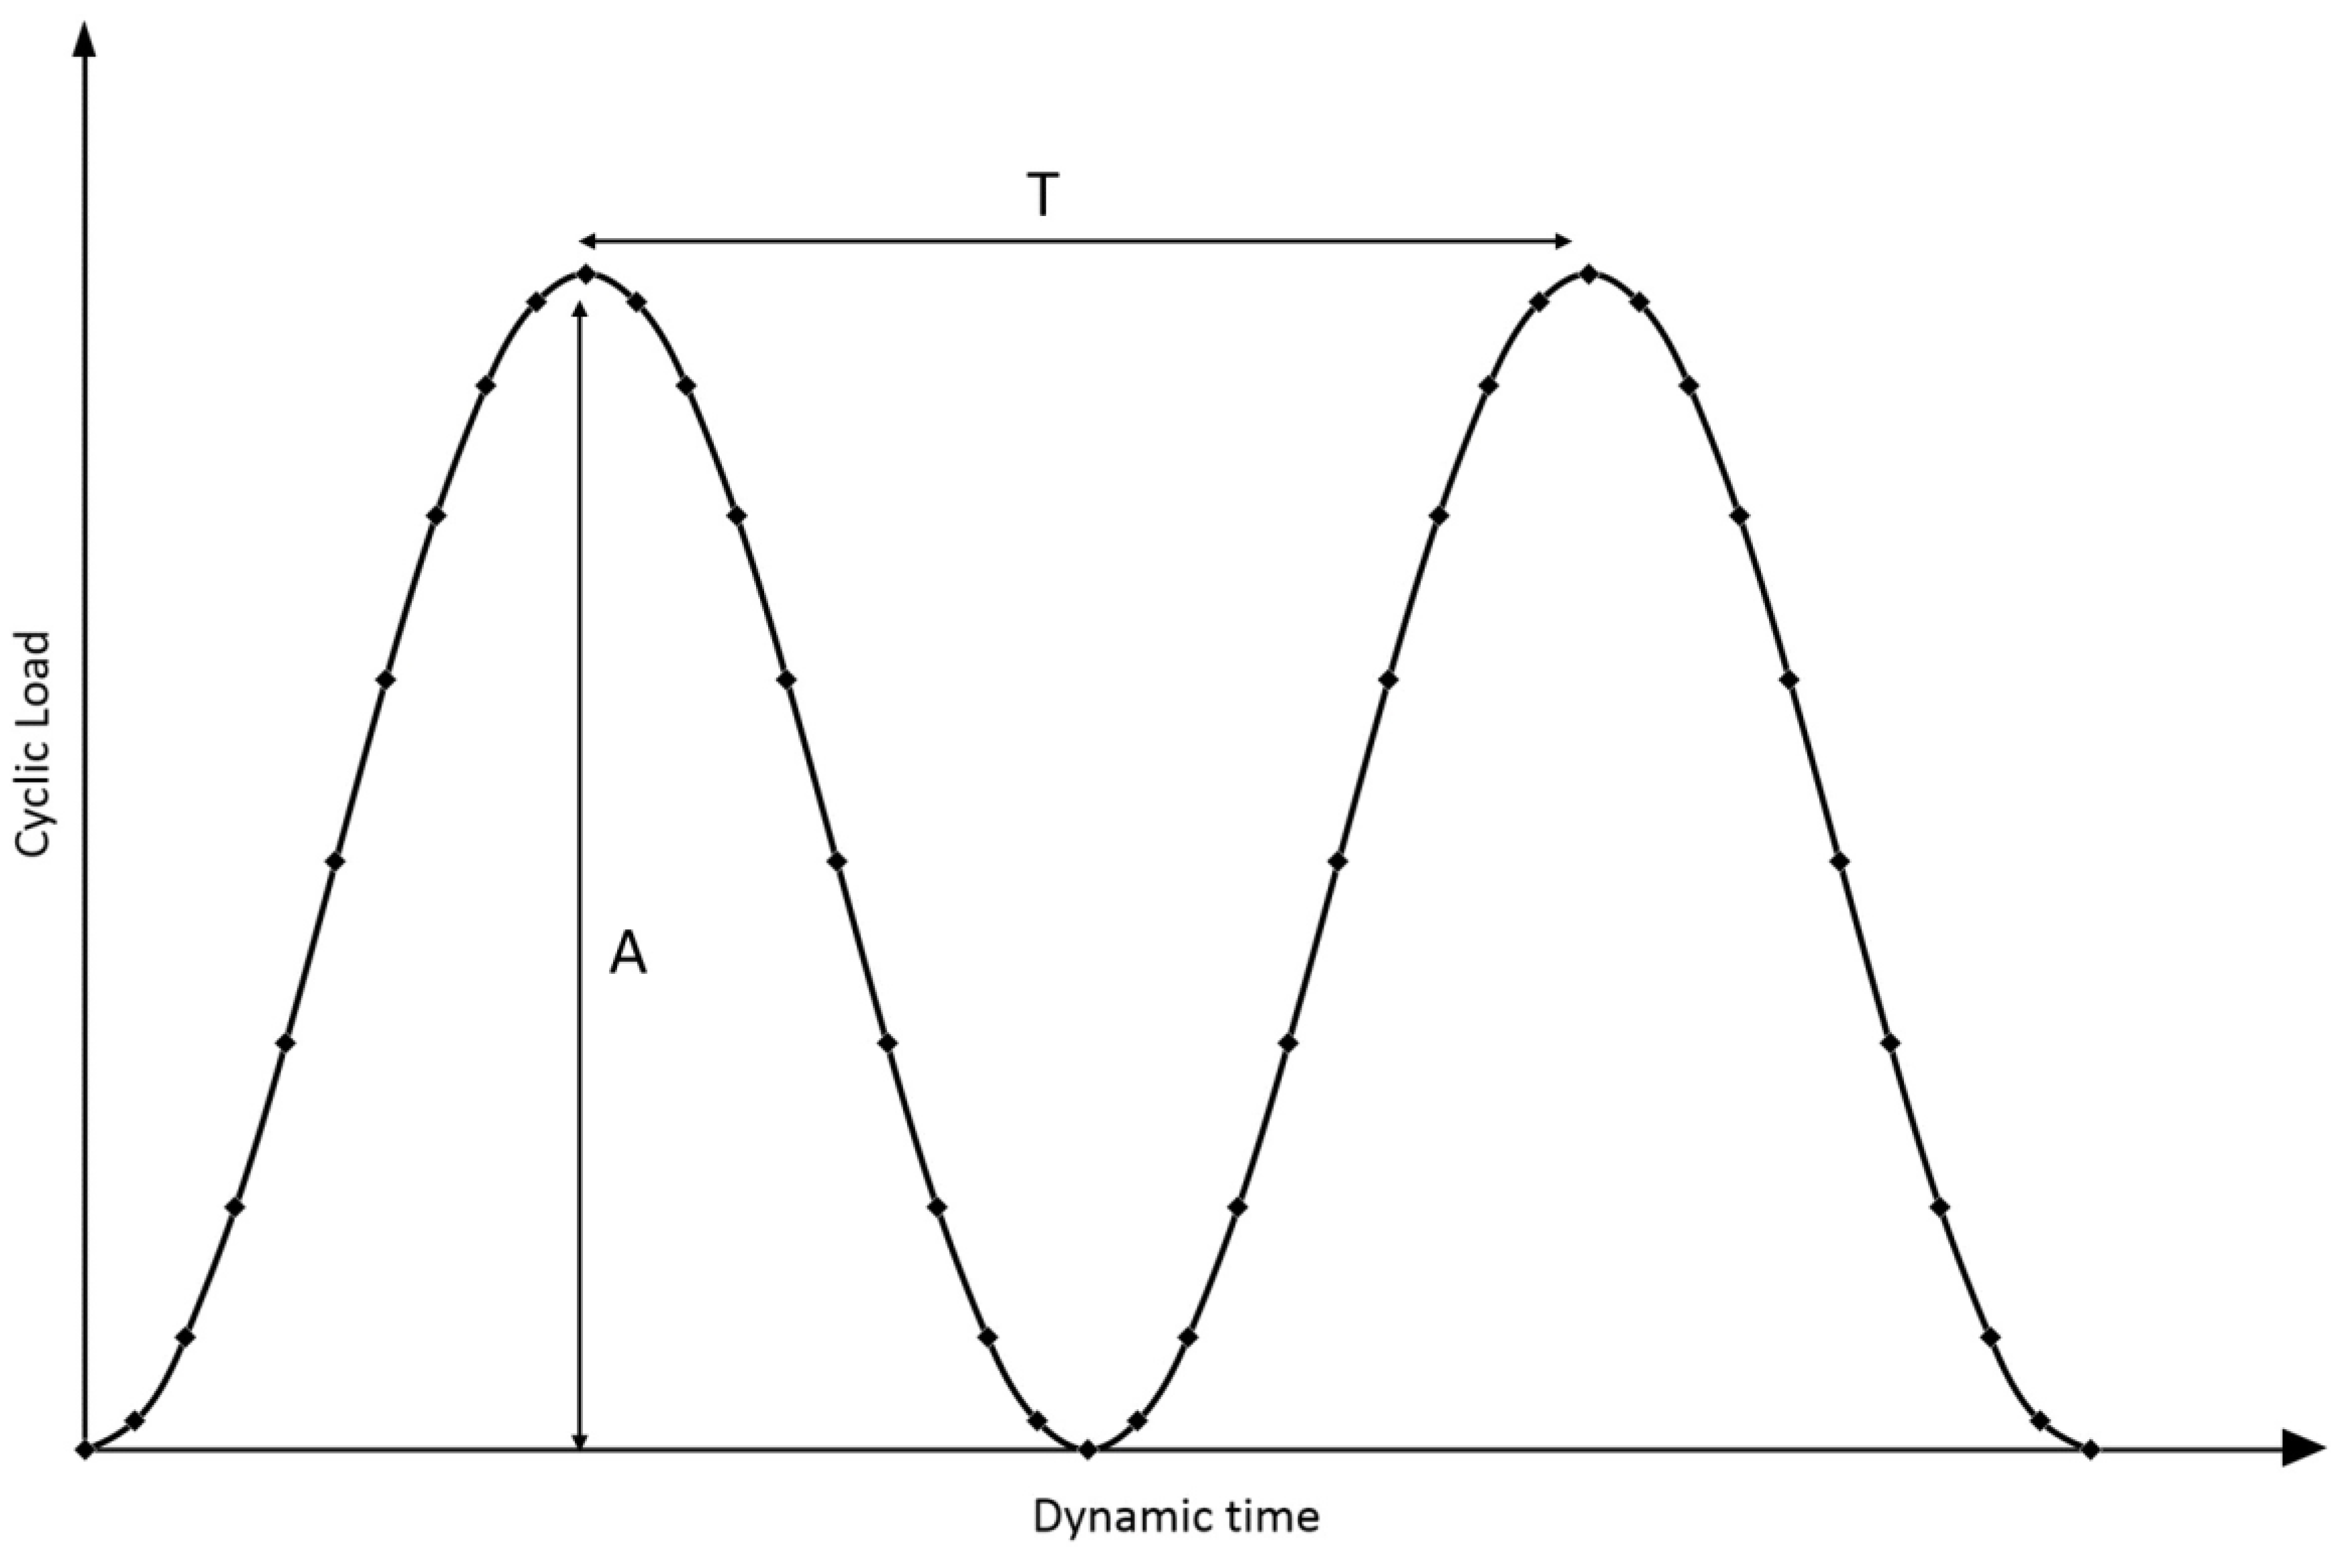
16]. The magnitude and number of cycles of the cyclic loading delivered during the shearing stage have been predetermined prior to conducting the test. As previously stated, the cyclic load pattern is often represented as the sinusoidal functions and is presented in
Figure 3. Numerous researchers have investigated the amount of cyclic load. The distribution of stress on the subgrade was examined by Owende et al. (2001) [
37]. The tire pressures applied by the truck exhibited a range of 350 Kpa to 770 Kpa. The subgrade is subject to forces ranging from 20 to 40 Kpa. While Lu et al. (2018) [
38] argued that dynamic stress distribution on subgrade is approximately 10%- 25% of stress value [
37]. The load frequency can be ascertained by examining the ratio between the length of the vehicle and its velocity (Kph) [
11,
13,
39,
40].
Based on the traffic loading characteristics, it is possible to hypothesize that the position of the wheel load determines the direction of the maximum principal stress in the soil, and that the direction of the greatest principal stress is influenced by the location of the wheel load [
10]. As previously stated, the highest limit of the stress-strain response under repeated loading is the soil's threshold stress. The threshold stress can be determined using a cyclic stress path diagram (P'-q diagram) by the intersection point between the cyclic path and critical state line (CSL) [
8,
11,
13]. The behavior of soft soil subjected to cyclic loading, while remaining below the threshold stress can be readily categorized into two typical soil responses, as described in references [
6,
12,
41,
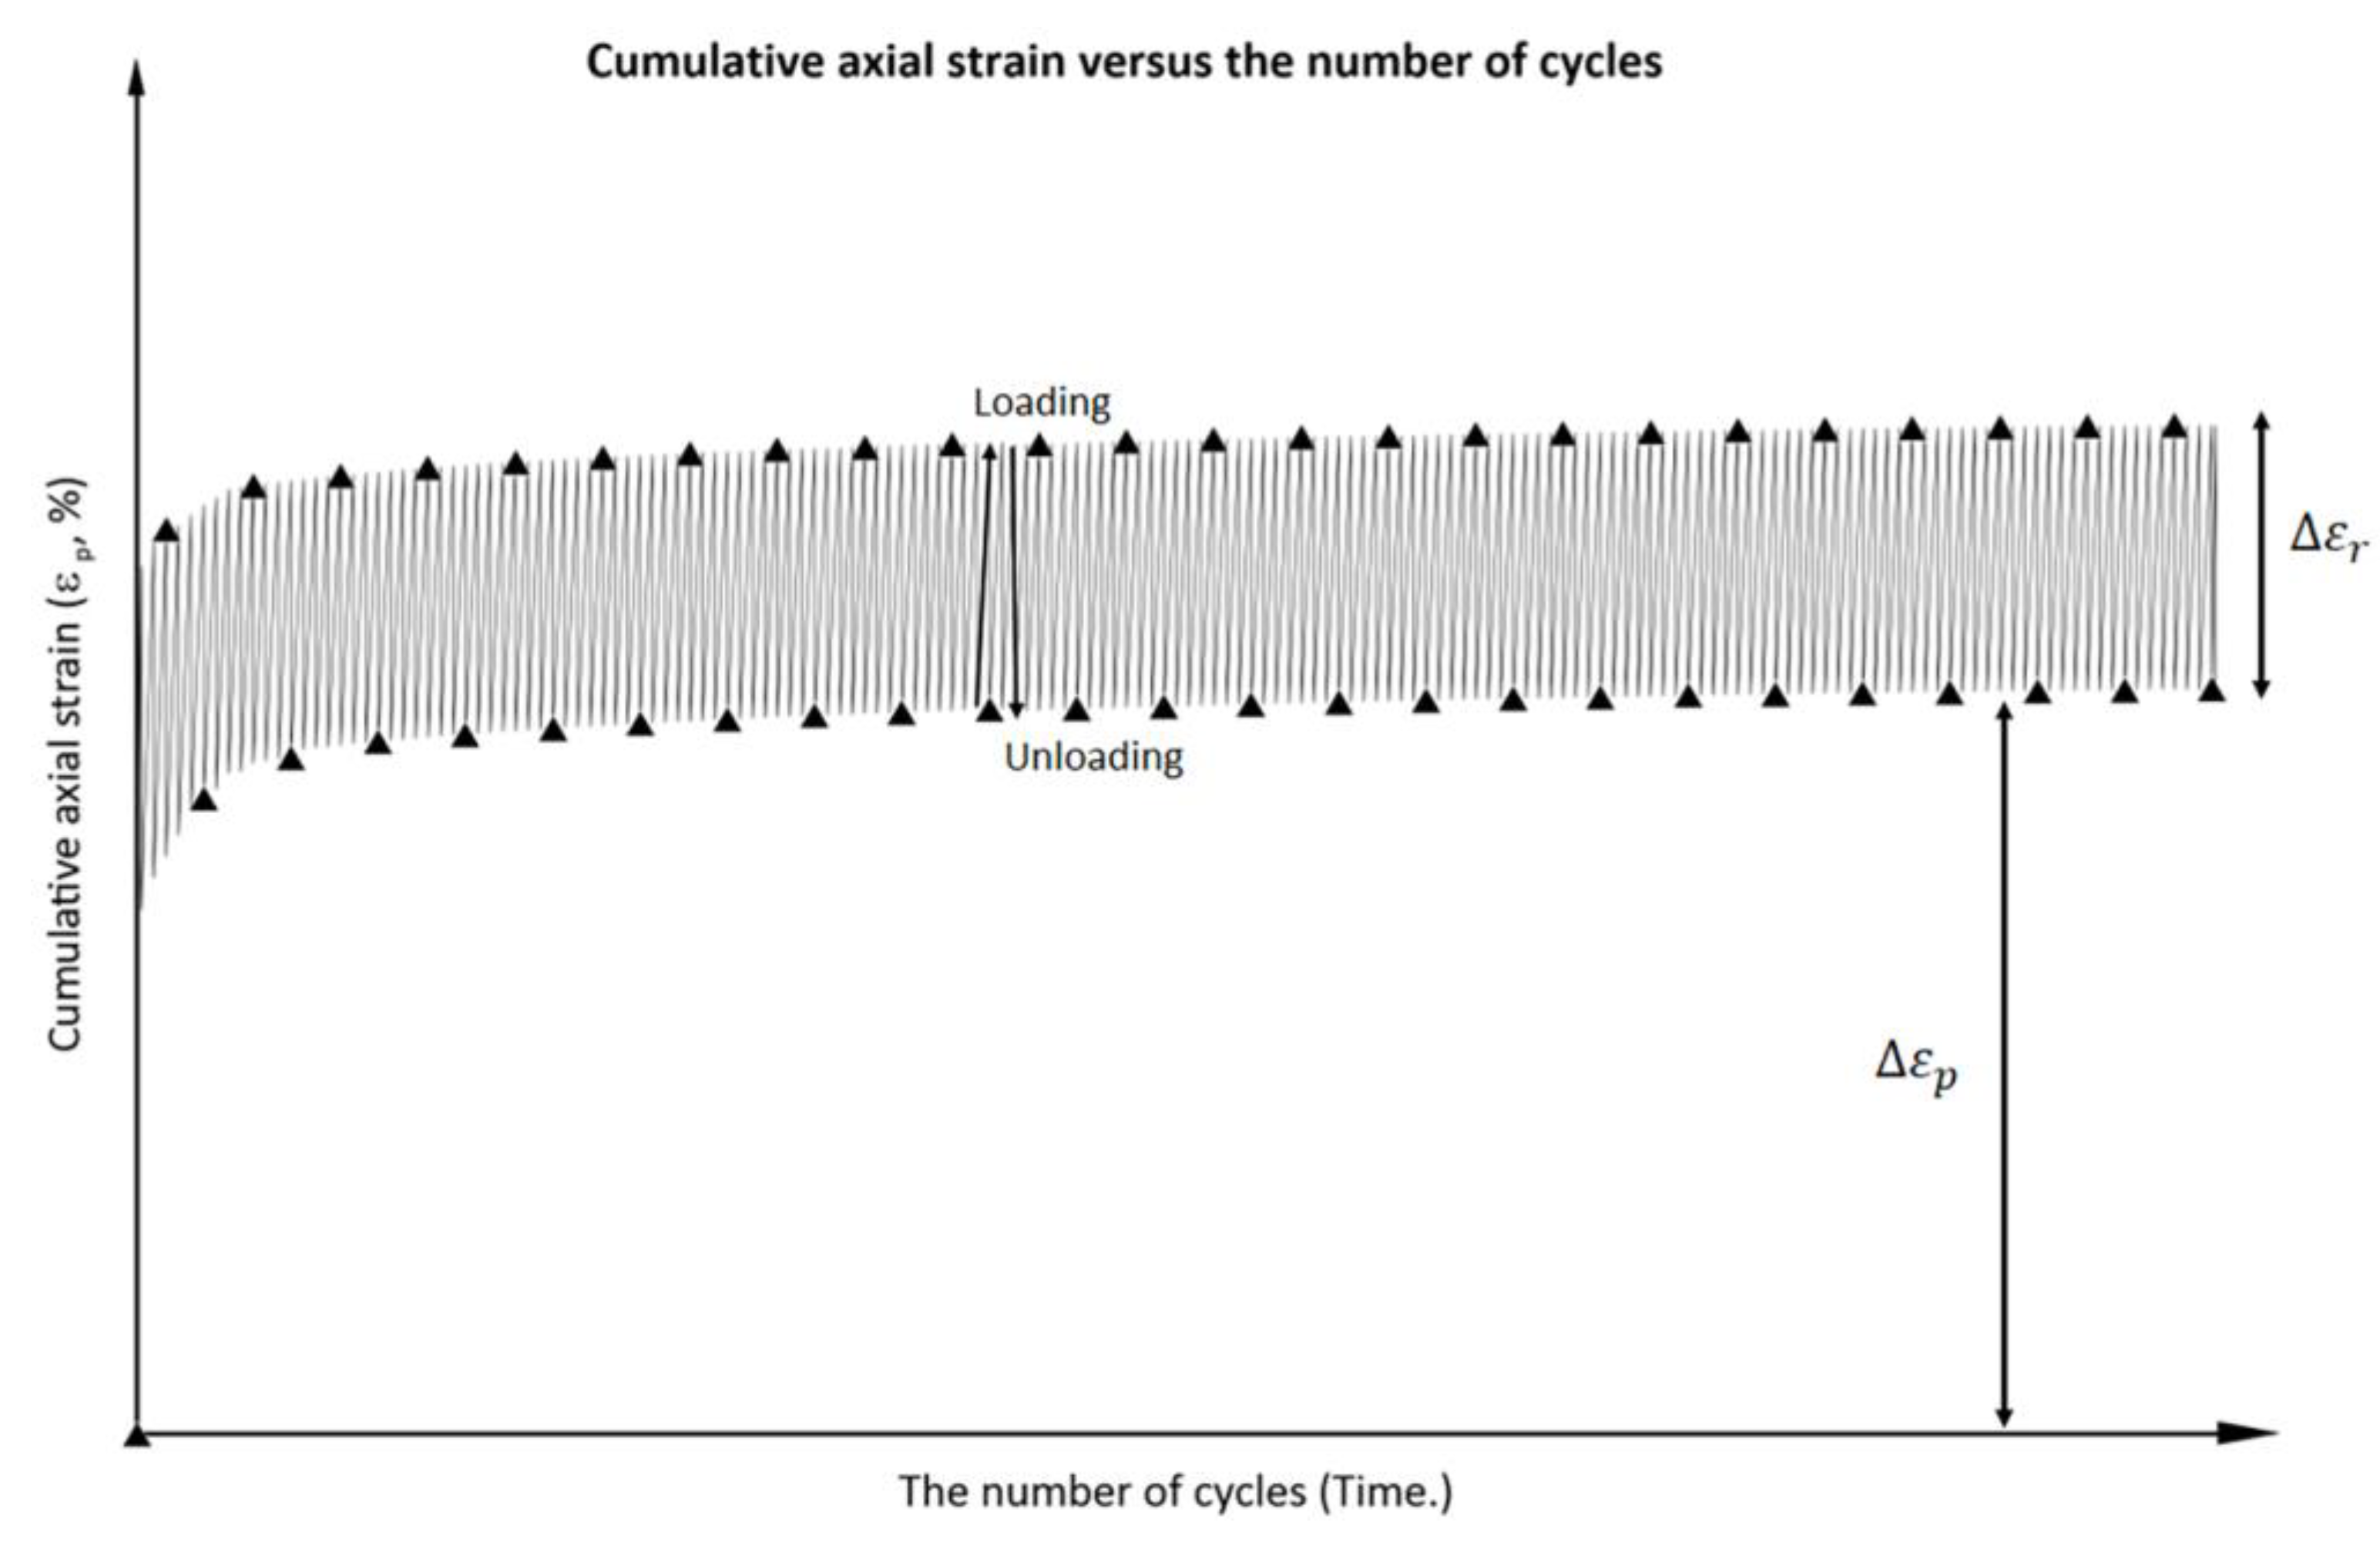
42]. The initial finding of the cyclic triaxial test was the presence of plastic non-recoverable strain (
), the test result indicates the resilient strain (
) where are the increased pore water pressure created in the soil exhibits identical behavior to the strain response and the parameters in their entirety are illustrated in
Figure 4. The mode of the failure can be discussed in [
12] namely shear failure, Liquefaction, and flow deformation via the typical the plot against between axial strain and the number of cycle. By using the cumulative strain empirical model (Power model), which was introduced by Li and Selig (1996) [
17], one may analyses the strain and cycle count in accordance with the equation provided (1). Regression is the foundation of the practical analysis method.
Where: is the cumulative plastic strain,
N is the number of repetitive loads,
a, b, and m result from the regression analysis,
and are cyclic stress and monotonic stress, respectively.
2.4. Previous Study for Embankment Failure under Vehicle Load
The mode of embankment slope failure could be categorized as local failure, surficial failure, general slope failure, and deep seat failure [
43,
44]. In regard to the failure mode under repetitive loading, Loh (2011) [
8] and Selig and Waters (1994) [
45] discovered that progressive shear failure can occur in embankments. This occurs due to the fact that additional pore pressures accumulate during each loading cycle and cannot be completely recouped after each unloading. As a result, the soil's shear resistance is diminished. One of the most effective approaches for assessing the effects of vehicle repeated loads on an embankment situated on a soft clay base is the utilization of the finite element method (FEM). According to Eberhardt (2017) [
46], Essat (2018) [
47], and Potts and Zdravković (2001) [
48], the approach utilized in soil and rock mechanics problems is founded on continuum mechanics and can be likened to a computational method. The underlying principle of this approach is the material's discretization into minute, surface-connected components.
Mohr-Coulomb soil constitutive model (MCM) is one of the simplest soil constitutive models; it shows completely plastic behavior (bilinear stress-strain curve), and its yield surface is a three-dimensional hexagonal surface; further information is available in [
47,
48]. But besides being a widely used constitutive model for soil, the MCM has been subject to criticism in numerous works due to its inability to reproduce very stiffness at low strain concentrations, which leads to an underestimation of the strain [
49,
50]. One potential soil constitutive model that may yield more dependable outcomes is the Hardening Soil Model (HSM). According to a study by Obrzud and Truty (2018) [
50], the soil is expected to exhibit perfect elasticity under low-pressure conditions. Within this strain range, soil may demonstrate a nonlinear connection between strain and stress. For further information on HSM, please refer to references [
49,
50].
Additionally, the Modified Cam Clay soil model (MCC), which is the most robust model based on the critical state theory and consolidation of soil mechanics, is an additional dependable soil constitutive model. The Modified Cam Clay model utilizes this critical state line (CSL) as a failure line, given that it is similarly influenced by the mean effective primary stress. Furthermore, the parameter M determines the ellipse's shape; specifically, the value of the coefficient of lateral earth pressure (
) under normal-consolidated one-dimensional compression conditions is dependent on the height of the ellipse. A measure of the pre-consolidation pressure (
) establishes the breadth of the ellipse [
49]. For further details, please refer to this reference. To ensure the reliability of the analysis result can be trusted, the soil parameter can be calibrated before the numerical simulation begins. Surarak et al. (2012) [
51] and Obrzud and Truty (2018) [
50] conducted the calibration of the HSM, based on the single element technique and then made comparisons between the relationship of stress – strain, excess pore water pressure- strain, and stress path from finite element software and actual laboratory results.
Moreover, there are several publications publishing the Bangkok soft clay parameters with various soil constitutive models [
51,
52,
53,
54,
55,
56,
57], whereas the flexible pavement components finite element parameters are proposed by Mulungye et al. (2007), Leonardi et al. (2017), and Karatağ et al. (2018) [
58,
59,
15]. Likitlersuang et al. (2018) [
19] speculated that the strength reduction algorithm be utilized to analyze the train traffic loading on the railway embankment situated on the Bangkok soft clay. They intended to develop ground improvement strategies for the soft clay foundation and ascertain the factor of safety in the short term. It was postulated that the train systems experienced static loading due to the traffic.
3. Site Information and Field Data Collection
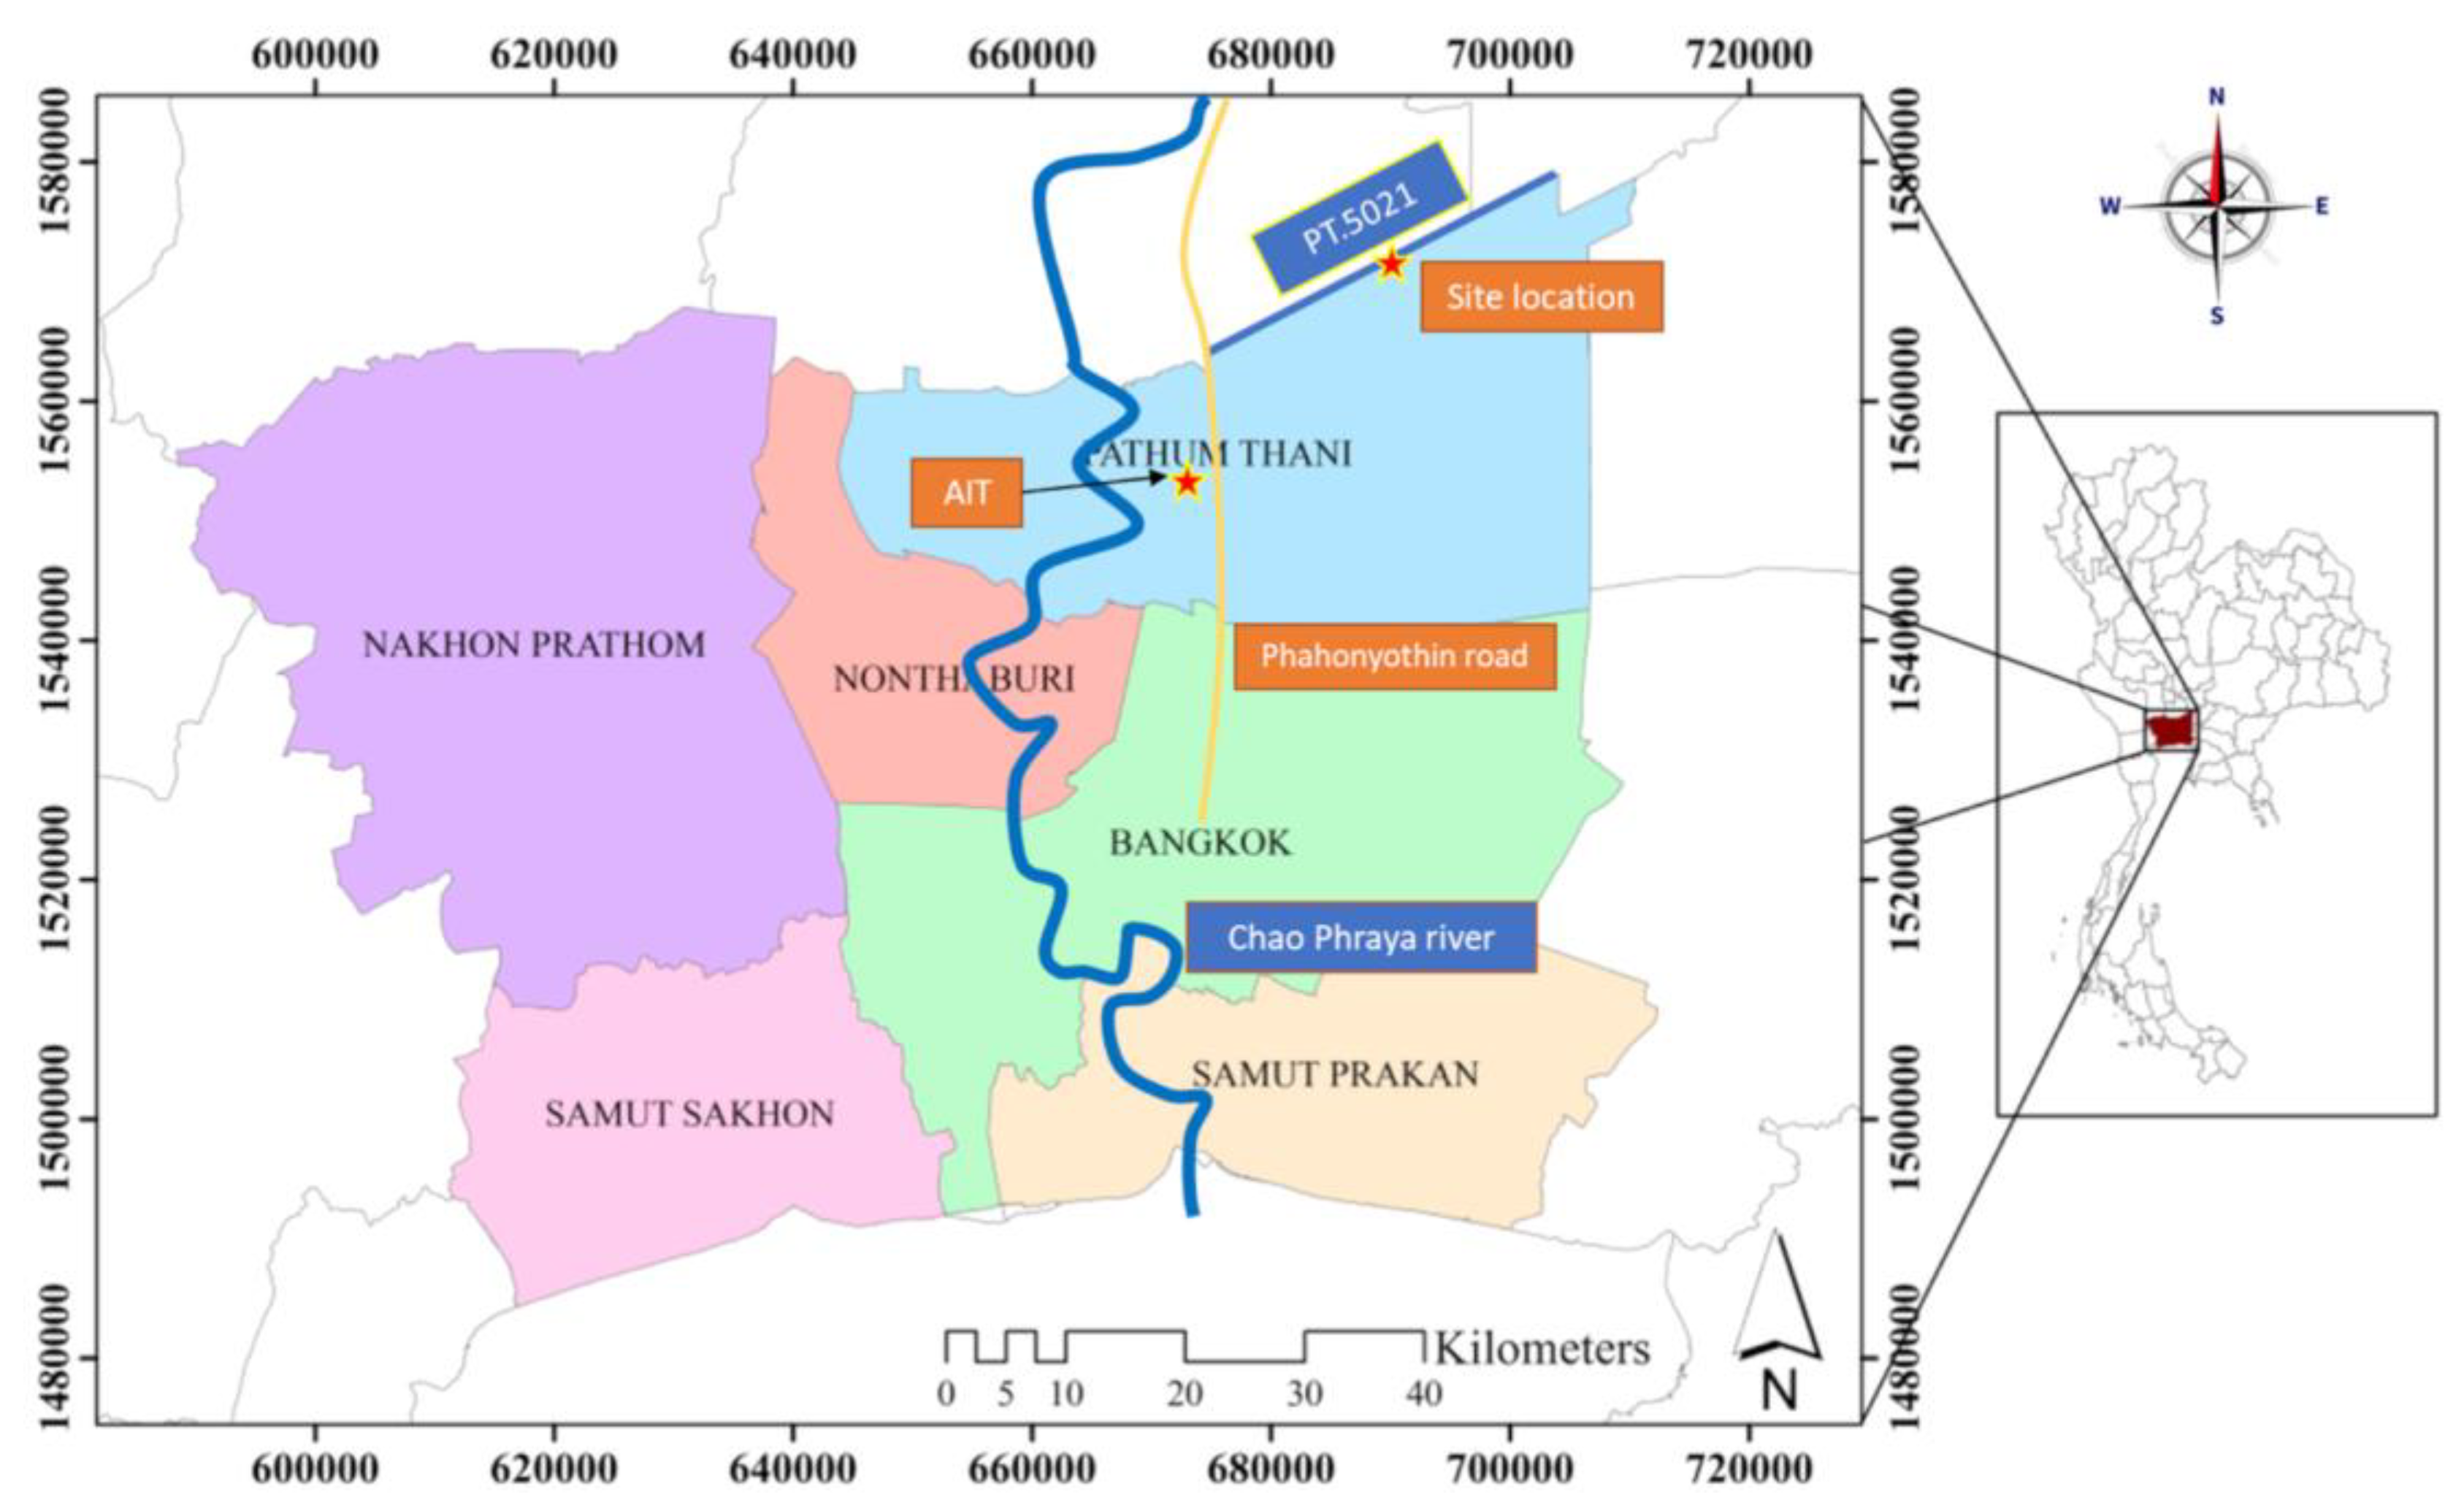
The project site is located between Sta.16+100 and Sta.17+600 on rural road No. PT-5021 in Pathumthani province, Thailand, as shown in
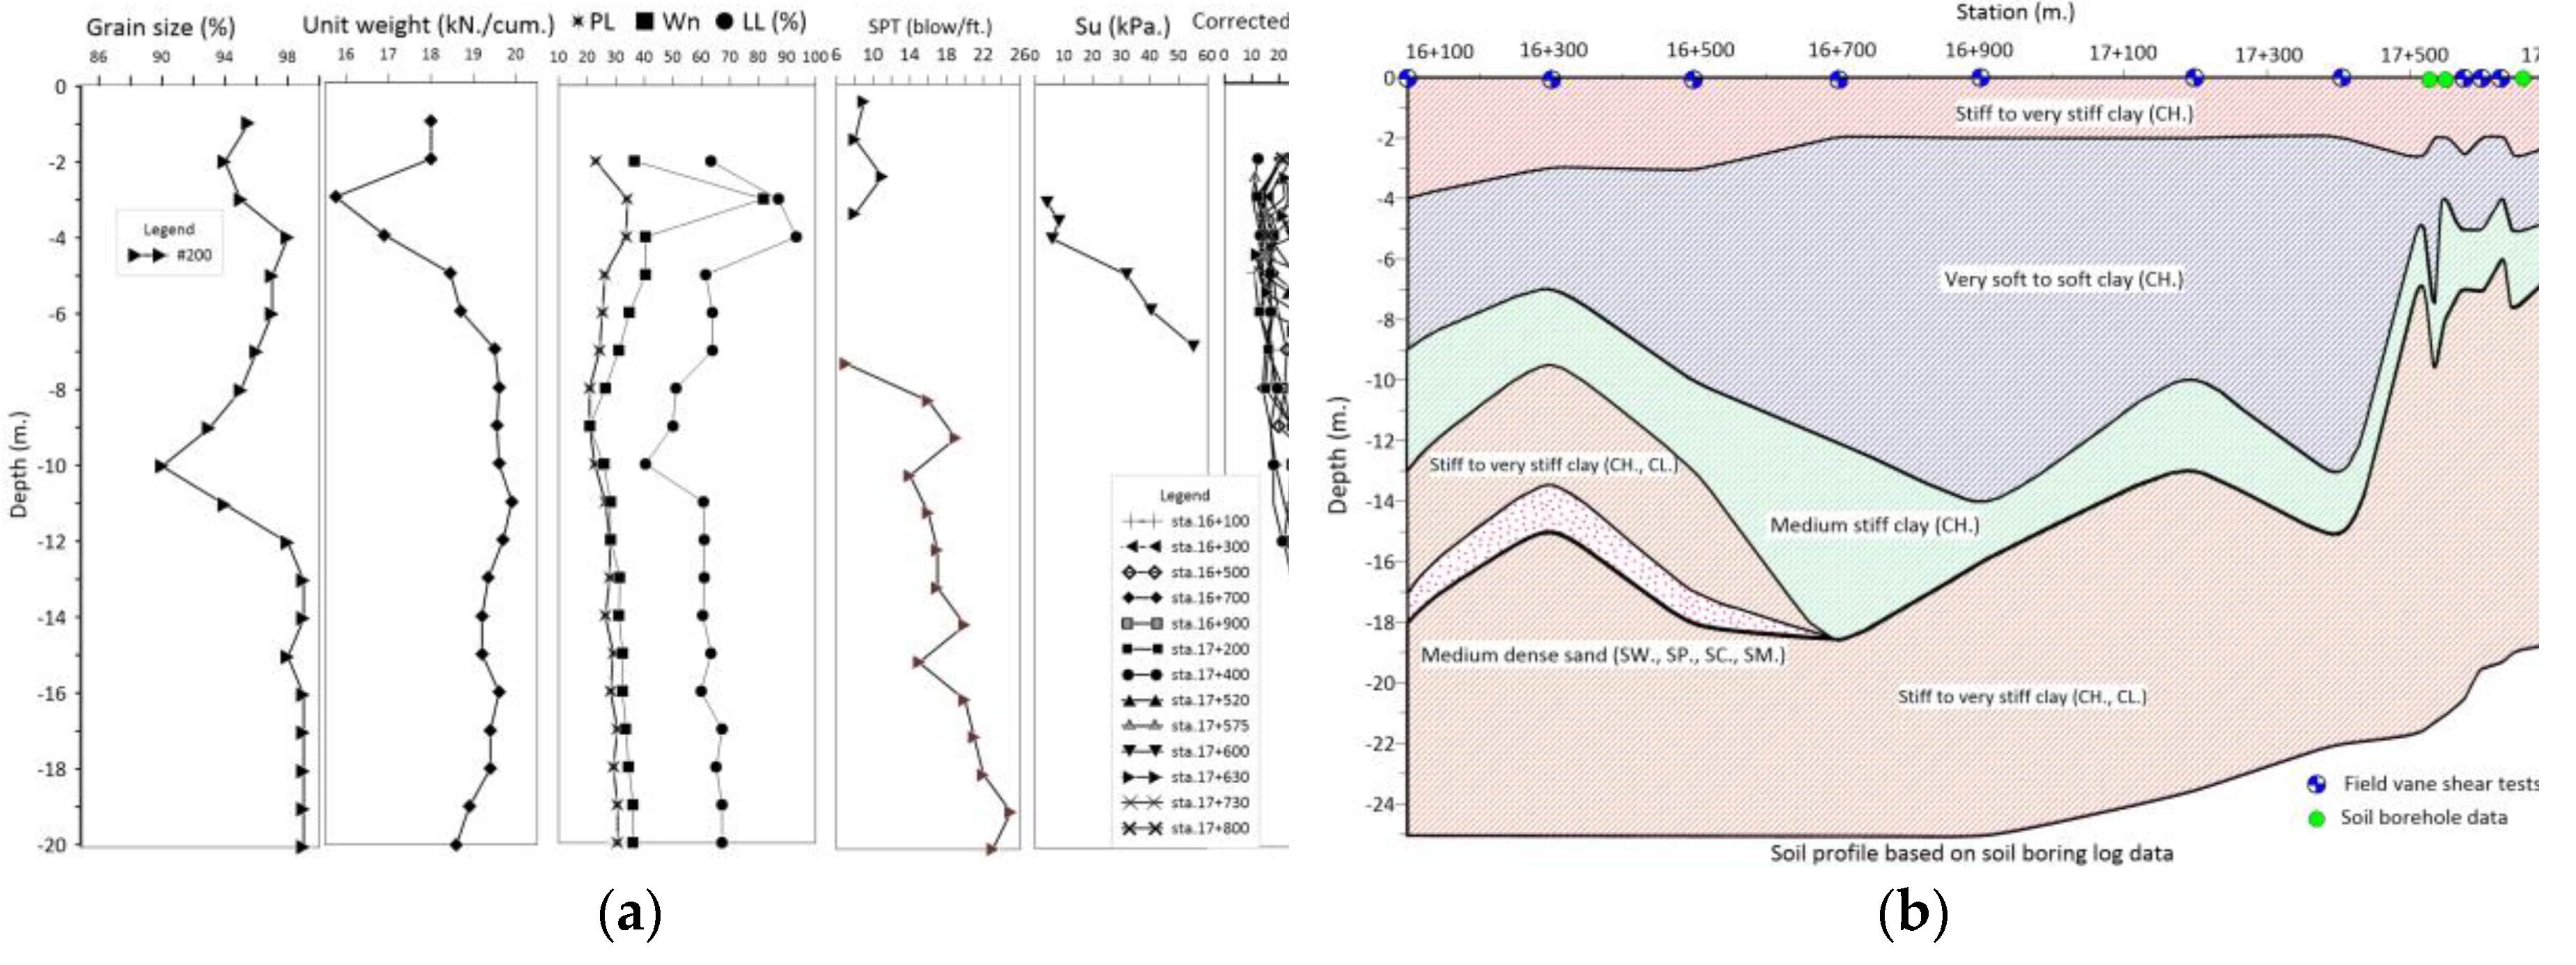
Figure 5. The deep seat failure was witnessed between stations 17+475 and 17+525. Field vane shear testing was conducted between stations 16+100 and 17+730 following the failure incidence. Two extra soil boreholes have been excavated at Sta.17+535 and Sta.17+642.50 to examine soil layers and collect soil samples. The soil boring data and field vane shear test results were summarized and presented in
Figure 6. It is observed that between stations 16+300 m and 17+500 m, the deepest layer of soft clay covers approximately 1 km. The maximum thickness of the soft layer is around 12 m, whereas the thickness of soft clay beyond station 17+500 m is less than 10 m. Zones from station 17+280 m. to 17+357 m. and from station 17+487 m. to station 17+550 m. experienced collapse in the shallow area. The failure zone occurs at the interface between the deep and shallow layers of soft clay.
4. Laboratory Testing
4.1. Conventional Consolidated Undrained (CU) Triaxial Tests
The conventional triaxial tests were conducted in accordance with the ASTM procedure of consolidated undrained triaxial test (CU) [
29]. The initial stage of specimen preparation was conducted according to the method described in the literature [
27,
28,
29]. The back pressure method was utilized to fully saturate the specimen, which can be verified by the B-value as per Skempton (1954) [
30]. The Shansep technique [
32,
33] was employed to ensure the specimens followed the virgin compression line and to minimize any disturbances caused by the soil collection process. The last step involved subjecting the specimen to shear loading at a slow and suitable rate following the ASTM D4767 approach to determine the rate of loading corresponding to the recommended strain at failure. The specifics of the conventional triaxial test design for soft clay layers were outlined in
Table 1.
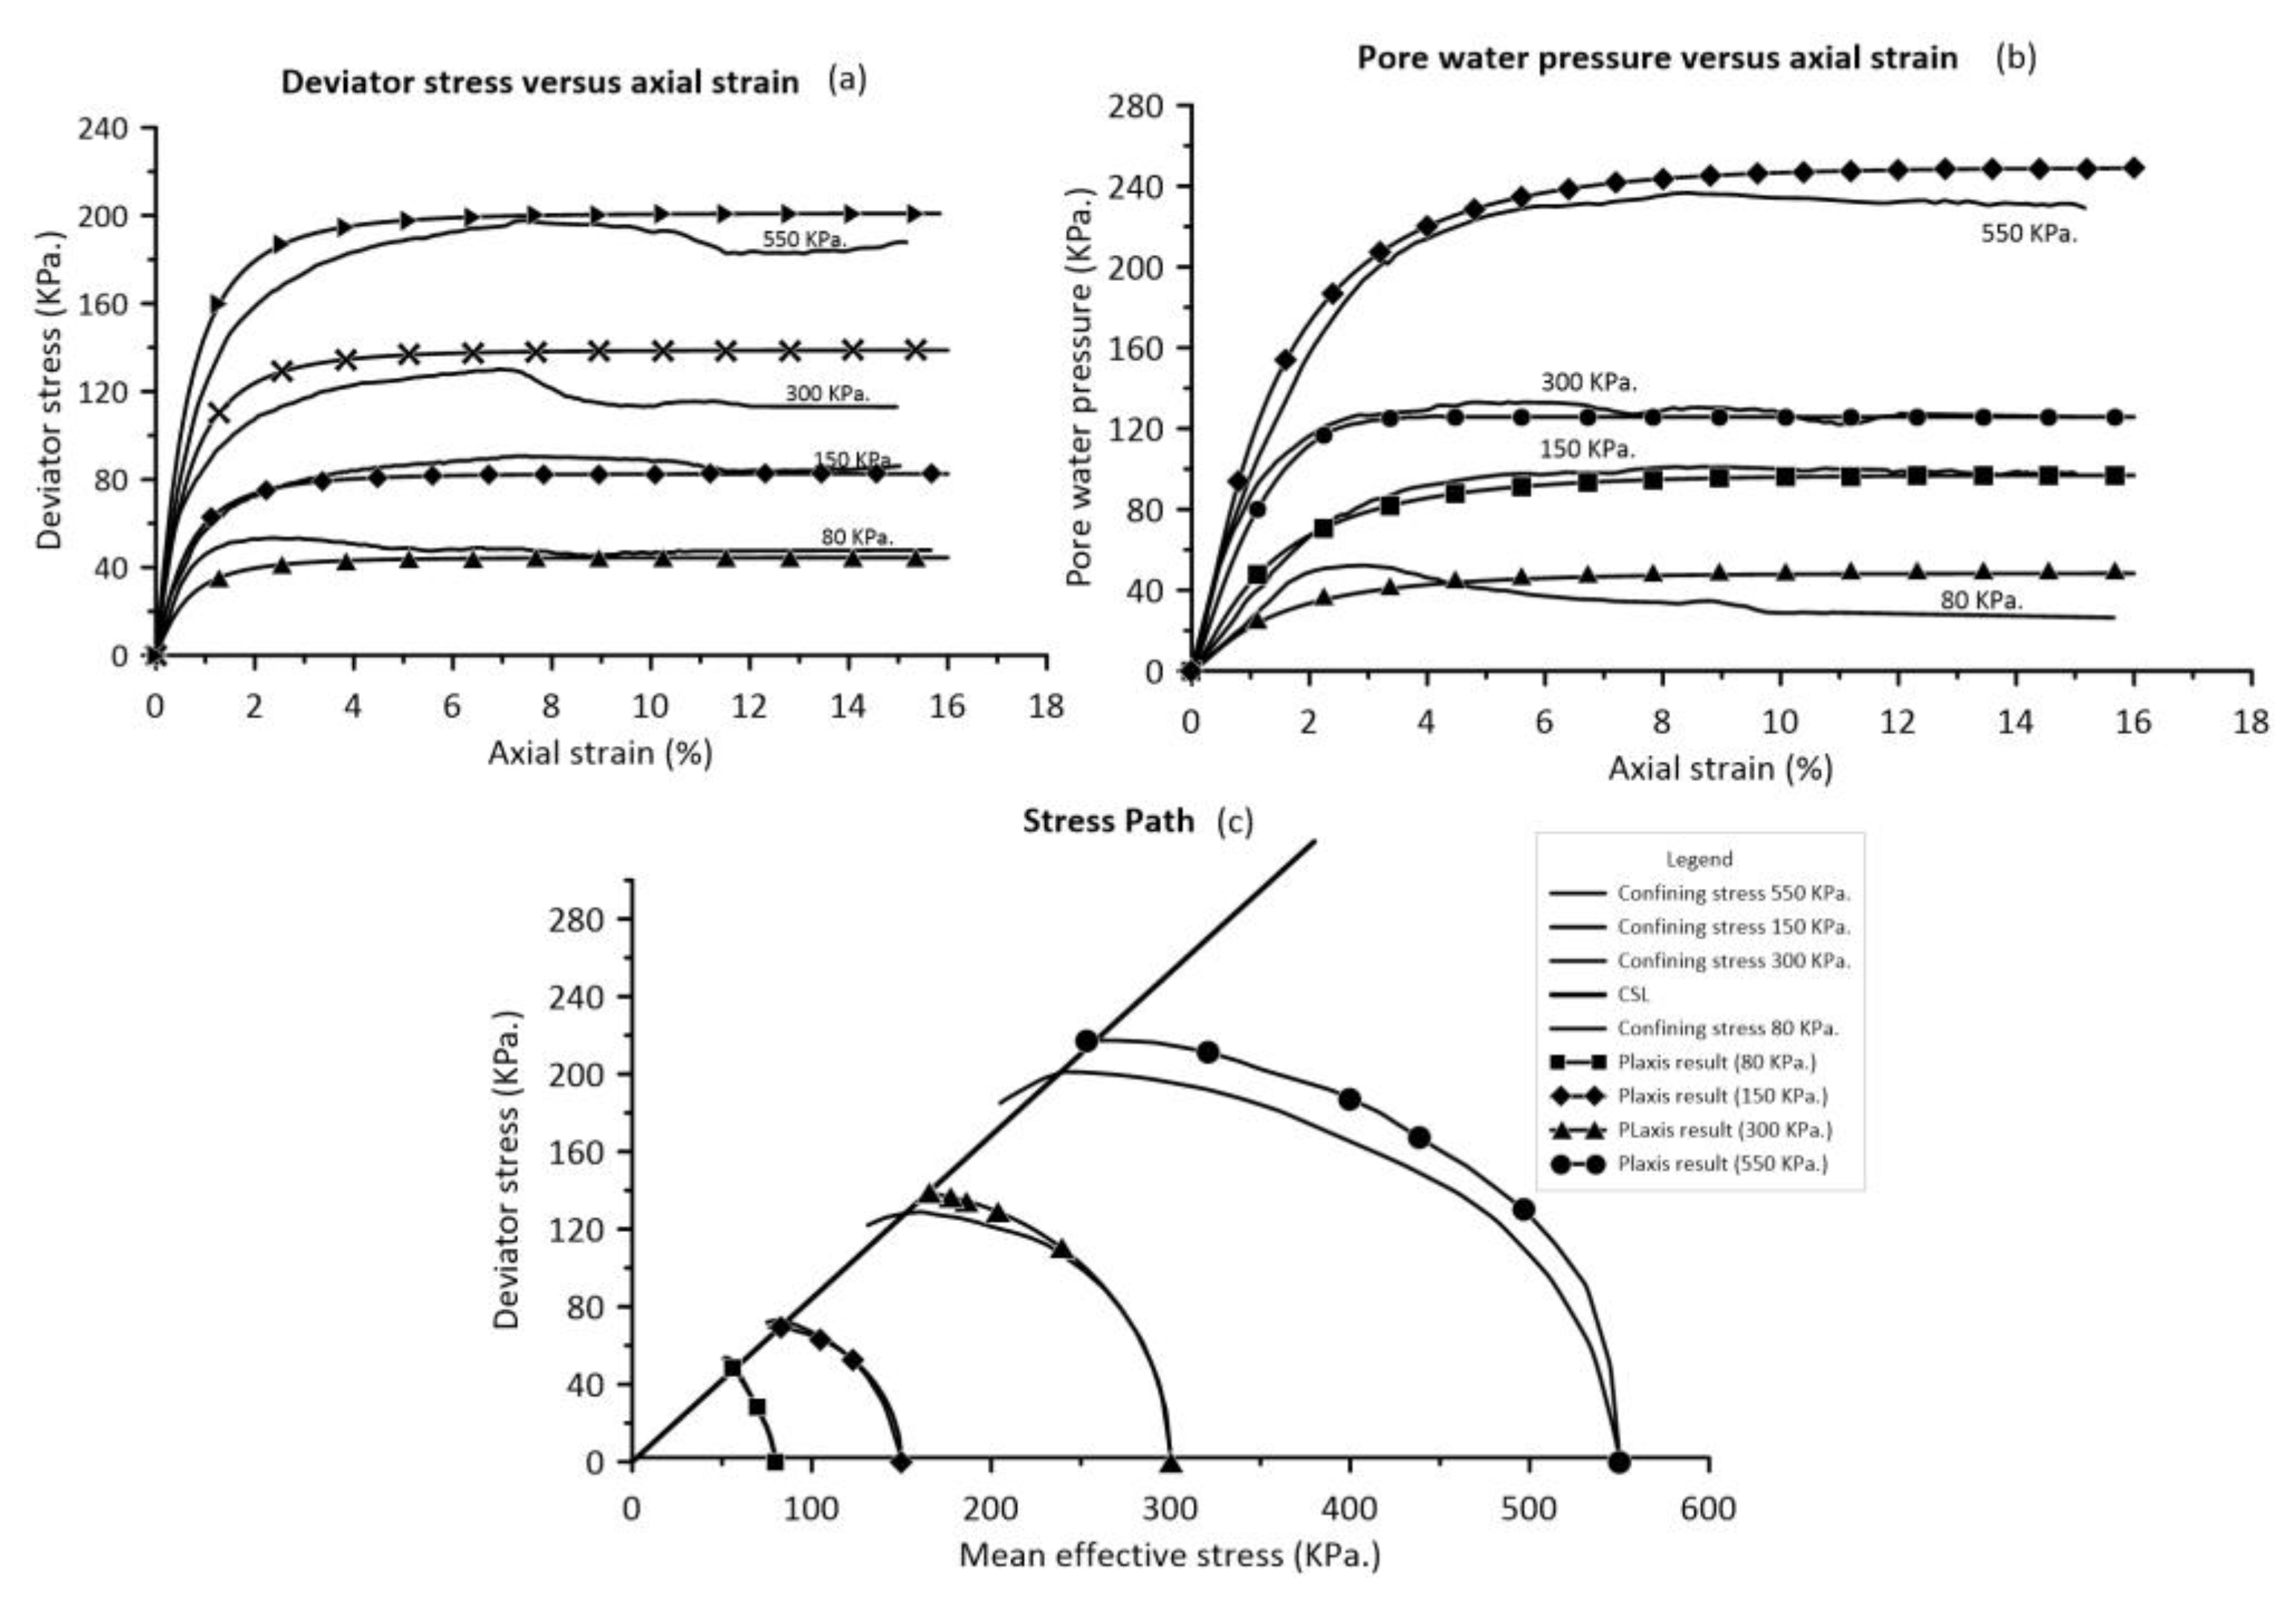
Figure 7a shows the deviatoric stress and axial strain diagram of the soft clay CU tests, indicating that the specimen experienced contraction throughout the test period. The strain at failure ranges from 2% to 4%, with excess pore water pressure increasing throughout the test, as depicted in
Figure 7b. This increase in excess pore water pressure can lead to a decrease in the effective stress of the soil specimen until failure develops. The stress path diagram provides reinforced evidence supporting the soil's contraction behavior. It is evident that the stress trajectory of the specimen does not go beyond the envelope line and tends to shift to the left side throughout the test, as shown in
Figure 7 (c). The pore pressure at specimen failure can be calculated by measuring the distance between the total stress path (TSP) and the effective stress path (ESP), within the range of 50 – 250 KPa. The coefficient A for CIU-5 to CIU-8 exceeds 0.50, indicating normally consolidated clay behavior (NC). The Mohr-Coulomb model (MCM.) parameters and additional information can be understood by referring to
Figure 7d, and the summarized outcomes are included in
Table 2.
4.2. Cyclic Consolidated Undrained Triaxial Tests
The cyclic consolidated undrained triaxial test followed the usual triaxial test protocol throughout the saturation and consolidation stages, but instead differed during the shearing stage due to the use of recurrent loading in several cycles. The traffic loading magnitude was established according to the definition of local legislation provided by the Department of Rural Roads (DRR). The rural road authorizes 10 tons per axle maximum for semi-trailers. The speed limit is set at 90 km/h. The load frequency is determined by inputting vehicle velocities of approximately 50 and 90 km/h, resulting in computed frequencies of 1.50 and 2.50 Hz, respectively, as per Kongpanickul et al. (2022), Al-Qadi et al. (2008), Kongpanickul (2019), and Liu and Xiao (2010) [
11,
40,
13,
39]. The loading pattern followed a sinusoidal formula [
8,
11,
13,
16].
Table 3 summarizes the cyclic consolidated undrained triaxial testing conducted for the Bangkok soft clay. The threshold stress of the soft clay was estimated to be approximately four times the undrained shear strength of the soil (CSR = 0.73 - 0.75). The simulation of cyclic loading was determined based on cyclic stress ratios (CSR) of 0.18 (equivalent to one traffic loading) and 0.38 (equivalent to two traffic loadings). The strain's consequences was assessed through regression analysis by using Li and Selig's empirical model [
17] to analyses the projected permanent strain equation, which is confirmed by the R square-indicator (
1). This equation can forecast the whole strain at specific cycles.
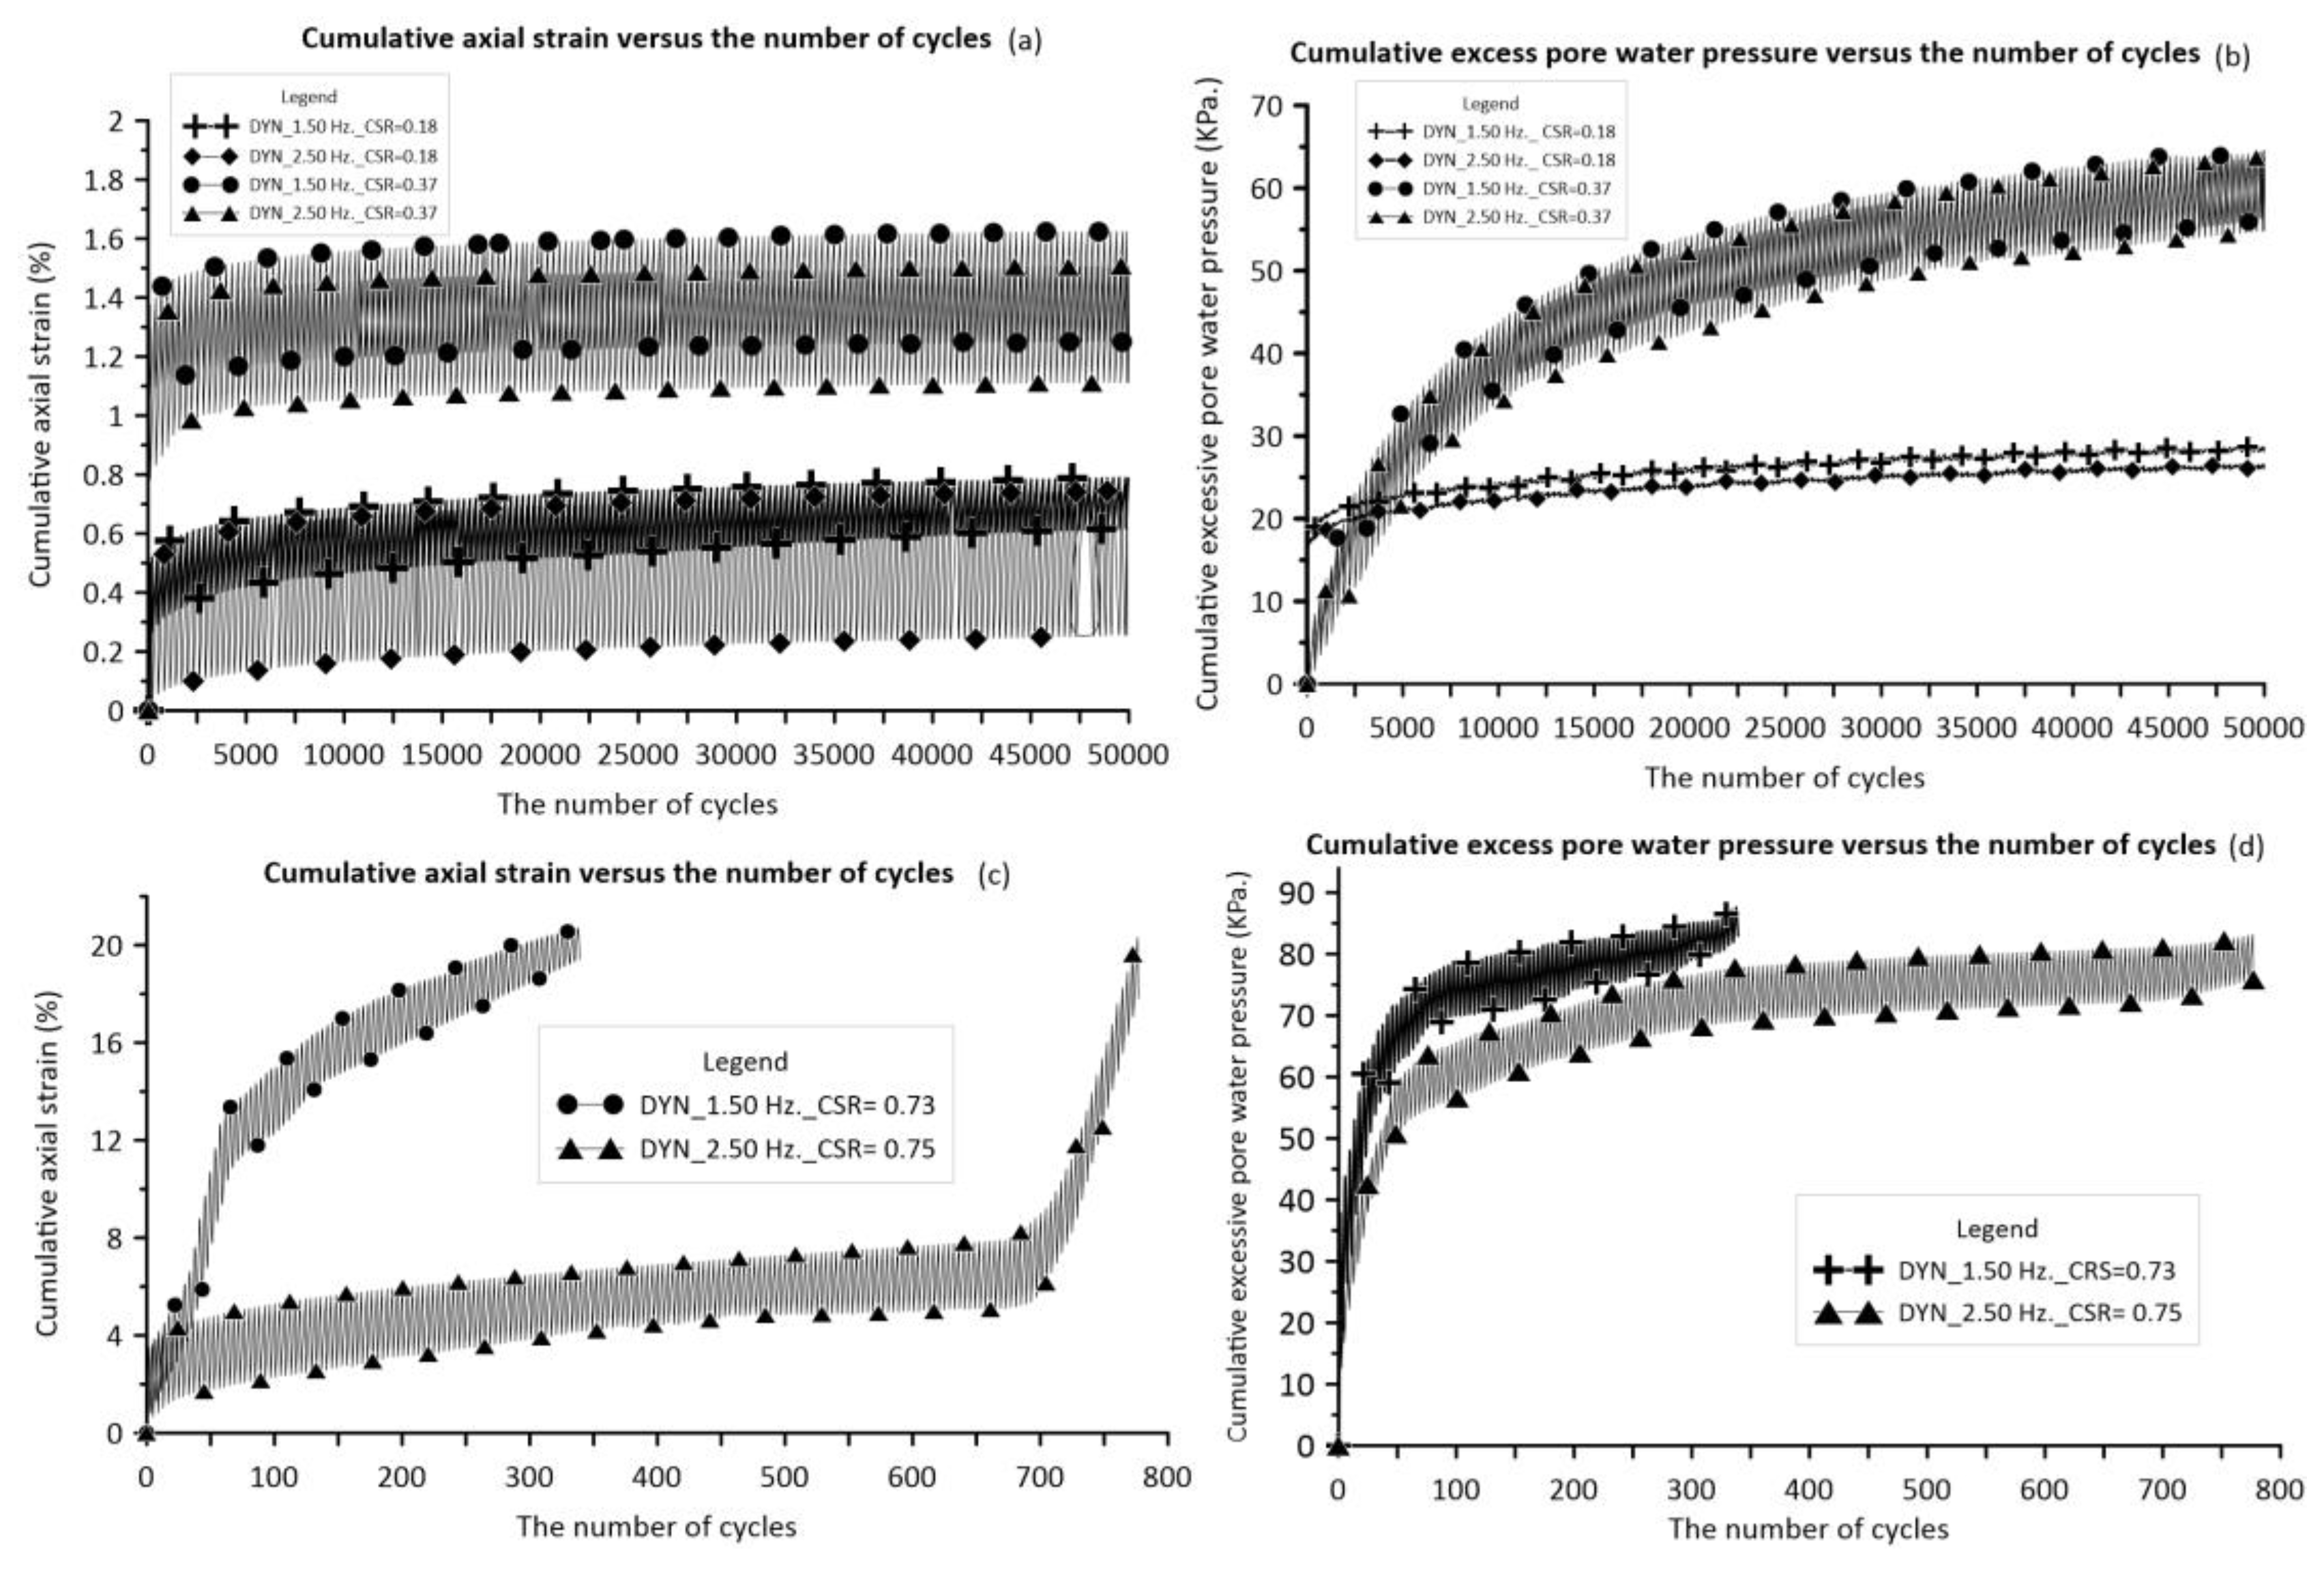
Figure 8a shows the progression of cumulative permanent and resilient strains (CSR = 0.18) at 0.65% and 0.70% of total strain at 2.50 Hz and 1.50 Hz frequencies, respectively. The resilient strain ranges around 0.20% - 0.45% for higher and lower frequencies during the test, while lower load frequency leads to a 7% increase in axial strain reproduction versus higher load frequency. At an even higher cycle stress ratio of 0.37, analogous tendencies are observed as with the lower cyclic stress ratio, the frequency gap is 12.50%. The overall strain is a little above 1.50% axial strain for all cases. The elastic response fluctuations for both cases are practically the same, with a magnitude of only 0.40%. The additional contention for utilizing cyclic stress involves applying CSR values of 0.73 and 0.75 to analyze the threshold stress of soft soil. It is shown that increasing the applied load frequency may necessitate a higher cyclic load magnitude and number of cycles for the specimen to fail. The soil fails at 5% axial strain after 40 cycles under a 1.50 Hz frequency and at around 8% strain after 700 cycles under a 2.50 Hz frequency, as depicted in
Figure 8c. Soil behavior can be categorized as either flow deformation (CSR = 0.73) or liquefaction and shear failure (CSR = 0.75) modes. Thus, this could mean that the failure condition of soil under repetitive loading is sensitive to load frequency.
Figure 8b shows the positive excess pore water pressure over the tests for CSR values of 0.18 and 0.37. The soil specimen can indicate encountering a decrease in shear strength capacity. The extra pore water pressure evolves quickly during the initial cycles, reaching 20 KPa and 23 KPa at load frequencies of 2.50 Hz and 1.50 Hz, respectively (CSR = 0.18). Subsequently, it increases marginally to 25 KPa during the duration of the test. It is shown that lower load frequency could cause an additional 10% increase in total pore pressure compared to greater frequency, whereas resilience behavior shows minimal variation when it gets to the greater cyclic magnitude scenario. The pattern remains consistent with the prior case in point. However, the fluctuation resilience gap is approximately 10 KPa, while the accumulated pore pressure exceeds 55 KPa after 15,000 cycles.
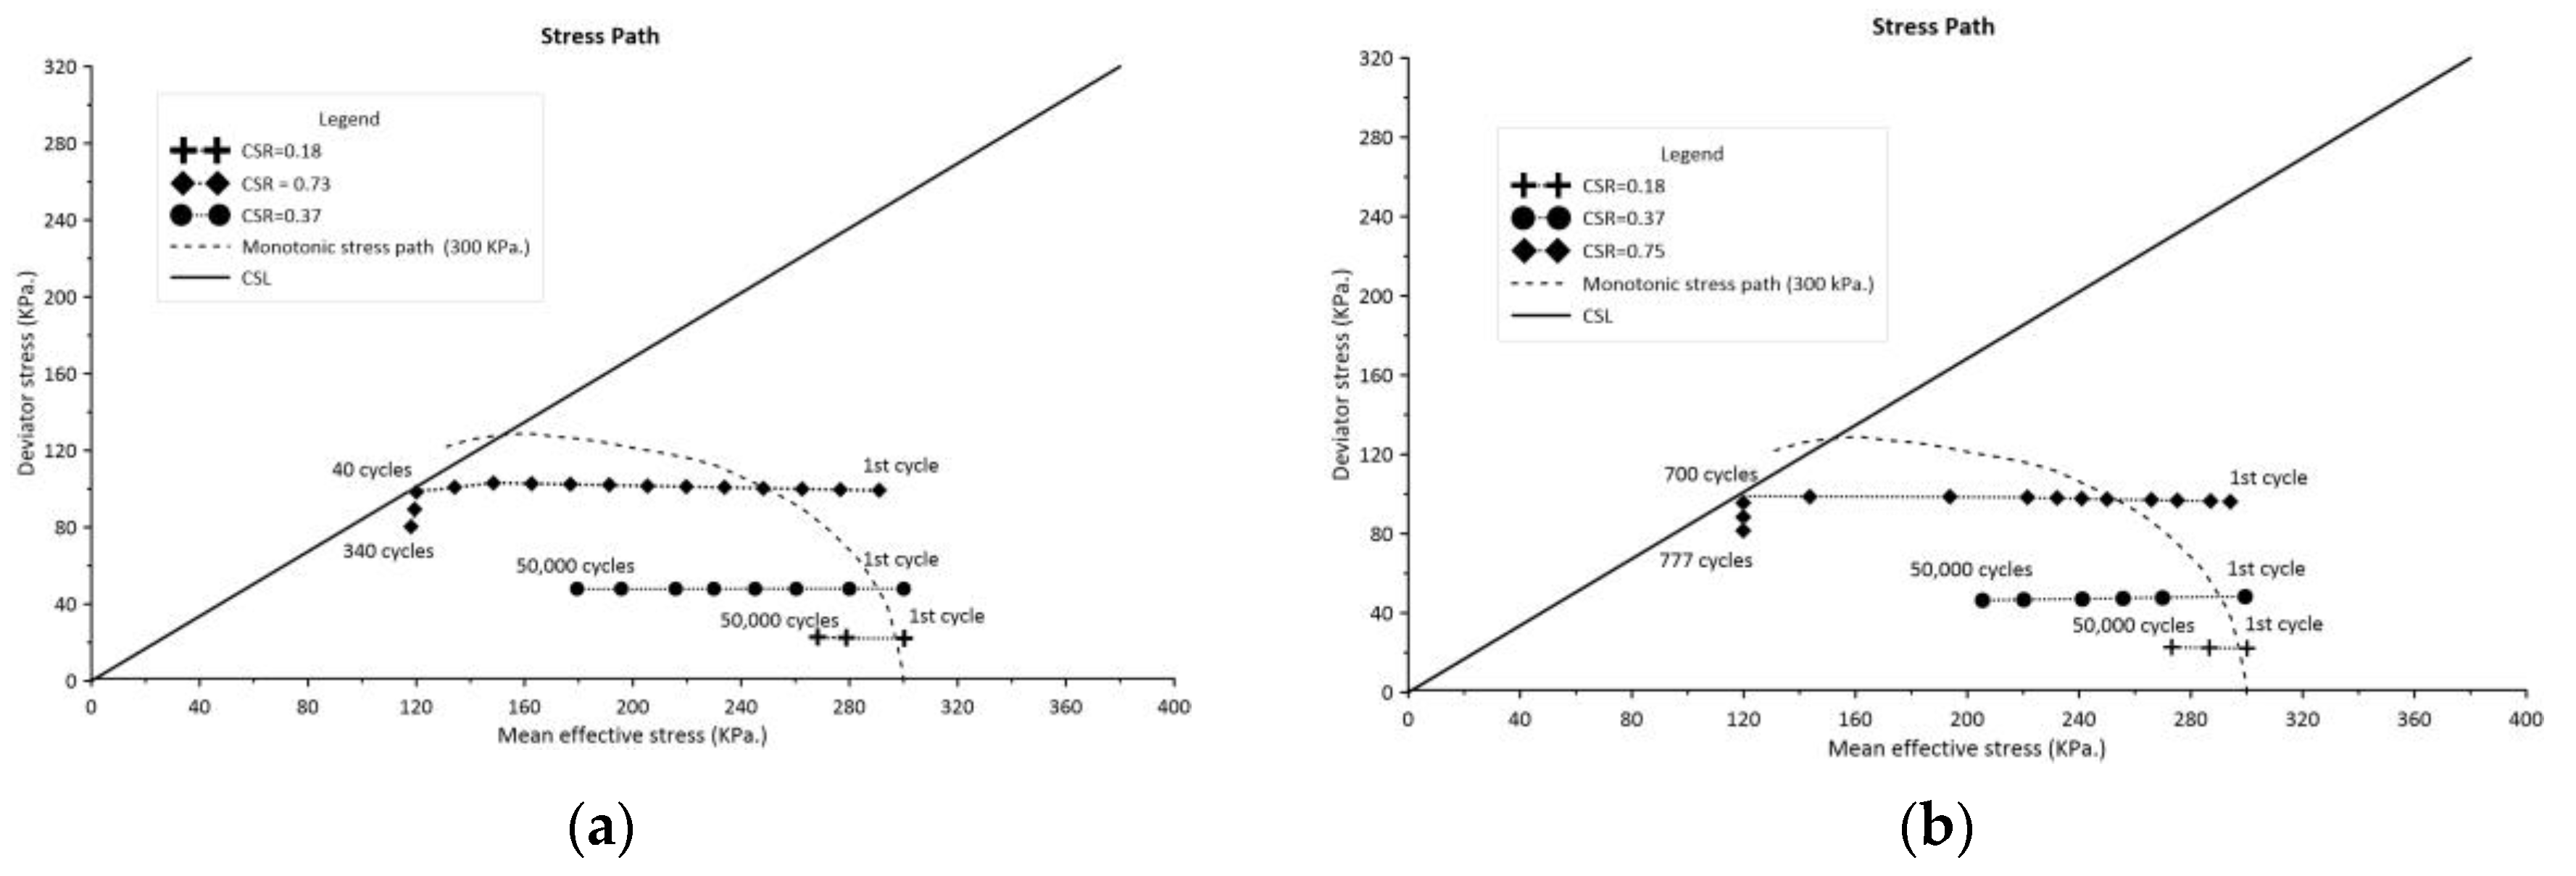
Figure 9a,b show the cyclic stress behavior at different load frequencies. The stress trajectories change to the left of the failure envelope line but do not intersect with it. It can be assumed that no failures occurred during the test. When the cyclic stress ratio (CSR) reaches 0.73, the stress path shifts to the left and intersects the envelope line. The soil's threshold stress can be determined by projecting a horizontal line onto the deviatoric axis. The threshold stress for both situations is 88 KPa for the lower frequency and 90 KPa for the higher frequency, estimated based on the cyclic stress ratio (CSR) of 0.73 and 0.75.
4.3. Validation of Cyclic Triaxial Results with Li & Selig Empirical Model
The trial-and-error method was used to estimate the constant coefficient of an empirical model, similar to how regression analysis can be conducted to prove the accuracy of the model compared to laboratory results in terms of total accumulated axial strain.
Table 4 summarizes the curve fitting equation and R-square value.
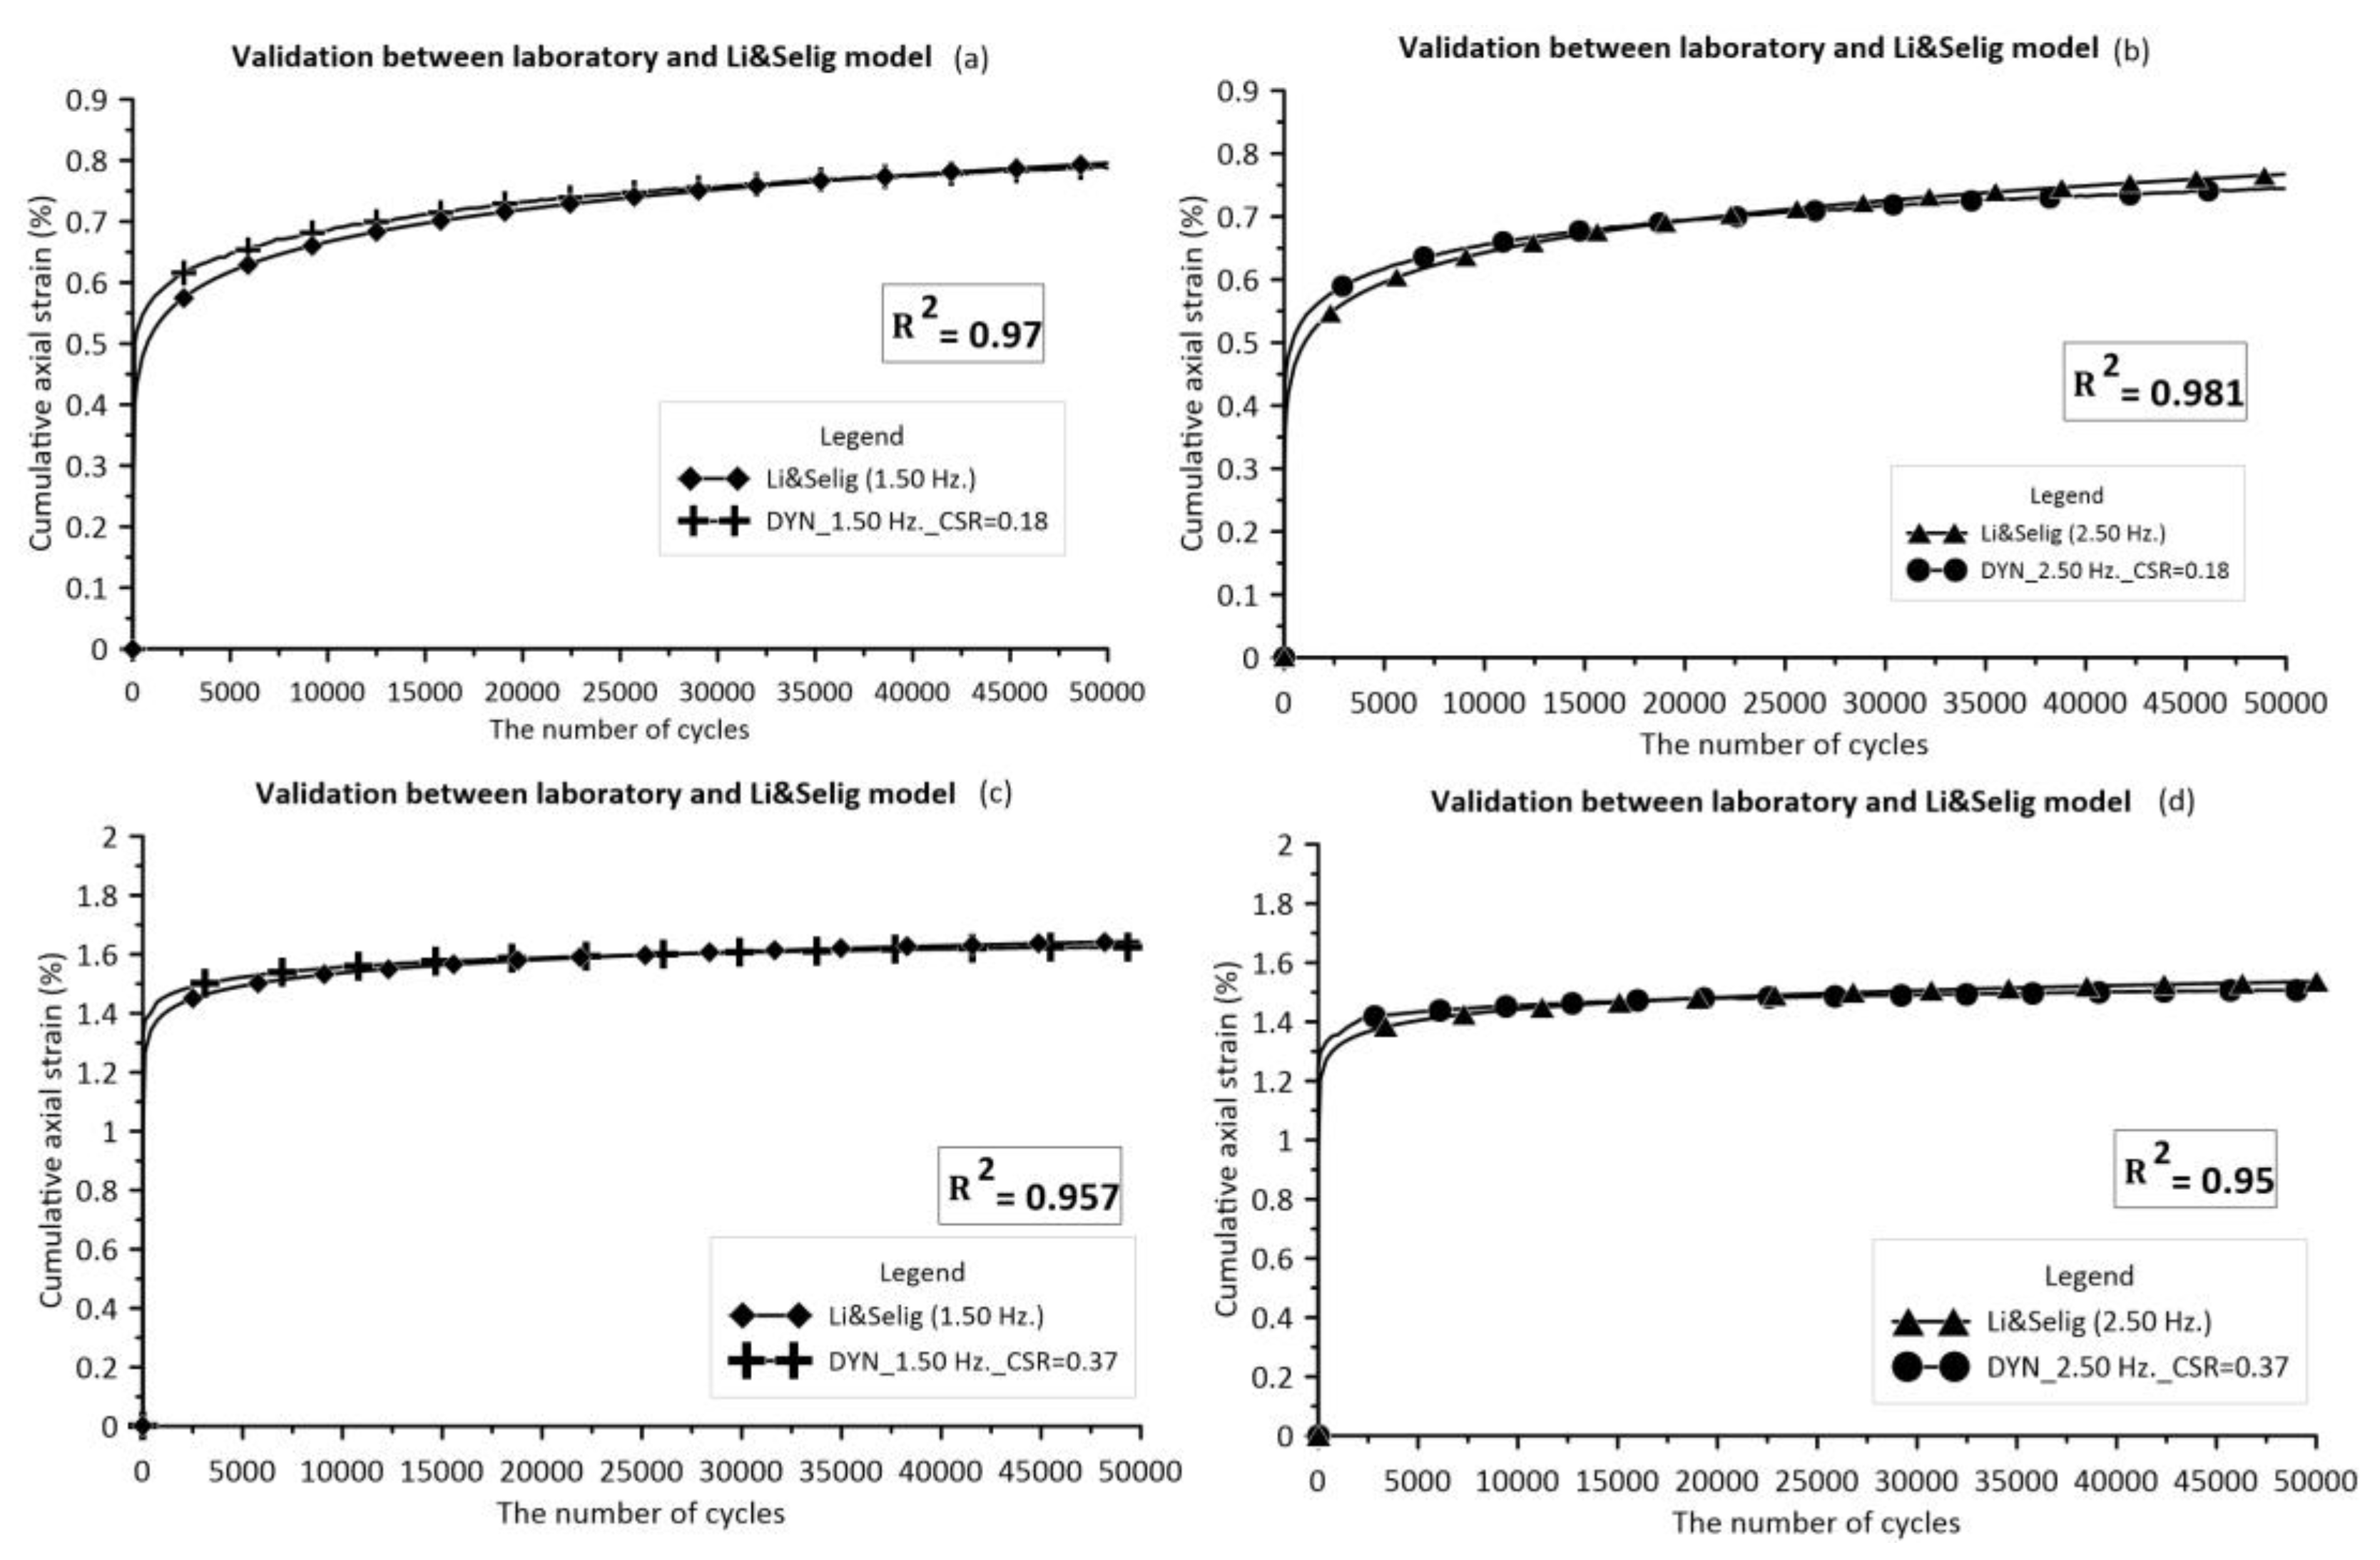
Table 4 indicates a strong agreement with R-square values greater than or equal to 0.95 for all situations, as shown in
Figure 10. For this reason, the curve fitting equation will be utilized to forecast the cumulative permanent strain with various targeted cyclic stress and cycles.
5. Finite Element Numerical Analysis
5.1. Model Description
The 2-D Plaxis software is widely acknowledged as an exceptionally efficient finite element software for tackling geotechnical engineering challenges, especially in the case of assessing embankment stability. This software offers a range of soil constitutive models that enable geotechnical engineers to mimic the conditions for erecting under real-world conditions. To assess the stability of embankments with this program, a number of valuable processes can be performed to establish a model for study. The earliest steps involve determining the soil condition parameters, while the subsequent steps involve establishing the model geometry and applying external loading. Subsequently, the next stages involve mesh production, boundary condition definition, and simulation. The ultimate phase involves the computation and analysis of the model within the output module.
A finite element model (FEM) representing the dynamic triaxial testing setup was constructed to ascertain the behavior of the soil on the application of the cyclic loading. The Modified Cam Clay (MCC) and Hardening Soil Constitutive (HSM) models were used in the model to mimic the soft soil behavior. The single element technique [
50,
51] was used in the calibration procedure to replicate the CU test in the finite element software.
Table 5 summarizes the scenarios analyzed in the FEM study. As shown in
Table 5, the simulated instances were categorized into two main groups based on the thickness of the soft clay (5.50 m and 10.00 m) and load frequency (1.50 Hz and 2.50 Hz). The validation of the simulation results necessitates contrasting the consolidated undrained cyclic triaxial test outcomes with the finite element method (FEM) results using regression analysis, affirmed by the R-square value (
≈ 1).
The geometry modeling of the evaluation of embankment stability case was developed using the 2-D Plaxis software, incorporating survey data and information that was accessible. This software has been used to model an actual embankment environment before the failure. The category of soil profile consists of two primary classifications: pavement structures (including asphalt concrete, crushed rock base, and soil aggregate subbase) and subgrade layers such as weather crust, soft clay, medium clay, and stiff clay. The aforementioned groups are determined by the collection of recorded and survey data. Following that, the pavement structures and soil parameters that were gathered and calibrated were assigned to the geometry of the embankment model. Similarly, a vehicle cycle loading of 50,000 cycles in a sinusoidal pattern was simulated on the pavement surface.
Figure 11 depicts the establishment and design of the mesh generation and simulation stage, resulting in the representation of the total simulated numerical scenarios that are prepared for calculation.
5.2. Calibration of the Soil Constitutive Model Parameters of Soft Clay
The Modified Cam Clay (MCC) model and the Hardening soil model (HSM) were utilized to imitate the cyclic loading of a vehicle in the Plaxis program. Calibrating these soil characteristics ensures that the input parameters accurately reflect the real soil behavior and laboratory results.
Figure 12 illustrates the comparison between finite element and laboratory data using the MCC model, whereas the HSM model could have been analyzed using the same technique. Both results exhibit excellent agreement, suggesting that the parameters accurately represent the soil response according to the constitutive model and are consistent with existing literature [
51,
53,
54,
56,
57]. On top of that, input parameters for soil layers, excluding soft soil, can be derived from prior research to model the soil and pavement layers' behavior.
Table 6 summarizes the key input parameters of this study.
5.3. Results of 2-D Cyclic Loading Simulation
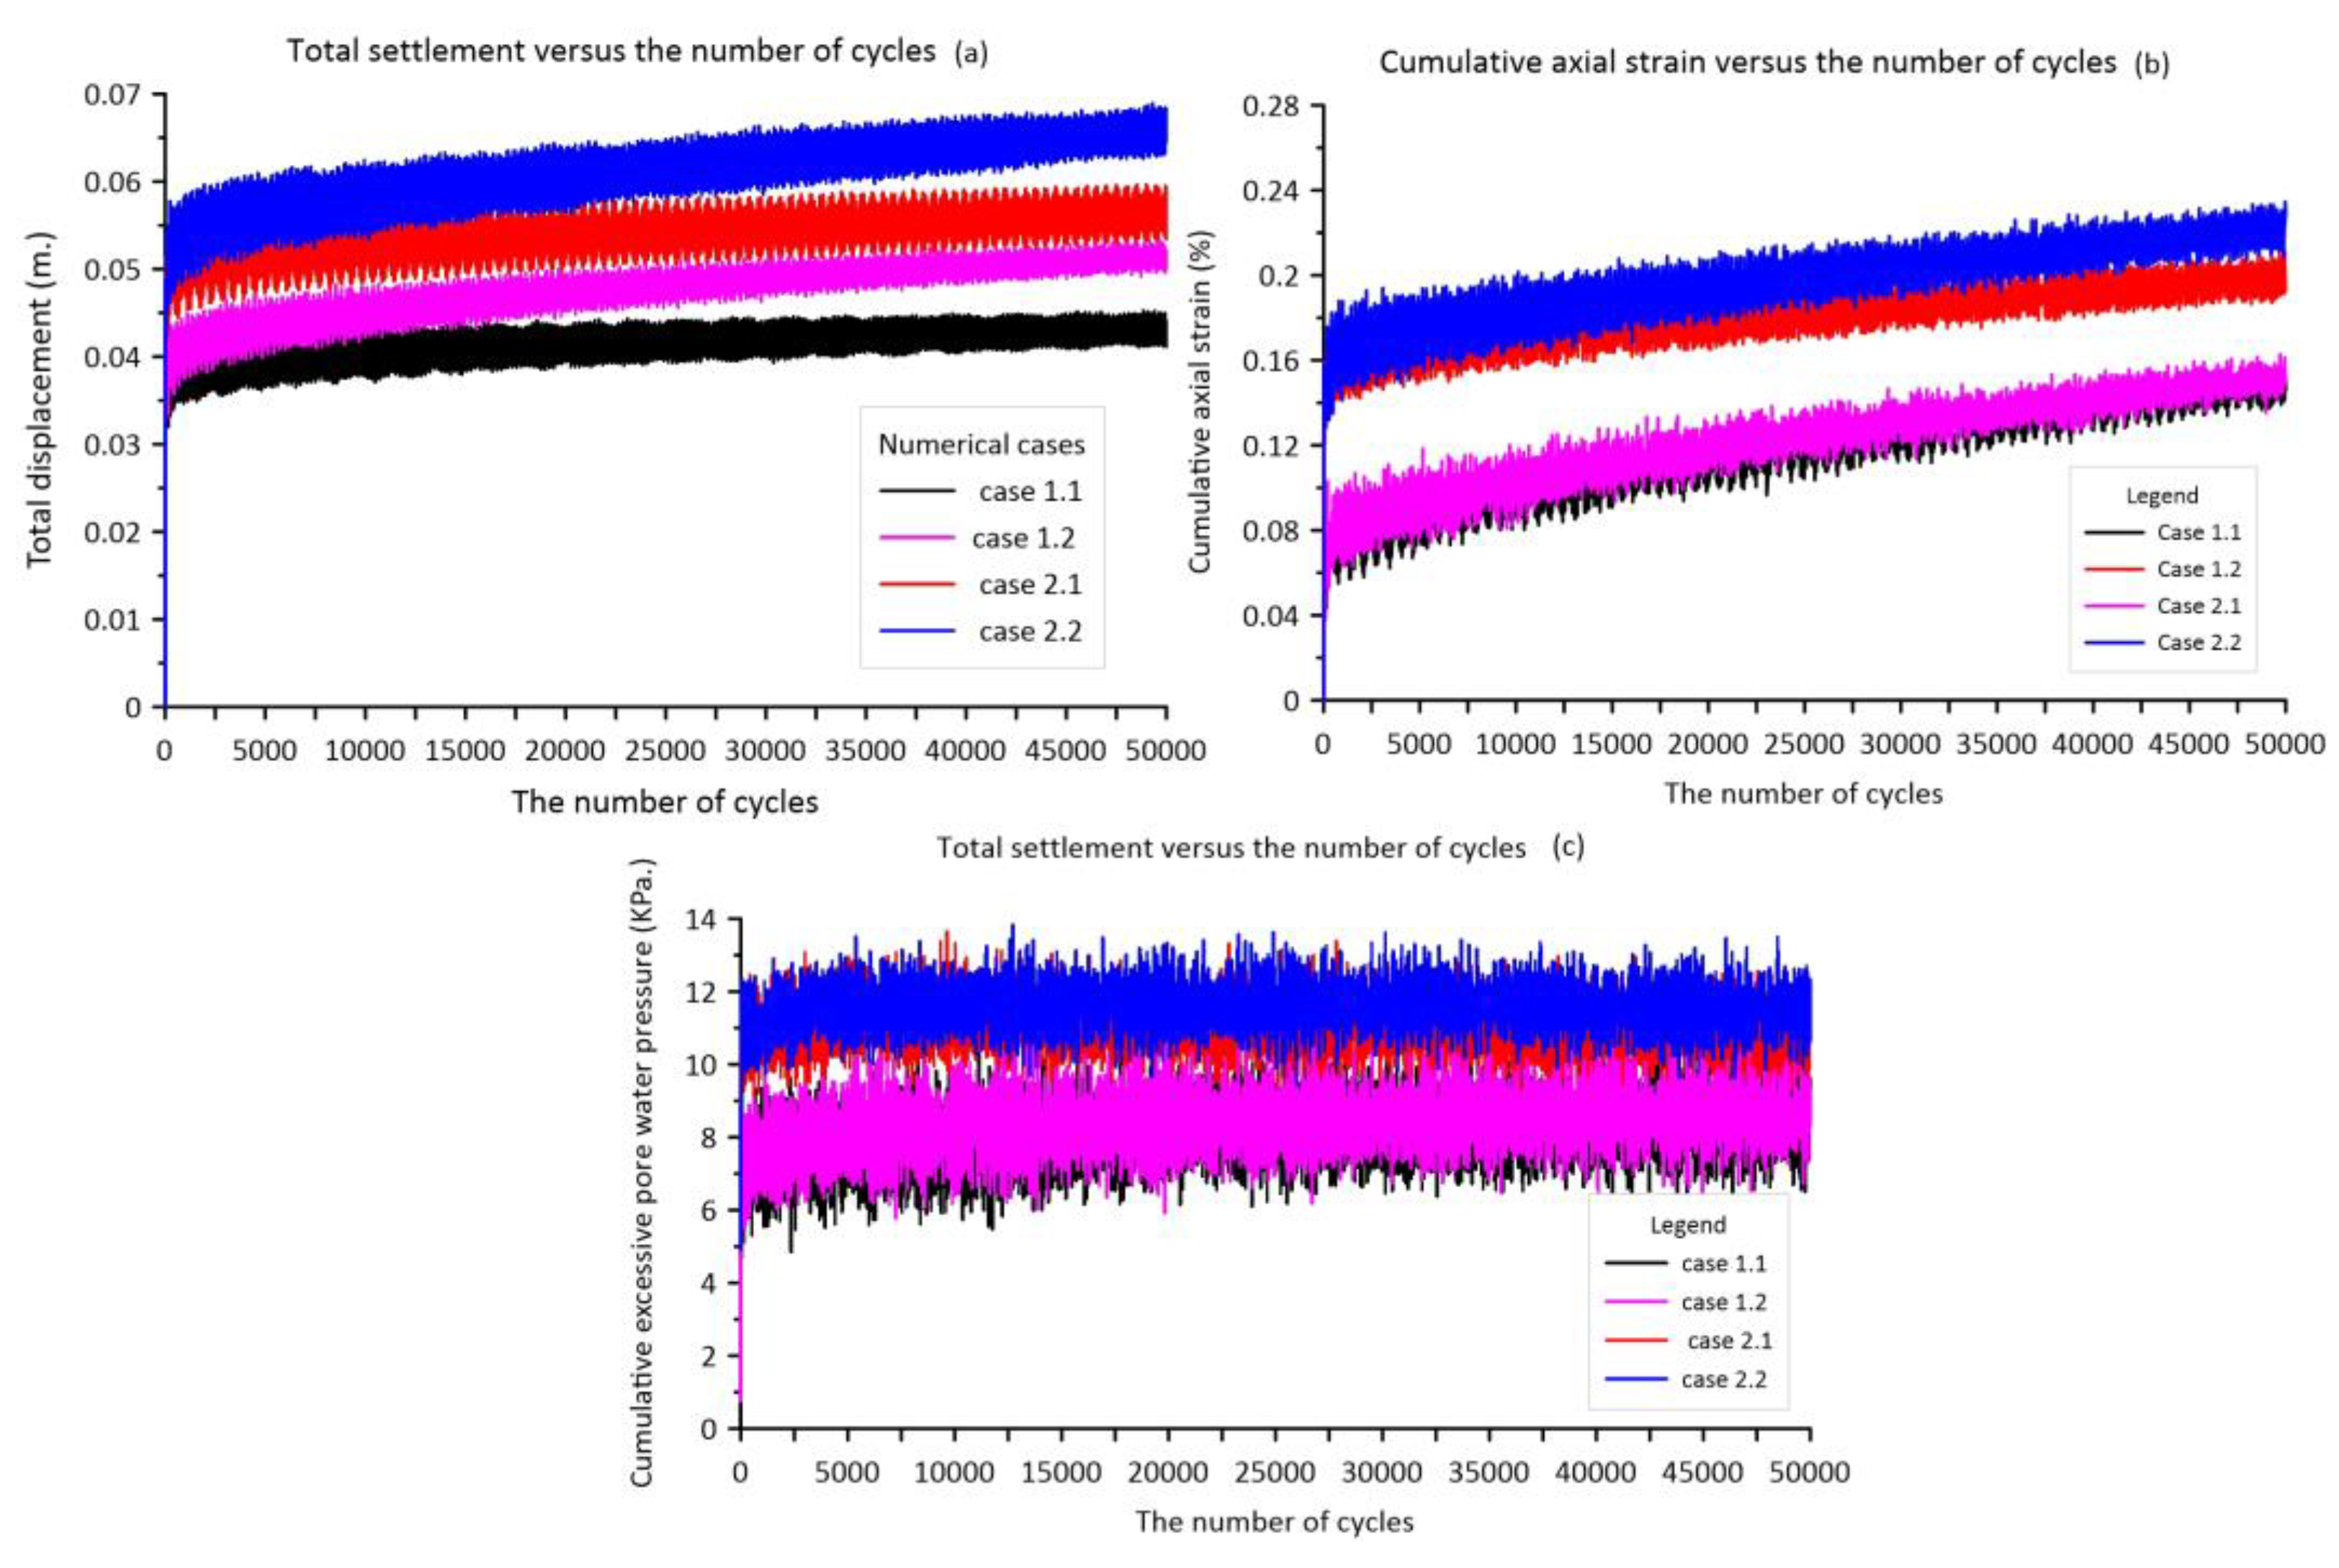
Figure 13 shows the results of total displacement, accumulated axial strain, and excess pore water pressure versus the number of cycles for the scenarios analyzed.
Figure 13 reveals that the critical point of the embankment is the end of the toe slope at the -0.50 m. from the soft clay surface. Moreover,
Figure 13b represents the accumulated strain response upon 50,000 load cycles, which aligns with the deformation results discussed. Lower load frequency has a greater impact on 13% of the total axial strain compared to higher load frequency. Also, the thickness of the soft clay could correspond to an additional 40% total axial strain. The biggest axial strain is 0.25%, indicating that the induced strain is below the threshold strain. Thus, cyclic loading is unable to create failure. Similarly, the pore water pressure excess exhibits a positive value throughout the simulation, as depicted in
Figure 13c. The peak excess pore water pressure reaches 13 KPa in deep soft clay cases and 10 KPa in shallow cases over time. There is a small differential in pressure between the loads at different frequencies, with lower frequencies causing somewhat greater excess pore water pressure than higher frequencies.
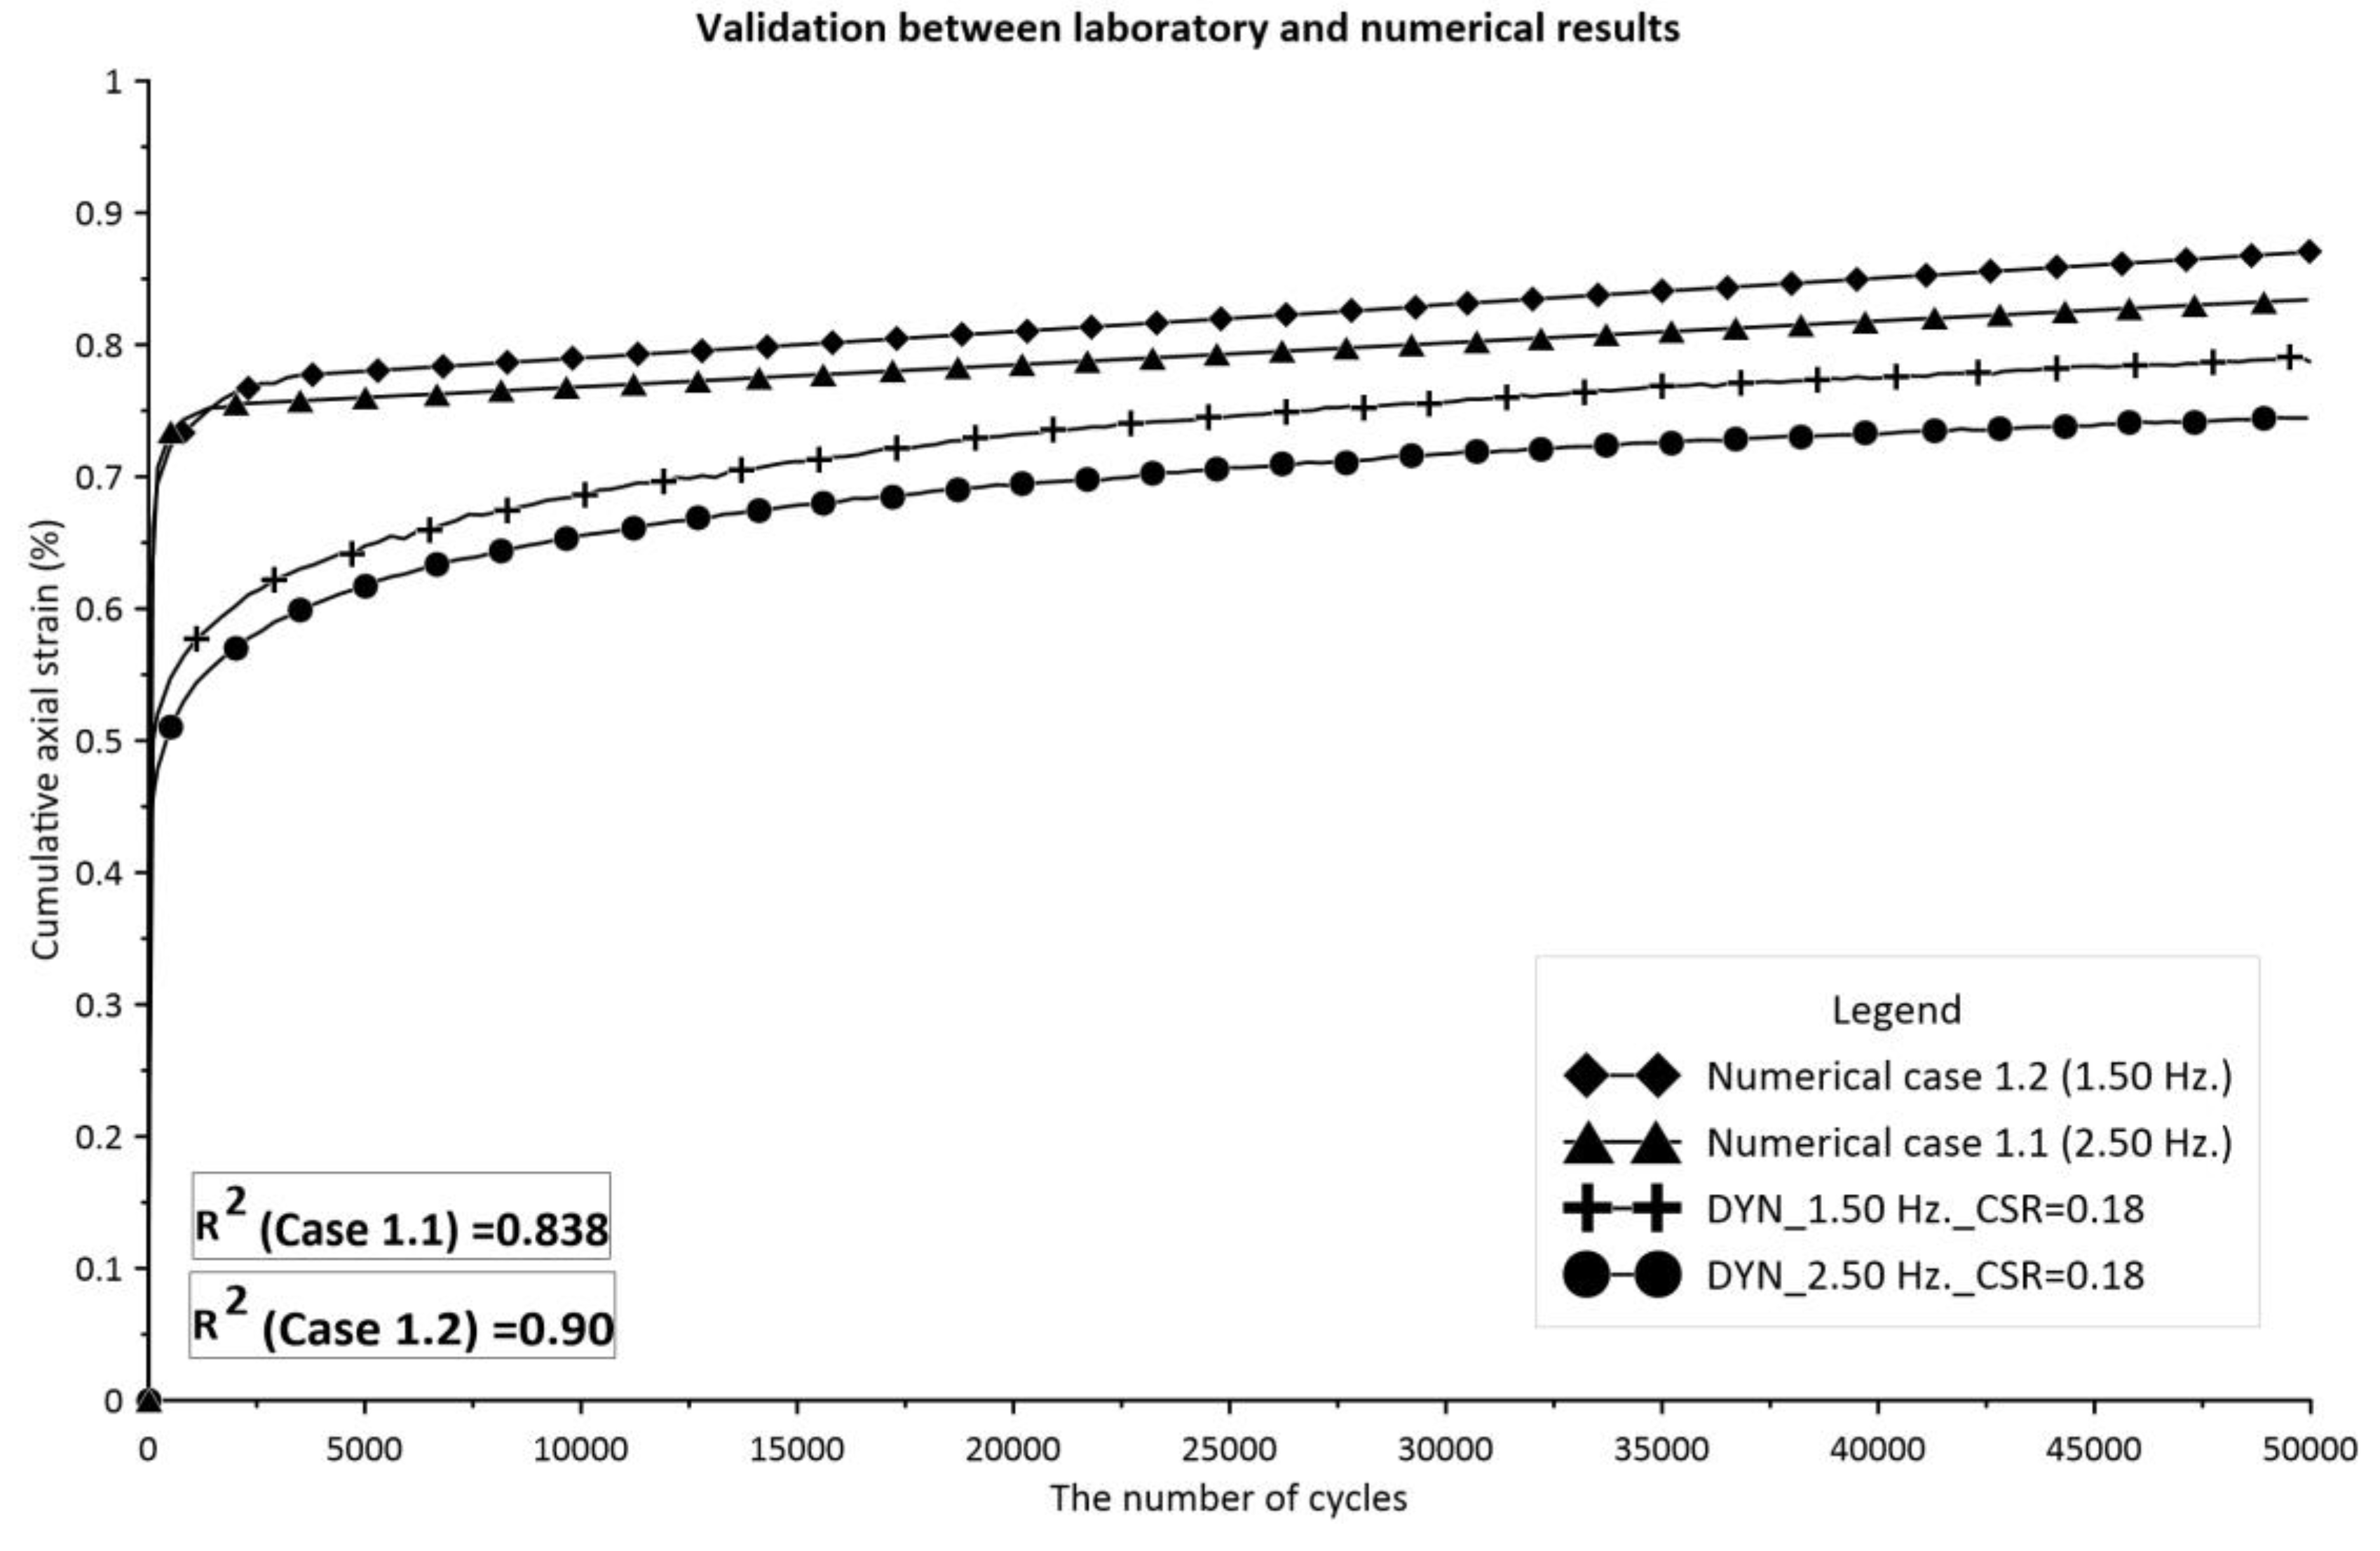
Additionally, to confirm the accuracy of the numerical output, the validation method involves comparing it with the laboratory result and using regression analysis to calculate the R-square indicator (
) for assessing reliability. The validation results are presented in
Figure 14 in this study. With an R-square value (
) exceeding 0.80, the numerical outcome can be considered reliable. However, it is observed that the validation procedure can only be accomplished by considering the total axial strain term, as the resilience response effect cannot be accurately accommodated.
The Modified Cam Clay soil model (MCC) is incompatible with the strength reduction algorithm of the Plaxis software. The Hardening Soil Model (HSM) can be accomplished with this approach, and the generation of the geometry model can proceed in a similar manner as described in the preceding section. Even so, the simulation phase is distinct and can be determined according to
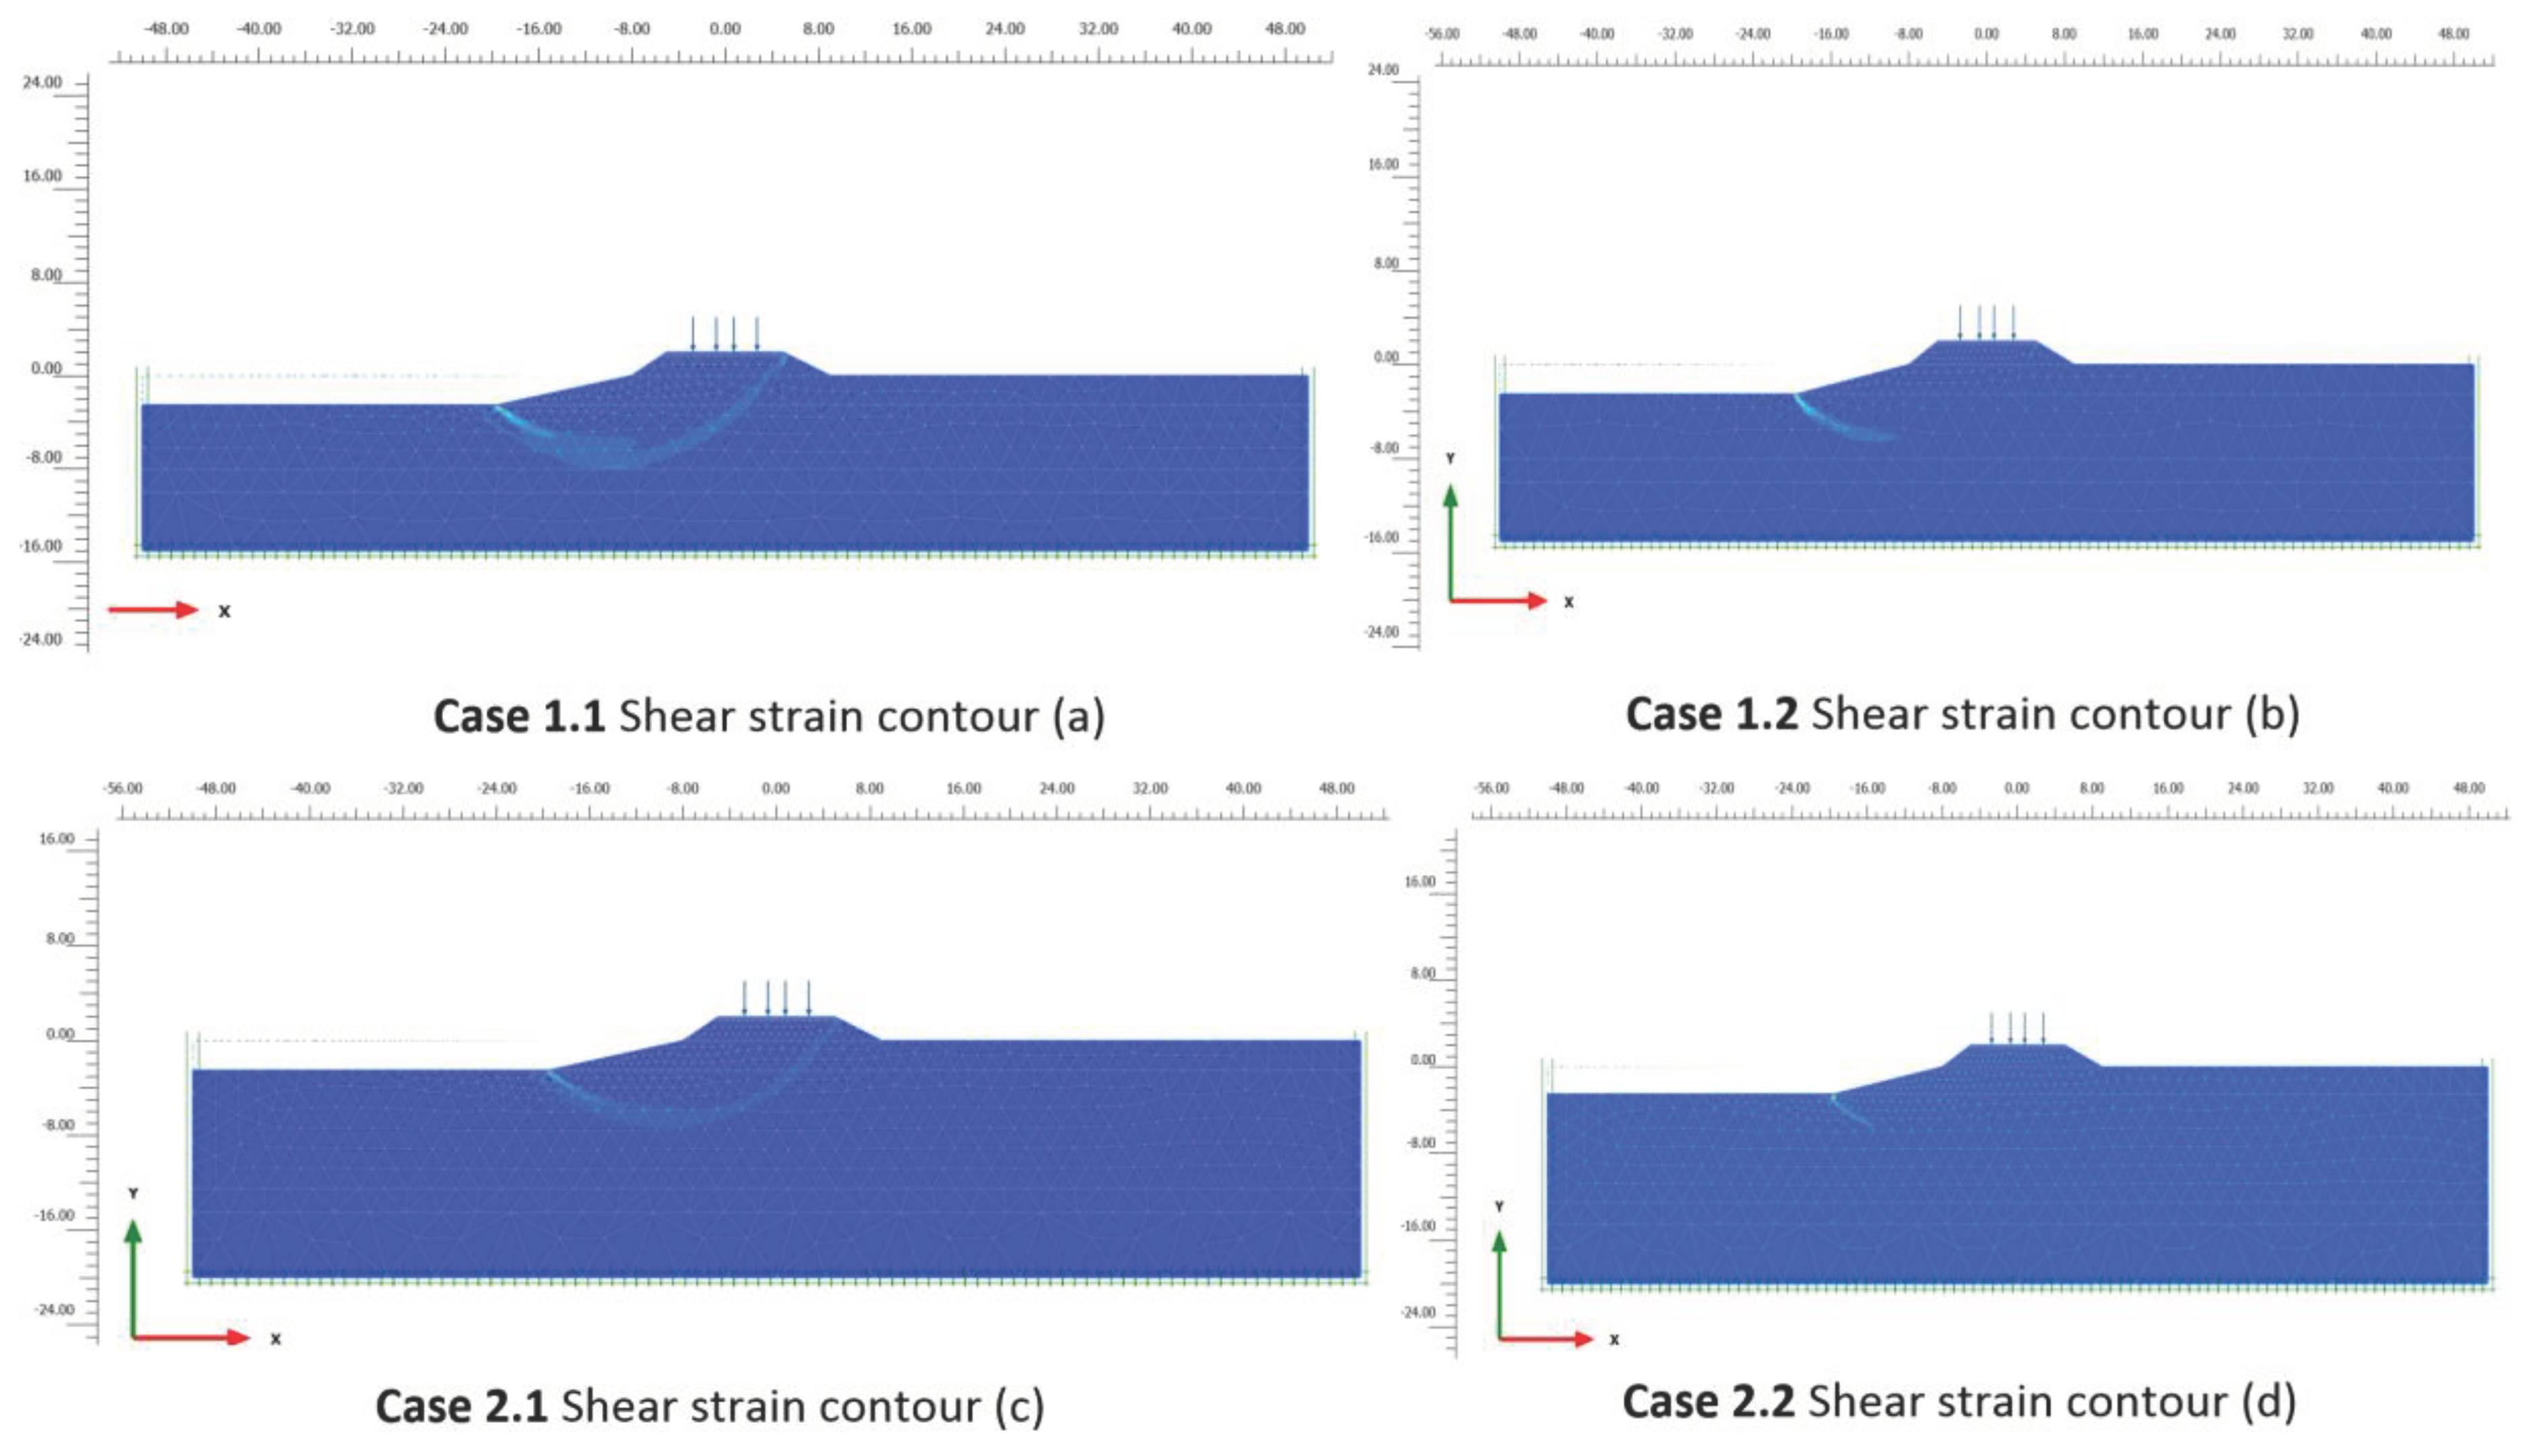
Table 6. The factor of safety (FS) is a crucial stress ratio that indicates the unsafe condition of the slope and embankment combined with the critical slip surface. The safety analysis in Plaxis 2-d software can be performed to evaluate factors of safety (FS), and the shear strain contour can show the critical slip surface for different numerical scenarios.
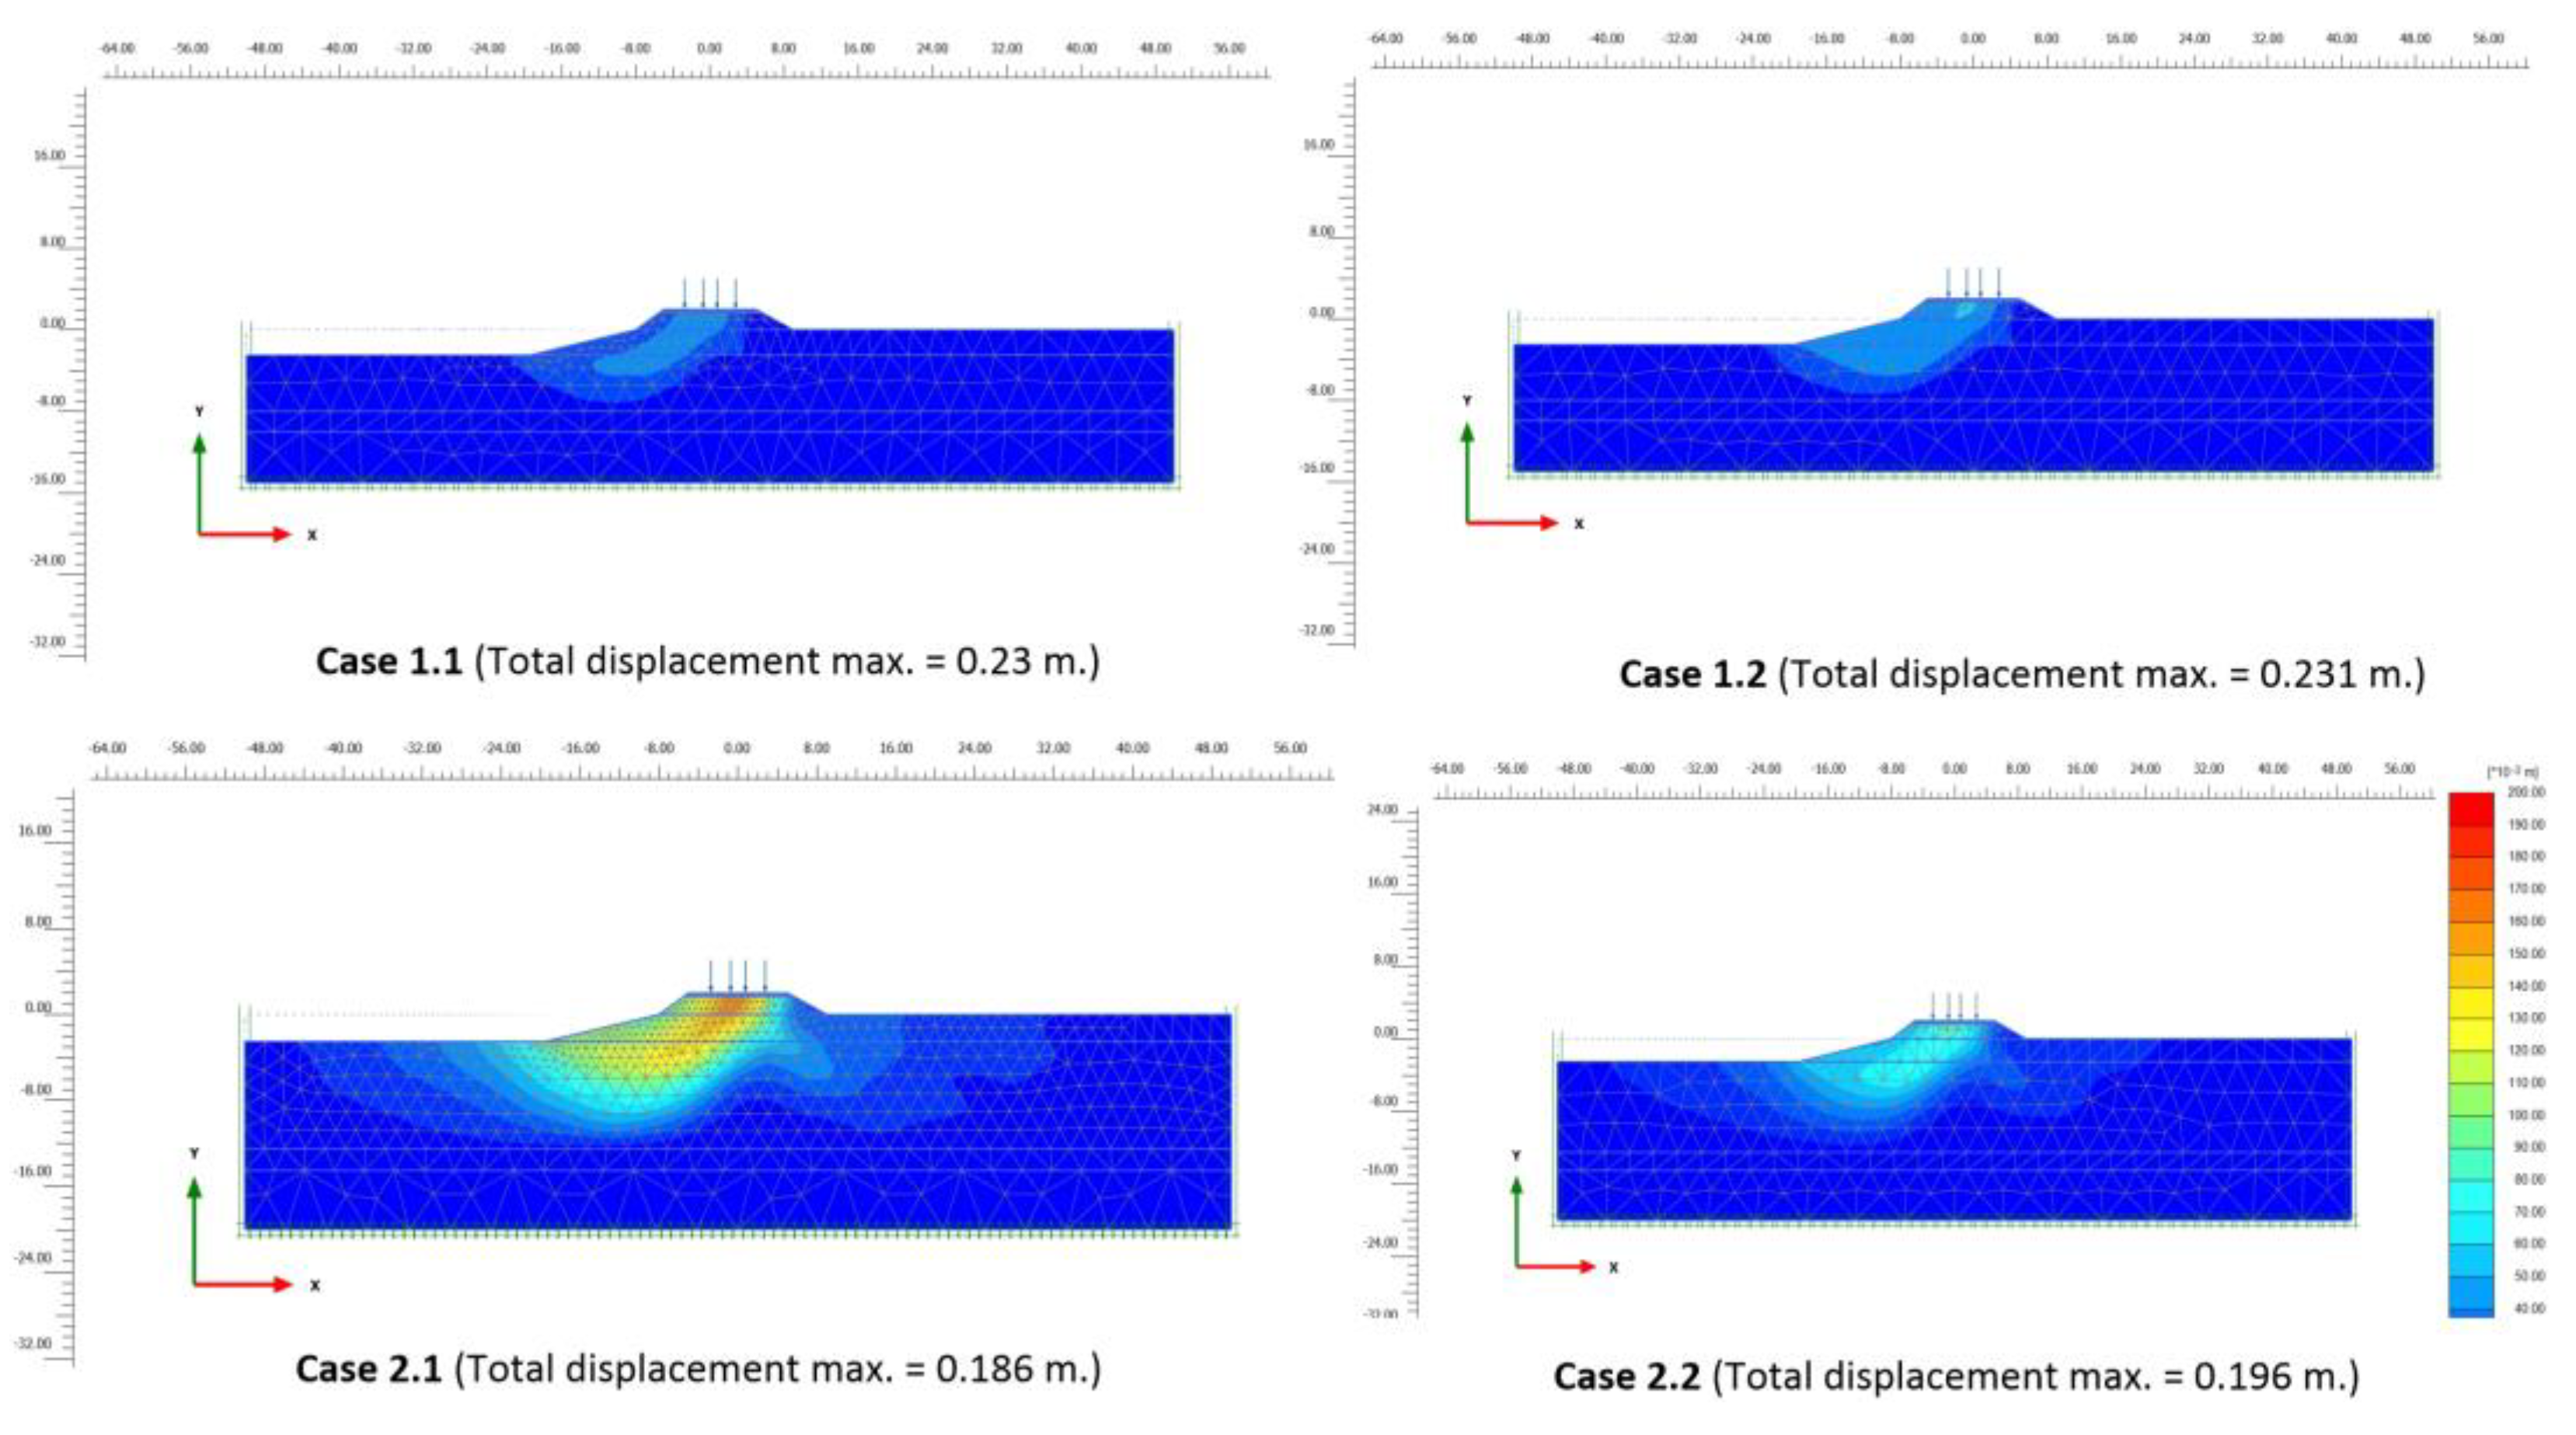
Figure 15 shows that the shear strain distribution points to the crucial slip surface can intersect the soft clay layer in all scenarios, indicating a potential deep-seated failure mechanism. Before cyclic stress, the factors of safety values were 1.623 (Case 2) and 1.655 (Case 1). After cycle stress, the factor of safety ranged from 1.284 to 1.331 for cases 1.1 and 1.2, and from 1.281 to 1.308 for cases 2.1 and 2.2.
Table 7 presents a summary of FS information, showing that cyclic loading may lead to a 20% decrease in the factor of safety (FS). This can reinforce the earlier argument that cyclic loading cannot result in the embankment collapsing. Lower load frequency can lead to a nearly 5% diminution in the factor of safety, while a greater thickness of soft clay may result in a 4% drop in the factor of safety.
6. Conclusions
The present research examines the cyclic loading behavior and possible catastrophic factors of an embankment along an irrigation canal on a soft clay base through a combination of laboratory tests, empirical models, and numerical studies. Standard and cyclic consolidated undrained triaxial tests were conducted using the finite element technique (FEM) on the Plaxis software with available codes [
49,
60] to assess the influence of cyclic loading.
The conclusion can be gathered from the laboratory results, empirical model, and finite element technique. The cyclic threshold strain ranges from 5% to 8%, which is approximately double the value of the monotonic threshold strain. Conversely, the threshold stress for soft soil is only 73% of the monotonic threshold stress. Cyclic loading can lead to 9% - 14% of the threshold strain at CSR = 0.18 and increase about one-third of the failure strain if CSR doubles. Besides, cyclic stress can cause approximately 30% of the threshold excess pore water pressure, leading to a decrease in the effective stress of soft soil. The soft clay's response to cyclic loading is influenced by the load frequency and thickness. Lower load frequency can lead to approximately 7% - 12.50% greater overall cumulative axial strain and 10% extra excess pore water pressure in cyclic triaxial testing. Increasing the thickness of soft clay can result in a 40% rise in total axial strain and about one-third more excess pore water pressure. Moreover, truck cyclic loading may contribute to a 20% reduction in the factor of safety for embankment stability. Nanthananthan et al. (2005) [
4] discovered that water level fluctuations in canals can lead to a 50% decrease in the factor of safety for road embankments alongside irrigation canals. Dredging activities during the summer are crucial for maintaining embankment stability [
3,
4]. This data ensures that the truck's cyclic loads are not capable of causing the embankment to fail. The primary reason for failure is the simultaneous occurrence of rapid depletion, traffic loading, and maintenance activities.
Fortunately, the study achieved satisfactory agreement results, but it also has certain limitations. Studying threshold stress and strain in soft soil can impact multiple uncontrollable parameters comprising loading frequency, stress history, soil physical state, degree of disturbance, and soil suction conditions. The soil specimen in the laboratory is expected to be completely isotropic, but in reality, the soil condition might be either partially isotropic or anisotropic. In this work, the impact of perpetual loading on fatigue under cyclic loading conditions was not considered, potentially leading to increased strain. The soil constitutive model in the commercial program has limited capabilities to assess cyclic loading effects and does not incorporate the impact loading from the contact between the wheel and pavement surface. The limitations suggest specific recommendations for future studies. To monitor the road embankment's behavior on soft soil foundation along the canal accurately, inclinometers, strain gauges, and accelerometers need to be installed in the field. These instruments will collect the necessary data to assess the risk of embankment failure during construction and operation. To enhance the accuracy of soil response, it is recommended that complex laboratory tests reminiscent of the Hollow Cyclic Triaxial Test be conducted, which considers stress rotation effects. Additionally, using a sophisticated soil constitutive model that can better capture cyclic behavior is advised to simulate the impact of cyclic stress. When designing road embankments near canals, it is crucial to consider the impact of cyclic loading from traffic on the long-term stability of the embankment.
Author Contributions
Conceptualization, K.C.C. and K.S.; methodology, T.K. and K.S.; validation, T.K. and K.S.; finite element analysis, T.K. and K.S.; investigation, T.K.; resources, T.K. and K.S.; Laboratory test, T.K.; data curation, K.S.; writing—review and editing, T.K., K.C.C. and K.S.; visualization, T.K.; supervision, K.C.C. and K.S. All authors have read and agreed to the published version of the manuscript.
Funding
No funding was used for the research.
Conflicts of Interest
The authors declare no conflict of interest.
References
- Bergado, D.T.; Patron, B.C.; Youyongwatana, W.; Chai, J.-C. ; Yudhbir Reliability-Based Analysis of Embankment on Soft Bangkok Clay. Structural Safety 1994, 13, 247–266. [Google Scholar] [CrossRef]
- Chaiyaput, S.; Suksawat, T.; Ayawanna, J. Evaluation of the Road Failure Using Resistivity and Screw Driving Sounding Testing Techniques: A Case Study in Ang Thong Province, Thailand. Engineering Failure Analysis 2021, 121, 105171. [Google Scholar] [CrossRef]
- Nanthannanthan, N. Investigation on Road Failure along the Khlong Song Irrigation Canal, Khlong Song, Pathumthani. Master thesis, Asain Insititute of Technology: Thailand, 1998.
- Nanthananthan, N.; Dissanayake, D.M.D.O.K.; Phien-Wej, N.; Zou, D.H.S. A Case Study of Road Failure along an Irrigation Canal in Bangkok Plain. Annual Transactions of IESL 1–9.
- Sanmuang, J. A Study of Failure Behavior of Canal Road on Soft Bangkok Clay Due to Water Level Fluctuation. Master thesis, Kasetsart University: Bangkok, Thailand, 2020.
- Wilson, N.E.; Greenwood, J.R. Pore Pressures and Strains After Repeated Loading of Saturated Clay. Can. Geotech. J. 1974, 11, 269–277. [Google Scholar] [CrossRef]
- Lefebvre, G.; LeBoeuf, D.; Demers, B. Stability Threshold for Cyclic Loading of Saturated Clay. Can. Geotech. J. 1989, 26, 122–131. [Google Scholar] [CrossRef]
- Loh, B.H. Behaviour of Railway Track Subgrade under Cyclic Loading. Dotoral thesis, Curtin University, 2011.
- Guo, L.; Wang, J.; Cai, Y.; Liu, H.; Gao, Y.; Sun, H. Undrained Deformation Behavior of Saturated Soft Clay under Long-Term Cyclic Loading. Soil Dynamics and Earthquake Engineering 2013, 50, 28–37. [Google Scholar] [CrossRef]
- Guo, L.; Cai, Y.; Jardine, R.J.; Yang, Z.; Wang, J. Undrained Behaviour of Intact Soft Clay under Cyclic Paths That Match Vehicle Loading Conditions. Can. Geotech. J. 2018, 55, 90–106. [Google Scholar] [CrossRef]
- Kongpanickul, S.; Mudden, F.; Chao, K.C.; Saowiang, K. Evaluation of Threshold Stress for High-Speed Railway Foundation on Bangkok Soft Clay Under Cyclic Loading.; Proceedings of the 20th International Conference on Soil Mechanics and Geotechnical Engineering, Sydney, May 2022; pp. 1–6.
- Indraratna, B.; Singh, M.; Nguyen, T.T.; Leroueil, S.; Abeywickrama, A.; Kelly, R.; Neville, T. Laboratory Study on Subgrade Fluidization under Undrained Cyclic Triaxial Loading. Can. Geotech. J. 2020, 57, 1767–1779. [Google Scholar] [CrossRef]
- Kongpanickul, S. Threshold Stress and Plastic Settlement for High Speed Railway Foundation on Bangkok Soft Clay Under Cyclic Loading. Master thesis, Asain Insititute of Technology: Thailand, 2019.
- Huang, Y.H. Pavement Analysis and Design; 2nd ed.; Pearson/Prentice Hall: Upper Saddle River, NJ, 2004; ISBN 978-0-13-142473-9.
- Karatağ, H.; Firat, S.; Işik, N.S. Evaluation of Flexible Highway Embankment Under Repetitive Wheel Loading Using Finite Element Analysis. In Proceedings of 3rd International Sustainable Buildings Symposium (ISBS 2017); Fırat, S., Kinuthia, J., Abu-Tair, A., Eds.; Lecture Notes in Civil Engineering; Springer International Publishing: Cham, 2018; Vol. 6, pp. 705–716 ISBN 978-3-319-63708-2.
- Ree, S. Part 3: Dynamic Triaxial Testing 2020.
- Li, D.; Selig, E.T. Cumulative Plastic Deformation for Fine-Grained Subgrade Soils. J. Geotech. Engrg. 1996, 122, 1006–1013. [Google Scholar] [CrossRef]
- Hendry, M.T.; Martin, C.D.; Barbour, S.L. Measurement of Cyclic Response of Railway Embankments and Underlying Soft Peat Foundations to Heavy Axle Loads. Can. Geotech. J. 2013, 50, 467–480. [Google Scholar] [CrossRef]
- Likitlersuang, S.; Pholkainuwatra, P.; Chompoorat, T.; Keawsawasvong, S. Numerical modelling of railway embankments for high-speed train constructed on soft soil. Journal of Geo-Engineering 2018, 13, 149–159. [Google Scholar]
- Cox, J.B. Shear Strength Characteristics of the Recent Marine Clays in South East Asia. Journal S.E.A.S.S.E. 1970, 1, 1–27. [Google Scholar]
- Sinsakul, S. Evidence of Quarternary Sea Level Changes in the Coastal Areas of Thailand: A Review. Journal of Southeast Asian Earth Sciences 1992, 7, 23–37. [Google Scholar] [CrossRef]
- Horpibulsuk, S.; Shibuya, S.; Fuenkajorn, K.; Katkan, W. Assessment of Engineering Properties of Bangkok Clay. Can. Geotech. J. 2007, 44, 173–187. [Google Scholar] [CrossRef]
- Amornkul, C. Engineering Subsoil Database of Lower Central Plain, Thailand. Master thesis, Kasetsart University: Bangkok, Thailand, 2010.
- Moh, Z.C.; Nelson, J.D.; Brand, E.W. Strength and Deformation Behavior of Bangkok Clay. In Proceedings of the Proceedings of the Seventh International Conference of Soil Mechanics and Foundation Engineering; Mexico, 1969; Vol. 1, pp. 287–296.
- Balasubramaniam, A.S.; Chaudry, A.R. Deformation and Strength Characteristics of Soft Bangkok Clay. J. Geotech. Engrg. Div. 1978, 104, 1153–1167. [Google Scholar] [CrossRef]
- Matasovic, N.; Vucetic, M. A Pore Pressure Model for Cyclic Straining of Clay. Soils and Foundations 1992, 32, 156–173. [Google Scholar] [CrossRef] [PubMed]
- Head, K.H. Manual of Soil Laboratory Testing. 3: Effective Stress Tests; 2. ed.; Pentech Pr: London, 1998; ISBN 978-0-471-97795-7.
- Lade, P. Triaxial Testing of Soils; John Wiley & Sons Inc: Hoboken, 2016; ISBN 978-1-119-10659-3.
- D18 Committee Test Method for Consolidated Undrained Triaxial Compression Test for Cohesive Soils; ASTM International.
- Skempton, A.W. The Pore-Pressure Coefficients A and B. Géotechnique 1954, 4, 143–147. [Google Scholar] [CrossRef]
- Bjerrum, L. Problems of Soil Mechanics and Construction on Soft Clays and Structurally Unstable Soils (Collapsible, Expansive and Others). In Proceedings of the Proceedings, Eighth International Conference of Soil Mechanics and Foundation Engineering; Moscow, 1973; Vol. 3, pp. 111–159.
- Ladd, C.C.; Foott, R. New Design Procedure for Stability of Soft Clays. J. Geotech. Engrg. Div. 1974, 100, 763–786. [Google Scholar] [CrossRef]
- Seah, T.; Lai, K. Strength and Deformation Behavior of Soft Bangkok Clay. Geotechnical Testing Journal 2003, 26, 421–431. [Google Scholar] [CrossRef]
- Burton, G.J.; Airey, D.W. Strain Rate Calculation in Consolidated Undrained Triaxial Testing and Implications on Design Strengths.; Melbourne, Australia, 2012; pp. 1063–1068.
- Holtz, R.D.; Kovacs, W.D.; Sheahan, T.C. An Introduction to Geotechnical Engineering; 2nd ed.; Pearson: Upper Saddle River, NJ, 2011; ISBN 978-0-13-249634-6.
- Das, B.M. Advanced Soil Mechanics; Fith edition.; CRC Press/Taylor & Francis Group: Boca Raton, 2019; ISBN 978-0-8153-7913-3.
- Owende, P.M.O.; Hartman, A.M.; Ward, S.M.; Gilchrist, M.D.; O’Mahony, M.J. Minimizing Distress on Flexible Pavements Using Variable Tire Pressure. J. Transp. Eng. 2001, 127, 254–262. [Google Scholar] [CrossRef]
- Lu, Z.; Fang, R.; Yao, H.; Hu, Z.; Liu, J. Evaluation and Analysis of the Traffic Load–Induced Settlement of Roads on Soft Subsoils with Low Embankments. Int. J. Geomech. 2018, 18, 04018043. [Google Scholar] [CrossRef]
- Liu, J.; Xiao, J. Experimental Study on the Stability of Railroad Silt Subgrade with Increasing Train Speed. J. Geotech. Geoenviron. Eng. 2010, 136, 833–841. [Google Scholar] [CrossRef]
- Al-Qadi, I.L.; Elseifi, M.A.; Yoo, P.J.; Dessouky, S.H.; Gibson, N.; Harman, T.; D’Angelo, J.; Petros, K. Accuracy of Current Complex Modulus Selection Procedure from Vehicular Load Pulse: NCHRP Project 1-37A Mechanistic-Empirical Pavement Design Guide. Transportation Research Record 2008, 2087, 81–90. [Google Scholar] [CrossRef]
- Yang, Q.; Ren, Y.; Niu, J.; Cheng, K.; Hu, Y.; Wang, Y. Characteristics of Soft Marine Clay under Cyclic Loading: A Review. Bull Eng Geol Environ 2018, 77, 1027–1046. [Google Scholar] [CrossRef]
- Sævarsdóttir, Þ. Performance Modelling of Flexible Pavements Tested in a Heavy Vehicle Simulator. Doctoral thesis, University of Iceland: Reykjavik, 2014.
- Abusharar, S.W.; Han, J. Two-Dimensional Deep-Seated Slope Stability Analysis of Embankments over Stone Column-Improved Soft Clay. Engineering Geology 2011, 120, 103–110. [Google Scholar] [CrossRef]
- Huang, Y.H. Slope Stability Analysis by the Limit Equilibrium Method; ASCE Press: Reston, Virginia, 2014; ISBN 978-0-7844-1288-6.
- Selig, E.T.; Waters, J.M. Track Geotechnology and Substructure Management; Thomas Telford Publishing, 1994; ISBN 978-0-7277-4982-6.
- Eberhardt, E. Geological Engineering Practice I – Rock Engineering (Lecture 10: Deformation Analysis and Elasto-Plastic Yield). 2017.
- Ezzat, M. Numerical Analysis in Geotechnical Engineering (Theory and Application, Lecture 5). 2018.
- Potts, D.M.; Zdravković, L. Finite Element Analysis in Geotechnical Engineering. Application; Thomas Telford: London, 2001; ISBN 978-0-7277-2783-1.
- PLAXIS Material Models CONNECT Edition V20.02 2020.
- Obrzud, R.F.; Truty, A. The Hardening Soil Model - A Practical Guidebook; Zace Services Ltd.: Switzerland, 2018; pp. 1–127.
- Surarak, C.; Likitlersuang, S.; Wanatowski, D.; Balasubramaniam, A.; Oh, E.; Guan, H. Stiffness and Strength Parameters for Hardening Soil Model of Soft and Stiff Bangkok Clays. Soils and Foundations 2012, 52, 682–697. [Google Scholar] [CrossRef]
- Jamsawang, P. Full Scale Tests on Stiffened Deep Cement Mixing (SDCM) Pile Including 3D Finite Element Simulation. Doctoral thesis, Asain Insititute of Technology, 2009.
-
Soft Ground Improvement: In Lowland and Other Environments; Bergado, D.T., Ed.; ASCE Press: New York, N.Y, 1996; ISBN 978-0-7844-0151-4.
-
Geotechnical Aspects of Underground Construction in Soft Ground: Proceedings of the 7th International Symposium on Geotechnical Aspects of Underground Construction in Soft Ground, Roma, Italy, 17-19 May 2011; Viggiani, G., Ed.; CRC Press: Boca Raton, Fla., 2012; ISBN 978-0-415-68367-8.
- Likitlersuang, S.; Surarak, C.; Balasubramaniam, A.; Oh, E.; Syeung Ryull, K.; Wanatowski, D. Duncan-Chang -Parameters for Hyperbolic Stress Strain Behaviour of Soft Bangkok Clay. 2013.
- Jongpradist, P.; Detkhong, T.; Youwei, S. Numerical Simulations of Geotechnical Works in Bangkok Subsoil Using Advanced Soil Models Available in Plaxis and Through User-Defined Model - GeoStudio | PLAXIS Wiki - GeoStudio | PLAXIS - Bentley Communities Available online: (accessed on 23 February 2024).
- Saowiang, K. Sea-Level Related Engineering Geology and Intrinsic Compression Behaviour of Bangkok Clays. GEOMATE 2019, 17. [Google Scholar] [CrossRef]
- Mulungye, R.M.; Owende, P.M.O.; Mellon, K. Finite Element Modelling of Flexible Pavements on Soft Soil Subgrades. Materials & Design 2007, 28, 739–756. [Google Scholar]
- Leonardi, G.; Palamara, R.; Calvarano, L.S. Numerical Analysis of Flexible Pavement Reinforced with Geogrids. In Airfield and Highway Pavements 2017; 2017; pp. 416–427.
- Manuals Archive - PLAXIS - GeoStudio | PLAXIS Wiki - GeoStudio | PLAXIS - Bentley Communities Available online:. Available online: https://communities.bentley.com/products/geotech-analysis/w/wiki/50826/manuals-archive---plaxis (accessed on 29 February 2024).
Figure 1.
General methodology used to investigate the repetitive loading impact on the embankment.
Figure 1.
General methodology used to investigate the repetitive loading impact on the embankment.
Figure 2.
The classification zones of similar soil thickness of Bangkok soft clay [
5].
Figure 2.
The classification zones of similar soil thickness of Bangkok soft clay [
5].
Figure 3.
The sinusoidal function of traffic loading.
Figure 3.
The sinusoidal function of traffic loading.
Figure 4.
The strain response of soft soil underneath traffic loading.
Figure 4.
The strain response of soft soil underneath traffic loading.
Figure 5.
Site location on the rural road No. PT.5021 of this study.
Figure 5.
Site location on the rural road No. PT.5021 of this study.
Figure 6.
Summary of the soil boring data and soil profile in the study area: (a) Soil physical and engineering properties; (b) Estimation of longitudinal soil profile in the study area.
Figure 6.
Summary of the soil boring data and soil profile in the study area: (a) Soil physical and engineering properties; (b) Estimation of longitudinal soil profile in the study area.
Figure 7.
Summary of the CU tests of Bangkok soft clay layer (a) the relationship between deviatoric stress and axial strain; (b) the relationship between excess pore water pressure and axial strain; (c) the stress path diagram; (d) the shear stress – principal effective stress chart.
Figure 7.
Summary of the CU tests of Bangkok soft clay layer (a) the relationship between deviatoric stress and axial strain; (b) the relationship between excess pore water pressure and axial strain; (c) the stress path diagram; (d) the shear stress – principal effective stress chart.
Figure 8.
Summary of the cyclic undrained consolidated triaxial tests of Bangkok soft clay layer (a) The relationship between the number of cycles and cumulative axial strain (CSR = 0.18 and 0.38); (b) The relationship between the number of cycles and excess pore water pressure (CSR = 0.18 and 0.38); (c) The relationship between the number of cycles and cumulative axial strain (CSR = 0.73 and 0.75); (d) The relationship between the number of cycles and excess pore water pressure (CSR = 0.73 and 0.75).
Figure 9.
Schematic of the cyclic stress path: (a) Cyclic stress path of CSR = 0.18, 0.37 and 0.73 (f = 1.50 Hz.); (b) Cyclic stress path of CSR = 0.18, 0.37 and 0.75 (f = 2.50 Hz.).
Figure 9.
Schematic of the cyclic stress path: (a) Cyclic stress path of CSR = 0.18, 0.37 and 0.73 (f = 1.50 Hz.); (b) Cyclic stress path of CSR = 0.18, 0.37 and 0.75 (f = 2.50 Hz.).
Figure 10.
Schematic of the relationship between the number of cycles and cumulative axial strain: (a) Comparison results between empirical model and laboratory test (f = 1.50 Hz., CSR = 0.18); (b) Comparison results between empirical model.
Figure 10.
Schematic of the relationship between the number of cycles and cumulative axial strain: (a) Comparison results between empirical model and laboratory test (f = 1.50 Hz., CSR = 0.18); (b) Comparison results between empirical model.
Figure 11.
The 2-d Plaxis embankment simulation cases.
Figure 11.
The 2-d Plaxis embankment simulation cases.
Figure 12.
Schematic of the calibration of the input Modified Cam clay (MCC) soil model with laboratory results of soft clay (a) The relationship between deviatoric stress and axial strain; (b) The relationship between excess pore water pressure and axial strain; (c) The effective stress path diagram.
Figure 13.
Schematic of the total displacement, accumulated axial strain, excess pore water pressure, and the number of cycles of four main numerical cases.
Figure 13.
Schematic of the total displacement, accumulated axial strain, excess pore water pressure, and the number of cycles of four main numerical cases.
Figure 14.
Schematic of the validation outcome of cumulative axial strain of the cyclic loading simulation.
Figure 14.
Schematic of the validation outcome of cumulative axial strain of the cyclic loading simulation.
Figure 15.
Schematic of the distribution of shear strain on various numerical cases.
Figure 15.
Schematic of the distribution of shear strain on various numerical cases.
Table 1.
Summary of consolidated undrained triaxial tests (CU) for weather crust and Bangkok soft clay.
Table 1.
Summary of consolidated undrained triaxial tests (CU) for weather crust and Bangkok soft clay.
| Soil type |
Series |
Test No. |
Depth (m) |
(KPa) |
(KPa) |
|
Targeted OCR |
| Soft clay |
CIU-I |
CIU-1 |
5.50 |
80 |
50.50 |
1.58 |
1 |
| CIU-2 |
5.50 |
150 |
50.50 |
2.97 |
1 |
| CIU-3 |
5.25 |
300 |
50.50 |
6.15 |
1 |
| CIU-4 |
5.25 |
550 |
50.50 |
11.28 |
1 |
Table 2.
Summary of the interpretation of MCM and other parameters of Bangkok soft clay.
Table 2.
Summary of the interpretation of MCM and other parameters of Bangkok soft clay.
| Order |
Lists of parameters |
Interpreted results |
Literature results |
Reference |
| 1 |
Initial stiffness () |
9,000 – 13,333 (KPa.) |
7,690 – 11,300 |
Viggiani, 2012 |
| |
|
|
|
Surarak et al, 2012 |
| 2 |
50% deviatoric stress stiffness () |
10,000 – 15,000 (KPa.) |
4,831 – 10,000 (KPa.) |
Jongpadit et al., 2010
Surarak et al, 2012
Likitlersuang et al, 2012
Viggiani, 2012 |
| 3 |
Frictional angle () |
21.80 |
17.80 - 22.60 |
Moh et al., 1969 |
| 4 |
Cohesion () |
0 (KPa.) |
0 – 17.50 (KPa.) |
Moh et al., 1969 |
Table 3.
Summary of cyclic consolidated undrained triaxial tests for the Bangkok soft clay.
Table 3.
Summary of cyclic consolidated undrained triaxial tests for the Bangkok soft clay.
| Order |
Description |
(KPa.) |
|
Load frequency (Hz.) |
The number of cycles |
| 1 |
Threshold stress |
300 |
0.73 – 0.75 |
1.50 and 2.50 |
- |
| 2 |
Simulated vehicle loading |
300 |
0.38 |
50,000 |
| 3 |
300 |
0.18 |
50,000 |
Table 4.
Summary of the curve fitting equation and R-square value of Li and Selig empirical model.
Table 4.
Summary of the curve fitting equation and R-square value of Li and Selig empirical model.
| Order |
CSR |
Frequency (Hz.) |
a |
b |
m |
Equation |
|
| 1 |
0.18 |
1.50 |
2.50 |
0.11 |
1.348 |
= 2.50 () |
0.970 |
| 2 |
0.18 |
2.50 |
2.57 |
0.11 |
1.385 |
= 2.57 () |
0.981 |
| 3 |
0.37 |
1.50 |
6.40 |
0.042 |
1.820 |
= 6.40 () |
0.957 |
| 4 |
0.37 |
2.50 |
6.30 |
0.039 |
1.840 |
= 6.30 () |
0.950 |
Table 5.
Numerical simulation cases of traffic loading impact on the road embankment along an irrigation canal.
Table 5.
Numerical simulation cases of traffic loading impact on the road embankment along an irrigation canal.
| Case No. |
Frequency (Hz.) |
Thickness of soft clay (m.) |
The number of cycles |
| 1.1 |
2.50 |
5.50 |
50,000 |
| 1.2 |
1.50 |
5.50 |
| 2.1 |
2.50 |
10.00 |
| 2.2 |
1.50 |
10.00 |
Table 6.
Summary and comparison of the input MCC and HSM soil models of Bangkok soft clay.
Table 6.
Summary and comparison of the input MCC and HSM soil models of Bangkok soft clay.
| Materials |
Soil model |
Behavior |
MCC. |
|
|
HSM. and MCM. |
|
|
M |
(KPa) |
(KPa) |
(KPa) |
m |
(KPa) |
(KPa) |
(Deg) |
| Asphaltic concrete |
LEM |
Drain |
- |
- |
- |
- |
- |
- |
- |
|
- |
- |
| Granular material |
MCM. |
Drain |
- |
- |
- |
- |
- |
- |
- |
400,000 |
80 |
39 |
| Soft clay |
MCC, HSM |
Undrain |
0.36 |
0.049 |
0.84 |
7,900 |
7,100 |
20,800 |
1 |
- |
0.05 |
20.25 |
| Weather crust |
MCM |
- |
- |
- |
- |
- |
- |
- |
15,000 |
40 |
20 |
| Medium clay |
MCM. |
- |
- |
- |
- |
- |
- |
- |
12,000 |
10 |
25 |
| Stiff clay |
MCM |
- |
- |
- |
- |
- |
- |
- |
20,000 |
10 |
26 |
Table 7.
Summary of results of embankment stability analysis.
Table 7.
Summary of results of embankment stability analysis.
| Order |
Case No. |
FS before traffic loading simulation |
FS after traffic loading simulation |
| 1 |
Case 1.1 |
1.655 |
1.284 |
| 2 |
Case 1.2 |
1.655 |
1.331 |
| 3 |
Case 2.1 |
1.623 |
1.281 |
| 4 |
Case 2.2 |
1.623 |
1.308 |
|
Disclaimer/Publisher’s Note: The statements, opinions and data contained in all publications are solely those of the individual author(s) and contributor(s) and not of MDPI and/or the editor(s). MDPI and/or the editor(s) disclaim responsibility for any injury to people or property resulting from any ideas, methods, instructions or products referred to in the content. |
© 2024 by the authors. Licensee MDPI, Basel, Switzerland. This article is an open access article distributed under the terms and conditions of the Creative Commons Attribution (CC BY) license (http://creativecommons.org/licenses/by/4.0/).
