1. Introduction
The recent SARS-CoV-2 outbreak has raised concerns about global health, prompting the development of vaccines to lower its severity and limit its spread [
1,
2]. Multiple vaccine platforms, particularly viral vector and mRNA vaccines were developed with excellent efficacy in response to this sudden outbreak [
3]. Despite their rapid development, these vaccines were found unstable and require storage at ultra-low or sub-zero temperatures [
4,
5]. Therefore, a strictly monitored cold chain distribution system is required for transport and storage. This is particularly challenging in low- and medium-income countries with intermittent or deficient power supply [
6]. This costly temperature control infrastructure is considered one of the prime challenges to global vaccine availability [
7]. The World Health Organization reports that millions of vaccine doses are wasted each year due to a lack of vaccine thermostability, thereby increasing the overall cost of vaccines [
8]. Therefore, evaluating the factors that contribute to vaccine loss is critical to the improvement of vaccine stability and to minimizing costs [
9].
The notion of “vaccine instability” refers to a phenomenon where a vaccine gradually loses its efficacy over time. Several factors contribute to vaccine instability, including temperature fluctuations, pH changes, freeze-thaw stresses, chemical reactions, oxidation, and contamination. Among these factors, temperature has a significant impact on live viral vector vaccines. Exposure to temperatures that are too high or too low can denature or damage the vaccine’s components, rendering the vaccine ineffective [
10]. Furthermore, repeated freeze-thaw cycles can lead to the physical breakdown of the viral vector particles and the genetic material. Therefore, proper formulation and storage conditions, including control of pH, osmolarity, and the addition of stabilizers, are crucial for maintaining the stability of viral vectored vaccines [
11,
12].
Most viruses are unstable in liquid forms above refrigerated temperatures due to water-mediated destabilization and degradation mechanisms [
12,
13]. To overcome this instability, freeze-drying is used to dehydrate viral vector vaccines, immobilizing their structures and biological activities [
14]. This technique is effective for the long-term storage of viral vector vaccines [
15,
16]. Several parameters of the freeze-drying cycle, known as critical process parameters (CPPs), can influence the quality of live viral vector vaccines. These CPPs include freezing rate, ramp rate, temperature, pressure, pH, storage vials, buffers and cryoprotectants [
17,
18]. These parameters must be evaluated and controlled carefully to minimize the loss of viral infectivity. Moreover, the final formulation of the freeze-dried vaccine must meet certain quality thresholds to be accepted as a successful solid formulation. These qualities are generally known as critical quality attributes (CQAs) and include thresholds describing cake stability, resuspension efficiency, and moisture content [
19,
20].
In contrast to non-enveloped viruses, enveloped viruses exhibit greater susceptibility to freeze-drying stress due to their fragile lipid bilayer [
13]. To maintain infectivity and functionality, they must preserve their envelope structure [
15,
19]. To minimize stresses induced during freeze-drying, sufficient cryoprotection media is required during the process [
21,
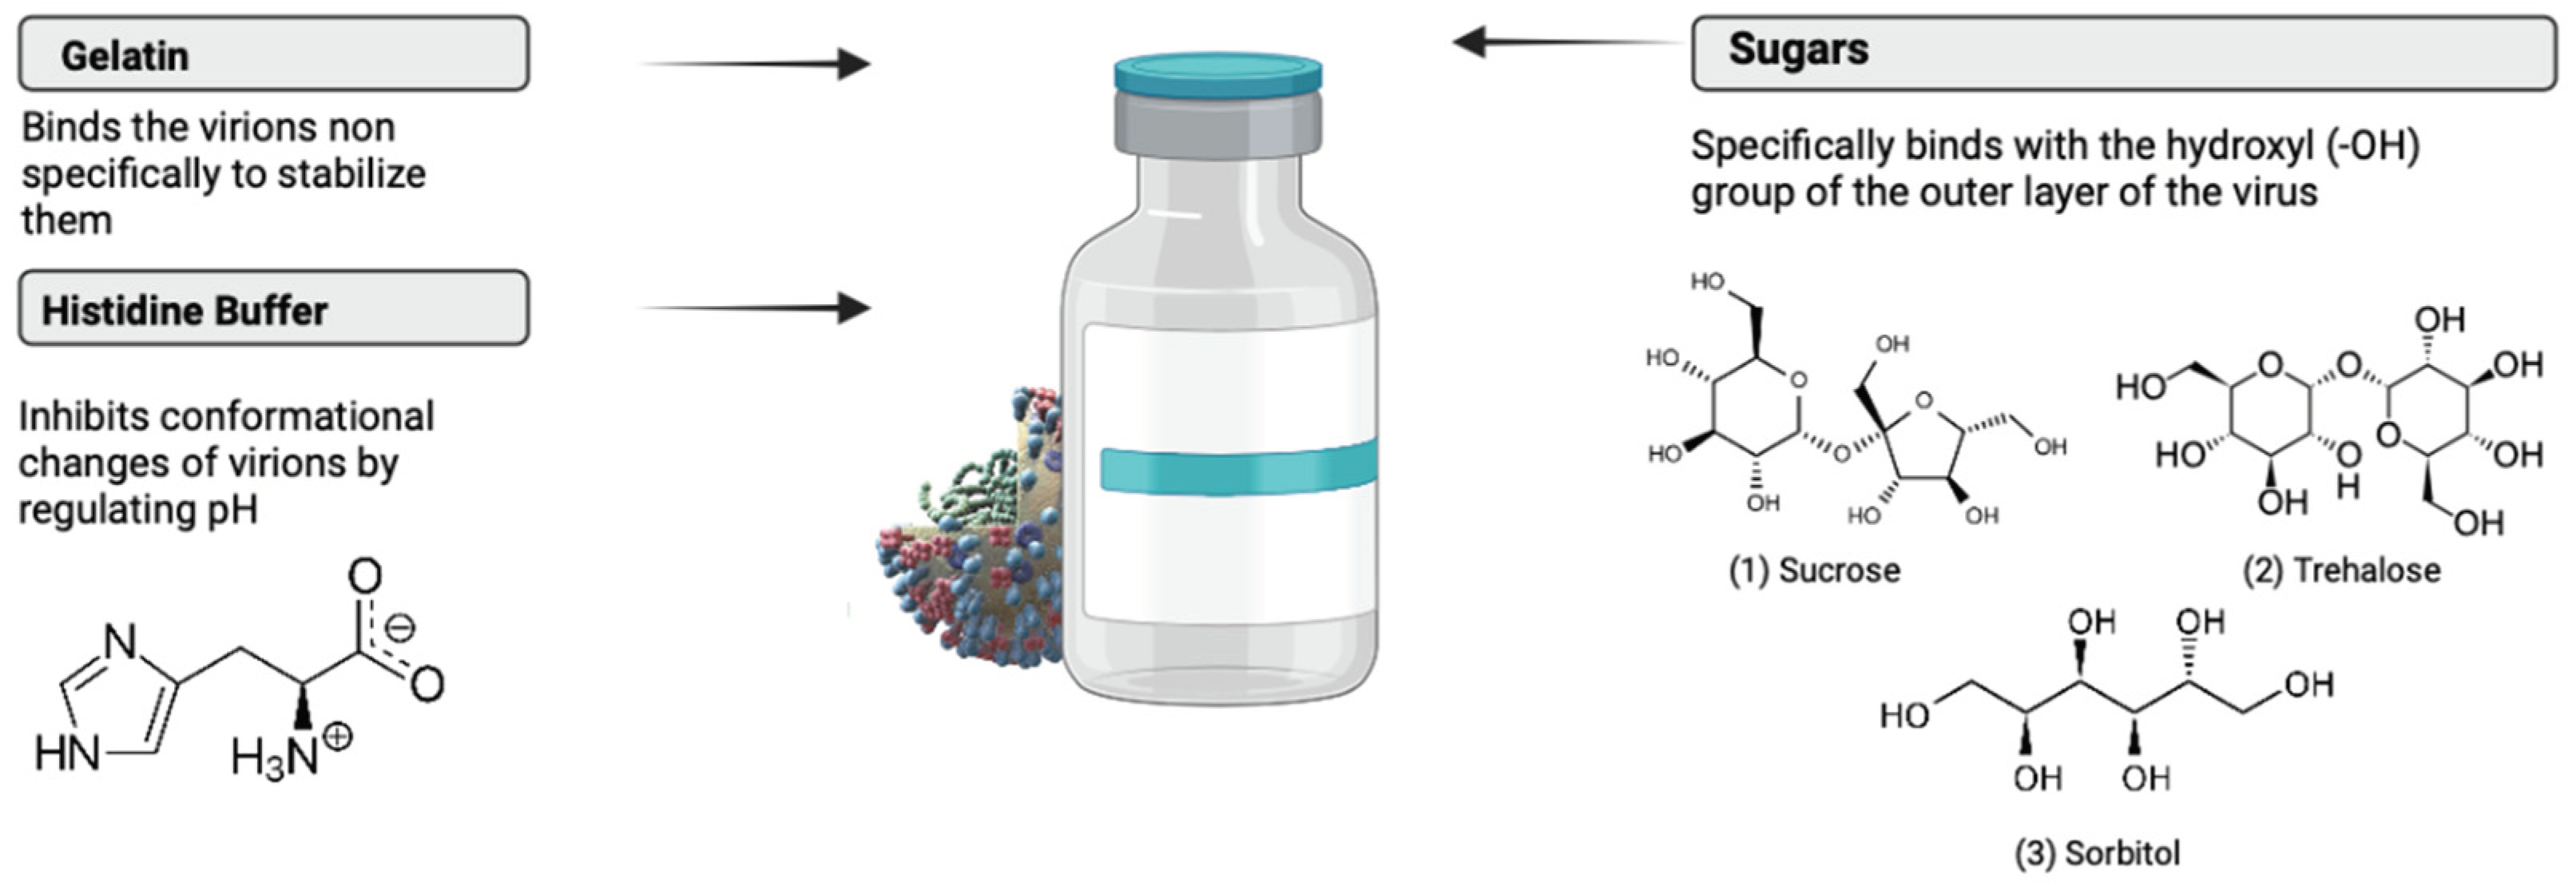
22]. Sugars protect live viruses during freeze-drying by generating a glass structure, a process known as vitrification, and by forming hydrogen bonds, a process known as water substitution (
Figure 1) [
23,
24,
25,
26]. Sugars like sucrose and trehalose are often recommended as suitable stabilizers since they retain their amorphous structure throughout the process [
27]. In comparison to other monosaccharides, these sugars have high glass transition temperature (T
g) and high collapse temperature (T
c) [
20,
28,
29,
30]. This increases the chemical potential of the vaccine and ensures a compact state of the structure [
31]. Cryo-concentrated sugars improve stability by reducing reaction rates and inhibiting structural mobility [
15]. These sugars also confer both colloidal and conformational stability to the viral vector under extreme conditions [
14]. Moreover, stabilizers like gelatin are used in freeze-dried live viral vector vaccines. Gelatin’s gelling properties are often utilized to protect vaccines against temperature-induced inactivation (
Figure 1). Further, hydrolyzed gelatin inhibits free radical reactions by acting as an antioxidant [
32].
A brief literature review was performed to determine the viral vector product formulations currently used in both the vaccine and gene therapy fields.
Table 1 highlights some of the excipients which were found effective in freeze-dried viral vector drug products.
In this study, we present the design and development of a freeze-drying process for the enveloped vector rVSV-SARS-CoV-2. VSV, as an enveloped virus, is considered a promising viral vector vaccine because it can elicit both strong humoral and cellular immune responses [
41]. Its genome is also large enough (11 kb) to incorporate many sizable inserts [
42]. In addition, the genomic structure of VSV is well understood, facilitating genome editing [
43,
44,
45,
46,
47]. A VSV-based Ebola vaccine was recently approved for human use and another VSV-based COVID-19 vaccine is under development [
48]. In both cases, VSV envelope glycoprotein G was replaced by the Ebola virus glycoprotein, or the SARS-CoV-2 spike antigen, resulting in a replication-competent virus.
Here, several formulations were initially screened and those that could reduce the freeze-drying stresses were selected. CPPs like temperature, pressure, time, and ramp rate were optimized at different stages of the freeze-drying process. Throughout this optimization, CQAs like cake formation, cake stability, resuspension efficiency and moisture content were evaluated in the development of the freeze-drying process. The freeze-dried viruses from different process stages and their long-term stability were finally evaluated through an infectivity assay.
3. Results
3.1. Effect of Final Moisture Content
This part of the research aimed to determine the ideal moisture range, which is considered one of the CQAs for the enveloped rVSV-SARS-CoV-2 vector. Three primary formulations (SMH, TMH, and SoMH) were selected (
Table 2) and evaluated at four different moisture ranges (<1%, 1-3%, 3-6%, and 10%). This study revealed that extreme moisture content levels ultimately led to poor stability or cake deterioration (<1% or 10%). Furthermore, we found that a narrow window of final moisture content led to a comparatively high recovery of infectious viral titers (3-6%) and enhanced cake stability.
Figure 2 displays the TCID
50 results of infectious viruses lyophilized to various moisture contents.
There is a clear trend indicating that the infectious viral titer recovery increases as the final moisture content increases. The highest loss of infectious viral titer was observed at < 1% moisture content, showing ~ 2.5 to 3.5 log loss of infectivity across all three formulations. Within the moisture range of 1-3%, the change in infectious viral titer varied between the three formulations. The trehalose-containing formulation (TMH) showed 1.7±0.2 log loss of infectious viral titer, whereas both the sucrose- (SMH) and sorbitol-containing (SoMH) formulations showed > 2. Within the final moisture content range of 3-6%, all formulations demonstrated an infectious viral log loss of ~ 0.5 to 0.7. Finally, at 10% final moisture content, despite no loss of infectious viral titer being observed, the lyophilized cake collapsed within 24 hours.
These findings highlight the critical importance of moisture content in preserving viral infectivity and cake stability during freeze-drying. The optimal moisture level (3-6%) resulted in high viral titer recovery and stable cake formation, indicating the suitability of this range for the lyophilized rVSV-SARS-CoV-2 formulations. These results emphasize the need for precise control of moisture content to ensure that freeze-dried viral products maintain high efficacy and long shelf lives.
3.2. Effect of Formulation’s Composition and Concentration
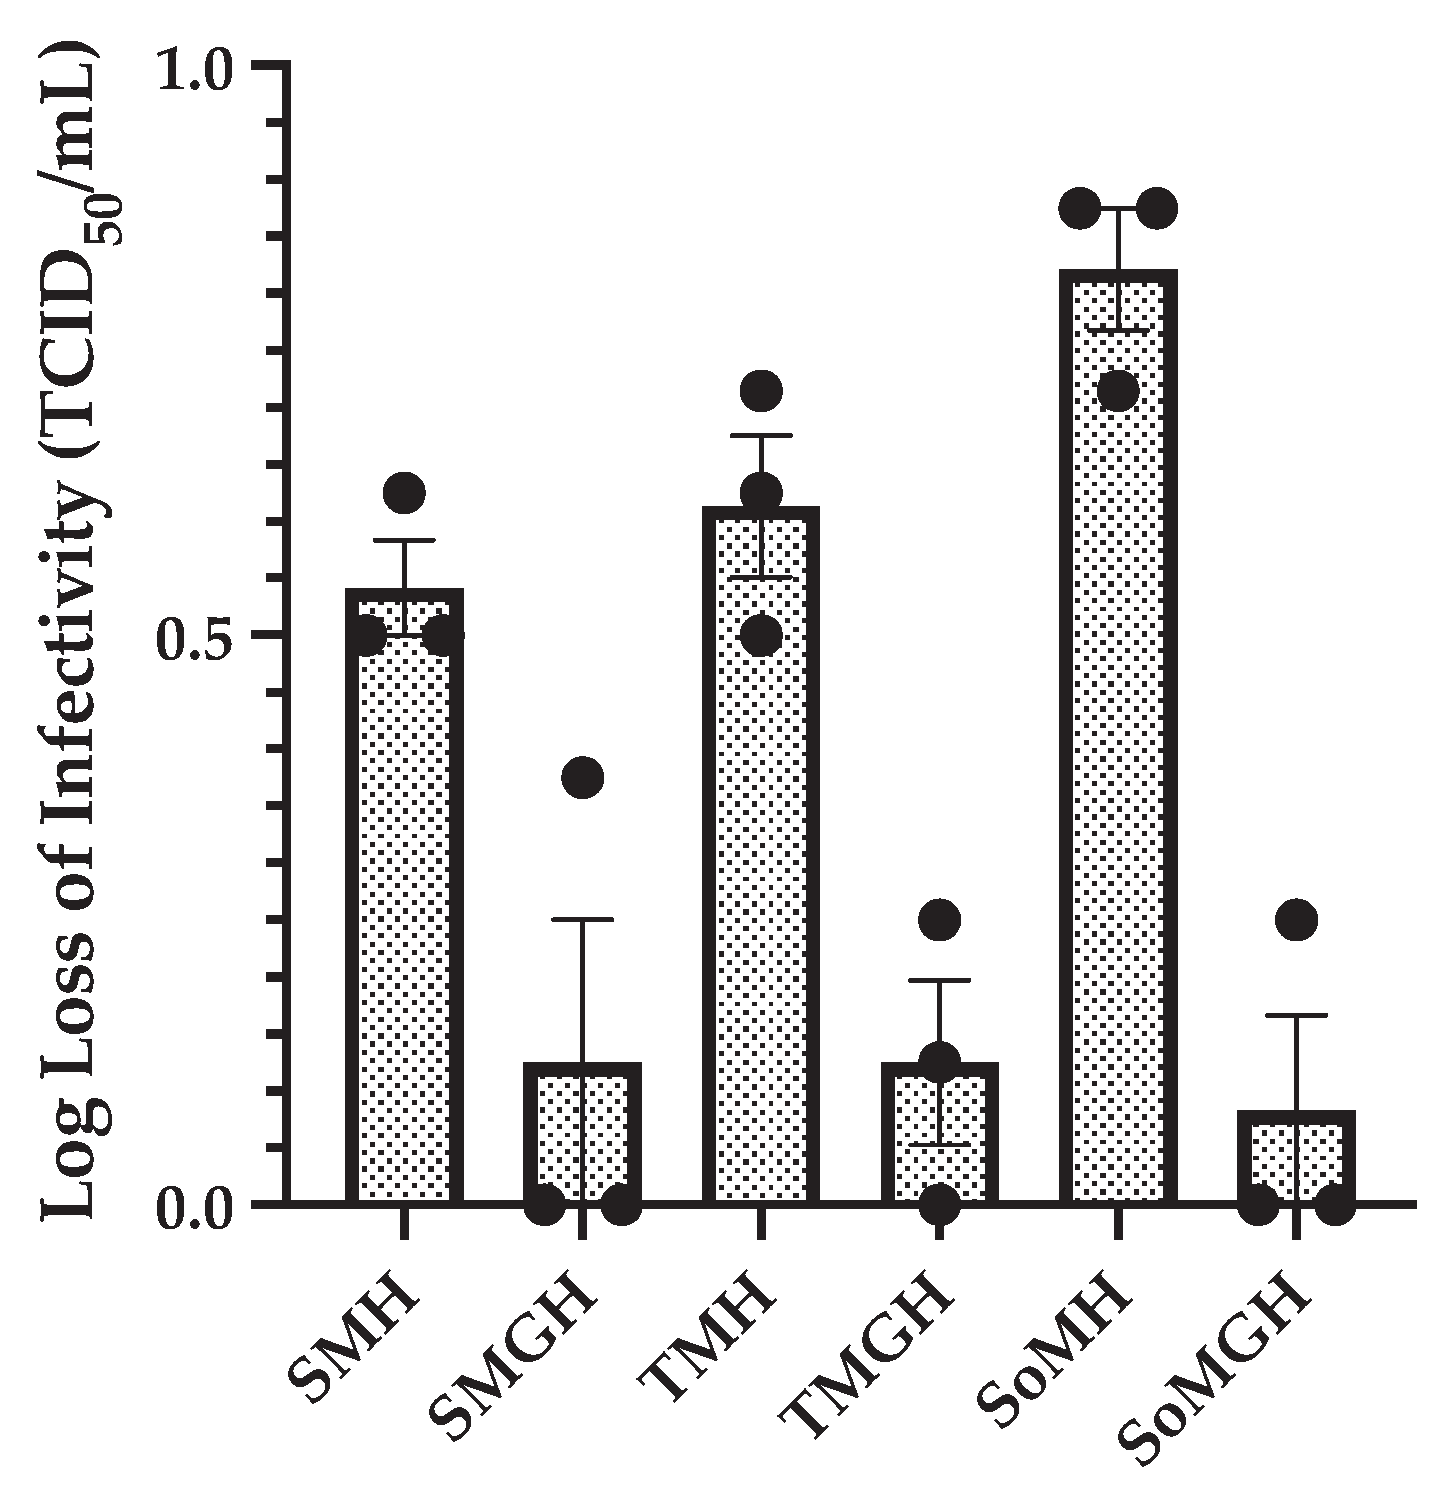
Next, as a stepwise improvement in the freeze-dried formulations, the composition and concentrations of excipients were evaluated. In this part of the analysis, we observed that excipient concentrations had a major impact on the infectivity of freeze-dried formulations. Initially, formulations predominantly composed of 5% cryoprotectant and 5% lyoprotectant exhibited a notable loss in infectious viral titer (~ 0.5 to 0.8 log loss) after freeze-drying. To investigate this phenomenon, we systematically increased the concentrations of both cryoprotectant and lyoprotectant from 5 to 10% and 0.5% gelatin was added. These were labelled as SMGH, TMGH and SoMGH, as given in
Table 2. These modified formulations demonstrated a remarkable improvement in the recovery of infectivity. Notably, all new formulations showed < 0.2 log loss of infectious viral titer.
Figure 3 compares these new formulations with the previous formulations.
These results highlight the critical role of a formulation’s composition and concentration in safeguarding viral integrity during freeze-drying processes. By increasing the concentrations of cryoprotectants, and lyoprotectants and incorporating gelatin, these formulations effectively mitigated the detrimental effects of freeze-drying stress on the infectivity of rVSV-SARS-CoV-2. Moreover, the increased concentration of lyoprotectants positively influenced cake thickness, indicating improved structural integrity.
3.3. Effect of Temperature
To investigate the effect of CPPs, we also studied the impact of several freeze-drying cycle parameters on the infectivity of rVSV-SARS-CoV-2. Among all of the CPPs evaluated, temperature had the most significant effect on the infectivity of the viral vector and the structural integrity of the lyophilized cake. Three optimized formulations (SMGH, TMGH and SoMGH) were used to evaluate the temperature effect across all freeze-drying stages while considering the previously optimized moisture content range.
In the freezing stage, samples were taken at the middle and end of the process. No decline in the infectious virus titer was found throughout the freezing phase. Different temperature ramp rates, from 0.1 to 1°C/min, were tested in the freezing stage to investigate the potential influence on the infectivity of the viral vector. These variations in ramp rate showed no influence on the infectivity.
In the next phase, the temperature of the primary drying was set to -30°C based on the Tg and Tc values of the formulations. The primary drying stage was the longest step of the freeze-drying cycle, taking approximately 15 hours. During this step, no loss of infectious viral titer was observed. In addition, different ramp rates (0.1 to 1°C/min) used in the primary drying showed no loss of viral titer.
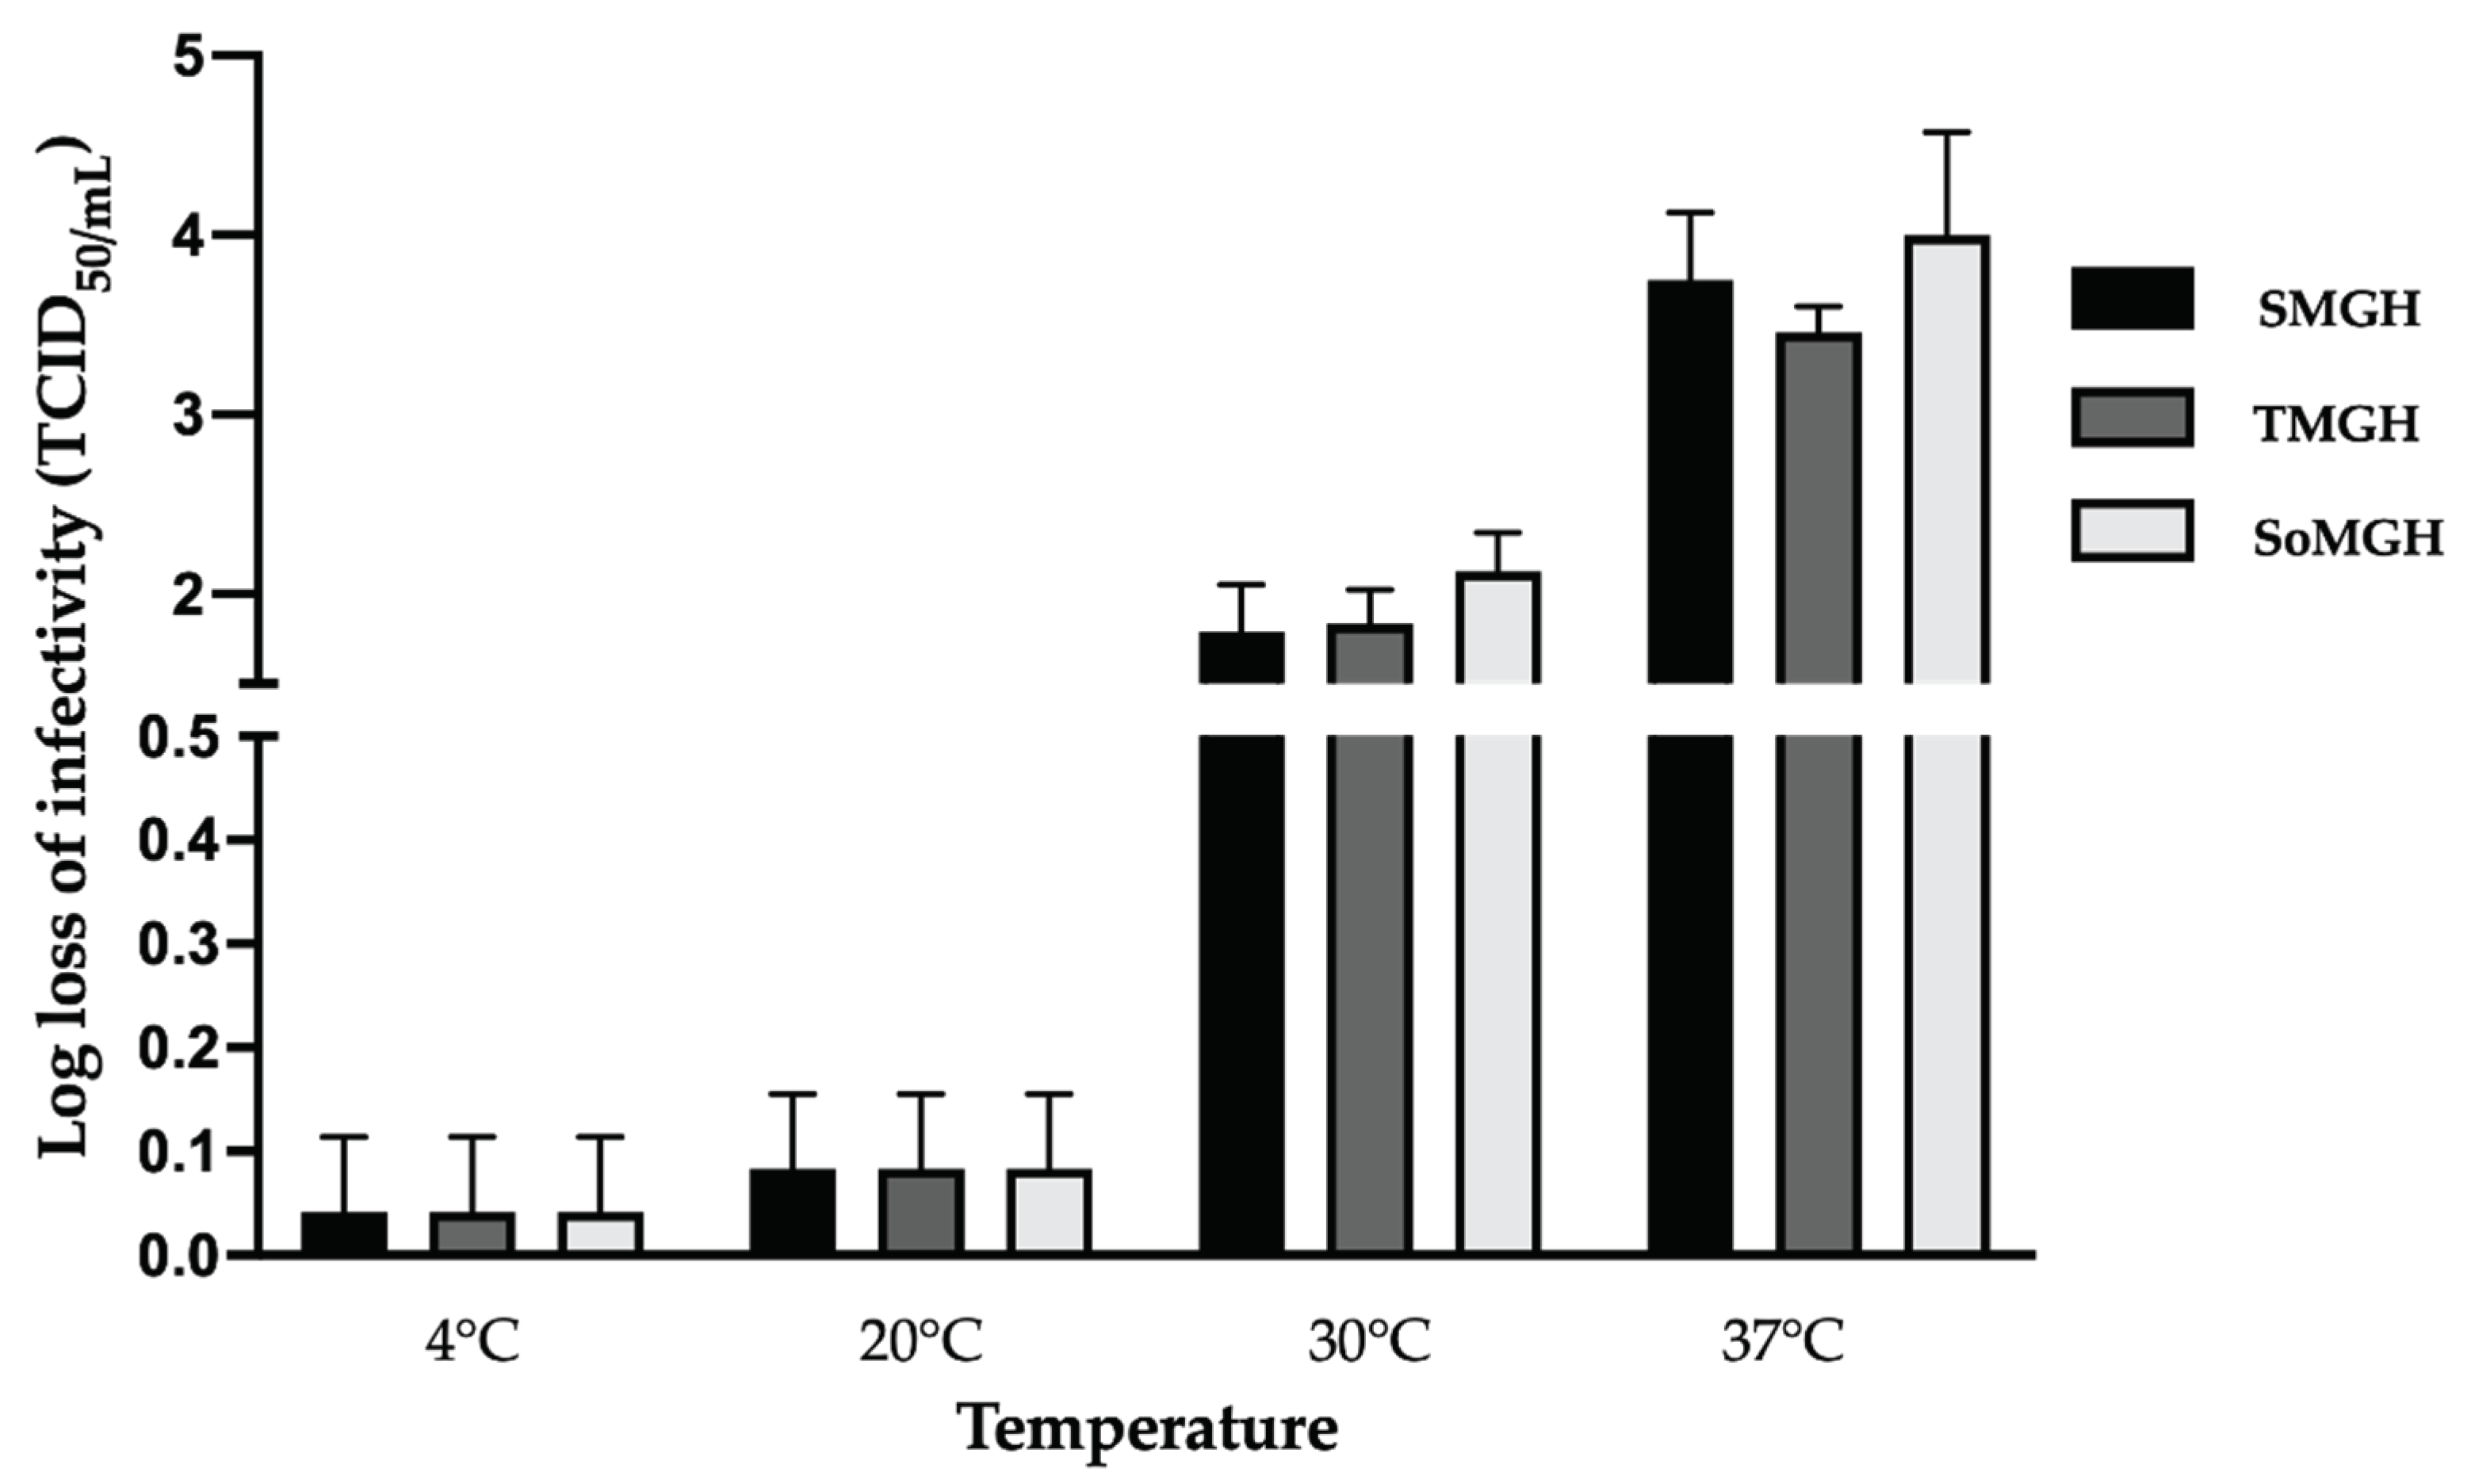
During the secondary drying step, the temperature is gradually increased, and the vacuum pressure is lowered to evaporate the residual water. These extreme conditions induce more stress on the viral vector. To assess the impact of temperature during this phase, several temperatures were tested. Secondary drying at refrigerated temperatures (4°C) brought no significant loss of viral titer (< 0.1 log loss of infectivity). To reduce drying time, the secondary drying temperature was increased from 4 to 20°C, where the three formulations also showed no major loss (~ 0.1 to 0.2 log loss) of infectious viral titer (
Figure 4). However, when the temperature of secondary drying was raised above 20°C, a significant loss of infectivity of the vector was observed. In the three formulations, secondary drying at 30 and 37°C showed 2±0.5 and 3.8±0.7 log loss of infectious viral titer, respectively. The observed infective viral titer loss in all three formulations indicates that the excipients used in these formulations were not successful in preventing viral loss at elevated temperatures. Based on these findings, the secondary drying temperature was set to 20°C to reduce significant losses and minimize the duration of this process (
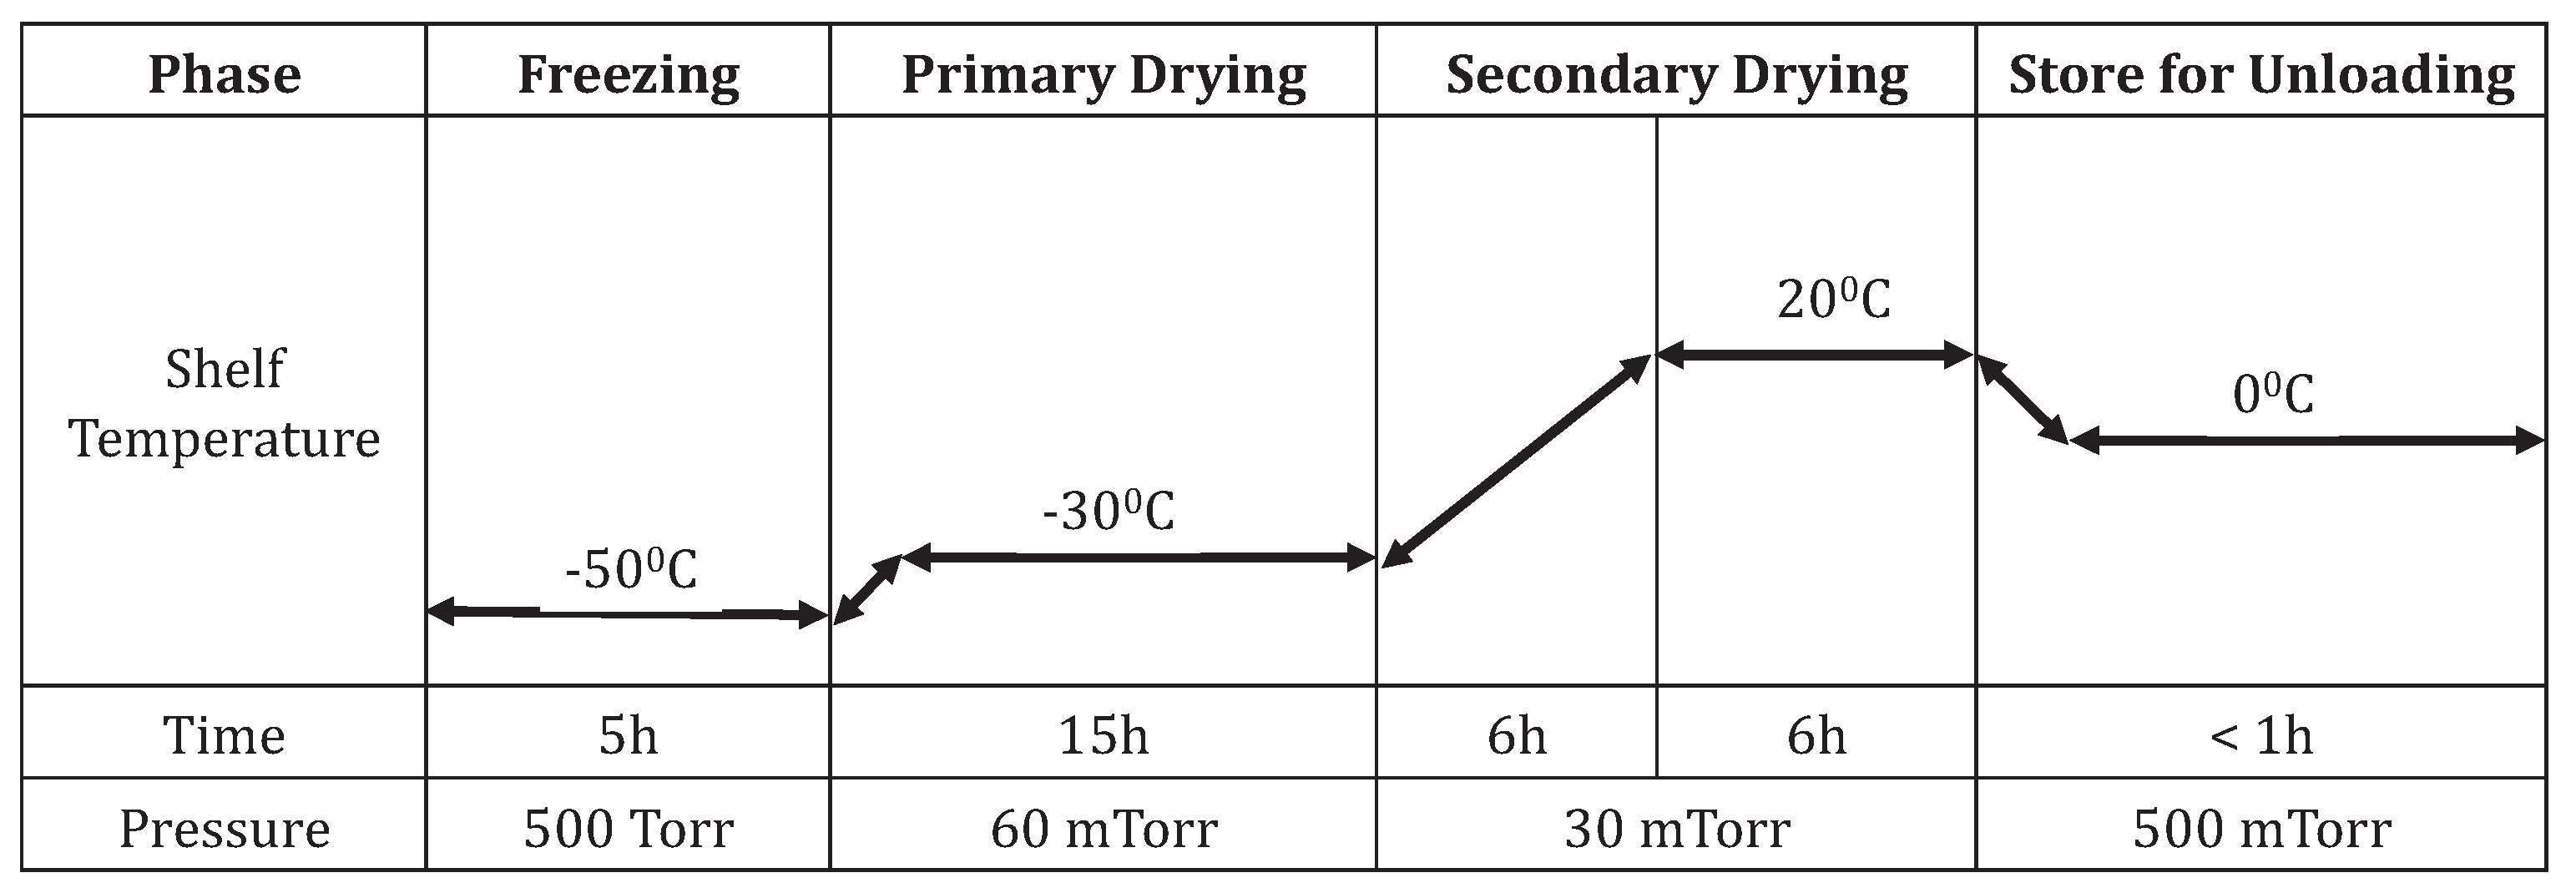
Figure 4). Here, a slow ramp rate of ~ 0.1°C/min was applied from primary drying to secondary drying to minimize the freeze-drying stress (
Figure 5).
3.4. Long-Term Stability Data
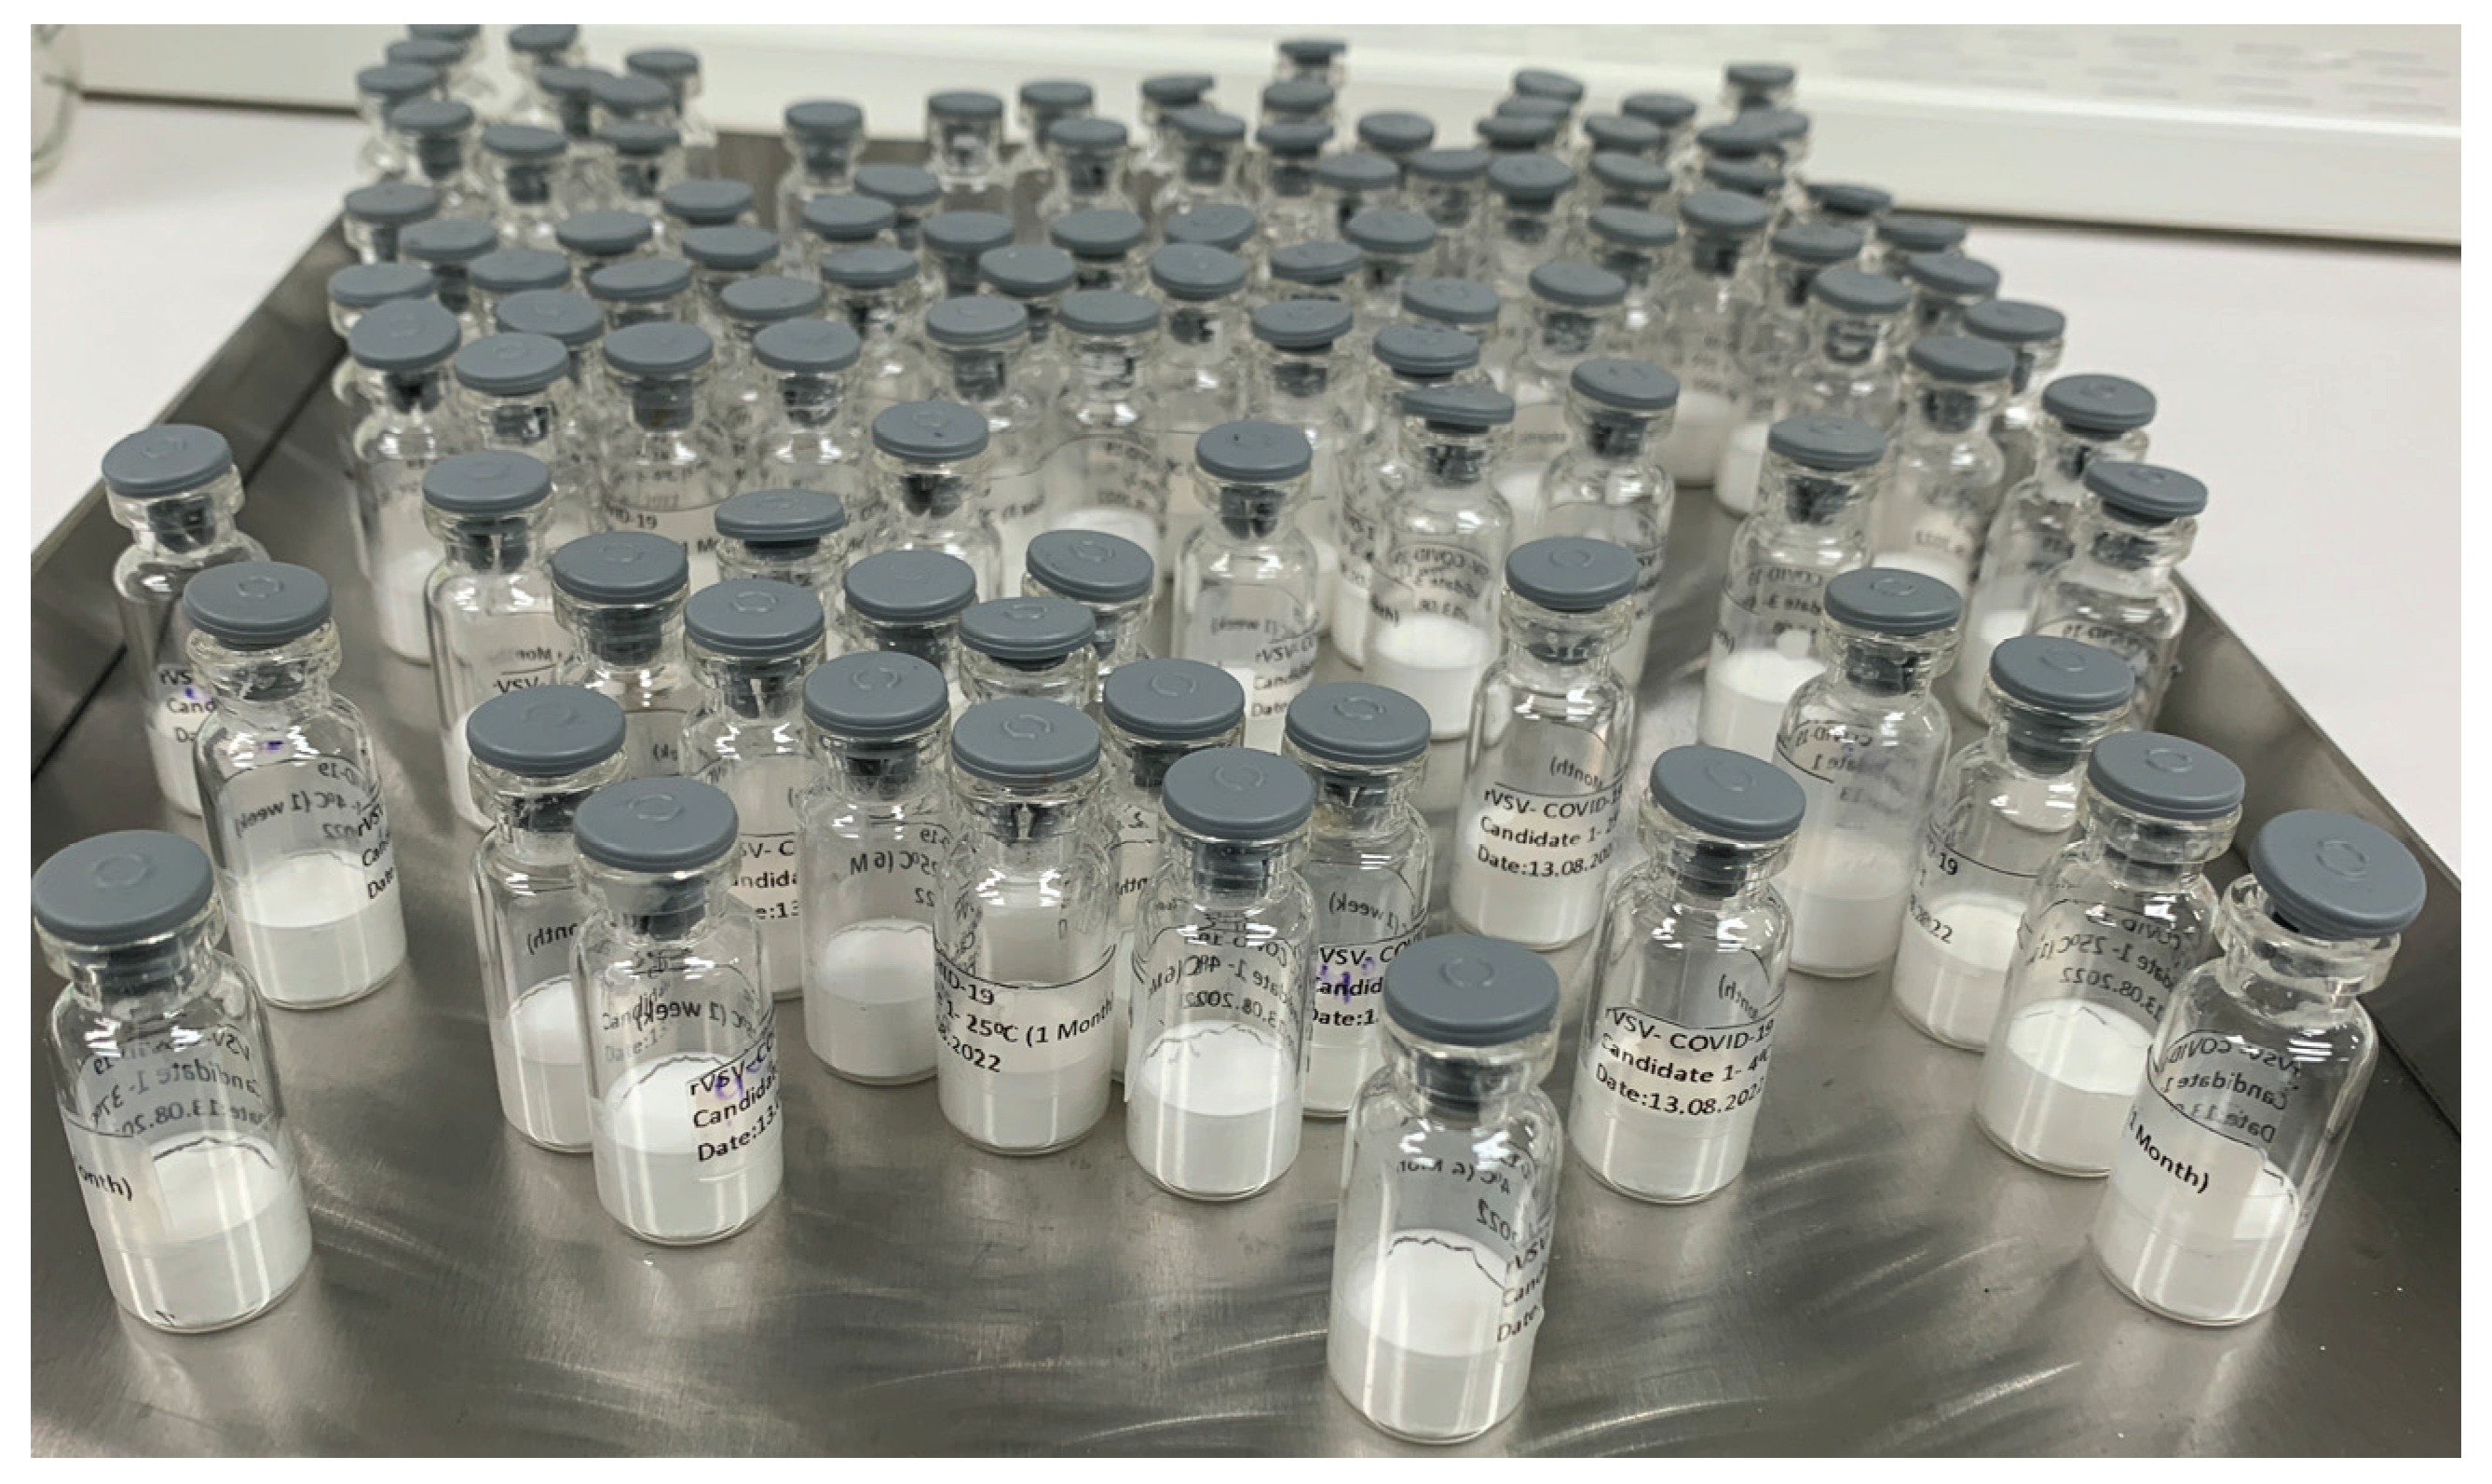
Following the optimization of the formulations and critical parameters of the freeze-drying cycle, we manufactured a small batch of freeze-dried vaccine vials (
Figure 6). To investigate thermal stability, these optimized freeze-dried formulations, SMGH, TMGH, and SoMGH, were stored at 4, 20, and 37°C for up to six months. The unformulated samples (control) were incubated at the same conditions to compare the stability results.
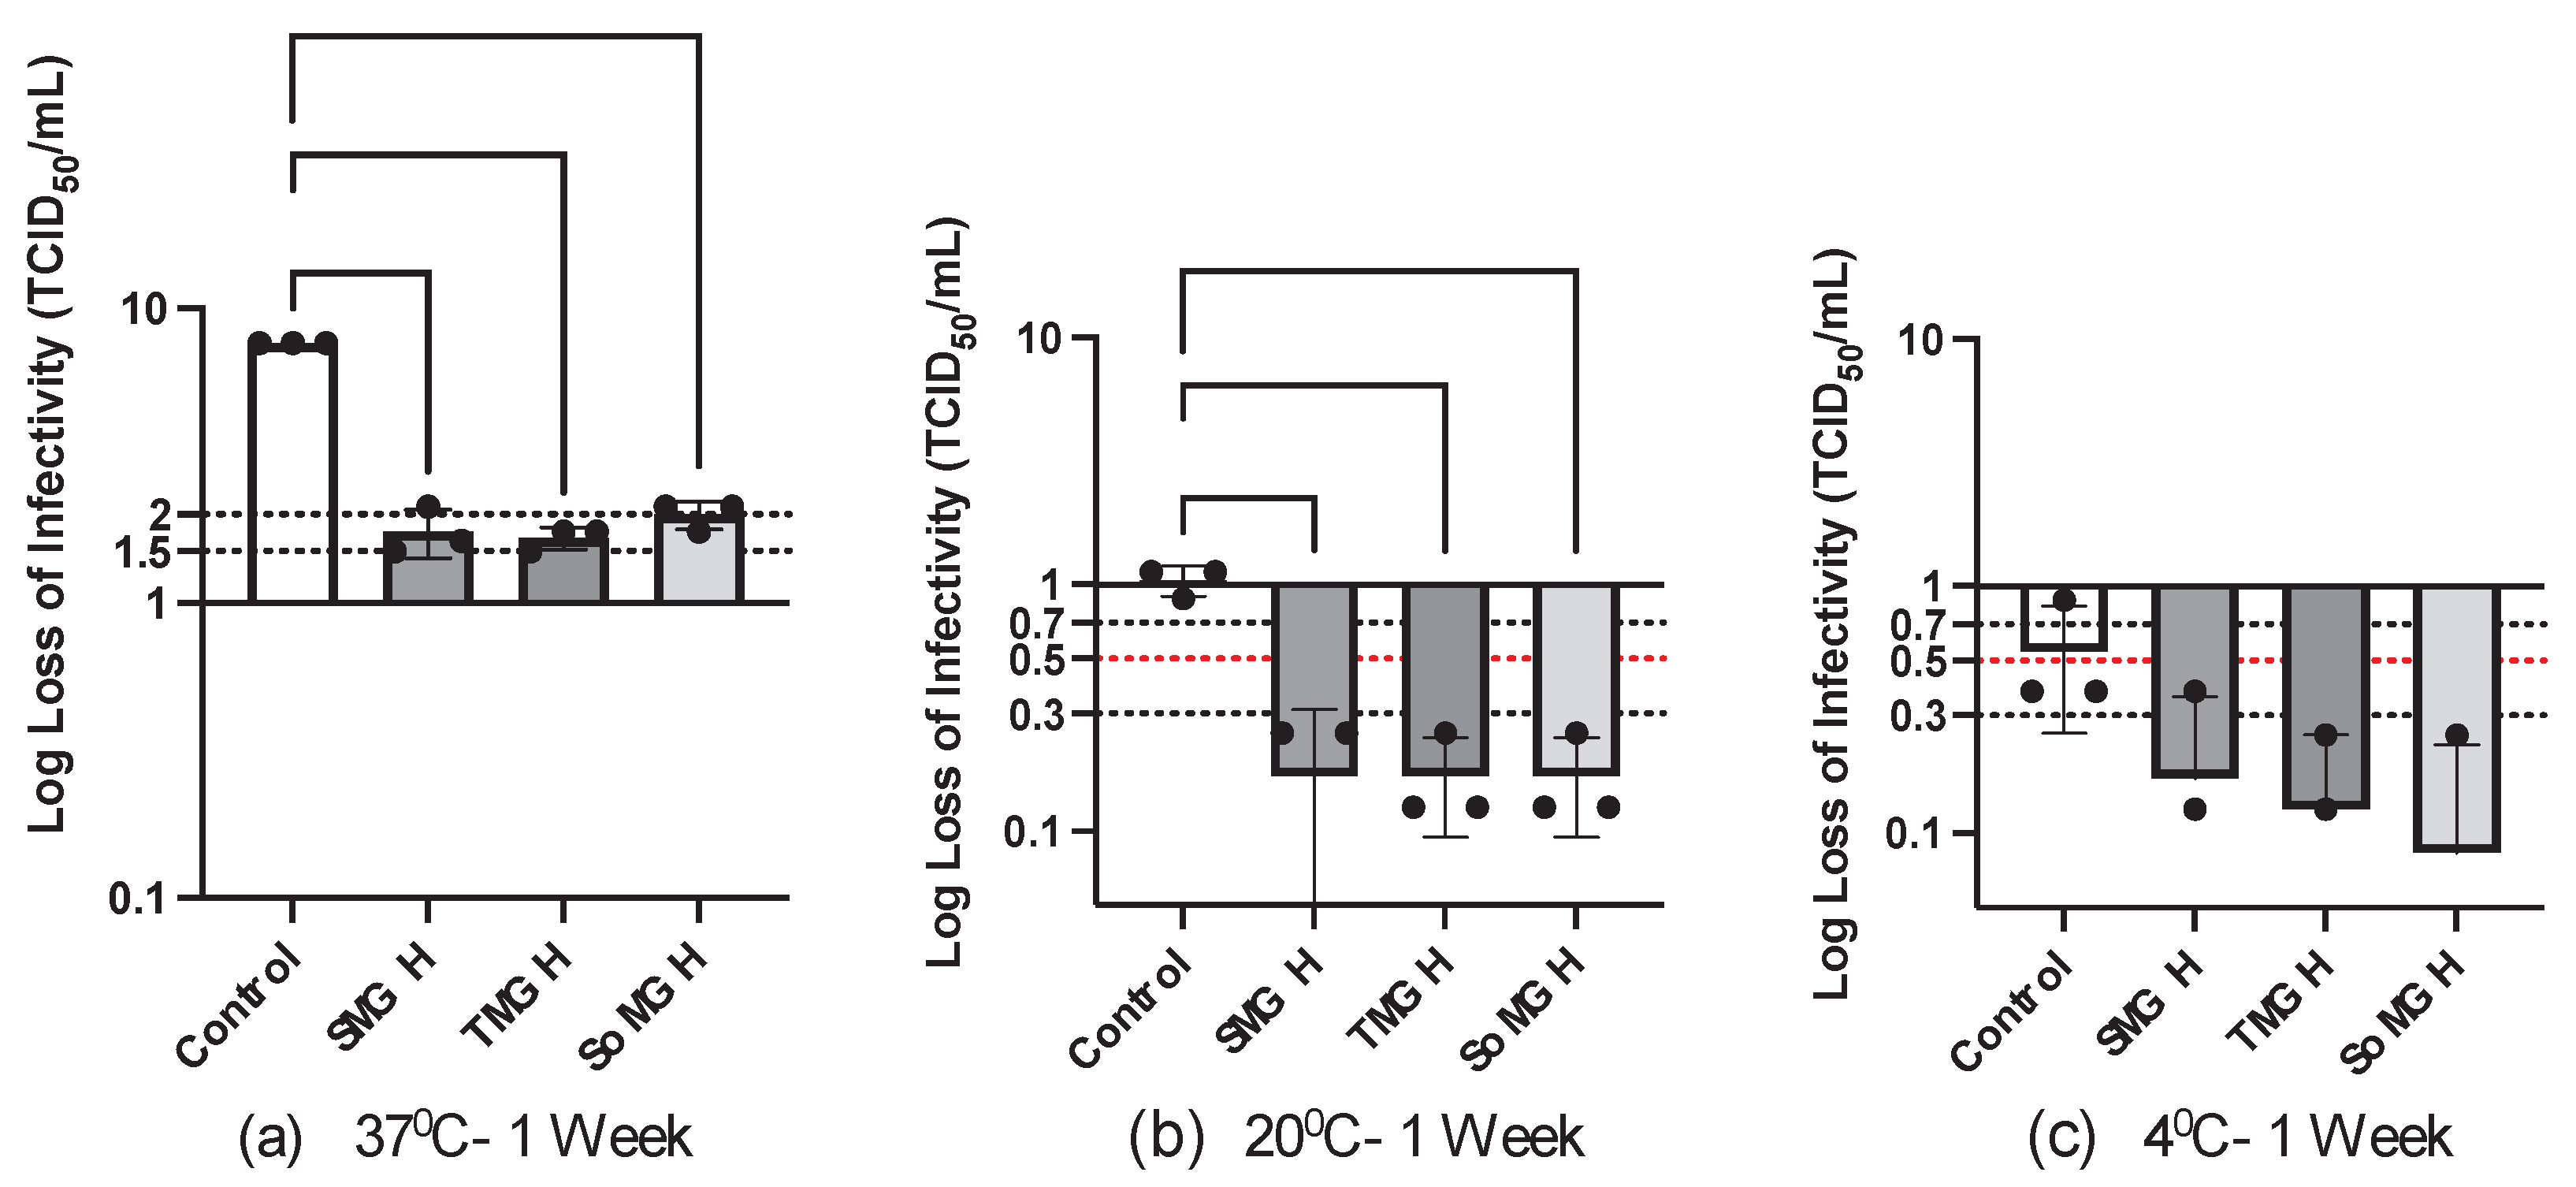
After one week at 37°C, the control showed a complete loss of infectious viral titer (
Figure 7a). In contrast, titer losses were reduced by the three freeze-dried formulations in this accelerated stress condition (37°C). More specifically, SoMGH (sor-man-gel-his) showed 2±0.2 log loss, whereas SMGH (suc-man-gel-his) and TMGH (tre-man-gel-his) showed 1.75±0.25 log loss (
Figure 7a). From the ANOVA, significant statistical differences were found between the control and the other three formulations at 37°C. This indicates that the optimized formulations played a vital role in minimizing the temperature stress on the infectivity of rVSV-SARS-CoV-2.
In contrast, the three freeze-dried formulations showed only a small loss of infectious viral titer at 4 and 20°C after one week. At 20°C, the three formulations showed < 0.3 log loss of infectivity, while the control showed ~ 1 log loss of infectivity (
Figure 7b). At 4°C, on the other hand, the three formulations showed ~ 0.1 to 0.2 log loss, with the control having a 0.5±0.2 log loss (
Figure 7c). This demonstrates that the three formulations had improved stability when exposed to 4 and 20°C for a short period. There were no significant statistical differences (P > 0.05) found between the control and other groups at 4°C (
Figure 7c). However, a significant statistical difference (P < 0.0001) was identified at 20°C between the control and the other three formulations (
Figure 7b). This indicates that these formulations have significant value in protecting the viral vector in this condition.
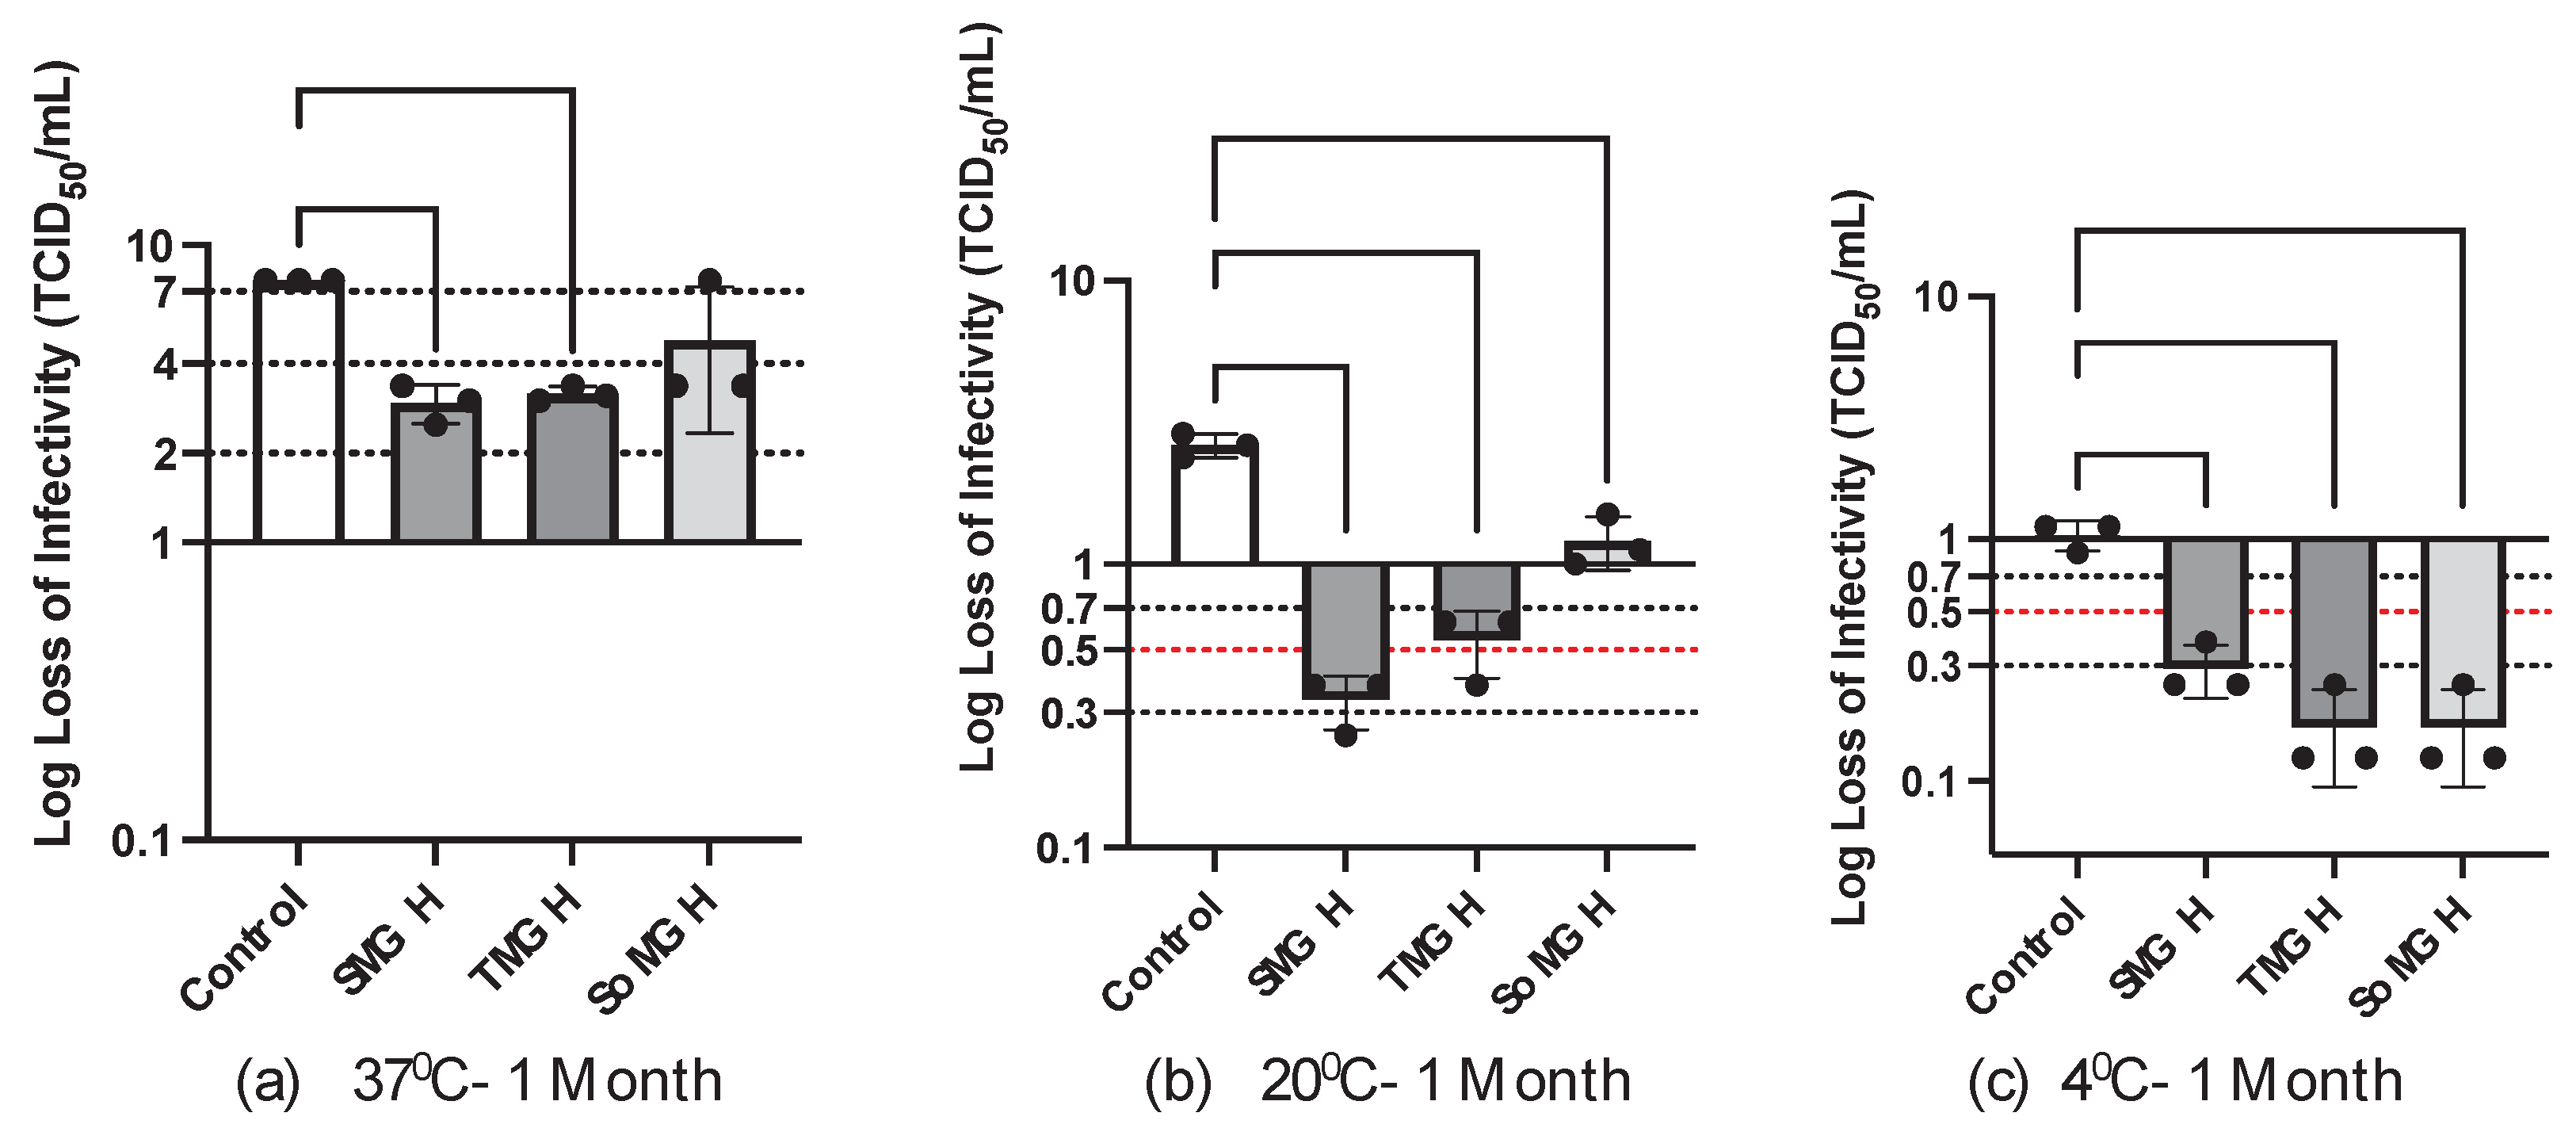
The stability study was extended to one month under the same conditions as the one-week test. As shown in
Figure 8a, a significant loss of infectious viral titer was observed for rVSV-SARS-CoV-2 in the accelerated (37⁰C, 1 month) stress condition. Here, the sorbitol-containing formulation (SoMGH) showed a severe loss of infectivity close to the control, and the other two formulations (SMGH and TMGH) showed ~ 3 log loss of infectivity (
Figure 8a). More importantly, there were less significant statistical differences found between the control and SMGH (P = 0.0079), and between the control and TMGH (P = 0.0102). However, no significant statistical difference was found between the control and SoMGH (P = 0.0913), suggesting that the formulation incorporating sorbitol had poor stability in this condition.
After one month at 20°C, distinct stability data were observed among the three formulations.
Figure 8b shows a significant loss (1.25±0.25 log loss) of viral titer in the SoMGH formulation. Unlike SoMGH, SMGH showed 0.3±0.1 and TMGH showed 0.5±0.1 log loss of infectivity. Therefore, a less significant statistical difference was found between the control and SoMGH as compared to the other two formulations (
Figure 8b).
Following one month at 4°C, the measured infectious viral titer was found high in all formulations (0.1 to 0.3 log loss of infectivity). Under this condition, a significant statistical difference (P < 0.0001) was observed between the control and all other formulation groups, as the control showed ~ 1 log loss of infectivity (
Figure 8c). The statistical analyses demonstrate that the excipients effectively shielded the viral vector from denaturation, aggregation and loss of infectivity at both 4 and 20°C temperatures.
A complete loss of infectious vector rVSV-SARS-CoV-2 titer was observed in all formulations when the stability study was carried out for six months at 37
0C (no figure shown). Among the three formulations tested, sucrose−containing SMGH and trehalose−containing TMGH formulations were found to be effective in maintaining the viral titer for six months at 4
0C (< 0.5 log loss of infectivity,
Figure 9b). Further, both of these formulations also showed promising stability for 6 months at 20
0C (~ 1.2 log loss of infectivity,
Figure 9a). In contrast, the sorbitol−containing formulation SoMGH showed a significant drop in infectious viral titer in six months both at 4 and 20
0C (
Figure 9a,b). Here, it appears that sorbitol as a cryoprotectant was unsuccessful in stabilizing the rVSV-SARS-CoV-2 as compared to the other two formulations containing sucrose and trehalose. The significant statistical difference observed between the control and the two improved formulations (SMGH and TMGH) in 6 months at both 4 and 20
0C demonstrates their ability to improve the shelf life of the viral vector.
4. Discussion
To claim a successful solid formulation of a viral vector vaccine, two challenges must be overcome. The first is to protect the vector from the in-process stresses of the freeze-drying cycle; the second is to protect the vector during long-term storage and transportation
[53]. The stability analysis from this study showed that sucrose-gelatin, trehalose-gelatin, and sorbitol-gelatin formulations play an important role in stabilizing the rVSV-SARS-CoV-2 during freeze-drying stress. These formulations create a protective environment that effectively mitigates the adverse effects of freezing and dehydration. Whereas, in the long-term storage, only the sucrose-gelatin and trehalose-gelatin formulations were found effective in retaining the infectivity of rVSV-SARS-CoV-2.
For a formulation to be considered stable, the loss of infectious viral titer should be < 0.5 log loss in six to twelve months of storage
[54]. The two aforementioned formulations achieved < 0.5 log loss of infectivity at 4°C and ~ 1.2 log loss of infectivity at 20°C in six months. Therefore, these two freeze-dried formulations may be considered for potential use as a COVID-19 vaccine. Similarly, both sucrose and trehalose were reported to improve the stability of mumps virus, rinderpest virus and pox virus during freezing and drying phases
[55,56,57,58]. Furthermore, sucrose and trehalose have long been known to act as a potent stabilizer for lyophilized viruses, ensuring that the virus remains unaffected for a long time
[17,59,60]. In the past two decades, cryoprotectants such as sucrose and trehalose have been widely used to protect proteins, liposomes, and viral vectors against freeze-drying stress.
Furthermore, the addition of gelatin to these formulations showed significant recovery of the infectious viral titer of rVSV-SARS-CoV-2. Due to its interaction with viral particles and its capacity to limit surface adsorption, hydrolyzed gelatin is utilized in many live viral vaccine formulations. Additionally, sorbitol was shown to be an efficient stabilizer for the freeze-drying of many viruses, including measles virus, hepatitis virus, yellow fever virus, herpes simplex virus, respiratory syncytial virus, and varicella-zoster virus
[53]. In some stability studies, sorbitol-gelatin was recognized as an efficient cryoprotectant in the freeze-dried formulations of measles virus and rinderpest virus
[61,62]. Here, despite demonstrating high recovery of infectivity during the freeze-drying phases, the sorbitol-gelatin combination showed inadequate long-term storage stability. After six months of storage, we found a significant loss of viral titer in the sorbitol-gelatin formulation at both 4 and 20°C.
The type and concentration of the cryoprotectant, lyoprotectant, and buffer also played a major role in maintaining the infectivity of VSV. The freeze-drying stress on enveloped viruses is caused by the fast expansion of small ice crystals during warming in the secondary drying phase. This increased rate of ice recrystallization compromises the structure of the envelope, resulting in a significant loss of virus
[8,33]. Under this stress condition, maximum recovery of viral titer can be obtained by increasing the concentration of sugar excipients
[32]. Similarly, this freeze-drying work showed that increasing concentrations of sugar and the presence of gelatin played a vital role in the infectivity of rVSV-SARS-CoV-2. The high concentration of sugar excipients and the gelatin contributed significantly to retaining the infectious viral titer throughout the freeze-drying process. There are two possible ways these sugars prevent the loss of the virus. In the first, sugars serve as a replacement for water by forming hydrogen bonds with polar residues present on the surface of viral membranes, therefore stabilizing these biomolecules. In the other way, highly concentrated sugar inhibits large ice crystal formation throughout both the virus and the external solution. This is mediated by lowering the nucleation temperature of the water inside the viral membrane
[37]. In the case of Herpes simplex virus, which is classified as a heat-labile enveloped virus, high concentrations of cryoprotectant (27% w/v) were shown to recover almost 80% of viral titer
[63].
One objective of this study was to explore the impact of moisture content on freeze-drying formulations. The purpose of the freeze-drying cycle is to remove most of the water from the formulation, but a minimum level of water activity is required to retain viral infectivity. Several studies have demonstrated that viruses and proteins degrade more rapidly at low moisture levels where several oxidation mechanisms contribute to this degradation
[63]. In the case of viral vectors, it has been found that overdried freeze-dried formulations had lower viral titers than formulations with slightly higher moisture contents (1-3%)
[54,64,65]. Based on our findings, overdried rVSV-SARS-CoV-2 also resulted in a major loss of infectivity. In contrast, higher moisture content contributed positively to the recovery of the viral vector with the most optimized recovery found at 3-6%. As a comparison, the ideal final moisture content for influenza virus was determined to be 1.7% and drying them below that point made them non-infectious. In the case of adenovirus, optimal final moisture content for maximal virus recovery was found between 1.3–1.5%
[54]. Our results demonstrate that the rVSV-SARS-CoV-2 vector requires higher moisture content as compared to other viral vectors to retain its infectivity.
Temperature is known to be a critical factor in the freeze-drying process that affects the stability of viruses. The structural integrity of viruses can only be stabilized by freezing them at extremely low temperatures. In this condition, water molecules in the sample crystallize to form ice, immobilizing the virus particles, restricting their mobility, and reducing substantial damage
[18]. However, the freezing rate can affect the infectivity of the viral vector vaccine. In the case of adenovirus without cryoprotectants, the rate of freezing accounted for approximately 90% loss of viral titer. The main explanation for this loss could be the mechanical stress caused by the crystallization of ice and cryo-concentrated fluid on the viral vector
[66]. According to the vitrification hypothesis, a sufficient amount of cryoprotectant is required to generate a stable glass matrix to protect the virus. The glass matrix isolates the freeze-dried virus, preventing it from forming aggregates and protecting it from mechanical stress. In our study, different freezing rates from 0.1 to 1°C/min were applied to the three formulations. Both the fast and slow freezing rates did not result in any loss of viral titer. A sufficient amount of cryoprotectants used in the three formulations, including sucrose, trehalose, sorbitol, and gelatin, played a positive role in maintaining the native conformation of the viral vector.
In the primary drying phase, the temperature needs to be adjusted below the collapse temperature (T
c). If this temperature is exceeded, the frozen product structure will collapse
[67]. This may lead to high moisture content and an unsatisfactory product appearance. Therefore, the primary drying temperature must be optimized for product quality and a robust primary drying rate
[68]. The primary drying process for all three formulations was conducted at -30°C based on the T
c. At this temperature, neither the product quality nor the infectivity declined during primary drying.
Following the primary drying phase, secondary drying is carried out to evaporate the bound water. Usually, secondary drying is performed at high temperatures as more energy is required for the evaporation
[69]. The secondary drying process requires a gradual increase in shelf temperature or a microcollapse may occur
[68]. Furthermore, rapid temperature changes during the drying process may lead to denaturation or inactivation of the virus. For this reason, it is vital to maintain appropriate temperatures during secondary drying to protect virus infectivity. Therefore, in most viral vector vaccines, secondary drying is performed at ultra-low or sub-zero temperatures to minimize the loss. We aimed to develop a robust process in this study with an optimal secondary drying temperature. This study found that there is a critical temperature range (≤ 20°C) within which the infectious viral titer remains stable during secondary drying. However, once the temperature surpasses this range, there’s a notable decrease in the infectious viral titer. Thus, the secondary drying temperature was optimized at this range to accelerate the process.
To minimize infectious viral titer loss, the entire freeze-drying cycle is normally carried out at ultra-low temperatures in many live viral vector vaccines. In the case of live attenuated viruses, the total time for the freeze-drying cycle normally requires more than 50 hours to complete. Specifically, for adenovirus, drying was performed at -50°C for 60 hours; for hepatitis vaccine, drying was performed at -40°C for 40 hours
[15]. However, from an economical and industrial standpoint, these lengthy freeze-drying cycles are costly and time-consuming. This study developed a freeze-drying process which took only 32 hours to complete and is considered a robust process with no significant loss of infectivity. This robust process ensures that the final product meets the aforementioned quality specifications consistently over multiple production runs. It can also reduce operating costs associated with energy consumption and labour, making it cost-effective for large-scale industrial production.
The improved stability of VSV developed from this freeze-drying analysis may potentially address the stability limitations in many vaccine candidates. For example, to ensure stability, the recently approved Ebola vaccine (Ervebo, a VSV-based vaccine) requires storage between -80 and -60°C. Once thawed, the vaccine can be stored at 2 to 8°C for up to 14 days
[70]. This study’s findings can alleviate the burden of the costly cold chain systems required. Moreover, this research makes a valuable contribution to the broader understanding of VSV stability through a meticulous assessment of many of the critical variables associated with freeze-drying.
In conclusion, this paper outlines a stepwise improvement of VSV stability throughout the freeze-drying process, considering both CPPs (temperature) and CQAs (cake stability, resuspension efficiency and moisture content). The formulations and process design that were developed throughout this study in the freeze-drying phase and long-term stability assessment, have the potential to offer valuable insights into the overall stability of enveloped viral vector vaccines.
Figure 1.
Mechanisms by which different excipients and buffer stabilize enveloped viral vectors. Figure created with Biorender.com.
Figure 1.
Mechanisms by which different excipients and buffer stabilize enveloped viral vectors. Figure created with Biorender.com.
Figure 2.
Effect of final moisture content on the infectivity of freeze-dried rVSV-SARS-CoV-2. Here, the infectious viral titer is presented as log loss of infectivity. The log loss was estimated by deducting the log(titer) of controlled -80°C stock sample from the log(titer) of the formulation sample. Infectious viral titer is an average of three samples’ TCID50 results; error bars represent the standard deviation. Moisture content was measured by the weight loss method after each cycle.
Figure 3.
Effect of formulations’ concentration and composition on the infectivity of rVSV-SARS-CoV-2. Six different formulations of rVSV-SARS-CoV-2 were freeze-dried and the infectivity of each was determined by the TCID50 assay. Here, the infectious titer of rVSV-SARS-CoV-2 is presented as a log loss of infectivity calculated by deducting the log (titer) of the controlled -80°C stock sample from the log (titer) of the formulation sample. The values shown are an average of three samples’ TCID50 results, and the error bars represent the standard deviation.
Figure 4.
Effect of secondary drying temperatures on three formulations (SMGH, TMGH and SoMGH) containing rVSV-SARS-CoV-2. Four different temperatures—4, 20, 30, and 37°C—were applied to the secondary drying step of the freeze-drying cycle. The infectious viral titer is an average of three samples’ TCID50 results, and the error bars represent the standard deviation. The log loss of rVSV-SARS-CoV-2 was calculated by deducting the log (titer) of the controlled -80°C stock sample from the log (titer) of the formulation sample.
Figure 5.
An optimized freeze-drying cycle was developed for rVSV-SARS-CoV-2. This freeze-drying cycle was designed for 1 mL samples comprising optimal SMGH, TMGH and SoMGH formulations. Freezing was done at -50°C for 5 hours with no vacuum. Next, primary drying was performed for 15 hours at -30°C based on the Tg and Tc of the formulations. A fast ramp rate of ~ 1°C/min was applied both in the freezing and primary drying stages, whereas a slow ramp rate of ~ 0.1°C/min was applied in the secondary drying stage. At last, the secondary drying was performed at 20°C for 6 hours.
Figure 6.
A small batch of lyophilized rVSV-SARS-CoV-2 cakes is shown. In most cases, cake appearance is considered a quality attribute and must meet certain criteria for acceptance. In the final stage depicted in the figure, the lyophilized cake is fully formed, presenting a uniform and porous structure. After optimizing the CPPs and CQAs, each vial in the figure shows perfect cake formation without any cake deterioration or shrinkage. The cake adheres firmly to the vial walls, indicative of successful lyophilization and optimal cake stability. Notably, the absence of collapse or cracking underscores the efficacy of the process in maintaining the structural integrity of the cake.
Figure 7.
After one week, the stability of three distinct rVSV-SARS-CoV-2 formulations at temperatures of 37°C (a), 20°C (b), and 4°C (c) is shown. TCID50 viral assay was performed for three formulation groups and one control to detect infectious viral titer. Viral titer is presented as a log loss value on the y-axis. Here, less than 0.5 log loss indicates good stability, and this boundary line is marked red. Log losses of viral titer due to thermal stress were calculated in comparison to control samples (−80°C stock); data is displayed as the mean ± standard deviation (n = 3). One-way ANOVA analysis was performed between the control and formulation groups, and the significant statistical difference is denoted through the asterisks (*) sign. Significant statistical differences were identified when the P-values were less than 0.05 (****P < 0.0001; ***P < 0.001; **P < 0.01; *P < 0.05).
Figure 8.
After one month, the stability of three distinct rVSV-SARS-CoV-2 formulations at temperatures of 37°C (a), 20°C (b), and 4°C (c) is shown. TCID50 viral assay was performed for three formulation groups and one control to detect infectious viral titers. Viral titer is presented as a log loss value on the y-axis. Here, less than 0.5 log loss indicates good stability in the long-term storage and this boundary line is marked red. Log losses of viral titer due to thermal stress were calculated in comparison to control samples (−80°C stock); data is displayed as the mean ± standard deviation (n = 3). One-way ANOVA analysis was performed between the control and formulation groups, and the significant statistical difference is denoted through the asterisks (*) sign. Significant statistical differences were identified when the P-values were less than 0.05 (****P < 0.0001; ***P < 0.001; **P < 0.01; *P < 0.05).
Figure 9.
After six months, the stability of three distinct rVSV-SARS-CoV-2 formulations at temperatures of 200C (a) and 40C (b) is shown. TCID50 viral assay was performed for three formulation groups and one control to detect infectious viral titers. Viral titer is presented as a log loss value on the y-axis. Here, less than 0.5 log loss indicates good stability in the long-term storage and this boundary line is marked red. Log losses of viral titer due to thermal stress were calculated in comparison to control samples (−80°C stock); data is displayed as the mean ± standard deviation (n = 3). One-way ANOVA analysis was performed between the control and formulation groups, and the significant statistical difference is denoted through the asterisks (*) sign. Significant statistical differences were identified when the P-values were less than 0.05 (****P < 0.0001; ***P < 0.001; **P < 0.01; *P < 0.05).
Table 1.
Freeze-dried viral vector vaccine formulations.
Table 1.
Freeze-dried viral vector vaccine formulations.
| Virus |
Type |
Composition |
Ref |
| Yellow Fever Virus |
RNA viruses.
Enveloped |
Sorbitol, gelatin |
[15] |
| Varicella-Zoster Virus |
DNA viruses.
Enveloped |
Sucrose, gelatin, glutamate |
[15] |
| Influenza Virus |
RNA viruses.
Enveloped |
Trehalose, sucrose, and soy peptone |
[33] |
| Measles virus |
RNA viruses.
Enveloped |
Sorbitol-gelatin |
[34] |
| Polio Virus |
RNA viruses.
Non enveloped |
Urea |
[35] |
| Pseudorabies Virus |
DNA virus.
Enveloped |
Glutamate, sucrose, dextran, phosphates, |
[36] |
| Herpes Simplex Virus 2 (HSV-2) |
DNA virus.
Enveloped |
Sucrose |
[37] |
| Herpesvirus |
DNA virus.
Enveloped |
Sucrose, mono potassium phosphate, dipotassium phosphate, monosodium glutamate, and bovine albumin powder |
[38] |
| Rubella Virus |
RNA viruses.
Enveloped |
Calcium-gluconate-lactobionate. |
[39] |
| Foot-and-Mouth Disease Virus (FMDV) |
RNA viruses.
Non enveloped |
Inositol, sodium glutamate and calcium lactobionate |
[40] |
Table 2.
Six formulation candidates for the freeze-drying study of rVSV-SARS-CoV-2.
Table 2.
Six formulation candidates for the freeze-drying study of rVSV-SARS-CoV-2.
| SMH |
TMH |
SoMH |
SMGH |
TMGH |
SoMGH |
Sucrose 5%
Mannitol 5%
Histidine 10 mM |
Trehalose 5%
Mannitol 5%
Histidine 10 mM |
Sorbitol 5%
Mannitol 5%
Histidine 10 mM |
Sucrose 10%
Mannitol 10%
Gelatin 0.5%
Histidine 10 mM |
Trehalose 10%
Mannitol 10%
Gelatin 0.5%
Histidine 10 mM |
Sorbitol 10%
Mannitol 10%
Gelatin 0.5%
Histidine 10 mM |
