Submitted:
03 April 2024
Posted:
03 April 2024
You are already at the latest version
Abstract
Keywords:
1. Introduction
2. Materials and Methods
2.1. Materials
2.2. BMSCs Culture
2.3. Cell Viability Assay
2.4. Intracellular ROS Examination
2.5. Alizarin Red S Staining
2.6. Oil Red O (ORO) Staining
2.7. Induction of Osteoporotic Models and LYC Administration
2.8. Serum and Bone Marrow Biomarkers Analysis
2.10. Bone Biomechanical Strength Assay
2.11. Fourier Transform Infrared Spectroscopy (FTIR) Assay
2.12. Haematoxylin & Eosin (H&E) and Safranin O-Fast Green Staining
2.13. Immunohistochemistry (IHC) Staining
2.14. Western Blot Assay
2.15. Statistical Analysis
3. Results
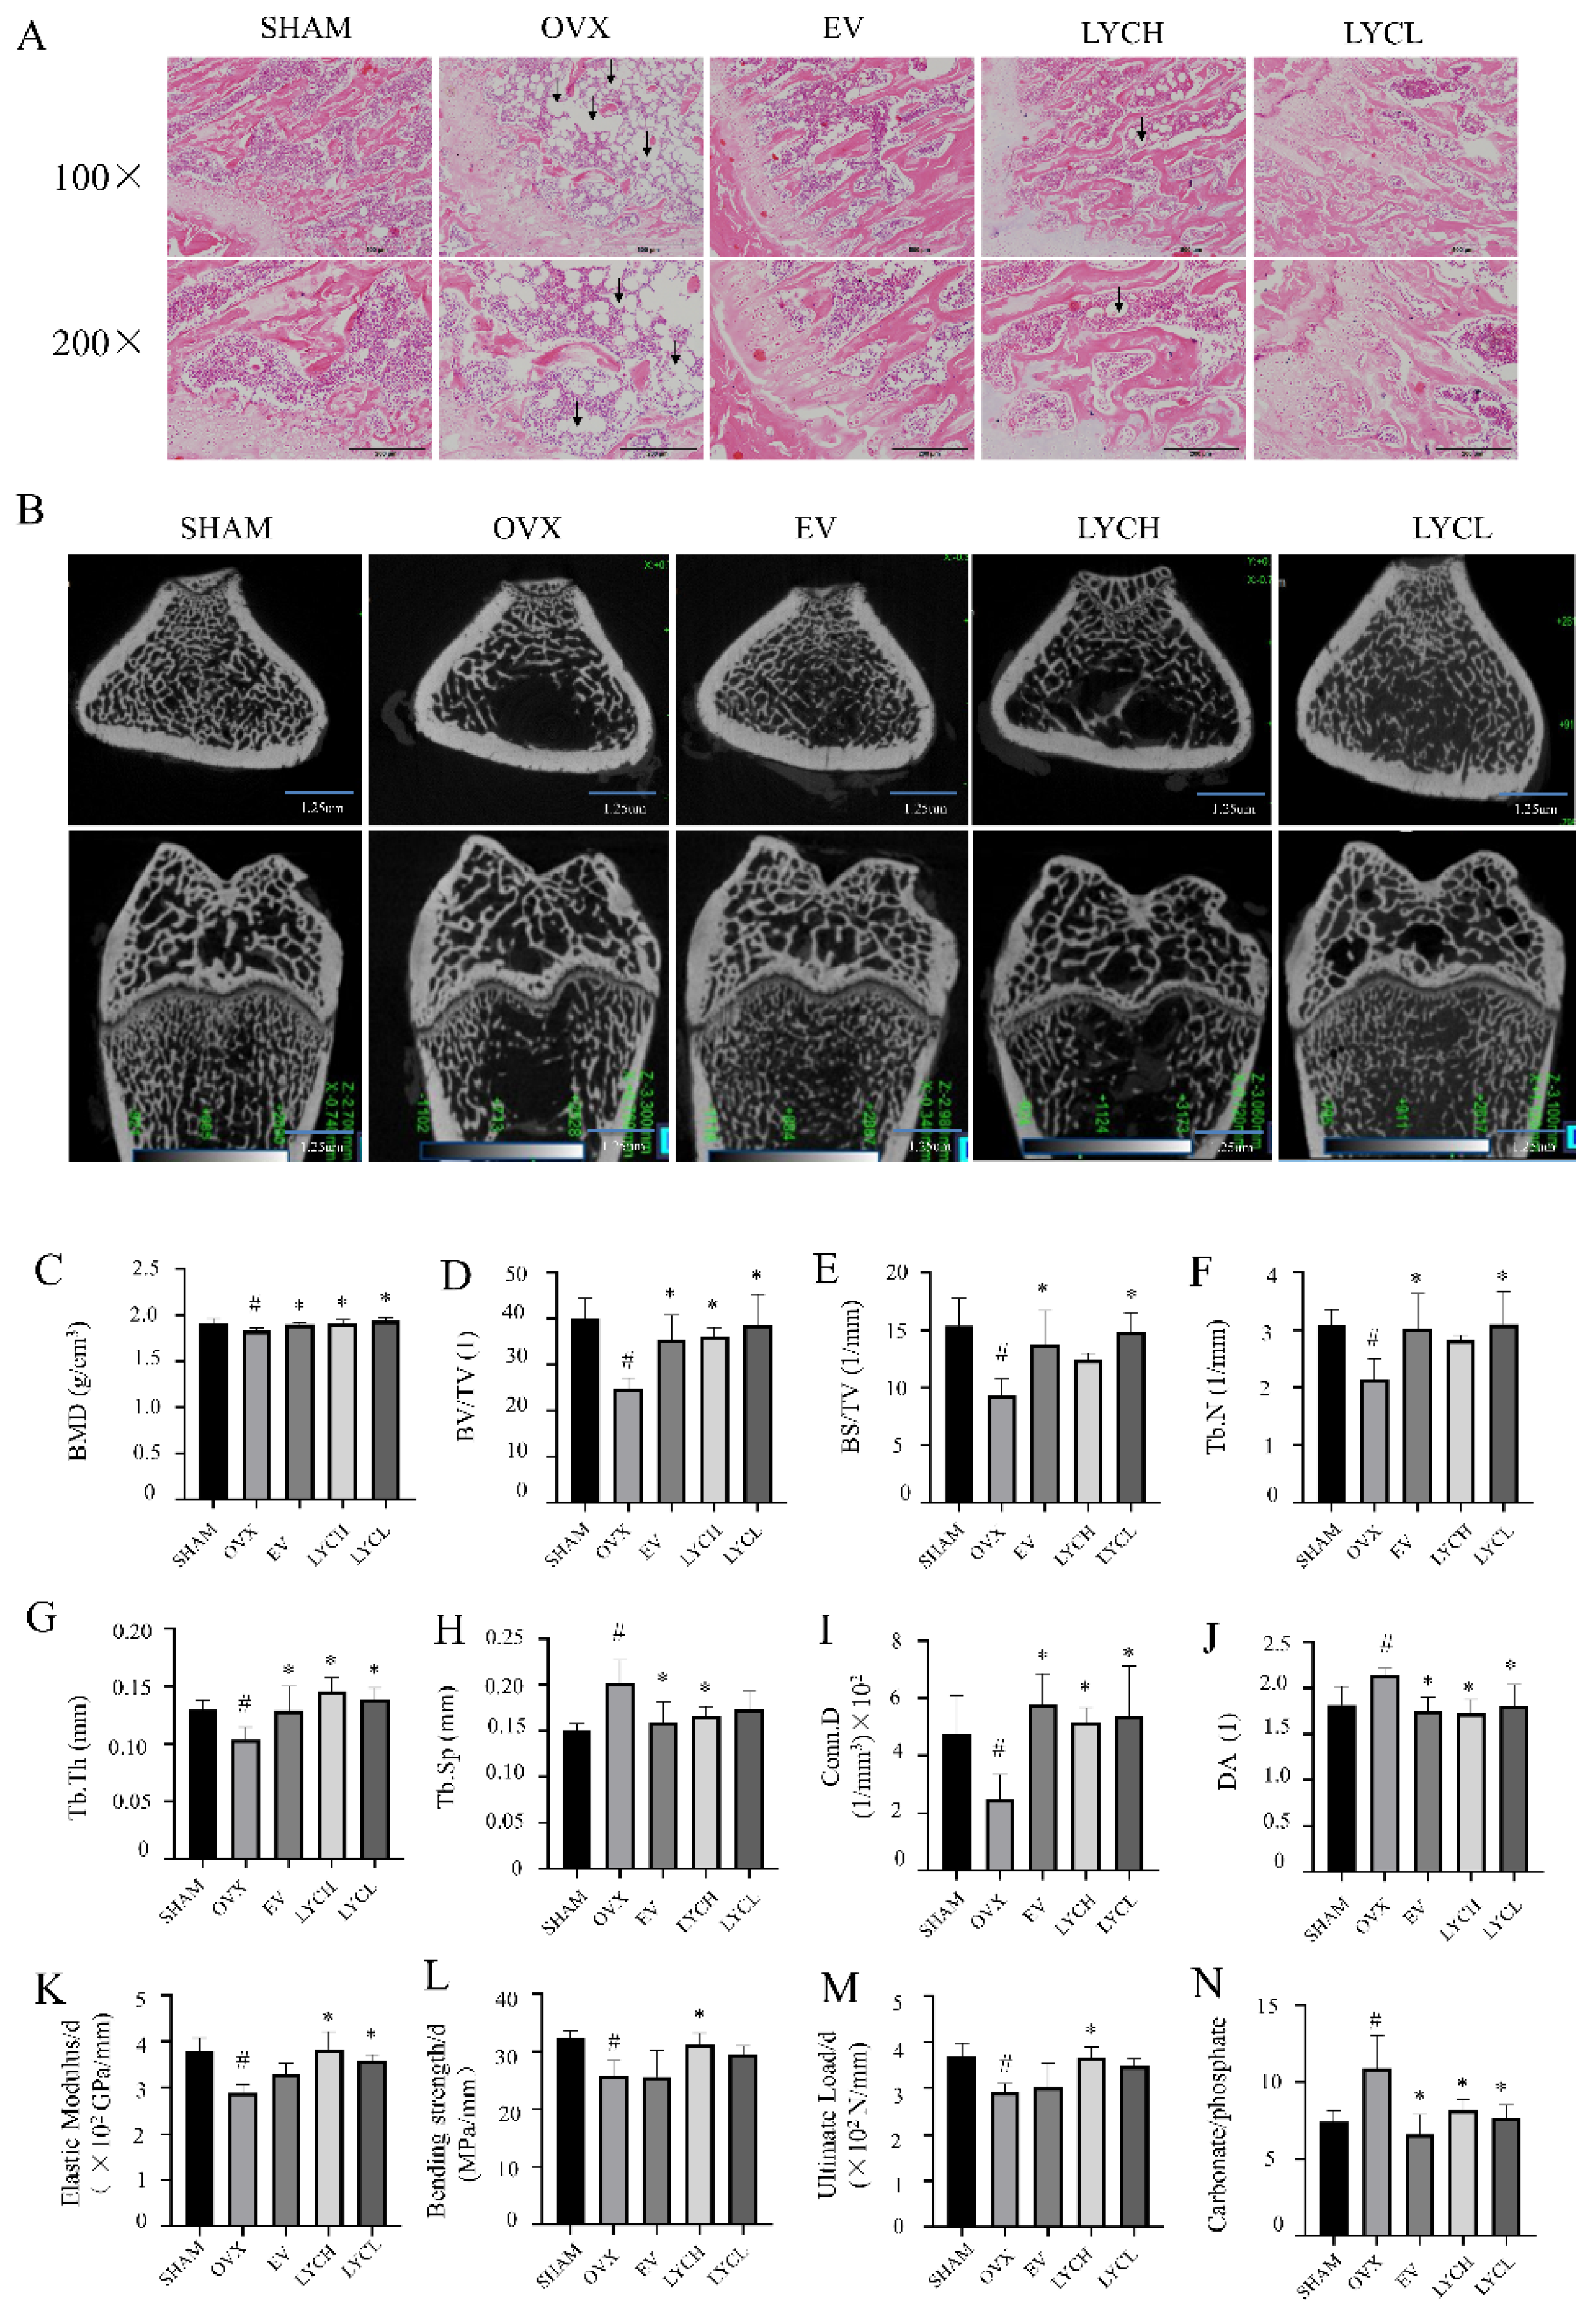
3.1. LYC Preserves Bone Micro-Architecture, Strength, Material Properties in OVX Rats
3.2. LYC Inhibits Oxidative Stress in OVX Rats and in BMSCs
3.3. LYC Improves Lipid Metabolism in OVX Rats and BMSCs
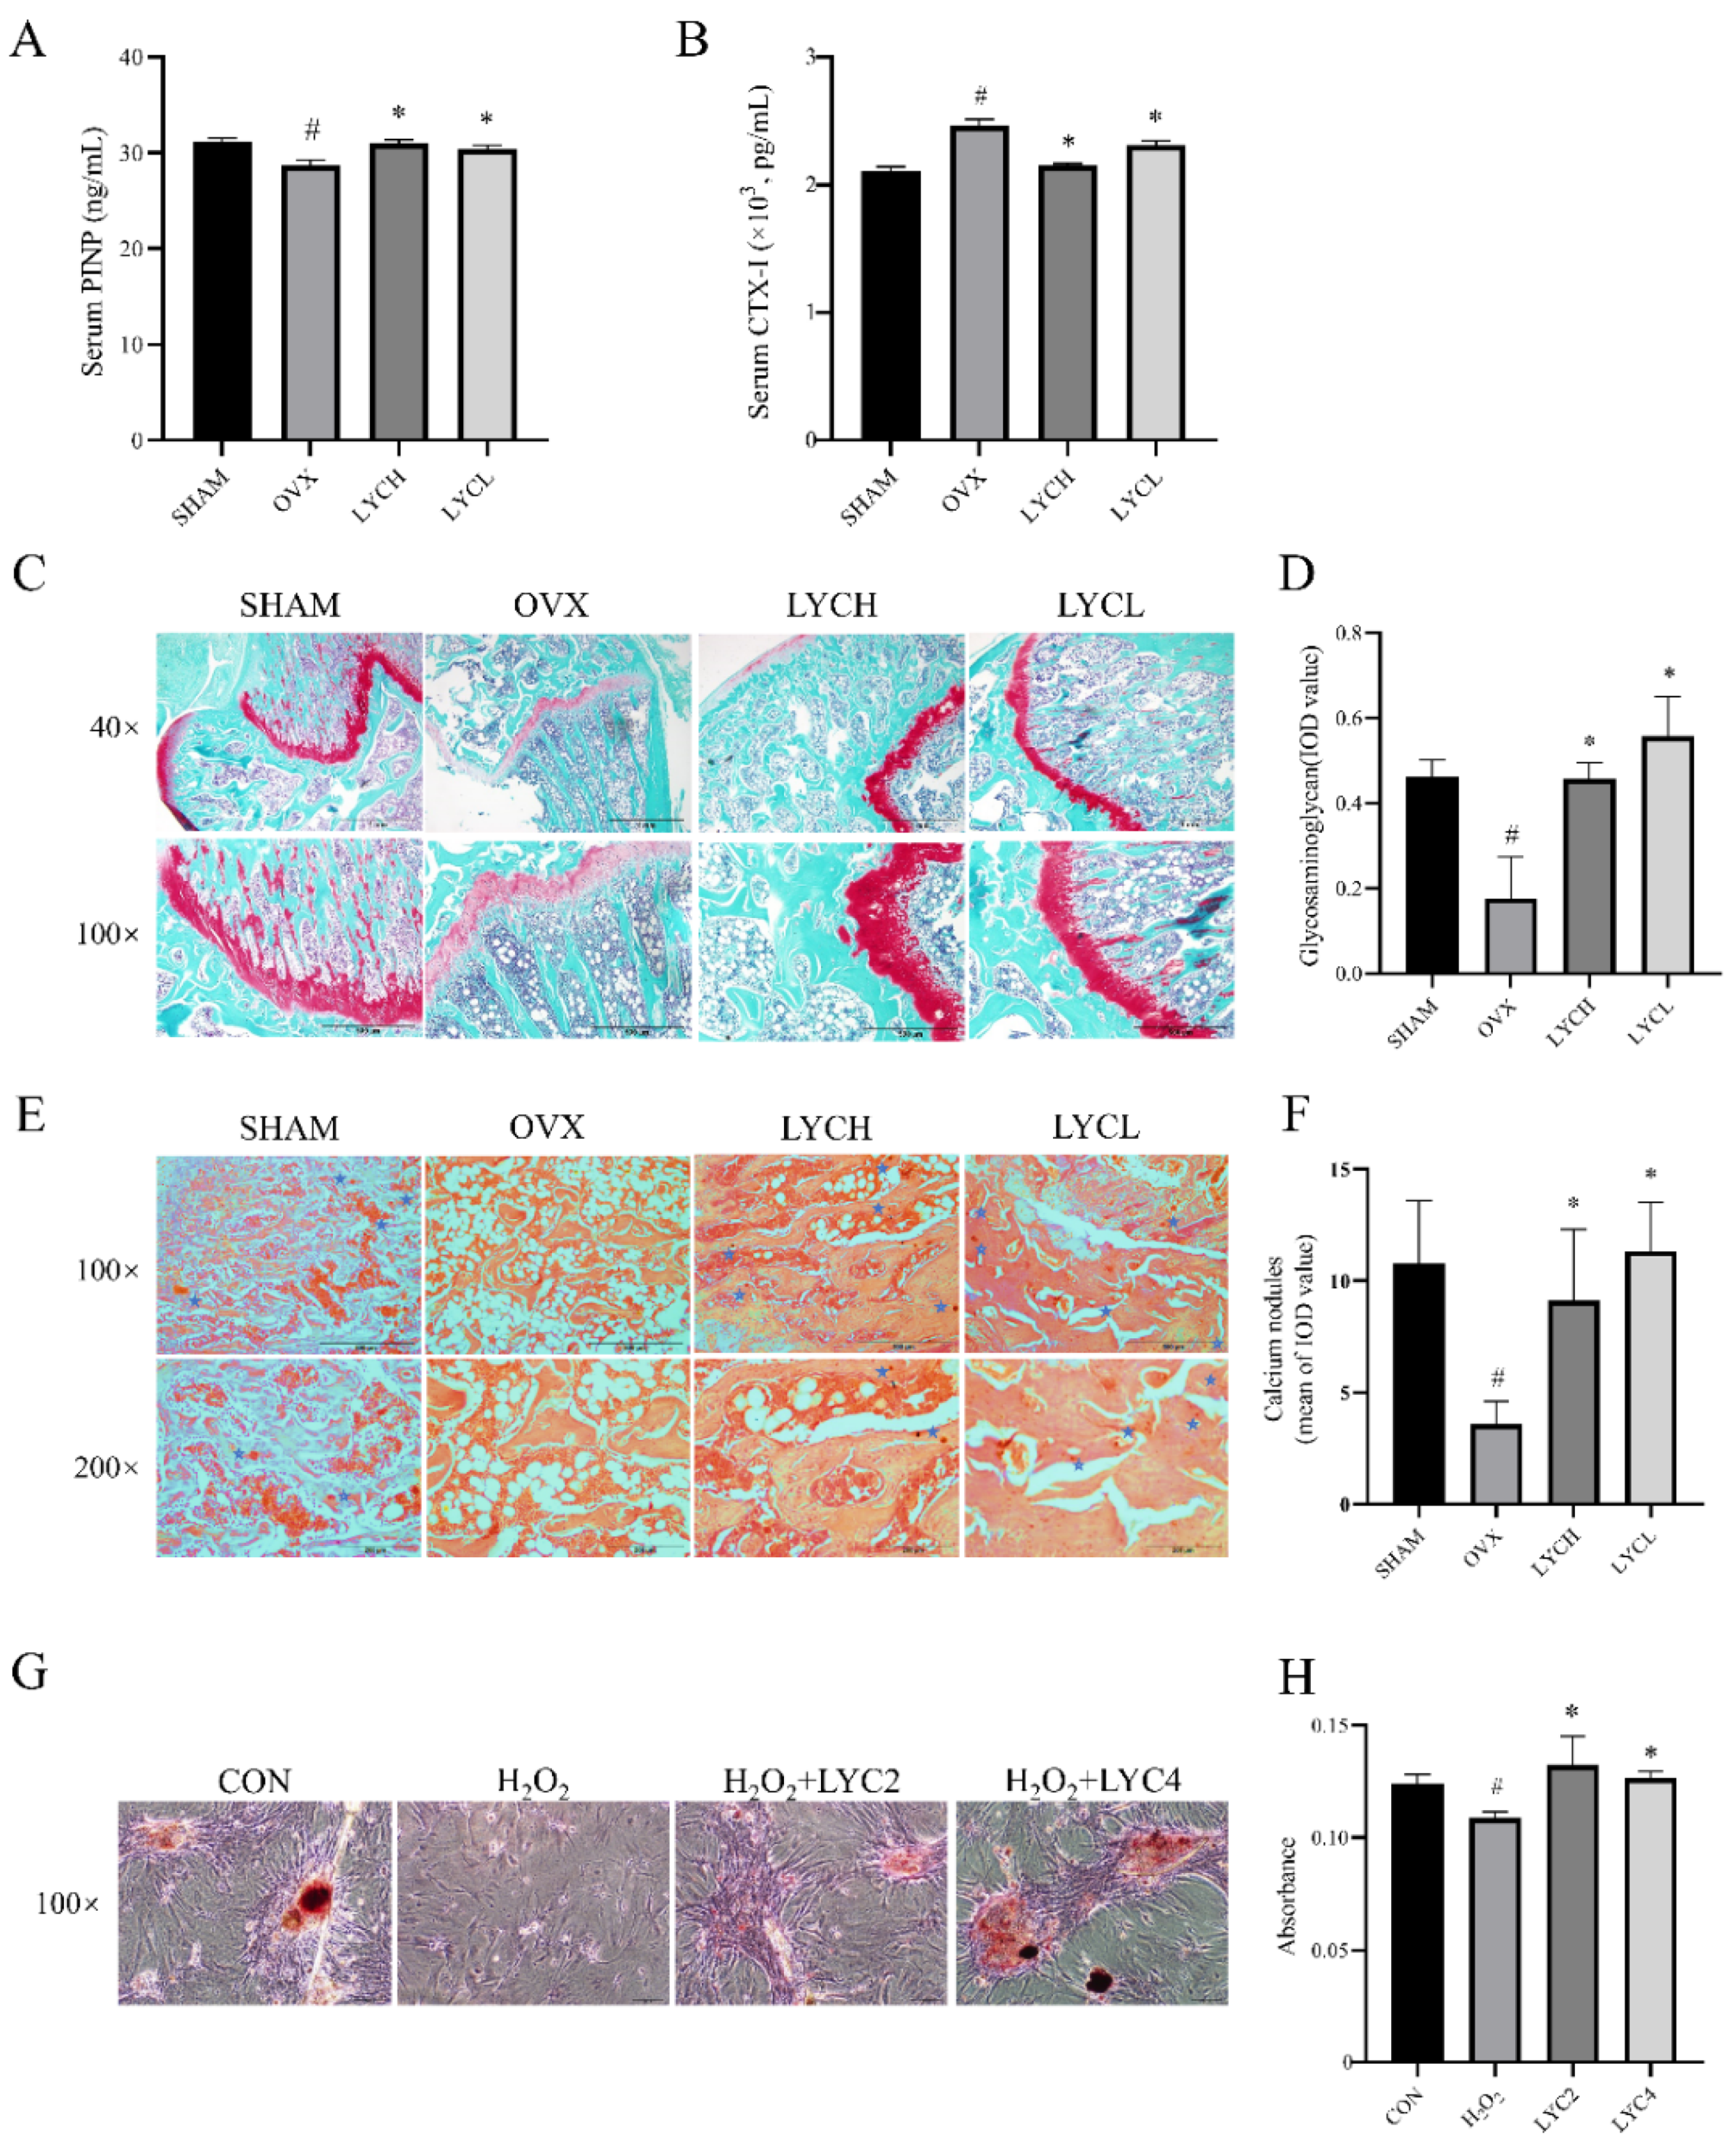
3.4. LYC Promotes Osteogenesis in OVX Rats and in BMSCs
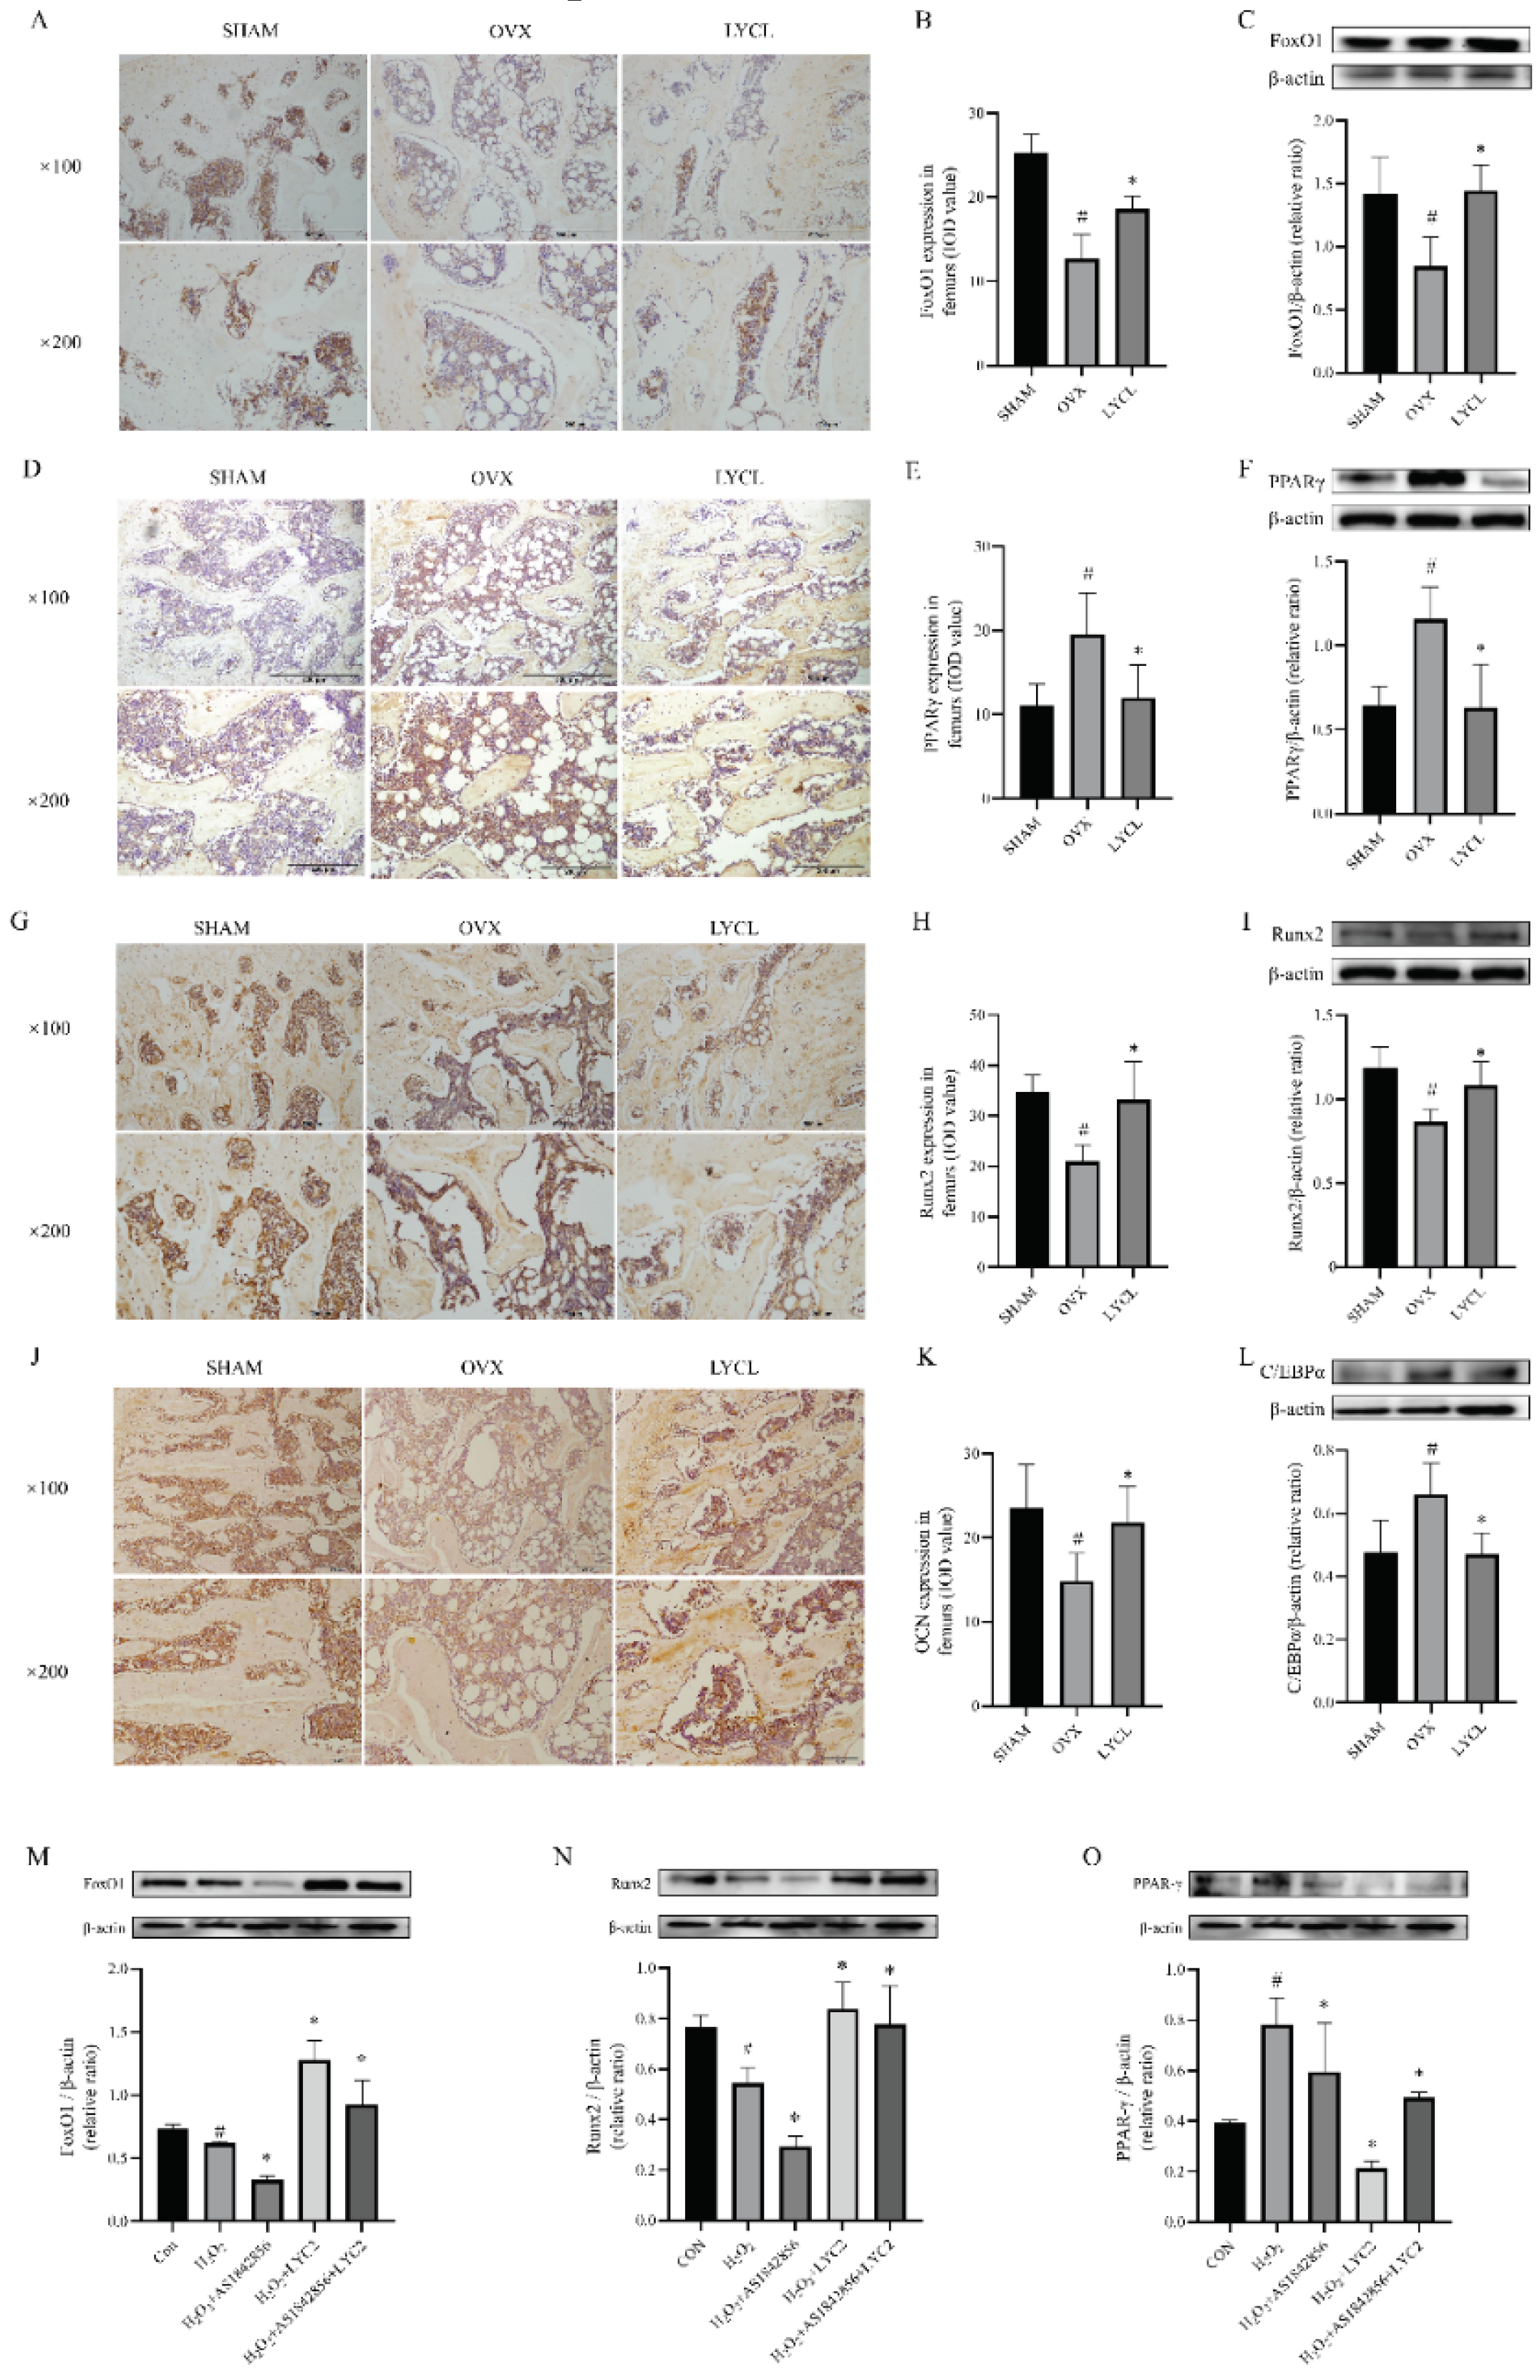
3.5. LYC Increases FoxO1, Runx2, and OCN Expressions, and Inhibits PPARγ and C/EBPα Expressions in the Femurs and Tibias of OVX Rats and BMSCs
4. Discussion
5. Conclusions
Author Contributions
Funding
Institutional Review Board Statement
Data Availability Statement
Conflicts of Interest
References
- Costa-Rodrigues, J.; Fernandes, M.H.; Pinho, O.; Monteiro, P.R.R. Modulation of Human Osteoclastogenesis and Osteoblastogenesis by Lycopene. J Nutr Biochem 2018, 57, 26–34. [Google Scholar] [CrossRef]
- Grabowska, M.; Wawrzyniak, D.; Rolle, K.; Chomczyński, P.; Oziewicz, S.; Jurga, S.; Barciszewski, J. Let Food Be Your Medicine: Nutraceutical Properties of Lycopene. Food Funct 2019, 10, 3090–3102. [Google Scholar] [CrossRef]
- Terao, J. Revisiting Carotenoids as Dietary Antioxidants for Human Health and Disease Prevention. Food Funct 2023, 14, 7799–7824. [Google Scholar] [CrossRef]
- Ozkan, G.; Günal-Köroğlu, D.; Karadag, A.; Capanoglu, E.; Cardoso, S.M.; Al-Omari, B.; Calina, D.; Sharifi-Rad, J.; Cho, W.C. A Mechanistic Updated Overview on Lycopene as Potential Anticancer Agent. Biomed Pharmacother 2023, 161, 114428. [Google Scholar] [CrossRef]
- Kulawik, A.; Cielecka-Piontek, J.; Zalewski, P. The Importance of Antioxidant Activity for the Health-Promoting Effect of Lycopene. Nutrients 2023, 15, 3821. [Google Scholar] [CrossRef]
- Abir, M.H.; Mahamud, A.G.M.S.U.; Tonny, S.H.; Anu, M.S.; Hossain, K.H.S.; Protic, I.A.; Khan, M.S.U.; Baroi, A.; Moni, A.; Uddin, M.J. Pharmacological Potentials of Lycopene against Aging and Aging-Related Disorders: A Review. Food Sci Nutr 2023, 11, 5701–5735. [Google Scholar] [CrossRef]
- Zhu, R.; Chen, B.; Bai, Y.; Miao, T.; Rui, L.; Zhang, H.; Xia, B.; Li, Y.; Gao, S.; Wang, X.-D.; et al. Lycopene in Protection against Obesity and Diabetes: A Mechanistic Review. Pharmacol Res 2020, 159, 104966. [Google Scholar] [CrossRef]
- Saini, R.K.; Prasad, P.; Lokesh, V.; Shang, X.; Shin, J.; Keum, Y.-S.; Lee, J.-H. Carotenoids: Dietary Sources, Extraction, Encapsulation, Bioavailability, and Health Benefits-A Review of Recent Advancements. Antioxidants (Basel) 2022, 11, 795. [Google Scholar] [CrossRef] [PubMed]
- Marcucci, G.; Domazetovic, V.; Nediani, C.; Ruzzolini, J.; Favre, C.; Brandi, M.L. Oxidative Stress and Natural Antioxidants in Osteoporosis: Novel Preventive and Therapeutic Approaches. Antioxidants (Basel) 2023, 12, 373. [Google Scholar] [CrossRef] [PubMed]
- Walallawita, U.S.; Wolber, F.M.; Ziv-Gal, A.; Kruger, M.C.; Heyes, J.A. Potential Role of Lycopene in the Prevention of Postmenopausal Bone Loss: Evidence from Molecular to Clinical Studies. Int J Mol Sci 2020, 21, 7119. [Google Scholar] [CrossRef] [PubMed]
- Black, D.M.; Rosen, C.J. Clinical Practice. Postmenopausal Osteoporosis. N Engl J Med 2016, 374, 254–262. [Google Scholar] [CrossRef]
- Ensrud, K.E.; Crandall, C.J. Osteoporosis. Ann Intern Med 2017, 167, ITC17–ITC32. [Google Scholar] [CrossRef]
- Salari, N.; Ghasemi, H.; Mohammadi, L.; Behzadi, M.H.; Rabieenia, E.; Shohaimi, S.; Mohammadi, M. The Global Prevalence of Osteoporosis in the World: A Comprehensive Systematic Review and Meta-Analysis. J Orthop Surg Res 2021, 16, 609. [Google Scholar] [CrossRef]
- Salari, N.; Darvishi, N.; Bartina, Y.; Larti, M.; Kiaei, A.; Hemmati, M.; Shohaimi, S.; Mohammadi, M. Global Prevalence of Osteoporosis among the World Older Adults: A Comprehensive Systematic Review and Meta-Analysis. J Orthop Surg Res 2021, 16, 669. [Google Scholar] [CrossRef]
- Lu, J.; Hu, D.; Ma, C.; Shuai, B. Advances in Our Understanding of the Mechanism of Action of Drugs (Including Traditional Chinese Medicines) for the Intervention and Treatment of Osteoporosis. Front Pharmacol 2022, 13, 938447. [Google Scholar] [CrossRef]
- Rached, M.-T.; Kode, A.; Xu, L.; Yoshikawa, Y.; Paik, J.-H.; Depinho, R.A.; Kousteni, S. FoxO1 Is a Positive Regulator of Bone Formation by Favoring Protein Synthesis and Resistance to Oxidative Stress in Osteoblasts. Cell Metab 2010, 11, 147–160. [Google Scholar] [CrossRef]
- Kousteni, S. FoxOs: Unifying Links between Oxidative Stress and Skeletal Homeostasis. Curr Osteoporos Rep 2011, 9, 60–66. [Google Scholar] [CrossRef]
- Ma, X.; Su, P.; Yin, C.; Lin, X.; Wang, X.; Gao, Y.; Patil, S.; War, A.R.; Qadir, A.; Tian, Y.; et al. The Roles of FoxO Transcription Factors in Regulation of Bone Cells Function. Int J Mol Sci 2020, 21, 692. [Google Scholar] [CrossRef]
- Li, Y.; Jin, D.; Xie, W.; Wen, L.; Chen, W.; Xu, J.; Ding, J.; Ren, D. PPAR-γ and Wnt Regulate the Differentiation of MSCs into Adipocytes and Osteoblasts Respectively. Curr Stem Cell Res Ther 2018, 13, 185–192. [Google Scholar] [CrossRef]
- Almeida, M.; Ambrogini, E.; Han, L.; Manolagas, S.C.; Jilka, R.L. Increased Lipid Oxidation Causes Oxidative Stress, Increased Peroxisome Proliferator-Activated Receptor-Gamma Expression, and Diminished pro-Osteogenic Wnt Signaling in the Skeleton. J Biol Chem 2009, 284, 27438–27448. [Google Scholar] [CrossRef]
- Kim, M.; Kim, C.; Choi, Y.S.; Kim, M.; Park, C.; Suh, Y. Age-Related Alterations in Mesenchymal Stem Cells Related to Shift in Differentiation from Osteogenic to Adipogenic Potential: Implication to Age-Associated Bone Diseases and Defects. Mech Ageing Dev 2012, 133, 215–225. [Google Scholar] [CrossRef] [PubMed]
- Xia, B.; Zhu, R.; Zhang, H.; Chen, B.; Liu, Y.; Dai, X.; Ye, Z.; Zhao, D.; Mo, F.; Gao, S.; et al. Lycopene Improves Bone Quality and Regulates AGE/RAGE/NF-кB Signaling Pathway in High-Fat Diet-Induced Obese Mice. Oxid Med Cell Longev 2022, 2022, 3697067. [Google Scholar] [CrossRef] [PubMed]
- Wang, J.; Suo, Y.; Zhang, J.; Zou, Q.; Tan, X.; Yuan, T.; Liu, Z.; Liu, X. Lycopene Supplementation Attenuates Western Diet-Induced Body Weight Gain through Increasing the Expressions of Thermogenic/Mitochondrial Functional Genes and Improving Insulin Resistance in the Adipose Tissue of Obese Mice. J Nutr Biochem 2019, 69, 63–72. [Google Scholar] [CrossRef] [PubMed]
- Yang, Z.; Zhang, Z.; Penniston, K.L.; Binkley, N.; Tanumihardjo, S.A. Serum Carotenoid Concentrations in Postmenopausal Women from the United States with and without Osteoporosis. Int J Vitam Nutr Res 2008, 78, 105–111. [Google Scholar] [CrossRef] [PubMed]
- Shen, C.-L.; von Bergen, V.; Chyu, M.-C.; Jenkins, M.R.; Mo, H.; Chen, C.-H.; Kwun, I.-S. Fruits and Dietary Phytochemicals in Bone Protection. Nutr Res 2012, 32, 897–910. [Google Scholar] [CrossRef] [PubMed]
- Rao, L.G.; Mackinnon, E.S.; Josse, R.G.; Murray, T.M.; Strauss, A.; Rao, A.V. Lycopene Consumption Decreases Oxidative Stress and Bone Resorption Markers in Postmenopausal Women. Osteoporos Int 2007, 18, 109–115. [Google Scholar] [CrossRef] [PubMed]
- Li, Y.; He, Y.; Chen, G.; Huang, Z.; Yi, C.; Zhang, X.; Deng, F.; Yu, D. Selenomethionine Protects Oxidative-Stress-Damaged Bone-Marrow-Derived Mesenchymal Stem Cells via an Antioxidant Effect and the PTEN/PI3K/AKT Pathway. Exp Cell Res 2021, 408, 112864. [Google Scholar] [CrossRef] [PubMed]
- Guo, Y.; Wang, L.; Ma, R.; Mu, Q.; Yu, N.; Zhang, Y.; Tang, Y.; Li, Y.; Jiang, G.; Zhao, D.; et al. JiangTang XiaoKe Granule Attenuates Cathepsin K Expression and Improves IGF-1 Expression in the Bone of High Fat Diet Induced KK-Ay Diabetic Mice. Life Sci 2016, 148, 24–30. [Google Scholar] [CrossRef] [PubMed]
- Chen, B.; Wang, L.; Li, L.; Zhu, R.; Liu, H.; Liu, C.; Ma, R.; Jia, Q.; Zhao, D.; Niu, J.; et al. Fructus Ligustri Lucidi in Osteoporosis: A Review of Its Pharmacology, Phytochemistry, Pharmacokinetics and Safety. Molecules 2017, 22, 1469. [Google Scholar] [CrossRef]
- Olfer’ev, A.M.; Il’ina, M.V.; Berzak, N.V.; Stetsenko, A.V.; Olfer’ev, M.A.; Chudakova, I.A.; Kapitanov, A.B.; Shamarin, V.M. [Effect of lycopene on blood lipoproteids in women with type 2 diabetes mellitus in postmenopause]. Vopr Pitan 2004, 73, 19–23. [Google Scholar]
- Li, L.; Chen, B.; Zhu, R.; Li, R.; Tian, Y.; Liu, C.; Jia, Q.; Wang, L.; Tang, J.; Zhao, D.; et al. Fructus Ligustri Lucidi Preserves Bone Quality through the Regulation of Gut Microbiota Diversity, Oxidative Stress, TMAO and Sirt6 Levels in Aging Mice. Aging (Albany NY) 2019, 11, 9348–9368. [Google Scholar] [CrossRef] [PubMed]
- Chen, B.; Wei, J.; Zhu, R.; Zhang, H.; Xia, B.; Liu, Y.; Dai, X.; Ye, Z.; Tian, Y.; Li, R.; et al. Fructus Ligustri Lucidi Aqueous Extract Promotes Calcium Balance and Short-Chain Fatty Acids Production in Ovariectomized Rats. J Ethnopharmacol 2021, 279, 114348. [Google Scholar] [CrossRef] [PubMed]
- Ou-Yang, H.; Paschalis, E.P.; Mayo, W.E.; Boskey, A.L.; Mendelsohn, R. Infrared Microscopic Imaging of Bone: Spatial Distribution of CO3(2-). J Bone Miner Res 2001, 16, 893–900. [Google Scholar] [CrossRef] [PubMed]
- Taylor, E.A.; Lloyd, A.A.; Salazar-Lara, C.; Donnelly, E. Raman and Fourier Transform Infrared (FT-IR) Mineral to Matrix Ratios Correlate with Physical Chemical Properties of Model Compounds and Native Bone Tissue. Appl Spectrosc 2017, 71, 2404–2410. [Google Scholar] [CrossRef] [PubMed]
- Zhu, C.-T.; Li, T.; Zhang, P.; Zou, M.; Guo, Q.; Qu, X.-W. Beneficial Effects of Low-Level Laser Irradiation on Senile Osteoporosis in Rats. Eur Rev Med Pharmacol Sci 2017, 21, 5230–5238. [Google Scholar] [CrossRef] [PubMed]
- Khan, U.M.; Sevindik, M.; Zarrabi, A.; Nami, M.; Ozdemir, B.; Kaplan, D.N.; Selamoglu, Z.; Hasan, M.; Kumar, M.; Alshehri, M.M.; et al. Lycopene: Food Sources, Biological Activities, and Human Health Benefits. Oxid Med Cell Longev 2021, 2021, 2713511. [Google Scholar] [CrossRef] [PubMed]
- Williams, C.; Sapra, A. Osteoporosis Markers. In StatPearls; StatPearls Publishing: Treasure Island (FL), 2024. [Google Scholar]
- Zhu, H.; Wang, M.; Zhao, C.; Li, R.; Yang, J.; Pei, G.; Ye, T.; Zuo, X.; Liu, L.; Chong Lee Shin, O.L.; et al. GAG and Collagen II Attenuate Glucocorticoid-Induced Osteoporosis by Regulating NF-κB and MAPK Signaling. Am J Transl Res 2018, 10, 1762–1772. [Google Scholar] [PubMed]
- Iantomasi, T.; Romagnoli, C.; Palmini, G.; Donati, S.; Falsetti, I.; Miglietta, F.; Aurilia, C.; Marini, F.; Giusti, F.; Brandi, M.L. Oxidative Stress and Inflammation in Osteoporosis: Molecular Mechanisms Involved and the Relationship with microRNAs. Int J Mol Sci 2023, 24, 3772. [Google Scholar] [CrossRef] [PubMed]
- Lin, T.; Zhang, Z.; Wu, J.; Jiang, H.; Wang, C.; Ma, J.; Yin, Y.; Wang, S.; Gao, R.; Zhou, X. A ROS/GAS5/SIRT1 Reinforcing Feedback Promotes Oxidative Stress-Induced Adipogenesis in Bone Marrow-Derived Mesenchymal Stem Cells during Osteoporosis. Int Immunopharmacol 2023, 114, 109560. [Google Scholar] [CrossRef]
- Wang, Y.-F.; Chang, Y.-Y.; Zhang, X.-M.; Gao, M.-T.; Zhang, Q.-L.; Li, X.; Zhang, L.; Yao, W.-F. Salidroside Protects against Osteoporosis in Ovariectomized Rats by Inhibiting Oxidative Stress and Promoting Osteogenesis via Nrf2 Activation. Phytomedicine 2022, 99, 154020. [Google Scholar] [CrossRef]
- Lee, G.-H.; Hoang, T.-H.; Lee, H.-Y.; Lim, Y.-J.; Kim, J.-H.; Jung, S.-J.; Chae, S.-W.; Rashid, M.M.U.; Chae, H.-J.; Yoon, S.-J. Ramie Leaf Extract Alleviates Bone Loss in Ovariectomized Rats-The Involvement of ROS and Its Associated Signalings. Nutrients 2023, 15, 745. [Google Scholar] [CrossRef] [PubMed]
- Zhang, J.; Liu, S.; He, Z.; Liu, H.; Liu, Y.; Hu, P.; Li, Z.; Xu, J.; Luo, E. Adiponectin Overexpression Promotes Fracture Healing through Regulating the Osteogenesis and Adipogenesis Balance in Osteoporotic Mice. J Bone Miner Metab 2023, 41, 457–469. [Google Scholar] [CrossRef] [PubMed]
- Zhu, R.; Wei, J.; Liu, H.; Liu, C.; Wang, L.; Chen, B.; Li, L.; Jia, Q.; Tian, Y.; Li, R.; et al. Lycopene Attenuates Body Weight Gain through Induction of Browning via Regulation of Peroxisome Proliferator-Activated Receptor γ in High-Fat Diet-Induced Obese Mice. J Nutr Biochem 2020, 78, 108335. [Google Scholar] [CrossRef] [PubMed]
- Ardawi, M.-S.M.; Badawoud, M.H.; Hassan, S.M.; Rouzi, A.A.; Ardawi, J.M.S.; AlNosani, N.M.; Qari, M.H.; Mousa, S.A. Lycopene Treatment against Loss of Bone Mass, Microarchitecture and Strength in Relation to Regulatory Mechanisms in a Postmenopausal Osteoporosis Model. Bone 2016, 83, 127–140. [Google Scholar] [CrossRef] [PubMed]
- Tsartsalis, A.N.; Dokos, C.; Kaiafa, G.D.; Tsartsalis, D.N.; Kattamis, A.; Hatzitolios, A.I.; Savopoulos, C.G. Statins, Bone Formation and Osteoporosis: Hope or Hype? Hormones (Athens) 2012, 11, 126–139. [Google Scholar] [CrossRef] [PubMed]
- Yoshida, T.; Takahashi, K.; Yamatani, H.; Takata, K.; Kurachi, H. Impact of Surgical Menopause on Lipid and Bone Metabolism. Climacteric 2011, 14, 445–452. [Google Scholar] [CrossRef] [PubMed]
- Polyzos, S.A.; Anastasilakis, A.D.; Efstathiadou, Z.A.; Yavropoulou, M.P.; Makras, P. Postmenopausal Osteoporosis Coexisting with Other Metabolic Diseases: Treatment Considerations. Maturitas 2021, 147, 19–25. [Google Scholar] [CrossRef] [PubMed]
- Ricardo, V.; Sousa, L.G. de; Regalo, I.H.; Pitol, D.L.; Bombonato-Prado, K.F.; Regalo, S.C.H.; Siessere, S. Lycopene Enhances Bone Neoformation in Calvaria Bone Defects of Ovariectomized Rats. Braz Dent J 2023, 34, 50–56. [Google Scholar] [CrossRef] [PubMed]
- Semeghini, M.S.; Scalize, P.H.; Coelho, M.C.; Fernandes, R.R.; Pitol, D.L.; Tavares, M.S.; de Sousa, L.G.; Coppi, A.A.; Siessere, S.; Bombonato-Prado, K.F. Lycopene Prevents Bone Loss in Ovariectomized Rats and Increases the Number of Osteocytes and Osteoblasts. J Anat 2022, 241, 729–740. [Google Scholar] [CrossRef]
- Oliveira, G.R.; Vargas-Sanchez, P.K.; Fernandes, R.R.; Ricoldi, M.S.T.; Semeghini, M.S.; Pitol, D.L.; de Sousa, L.G.; Siessere, S.; Bombonato-Prado, K.F. Lycopene Influences Osteoblast Functional Activity and Prevents Femur Bone Loss in Female Rats Submitted to an Experimental Model of Osteoporosis. J Bone Miner Metab 2019, 37, 658–667. [Google Scholar] [CrossRef]
- Russo, C.; Ferro, Y.; Maurotti, S.; Salvati, M.A.; Mazza, E.; Pujia, R.; Terracciano, R.; Maggisano, G.; Mare, R.; Giannini, S.; et al. Lycopene and Bone: An in Vitro Investigation and a Pilot Prospective Clinical Study. J Transl Med 2020, 18, 43. [Google Scholar] [CrossRef] [PubMed]
- Ardawi, M.S.M.; Badawoud, M.H.; Hassan, S.M.; Ardawi, A.M.S.; Rouzi, A.A.; Qari, M.H.; Mousa, S.A. Lycopene Nanoparticles Promotes Osteoblastogenesis and Inhibits Adipogenesis of Rat Bone Marrow Mesenchymal Stem Cells. Eur Rev Med Pharmacol Sci 2021, 25, 6894–6907. [Google Scholar] [CrossRef]
- Iimura, Y.; Agata, U.; Takeda, S.; Kobayashi, Y.; Yoshida, S.; Ezawa, I.; Omi, N. The Protective Effect of Lycopene Intake on Bone Loss in Ovariectomized Rats. J Bone Miner Metab 2015, 33, 270–278. [Google Scholar] [CrossRef]
- Mackinnon, E.S.; Rao, A.V.; Josse, R.G.; Rao, L.G. Supplementation with the Antioxidant Lycopene Significantly Decreases Oxidative Stress Parameters and the Bone Resorption Marker N-Telopeptide of Type I Collagen in Postmenopausal Women. Osteoporos Int 2011, 22, 1091–1101. [Google Scholar] [CrossRef]
- Zhu, S.-Y.; Li, X.-N.; Zhao, Y.; Dai, X.-Y.; Guo, J.-Y.; Li, J.-L. Lycopene Ameliorate Atrazine-Induced Oxidative Damage in the B Cell Zone via Targeting the miR-27a-3p/Foxo1 Axis. J Agric Food Chem 2022, 70, 12502–12512. [Google Scholar] [CrossRef] [PubMed]
- Zhu, S.-Y.; Li, C.-X.; Tong, Y.-X.; Xu, Y.-R.; Wang, Z.-Y.; Li, J.-L. IL-6/STAT3/Foxo1 Axis as a Target of Lycopene Ameliorates the Atrazine-Induced Thymic Mitophagy and Pyroptosis Cross-Talk. Food Funct 2022, 13, 8871–8879. [Google Scholar] [CrossRef] [PubMed]
- Albrahim, T. Lycopene Modulates Oxidative Stress and Inflammation in Hypercholesterolemic Rats. Pharmaceuticals (Basel) 2022, 15, 1420. [Google Scholar] [CrossRef] [PubMed]
- Cao, C.; Sun, S.; Li, J.; Song, C.; Meng, Q.; Shi, B.; Shan, A. Lycopene Modulates Lipid Metabolism in Rats and Their Offspring under a High-Fat Diet. Food Funct 2021, 12, 8960–8975. [Google Scholar] [CrossRef]
- Liao, L.; Su, X.; Yang, X.; Hu, C.; Li, B.; Lv, Y.; Shuai, Y.; Jing, H.; Deng, Z.; Jin, Y. TNF-α Inhibits FoxO1 by Upregulating miR-705 to Aggravate Oxidative Damage in Bone Marrow-Derived Mesenchymal Stem Cells during Osteoporosis. Stem Cells 2016, 34, 1054–1067. [Google Scholar] [CrossRef]
- Zhang, Y.; Xiong, Y.; Zhou, J.; Xin, N.; Zhu, Z.; Wu, Y. FoxO1 Expression in Osteoblasts Modulates Bone Formation through Resistance to Oxidative Stress in Mice. Biochem Biophys Res Commun 2018, 503, 1401–1408. [Google Scholar] [CrossRef]
- Chen, J.; Lu, Y.; Tian, M.; Huang, Q. Molecular Mechanisms of FOXO1 in Adipocyte Differentiation. J Mol Endocrinol 2019, 62, R239–R253. [Google Scholar] [CrossRef] [PubMed]
- Kousteni, S. FoxO1, the Transcriptional Chief of Staff of Energy Metabolism. Bone 2012, 50, 437–443. [Google Scholar] [CrossRef] [PubMed]
- Xiao, H.-H.; Zhu, Y.-X.; Lu, L.; Zhou, L.-P.; Poon, C.C.-W.; Chan, C.-O.; Wang, L.-J.; Cao, S.; Yu, W.-X.; Wong, K.-Y.; et al. The Lignan-Rich Fraction from Sambucus Williamsii Hance Exerts Bone Protective Effects via Altering Circulating Serotonin and Gut Microbiota in Rats. Nutrients 2022, 14, 4718. [Google Scholar] [CrossRef] [PubMed]
- Jiang, Y.; Luo, W.; Wang, B.; Wang, X.; Gong, P.; Xiong, Y. Resveratrol Promotes Osteogenesis via Activating SIRT1/FoxO1 Pathway in Osteoporosis Mice. Life Sci 2020, 246, 117422. [Google Scholar] [CrossRef]
- Chen, P.; Hu, B.; Xie, L.-Q.; Jiang, T.-J.; Xia, Z.-Y.; Peng, H. Scara3 Regulates Bone Marrow Mesenchymal Stem Cell Fate Switch between Osteoblasts and Adipocytes by Promoting Foxo1. Cell Prolif 2021, 54, e13095. [Google Scholar] [CrossRef]


Disclaimer/Publisher’s Note: The statements, opinions and data contained in all publications are solely those of the individual author(s) and contributor(s) and not of MDPI and/or the editor(s). MDPI and/or the editor(s) disclaim responsibility for any injury to people or property resulting from any ideas, methods, instructions or products referred to in the content. |
© 2024 by the authors. Licensee MDPI, Basel, Switzerland. This article is an open access article distributed under the terms and conditions of the Creative Commons Attribution (CC BY) license (https://creativecommons.org/licenses/by/4.0/).


