Submitted:
03 April 2024
Posted:
03 April 2024
You are already at the latest version
Abstract
Keywords:
1. Introduction
2. Materials and Methods
2.1. Study Area
2.2. Input Data
2.2.1. Landsat and Sentinel-2 Imagery
2.2.2. Global Burned Area Products
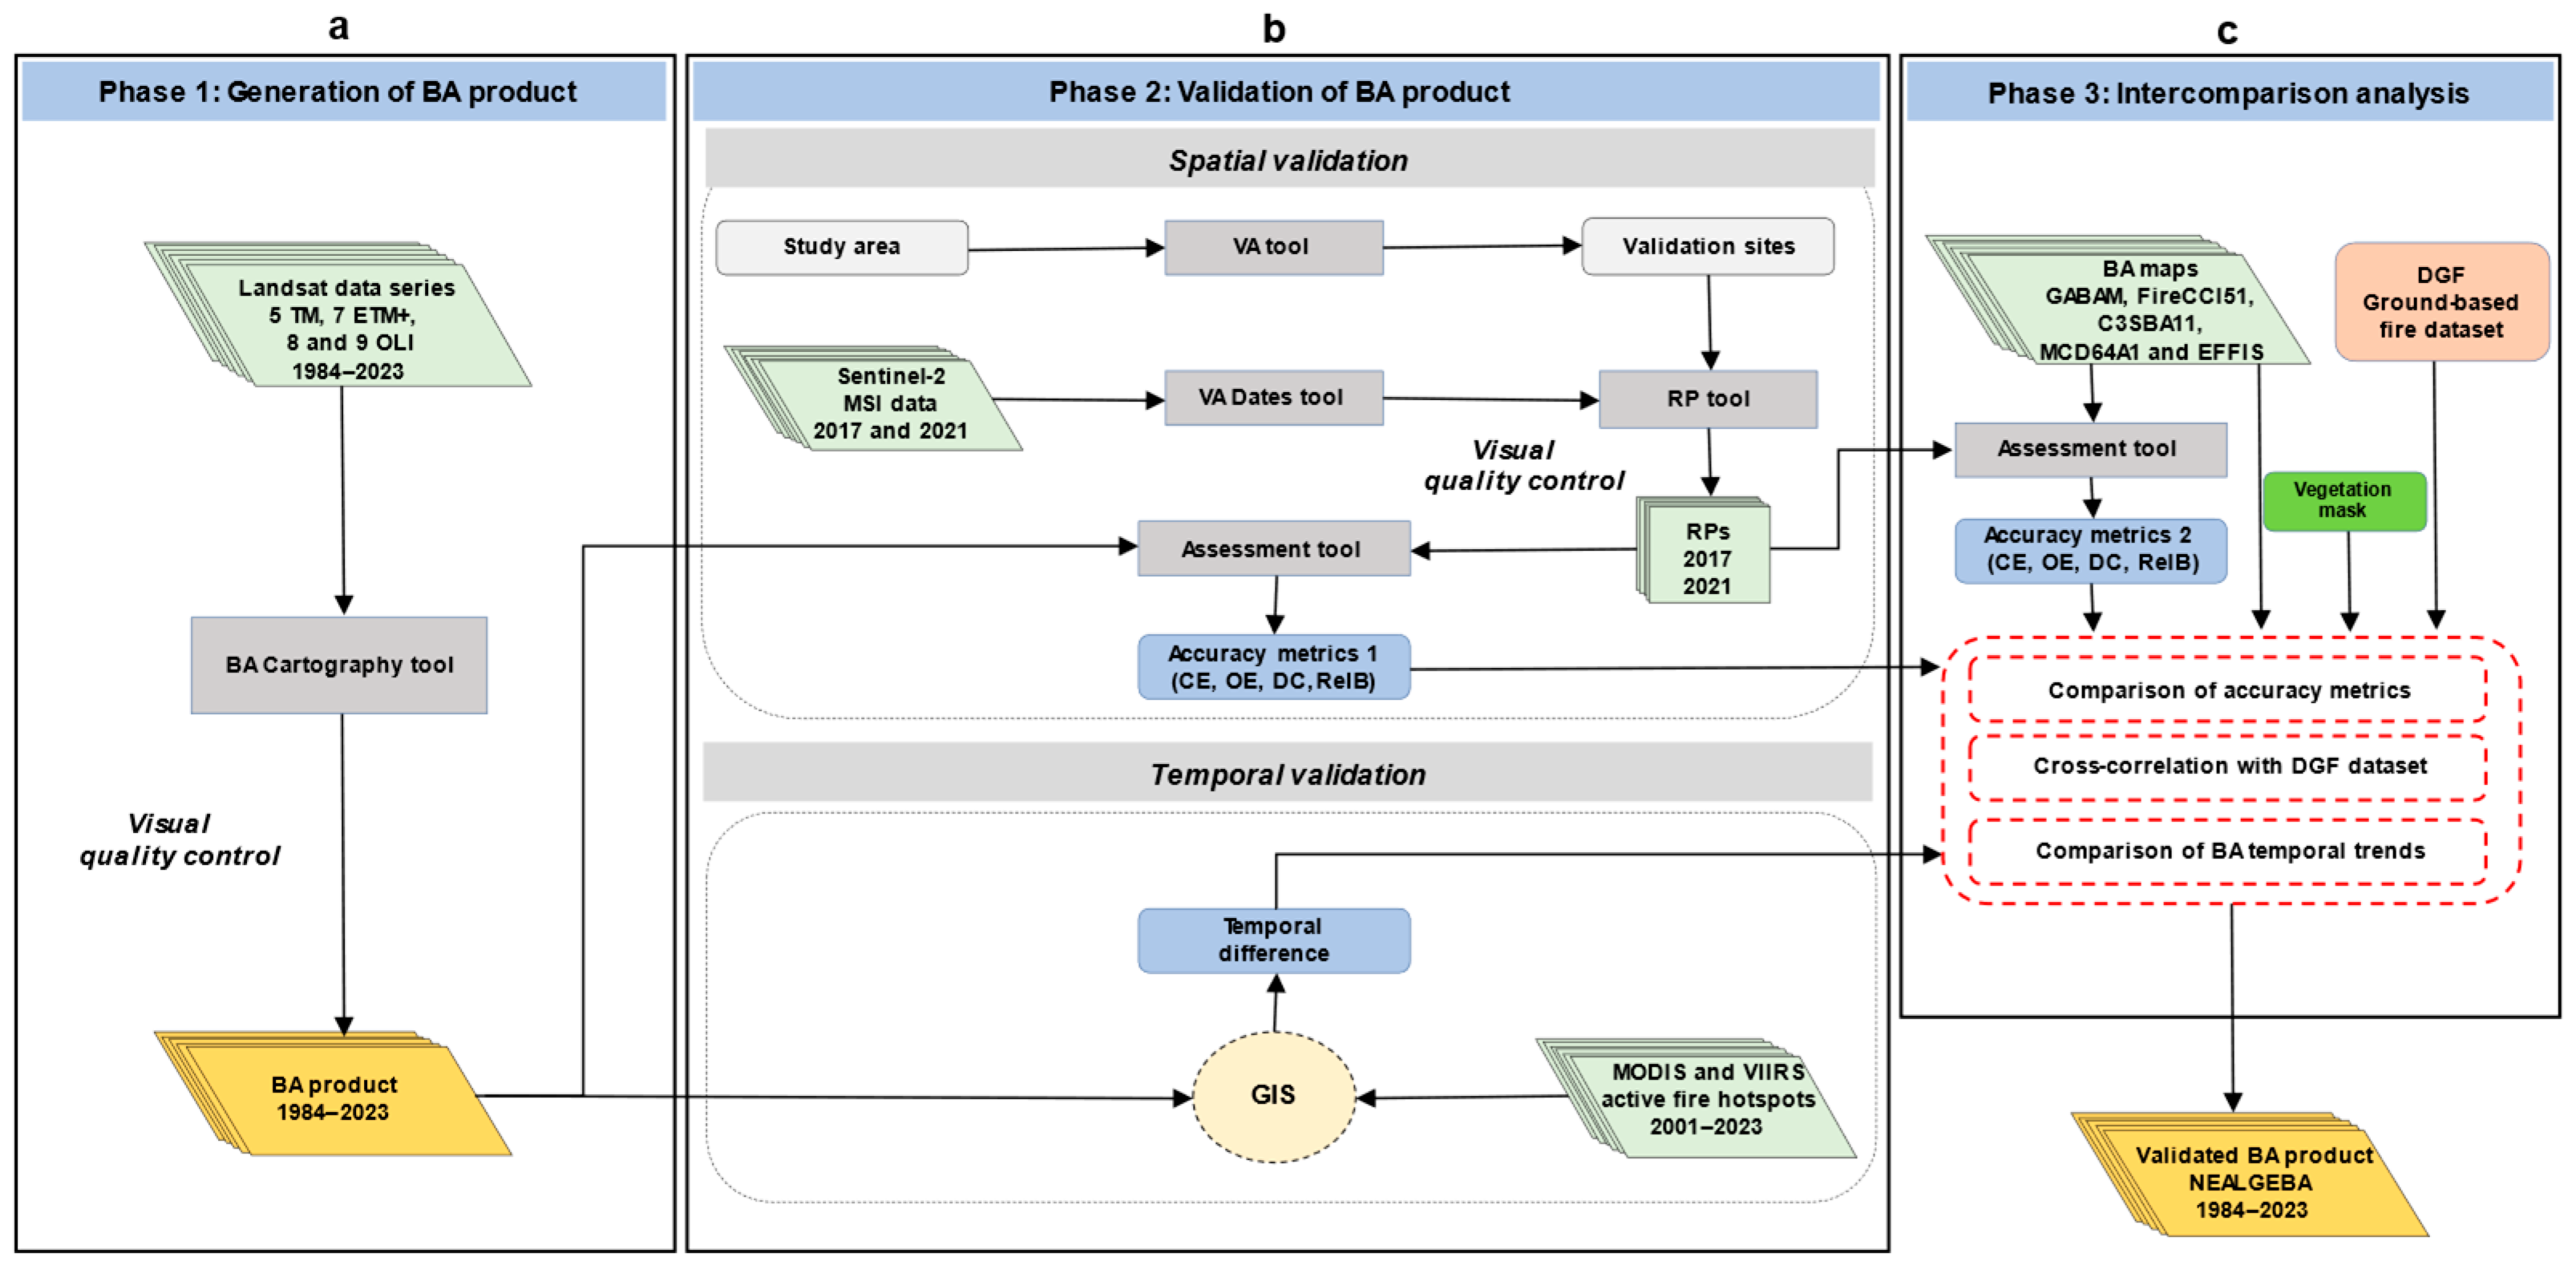
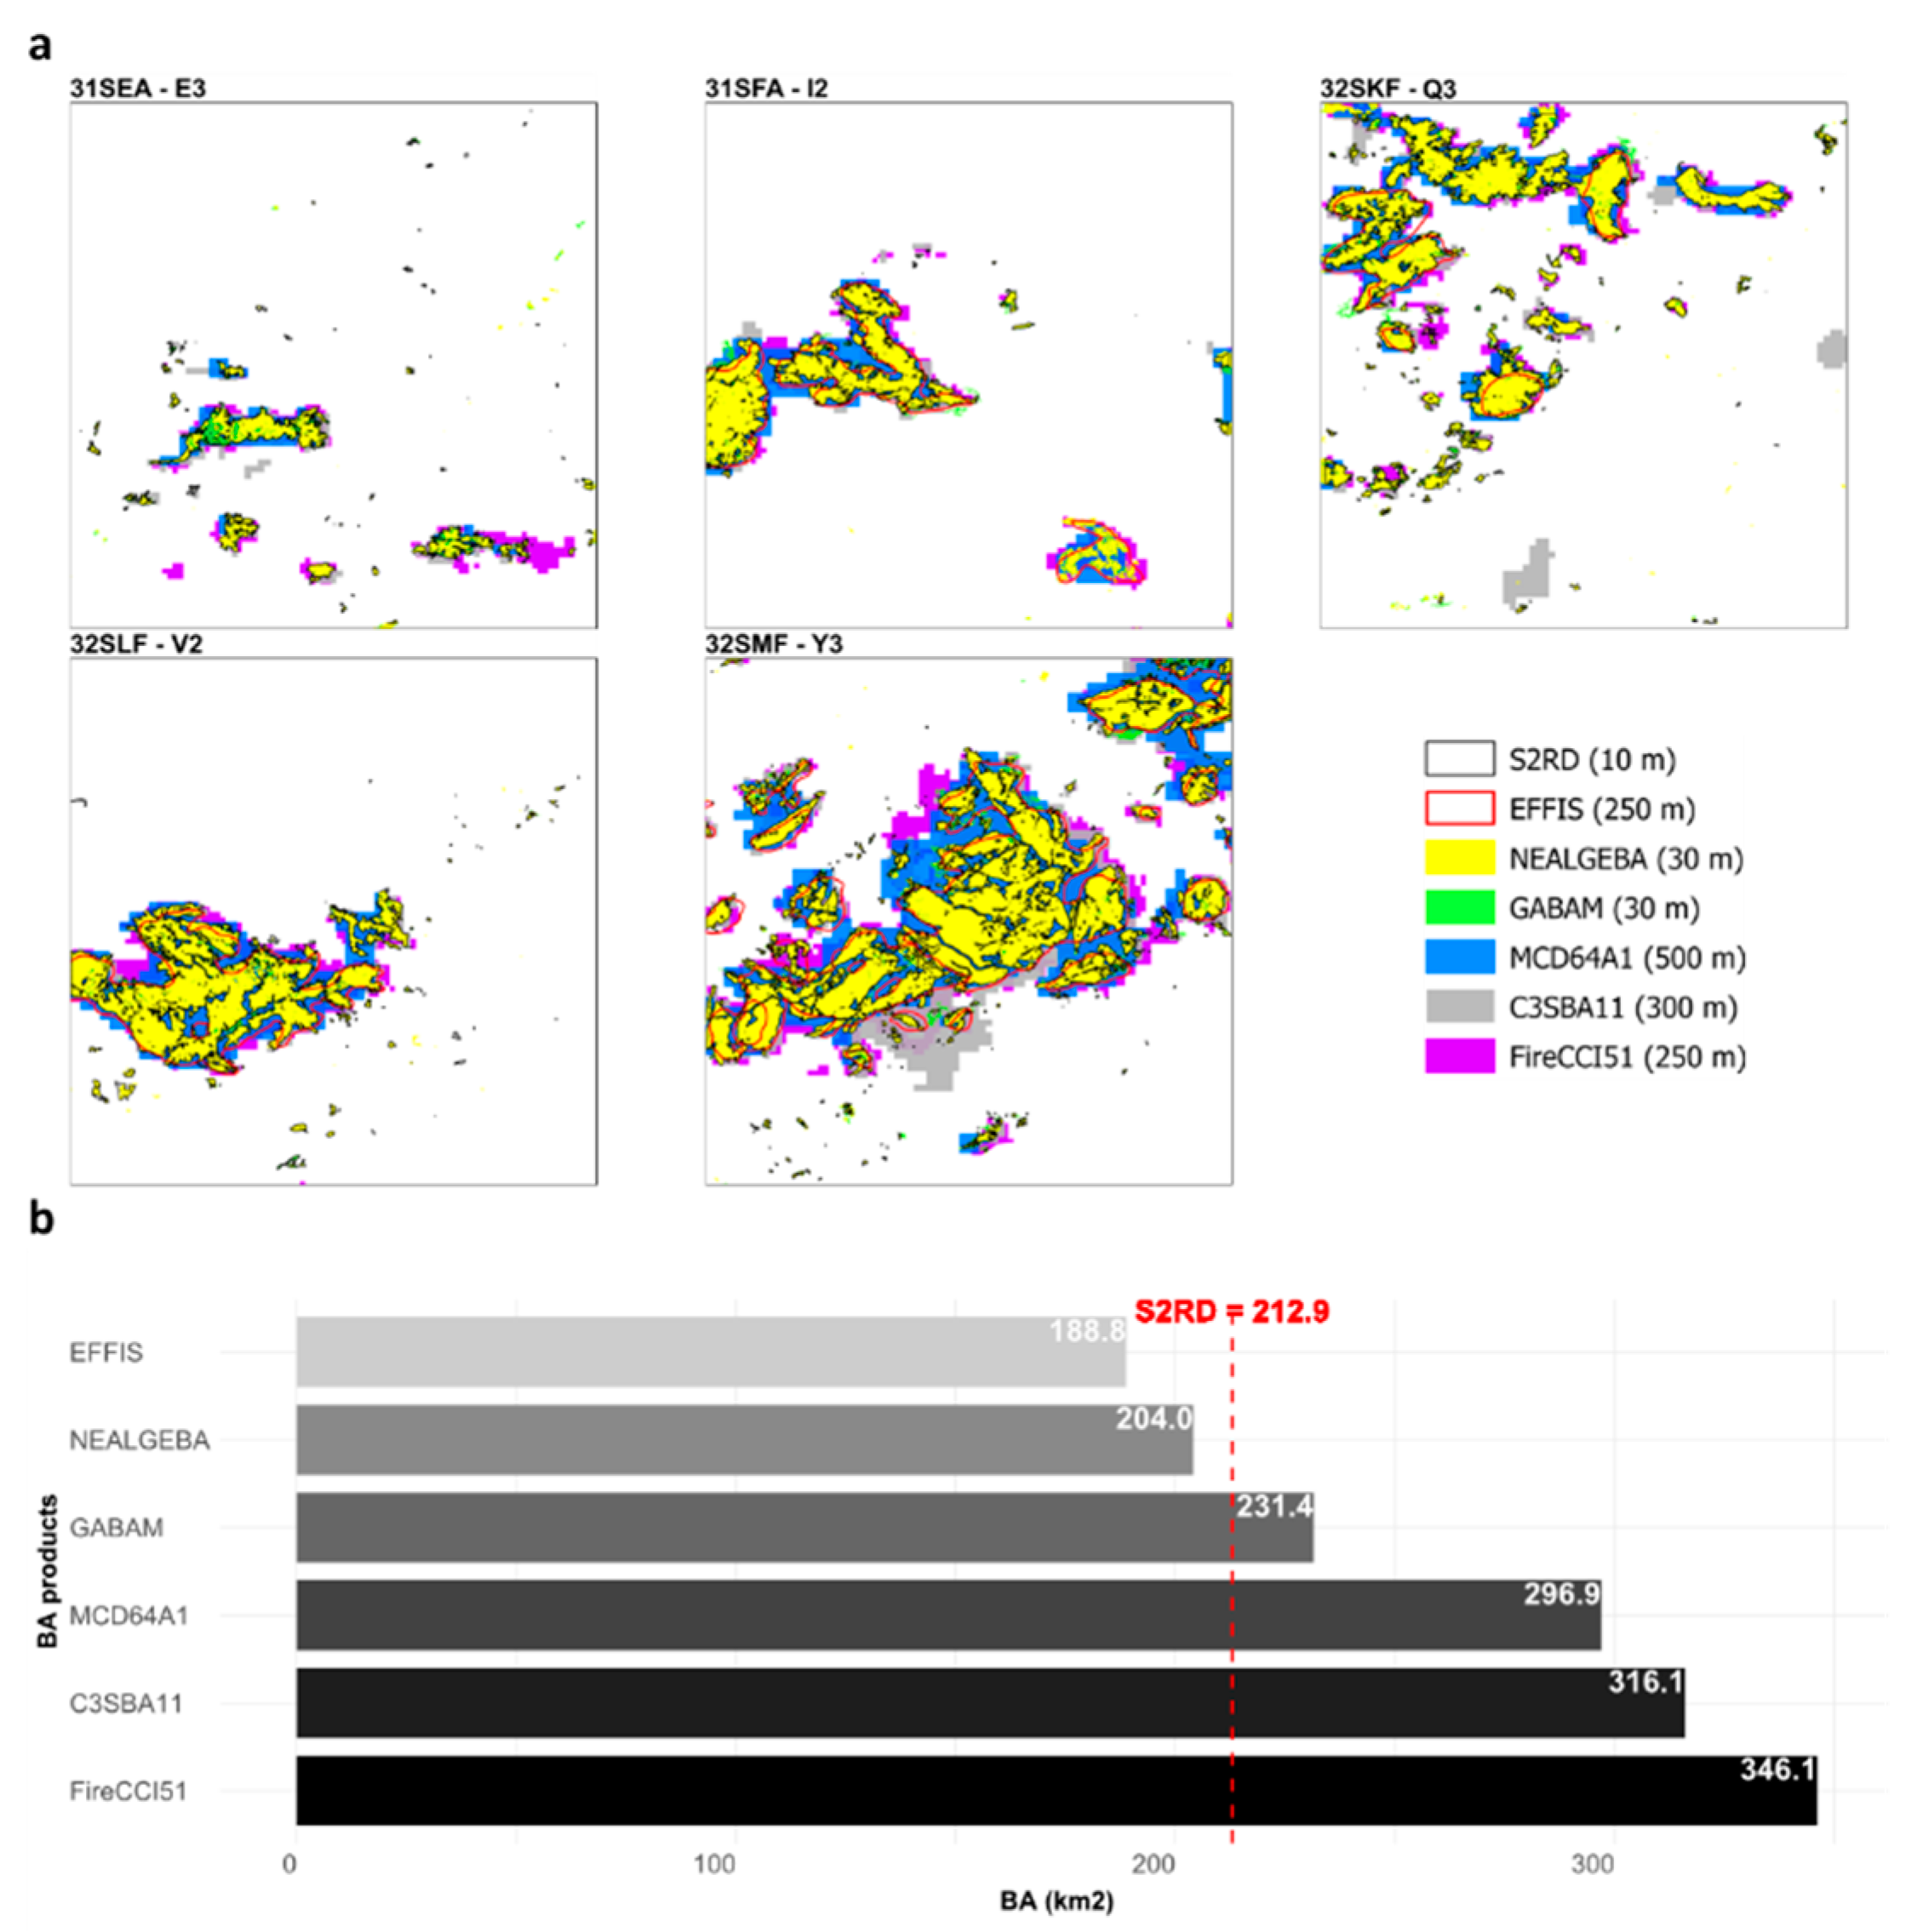
- The GABAM is the first and only medium-resolution BA product at 30-m resolution with a global scale and long-term BA data to date. A novel automatic pipeline [32] was applied to generate the annual global BA maps from the Landsat time-series on the GEE platform [33] from 1985 to 2019. Nevertheless, 1986, 1988, 1990, 1991, 1993, 1994, 1997 and 1999 are unavailable. Yearly GABAM composites were downloaded as 10° × 10° tiles in GeoTIFF format at ftp://124.16.184.141/GABAM (accessed February 2023).
- The FireCCI51 provides monthly global BA maps at the 250-m spatial resolution based on a hybrid algorithm coupling daily surface reflectance imagery and the active fire data from MODIS for 2001–2020 [23]. The FireCCI51 pixel product in GeoTIFF format was downloaded at https://doi.org/10.5285/58f00d8814064b79a0c49662ad3af537 (accessed April 2023).
- The C3SBA11 delivers monthly global BA maps at 300-m spatial resolution since 2017 onwards, using an adaptation of the FireCCI51 BA algorithm to Sentinel-3 OLCI data [25]. The pixel BA product was obtained from the C3S Climate Data Store (CDS) in NetCDF files at https://doi.org/10.24381/cds.f333cf85 (accessed April 2023).
- The MCD64A1 collection 6.1 BA mapping approach combines daily surface reflectance images with the active fire data from MODIS to produce monthly global BA maps at a spatial resolution of 500 m from 2000 onwards [28]. The product is provided by the USGS Land Processes Distributed Active Archive Centre (LP-DAAC) and was obtained in GeoTIFF format from the Application for Extracting and Exploring Analysis Ready Samples (AppEEARS) service (https://lpdaacsvc.cr.usgs.gov/appeears/, accessed April 2023).
- The EFFIS BA product provides daily updates of fire contours with information on the initial and final dates of burn detection, BAs, administrative units, and vegetation type for 49 countries in Europe, the Middle East, and North Africa (MENA) from 2000 to the present-day. The EFFIS Rapid Damage Assessment (RDA) module performs BA delineation by processing daily imagery from the MODIS instrument at a spatial resolution of 250 m [30]. Since 2018, EFFIS fire contours have been generated using the 20-m resolution Sentinel-2 imagery. For Algeria, EFFIS fire contours are available only for 2004 and 2005, and from 2009 onwards. The EFFIS BA product was provided in the ESRI Shapefile format from the EFFIS of the European Commission Joint Research Centre (https://effis.jrc.ec.europa.eu, accessed April 2023).
2.2.3. Active Fire Products
2.2.4. Ground-Based Fire Dataset
2.2.5. Land Cover Map
2.3. Burned Area Generation
2.4. Spatio-Temporal Validation
2.4.1. Spatial Validation
2.4.2. Temporal Validation
2.5. Intercomparison Analysis
2.5.1. Spatial Accuracy
2.5.2. Cross-Correlation with Ground-Based Fire Dataset
2.5.3. Temporal Burned Area Trends
3. Results
3.1. Analysis of the Generated BA Product
3.1.1. Spatial and Temporal Patterns
3.1.2. Fire-Size Distribution
3.1.3. Fire Seasonality
3.2. Spatio-Temporal Validation
3.2.1. Spatial Validation
3.2.2. Temporal Validation
3.3. Intercomparison Analysis
3.3.1. Spatial Accuracy
3.3.2. Cross-Correlation with Ground-Based Fire Dataset
3.3.3. Temporal Trends of the Burned Area
4. Discussion
5. Conclusions
Author Contributions
Funding
Institutional Review Board Statement
Data Availability Statement
Acknowledgments
Conflicts of Interest
Appendix A
|
Sentinel-2 tiles |
Validation sites |
Years | Validation period | |||
| Length in days | Start | End | Sentinel-2 images | |||
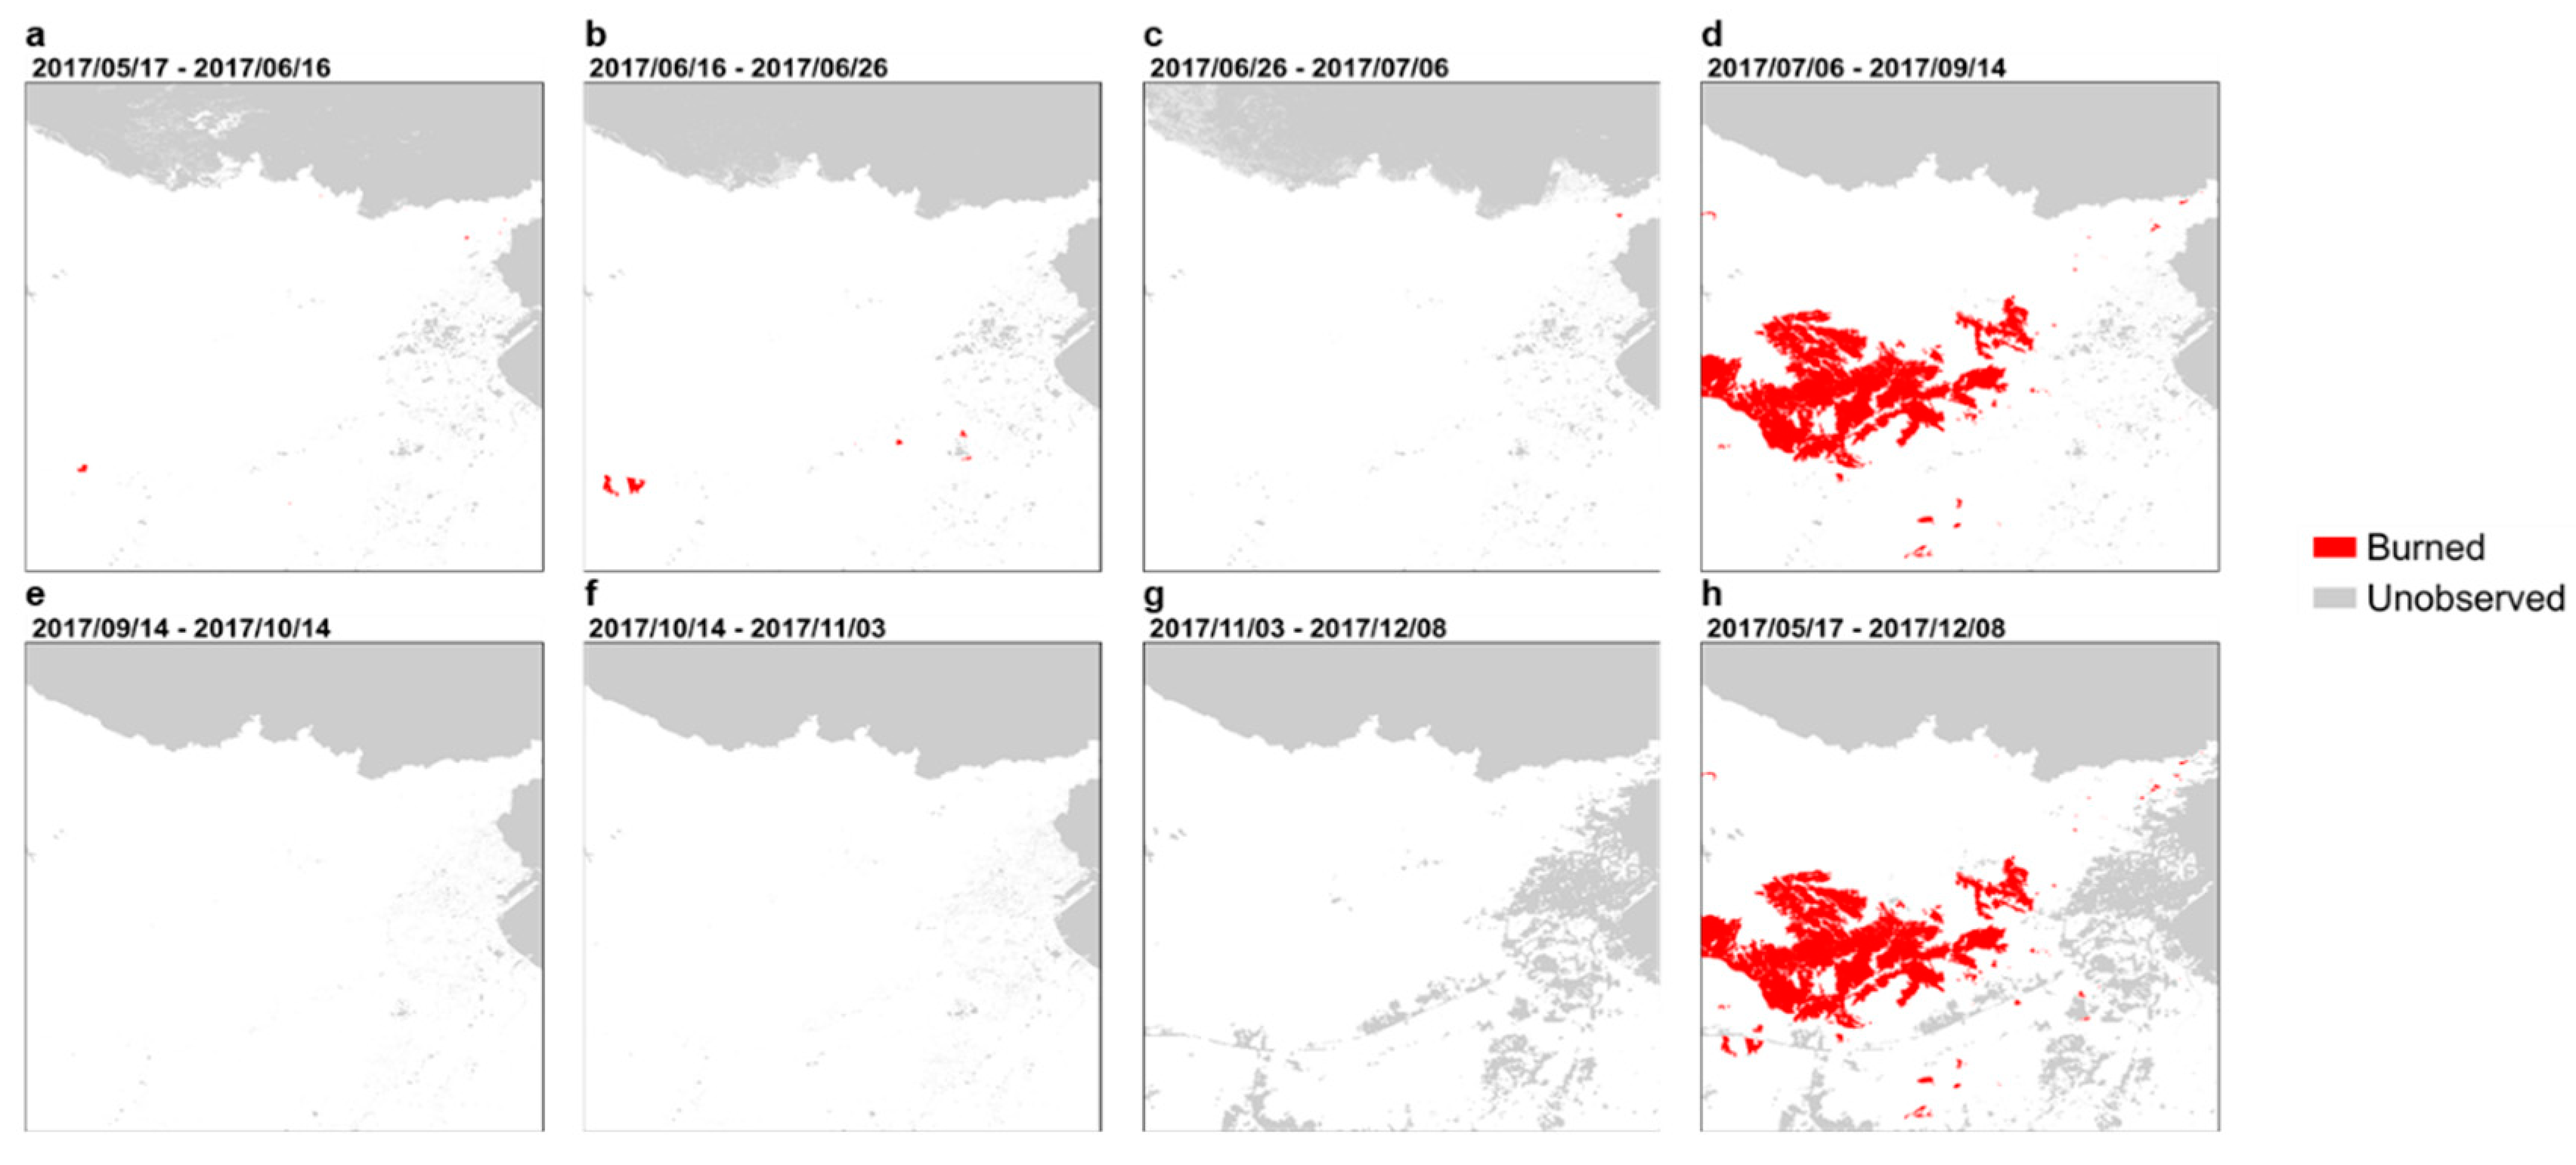
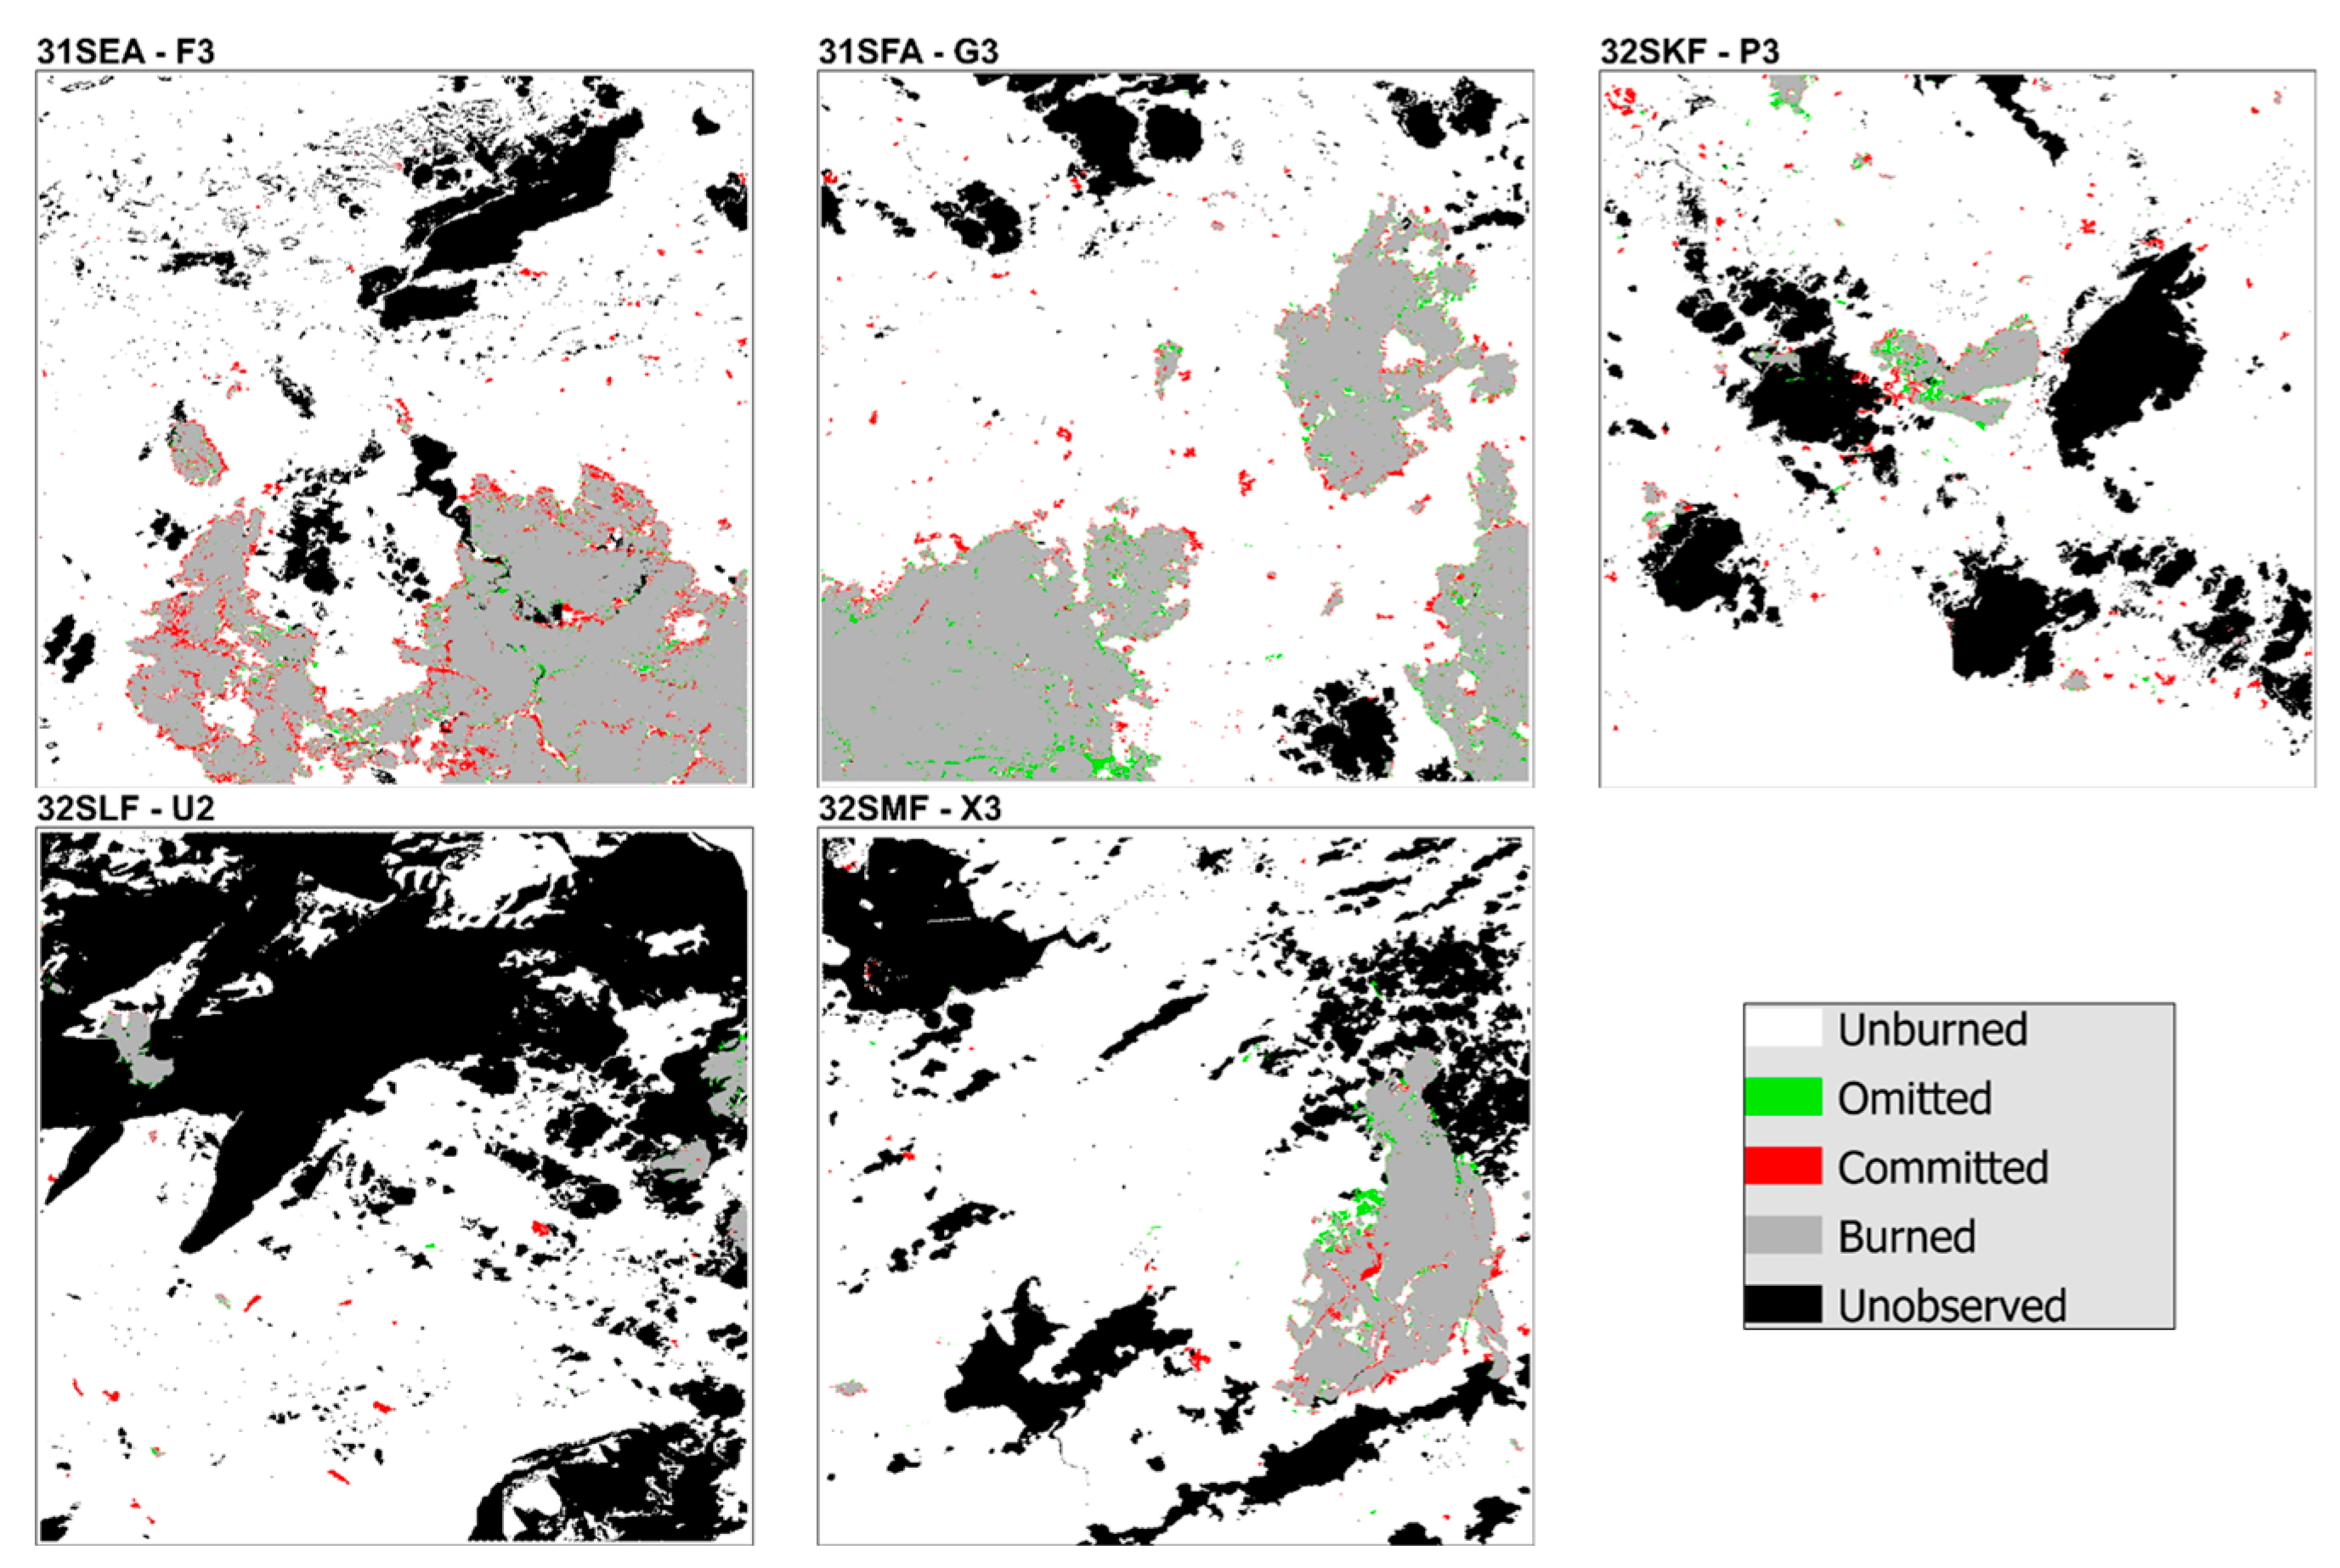
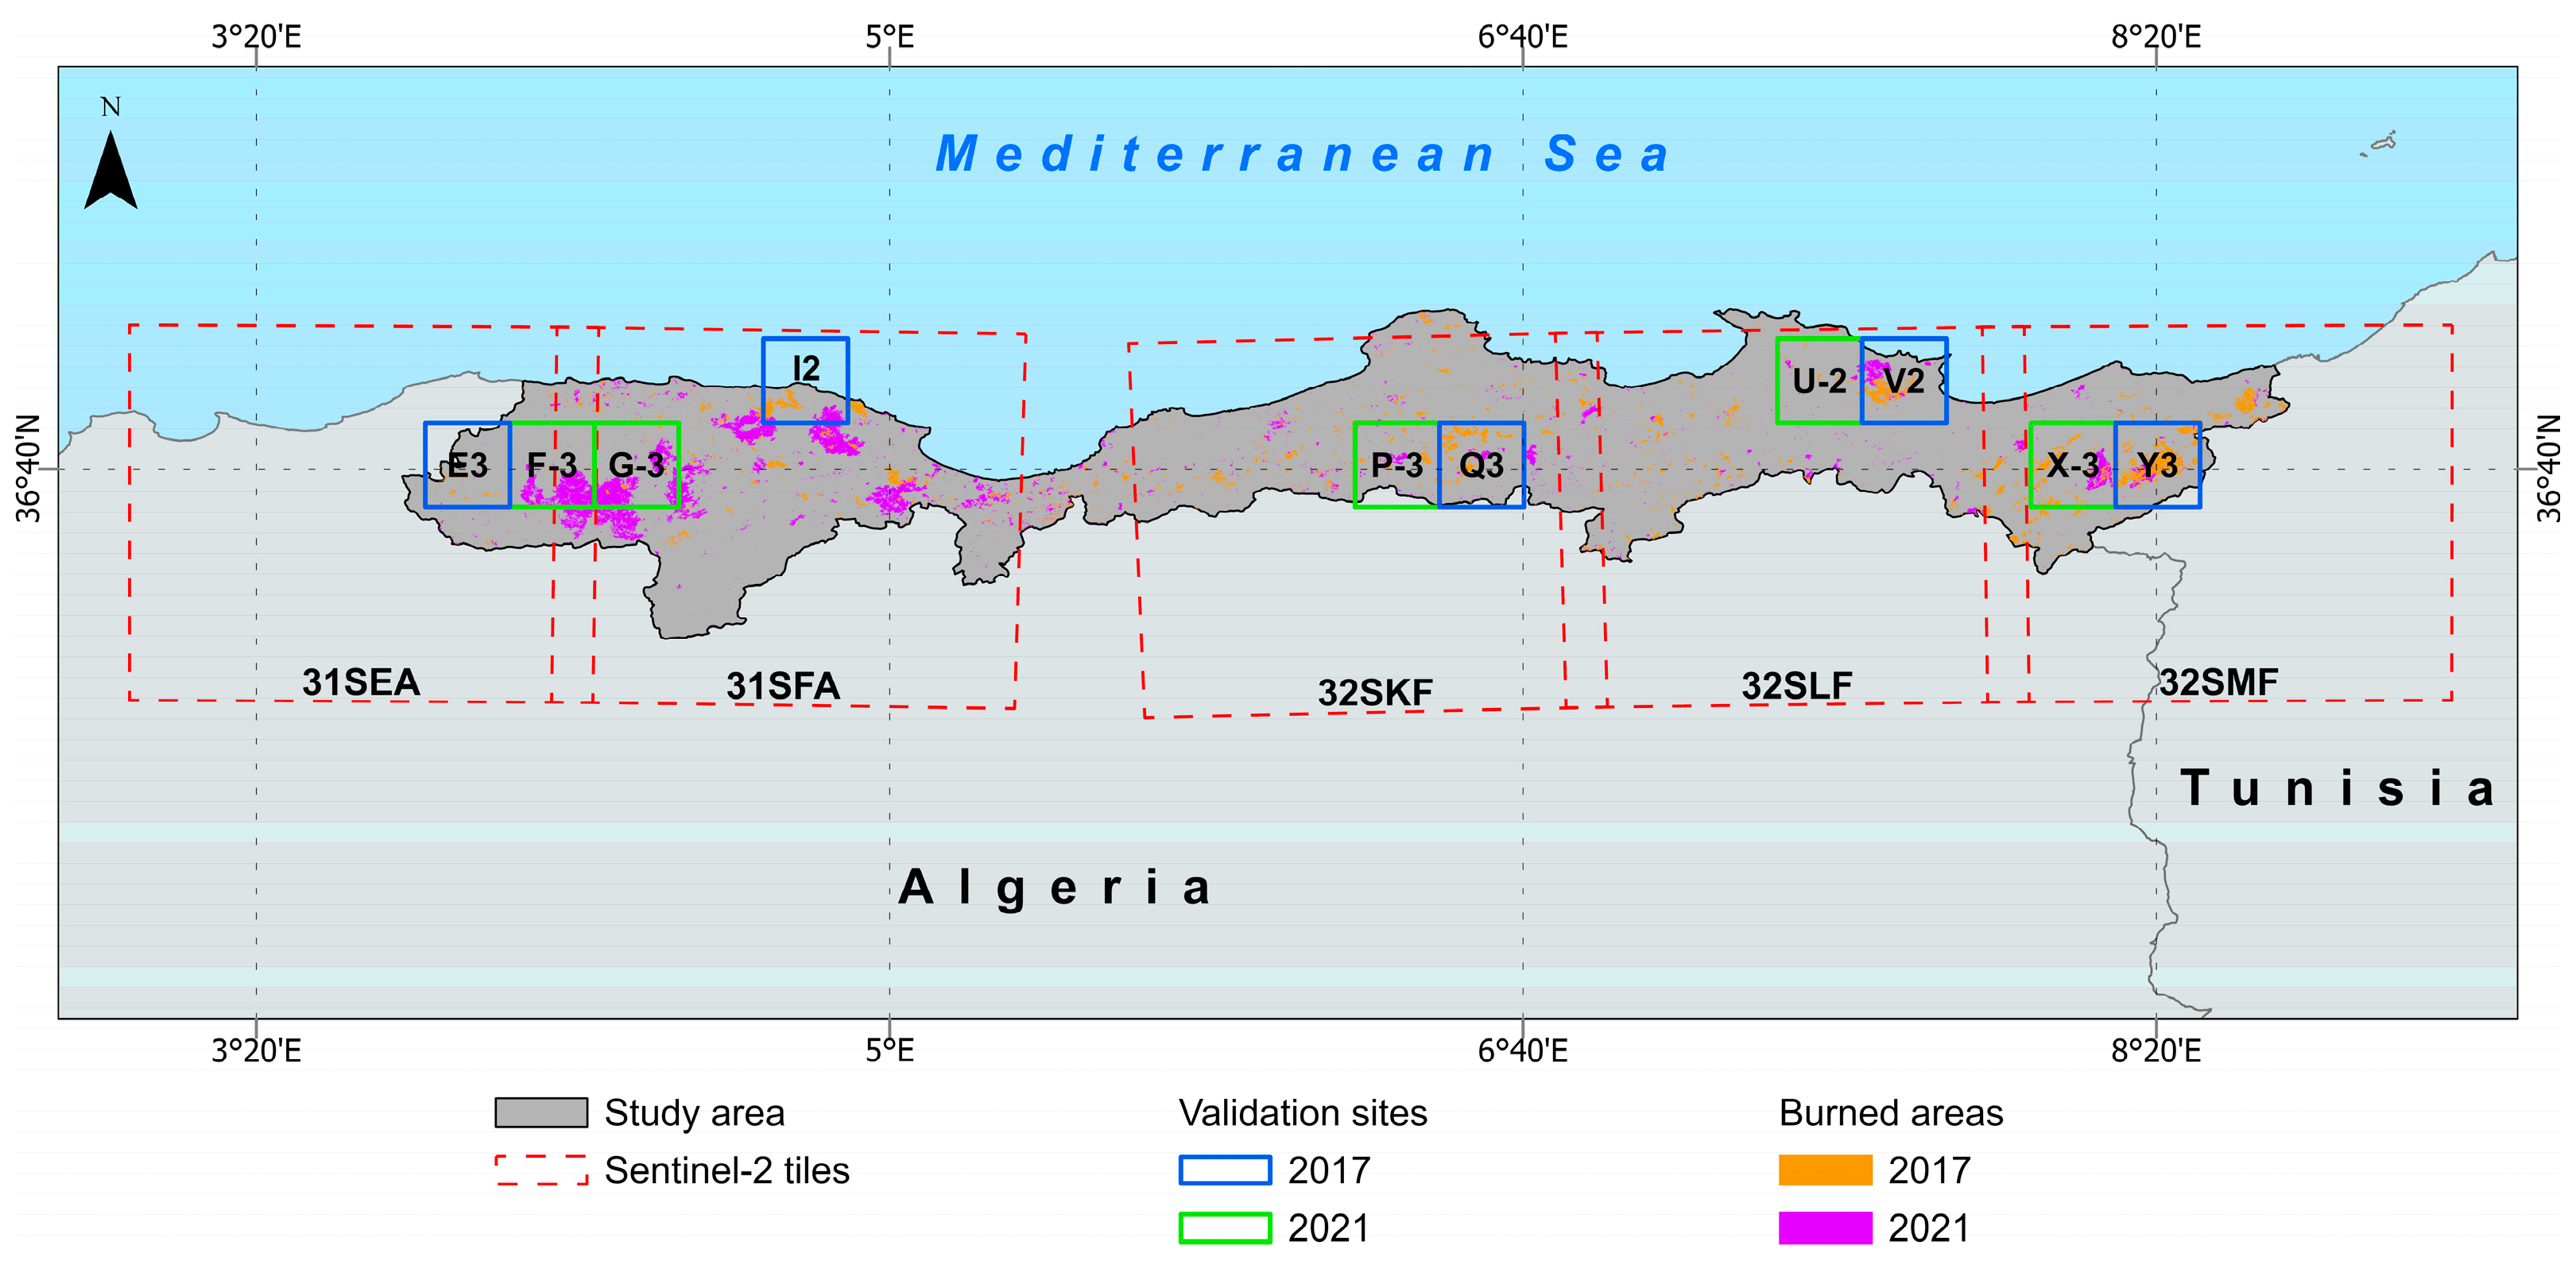
| 31SEA | E-3 | 2017 | 170 | 19/06/2017 | 06/12/2017 | 20 |
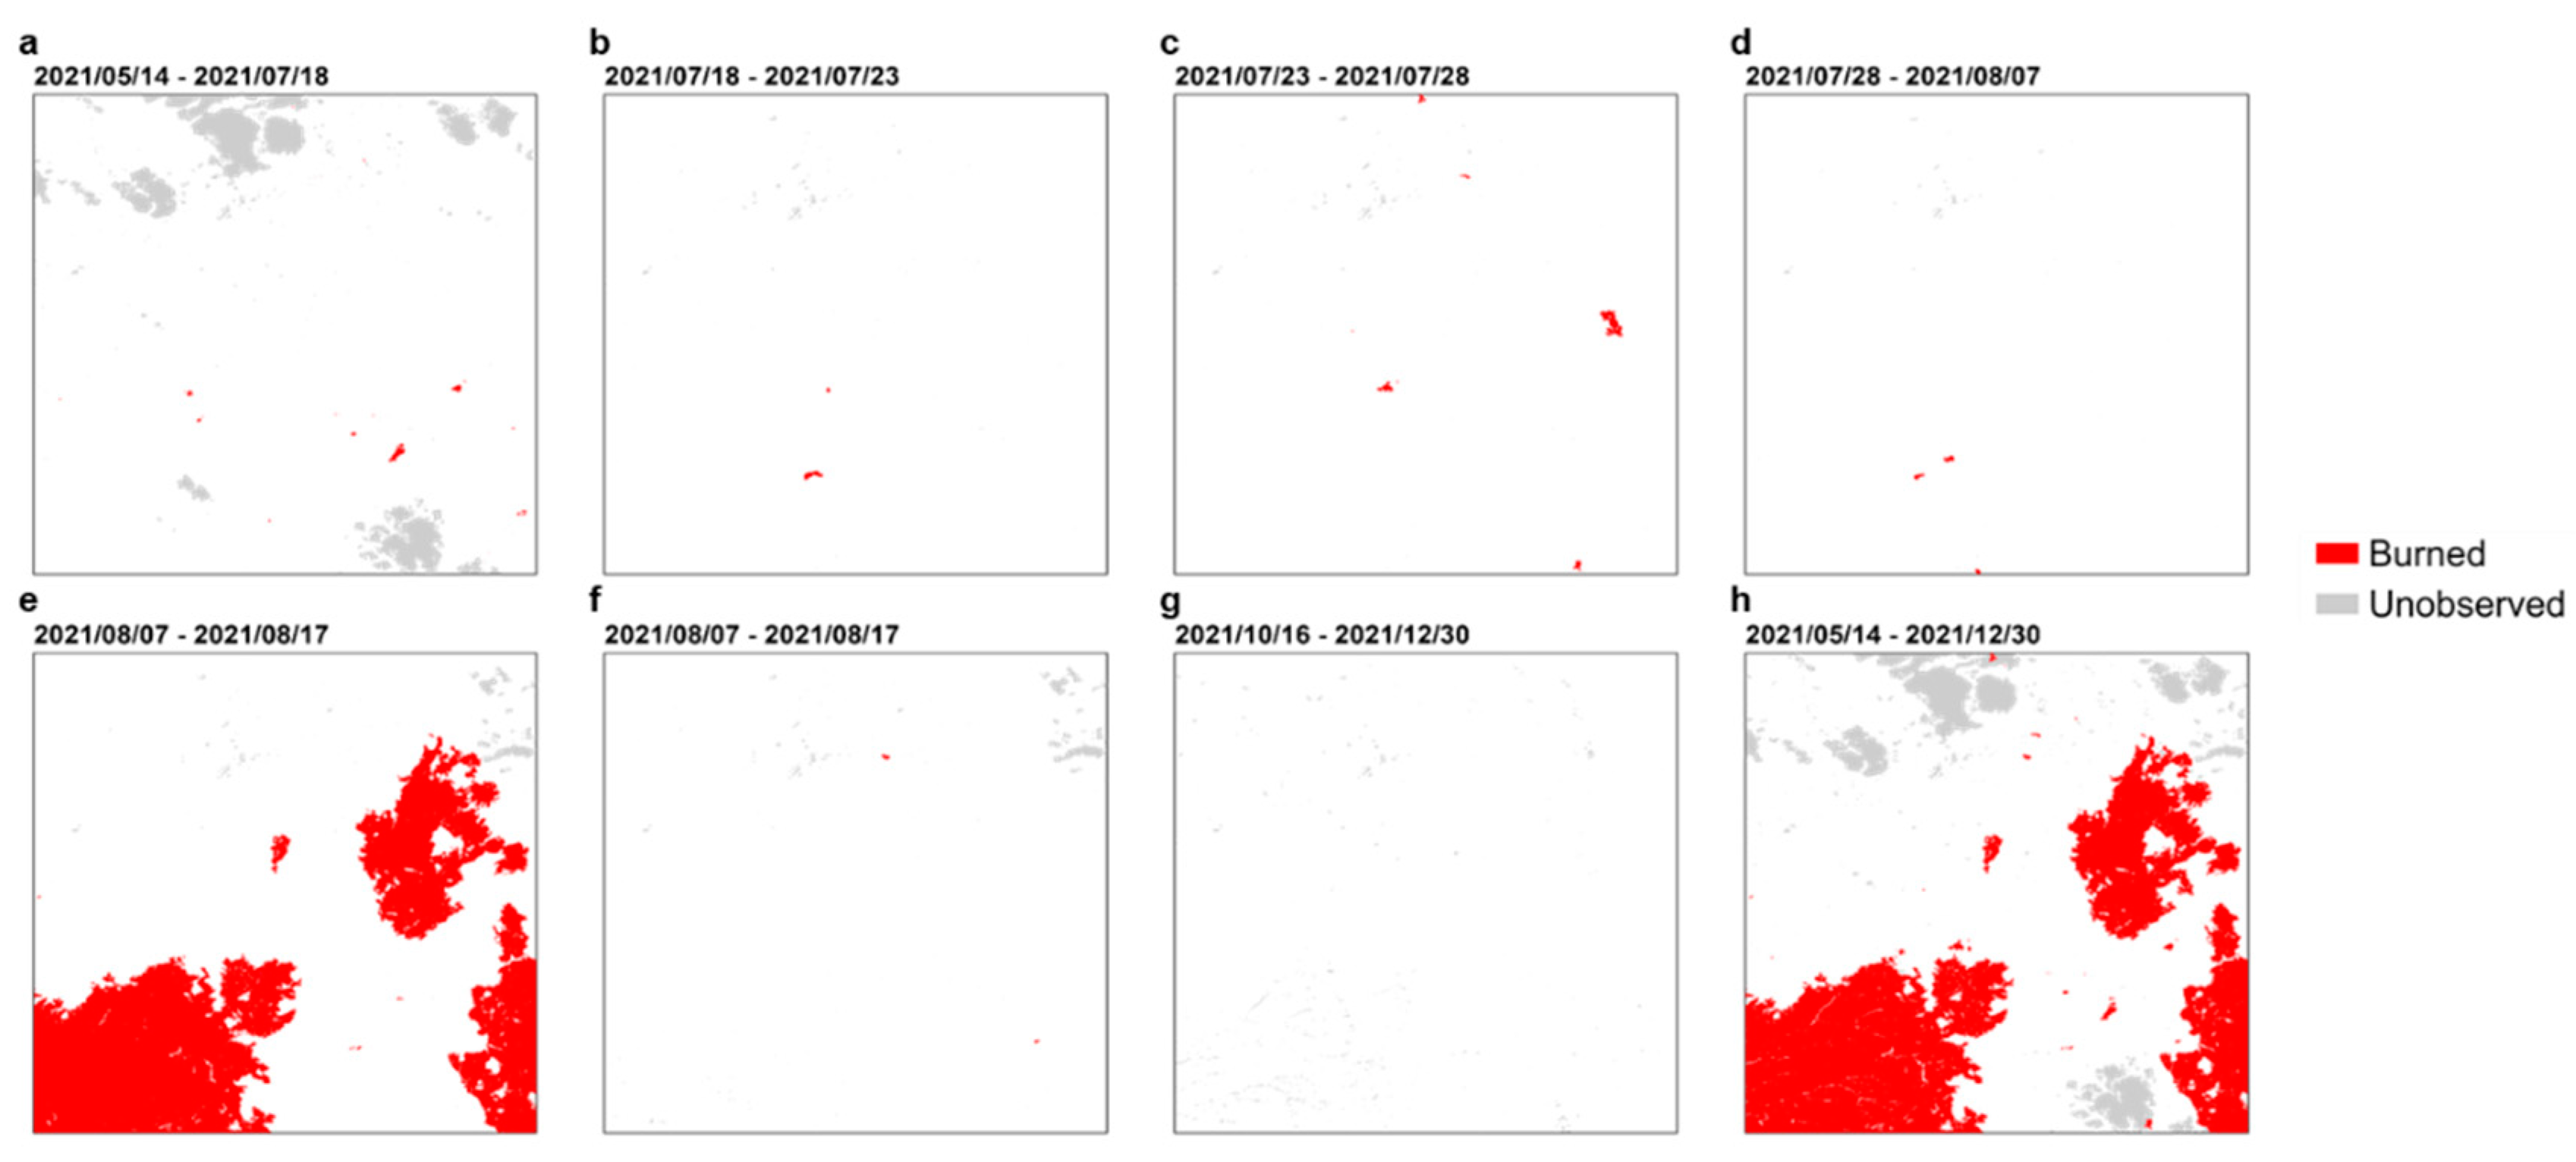
| F-3 | 2021 | 120 | 23/06/2021 | 21/10/2021 | 20 | |
| 31SFA | I-2 | 2017 | 170 | 19/06/2017 | 06/12/2017 | 18 |
| G-3 | 2021 | 225 | 11/05/2021 | 22/12/2021 | 29 | |
| 32SKF | Q-3 | 2017 | 205 | 17/05/2017 | 08/12/2017 | 21 |
| P-3 | 2021 | 225 | 11/05/2021 | 22/12/2021 | 26 | |
| 32SLF | V-2 | 2017 | 205 | 17/05/2017 | 08/12/2017 | 21 |
| U-2 | 2021 | 110 | 18/07/2021 | 05/11/2021 | 22 | |
| 32SMF | Y-3 | 2017 | 185 | 04/05/2017 | 05/11/2017 | 21 |
| X-3 | 2021 | 230 | 08/05/2021 | 24/12/2021 | 29 | |
| Total Sentinel-2 images | 227 | |||||
Appendix B
|
Sentinel-2 tile |
Validation site |
Accuracy metrics | ||||||||
| CE | OE | OA | DC | RelB | SurfBA | SurfUB | SurfCE | SurfOE | ||
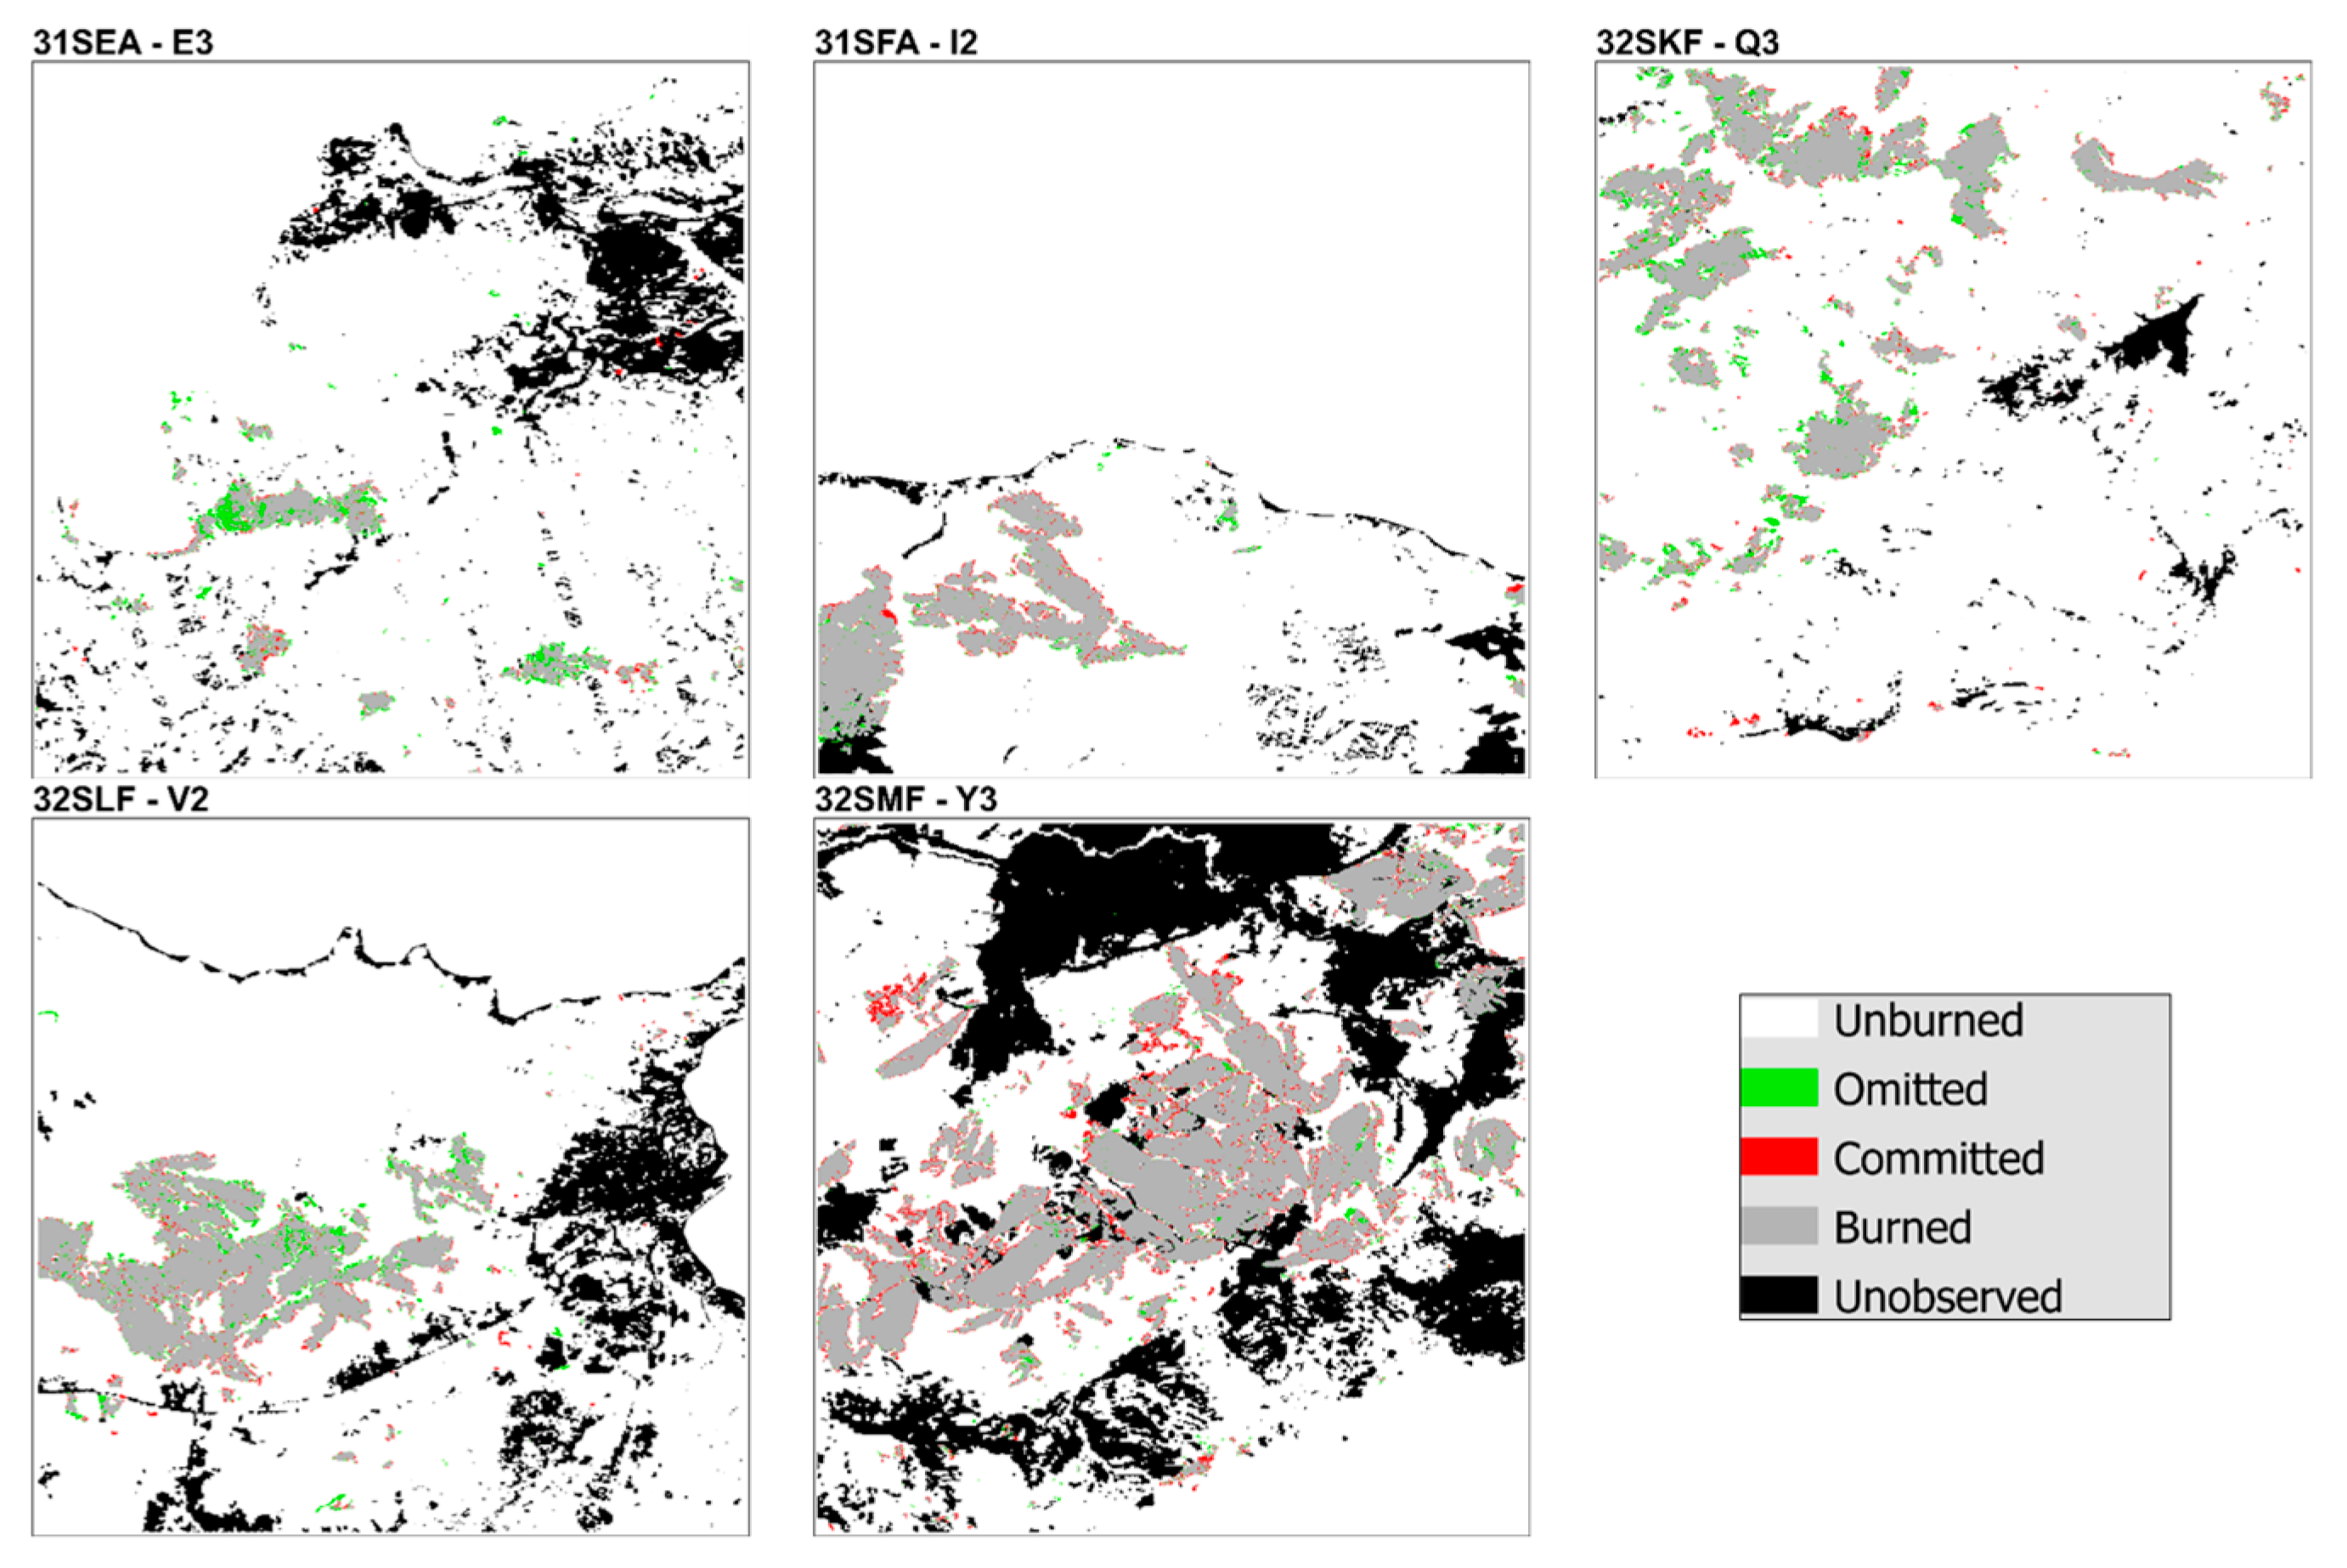
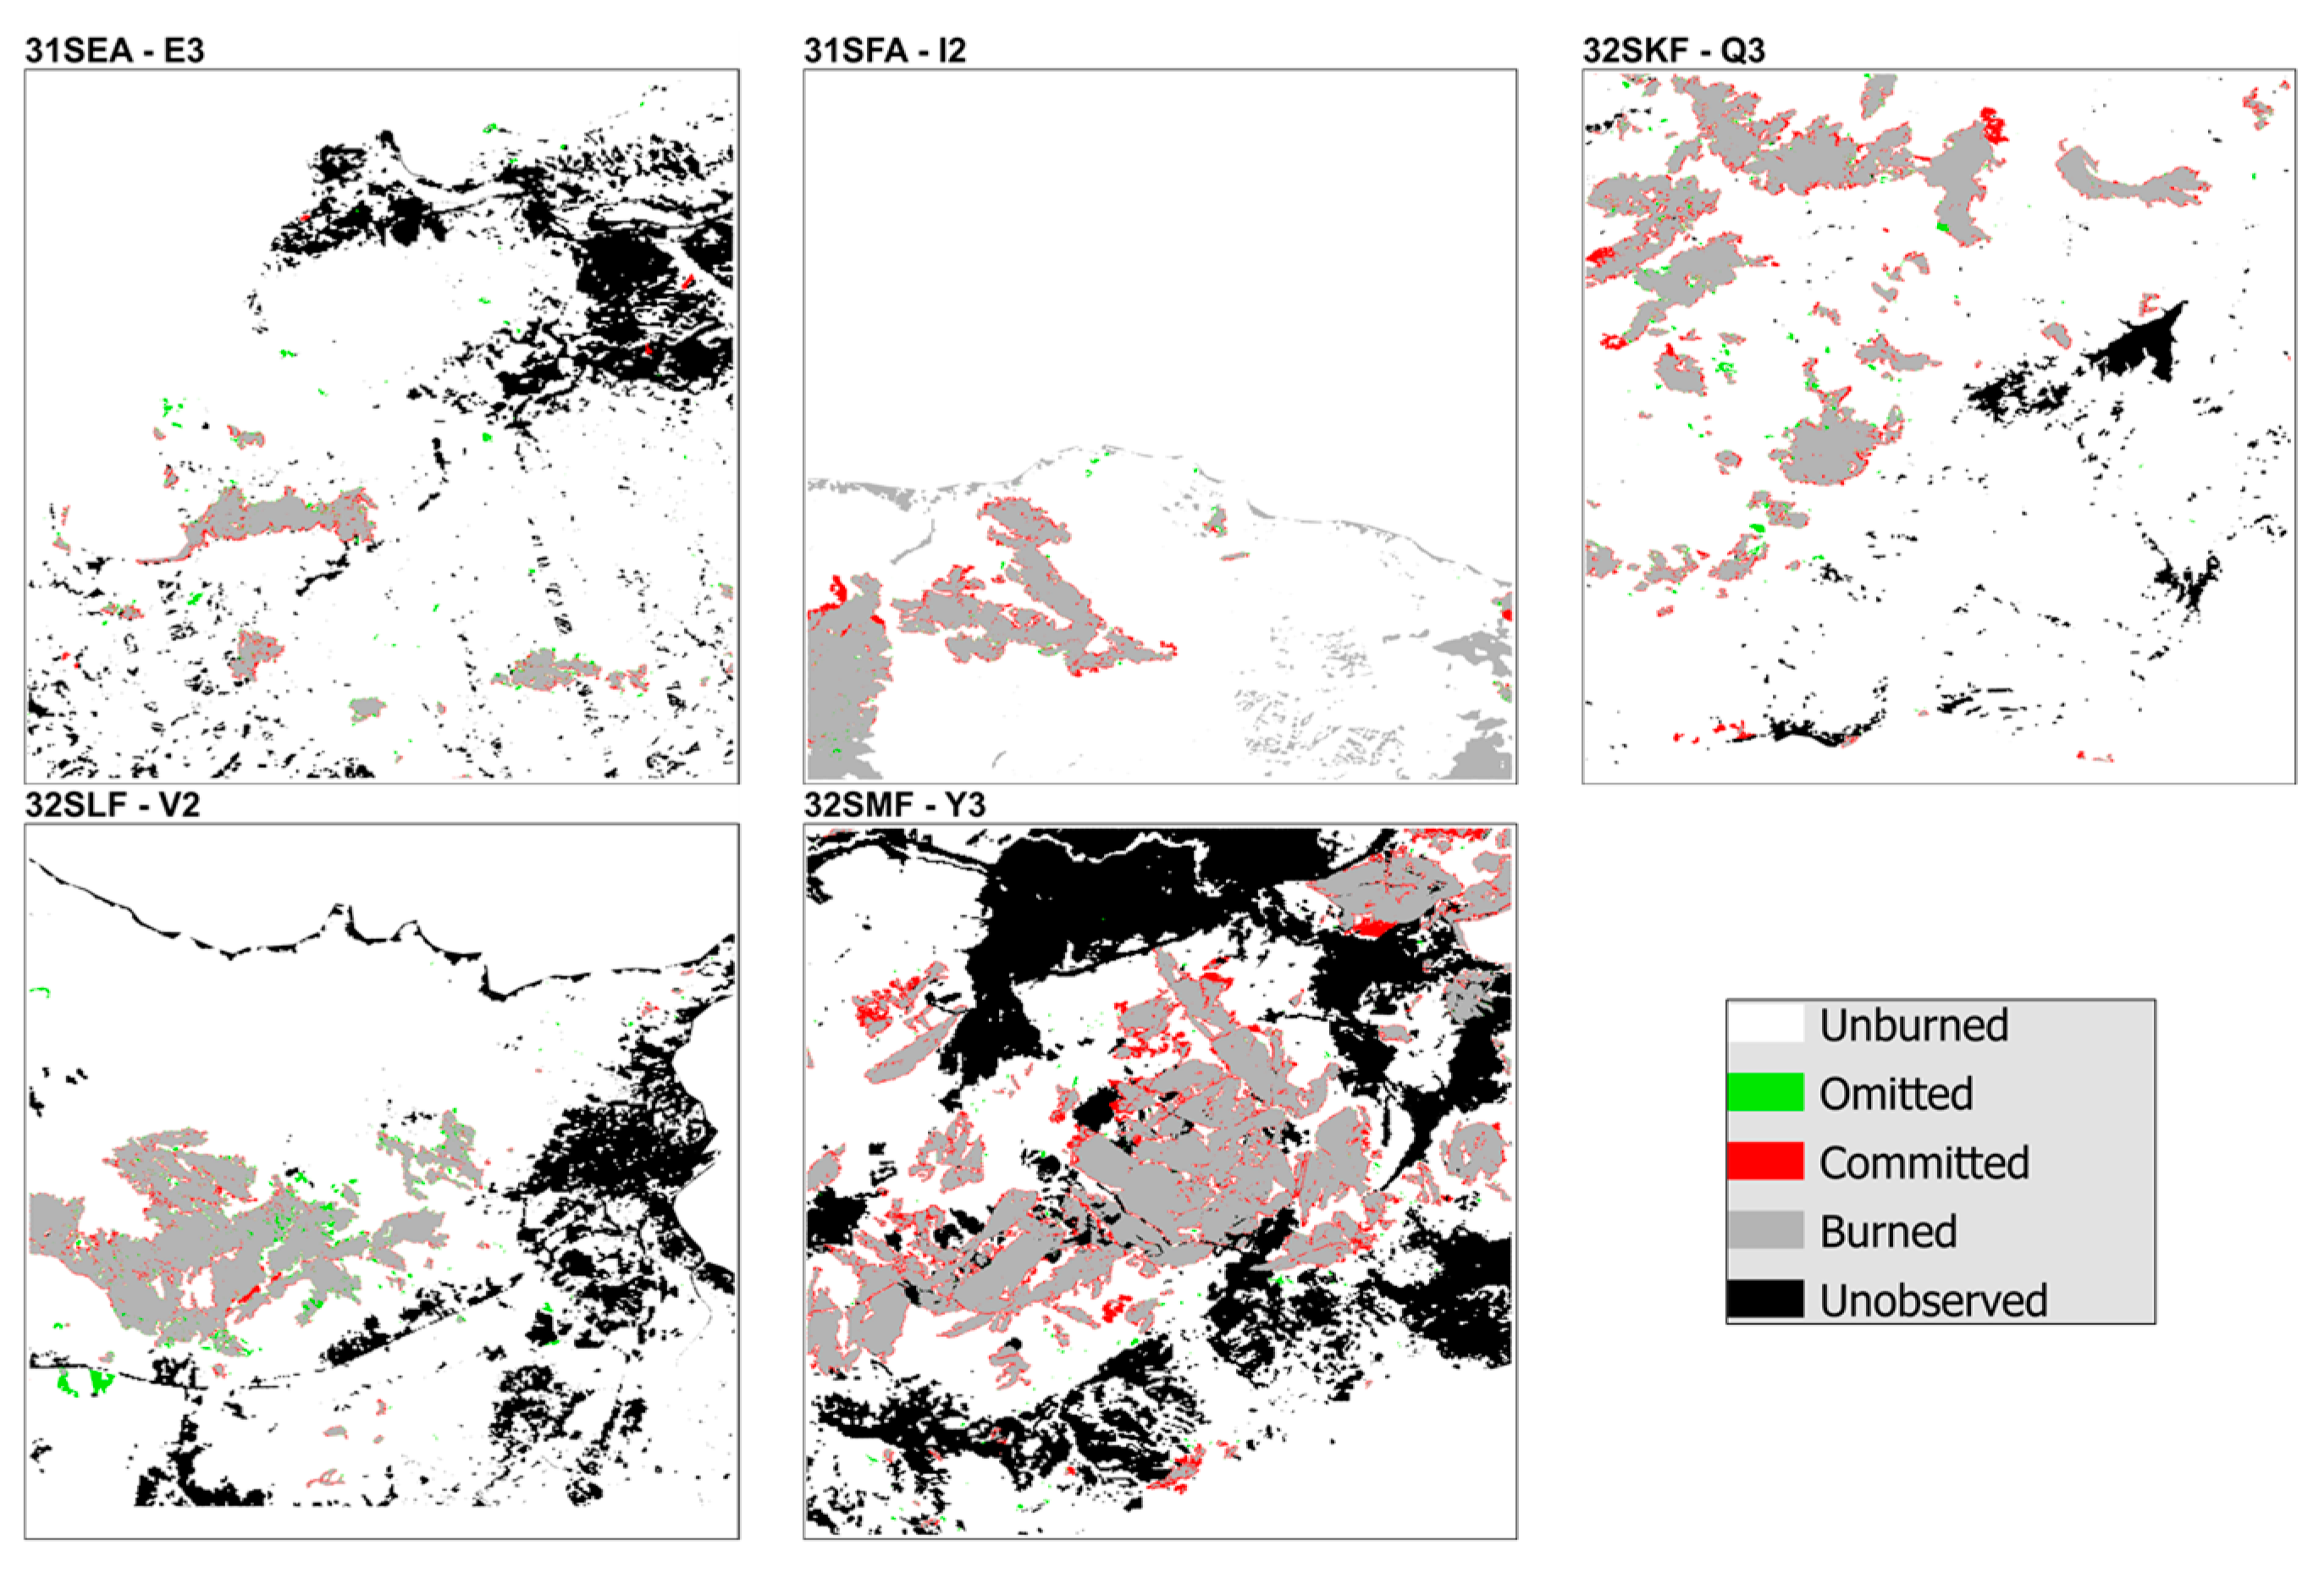
| 31SEA | E-3 | 15.24 | 11.26 | 99.26 | 86.71 | 4.69 | 10.75 | 429.52 | 1.93 | 1.36 |
| 31SFA | I-2 | 10.88 | 1.99 | 98.49 | 93.35 | 9.97 | 24.15 | 200.76 | 2.95 | 0.49 |
| 32SKF | Q-3 | 14.60 | 4.50 | 97.94 | 90.16 | 11.83 | 45.29 | 423.70 | 7.75 | 2.14 |
| 32SLF | V-2 | 7.29 | 7.75 | 98.54 | 92.48 | -0.50 | 37.42 | 371.99 | 2.94 | 3.14 |
| 32SMF | Y-3 | 15.45 | 1.32 | 95.31 | 91.07 | 16.72 | 87.05 | 259.49 | 15.91 | 1.16 |
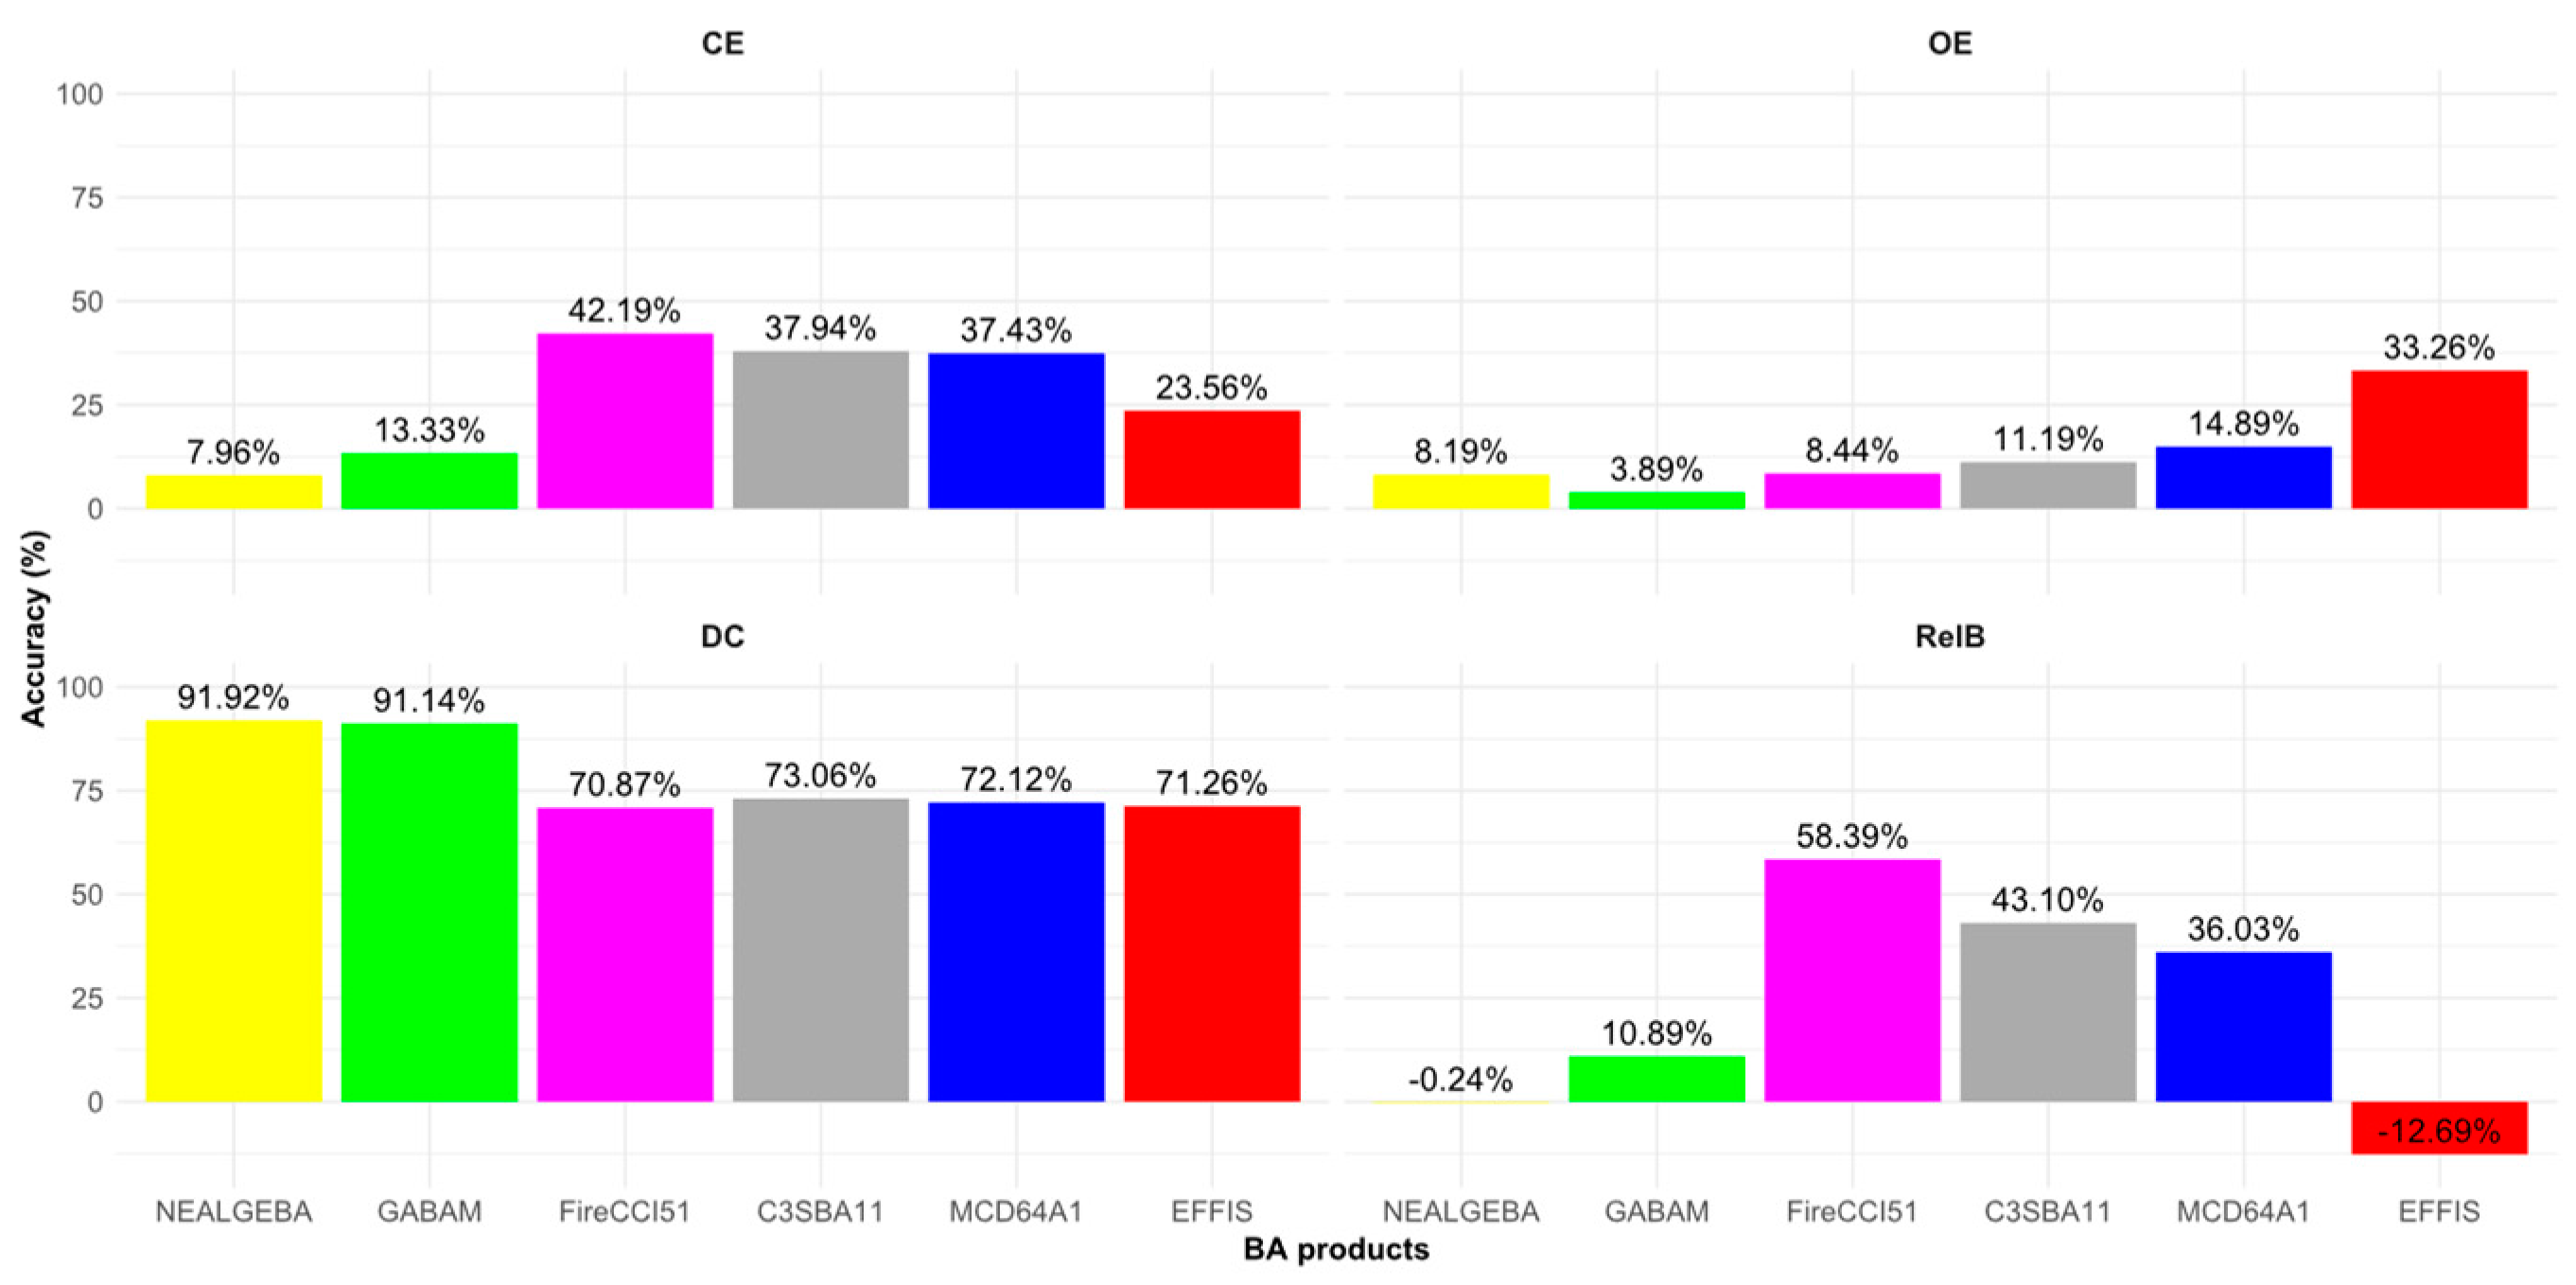
| Overall | 13.33 | 3.89 | 97.94 | 91.14 | 10.89 | 204.65 | 1 685.45 | 31.47 | 8.29 | |
| Sentinel-2 tile |
Validation site |
Accuracy metrics | ||||||||
|---|---|---|---|---|---|---|---|---|---|---|
| CE | OE | OA | DC | RelB | SurfBA | SurfUB | SurfCE | SurfOE | ||
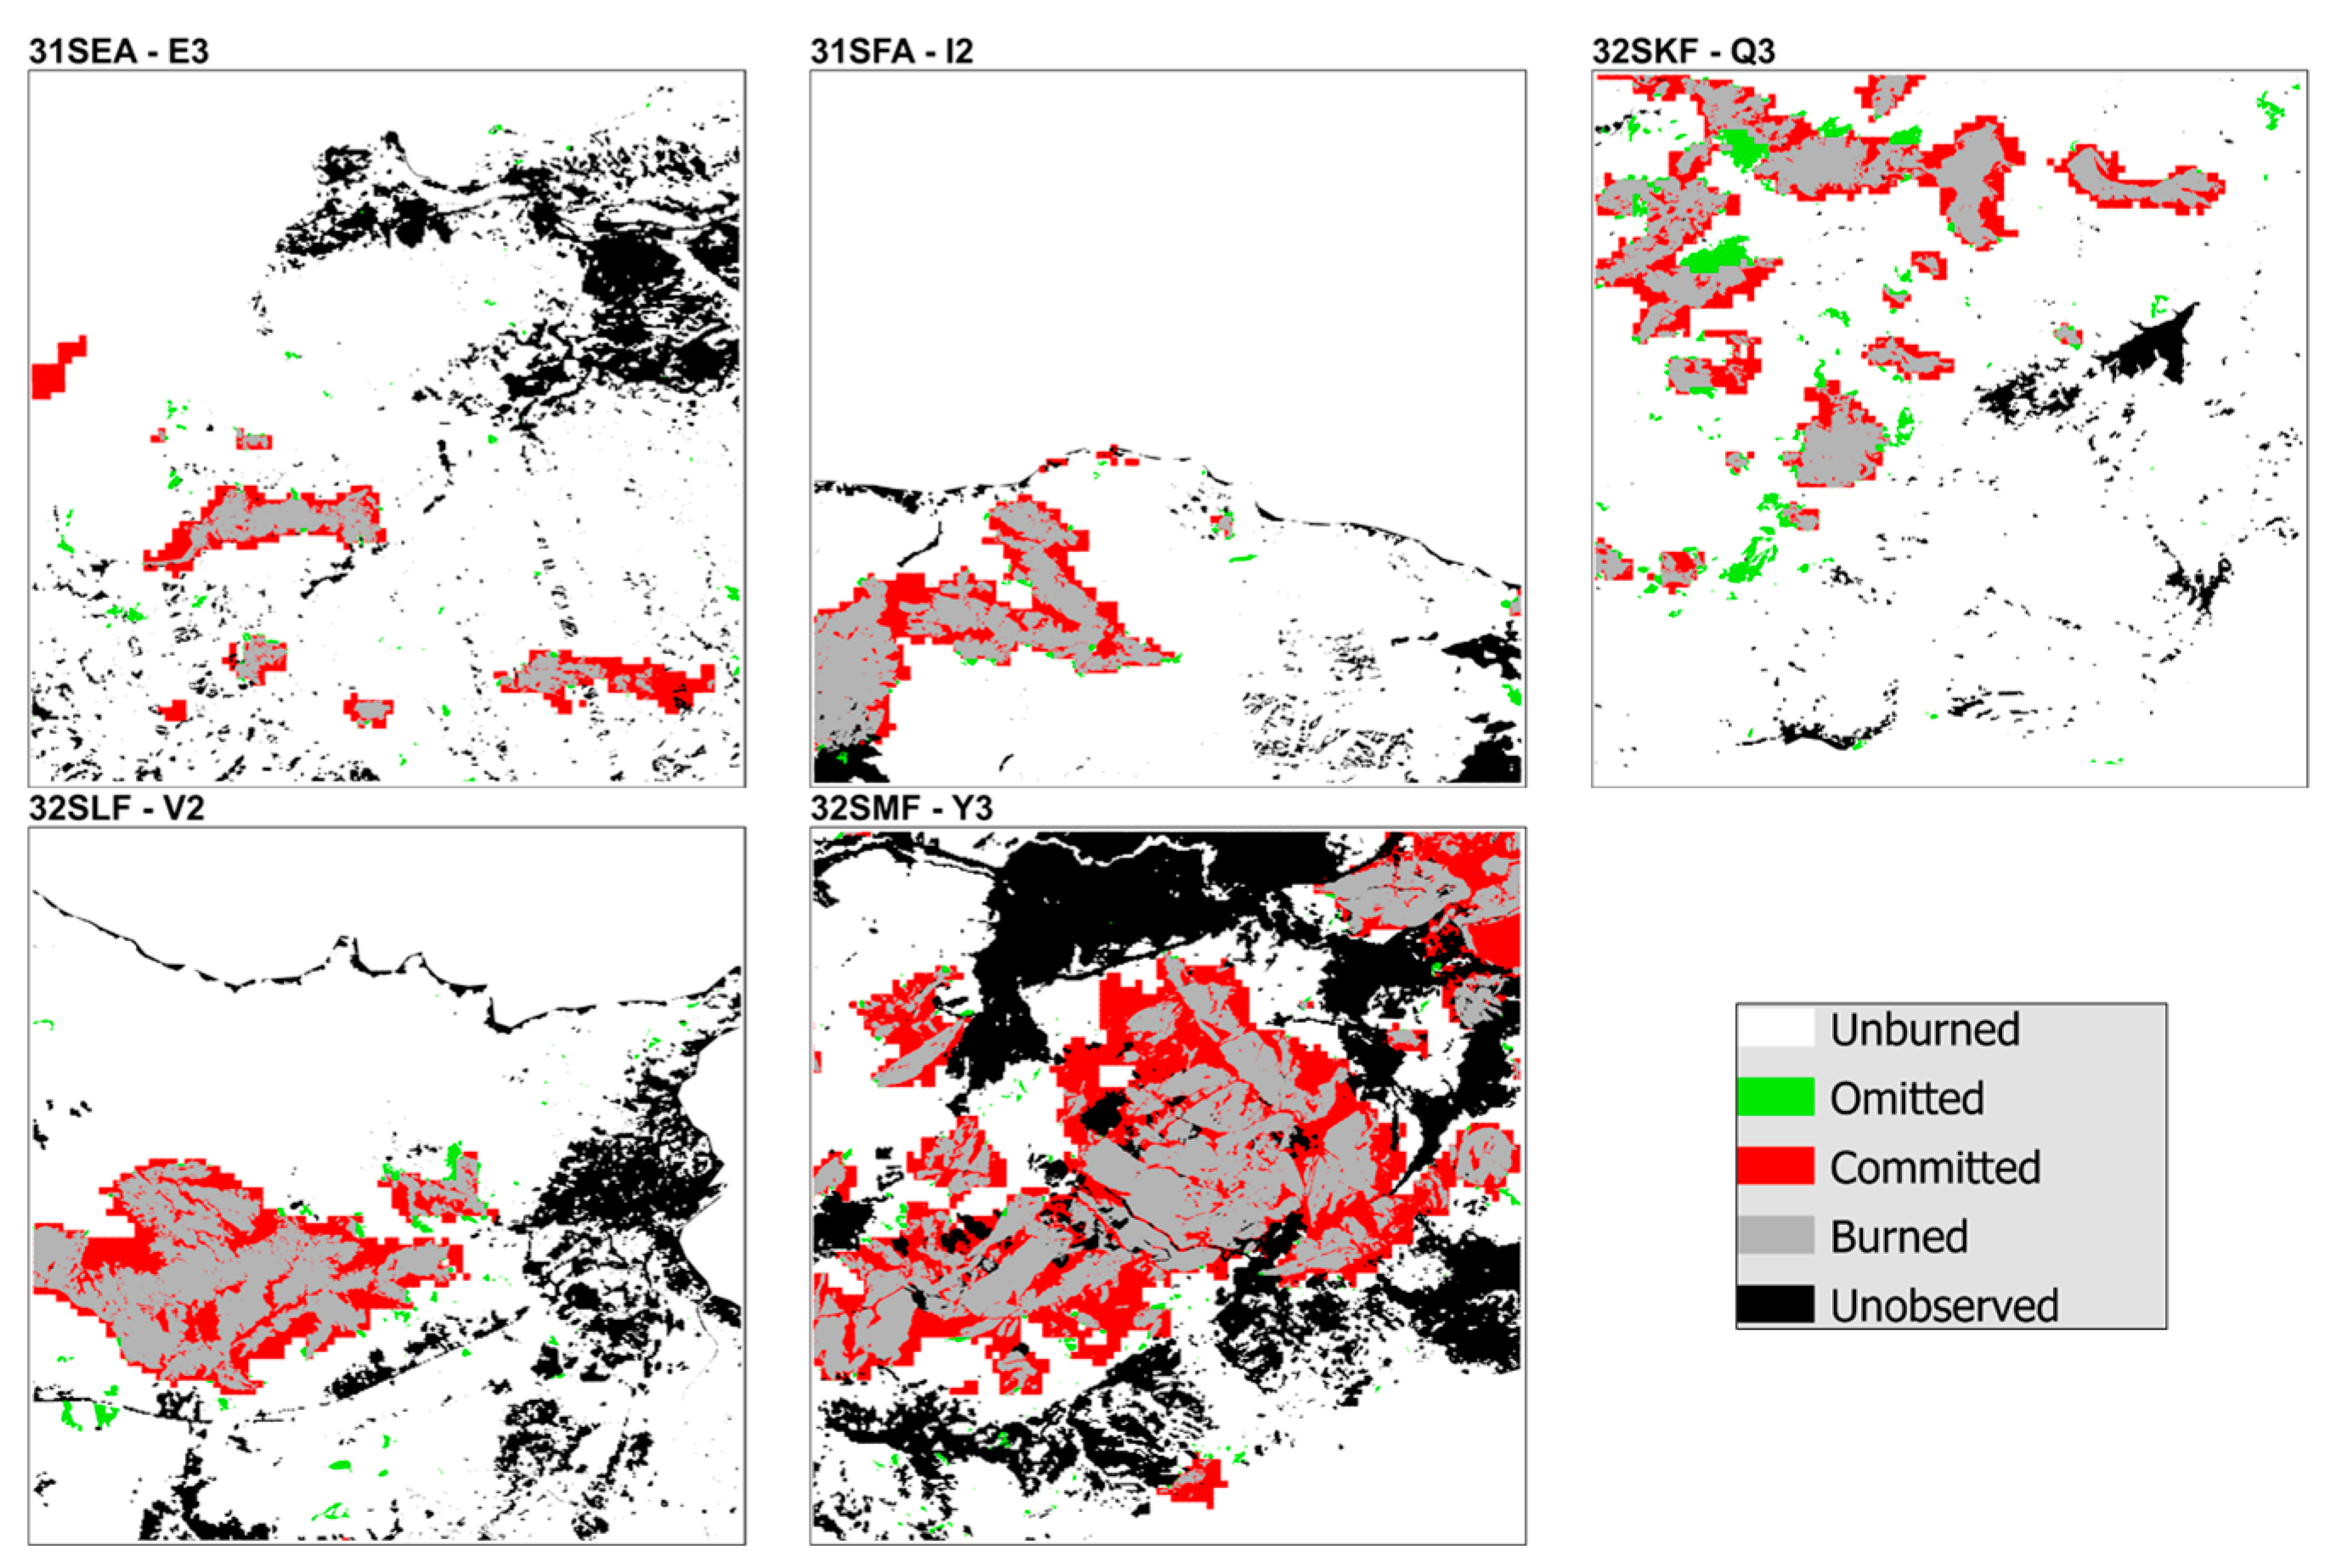
| 31SEA | E-3 | 55.69 | 15.09 | 96.67 | 58.24 | 91.61 | 10.29 | 418.53 | 12.93 | 1.83 |
| 31SFA | I-2 | 33.22 | 4.87 | 94.37 | 78.47 | 42.46 | 23.44 | 192.04 | 11.66 | 1.20 |
| 32SKF | Q-3 | 40.82 | 20.10 | 92.55 | 68.00 | 35.02 | 37.90 | 405.31 | 26.14 | 9.53 |
| 32SLF | V-2 | 35.97 | 7.50 | 94.20 | 75.68 | 44.47 | 37.52 | 353.85 | 21.08 | 3.04 |
| 32SMF | Y-3 | 45.09 | 2.68 | 79.96 | 70.21 | 77.24 | 85.84 | 204.90 | 70.49 | 2.36 |
| Overall | 42.19 | 8.44 | 91.70 | 70.87 | 58.39 | 194.98 | 1 574.63 | 142.30 | 17.96 | |
| Sentinel-2 tile |
Validation site |
Accuracy metrics | ||||||||
|---|---|---|---|---|---|---|---|---|---|---|
| CE | OE | OA | DC | RelB | SurfBA | SurfUB | SurfCE | SurfOE | ||
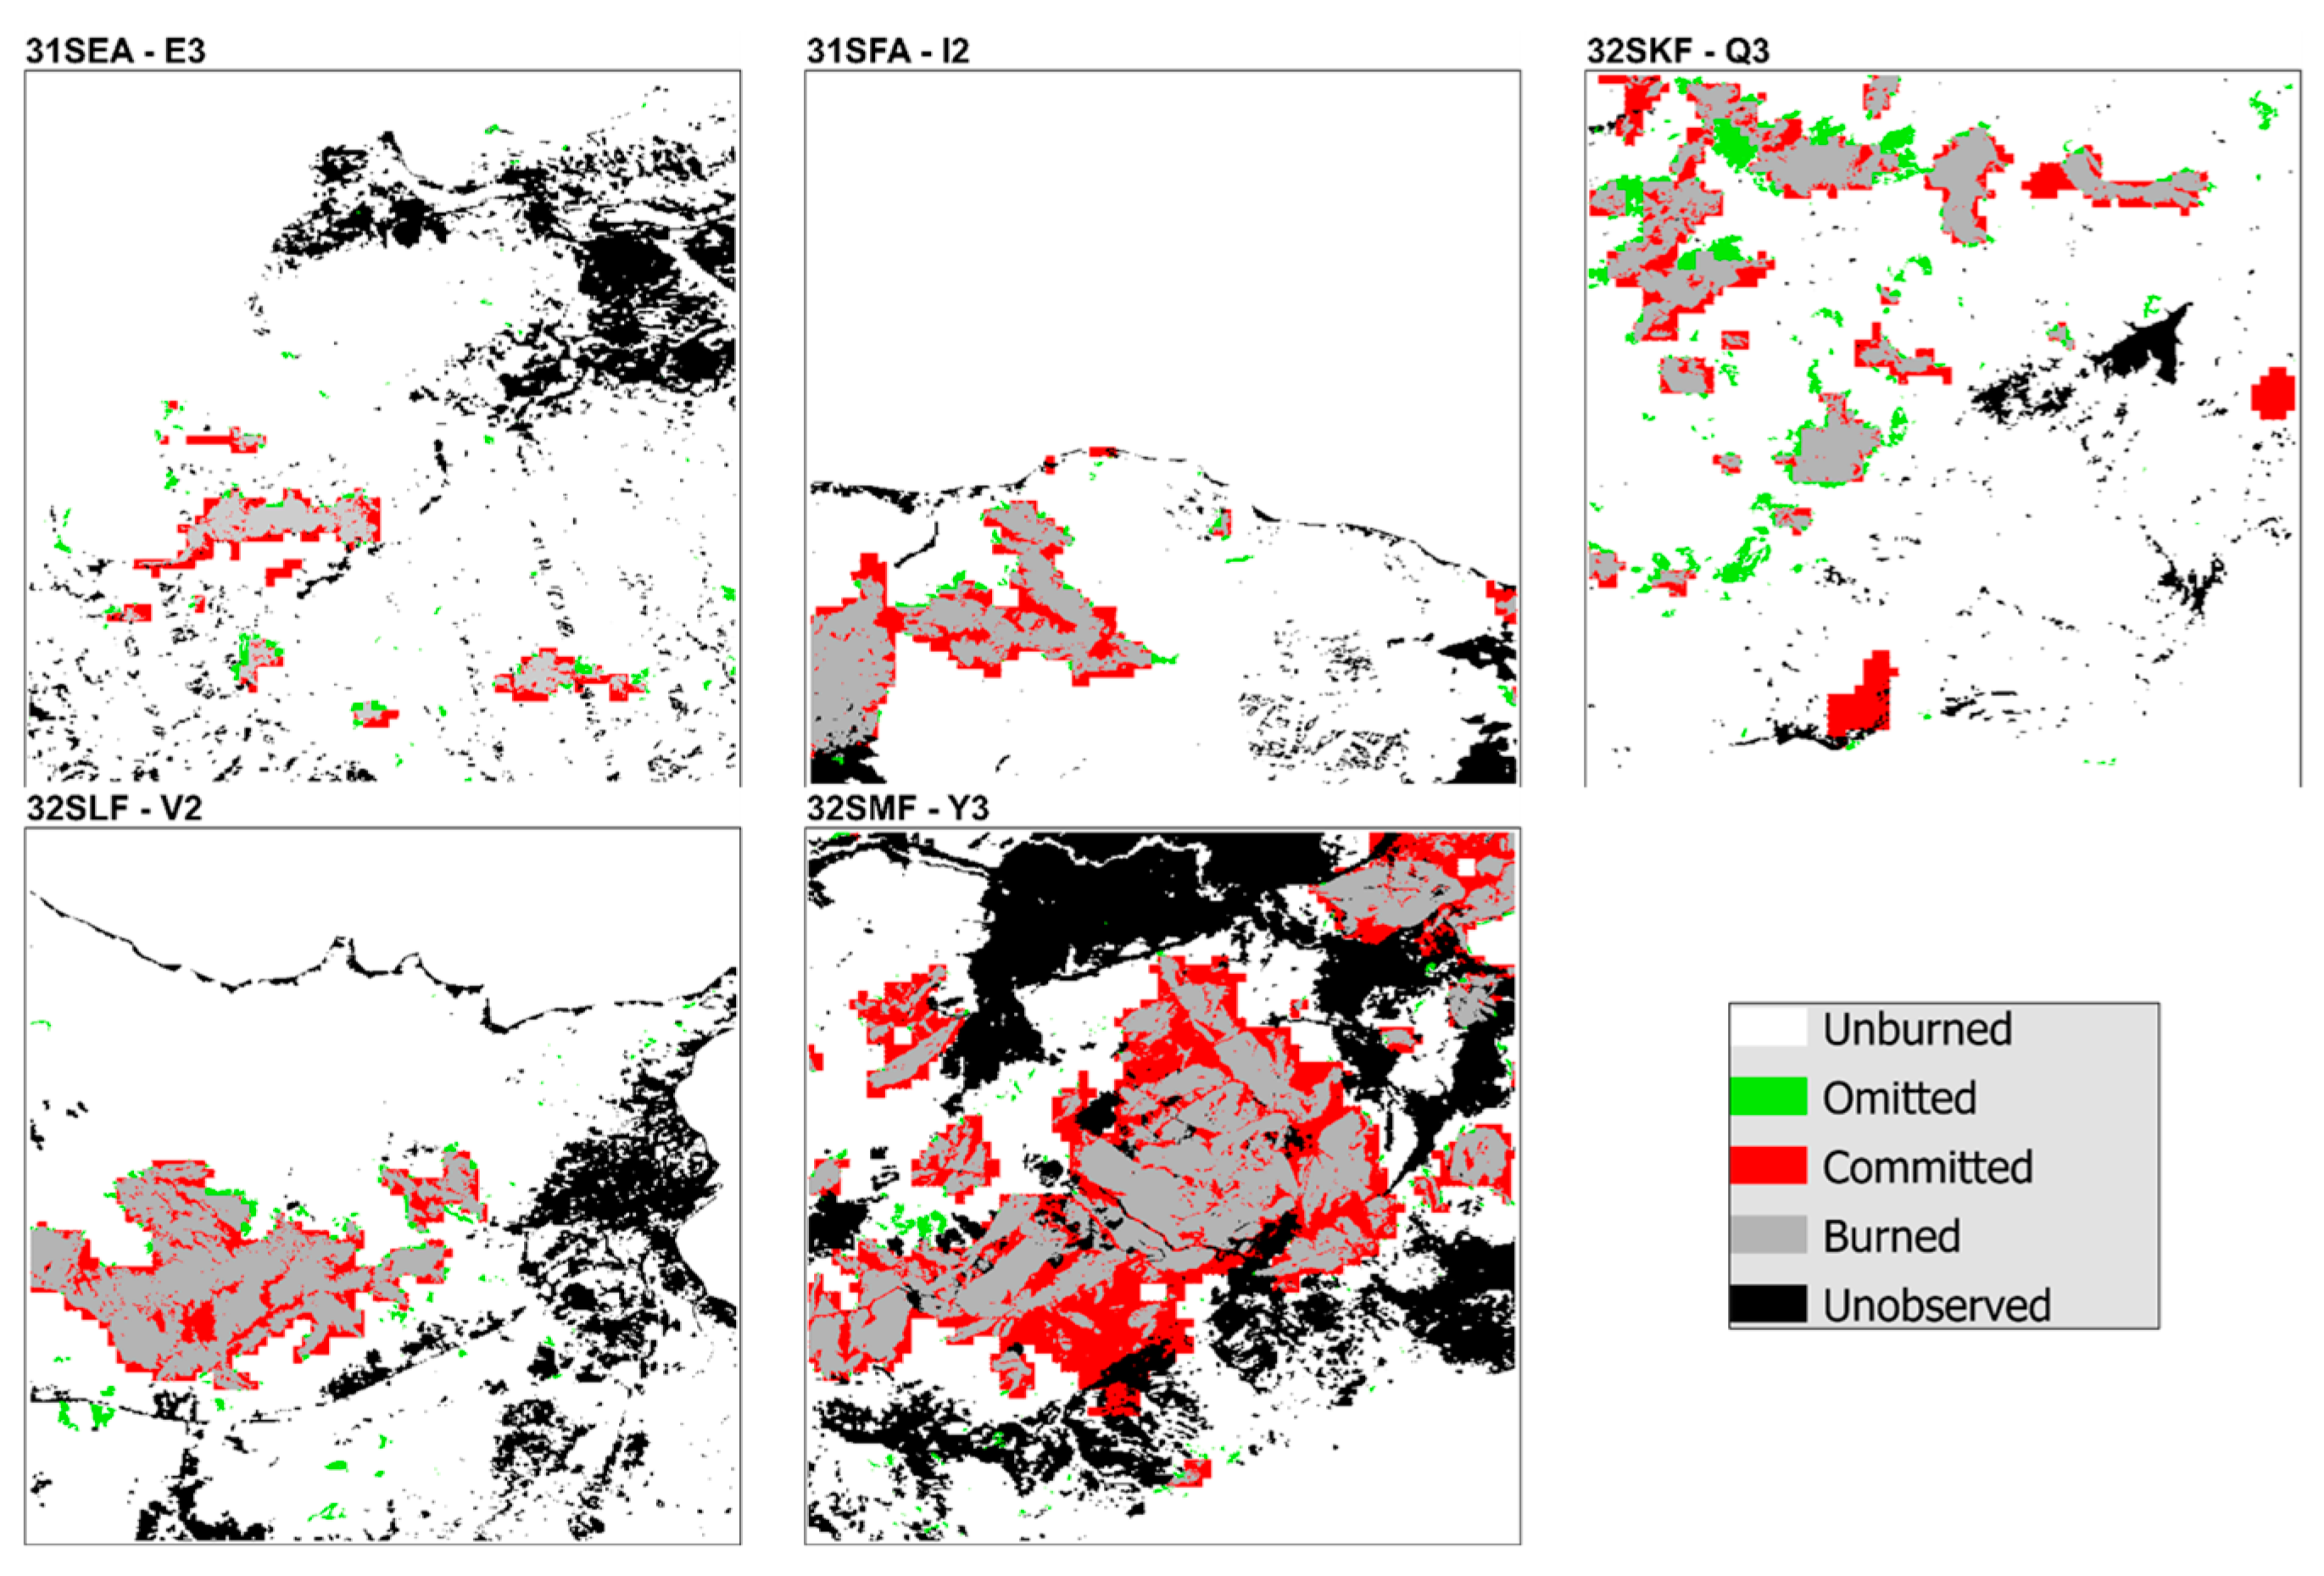
| 31SEA | E-3 | 44.82 | 22.43 | 97.67 | 64.48 | 40.59 | 9.40 | 423.82 | 7.63 | 2.72 |
| 31SFA | I-2 | 30.97 | 6.42 | 94.78 | 79.45 | 35.55 | 23.06 | 193.36 | 10.34 | 1.58 |
| 32SKF | Q-3 | 39.27 | 27.29 | 92.64 | 66.18 | 19.74 | 34.48 | 409.14 | 22.30 | 12.94 |
| 32SLF | V-2 | 26.31 | 8.97 | 95.95 | 81.44 | 23.53 | 36.92 | 361.75 | 13.18 | 3.64 |
| 32SMF | Y-3 | 42.16 | 3.35 | 82.10 | 72.37 | 67.11 | 85.25 | 213.25 | 62.15 | 2.95 |
| Overall | 37.94 | 11.19 | 92.77 | 73.06 | 43.10 | 189.11 | 1 601.32 | 115.61 | 23.83 | |
| Sentinel-2 tile |
Validation site |
Accuracy metrics | ||||||||
|---|---|---|---|---|---|---|---|---|---|---|
| CE | OE | OA | DC | RelB | SurfBA | SurfUB | SurfCE | SurfOE | ||
| 31SEA | E-3 | 44.14 | 34.32 | 97.65 | 60.37 | 17.59 | 7.96 | 425.17 | 6.29 | 4.16 |
| 31SFA | I-2 | 35.10 | 9.65 | 93.69 | 75.54 | 39.21 | 22.26 | 191.66 | 12.04 | 2.38 |
| 32SKF | Q-3 | 35.90 | 23.46 | 93.43 | 69.77 | 19.42 | 36.30 | 411.11 | 20.33 | 11.12 |
| 32SLF | V-2 | 33.42 | 11.79 | 94.53 | 75.88 | 32.50 | 35.78 | 356.97 | 17.96 | 4.78 |
| 32SMF | Y-3 | 39.62 | 10.50 | 83.21 | 72.11 | 48.23 | 78.94 | 223.59 | 51.80 | 9.26 |
| Overall | 37.43 | 14.89 | 92.74 | 72.12 | 36.03 | 181.24 | 1 608.50 | 108.42 | 31.70 | |
| Sentinel-2 tile |
Validation site |
Accuracy metrics | ||||||||
|---|---|---|---|---|---|---|---|---|---|---|
| CE | OE | OA | DC | RelB | SurfBA | SurfUB | SurfCE | SurfOE | ||
| 31SEA | E-3 | 0.00 | 100.00 | 97.27 | 0.00 | -100.00 | 0.00 | 431.46 | 0.00 | 12.11 |
| 31SFA | I-2 | 18.12 | 15.98 | 96.27 | 82.93 | 2.61 | 20.70 | 199.12 | 4.58 | 3.94 |
| 32SKF | Q-3 | 24.45 | 63.64 | 92.53 | 49.09 | -51.88 | 17.24 | 425.86 | 5.58 | 30.18 |
| 32SLF | V-2 | 21.77 | 21.94 | 95.74 | 78.14 | -0.21 | 31.66 | 366.12 | 8.81 | 8.90 |
| 32SMF | Y-3 | 25.51 | 17.79 | 88.86 | 78.16 | 10.36 | 72.52 | 250.56 | 24.83 | 15.69 |
| Overall | 23.56 | 33.26 | 94.06 | 71.26 | -12.69 | 142.12 | 1 673.12 | 43.80 | 70.82 | |
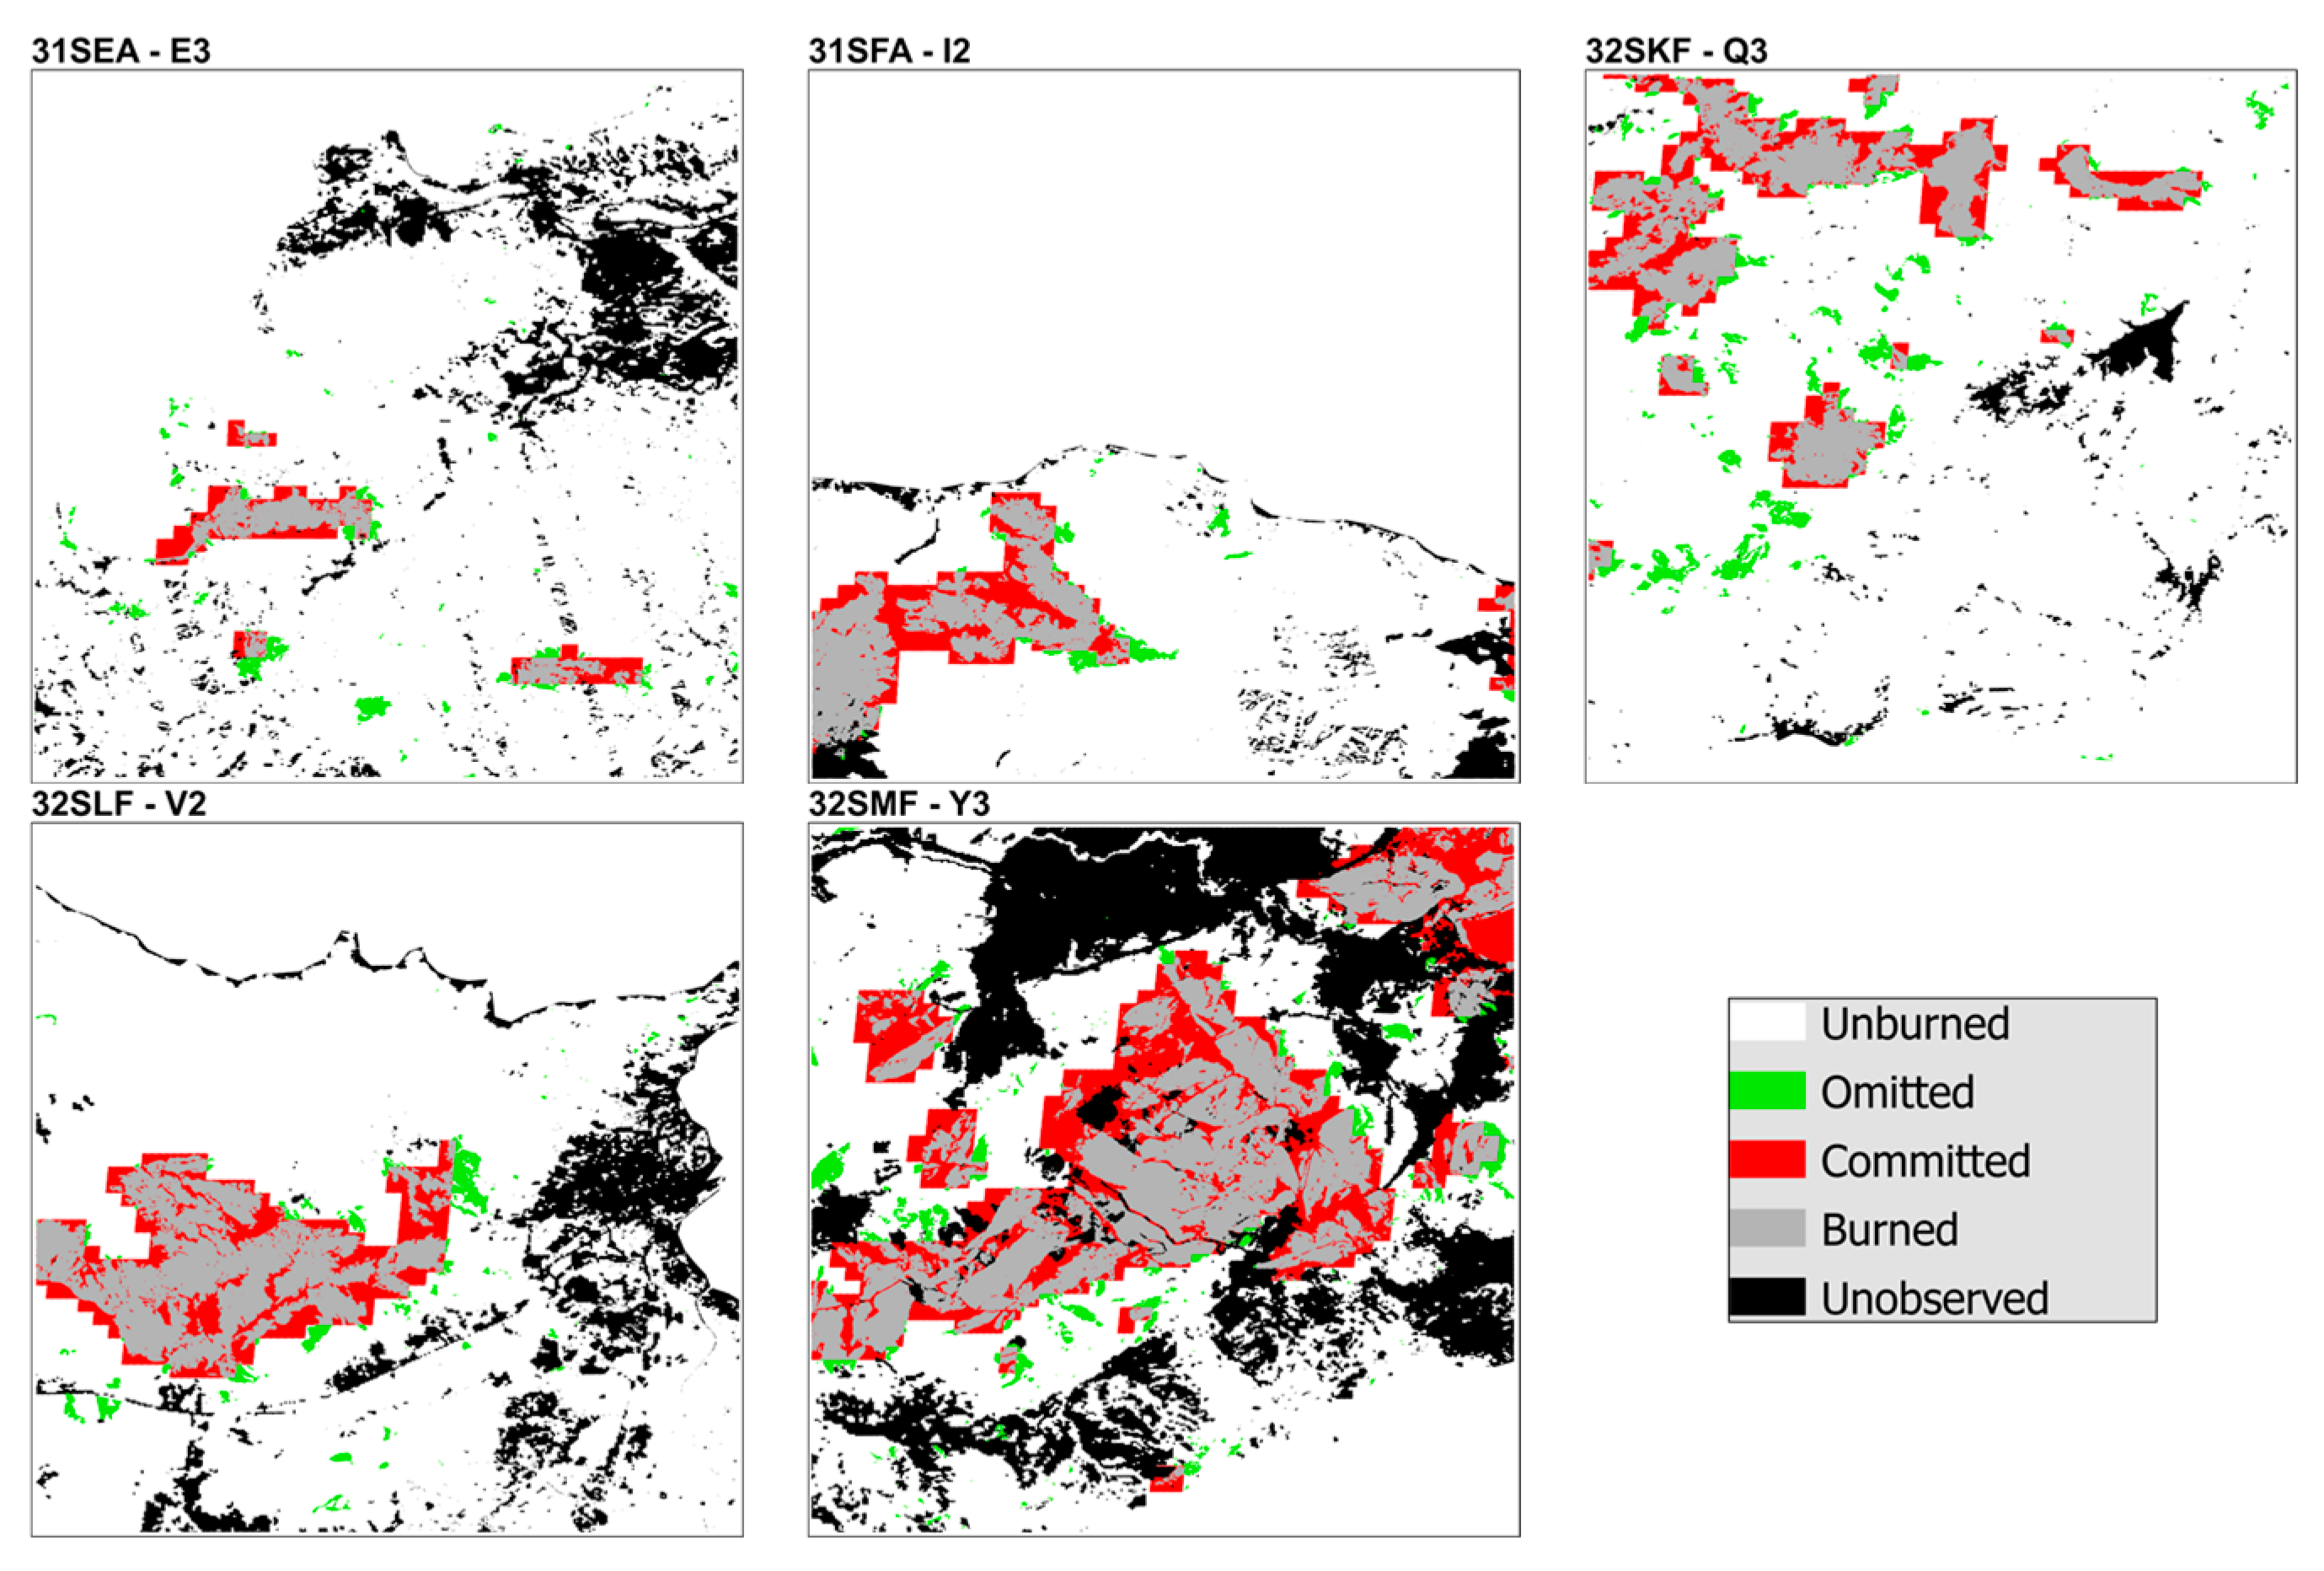
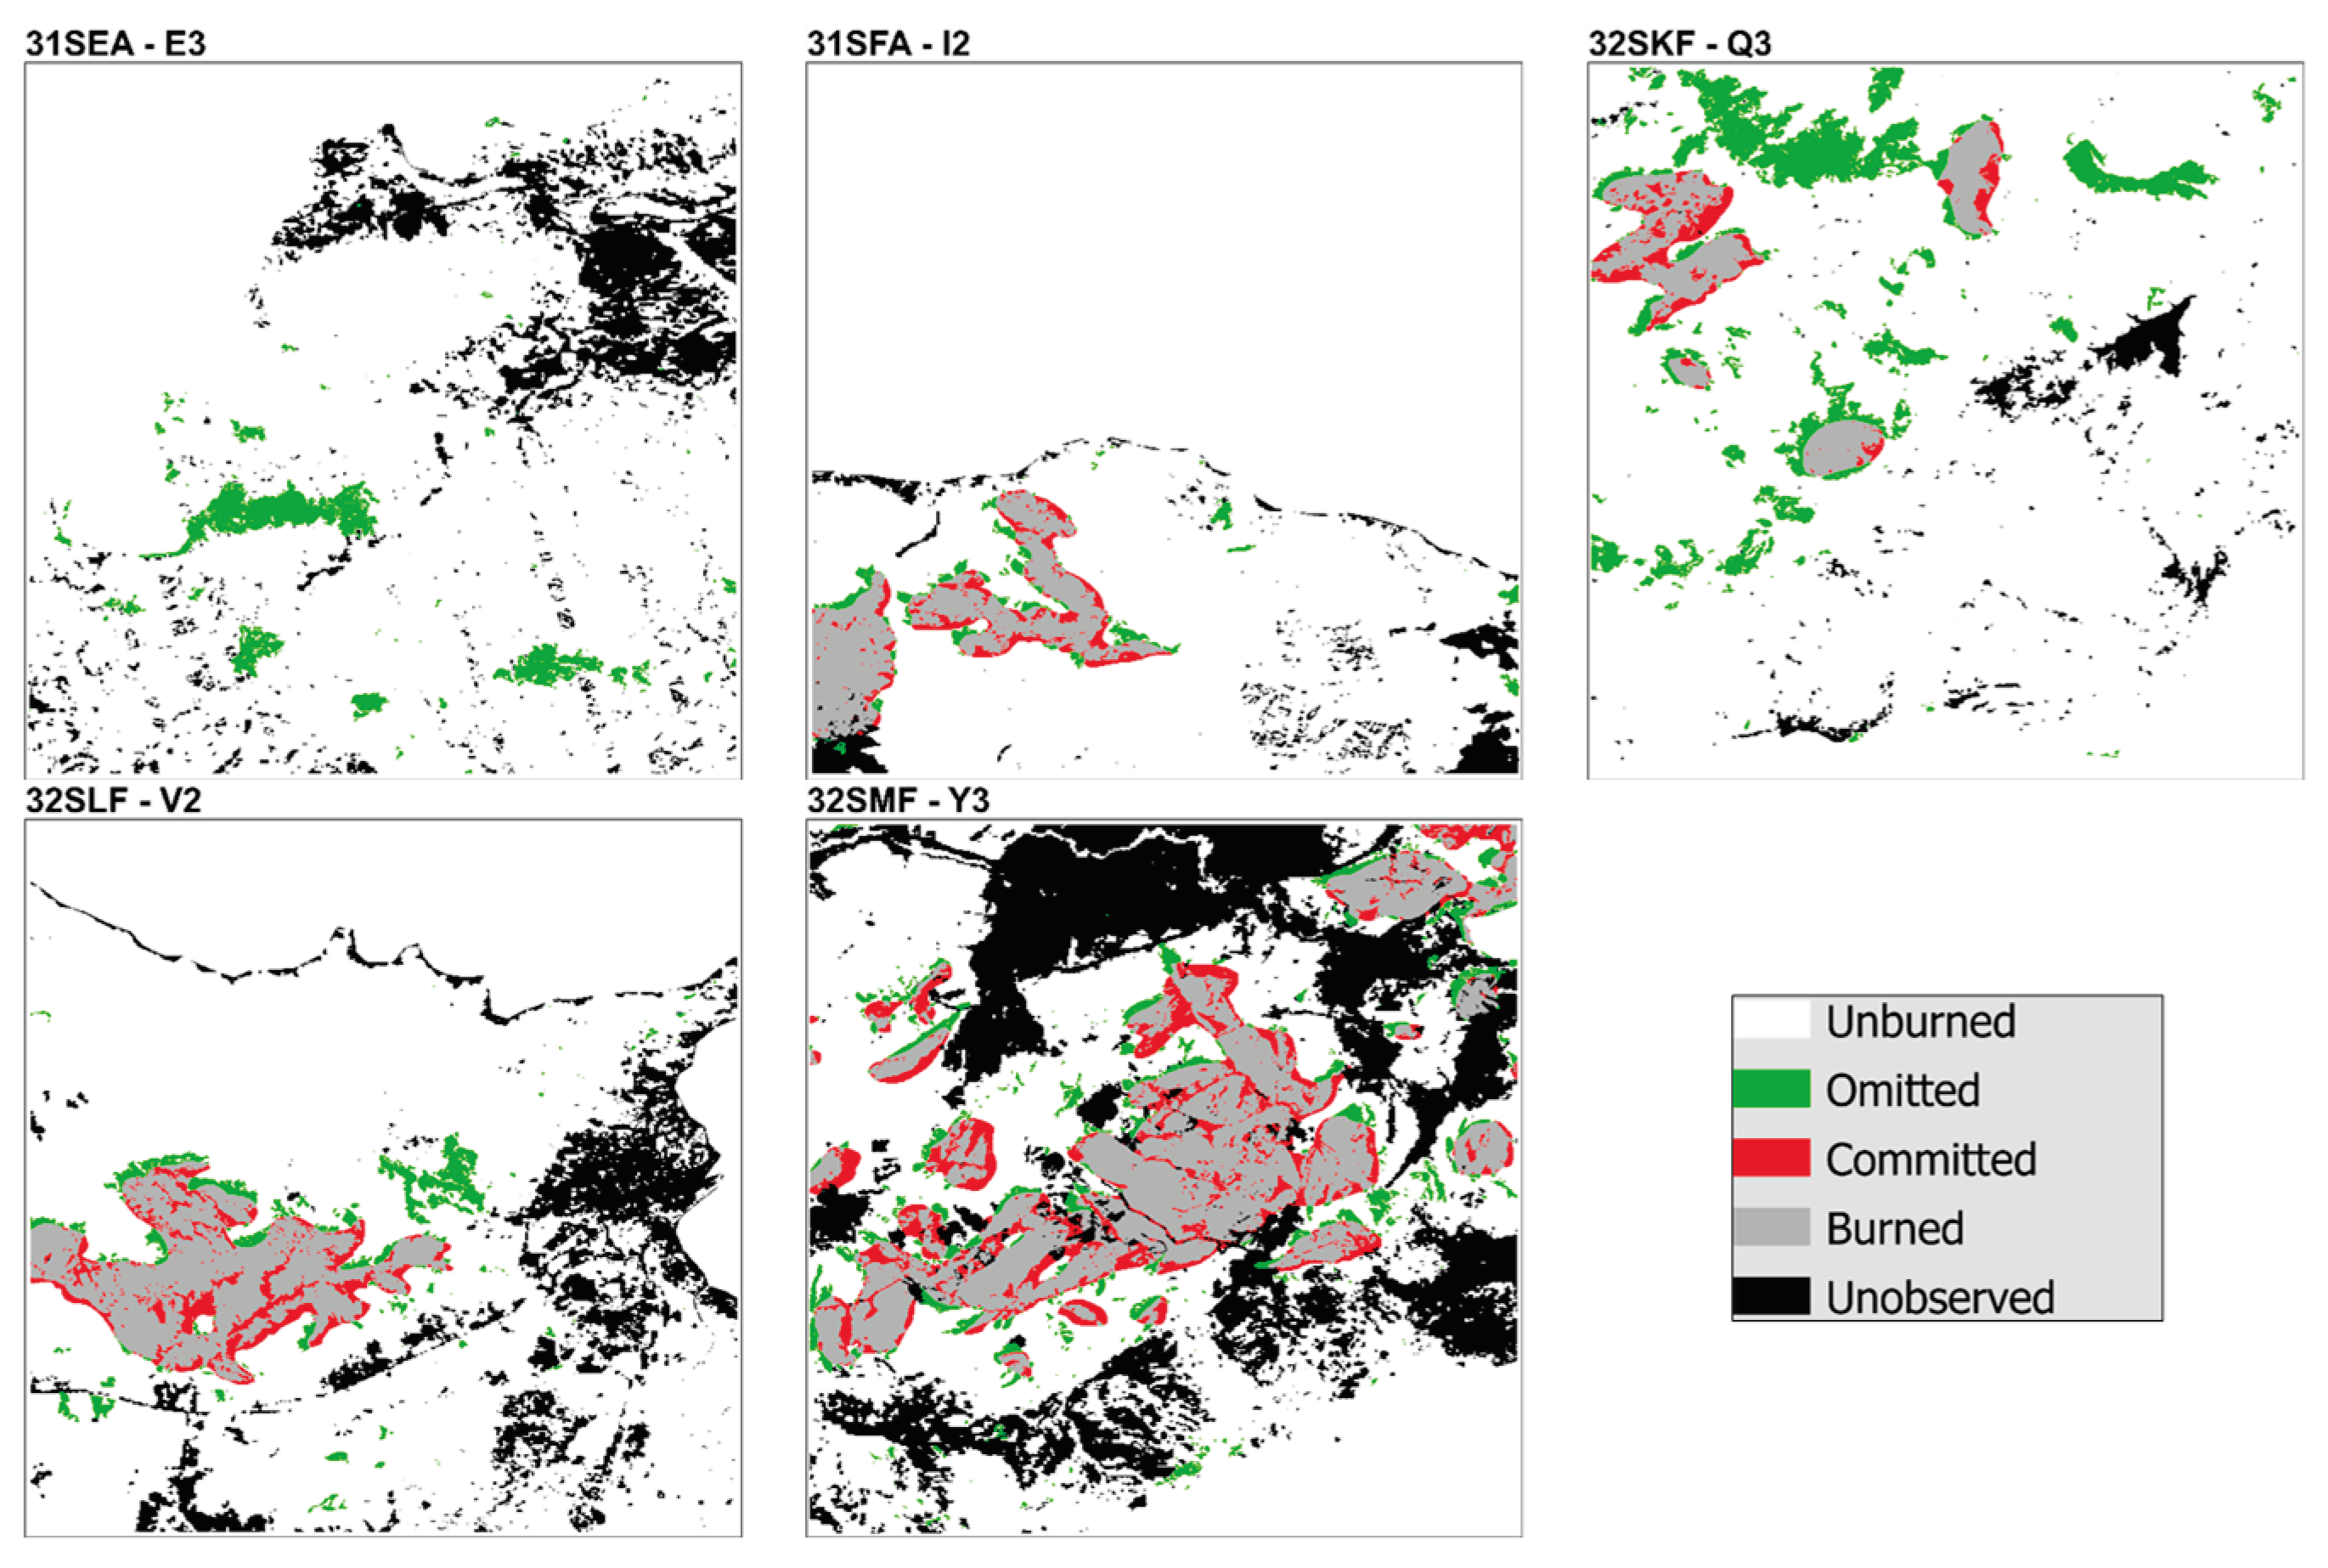
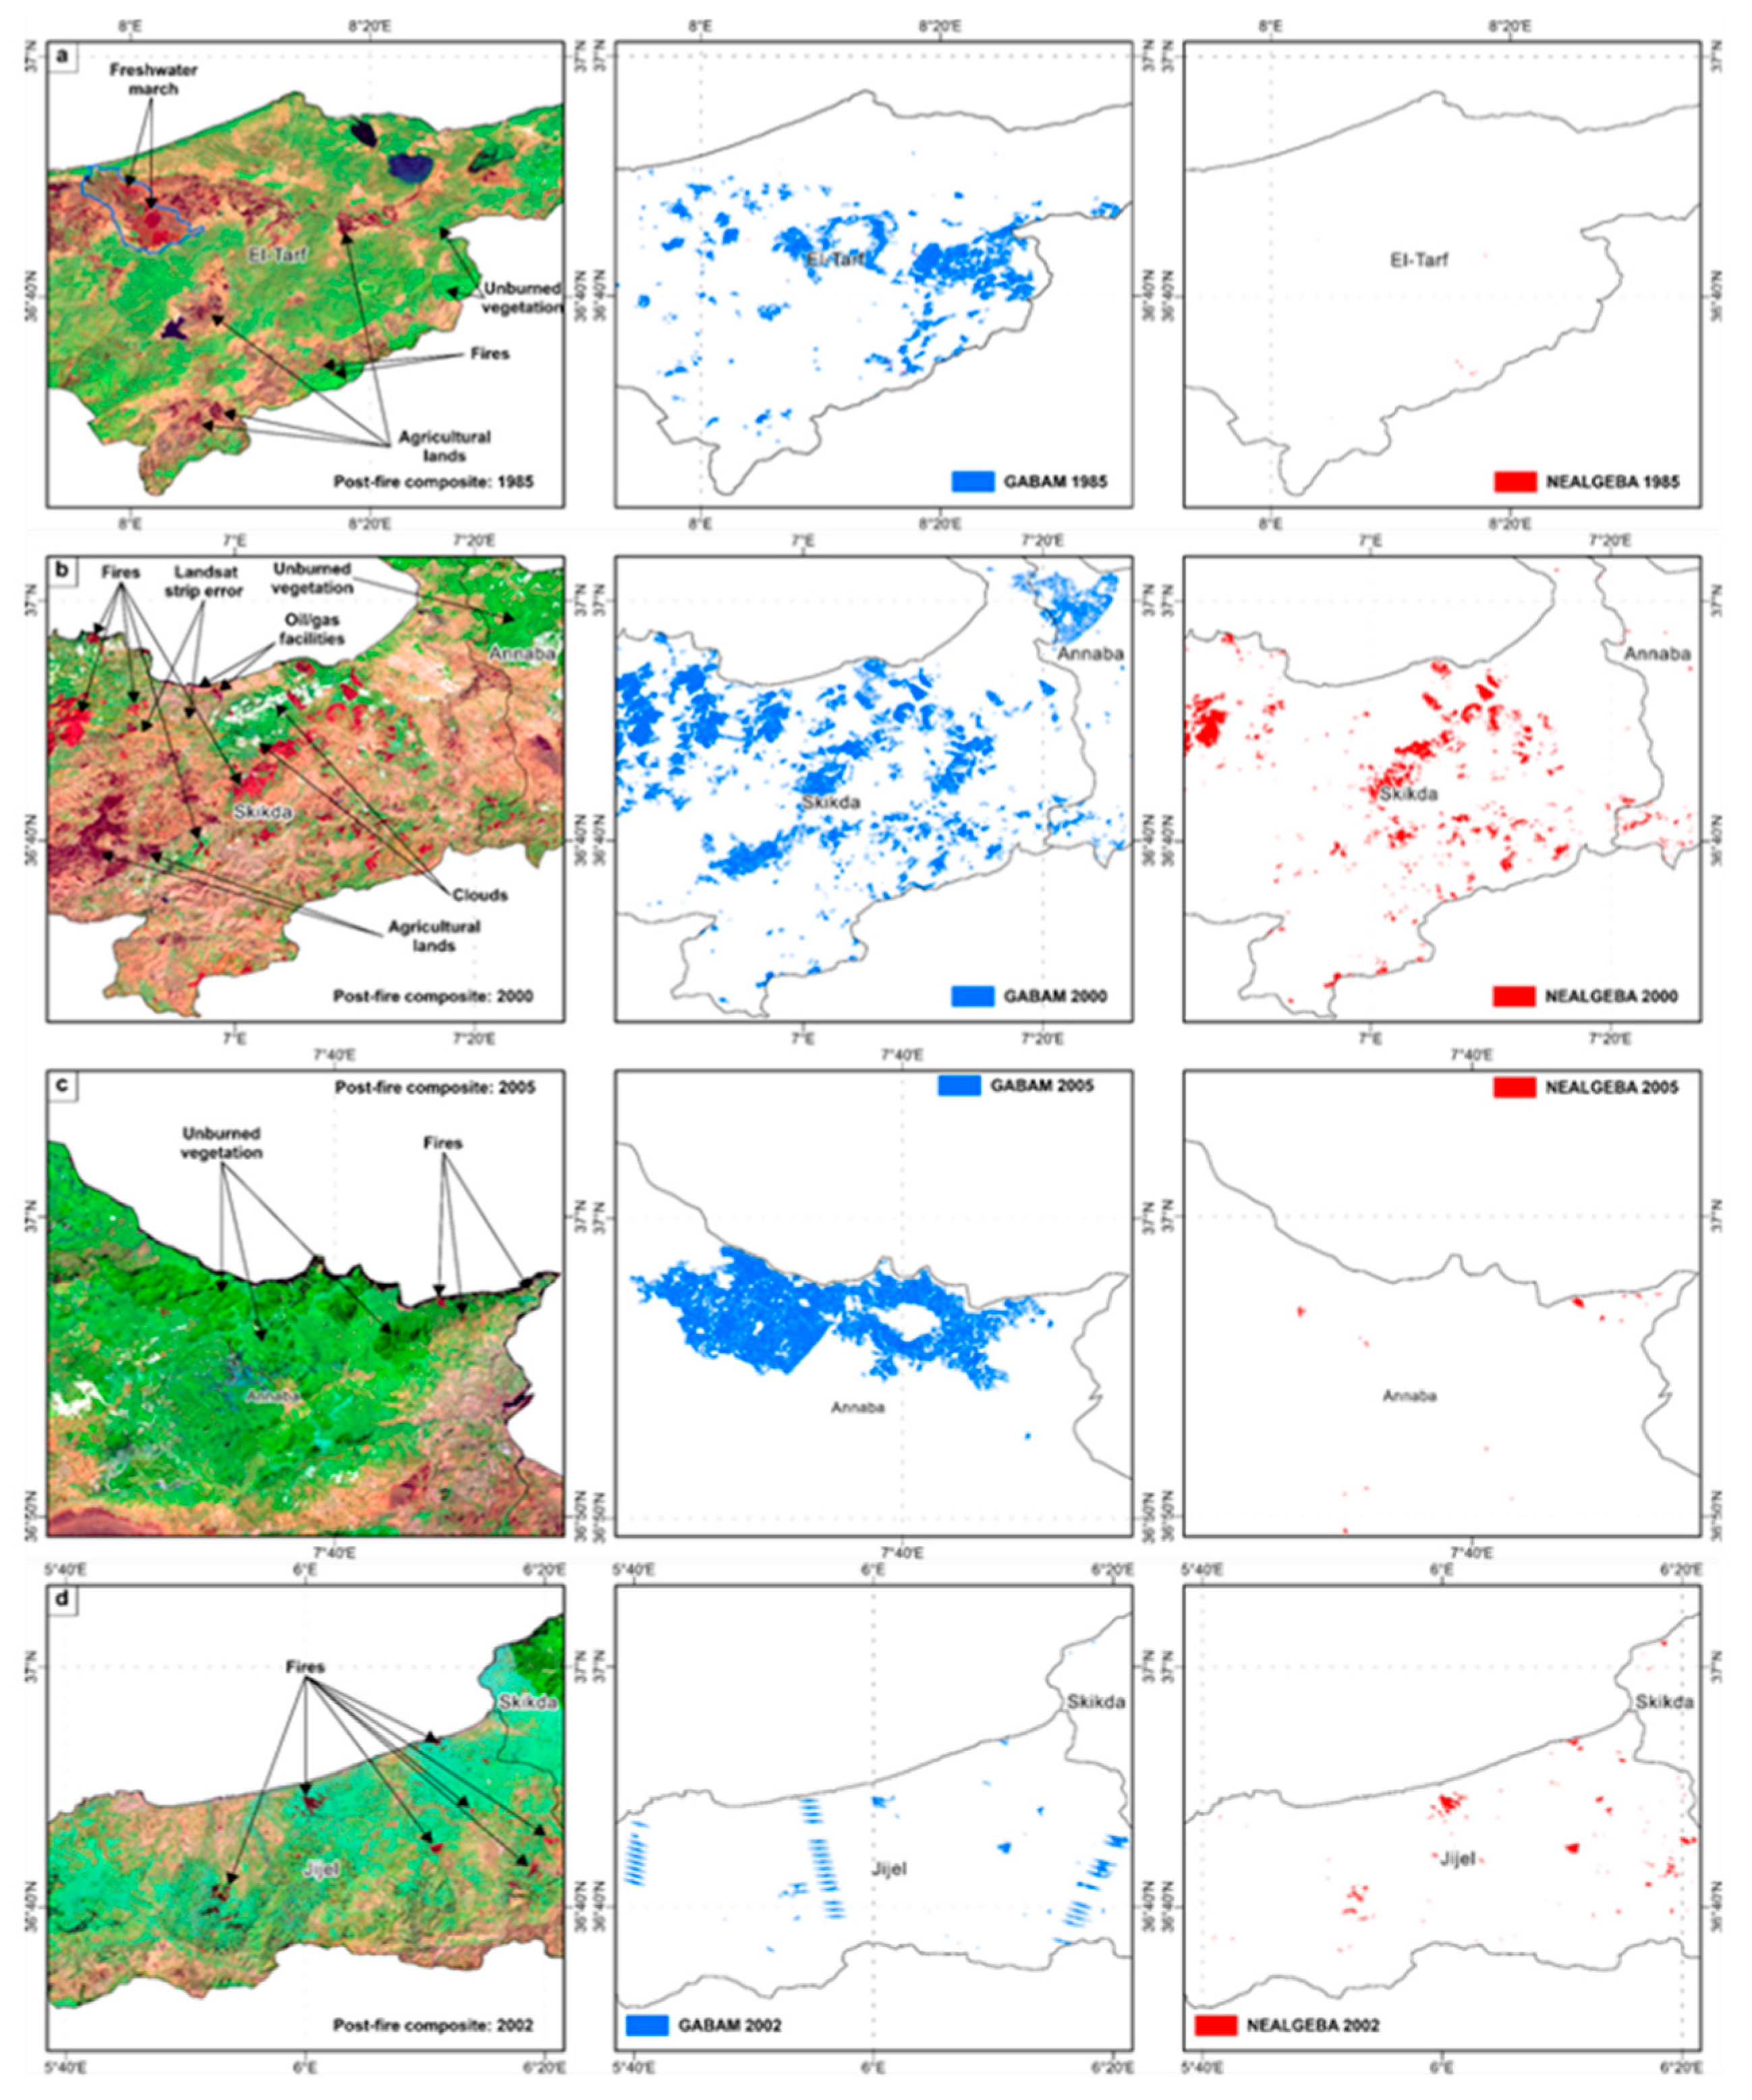
References
- Bowman, D.M.J.S.; Balch, J.K.; Artaxo, P.; Bond, W.J.; Carlson, J.M.; Cochrane, M.A.; D’Antonio, C.M.; DeFries, R.S.; Doyle, J.C.; Harrison, S.P.; et al. Fire in the Earth System. Science (1979) 2009, 324.
- Wu, C.; Venevsky, S.; Sitch, S.; Mercado, L.M.; Huntingford, C.; Staver, A.C. Historical and Future Global Burned Area with Changing Climate and Human Demography. One Earth 2021, 4. [CrossRef]
- Seidl, R.; Schelhaas, M.J.; Rammer, W.; Verkerk, P.J. Increasing Forest Disturbances in Europe and Their Impact on Carbon Storage. Nat Clim Chang 2014, 4. [CrossRef]
- Ruffault, J.; Curt, T.; Moron, V.; Trigo, R.M.; Mouillot, F.; Koutsias, N.; Pimont, F.; Martin-StPaul, N.; Barbero, R.; Dupuy, J.L.; et al. Increased Likelihood of Heat-Induced Large Wildfires in the Mediterranean Basin. Sci Rep 2020, 10. [CrossRef]
- Curt, T.; Aini, A.; Dupire, S. Fire Activity in Mediterranean Forests (The Algerian Case). Fire 2020, 3, 1–17. [CrossRef]
- Madoui, A. Les Incendies de Forêt En Algérie. Historique, Bilan et Analyse. Forêt méditerranéenne 2002, 23, 23–30.
- Sahar, O.; Leone, V.; Limani, H.; Rabia, N.; Meddour, R. Wildfire Risk and Its Perception in Kabylia (Algeria). IForest 2018, 11. [CrossRef]
- World Bank Note Sur Les Forêts Algériennes: Gestion Durable Des Forêts Pour Lutter Contre Les Feux de Forêts; Washington, DC: World Bank, 2023;
- Meddour-Sahar, O. Wildfires in Algeria: Problems and Challenges. IForest 2015, 8. [CrossRef]
- Majdalani, G.; Koutsias, N.; Faour, G.; Adjizian-Gerard, J.; Mouillot, F. Fire Regime Analysis in Lebanon (2001–2020): Combining Remote Sensing Data in a Scarcely Documented Area. Fire 2022, 5, 141. [CrossRef]
- Chuvieco, E.; Aguado, I.; Salas, J.; García, M.; Yebra, M.; Oliva, P. Satellite Remote Sensing Contributions to Wildland Fire Science and Management. Current Forestry Reports 2020, 6.
- Pereira, M.G.; Malamud, B.D.; Trigo, R.M.; Alves, P.I. The History and Characteristics of the 1980–2005 Portuguese Rural Fire Database. Natural Hazards and Earth System Sciences 2011, 11, 3343–3358. [CrossRef]
- Belhadj-Khedher, C.; Koutsias, N.; Karamitsou, A.; Ei-Melki, T.; Ouelhazi, B.; Hamdi, A.; Nouri, H.; Mouillot, F. A Revised Historical Fire Regime Analysis in Tunisia (1985–2010) from a Critical Analysis of the National Fire Database and Remote Sensing. Forests 2018, 9. [CrossRef]
- Koutsias, N.; Xanthopoulos, G.; Founda, D.; Xystrakis, F.; Nioti, F.; Pleniou, M.; Mallinis, G.; Arianoutsou, M. On the Relationships between Forest Fires and Weather Conditions in Greece from Long-Term National Observations (1894-2010). Int J Wildland Fire 2013, 22. [CrossRef]
- Chuvieco, E.; Mouillot, F.; van der Werf, G.R.; San Miguel, J.; Tanasse, M.; Koutsias, N.; García, M.; Yebra, M.; Padilla, M.; Gitas, I.; et al. Historical Background and Current Developments for Mapping Burned Area from Satellite Earth Observation. Remote Sens Environ 2019, 225. [CrossRef]
- Andela, N.; Morton, D.C.; Giglio, L.; Chen, Y.; van der Werf, G.R.; Kasibhatla, P.S.; DeFries, R.S.; Collatz, G.J.; Hantson, S.; Kloster, S. A Human-Driven Decline in Global Burned Area. Science (1979) 2017, 356, 1356–1362. [CrossRef]
- García, M.; Pettinari, M.L.; Chuvieco, E.; Salas, J.; Mouillot, F.; Chen, W.; Aguado, I. Characterizing Global Fire Regimes from Satellite-Derived Products. Forests 2022, 13, 699. [CrossRef]
- Archibald, S.; Lehmann, C.E.R.; Gómez-Dans, J.L.; Bradstock, R.A. Defining Pyromes and Global Syndromes of Fire Regimes. Proc Natl Acad Sci U S A 2013, 110. [CrossRef]
- Shi, K.; Touge, Y. Characterization of Global Wildfire Burned Area Spatiotemporal Patterns and Underlying Climatic Causes. Sci Rep 2022, 12. [CrossRef]
- Van Wees, D.; Van Der Werf, G.R. Modelling Biomass Burning Emissions and the Effect of Spatial Resolution: A Case Study for Africa Based on the Global Fire Emissions Database (GFED). Geosci Model Dev 2019, 12, 4681–4703. [CrossRef]
- Hantson, S.; Arneth, A.; Harrison, S.P.; Kelley, D.I.; Colin Prentice, I.; Rabin, S.S.; Archibald, S.; Mouillot, F.; Arnold, S.R.; Artaxo, P.; et al. The Status and Challenge of Global Fire Modelling. Biogeosciences 2016, 13. [CrossRef]
- Laurent, P.; Mouillot, F.; Yue, C.; Ciais, P.; Moreno, M.V.; Nogueira, J.M.P. FRY, a Global Database of Fire Patch Functional Traits Derived from Space-Borne Burned Area Products. Sci Data 2018, 5. [CrossRef]
- Lizundia-Loiola, J.; Otón, G.; Ramo, R.; Chuvieco, E. A Spatio-Temporal Active-Fire Clustering Approach for Global Burned Area Mapping at 250 m from MODIS Data. Remote Sens Environ 2020, 236, 111493. [CrossRef]
- Otón, G.; Lizundia-Loiola, J.; Pettinari, M.L.; Chuvieco, E. Development of a Consistent Global Long-Term Burned Area Product (1982–2018) Based on AVHRR-LTDR Data. International Journal of Applied Earth Observation and Geoinformation 2021, 103. [CrossRef]
- Lizundia-Loiola, J.; Franquesa, M.; Khairoun, A.; Chuvieco, E. Global Burned Area Mapping from Sentinel-3 Synergy and VIIRS Active Fires. Remote Sens Environ 2022, 282, 113298. [CrossRef]
- Chuvieco, E.; Roteta, E.; Sali, M.; Stroppiana, D.; Boettcher, M.; Kirches, G.; Storm, T.; Khairoun, A.; Pettinari, M.L.; Franquesa, M.; et al. Building a Small Fire Database for Sub-Saharan Africa from Sentinel-2 High-Resolution Images. Science of the Total Environment 2022, 845. [CrossRef]
- Roteta, E.; Bastarrika, A.; Padilla, M.; Storm, T.; Chuvieco, E. Development of a Sentinel-2 Burned Area Algorithm: Generation of a Small Fire Database for Sub-Saharan Africa. Remote Sens Environ 2019, 222, 1–17. [CrossRef]
- Giglio, L.; Boschetti, L.; Roy, D.P.; Humber, M.L.; Justice, C.O. The Collection 6 MODIS Burned Area Mapping Algorithm and Product. Remote Sens Environ 2018, 217, 72–85. [CrossRef]
- Lizundia-Loiola, J.; Franquesa, M.; Boettcher, M.; Kirches, G.; Pettinari, M.L.; Chuvieco, E. Implementation of the Burned Area Component of the Copernicus Climate Change Service: From Modis to Olci Data. Remote Sens (Basel) 2021, 13. [CrossRef]
- San-Miguel-Ayanz, J.; Schulte, E.; Schmuck, G.; Camia, A.; Strobl, P.; Liberta, G.; Giovando, C.; Boca, R.; Sedano, F.; Kempeneers, P. Comprehensive Monitoring of Wildfires in Europe: The European Forest Fire Information System (EFFIS). In Approaches to managing disaster-Assessing hazards, emergencies and disaster impacts; IntechOpen, 2012 ISBN 953510294X.
- Mouillot, F.; Schultz, M.G.; Yue, C.; Cadule, P.; Tansey, K.; Ciais, P.; Chuvieco, E. Ten Years of Global Burned Area Products from Spaceborne Remote Sensing-A Review: Analysis of User Needs and Recommendations for Future Developments. International Journal of Applied Earth Observation and Geoinformation 2014, 26.
- Long, T.; Zhang, Z.; He, G.; Jiao, W.; Tang, C.; Wu, B.; Zhang, X.; Wang, G.; Yin, R. 30m Resolution Global Annual Burned Area Mapping Based on Landsat Images and Google Earth Engine. Remote Sens (Basel) 2019, 11. [CrossRef]
- Gorelick, N.; Hancher, M.; Dixon, M.; Ilyushchenko, S.; Thau, D.; Moore, R. Google Earth Engine: Planetary-Scale Geospatial Analysis for Everyone. Remote Sens Environ 2017, 202, 18–27. [CrossRef]
- Eidenshink, J.; Schwind, B.; Brewer, K.; Zhu, Z.-L.; Quayle, B.; Howard, S. A Project for Monitoring Trends in Burn Severity. Fire Ecology 2007, 3. [CrossRef]
- Hawbaker, T.J.; Vanderhoof, M.K.; Schmidt, G.L.; Beal, Y.J.; Picotte, J.J.; Takacs, J.D.; Falgout, J.T.; Dwyer, J.L. The Landsat Burned Area Algorithm and Products for the Conterminous United States. Remote Sens Environ 2020, 244. [CrossRef]
- Ramo, R.; Roteta, E.; Bistinas, I.; van Wees, D.; Bastarrika, A.; Chuvieco, E.; van der Werf, G.R. African Burned Area and Fire Carbon Emissions Are Strongly Impacted by Small Fires Undetected by Coarse Resolution Satellite Data. Proc Natl Acad Sci U S A 2021, 118. [CrossRef]
- Khairoun, A.; Mouillot, F.; Chen, W.; Ciais, P.; Chuvieco, E. Coarse-Resolution Burned Area Datasets Severely Underestimate Fire-Related Forest Loss. Science of The Total Environment 2024, 170599.
- Katagis, T.; Gitas, I.Z. Assessing the Accuracy of MODIS MCD64A1 C6 and FireCCI51 Burned Area Products in Mediterranean Ecosystems. Remote Sens (Basel) 2022, 14. [CrossRef]
- Liu, J.; Heiskanen, J.; Maeda, E.E.; Pellikka, P.K.E. Burned Area Detection Based on Landsat Time Series in Savannas of Southern Burkina Faso. International Journal of Applied Earth Observation and Geoinformation 2018, 64. [CrossRef]
- Llorens, R.; Sobrino, J.A.; Fernández, C.; Fernández-Alonso, J.M.; Vega, J.A. A Methodology to Estimate Forest Fires Burned Areas and Burn Severity Degrees Using Sentinel-2 Data. Application to the October 2017 Fires in the Iberian Peninsula. International Journal of Applied Earth Observation and Geoinformation 2021, 95. [CrossRef]
- Gaveau, D.L.A.; Descals, A.; Salim, M.A.; Sheil, D.; Sloan, S. Refined Burned-Area Mapping Protocol Using Sentinel-2 Data Increases Estimate of 2019 Indonesian Burning. Earth Syst Sci Data 2021, 13. [CrossRef]
- Roteta, E.; Bastarrika, A.; Franquesa, M.; Chuvieco, E. Landsat and Sentinel-2 Based Burned Area Mapping Tools in Google Earth Engine. Remote Sens (Basel) 2021, 13, 1–30. [CrossRef]
- Fernández-García, V.; Franquesa, M.; Kull, C.A. Madagascar’s Burned Area from Sentinel-2 Imagery (2016–2022): Four Times Higher than from Lower Resolution Sensors. Science of The Total Environment 2024, 169929.
- Oliva, P.; Mansilla, R.; Roteta, E.; Pérez-Martínez, W. Suitability of Band Angle Indices for Burned Area Mapping in the Maule Region (Chile). Frontiers in Forests and Global Change 2023, 5. [CrossRef]
- Stroppiana, D.; Sali, M.; Busetto, L.; Boschetti, M.; Ranghetti, L.; Franquesa, M.; Pettinari, M.L.; Chuvieco, E. Sentinel-2 Sampling Design and Reference Fire Perimeters to Assess Accuracy of Burned Area Products over Sub-Saharan Africa for the Year 2019. ISPRS Journal of Photogrammetry and Remote Sensing 2022, 191. [CrossRef]
- Roteta, E.; Bastarrika, A.; Ibisate, A.; Chuvieco, E. A Preliminary Global Automatic Burned-Area Algorithm at Medium Resolution in Google Earth Engine. Remote Sens (Basel) 2021, 13. [CrossRef]
- Chuvieco, E.; Yebra, M.; Martino, S.; Thonicke, K.; Gómez-Giménez, M.; San-Miguel, J.; Oom, D.; Velea, R.; Mouillot, F.; Molina, J.R.; et al. Towards an Integrated Approach to Wildfire Risk Assessment: When, Where, What and How May the Landscapes Burn. Fire 2023, 6. [CrossRef]
- Véla, E.; Benhouhou, S. Évaluation d’un Nouveau Point Chaud de Biodiversité Végétale Dans Le Bassin Méditerranéen (Afrique Du Nord). C R Biol 2007, 330. [CrossRef]
- UNESCO Biosphere Reserves in Arab States Available online: https://en.unesco.org/biosphere/arab-states (accessed on 1 November 2023).
- FAO-DGF Plan National de Gestion Des Incendies de Forêt Algérie 2021-2030; 2022;
- Meddour-Sahar, O.; Derridj, A. Bilan Des Feux de Forêts En Algérie : Analyse Spatio-Temporelle et Cartographie Du Risque (Période 1985-2010). Science et Changements Planetaires - Secheresse 2012, 23. [CrossRef]
- Zanaga, D.; Van De Kerchove, R.; Daems, D.; De Keersmaecker, W.; Brockmann, C.; Kirches, G.; Wevers, J.; Cartus, O.; Santoro, M.; Fritz, S. ESA WorldCover 10 m 2021 V200. 2022. [CrossRef]
- USGS USGS EROS Archive - Digital Elevation - Shuttle Radar Topography Mission (SRTM) 1 Arc-Second Global Available online: https://www.usgs.gov/centers/eros/science/usgs-eros-archive-digital-elevation-shuttle-radar-topography-mission-srtm-1?qt-science_center_objects=0#qt-science_center_objects.
- Wulder, M.A.; Roy, D.P.; Radeloff, V.C.; Loveland, T.R.; Anderson, M.C.; Johnson, D.M.; Healey, S.; Zhu, Z.; Scambos, T.A.; Pahlevan, N.; et al. Fifty Years of Landsat Science and Impacts. Remote Sens Environ 2022, 280.
- USGS Landsat Missions Available online: https://www.usgs.gov/landsat-missions (accessed on 14 July 2023).
- European Space Agency SENTINEL-2 User Handbook. Sentinel-2 User Handbook 2015.
- Giglio, L.; Schroeder, W.; Justice, C.O. The Collection 6 MODIS Active Fire Detection Algorithm and Fire Products. Remote Sens Environ 2016, 178. [CrossRef]
- Schroeder, W.; Oliva, P.; Giglio, L.; Csiszar, I.A. The New VIIRS 375m Active Fire Detection Data Product: Algorithm Description and Initial Assessment. Remote Sens Environ 2014, 143. [CrossRef]
- Turco, M.; Llasat, M.C.; Tudela, A.; Castro, X.; Provenzale, A. Decreasing Fires in a Mediterranean Region (1970-2010, NE Spain). Natural Hazards and Earth System Science 2013, 13. [CrossRef]
- Ruffault, J.; Mouillot, F. How a New Fire-suppression Policy Can Abruptly Reshape the Fire-weather Relationship. Ecosphere 2015, 6, 1–19.
- Bastarrika, A.; Alvarado, M.; Artano, K.; Martinez, M.P.; Mesanza, A.; Torre, L.; Ramo, R.; Chuvieco, E. BAMS: A Tool for Supervised Burned Area Mapping Using Landsat Data. Remote Sens (Basel) 2014, 6, 12360–12380. [CrossRef]
- Bastarrika, A.; Chuvieco, E.; Martín, M.P. Mapping Burned Areas from Landsat TM/ETM+ Data with a Two-Phase Algorithm: Balancing Omission and Commission Errors. Remote Sens Environ 2011, 115, 1003–1012. [CrossRef]
- Alonso-Canas, I.; Chuvieco, E. Global Burned Area Mapping from ENVISAT-MERIS and MODIS Active Fire Data. Remote Sens Environ 2015, 163, 140–152. [CrossRef]
- Chuvieco, E.; Lizundia-Loiola, J.; Pettinari, M.L.; Ramo, R.; Padilla, M.; Tansey, K.; Mouillot, F.; Laurent, P.; Storm, T.; Heil, A. Generation and Analysis of a New Global Burned Area Product Based on MODIS 250 m Reflectance Bands and Thermal Anomalies. Earth Syst Sci Data 2018, 10, 2015–2031. [CrossRef]
- Vanderhoof, M.K.; Fairaux, N.; Beal, Y.J.G.; Hawbaker, T.J. Validation of the USGS Landsat Burned Area Essential Climate Variable (BAECV) across the Conterminous United States. Remote Sens Environ 2017, 198, 393–406. [CrossRef]
- Pleniou, M.; Xystrakis, F.; Dimopoulos, P.; Koutsias, N. Maps of Fire Occurrence - Spatially Explicit Reconstruction of Recent Fire History Using Satellite Remote Sensing. J Maps 2012, 8, 499–506. [CrossRef]
- Argañaraz, J.P.; Pizarro, G.G.; Zak, M.; Bellis, L.M. Fire Regime, Climate, and Vegetation in the Sierras de Córdoba, Argentina. Fire Ecology 2015, 11, 55–73. [CrossRef]
- Breiman, L. Random Forests. Mach Learn 2001, 45. [CrossRef]
- Rouse, J.W.; Haas, R.H.; Schell, J.A.; Deering, D.W. Monitoring Vegetation Systems in the Great Plains with ERTS. NASA Special Publication. NASA special publication 1974, 24.
- Key, C.H.; Benson, N.C. The Normalized Burn Ratio (NBR): A Landsat TM Radiometric Measure of Burn Severity. United States Geological Survey, Northern Rocky Mountain Science Center: Bozeman, MT, USA 1999.
- García, M.J.L.; Caselles, V. Mapping Burns and Natural Reforestation Using Thematic Mapper Data. Geocarto Int 1991, 6, 31–37. [CrossRef]
- Justice, C.; Belward, A.; Morisette, J.; Lewis, P.; Privette, J.; Baret, F. Developments in the “validation” of Satellite Sensor Products for the Study of the Land Surface. Int J Remote Sens 2000, 21. [CrossRef]
- Boschetti, L.; Stehman, S. V.; Roy, D.P. A Stratified Random Sampling Design in Space and Time for Regional to Global Scale Burned Area Product Validation. Remote Sens Environ 2016, 186. [CrossRef]
- Padilla, M.; Olofsson, P.; Stehman, S. V.; Tansey, K.; Chuvieco, E. Stratification and Sample Allocation for Reference Burned Area Data. Remote Sens Environ 2017, 203. [CrossRef]
- Olson, D.M.; Dinerstein, E.; Wikramanayake, E.D.; Burgess, N.D.; Powell, G.V.N.; Underwood, E.C.; D’amico, J.A.; Itoua, I.; Strand, H.E.; Morrison, J.C.; et al. Terrestrial Ecoregions of the World: A New Map of Life on Earth: A New Global Map of Terrestrial Ecoregions Provides an Innovative Tool for Conserving Biodiversity. Bioscience 2001, 51. [CrossRef]
- Franquesa, M.; Vanderhoof, M.K.; Stavrakoudis, D.; Gitas, I.Z.; Roteta, E.; Padilla, M.; Chuvieco, E. Development of a Standard Database of Reference Sites for Validating Global Burned Area Products. Earth Syst Sci Data 2020, 12, 3229–3246. [CrossRef]
- Franquesa, M.; Rodriguez-Montellano, A.M.; Chuvieco, E.; Aguado, I. Reference Data Accuracy Impacts Burned Area Product Validation: The Role of the Expert Analyst. Remote Sens (Basel) 2022, 14. [CrossRef]
- Boschetti, L.; Roy, D.P.; Justice, C.O. International Global Burned Area Satellite Product Validation Protocol. Part I–Production and Standardization of Validation Reference Data. Committee on Earth Observation Satellites: Maryland, MD, USA 2009, 1–11.
- Franquesa, M.; Lizundia-Loiola, J.; Stehman, S. V.; Chuvieco, E. Using Long Temporal Reference Units to Assess the Spatial Accuracy of Global Satellite-Derived Burned Area Products. Remote Sens Environ 2022, 269. [CrossRef]
- Dice, L.R. Measures of the Amount of Ecologic Association Between Species. Ecology 1945, 26. [CrossRef]
- Congalton, R.G.; Green, K. Assessing the Accuracy of Remotely Sensed Data: Principles and Practices; CRC press, 2019; ISBN 0429629354.
- Padilla, M.; Wheeler, J.; Tansey, K. ESA CCI ECV Fire Disturbance: D4. 1.1 Product Validation Report, Version 2.1. Tech. Rep. 2018.
- Giglio, L.; Schroeder, W.; Hall, J. V; Justice, C.O. MODIS Collection 6 Active Fire Product User’s Guide Revision C 2020.
- Peterson, B.G.; Carl, P.; Boudt, K.; Bennett, R.; Ulrich, J.; Zivot, E.; Cornilly, D.; Hung, E.; Lestel, M.; Balkissoon, K. Package ‘Performanceanalytics.’ R Team Cooperation 2018, 3, 13–14.
- Kendall, M.G. Rank Correlation Methods. Biometrika 1957, 44. [CrossRef]
- Mann, H.B. Nonparametric Tests Against Trend. Econometrica 1945, 13. [CrossRef]
- Sen, P.K. Estimates of the Regression Coefficient Based on Kendall’s Tau. J Am Stat Assoc 1968, 63. [CrossRef]
- Otón, G.; Pereira, J.M.C.; Silva, J.M.N.; Chuvieco, E. Analysis of Trends in the Firecci Global Long Term Burned Area Product (1982–2018). Fire 2021, 4. [CrossRef]
- Ricotta, C.; Arianoutsou, M.; Díaz-Delgado, R.; Duguy, B.; Lloret, F.; Maroudi, E.; Mazzoleni, S.; Manuel Moreno, J.; Rambal, S.; Vallejo, R.; et al. Self-Organized Criticality of Wildfires Ecologically Revisited. Ecol Modell 2001, 141.
- Padilla, M.; Stehman, S. V.; Ramo, R.; Corti, D.; Hantson, S.; Oliva, P.; Alonso-Canas, I.; Bradley, A. V.; Tansey, K.; Mota, B.; et al. Comparing the Accuracies of Remote Sensing Global Burned Area Products Using Stratified Random Sampling and Estimation. Remote Sens Environ 2015, 160, 114–121. [CrossRef]
- Achour, H.; Toujani, A.; Trabelsi, H.; Jaouadi, W. Evaluation and Comparison of Sentinel-2 MSI, Landsat 8 OLI, and EFFIS Data for Forest Fires Mapping. Illustrations from the Summer 2017 Fires in Tunisia. Geocarto Int 2021. [CrossRef]
- Vallet, L.; Schwartz, M.; Ciais, P.; van Wees, D.; de Truchis, A.; Mouillot, F. High-Resolution Data Reveal a Surge of Biomass Loss from Temperate and Atlantic Pine Forests, Contextualizing the 2022 Fire Season Distinctiveness in France. Biogeosciences 2023, 20, 3803–3825.
- Storey, J.C.; Choate, M.J. Landsat-5 Bumper-Mode Geometric Correction. IEEE Transactions on Geoscience and Remote Sensing 2004, 42.
- Turco, M.; Jerez, S.; Augusto, S.; Tarín-Carrasco, P.; Ratola, N.; Jiménez-Guerrero, P.; Trigo, R.M. Climate Drivers of the 2017 Devastating Fires in Portugal. Sci Rep 2019, 9. [CrossRef]
- Chergui, B.; Fahd, S.; Santos, X.; Pausas, J.G. Socioeconomic Factors Drive Fire-Regime Variability in the Mediterranean Basin. Ecosystems 2018, 21. [CrossRef]
- Bajocco, S.; Ferrara, C.; Guglietta, D.; Ricotta, C. Easy-to-Interpret Procedure to Analyze Fire Seasonality and the Influence of Land Use in Fire Occurrence: A Case Study in Central Italy. Fire 2020, 3.
- Michetti, M.; Pinar, M. Forest Fires Across Italian Regions and Implications for Climate Change: A Panel Data Analysis. Environ Resour Econ (Dordr) 2019, 72. [CrossRef]
- Salvati, L.; Ranalli, F. “Land of Fires”: Urban Growth, Economic Crisis, and Forest Fires in Attica, Greece. Geographical Research 2015, 53. [CrossRef]
- Nojarov, P.; Nikolova, M. Heat Waves and Forest Fires in Bulgaria. Natural Hazards 2022, 114. [CrossRef]
- Calheiros, T.; Nunes, J.P.; Pereira, M.G. Recent Evolution of Spatial and Temporal Patterns of Burnt Areas and Fire Weather Risk in the Iberian Peninsula. Agric For Meteorol 2020, 287. [CrossRef]
- Turco, M.; Bedia, J.; Di Liberto, F.; Fiorucci, P.; Von Hardenberg, J.; Koutsias, N.; Llasat, M.C.; Xystrakis, F.; Provenzale, A. Decreasing Fires in Mediterranean Europe. PLoS One 2016, 11. [CrossRef]
- Pausas, J.G. Changes in Fire and Climate in the Eastern Iberian Peninsula (Mediterranean Basin). Clim Change 2004, 63. [CrossRef]
- Chriha, S.; Sghari, A. Les Incendies de Forêt En Tunisie. Séquelles Irréversibles de La Révolution de 2011. Méditerranée. Revue géographique des pays méditerranéens/Journal of Mediterranean geography 2013, 87–93.
- Lemus-Canovas, M.; Insua-Costa, D.; Trigo, R.M.; Miralles, D.G. Record-Shattering 2023 Spring Heatwave in Western Mediterranean Amplified by Long-Term Drought. NPJ Clim Atmos Sci 2024, 7, 25.
- Bastarrika, A.; Chuvieco, E.; Martin, M.P. Automatic Burned Land Mapping from MODIS Time Series Images: Assessment in Mediterranean Ecosystems. In Proceedings of the IEEE Transactions on Geoscience and Remote Sensing; 2011; Vol. 49.
- Hall, J. V.; Zibtsev, S. V.; Giglio, L.; Skakun, S.; Myroniuk, V.; Zhuravel, O.; Goldammer, J.G.; Kussul, N. Environmental and Political Implications of Underestimated Cropland Burning in Ukraine. Environmental Research Letters 2021, 16. [CrossRef]
- Kouachi, M. E., Khairoun, A., Baeza, M., & Moutahir, H. (2024). 40-year fire history reconstruction from Landsat data in Mediterranean ecosystems of Algeria (1984–2023) (1.0) [Data set]. Zenodo. [CrossRef]
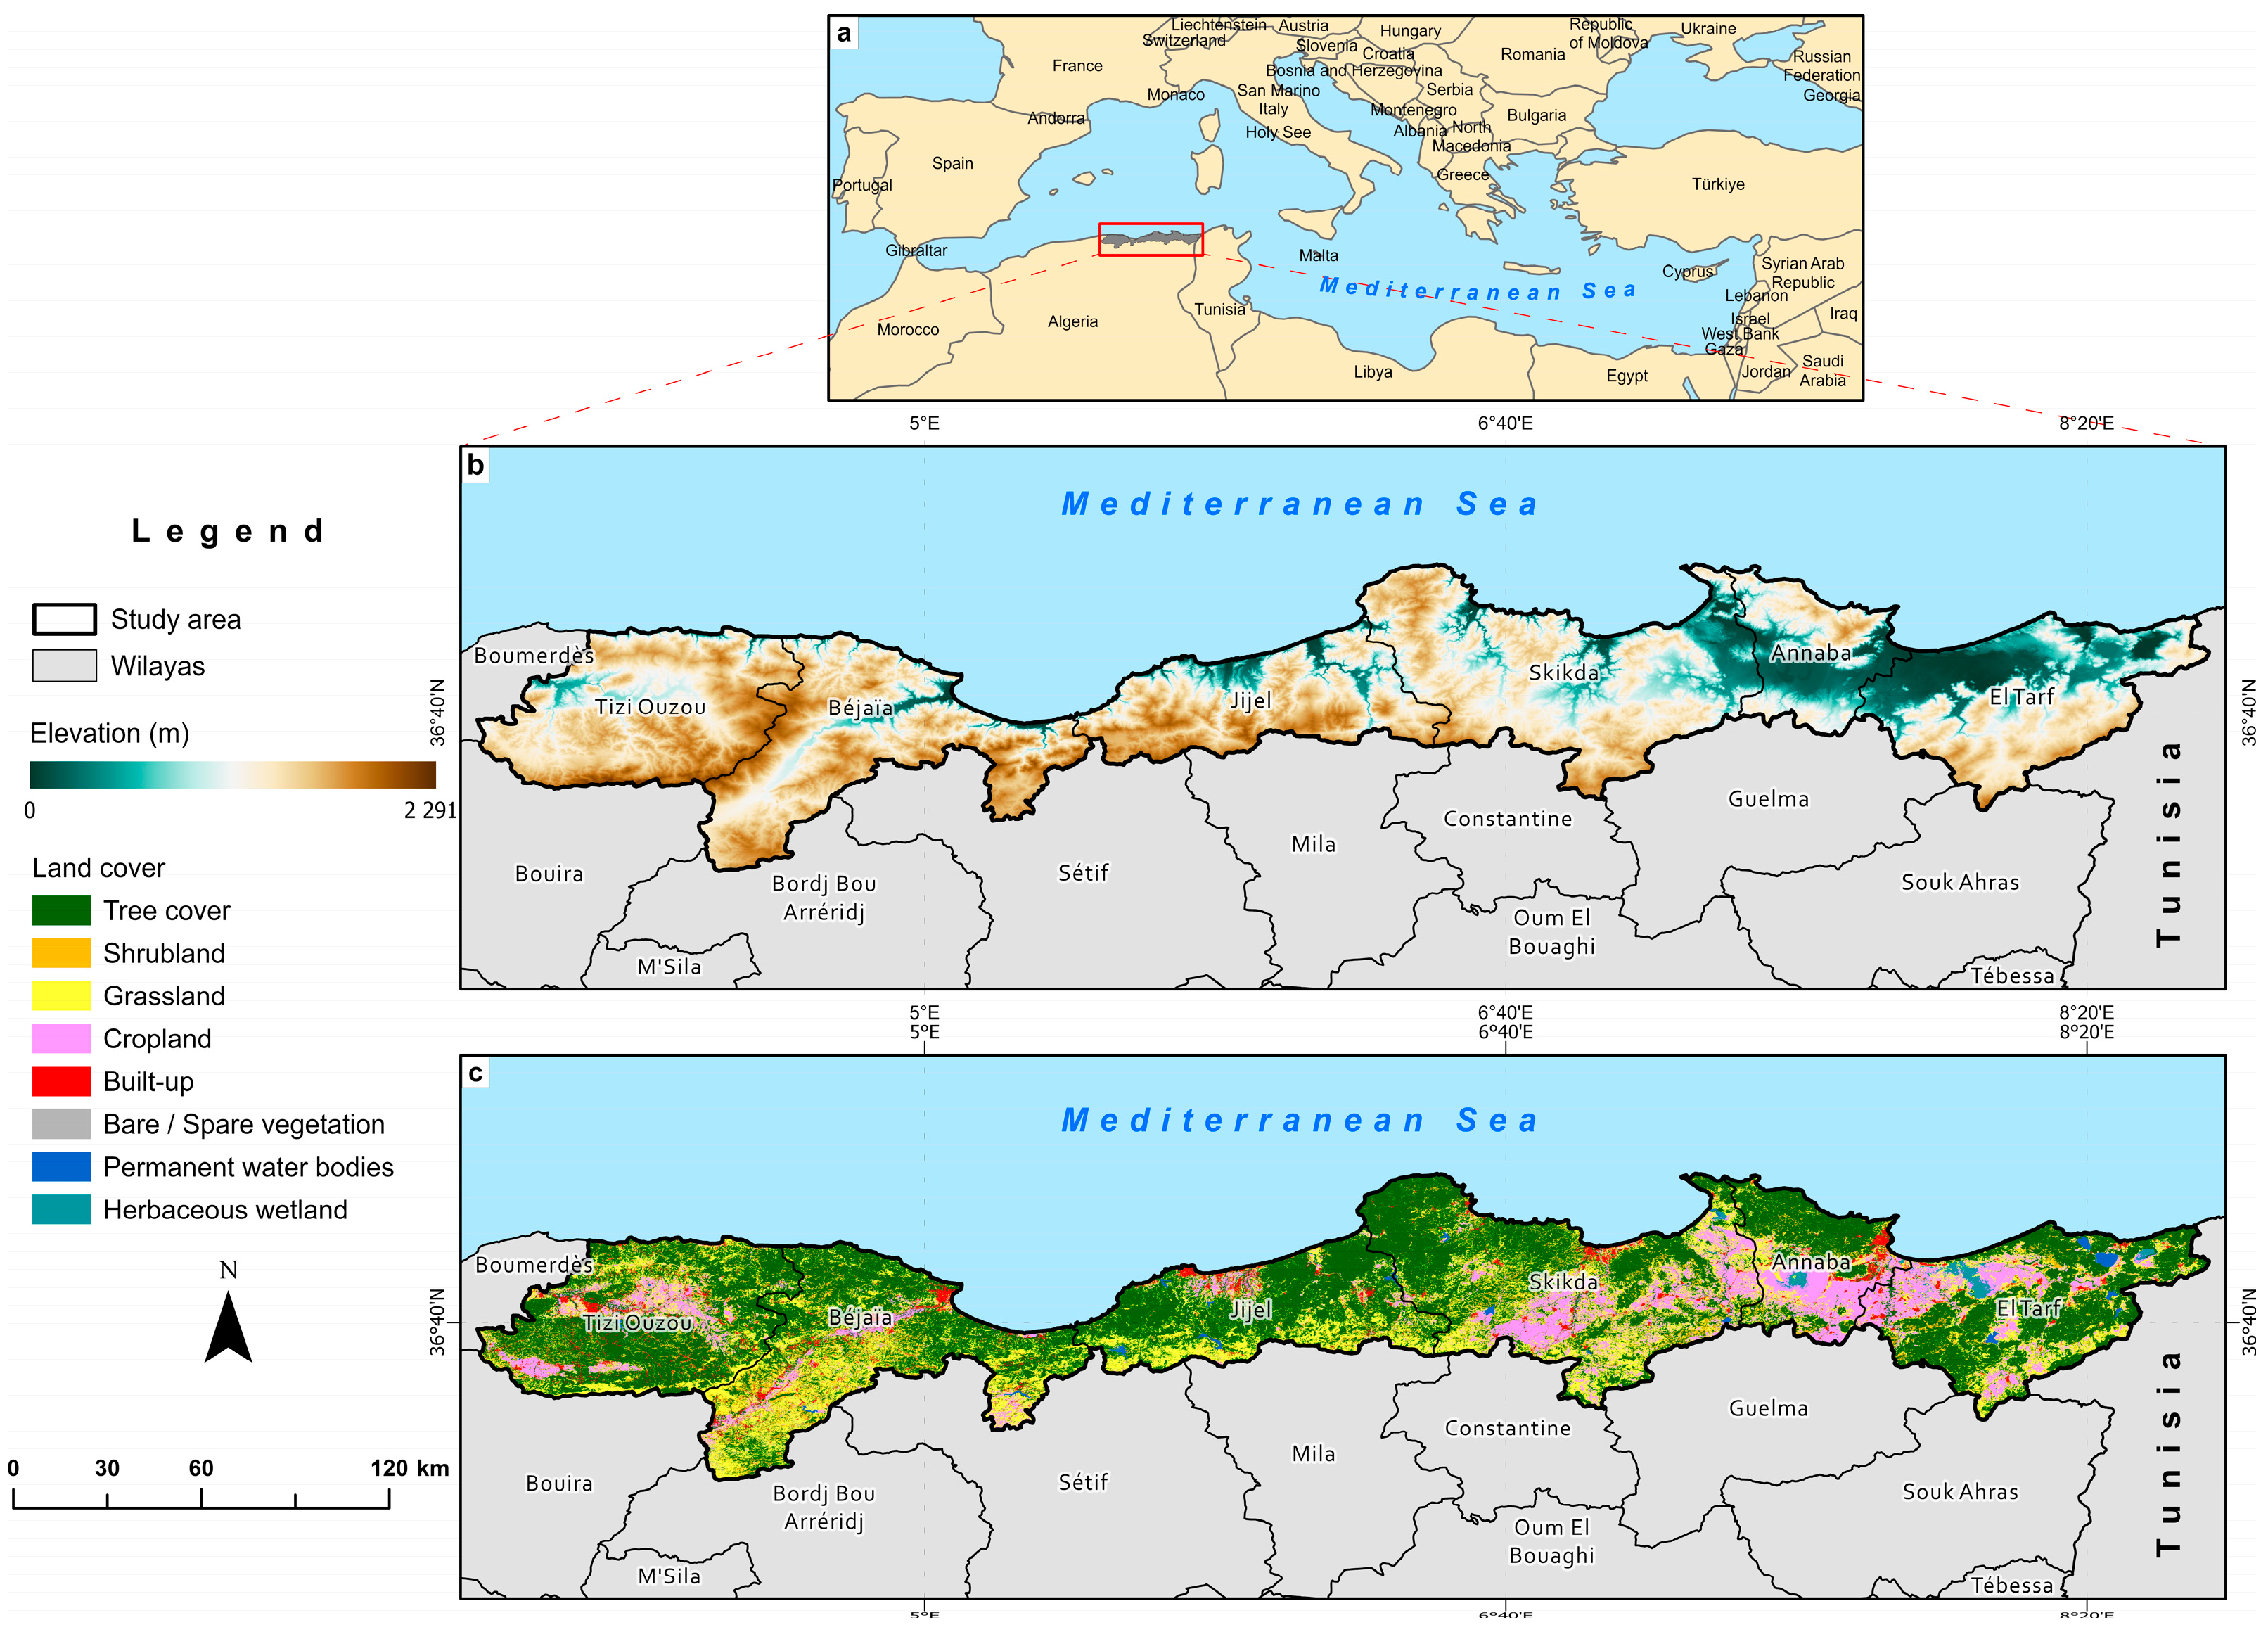

| Wilayas | Area (km2) | Natural vegetation areas (km2) * | Natural vegetation/Wilaya |
P (mm) ** | ||
|---|---|---|---|---|---|---|
| Tree cover | Shrubland | Grassland | ||||
| Annaba | 1 411.52 | 609.40 | 80.74 | 235.47 | 0.66 | 825 |
| Béjaïa | 3 226.11 | 1 434.69 | 278.52 | 1 138.15 | 0.88 | 767.6 |
| El-Tarf | 2 885.32 | 1 420.59 | 157.65 | 601.80 | 0.76 | 792.6 |
| Jijel | 2 397.22 | 1 437.11 | 61.75 | 693.88 | 0.91 | 924.1 |
| Skikda | 4 146.60 | 1 924.21 | 295.43 | 1 096.41 | 0.80 | 725 |
| Tizi Ouzou | 2 969.21 | 1 661.12 | 133.80 | 727.29 | 0.85 | 913 |
| Sentinel-2 tiles |
Validation sites |
Accuracy metrics | |||||||||
|---|---|---|---|---|---|---|---|---|---|---|---|
| Years | CE | OE | OA | DC | RelB | SurfBA | SurfUB | SurfCE | SurfOE | ||
| 31SEA | E-3 | 2017 | 9.08 | 30.16 | 98.99 | 79.00 | -23.19 | 8.46 | 430.61 | 0.84 | 3.65 |
| F-3 | 2021 | 9.71 | 2.92 | 96.91 | 93.56 | 7.52 | 99.57 | 333.54 | 11.06 | 2.99 | |
| 31SFA | I-2 | 2017 | 6.06 | 4.93 | 98.81 | 94.50 | 1.21 | 23.43 | 202.19 | 1.51 | 1.21 |
| G-3 | 2021 | 4.65 | 4.93 | 97.40 | 95.21 | -0.29 | 118.71 | 329.53 | 7.67 | 6.15 | |
| 32SKF | Q-3 | 2017 | 7.36 | 12.13 | 98.11 | 90.19 | -5.16 | 41.67 | 428.13 | 3.31 | 5.75 |
| P-3 | 2021 | 25.38 | 14.88 | 98.78 | 79.52 | 14.08 | 9.85 | 400.11 | 3.35 | 1.72 | |
| 32SLF | V-2 | 2017 | 5.51 | 10.00 | 98.51 | 92.19 | -4.75 | 36.50 | 372.80 | 2.13 | 4.06 |
| U-2 | 2021 | 11.56 | 6.37 | 99.53 | 90.96 | 5.87 | 6.79 | 277.59 | 0.89 | 0.46 | |
| 32SMF | Y-3 | 2017 | 9.65 | 3.12 | 96.73 | 93.50 | 7.22 | 85.45 | 266.27 | 9.13 | 2.76 |
| X-3 | 2021 | 6.66 | 5.78 | 98.78 | 93.78 | 0.94 | 35.78 | 349.07 | 2.55 | 2.19 | |
| Overall | 2017 | 7.96 | 8.19 | 98.22 | 91.92 | -0.24 | 195.51 | 1 700.01 | 16.92 | 17.43 | |
| 2021 | 7.92 | 4.76 | 98.15 | 93.63 | 3.43 | 270.70 | 1 689.84 | 25.53 | 13.52 | ||
Disclaimer/Publisher’s Note: The statements, opinions and data contained in all publications are solely those of the individual author(s) and contributor(s) and not of MDPI and/or the editor(s). MDPI and/or the editor(s) disclaim responsibility for any injury to people or property resulting from any ideas, methods, instructions or products referred to in the content. |
© 2024 by the authors. Licensee MDPI, Basel, Switzerland. This article is an open access article distributed under the terms and conditions of the Creative Commons Attribution (CC BY) license (http://creativecommons.org/licenses/by/4.0/).


