Submitted:
03 April 2024
Posted:
04 April 2024
You are already at the latest version
Abstract
Keywords:
1. Introduction
2. Materials and Methods
2.1. Study Design
2.2. Research Samples
2.3. Methods
2.4. Statistical Analysis
3. Results
3.1. Characteristics of the Samples(CAD Patients Sample and without CAD Patients Sample)
3.2. Detailed Results
3.2.1. Complete clinical examination
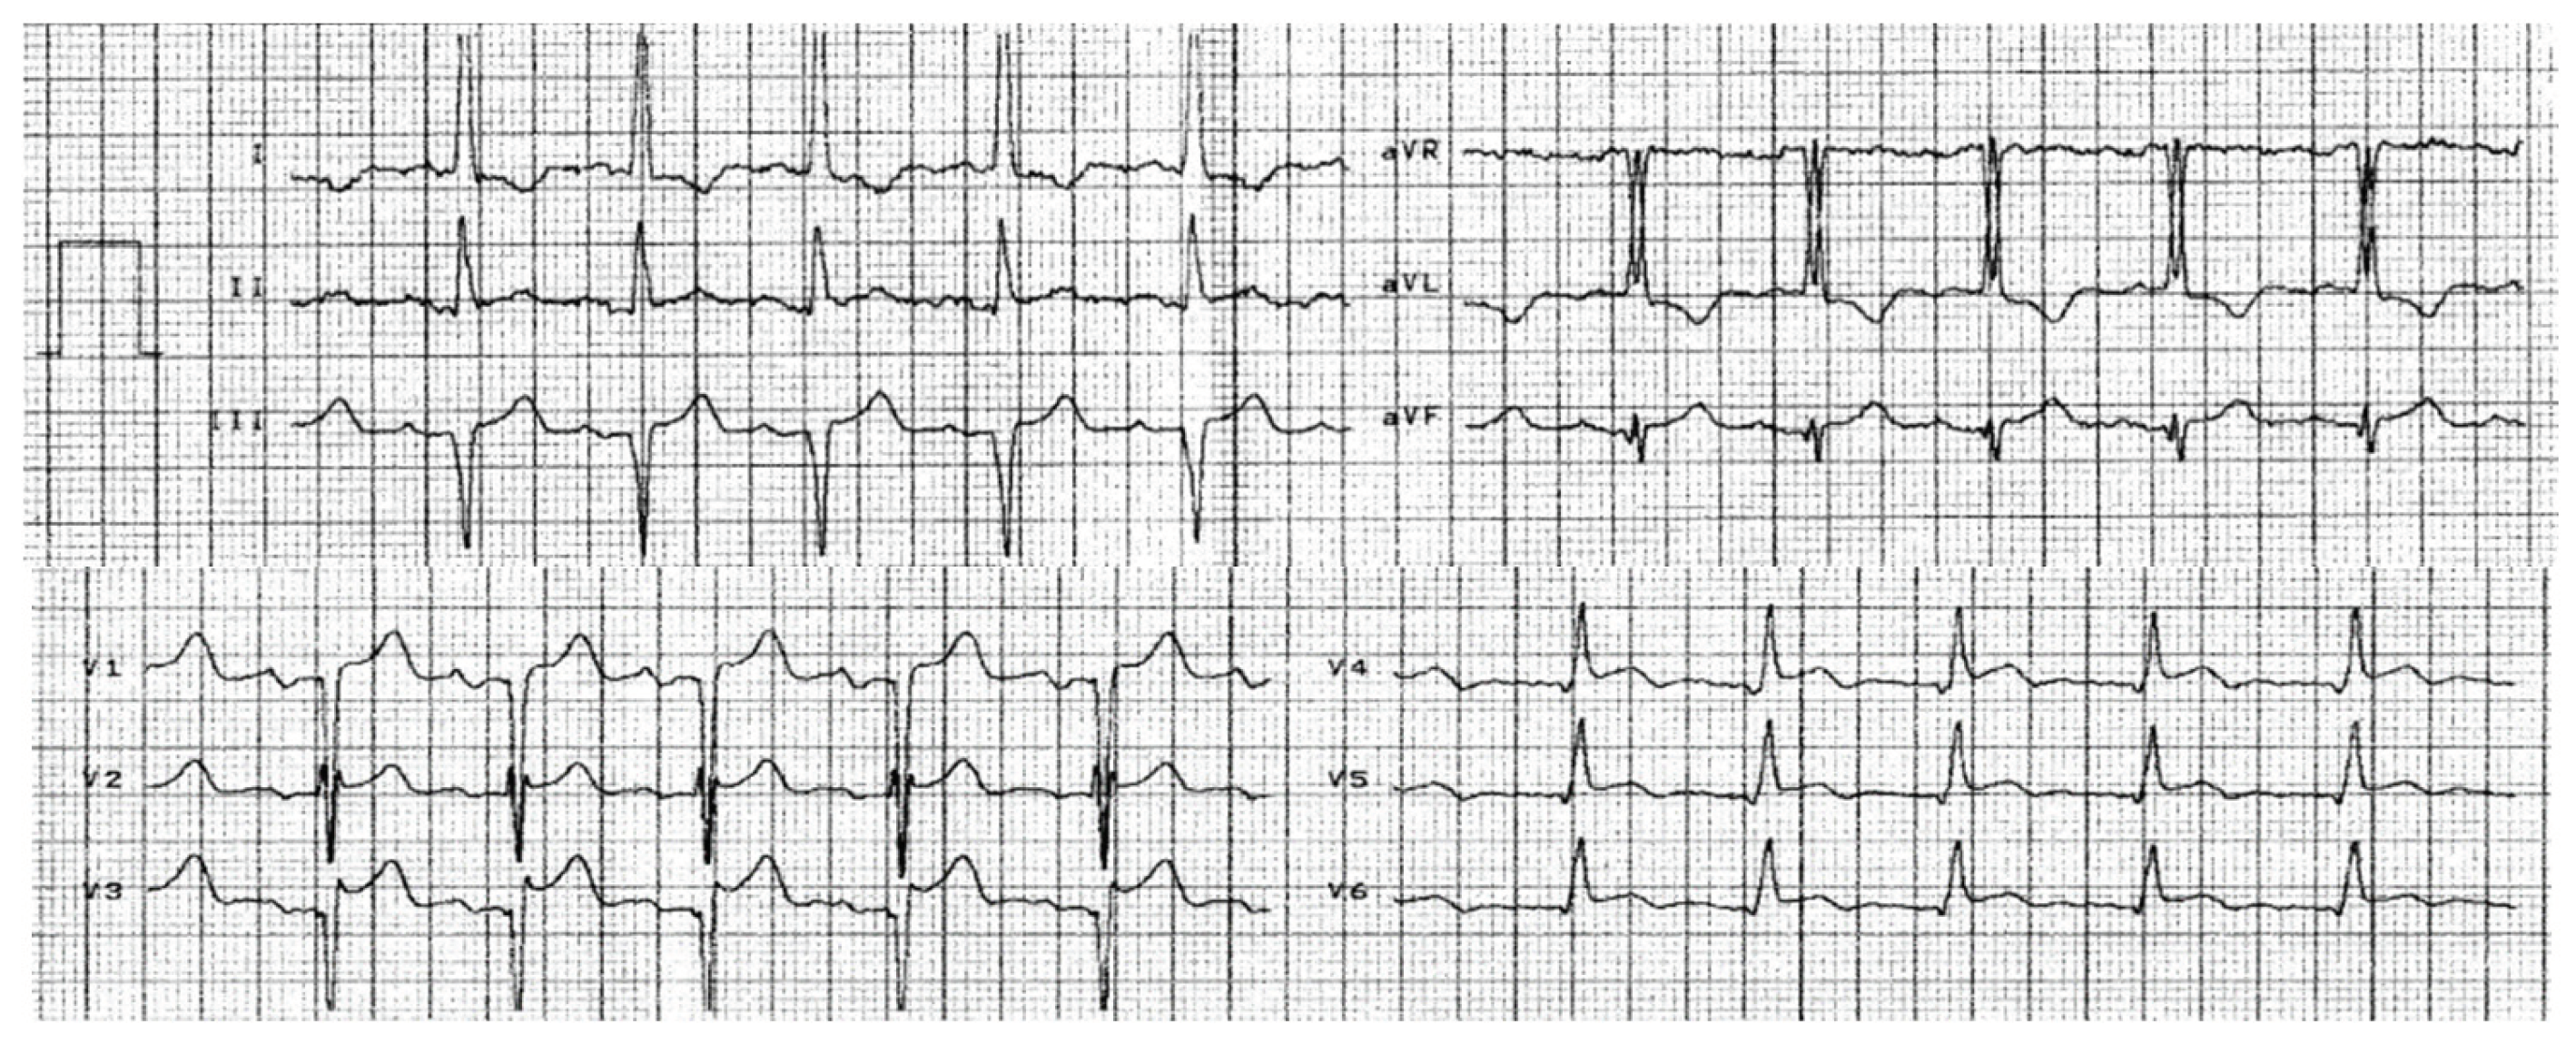
3.2.2. Electrocardiogram
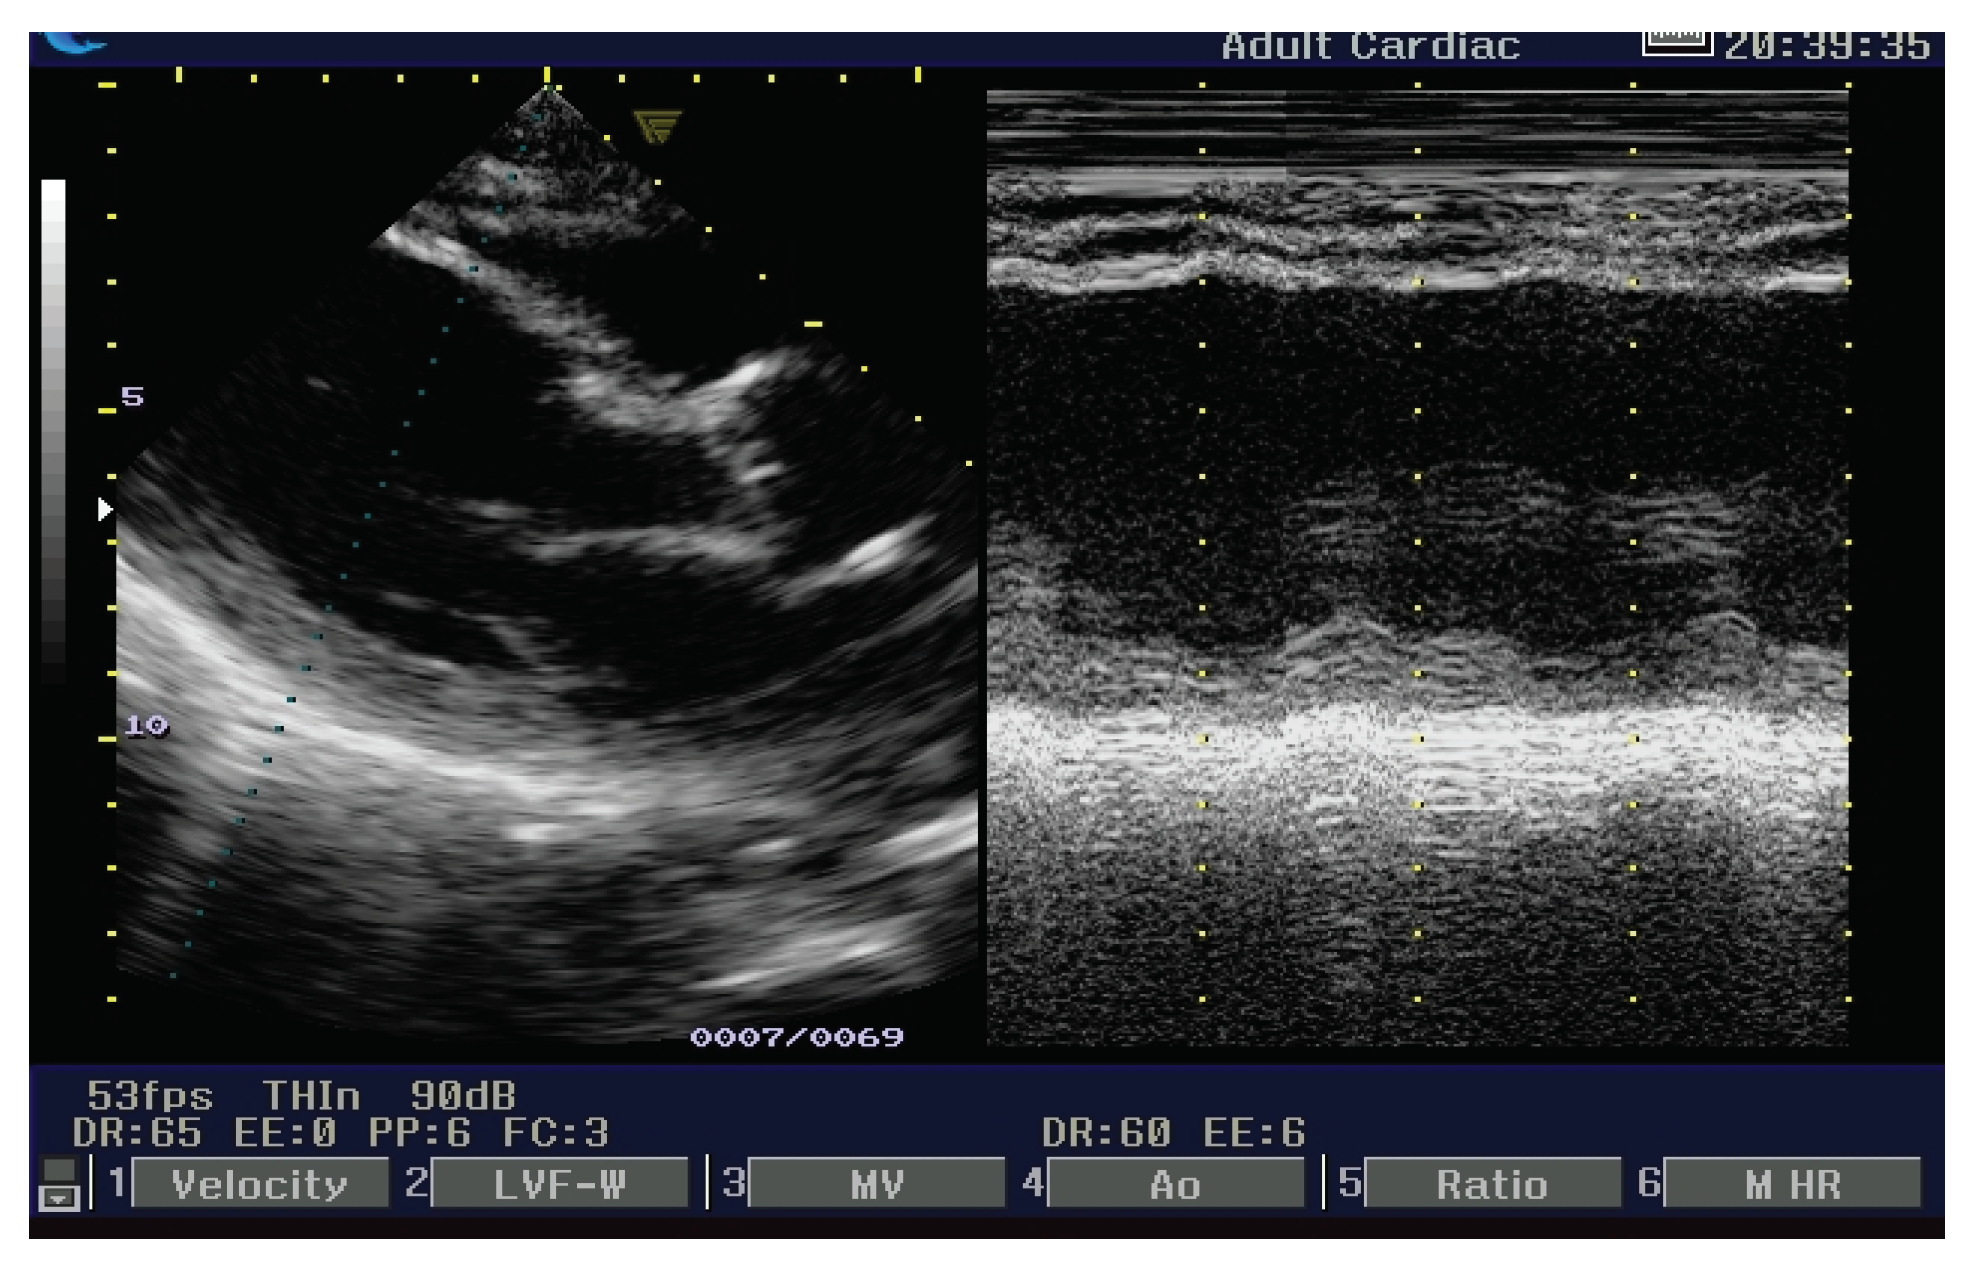
3.2.2. Echocardiogram
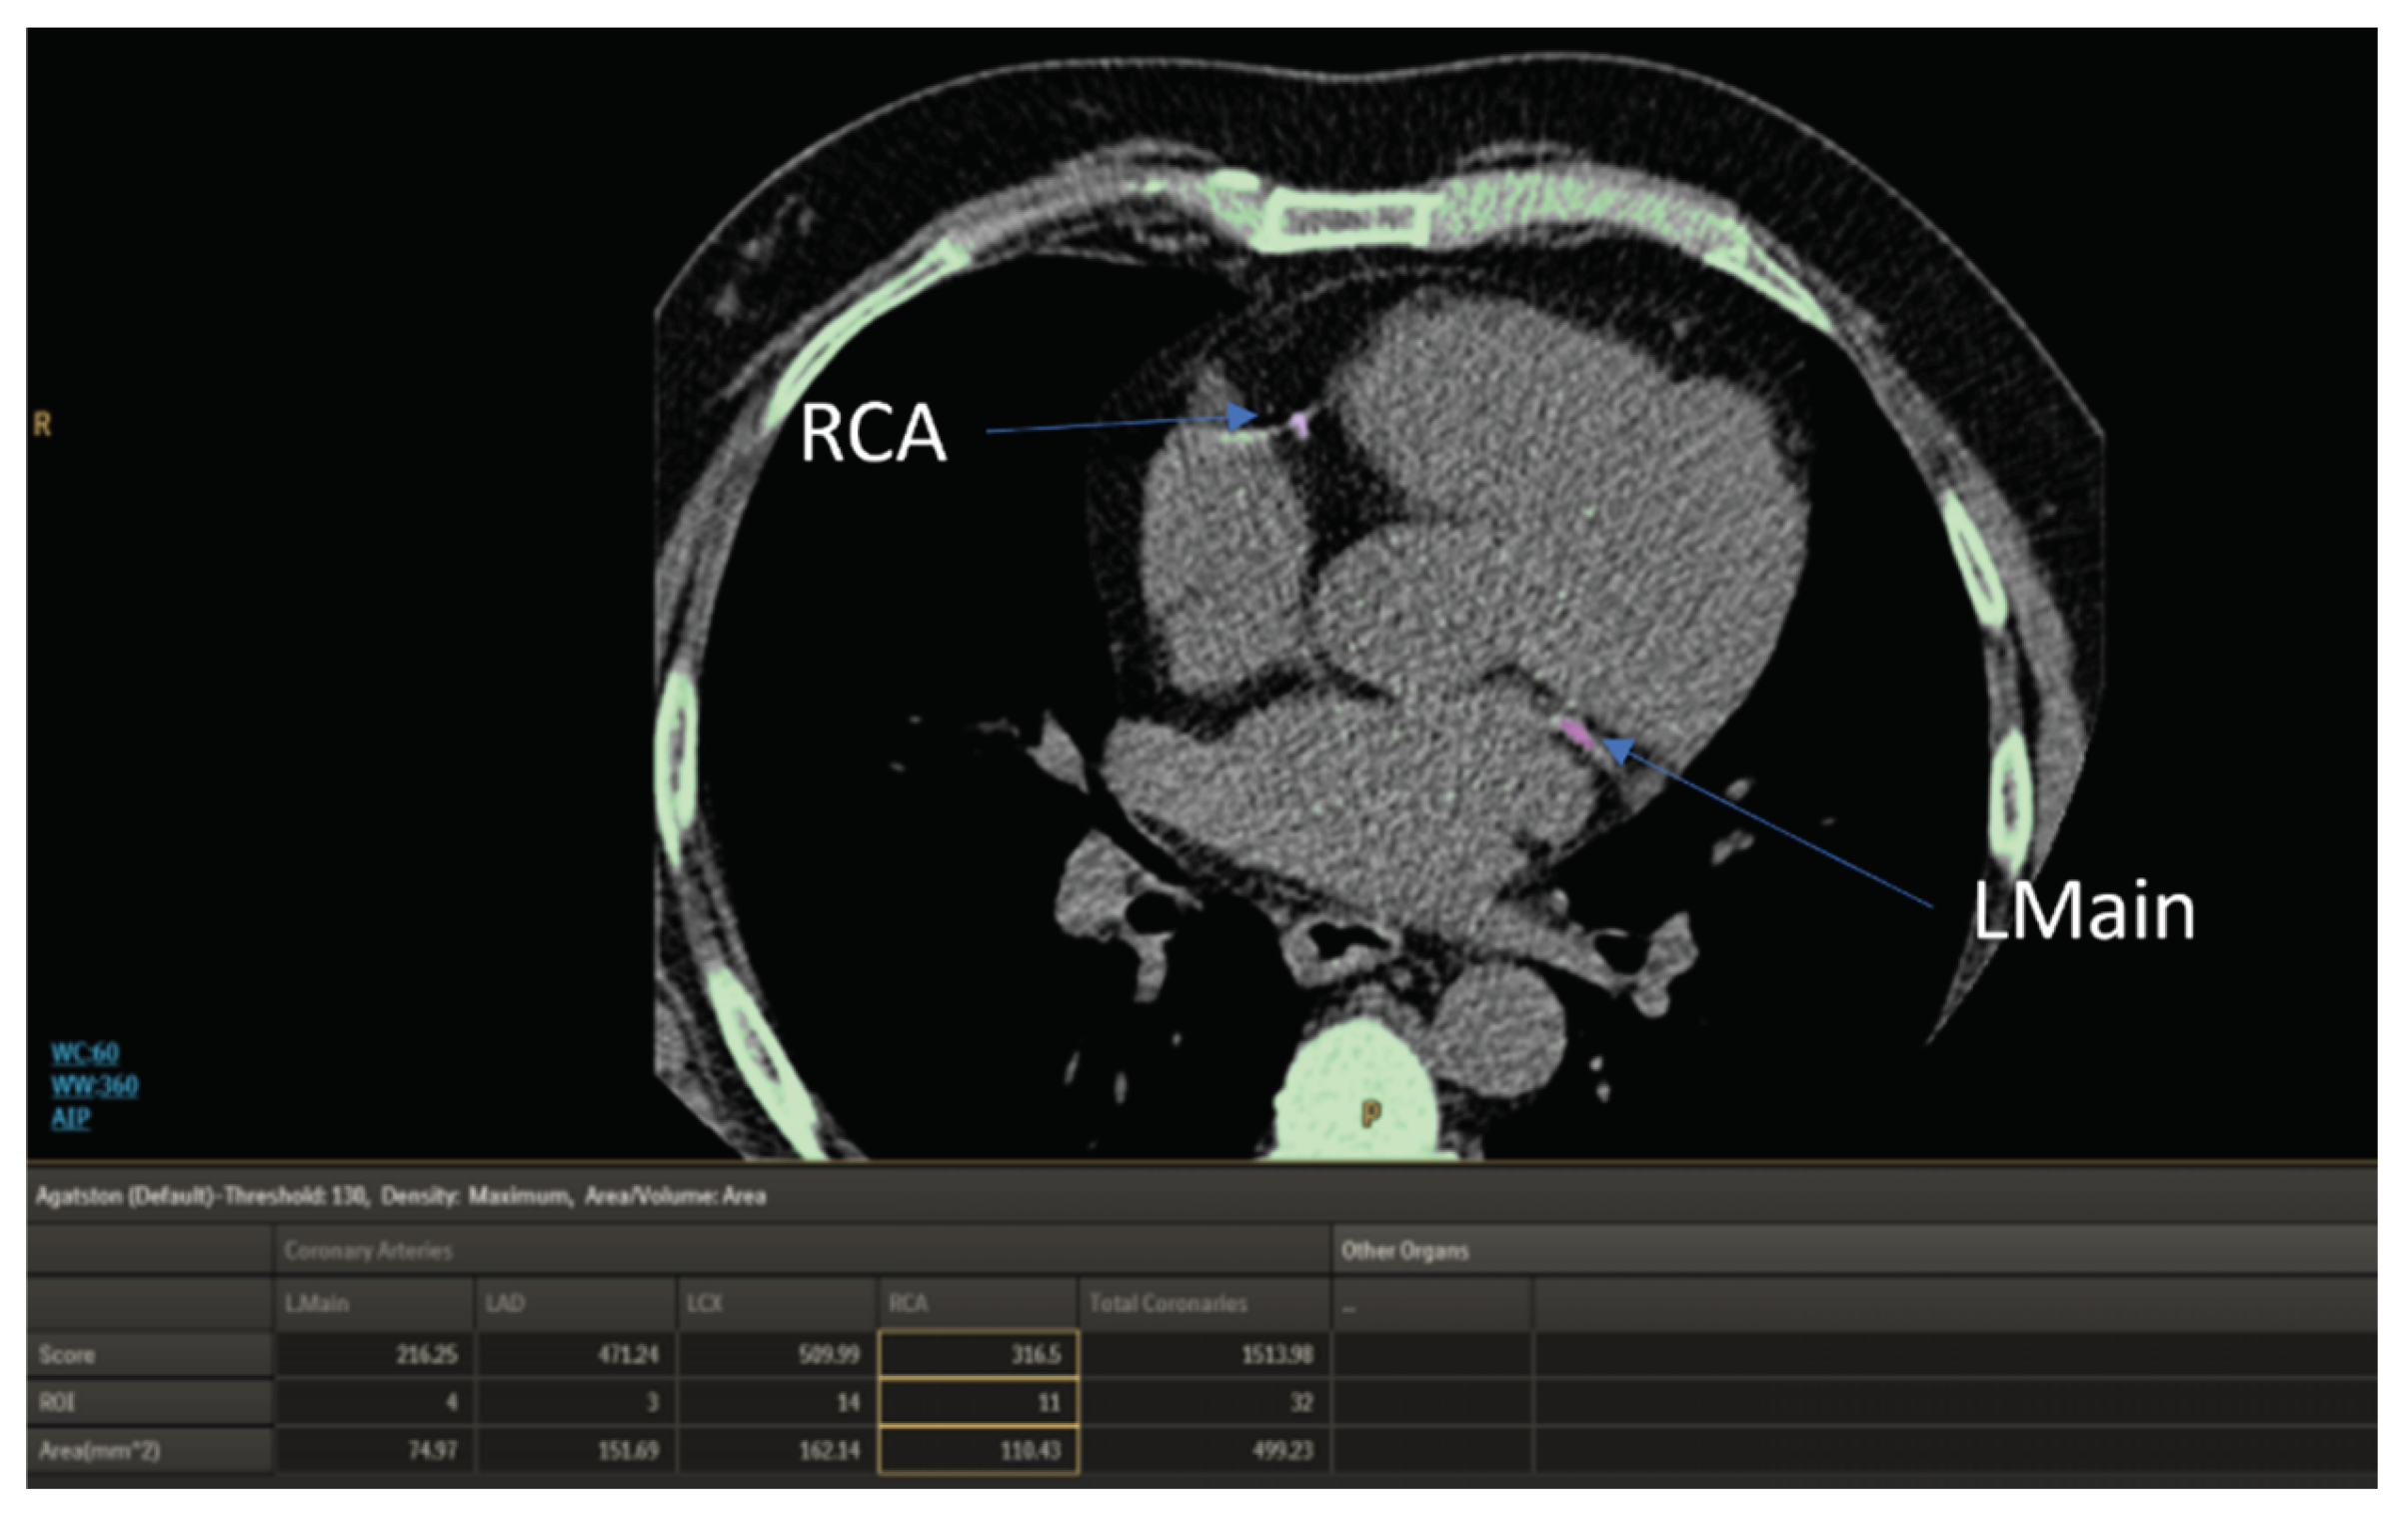
3.2.3. Non Contrast Enhanced Computed Chest Tomography, NCECCT
| Scoring | Interpretation |
| 0 | no measurable calcified plaque |
| 1-10 | Minimal |
| 11-100 | Mild |
| 100-400 | Moderate |
| > 400 | Extensive |
3.2.4. Biochemistry Results
3.2.5. DS-14 Results
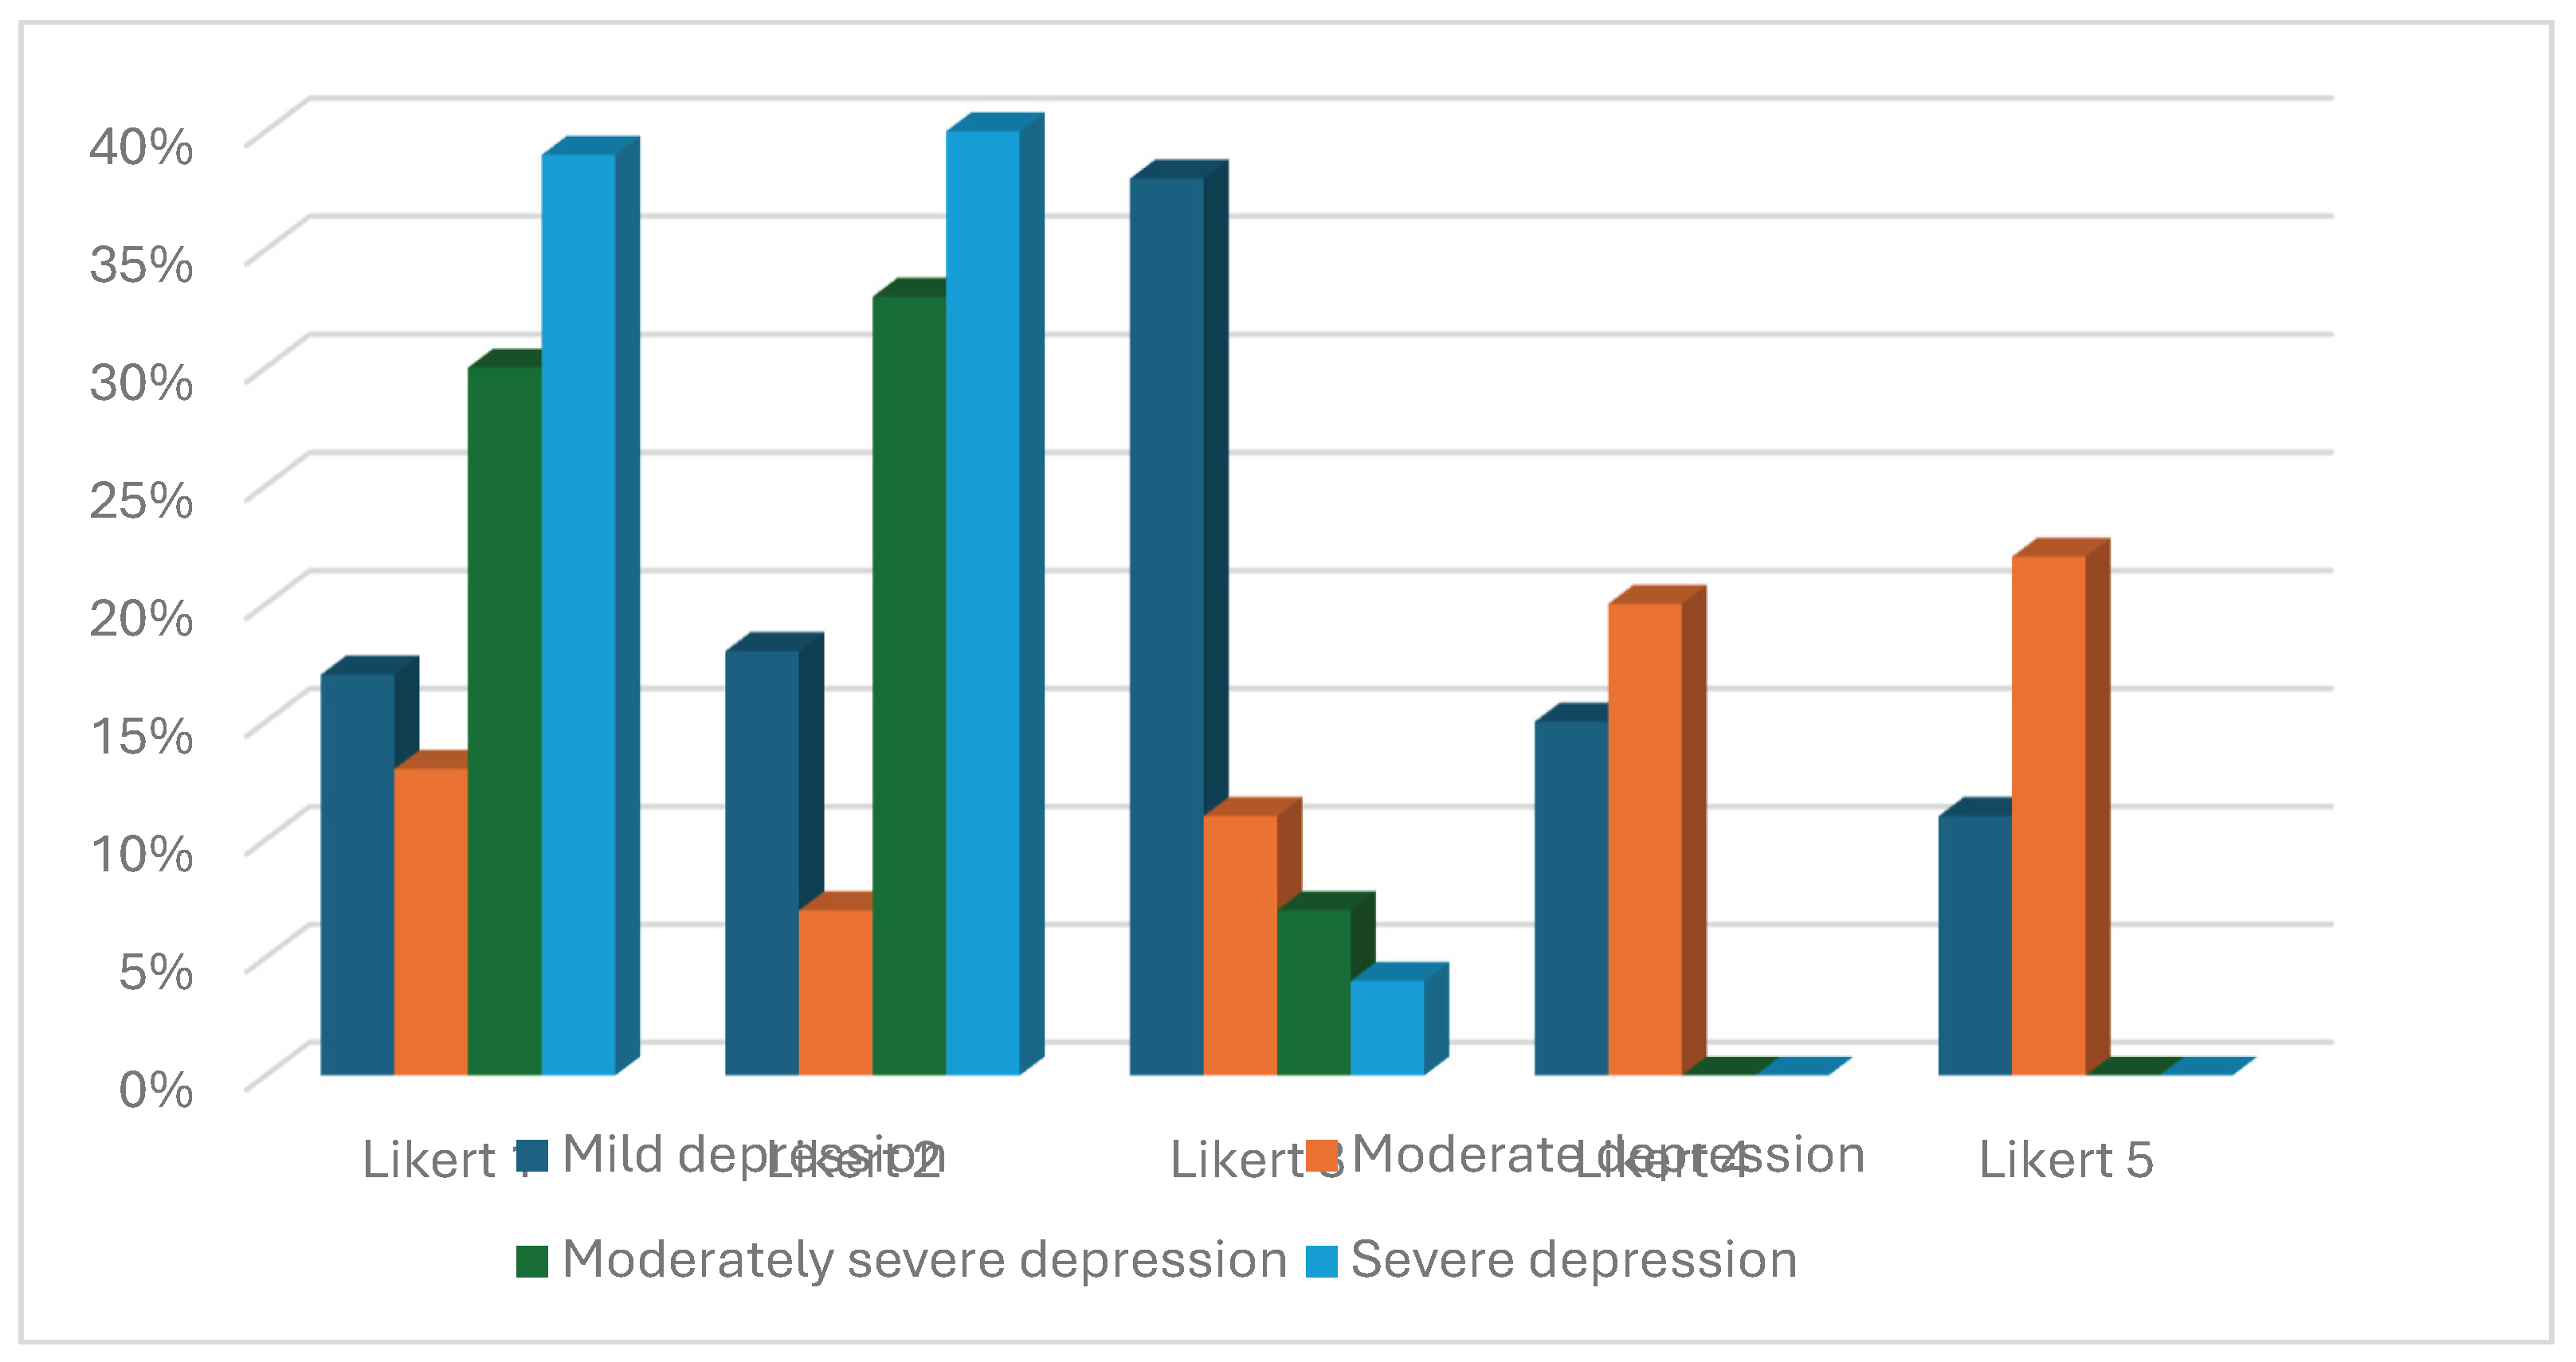
3.2.6. PHQ-9 Results
3.2.7. SWWS Results
3.2.8. The study Objectives
Discussion
4.1. Age
4.2. Gender
4.3. Education
4.4. Rural/Urban Environment
4.5. LDL-Cholesterol
4.6. Hs CRP and Microalbuminuria
4.7. Traditional Cardiovascular Risk Factors
4.8. Depression
4.9. SWWS Questionnaire Results
4.9.1. Age
4.9.2. Gender
4.9.3. Education
4. Conclusions
Author Contributions
Funding
Institutional Review Board Statement
Informed Consent Statement
Acknowledgments
Conflicts of Interest
References
- Aggarwal, A.; Srivastava, S.; Velmurugan, M. Newer perspectives of coronary artery disease in young. World. J. Cardiol. 2016, 8, 728–734. [Google Scholar] [CrossRef] [PubMed]
- Yang, W.X.; Yang, Z.; Wu, Y.J.; Qiao, S.B.; Yang, Y.J.; Chen, J.L. Factors associated with coronary artery disease in young population (age ≤ 40): Analysis with 217 cases. Chin. Med. Sci. J. 2014, 29, 38–42. [Google Scholar] [CrossRef] [PubMed]
- Klein, L.W. Acute coronary syndromes in young patients with angiographically normal coronary arteries. Am. Heart. J. 2006, 152, 607–610. [Google Scholar] [CrossRef] [PubMed]
- Bossard, M.; Latifi, Y.; Fabbri, M.; Kurman, R.; Brinkert, M.; Wolfrum, M.; Berte, B.; Cuculi, F.; Toggweiler, F.; Kobza, R.; et al. Increasing mortality from premature coronary artery disease in women in the rural United States. JAHA 2020, 9, e–015334. [Google Scholar] [CrossRef] [PubMed]
- Denollet, J. Type D personality. A potential risk factor refined. J. Psychosom. Res. 2000, 49, 256–266. [Google Scholar] [CrossRef]
- Pedersen, S.; Denollet, J. Type D personality, cardiac events and impaired quality of life: A review. Eur. J. Prev. Cardiol. 2003, 10, 241–248. [Google Scholar] [CrossRef] [PubMed]
- Denollet, J.; Gidron, Y.; Vrints, C.; Conraads, V.M. Anger,suppressed anger and risk of adverse events in patients with coronary artery disease. Am. J. Card. 2011, 105, 1555–1560. [Google Scholar] [CrossRef] [PubMed]
- Steptoe, A.; Malloy, G.J. Personality and heart disease. Heart 2007, 93, 783–784. [Google Scholar] [CrossRef] [PubMed]
- Dahlen, A.D.; Miguet, M.; Schioth, H.B.; Rukh, G. The influence of personality on the risk of myocardial infarction in UK Biobank cohort. Sci. Rep. 2022, 12, 6706. [Google Scholar] [CrossRef]
- Wang, L.; Shi, W.; Li, Y.; Ang, Y.; Jing, P.; Zhang, B.; Cao, X.; Loerbroks, A.; Zhang, M. Longitudinal associations of work stress with changes in quality of life among patients after acute coronary syndromes -a hospital based study. IJERPH 2022, 19, 17018. [Google Scholar] [CrossRef]
- Jaskanval, D.S.; Prasad, M.; Mackram, F.E.; Zhang, M.; Widmer, R.J. Association between work related stress and coronary heart disease: A review of prospective studies through the job strain, effort-reward balance and organizational justice models. JAHA 2018, 7, e0008073. [Google Scholar]
- Wang, C.; Le-Scherban, F.; Taylor, J.; Blotcher, E.; Allison, M.; Michael, Y.L. Associations of job strain,stresfull life events and social strain with coronary heart disease in the Women’s health initiative observational study. JAHA 2021, 10, e017780. [Google Scholar] [CrossRef] [PubMed]
- Lavigne-Robichaud, M.; Trudel, X.; Talbot, D.; Milot, A.; Gilbert-Ouimet, M.; Vézina, M.; Laurin, D.; Dionne, C.E.; Pearce, N.; Dagenais, G.R.; et al. Psychosocial Stressors at Work and Coronary Heart Disease Risk in Men and Women: 18-Year Prospective Cohort Study of Combined Exposures. Circ. Cardiovasc. Qual. Outcomes. 2023, 16, e009700. [Google Scholar] [CrossRef] [PubMed]
- Della Corte, V.; Todaro, F.; Cataldi, M.; Tuttolomondo, A. Atherosclerosis and Its Related Laboratory Biomarkers. Int. J. Mol. Sci. 2023, 24, 15546. [Google Scholar] [CrossRef]
- Braig, D.; Nero, T.L.; Koch, H.-G.; Kaiser, B.; Wang, X.; Thiele, J.R.; Morton, C.J.; Zeller, J.; Kiefer, J.; Potempa, L.A. Transitional changes in the CRP structure lead to the exposure of pro-inflammatory binding sites. Nat. Commun. 2017, 8, 14188. [Google Scholar] [CrossRef]
- Zhang, W.; Speiser, J.L.; Ye, F.; Tsai, M.Y.; Cainzos-Achirica, M.; Nasir, K.; Herrington, D.M.; Shapiro, M.D. High-sensitivity C-Reactive Protein Modifies the Cardiovascular Risk of Lipoprotein(a): Multi-Ethnic Study of Atherosclerosis. JACC 2021, 78, 1083–1094. [Google Scholar] [CrossRef] [PubMed]
- Denegri, A.; Boriani, G. High sensitivity C reactive protein (hsCRP)and its implications in cardiovascular outcomes Curr. Farm. Des. 2021, 27, 263–275. [Google Scholar] [CrossRef]
- Naidoo, D.P. The link between microalbuminuria, endothelial dysfunction and cardiovascular disease in diabetes. Cardiovasc. J. S. Afr. 2002, 13, 194–199. [Google Scholar] [PubMed]
- Liu, S.; Niu, J.; Wu, S. Urinary albumin-to-creatinine ratio levels are associated with subclinical atherosclerosis and predict CVD events and all-cause deaths: A prospective analysis. BMJ Open 2021, 11. [Google Scholar] [CrossRef]
- Denollet, J. DS14: Standard assessment of negative affectivity, social inhibition, and Type D personality. Psychosom. Med. 2005, 67, 89–97. [Google Scholar] [CrossRef]
- Kroenke, K.; Spitzer, R.L.; Williams, J.B. The PHQ-9: Validity of a brief depression severity measure. J. Gen. Intern. Med. 2001, 16, 606–13. [Google Scholar] [CrossRef] [PubMed]
- Kroenke, K.; Spitzer, R.L.; Williams, J.B. The Patient Health Questionnaire-2: Validity of a Two-Item Depression Screener. Med. Care. 2003, 41, 1284–1292. [Google Scholar] [CrossRef]
- Blais, M.R.; Lachance, L.; Forget, J.; Richer, S.; Dulude, D.M. L’eschelle de satisfaction globale au travail. In Proceedings of the Annual Congress of the Society Quebecoise for Research in Psychology, Trois Riviers, Quebec, Canada; 1991. [Google Scholar]
- Rumberger, J.A. Using noncontrast cardiac CT and coronary artery calcification measurements for cardiovascular risk assessment and management in asymptomatic adults. Vasc. Health. Risk. Manag. 2010, 6, 579–591. [Google Scholar] [CrossRef] [PubMed]
- Wantiyah, W.; Rivani, F.R.P.; Hakam, M. The correlation between religiosity and self-efficacy in patients with coronary heart disease. Belitung Nurs J. 2020, 6. [Google Scholar] [CrossRef]
- Li, X.; Zheng, W.; Li, J.; Lin, Q.; Yang, J.; Huang, S.; Wang, D.; Wang, B. Primary exploration of efficacy of community-family management mode under internet -based mobile terminal monitoring in elderly patients with stable coronary heart disease. J. Health. Eng. 2022, 704. [Google Scholar] [CrossRef] [PubMed]
- Kivimaki, K.; Nyberg, S.T.; Fransson, I.; Heikkila, K.; Alfredsson, L.; Sasini, A.; Clays, E.; De Bquer, D.; Dragano, N.; Ferrie, J.E.; et al. Associations of job strain and lifestyle risk factors with risk of coronarynartery disease: A meta-analysis of individual participant data. CMAJ 2013, 185, 763–769. [Google Scholar] [CrossRef] [PubMed]
- Vogel, B.; Acevedo, M.; Appelman, Y.; Bairey Merz, C.N.; Chieffo, A.; Figtree, G.A.; Guerrero, M.; Kunadian, V.; Lam, C.S.P.; Maas, A.H.E.M.; et al. The Lancet women and cardiovascular disease Commission: Reducing the global burden by 2030. Lancet 2021, 397, 2385–2438. [Google Scholar] [CrossRef]
- Martinho, M. Women more likely to die after heart attack than men.In Proceedings in Heart Failure, Congress of European Society of Cardiology. Topics Heart Failure, Prague, Czechia. 22 May 2023.
- Hosseini, N.; Kaier, T. Gender Disparity in Cardiovascular Disease in the Era of Precision Medicine. JACC Case Rep. 2023, 23. [Google Scholar] [CrossRef] [PubMed]
- Cenko, E.; Manfrini, O.; Fabin, N.; Dorobantu, M.; Milicic, D. Clinical determinants of ischemic heart disease in Eastern Europe. Lancet 2023, 33. [Google Scholar] [CrossRef]
- Schopfer, D. Rural health disparities in chronic heart disease. Prev. Med. 2021, 152, 106782. [Google Scholar] [CrossRef]
- Loccoh, E.C.; Maddox, J.; Wang, Y.; Kazi, D.S.; Yah, R.W.; Wadhera, R.K. Rural-urban disparities in outcome of myocardial infarction, heart failure abd stroke in United States. JACC 2022, 79, 267–279. [Google Scholar] [CrossRef]
- Yung, E.; Kong, S.Y.; Ro, Y.S.; Shin, S.D. Serum Cholesterol Levels and Risk of Cardiovascular Death: A Systematic Review and a Dose-Response Meta-Analysis of Prospective Cohort Studies, Int. J. Environ. Res. Public Health 2022, 19, 8272. [Google Scholar] [CrossRef]
- Bienstock, S.; Lee, S.E.; Blankstein, R.; Leipsic, J.; Patel, K.; Narula, J.; Chandrashekhar, Y.S.; Fuster, V.; Shaw, L.J. Systemic inflammation and high sensitivity C reactive protein and atherosclerotic plaque progression. JACC 2024, 17, 212–213. [Google Scholar] [CrossRef]
- Barzilay, J.I.; Farag, Y.M.K.; Durthaler, J. Albuminuria-an underappreciated risk factor for cardiovascular disease. JAHA 2024, 13. [Google Scholar] [CrossRef]
- Brown, J.C.; Gerhardt, T.E.; Kwon, E. Risk Factors for Coronary Artery Disease. [Updated 2023 Jan 23]. In: StatPearls [Internet]. Stat Pearls Publishing, Treasure Island, Finland. 2024. Available from: https://www.ncbi.nlm.nih.gov/books/NBK554410/.
- Strudwick, J.; Gayed, M.; Deady, M.; Haffar, S.; Mobbs, S.; Malik, A.; Akhtar, A.; Braund, T.; Bryant, R.A.; Harvey, S.B. Workplace mental health screening: A systematic review and meta-analysis. Occup. Environ. Med. BMJ 2023, 0, 1–16. [Google Scholar] [CrossRef]
- Deady, M.; Collins, D.A.J.; Johnston, D.A.; Glozier, N.; Calvo, R.A.; Christensen, H.; Harvey, M. The impact of depression, anxiety and comorbidity on occupational outcomes. Occup. Med. 2022, 72, 17–24. [Google Scholar] [CrossRef]
- Hartman, R.; Barber, E. Women in the workforce. The effect of gender on occupational self-efficacy, work engagement and career aspirations. Gend 2020. [Google Scholar] [CrossRef]

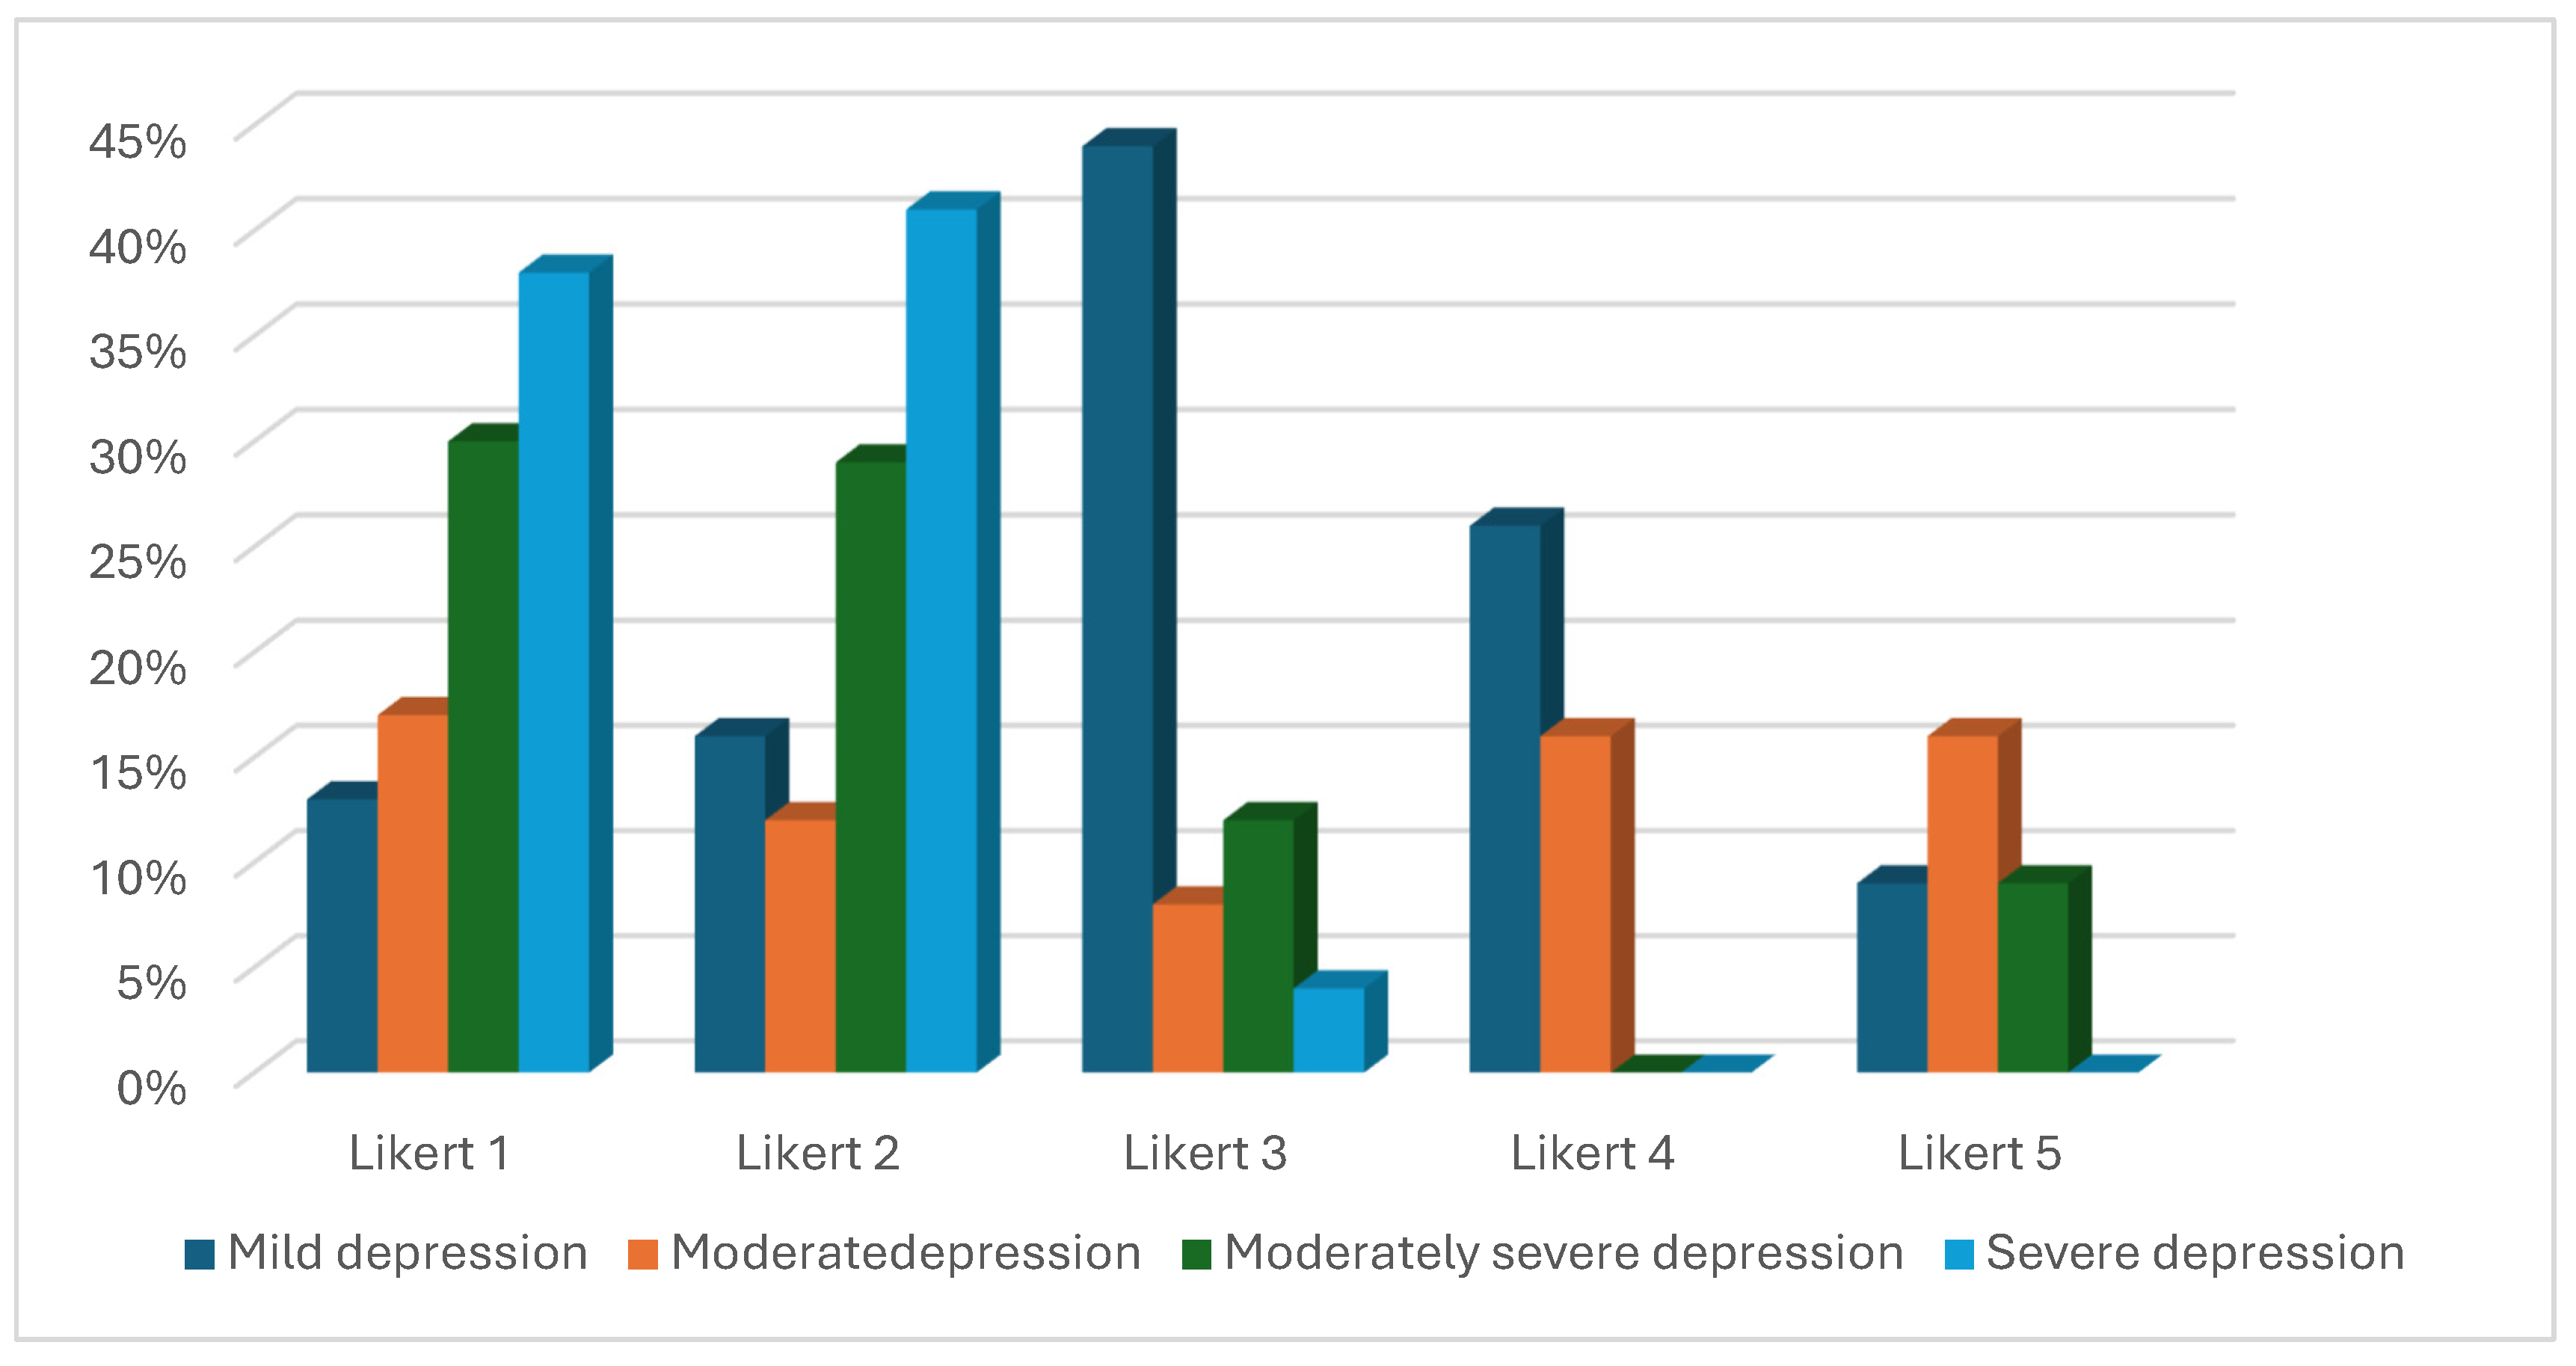
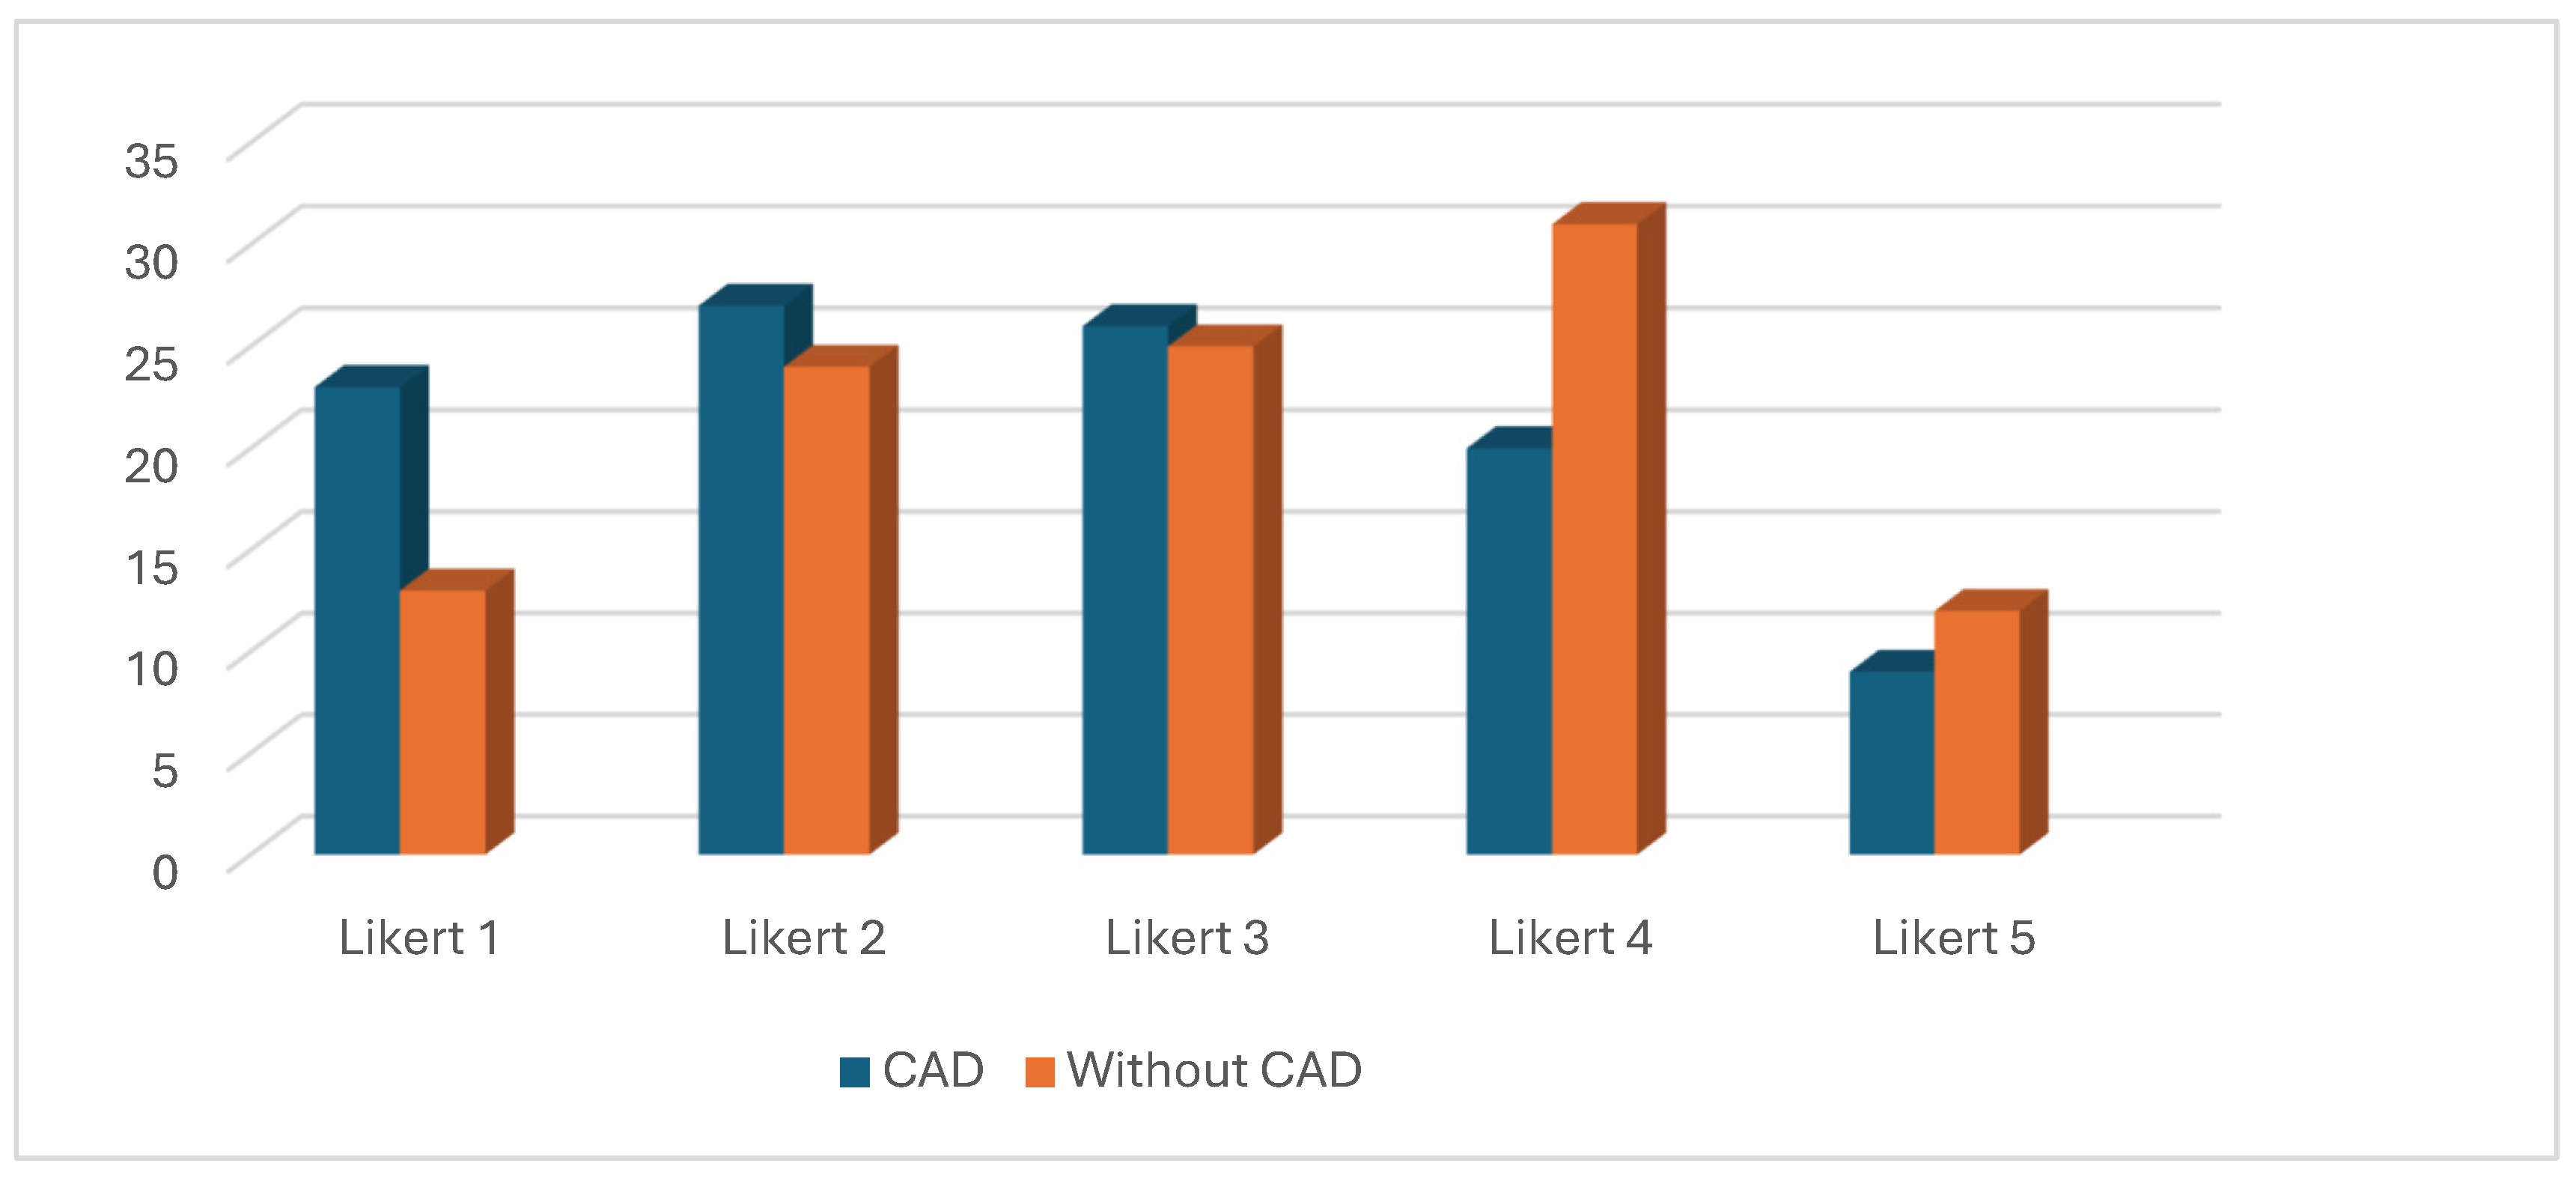
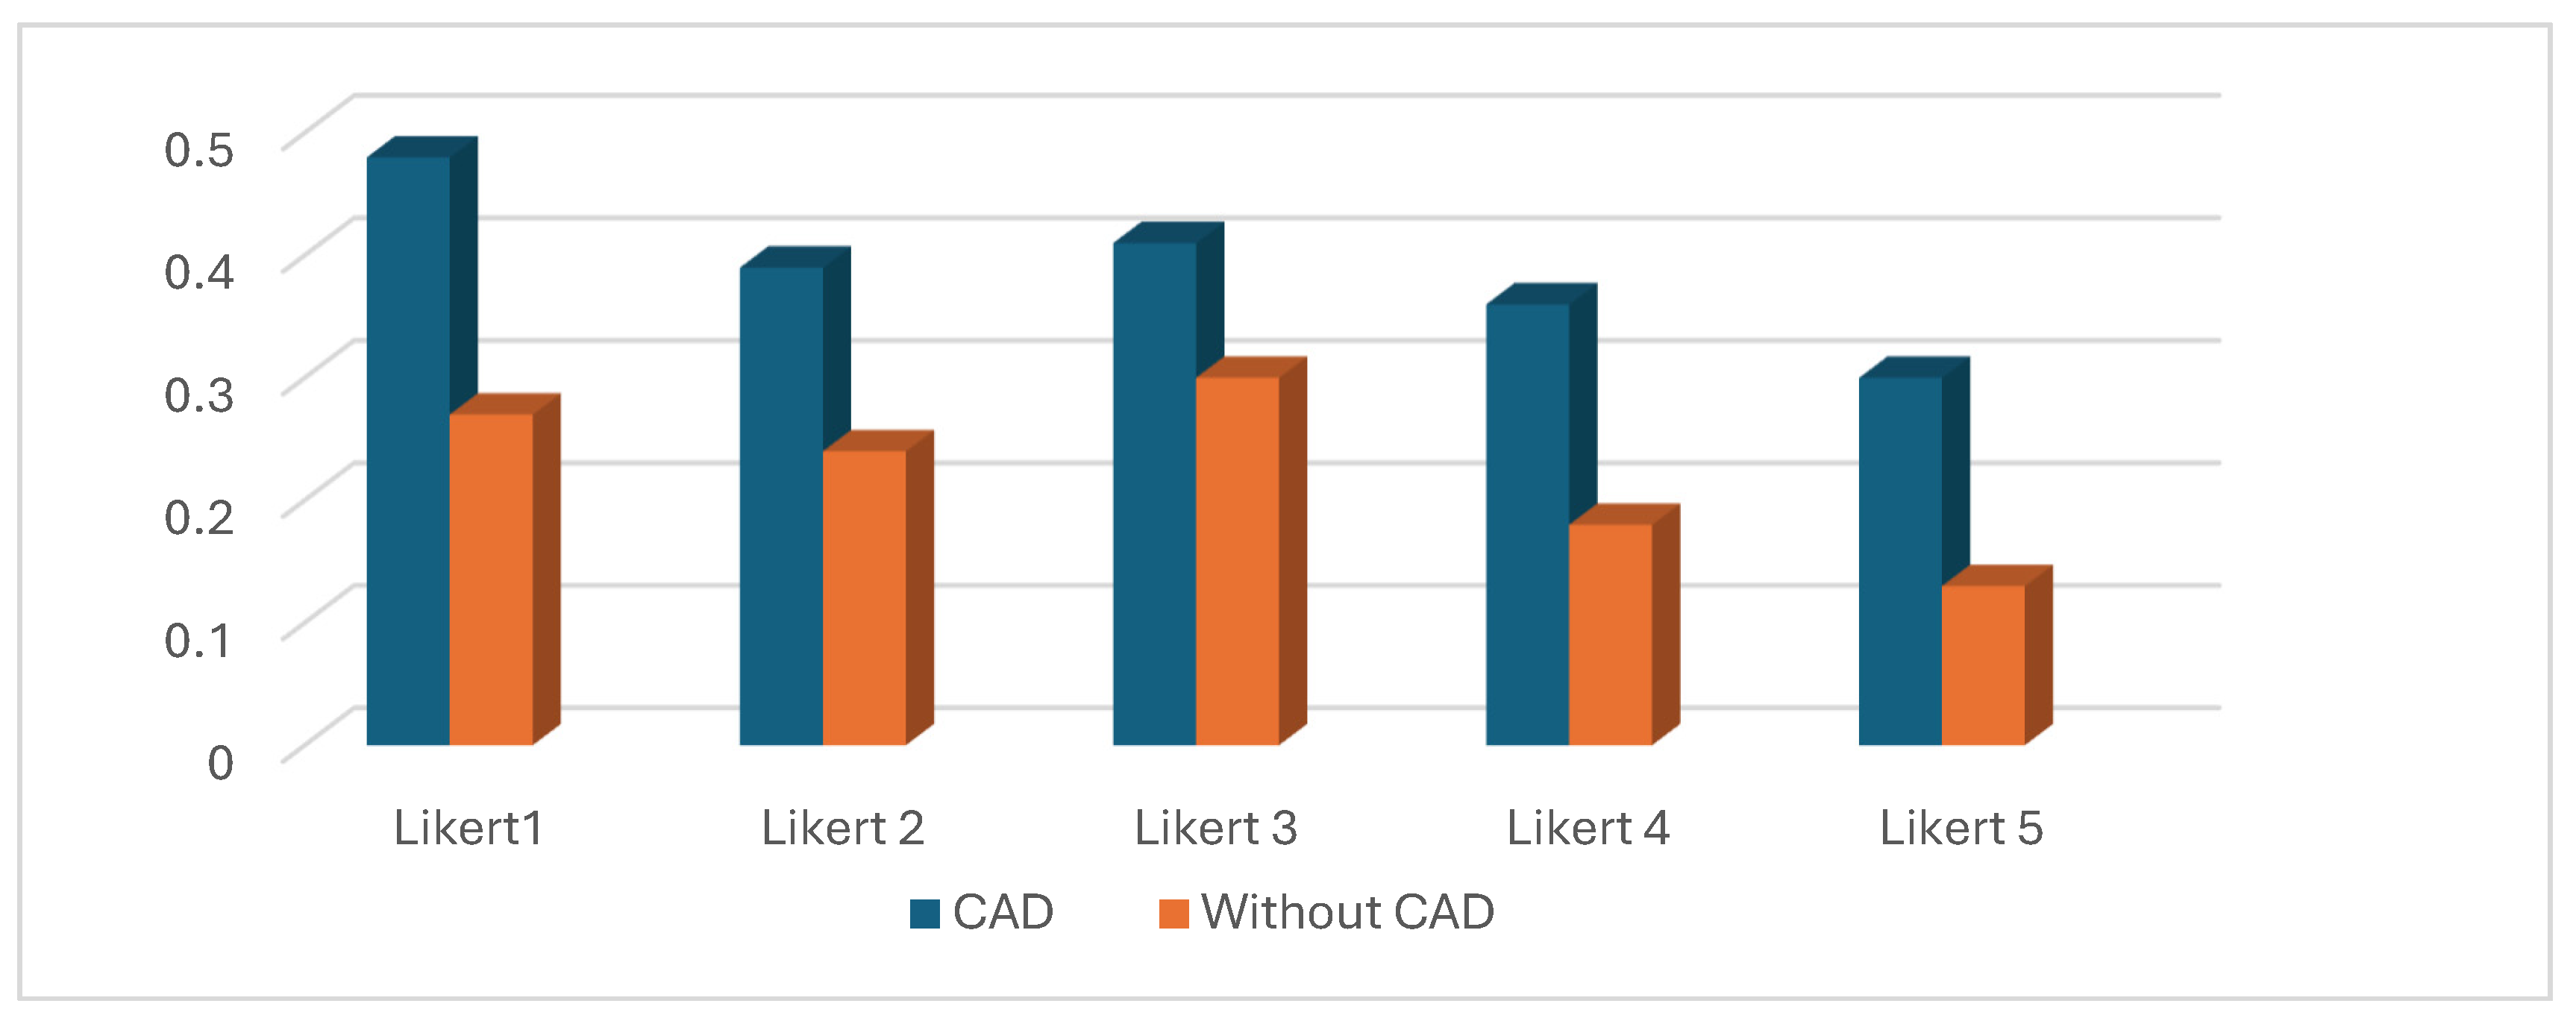
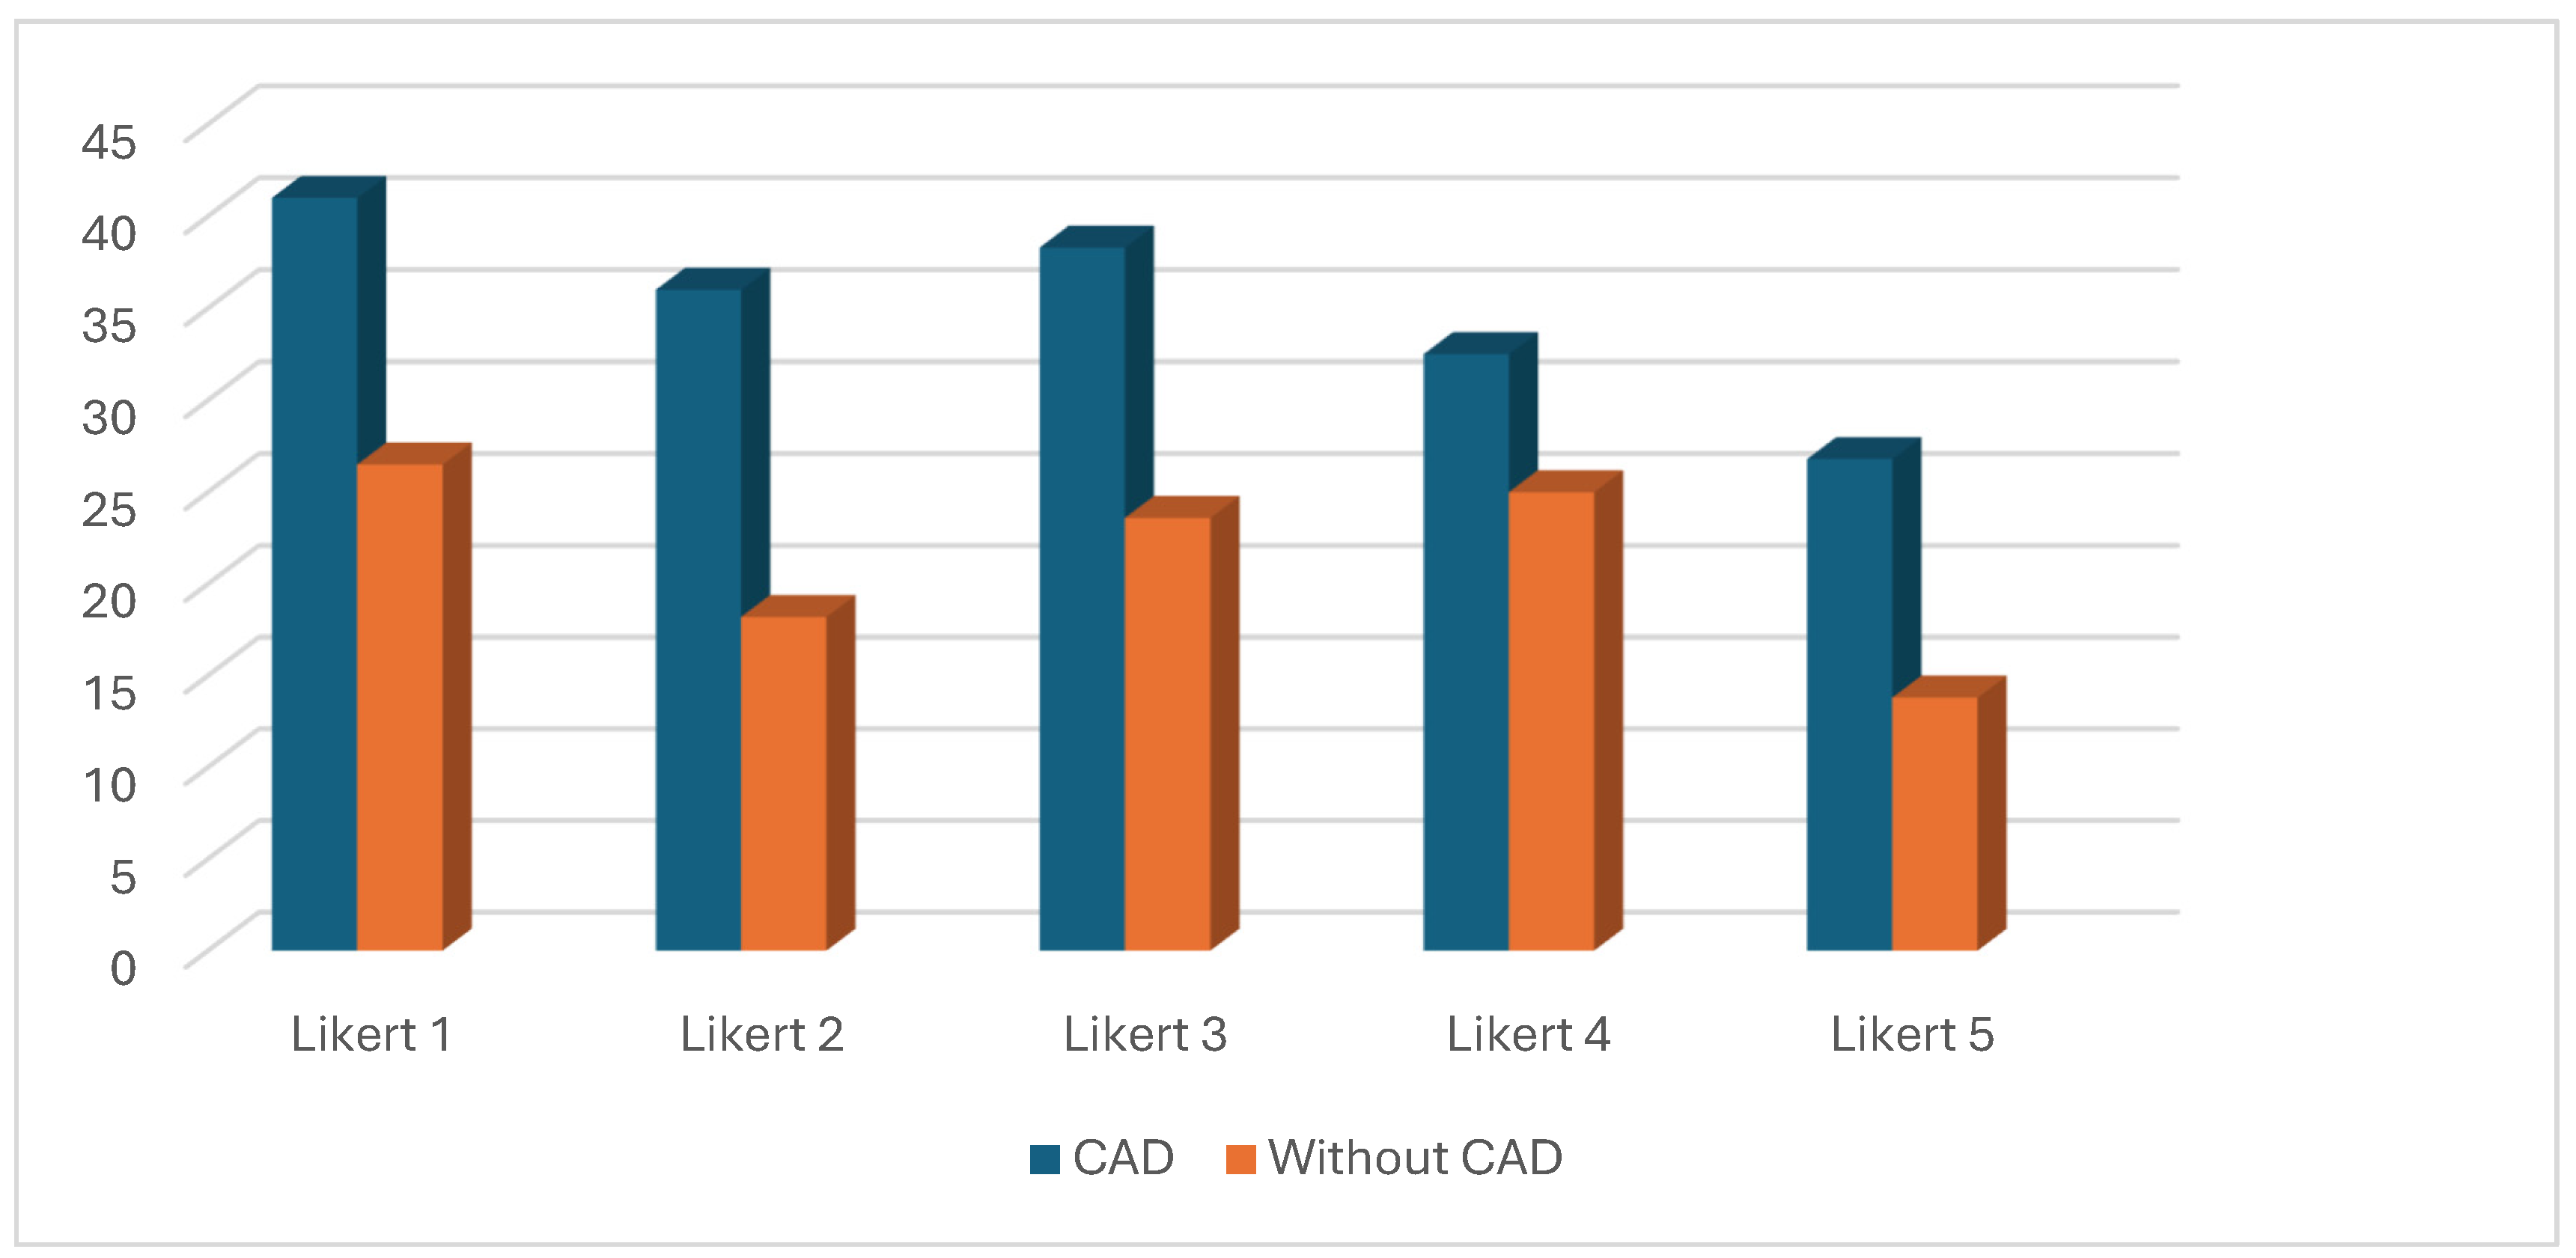
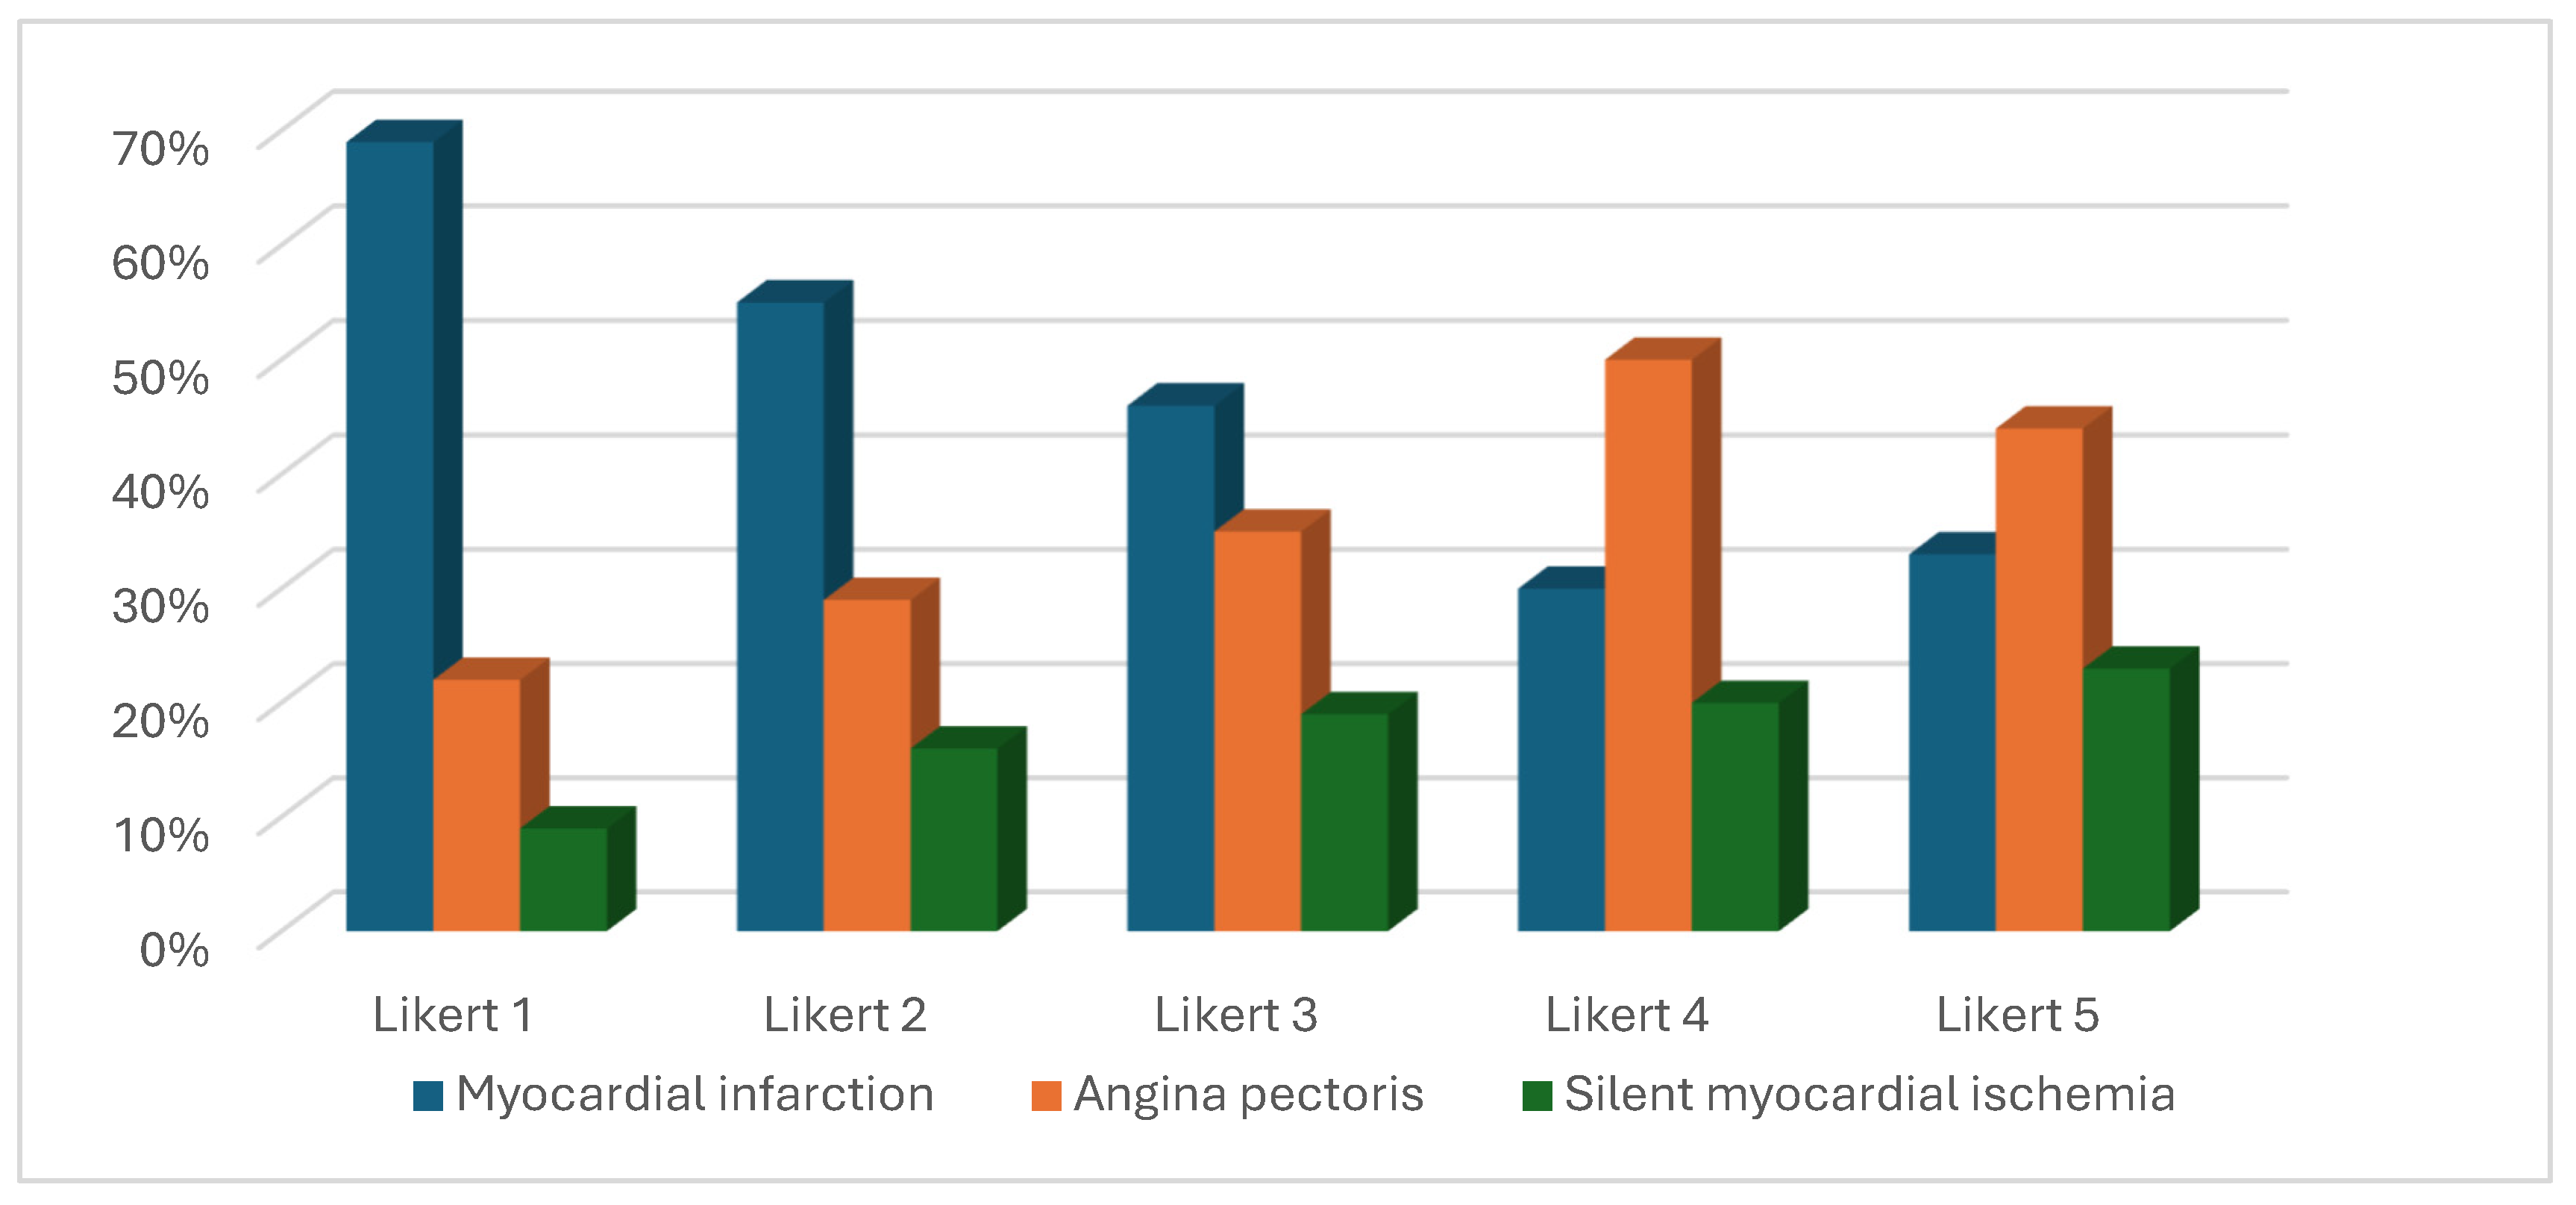
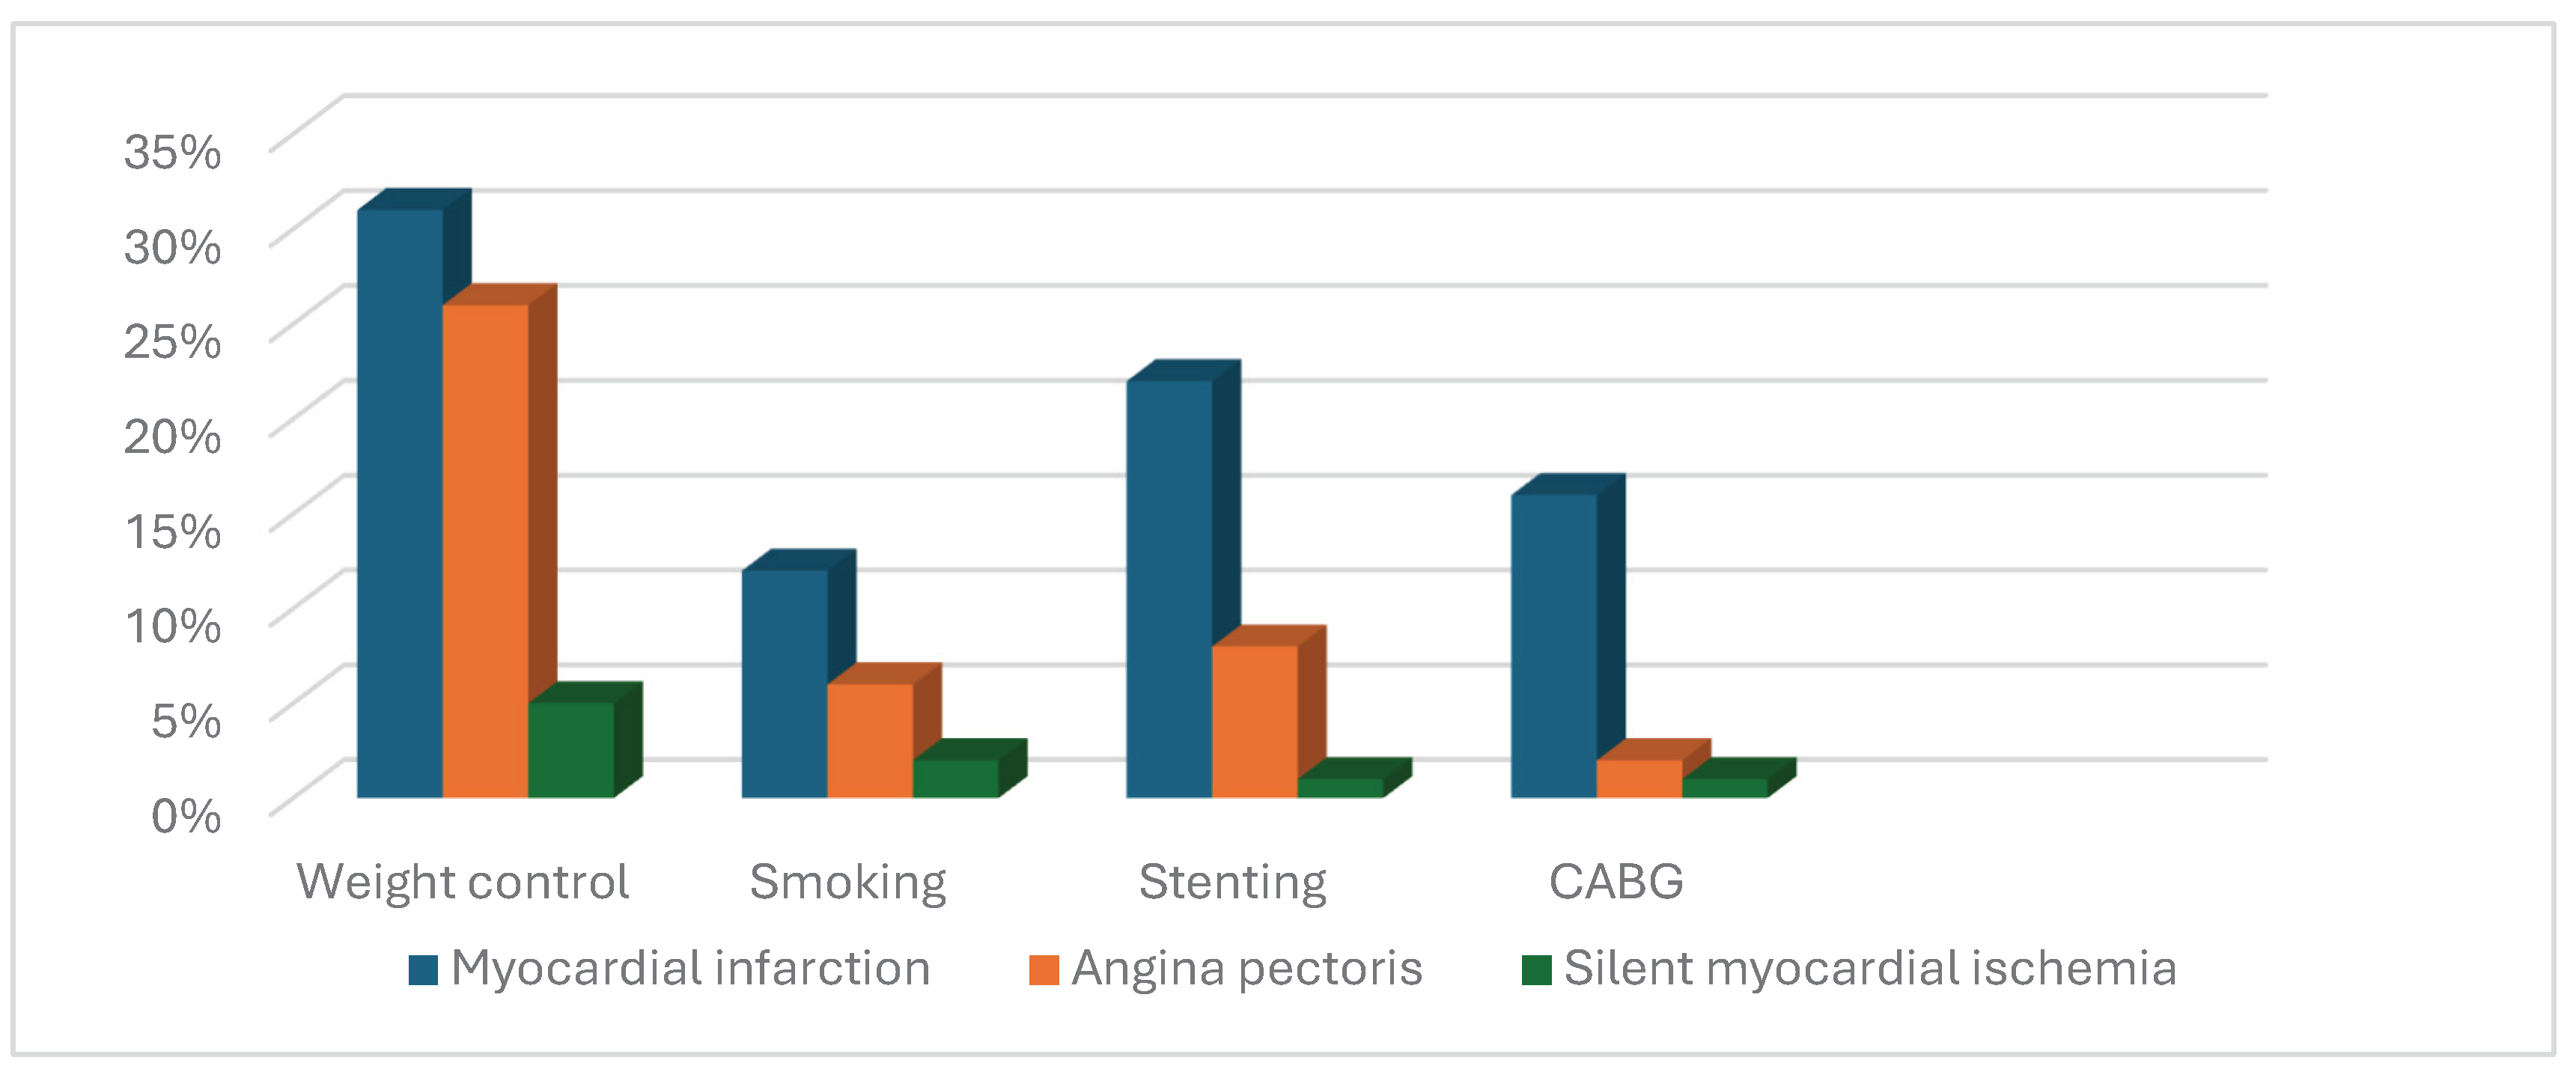
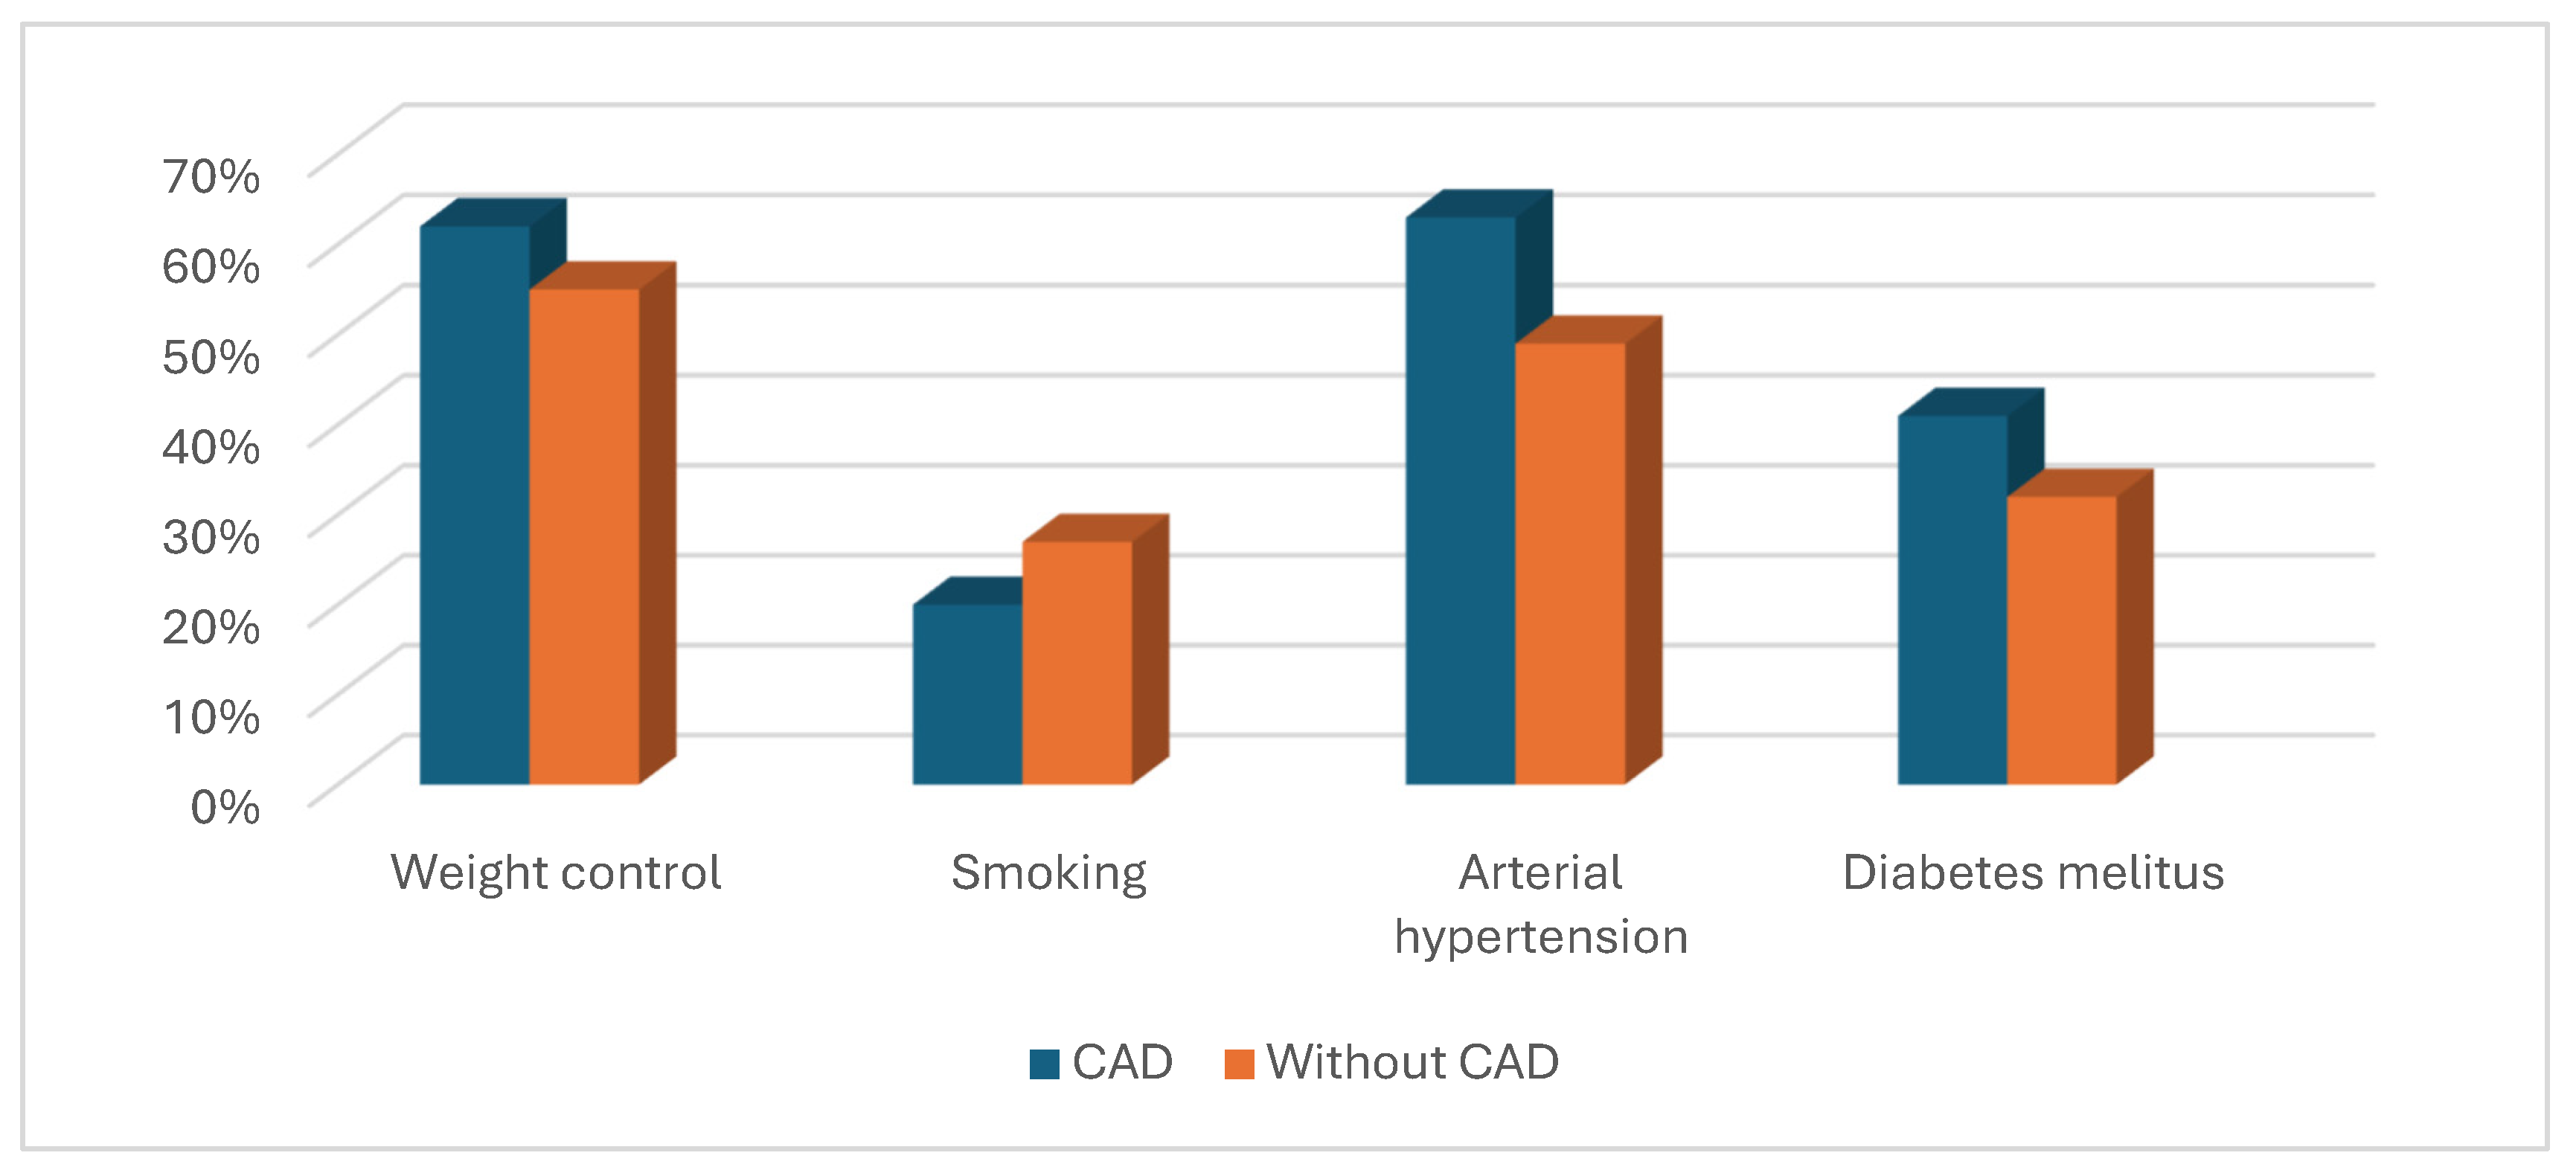
| Objectives | Objectives description |
|---|---|
| 1 | establish the relationship between job strain and outcome of CAD patients/without CAD patients |
| 2 | discover the role of hs CRP and microalbuminuria, as mediators in this relationship |
| 3 | find out the vulnerable CAD patients ( significant scores at job strain assessment) |
| 4 | active interventions for cardiovascular events prevention |
| Inclusion criteria | |
|---|---|
| 1 | Age ≥ 18 years |
| 2 | Informed consent and consent for publication |
| 3 | Adherence to medical recommendations |
| Exclusion criteria | |
|---|---|
| 1 | Evolutive cancer |
| 2 | Autoimmune disorder |
| 3 | Pregnancy |
| 4 | Difficult transportation to Cardiology Office |
| 5 | Acute myocardial infarction |
| 6 | Unstable angina pectoris(de novo/worsened) |
| Affirmation |
|---|
| a. ‘’generally speaking, my work corresponds with what I want in my life” |
| b. “work conditions are excellent” |
| c. “I am satisfied by my work” |
| d. “I achieved important things wanted by me at work, till now” |
| e. “if I could change something at work place, I woudn’t change anything”. |
| Likert score | Patient’s answer |
|---|---|
| 1 | “ totally disagree” |
| 2 | “ partially disagree” |
| 3 | “ almost agree” |
| 4 | “ agree” |
| 5 | “ totally agree” |
| Continuos variables and categorical data | Total (210) | With CAD (105) | Without CAD (105) | p-Value |
|---|---|---|---|---|
| Age, years, median (IQR) | 60 (22) | 69 (16) | 52 (18) | 0.01 |
| Sex Female, n (%) | 130 (61.9) | 58 (55.2) | 74 (70.5) | 0.03 |
| Education n (%) | 1. Elementary school 42 (20) 2.High school 128 (61) 3. Higher education 40 (19) |
1. Elementary school 28 (26.6) 2. High school 59 (56.2) 3. Higher education 18 (17.2) |
1. Elementary school 14 (13.3) 2. High school 69 (65.7) 3.Higher education 22 (21) |
0.04 |
|
Rural n (%) Urban n (%) |
126 (60) 84 (40) |
62 (59) 43 (41) |
64 (61) 41 (39) |
0.032 |
| Total cholesterol (mg/dl) median (IQR) | 248 (55) | 260 (59) | 246 (52) | 0.16 |
| LDL cholesterol (mg/dl) median (IQR) | 182 (61) | 186 (52) | 177.5 (59.75) | 0.03 |
| hsCRP (mg/dl) median (IQR) | 0.48 (0.27) | 0.38 (0.25) | 0.22 (0.26) | 0.002 |
| Microalbuminuria/24 hours(mg/dl) median (IQR) | 29 (19) | 36.5 (20) | 21.4 (14.3) | 0.003 |
| Smoking n (%) | 50 (23.8) | 21 (20) | 29 (27.6) | 0.032 |
| Obesity n (%) | 124 (59) | 66 (62.8) | 58 (55.2) | 0.04 |
| Arterial hypertension n (%) | 119 (56.6) | 67 (63.8) | 52 (49.5) | 0.03 |
| Diabetes mellitus n (%) | 77 (36.6) | 43 (41) | 34 (32.4) | 0.02 |
| Likert 1 | Total (36) | With CAD (23) | Without CAD (13) | p-Value |
|---|---|---|---|---|
| Age median (IQR) | 59 (21) | 66 (18) | 50 (12.75) | 0.007 |
| Sex F n (%) | 26 (72.2) | 16 (69.5) | 10 (76.9) | 0.03 |
| Elementary school n (%) | 11 (30.5) | 10 (43.4) | 1 (7.7) | 0.03 |
| High school n (%) | 20 (55.5) | 11 (47.8) | 9 (69.2) | 0.042 |
| Higher education n (%) | 5 (13.8) | 2 (8.7) | 3 (23) | 0.045 |
| hsCRP (mg/dl) median (IQR) | 0.41 (0.47) | 0.48(0.29) | 0.27 (0.14) | 0.002 |
|
Microalbuminuria/24hours (mg/dl) median (IQR) |
29 (22.57) | 41 (18) | 26.5 (9.1) | 0.003 |
| Likert 2 | Total (51) | With coronary heart disease (27) | Without coronary heart disease (24) | p-Value |
|---|---|---|---|---|
| Age median (IQR) | 58 (22) | 67 (17) | 53 (26.75) | 0.008 |
| Sex F n (%) | 31 (60.7) | 15 (55.5) | 16 (66.6) | 0.032 |
| Elementary school n (%) | 12 (23.5) | 9 (33.3) | 3 (12.5) | 0.025 |
| High school n (%) | 33 (64.7) | 15 (55.5) | 18 (75) | 0.031 |
| Higher education n (%) | 6 (11.7) | 3 (11.1) | 3 (12.5) | 0.04 |
| hsCRP (mg/dl) median (IQR) | 0.29 (0.42) | 0.39 (0.24) | 0.24 (0.14) | 0.003 |
|
Microalbuminuria/24hours (mg/dl) median (IQR) |
26 (14.2) | 36 (18.3) | 18.2 (15.6) | 0.006 |
| Likert 3 | Total (51) | With CAD (26) | Without CAD (25) | p-Value |
|---|---|---|---|---|
| Age median (IQR) | 64 (19.7) | 69.5 (11) | 52 (16.2) | 0.004 |
| Sex F n (%) | 32 (62.7) | 14 (53.8) | 18 (72) | 0.04 |
| Elementary school n (%) | 11 (21.5) | 6 (23) | 5 (20) | 0.045 |
| High school n (%) | 33 (64.5) | 18 (69.2) | 15 (60) | 0.041 |
| Higher education n (%) | 7 (13.7) | 2 (7.7) | 5 (20) | 0.036 |
| hsCRP (mg/dl) median (IQR) | 0.37 (0.31) | 0.41 (0.15) | 0.3 (0.1) | 0.004 |
|
Microalbuminuria/24hours (mg/dl) median (IQR) |
34 (17.35) | 38.3 (14.5) | 23.6 (7.6) | 0.005 |
| Likert 4 | Total (51) | With CAD (20) | Without CAD (31) | p-Value |
|---|---|---|---|---|
| Age median (IQR) | 59 (25.5) | 71 (15.5) | 51 (17) | 0.009 |
| Sex F n (%) | 32 (62.7) | 8 (40) | 24 (77.4) | 0.03 |
| Elementary school n (%) | 5 ( 9.8) | 1 (5) | 4 (12.9) | 0.041 |
| High school n (%) | 31 (60.7) | 10 (50) | 21 (67.7) | 0.036 |
| Higher education n (%) | 15 (29.4) | 9 (45) | 6 (19.3) | 0.024 |
| hsCRP (mg/dl) median (IQR) | 0.27 (0.28) | 0.36 (0.17) | 0.18 (0.09) | 0.004 |
|
Microalbuminuria/24hours (mg/dl) median (IQR) |
24.6 (16.5) | 32.5 (20.7) | 25 (14.8) | 0.005 |
| Likert 5 | Total (21) | With CAD (9) | Without CAD (12) | p-Value |
|---|---|---|---|---|
| Age median (IQR) | 63 (17.75) | 67 (18) | 59 (30.75) | 0.008 |
| Sex F n (%) | 11 (52.3) | 5 (55.5) | 6 (50) | 0.04 |
| Elementary school n (%) | 3 (14.3) | 2 (22.2) | 1(8.3) | 0.042 |
| High school n (%) | 11 (52.3) | 5 (55.5) | 6 (50) | 0.04 |
| Higher education n (%) | 7 (33.3) | 2 (22.2) | 5 (41.6) | 0.033 |
| hsCRP (mg/dl) median (IQR) | 0.22 (0.16) | 0.3 (0.09) | 0.13 (0.1) | 0.005 |
|
Microalbuminuria/24hours (mg/dl) median (IQR) |
21.5 (14.2) | 26.8 (25.4) | 13.85 (11.17) | 0.006 |
Disclaimer/Publisher’s Note: The statements, opinions and data contained in all publications are solely those of the individual author(s) and contributor(s) and not of MDPI and/or the editor(s). MDPI and/or the editor(s) disclaim responsibility for any injury to people or property resulting from any ideas, methods, instructions or products referred to in the content. |
© 2024 by the authors. Licensee MDPI, Basel, Switzerland. This article is an open access article distributed under the terms and conditions of the Creative Commons Attribution (CC BY) license (http://creativecommons.org/licenses/by/4.0/).


