1. Introduction
Contemporary learning environments are undergoing a significant transformation, progressively integrating a range of design parameters to support different pedagogical approaches [
1,
2,
3]. This architectural transition from traditional to more flexible typologies is crucial to addressing different learning styles and teaching methodologies [
4]. The inherent flexibility of these environments, characterized by movable furniture, a diversity of learning zones, and spatial adaptability, plays a crucial role in fostering social interaction and facilitating dynamic student-centered activities such as discussions or group work [
5,
6,
7,
8].
This research investigates how architectural parameters of different learning spaces influence the perception of acoustic environment and, consequently, the educational experience of primary students. While previous research shown that the physical environment has a significant impact on learning, demonstrating 16% of the variation in learning progress according to classroom design [
9], the specific role of acoustic perceived within these environments remains underexplored. Recent studies have introduced similar frameworks for evaluating the classroom environment and its impacts on students’ educational experiences and performance [
10,
11,
12,
13]. These frameworks incorporate design principles that encompass architectural parameters such as flexibility, spatial connection, and indoor environmental quality factors, e.g., air quality, temperature, daylight, and acoustics.
Despite the advantages of flexible learning environments on student-centered activities, there is a growing concern that the flexibility and adoption of new pedagogical approaches could lead to an acoustically challenging environment, increasing noise, and potentially causing distraction and discomfort [
2,
14]. Although some studies hint at this trend, the empirical evidence remains scant [
15], highlighting a gap in the existing literature that this study intends to address.
Noise, particularly in educational settings with poor acoustics, has been reported to negatively affect the learning process [
16,
17,
18,
19,
20], comfort perception [
21], and health [
22,
23,
24]. It has been identified as the most annoying indoor environmental factor in educational spaces in the global north, surpassing others like temperature, air quality, and daylight [
24,
25]. Furthermore, it has been linked to stress-related issues [
26] and voice and hearing diseases in teachers [
27,
28].
Therefore, it is important to consider various architectural design parameters when analyzing classroom acoustics. While traditional measurements such as background noise level, speech transmission index, and reverberation times are influenced by room geometry and absorption materials, a broader approach could provide more nuanced insights into environment acoustic perception [
29]. For instance, room geometry influences acoustics; larger volumes and higher ceilings tend to increase reverberation times, whereas the quality and quantity of absorption materials reduce them [
18,
30,
31]. Additionally, the amount of glass in a room’s structure and its proximity to urban noise sources are critical for optimizing speech intelligibility and managing background noise levels [
30,
32].
Furthermore, the concept of flexibility in both usage and space configuration warrants further exploration. Spatial density impacts adaptability and the potential for social interactions [
33]; the number of learning zones within the space and the diversity of furniture could enable the reconfiguration of the interior space, affecting the types of activities it can support [
34]. Features that offer the potential for subdividing spaces or creating connections with adjacent areas could provide acoustic control [
35].
In light of these considerations, this study aims to identify the characteristics of physical learning spaces that influence the acoustic environment perceived by primary students. To achieve this, a questionnaire was conducted to assess acoustic perception and a space checklist was used to characterize the learning environments. The study involved 465 students aged between 8 and 11 years old from 19 learning spaces across 9 primary schools. A statistical analysis was carried out to explore the association between questionnaire scores and design parameters, offering actionable insights for enhancing the acoustic quality in educational settings.
2. Materials and Methods
2.1. Study Design
The underlying field study was developed between march and august of 2023 to investigate the relationship between the architectural characteristics and the acoustic environment perceived by primary students in 19 learning spaces of 9 schools located in two cities in Chile (Santiago and Concepción). The field study comprises a questionnaire for students, a checklist of inventory space characteristics and acoustics measurements of background noise level during occupied condition.
2.2. Learning Spaces and Architectural Design Parameters
The selection of schools was carried out with the purpose of contrasting comparable cases based on the main variables that contribute to both acoustic and flexible design parameters (
Table 1). On the one hand, the acoustic design parameters analyzed correspond to the geometry of the space (height, floor size, and volume); the acoustic conditioning through the percentage of sound-absorbing material and the percentage of glass relative to the surface area; and the identification of potential sources of urban noise (road traffic or industrial activities) located less than 100 meters from the school. Additionally, acoustic measurements of background noise level (Ln, dBA) were carried out under occupied conditions while children responded the survey. Ln was measured at each learning space for 15 minutes, at a heigh of 1.1 mt on the center of space.
On the other hand, the flexible design parameters were organized according to the flexibility of both use and space. The flexibility of use was surveyed by the spatial density (m2/student), since it influences the possibilities of adaptability and movement; the number of learning zones based on the identification of differentiated areas within the space; and the number of furniture types that allows the reconfiguration of the interior space according to educational needs. Regarding the spatial flexibility factor, the adaptability opportunity variable was analyzed based on the identification of elements that allowed the space to be subdivided or to generate a spatial or visual connection with other adjacent areas.
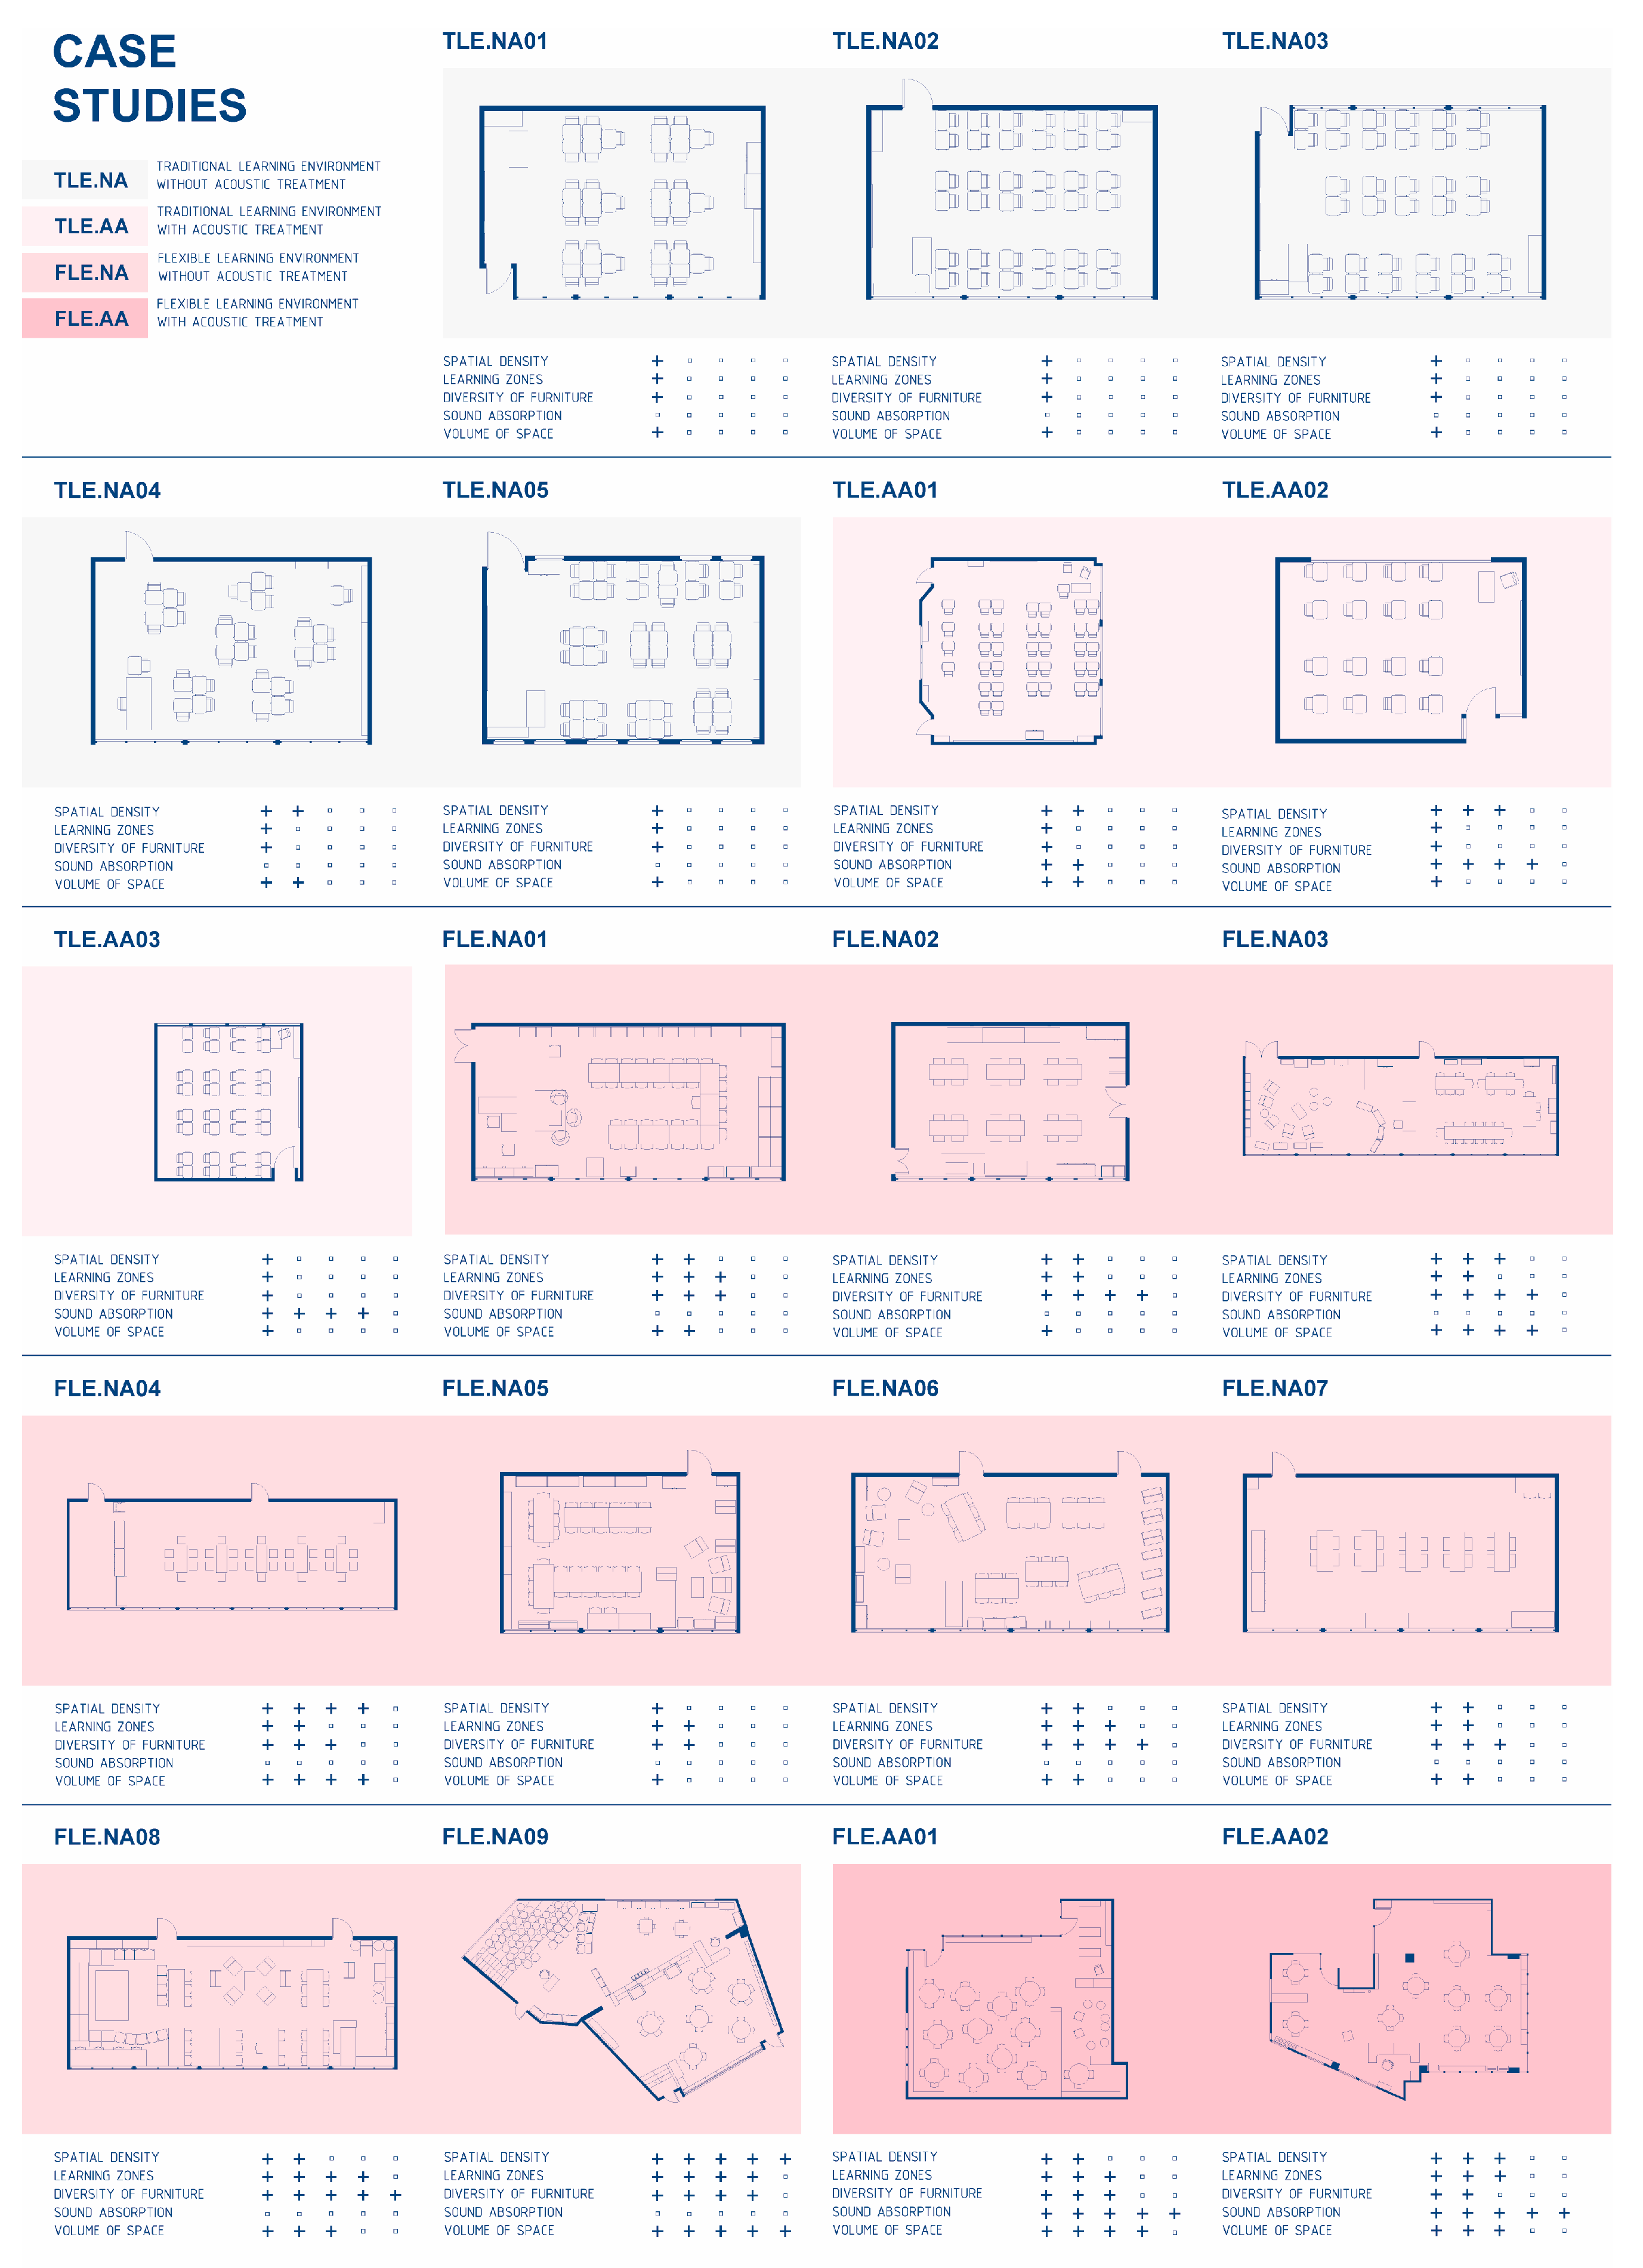
From a first analysis of the learning space characteristics, the study cases were classified in four groups according to their spatial layout and acoustic treatment, as presented in
Figure 1: Traditional learning space without acoustic treatment (TLE.NA, n:5), Traditional learning space with acoustic treatment (TLE.AA, n:3), Flexible learning space without acoustic treatment (FLE.NA, n:9), and Flexible learning space with acoustic treatment (FLE.AA, n:2).
2.3. Questionaire
A students’ questionnaire has been designed based on previous questionnaires about both acoustic environment perception and Indoor Environmental Quality (IEQ) comfort [
25,
36,
37]. It was adapted for the cultural context and the age of participants (8-11 years old). The final version of the whole questionnaire is shown in
Table 2. The questionnaire comprised five sections: (1)
demographic such as gender, age, and mother tongue; (2
) IEQ comfort, e.g., daylight, temperature, air quality, and noise, where, due to the scope of this study, the scale of the questions of the four aspects was adjusted to the noise discomfort scale stipulated on ISO 28802 standard [
37];
Noise source annoyance, which consists of 6 items to understand the noise sources that cause more annoyance to students. In this section, children first were asked if they ever heard each noise source (yes or no). If children answered “yes”, they had to answer a second question: “Are you bothered by the noise from…? on a three-point scale (always, sometimes, never), If the children answered “no” to the first question, the noise source was considered as not bothering; (4)
Hearing ability, which consists of four items that ask about their ability to hear the teacher and other students in different scenarios; and (5)
Acoustic Preference, related to the preference of the sound environment perceived at the moment of the survey. The questionnaire was tested in a pilot study at one school and two learning environments (TLE and FLE) in November of 2022.
It was administrated inside the learning space during sessions of 30 minutes approximately. An introduction with information about the study purpose, oral instructions for filling out the questionnaire, and the opportunity to ask questions were given at the children under the supervision of the researchers.
2.4. Participants
A total of 465 students filled out the questionnaire in 19 learning environments (
Table 3). In general, there were more women (59.0%) than men (38.7%) or other genders (2.3%), the age of the children was between 8-11 years old, and the overall sample was composed of 98 .0% native Spanish language, while 2.0% used other primary languages, mostly Creole or Haiti French. The Ethics committee of the University of Bío-Bío approved the study. Before the survey, parents were sent a consent letter from the school managers. The research team collected the consent forms on the day of the survey. For the students without permission to fill out the questionnaire the teachers gave them an activity or in some cases, the school management decided to remove them from class.
2.5. Data Analysis and Statistical Treatment
The data collected from the questionnaires and checklists were imported and analyzed using IBM SPSS Statistics 29.0 software. In the current sample, the McDonald’s omega values between 0.71 and 0.75 were obtained from the answers within the components of the questionnaire, thus showed an internal consistency.
Additionally, two different procedures were conducted to identify the impact of design parameters on the acoustic environment perceived by students. One procedure focused on assessing the acoustic environment perceived by students within the four groups of learning spaces (TLE.NA, TLE.AA, FLE.NA, FLE.AA), while the other involved analyzing the correlation between the acoustic environment perceived per learning space and its corresponding design parameters.
First, the percentage, mean and standard deviation (SD) of data were calculated using descriptive analyses to summarize the acoustic environment perceptions of the learning spaces groups. In general, the data from ordinal scale were not distributed in a normal way (Shapiro-wilk test, P-value < 0.001). Therefore, both Kruskal-Wallis or Mann–Whitney U test was used to analyze the significance of differences between the perception associated to the group of learning spaces. Second, in a separated file, the relationship between the average of subjective outcomes in each learning space, the design parameters, and background noise level in occupied conditions, were also investigated using Spearman or Pearson correlation according to the data distribution. Finally, to develop a more robust correlation analysis, linear regressions of the data with normal distribution were developed to predict possible degrees of dependence between design variables and subjective responses.
3. Results
Table 4 shown the learning space characteristics by group according to acoustic and flexible design parameters. Regarding acoustic design parameters, most of the learning spaces had similar height, but different floor area (m2) and volume (m3). Also, 88% of learning spaces presented windows with hermetic double glazing (DVH) and polyvinyl chloride material, and more than 50% of them were close to potential noise sources. Spaces with acoustic treatment presented a mean of 56.6% (SD:16.4%) of absorbent surfaces in TLE.AA, while FLE.AA was 100%.
Regarding flexible design parameters, as expected, traditional learning spaces (TLE) presented lower learning zones, diversity of furniture, and space adaptability, than flexible learning spaces (FLE). However, spatial density (m2 per student) was similar between them, except in the cases of TLE.NA.
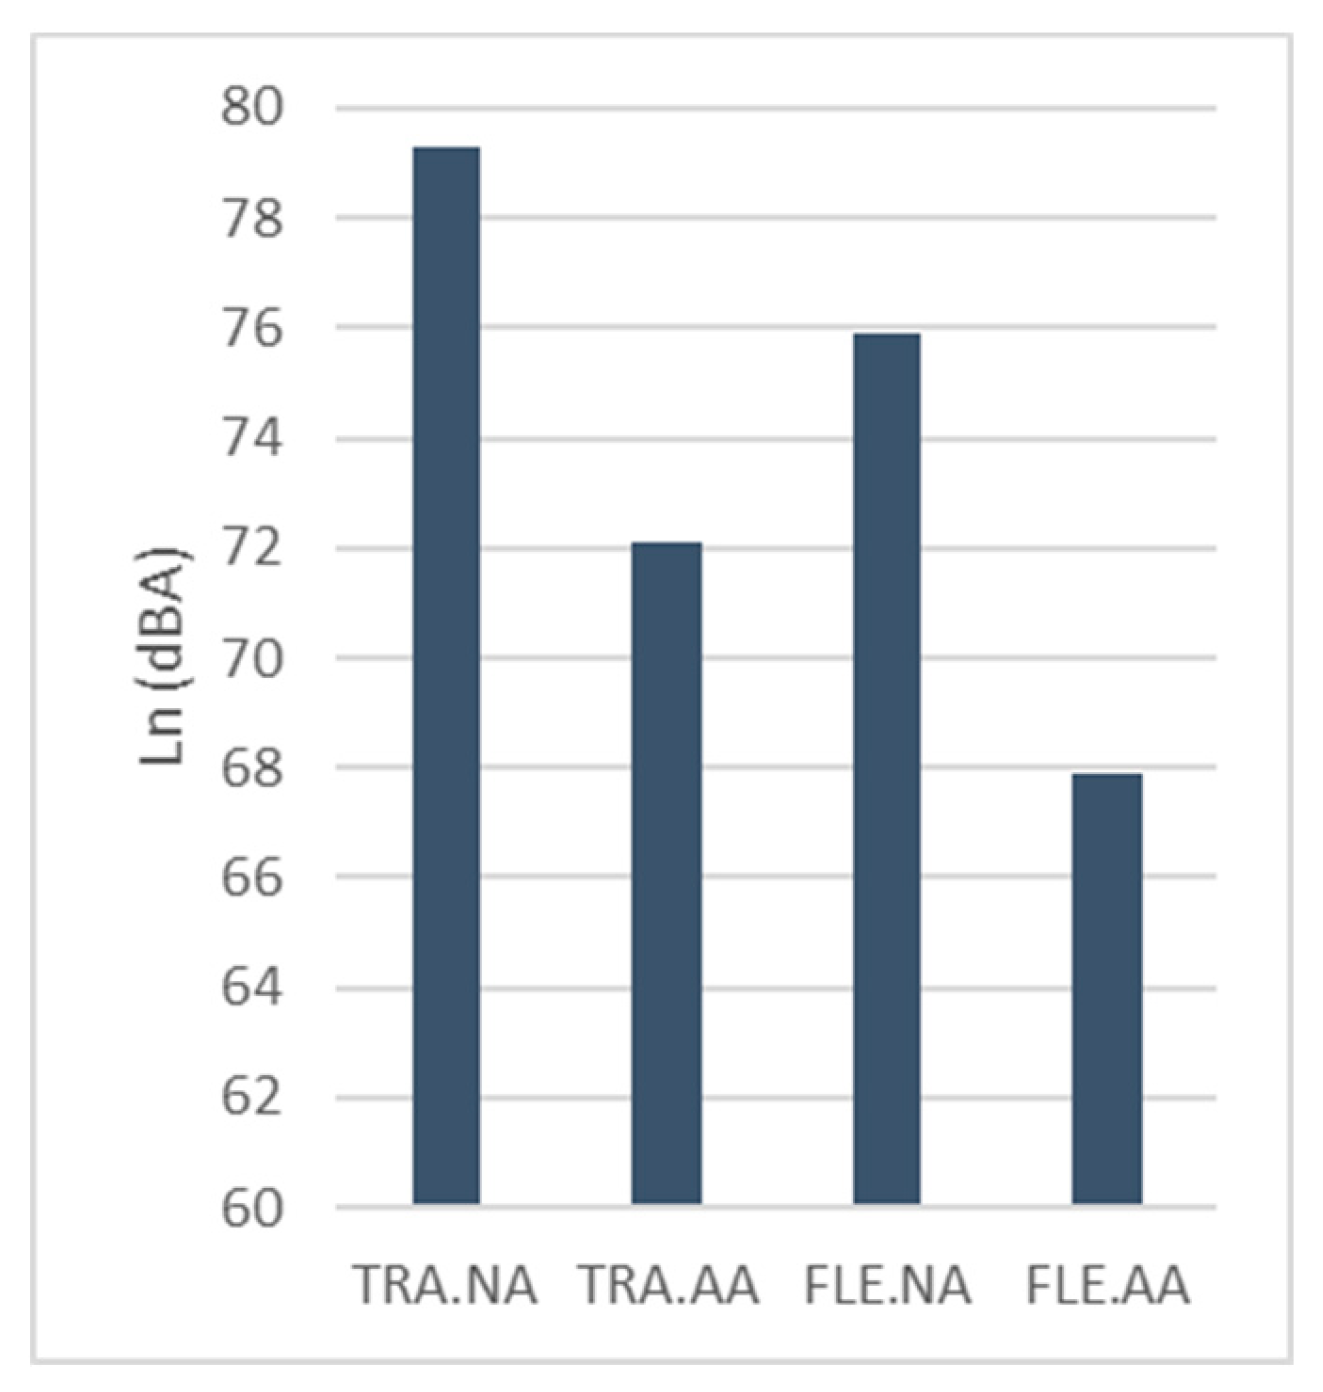
Additionally, background noise levels, measured during occupied conditions (
Figure 2) were higher in learning spaces lacking acoustic treatment. Specifically, TRA.NA presented an average noise level of 73.9 dBA average with a standard deviation (SD) of 5.0 dBA, followed by FLE.NA (75.9 dBA; SD: 3.5), TLE.AA (72.1 dBA; SD: 3.4), and FLE.AA (67.5 dBA, SD: 1.2).
3.1. Subjetive Acoustic Environment Responses
3.1.1. Noise Discomfort
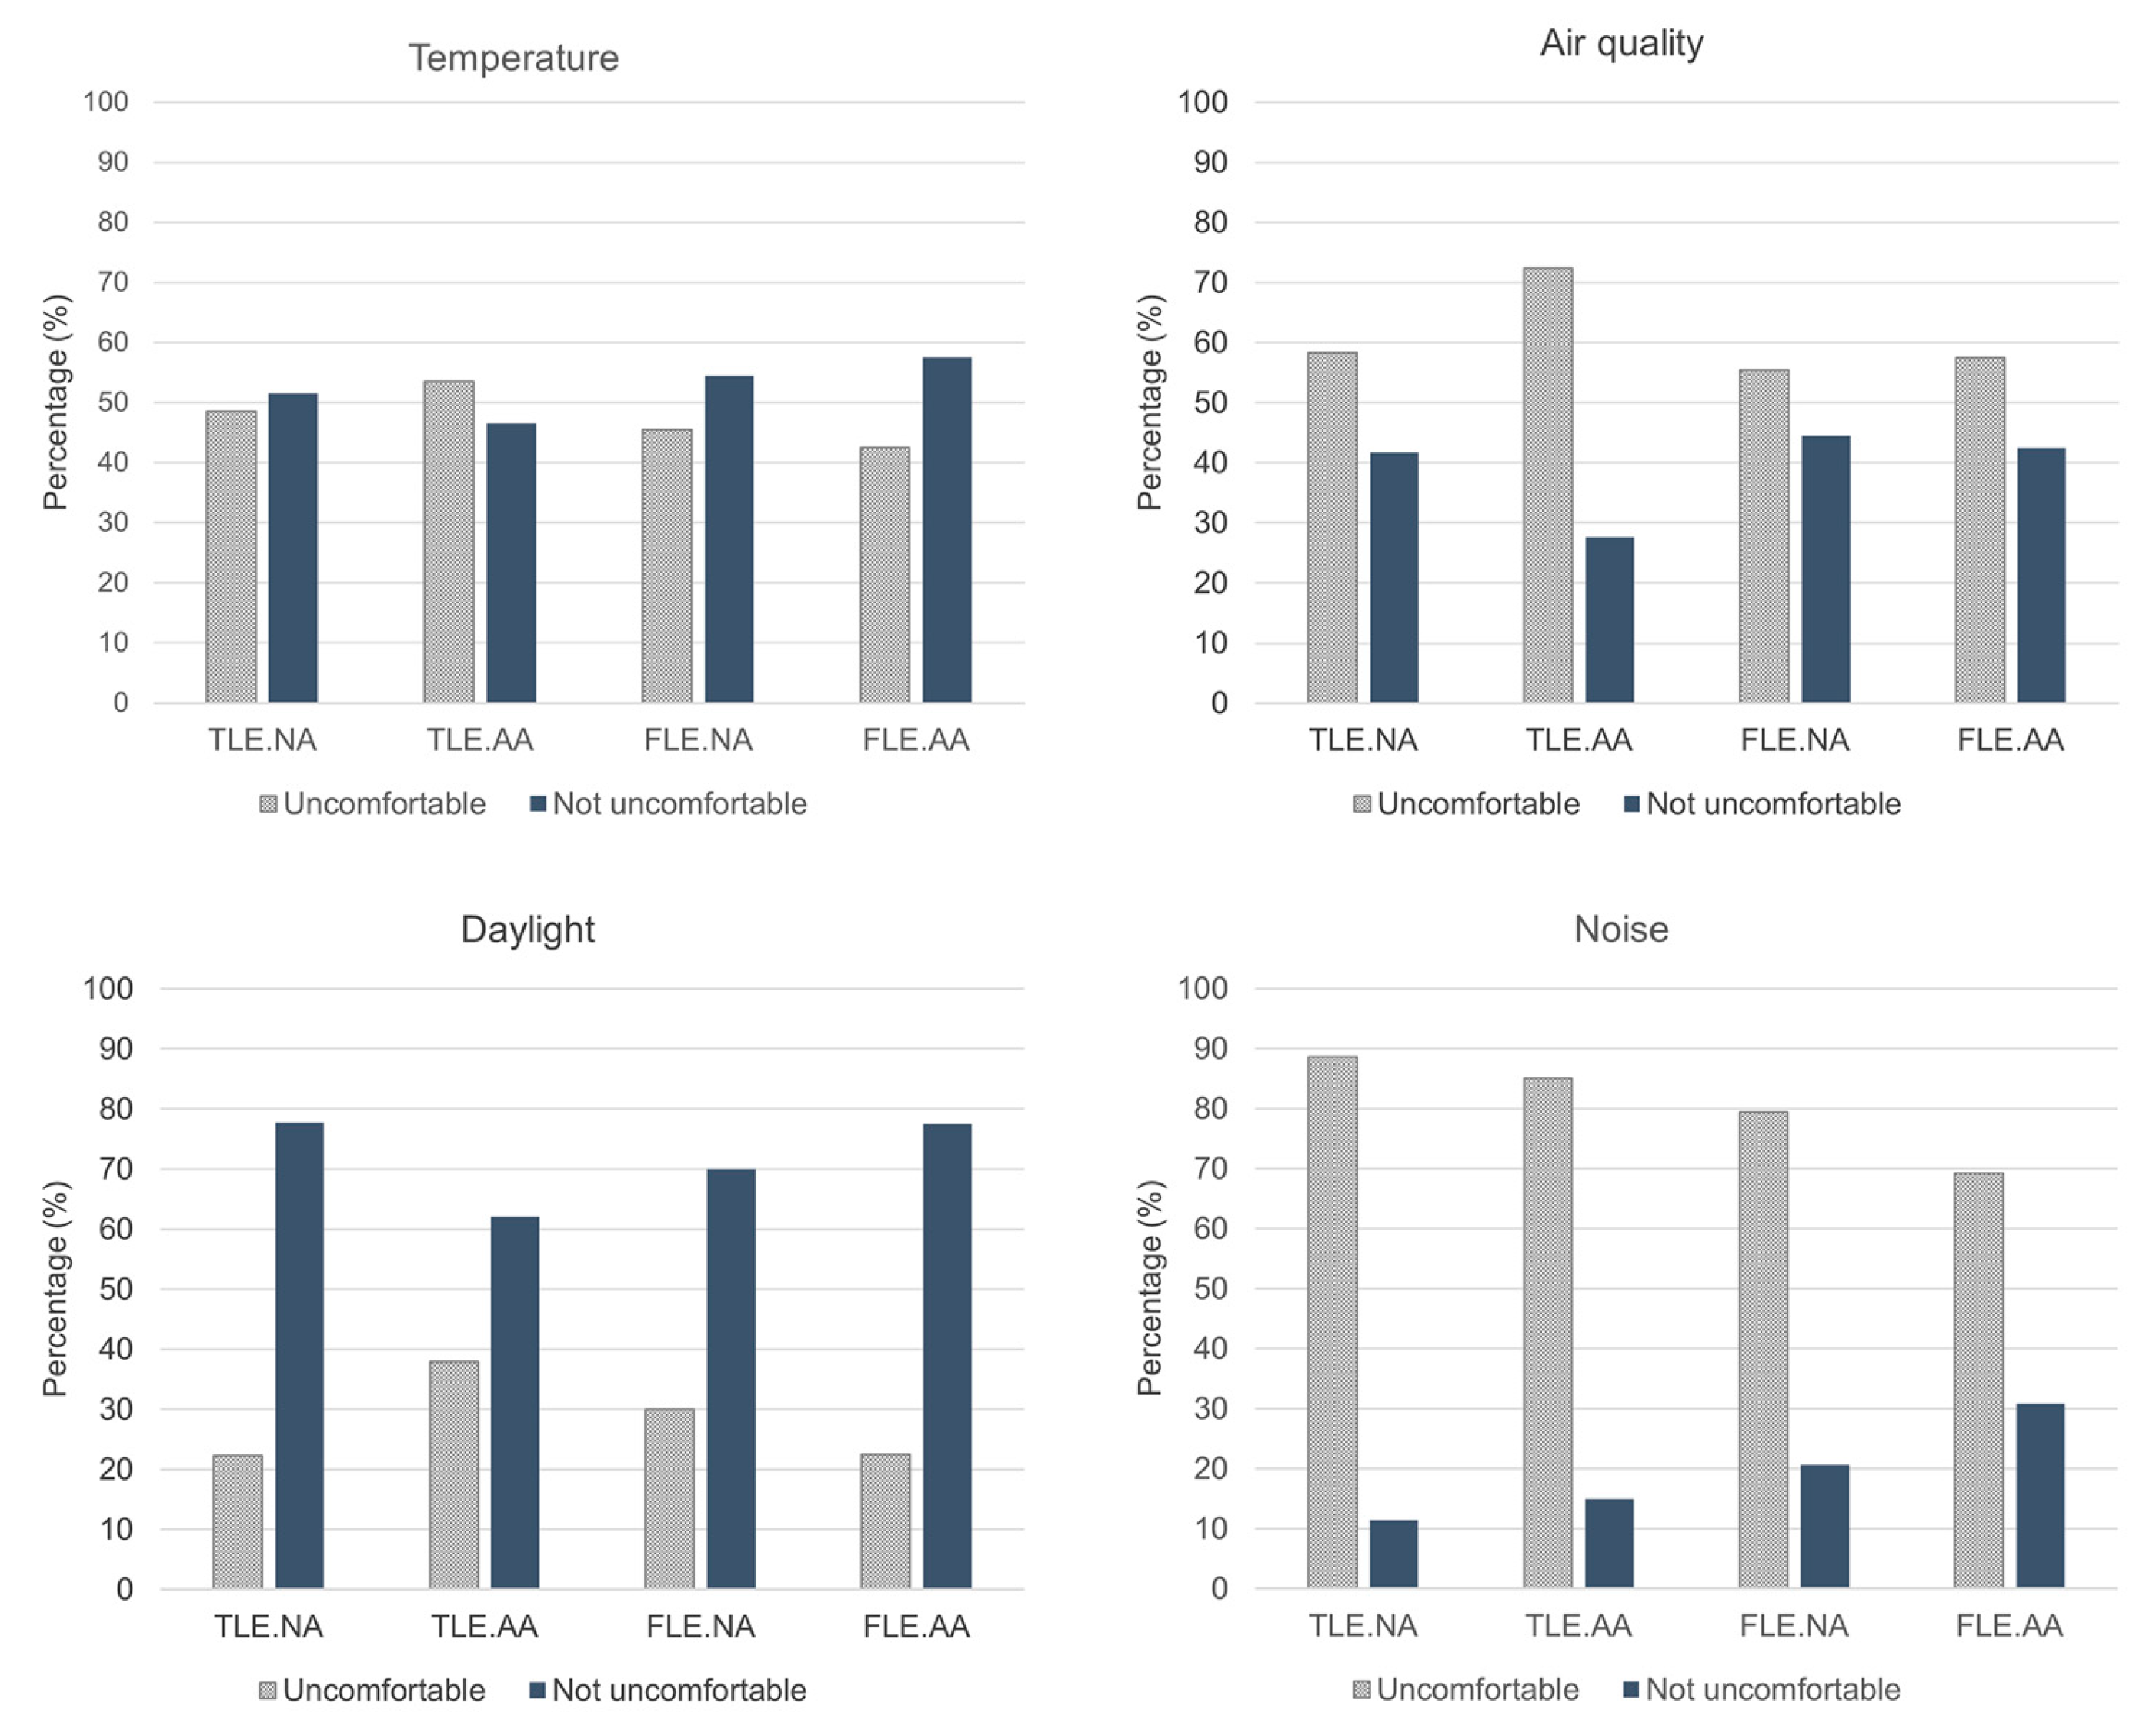
In the questionnaire, the scale for this component was very uncomfortable, uncomfortable, slightly uncomfortable, and not uncomfortable. It should be noted that the World health organization define noise as any unwanted sound in the environment [
38], thus the perception scale was considered from discomfort perspective evaluation. Respondents who answered between “very uncomfortable” and “slightly uncomfortable” scale were grouped as discomfort as shown in
Figure 3. The results showed that the most uncomfortable aspect was notoriously noise, followed by air quality, temperature, and daylight. Noise discomfort was declared between 69% (FLE.AA) to 89% (TLE.NA) of students. Also, it was higher in traditional learning environments than flexible learning environments and, in each typology, it was lower in spaces with acoustic treatment.
3.1.2. Noise Annoyance
Environmental noise annoyance is a reflective assessment that comprises past experiences with a noise source during a time [
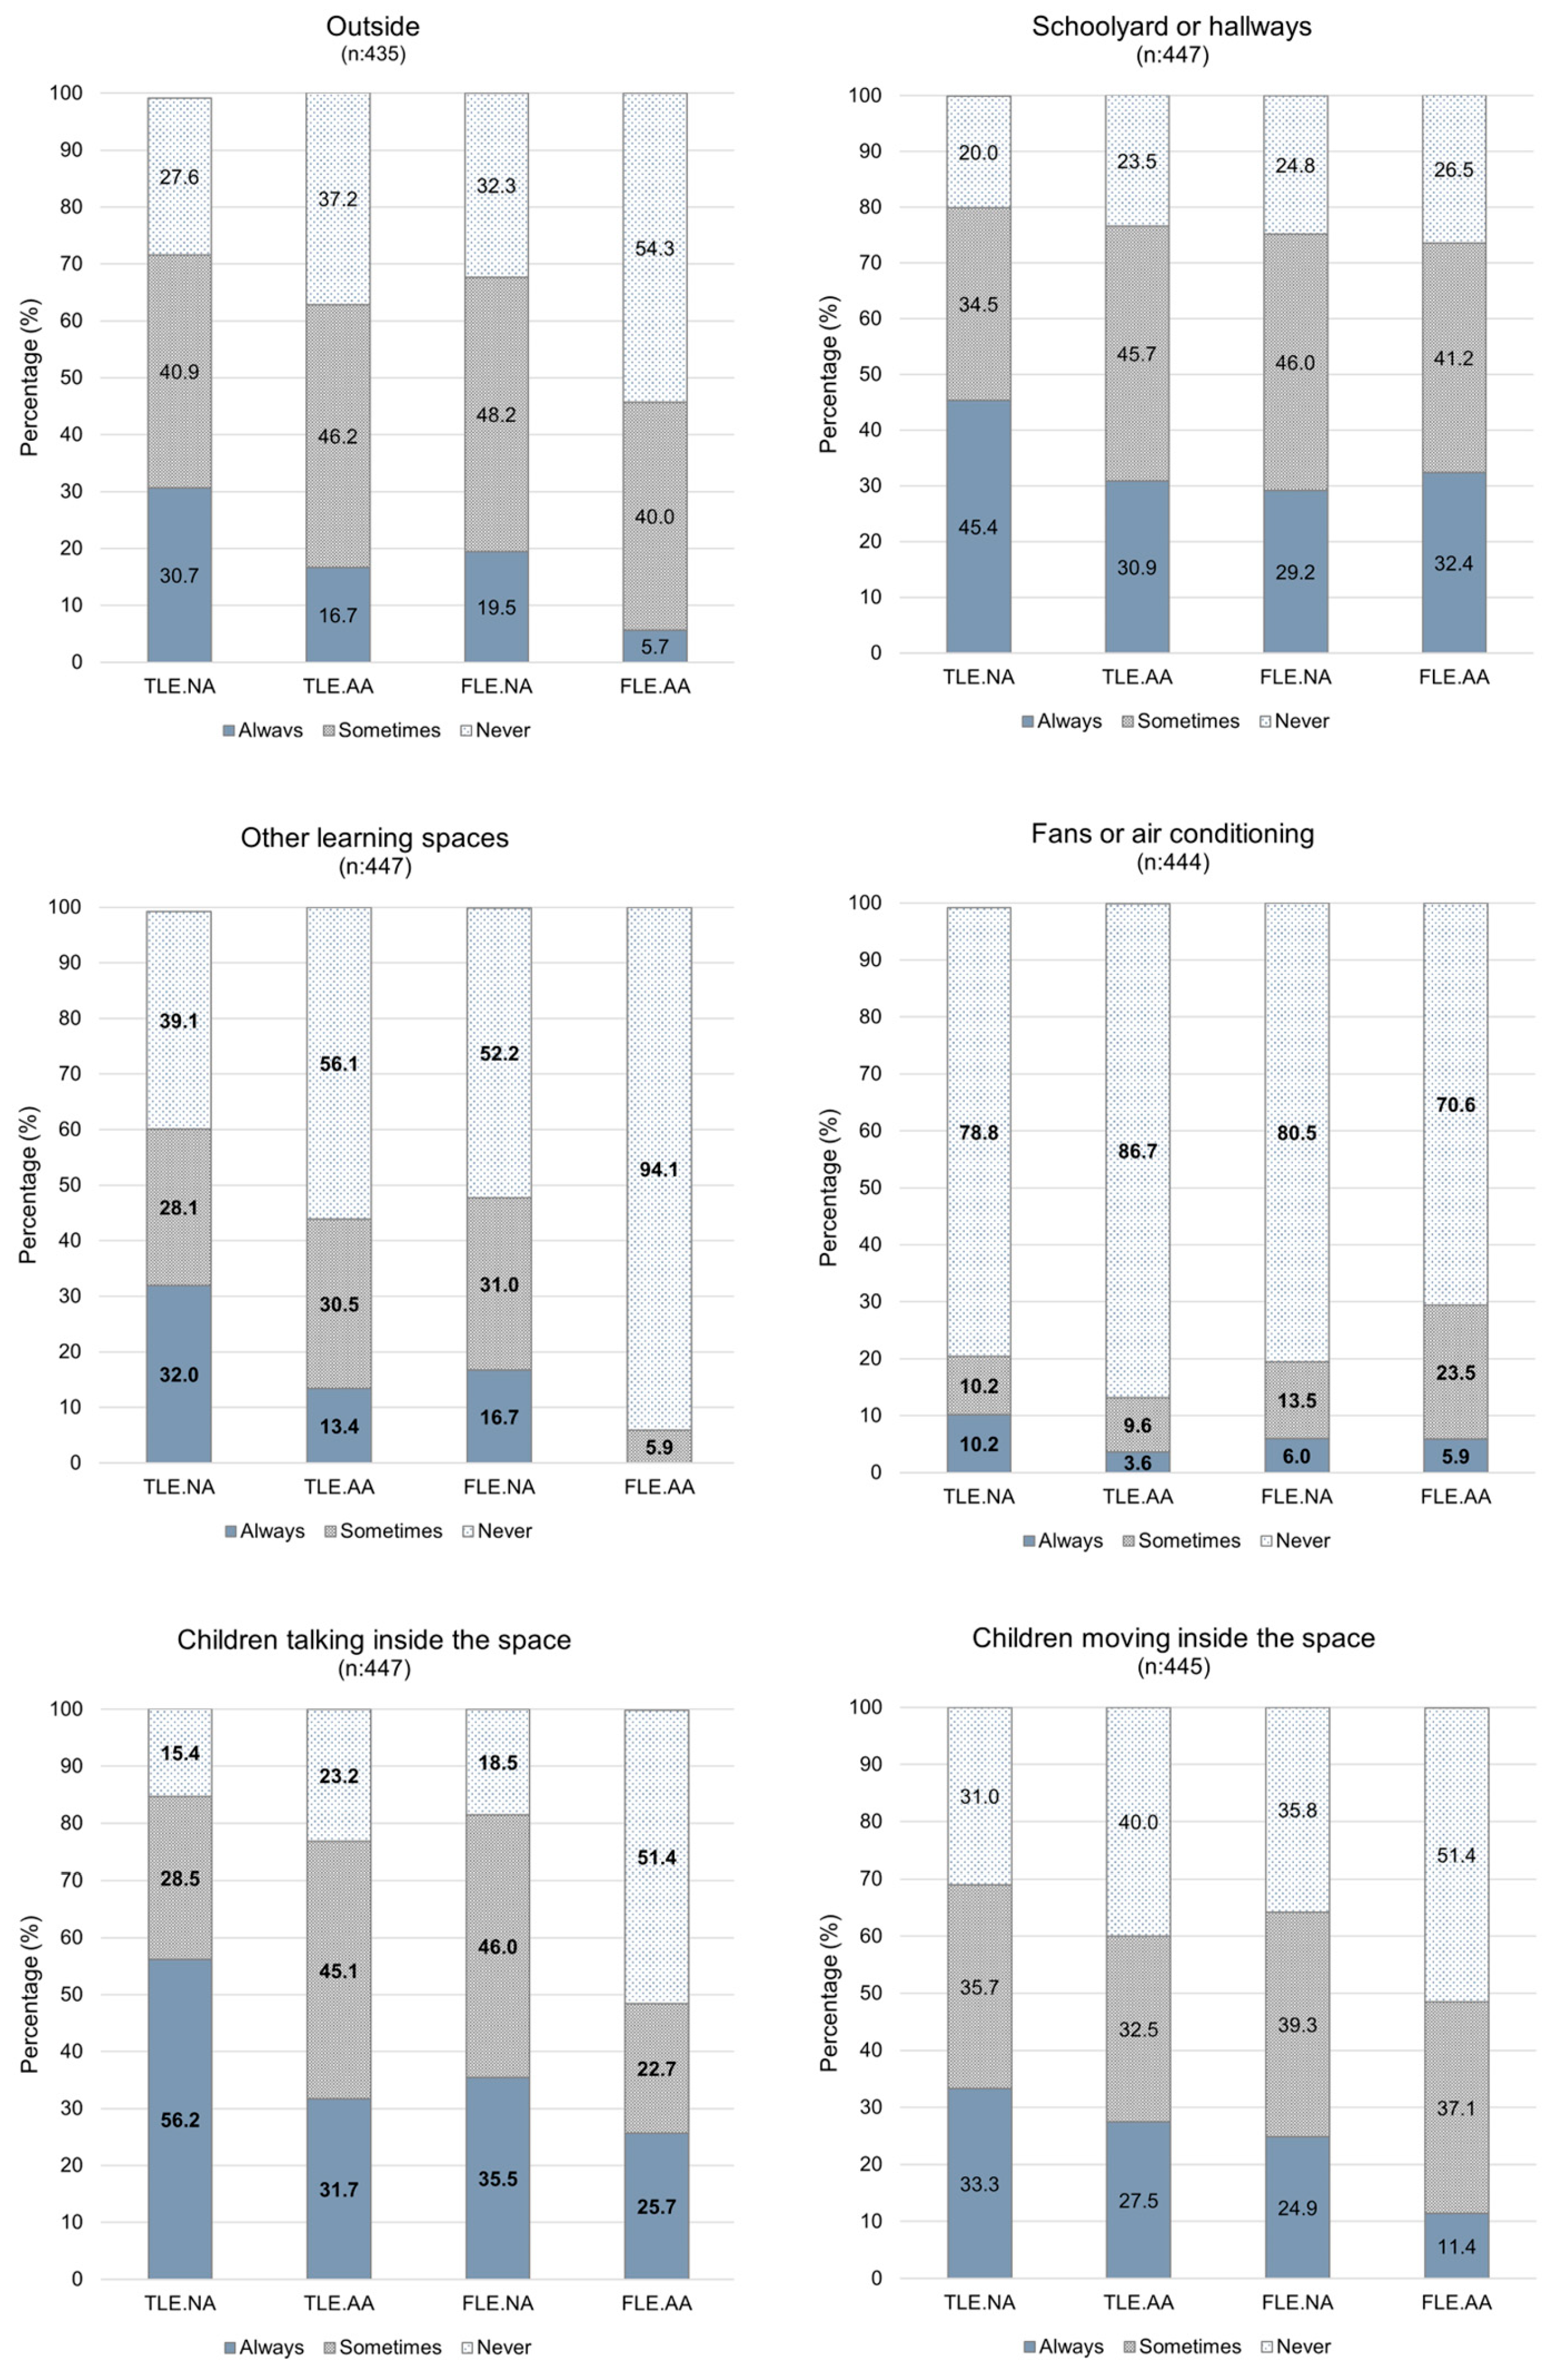
39]. In order to understand the types of noise that cause more annoyance among students, the children were asked about their exposure to various noise sources, prompting responses of ‘yes’ or ‘no’. Affirmative responses triggered a subsequent inquiry using a three-point scale to analyze the level of annoyance (always, sometimes, never). If the children answered ‘no’ to the first question, the answer was considered as non-annoying. As shown in
Figure 4, in general children in traditional learning spaces lacking acoustic treatment (TLE.NA) were more bothered by all of noise sources compared to other groups of learning spaces.
It can be noted that students identified children talking inside the space as the most annoying noise, except for FLE.AA, where noise from schoolyard or hallways was identified as the most annoying noise. Secondly, the noise from schoolyard or hallways did not bother 20% of children in TLE.NA, in contrast to 24% in TLE.AA, 25% in FLE.NA, and 27% in FLE.AA. Thirdly, students non-bothered by noise from outside was similar in all spaces (28%-38%), except for FLE.AA (54%). In fourth place, annoyance from the sound of children moving within the space was highly in the spaces without acoustic treatment (69% TLE.NA, 64% FLE.NA) compared to spaces conditioned with absorbent acoustic materials (60% TLE.AA, 49% FLE.AA). The same trend was observed regarding to noise annoyance from other learning spaces. Additionally, less than 70% of the students complained about the noise coming from fans or air conditioning.
3.1.3. Hearing Ability
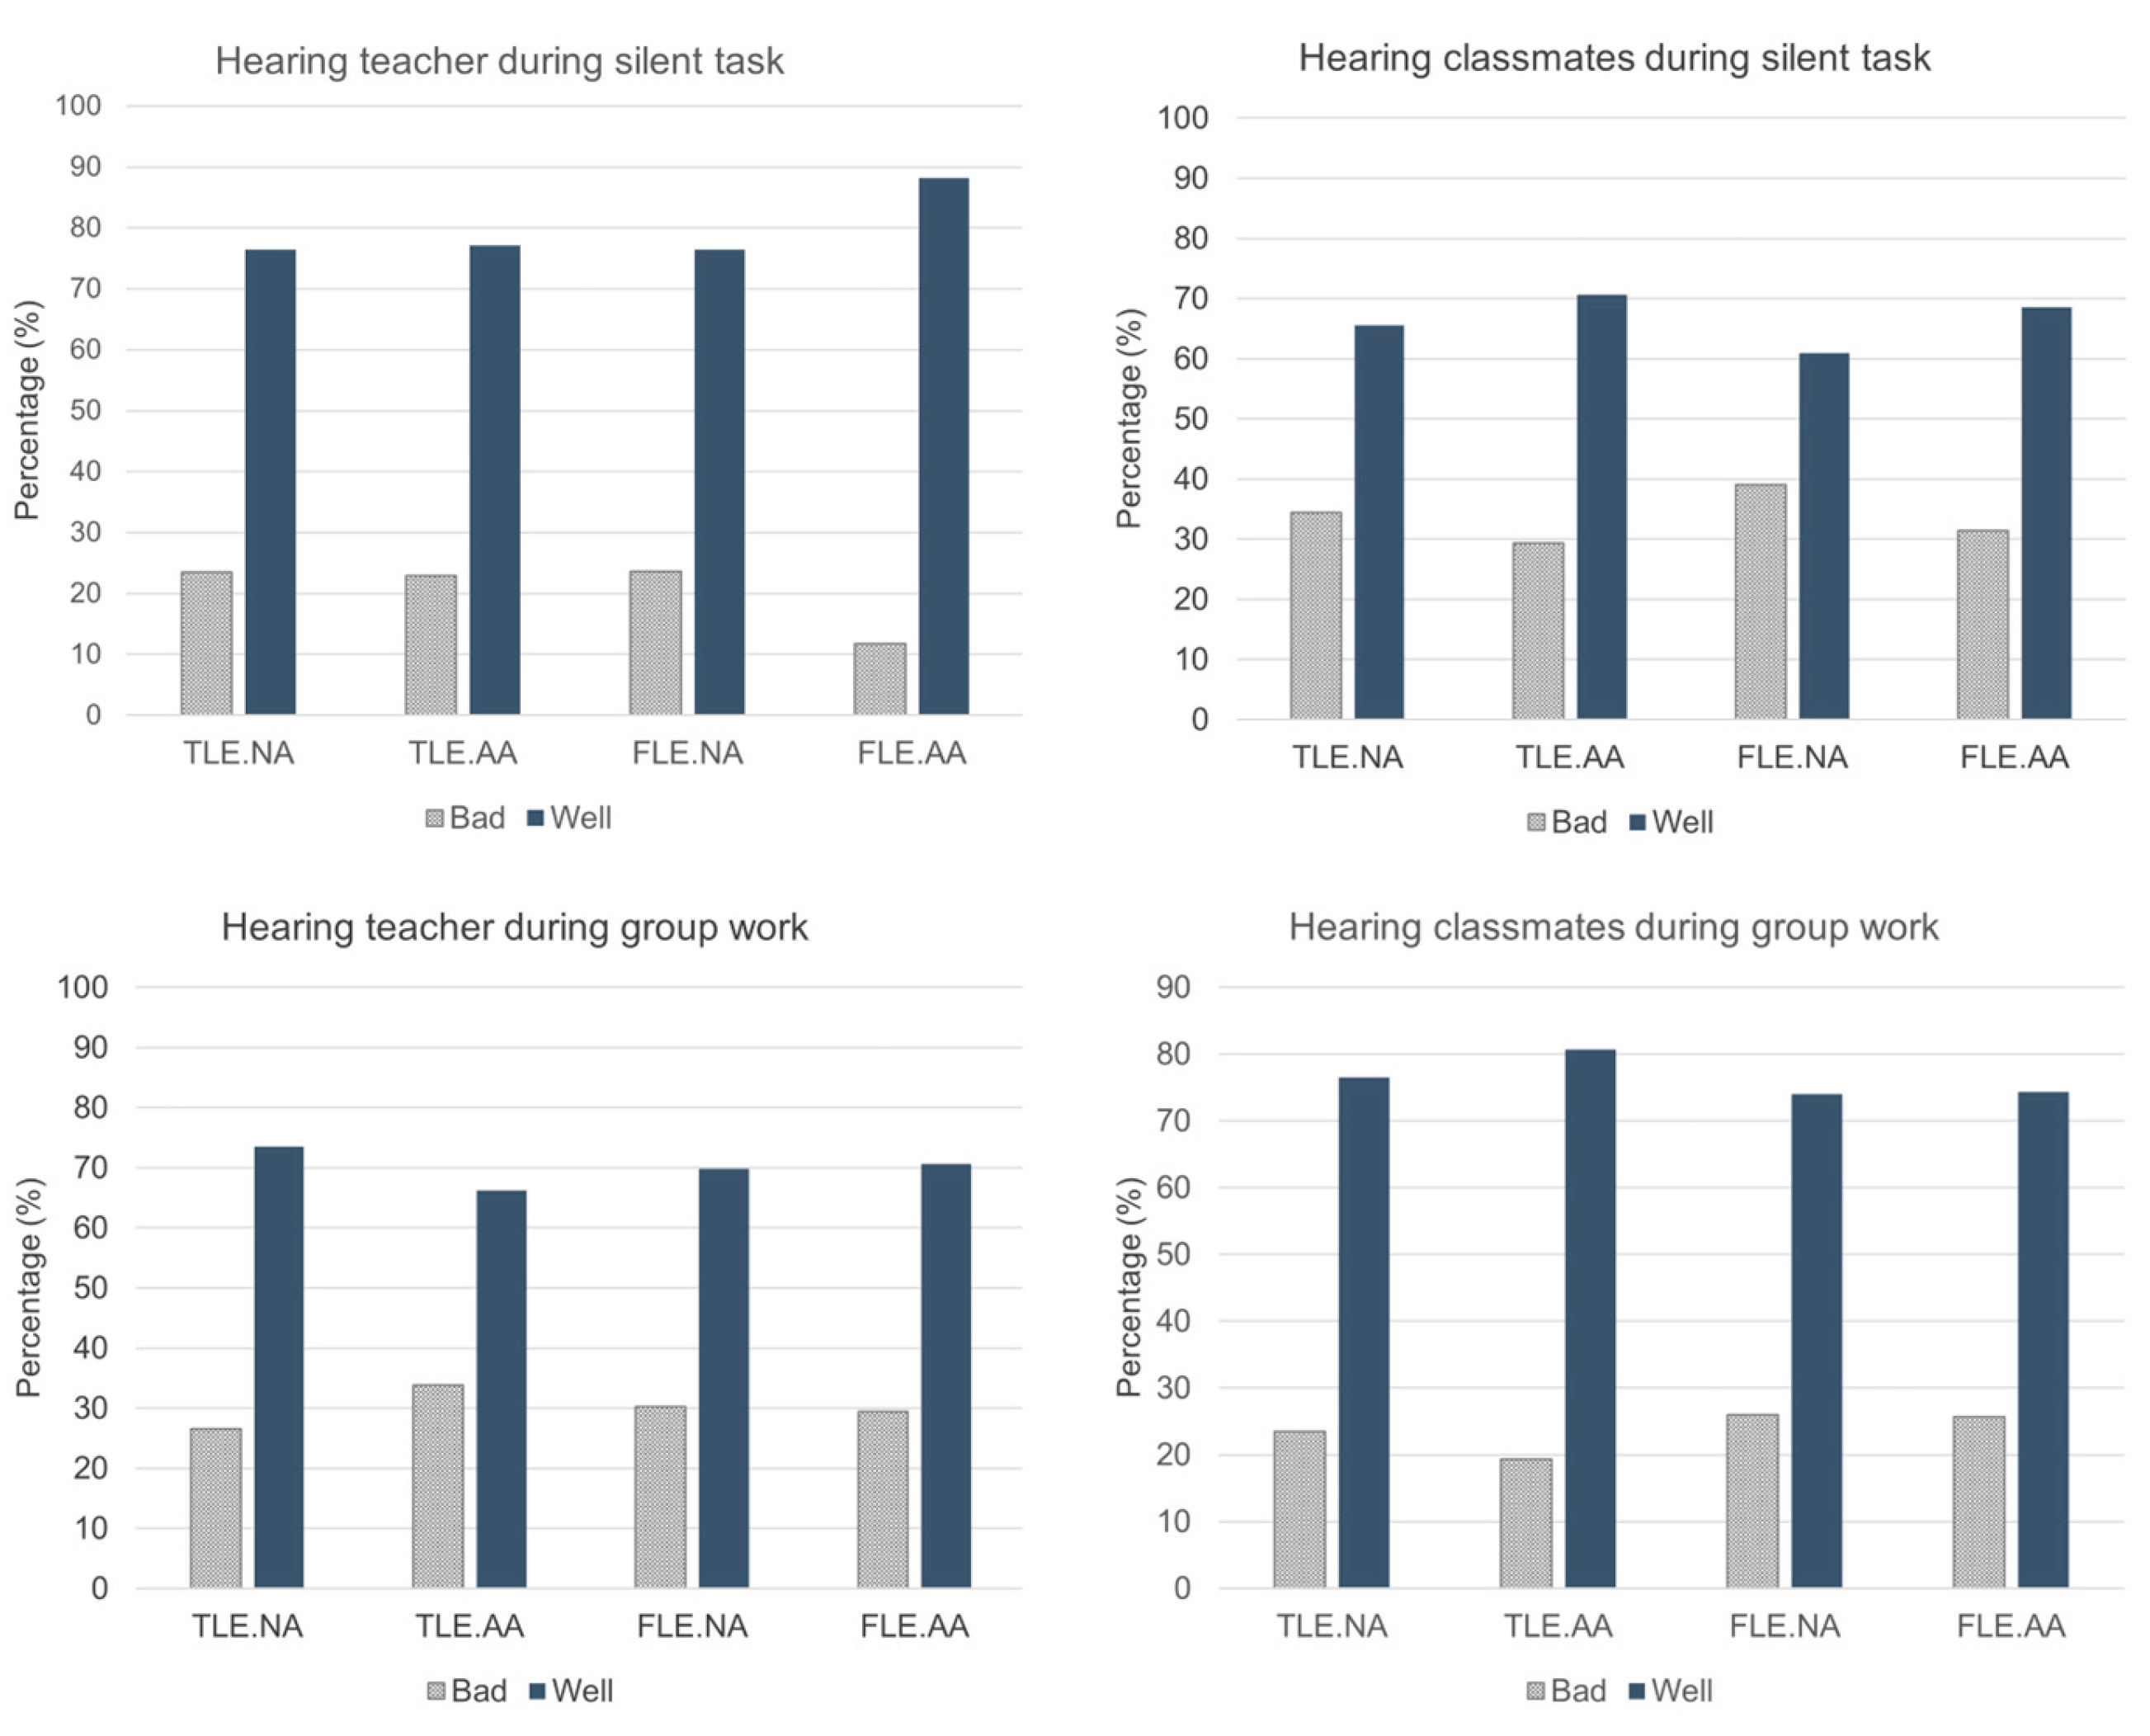
In terms of perception on hearing ability, the children were asked to rate “How well can you hear your (teacher or classmates) during two scenarios (silent task or group work)”, using a 5-point scale. Responses of “very well” and “well” were categorized as good hearing ability, while “not very well”, “bad”, and “very bad” were considered indicative of poor hearing ability perception (
Figure 5). The most common complaint was difficulty hearing classmates during silent task in FLE.NA (39%), closely followed by TRA.NA (34%) in the same scenario. Additionally, hearing teacher problems during group work were more prevalent in TRA.AA (34%) and FLE.NA (30%), while hearing classmates in the same scenario was reported by 26% in FLE.NA and FLE.AA. Regarding hearing teacher during silent task, the complaint responses were similar inTLE.NA, TLE.AA, and FLE.NA (approximately 23%), except for FLE.AA (11%).
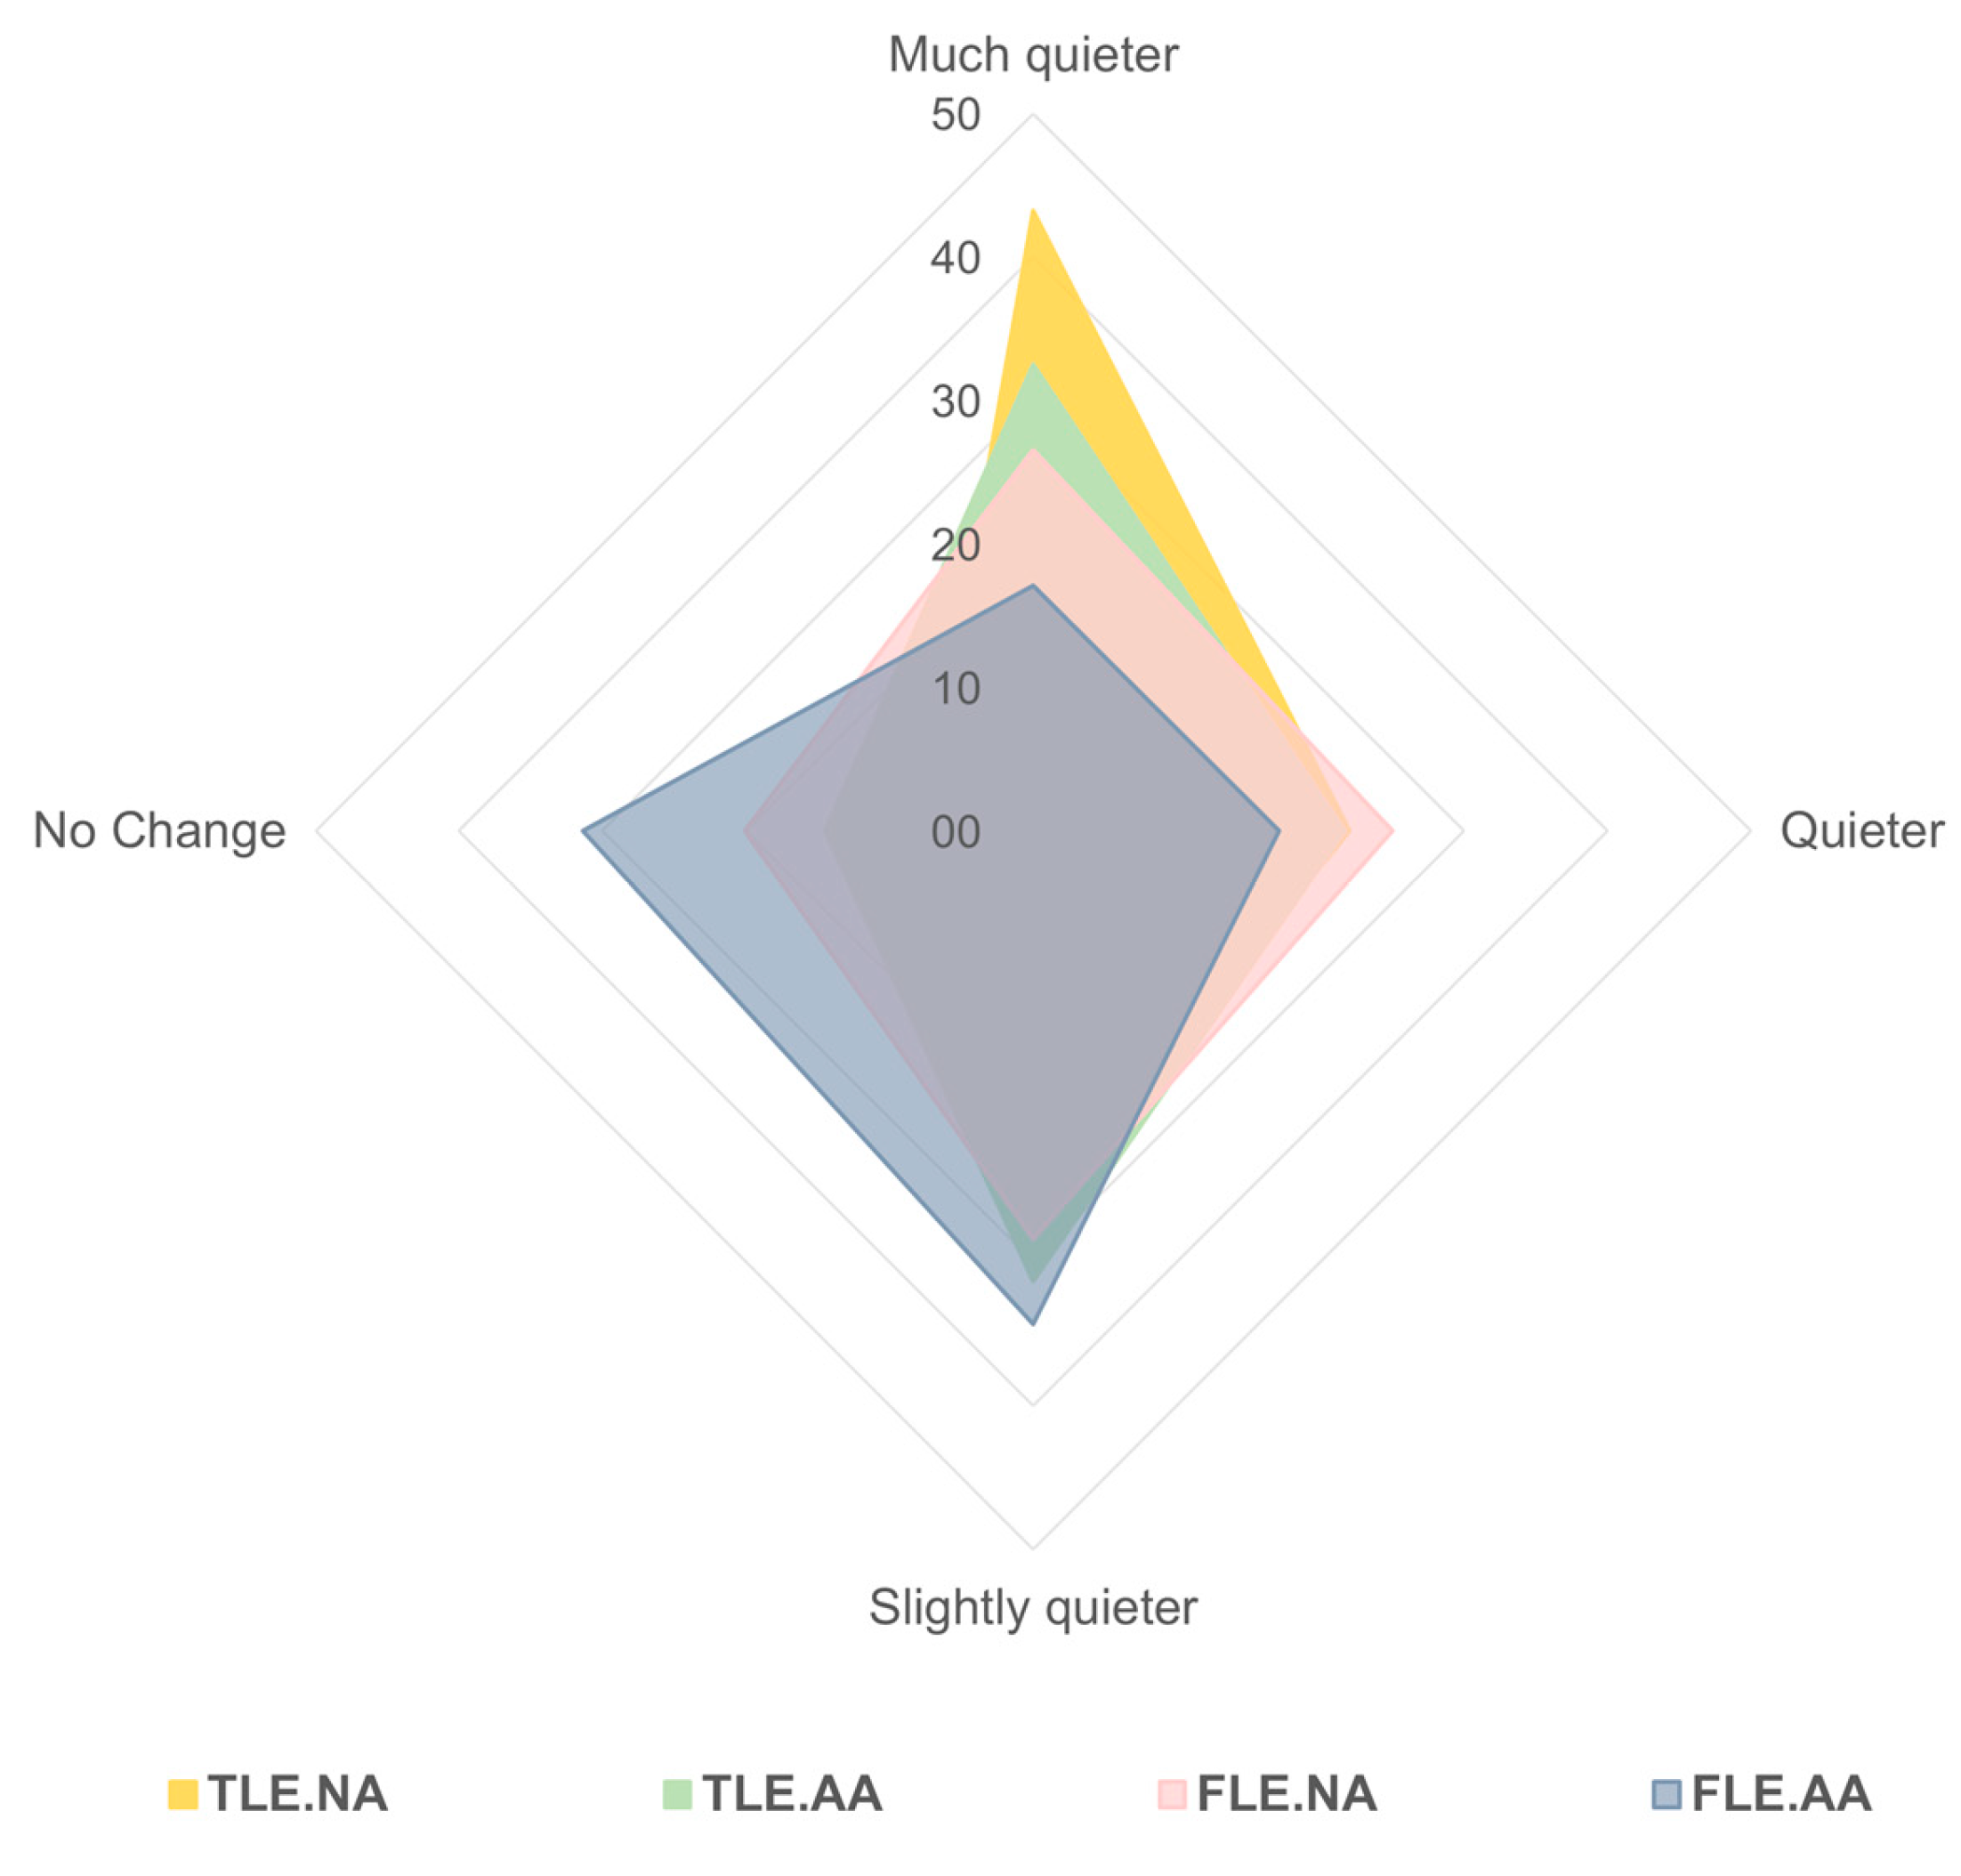
3.1.4. Acoustic Preference
Figure 6 shows the acoustic preference at the moment of the questionnaire application. In general, the preference for “no change” in terms of noise was higher in the flexible learning space with acoustic treatment (FLE.AA), while “much quieter” was higher in the two traditional spaces TLE.NA, TLE.AA, and the other flexible space FLE.NA respectively. Specifically, 43% of students in TLE.NA preferred a much quieter environment (33%TLE.AA, 27% FLE.NA, 17% FLE.AA), while 25% of students in FLE.NA preferred a quieter environment (22% TLE.NA, 22%TLE.AA, 17% FLE.AA), and 24% of students in FLE.AA preferred a slightly quieter environment (31.3 TLE.AA, 28% FLE.NA, 27% TLE.NA). No change responses were higher in FLE.AA (31%), followed by FLE.NA (20%), TLE.AA (15%), and TLE.NA (8%).
3.2. Relationship between the Type of Learning Space and Acoustic Environment Perceived
In the context of subjective responses, a preliminary analysis was conducted to identify differences between the acoustic environment perceived by students across the four groups of learning spaces. Two additional analyses were developed to compare responses concerning acoustic treatment and the type of learning space. Specifically, comparisons were made between spaces with and without acoustic treatment (TLE.NA and TLE.AA - FLE.NA and FLE.AA) and among the types of learning spaces (TLE.NA and FLE.NA - TLE.AA and FLE. AA).
Regarding relationship between subjective responses and the four groups of learning spaces (
Table 5), the Kruskal-Wallis H test (KW) revealed significant differences in responses related to air quality and noise comfort in the IEQ topic. Similar differences were observed in responses to questions about noise annoyance, particularly concerning noise from outside, other spaces, and children talking and moving within the learning space. Another significant difference was noted in the acoustic preference topic.
Table 6 presents an analysis of the same results but compares the differences between the group of cases organized according to their acoustic treatment or typology. Significant differences, consistent with those in
Table 5 but according to the Mann-Whitney U test, were found for the comparison of the group of FLE, except for the topic of acoustic preferences. On the other hand, in traditional learning spaces (TLE), no significant differences were observed in air quality and noise comfort, noise annoyance from children moving inside, and acoustic preferences.
Furthermore, in learning spaces without acoustic treatment (TLE.NA and FLE.NA), significant differences were found in responses related to noise comfort in the IEQ topic, noise annoyance from schoolyard, other learning spaces and children talking inside the space, as well as in acoustic preference. On the other hand, for learning spaces treated with sound-acoustic material (TLE.AA and FLE.AA), significant differences were found in the same responses as the other group, except for noise annoyance from schoolyard or hallway. Additionally, significant differences were observed in questions related to air quality comfort and noise annoyance from both outside and fans or air conditioning.
In summary, the results suggest that the type of learning spaces influenced acoustic environment perception more than the acoustic treatment, especially on the topics of acoustic comfort and acoustic preference. However, in relation to noise annoyance, it seems that both the type of space and the acoustic treatment influenced the responses.
3.3. Relationship between Design Parameters and Acoustic Environment Perceived
The analysis concerning the relationship between design parameters in learning spaces and the perceived acoustic environment involved assessing the average of responses per topic within each learning space. The sample analyzed include the 19 study cases outlined in this research.
Table 7 illustrates the correlation matrix of acoustic and flexible design parameters and subjective responses. Pearson or Spearman correlation test were conducted based on the distribution of the data. Notably, the percentage of sound-absorption material, background noise level in occupied conditions, and the space density exhibited significant relationships with subjective responses compared to other design parameters.
Specifically, significant relationships were found between the background noise level in occupied conditions and various subjective responses, including general noise comfort (IEQ 04), noise annoyance from outside (NA01, NA03), noise annoyance within the space (NA05, NA06), and the acoustic preference (AP01). Additionally, Ln (dBA) demonstrated a strong correlation with the percentage of sound-absorption material and a moderate correlation with the space density. Moreover, the percentage of sound-absorption material suggests a correlation with different noise source annoyance and the hearing ability of teacher during silent task.
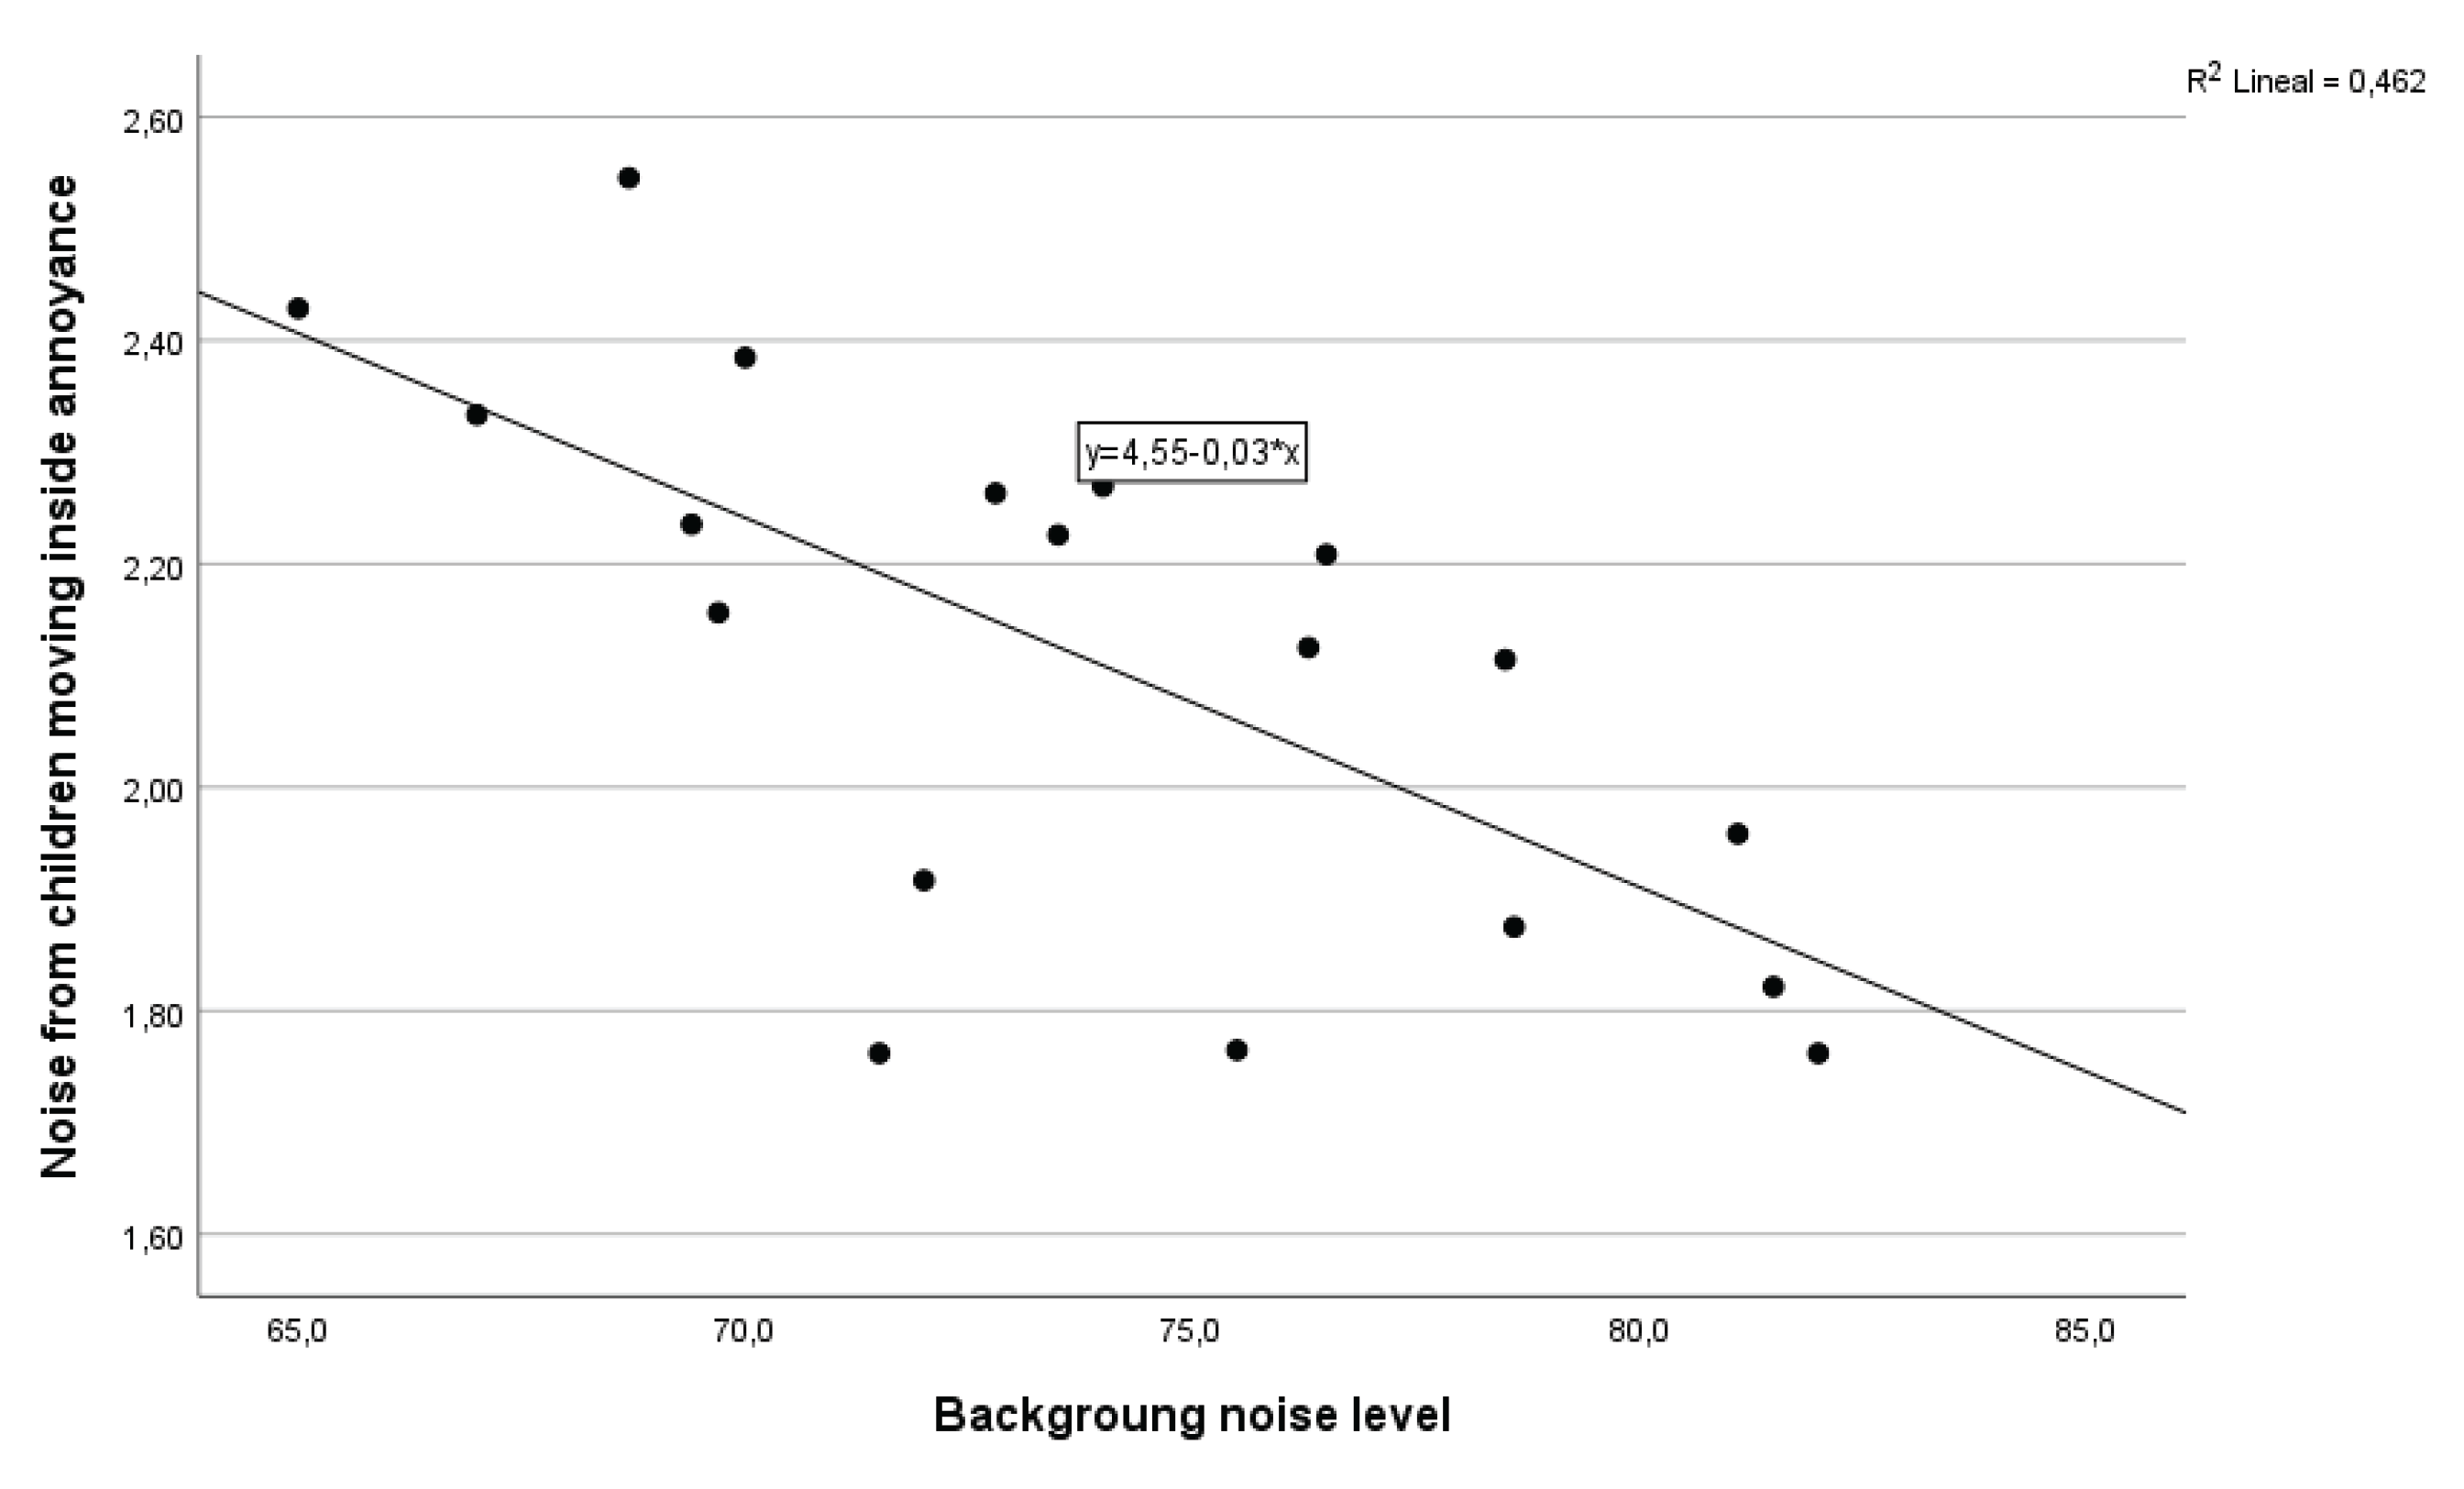
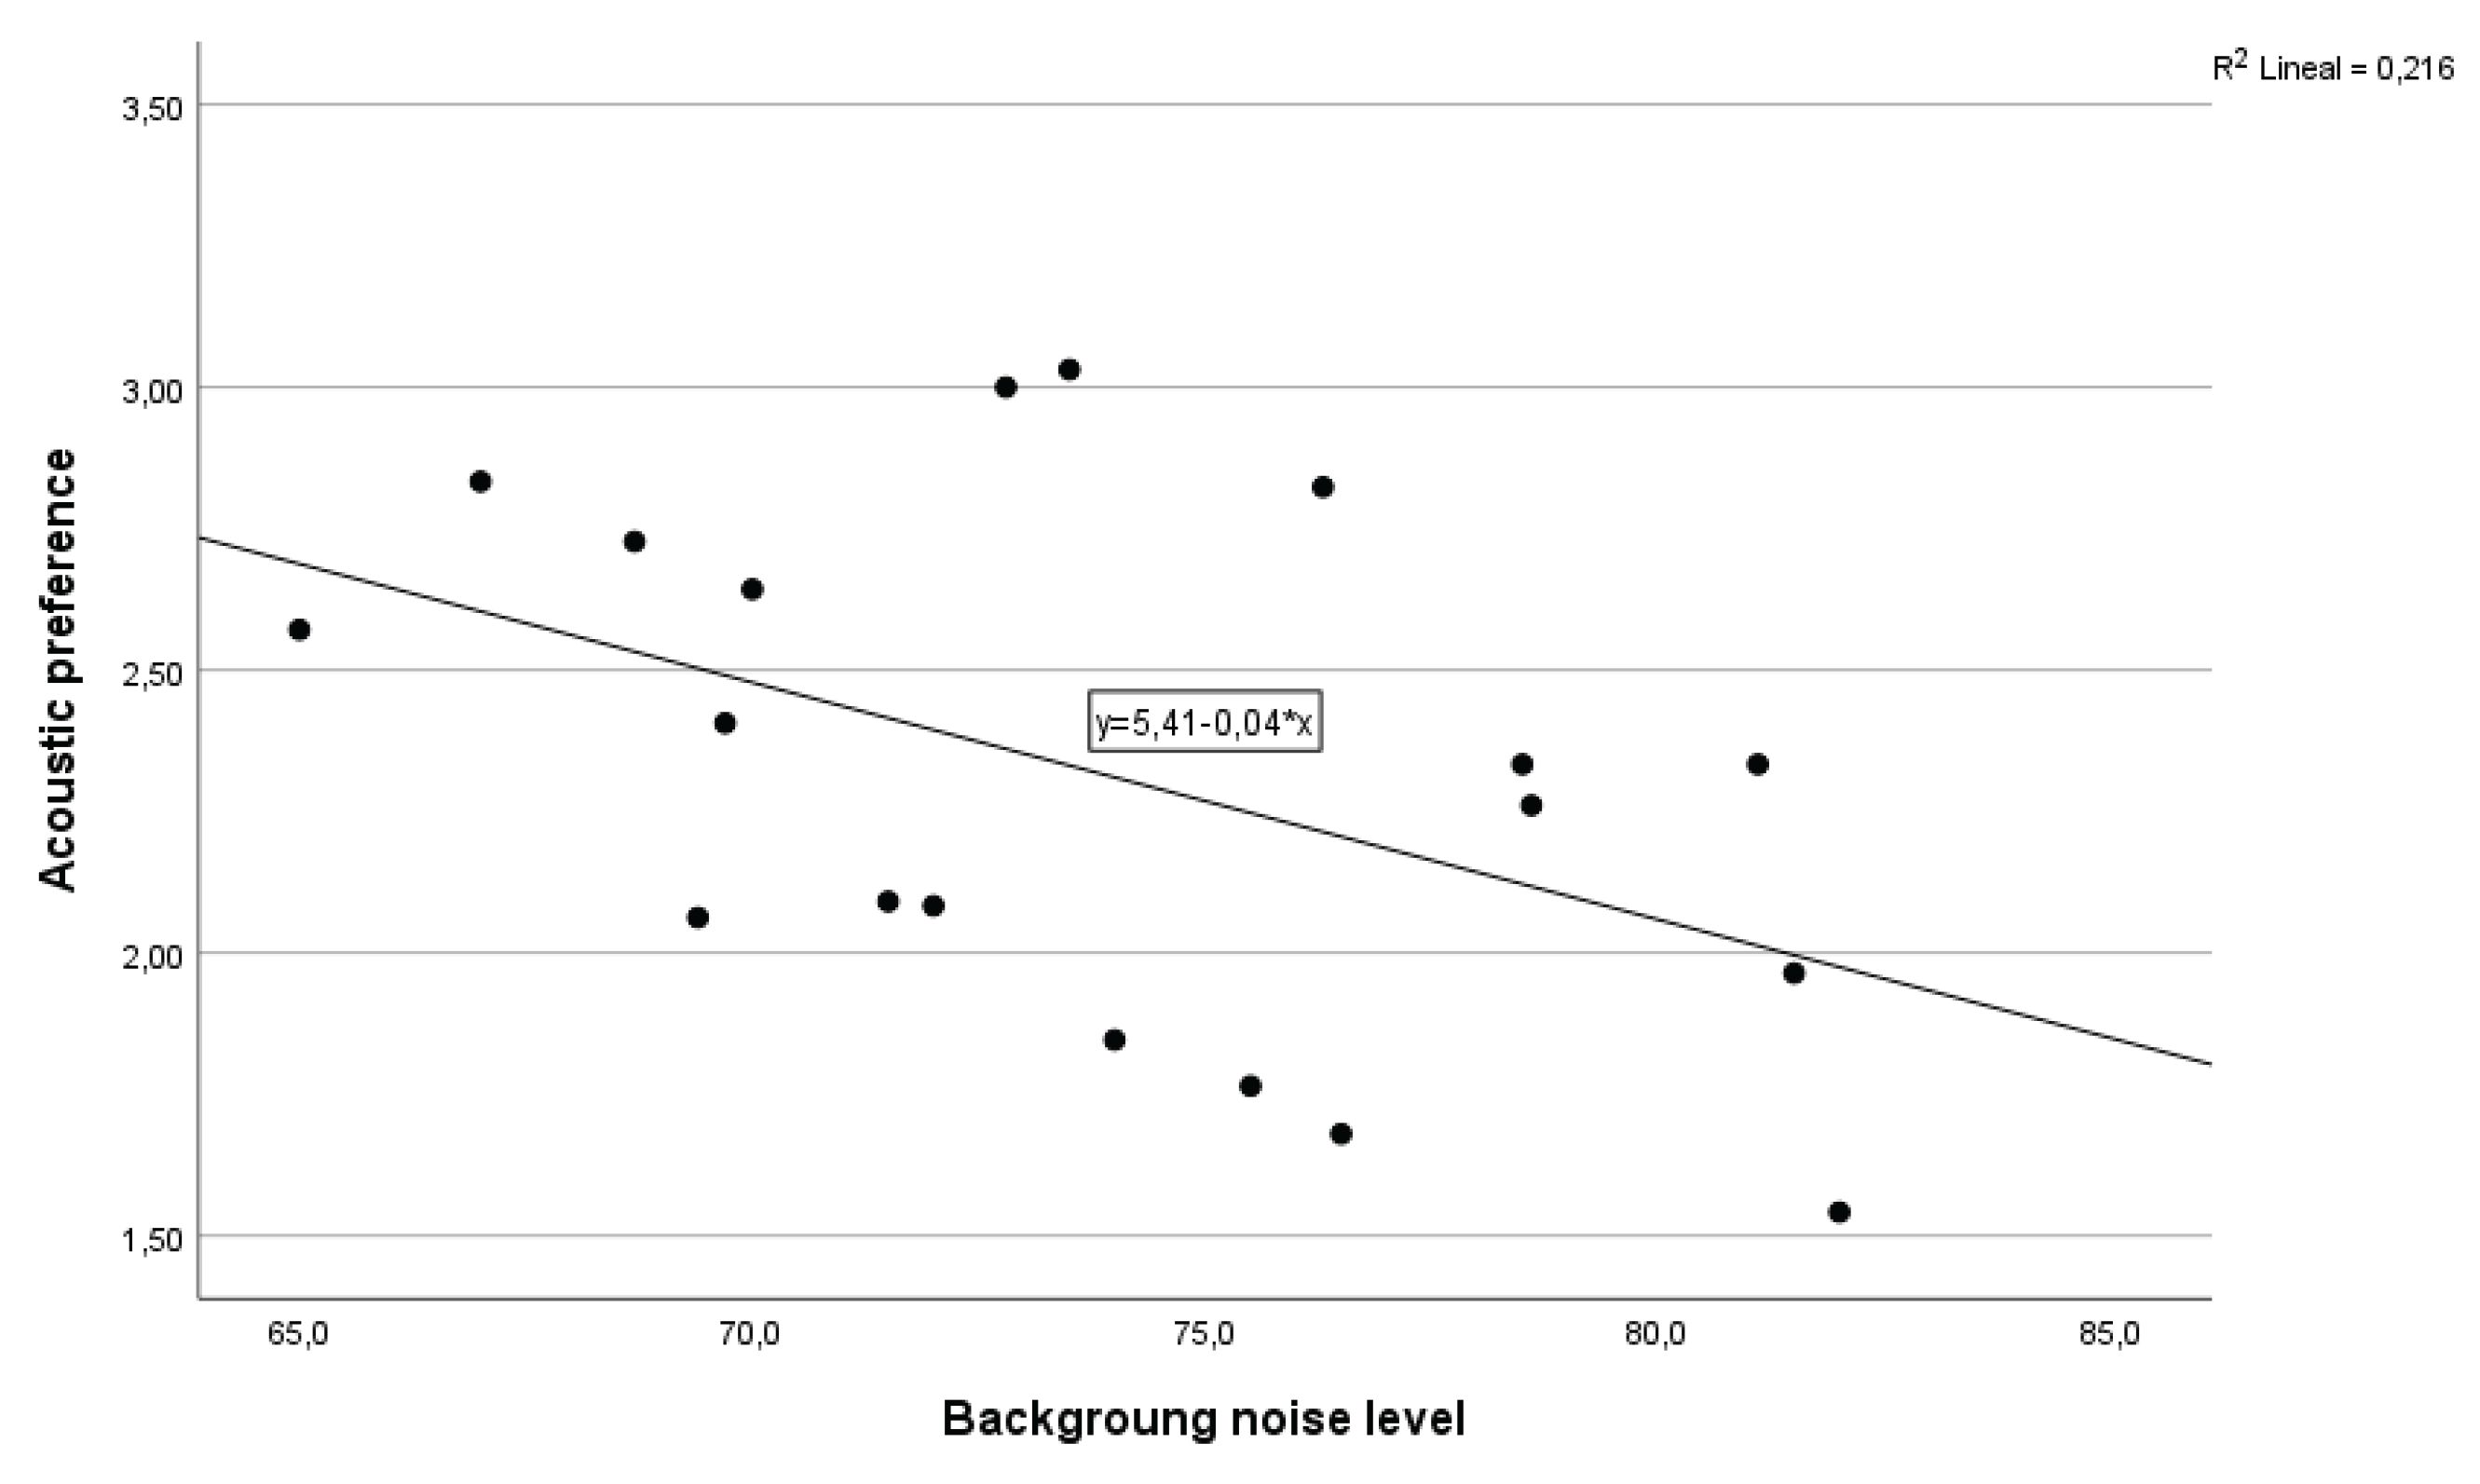
To further clarify the relationship between subjective responses and potential outcomes, linear regressions were conducted between the design parameters that exhibited the most influence on the perceived acoustic environment
(Table 7). However, the percentage of sound absorption material was not included due to its non-normal distribution.
Figure 7,
Figure 8,
Figure 9 and
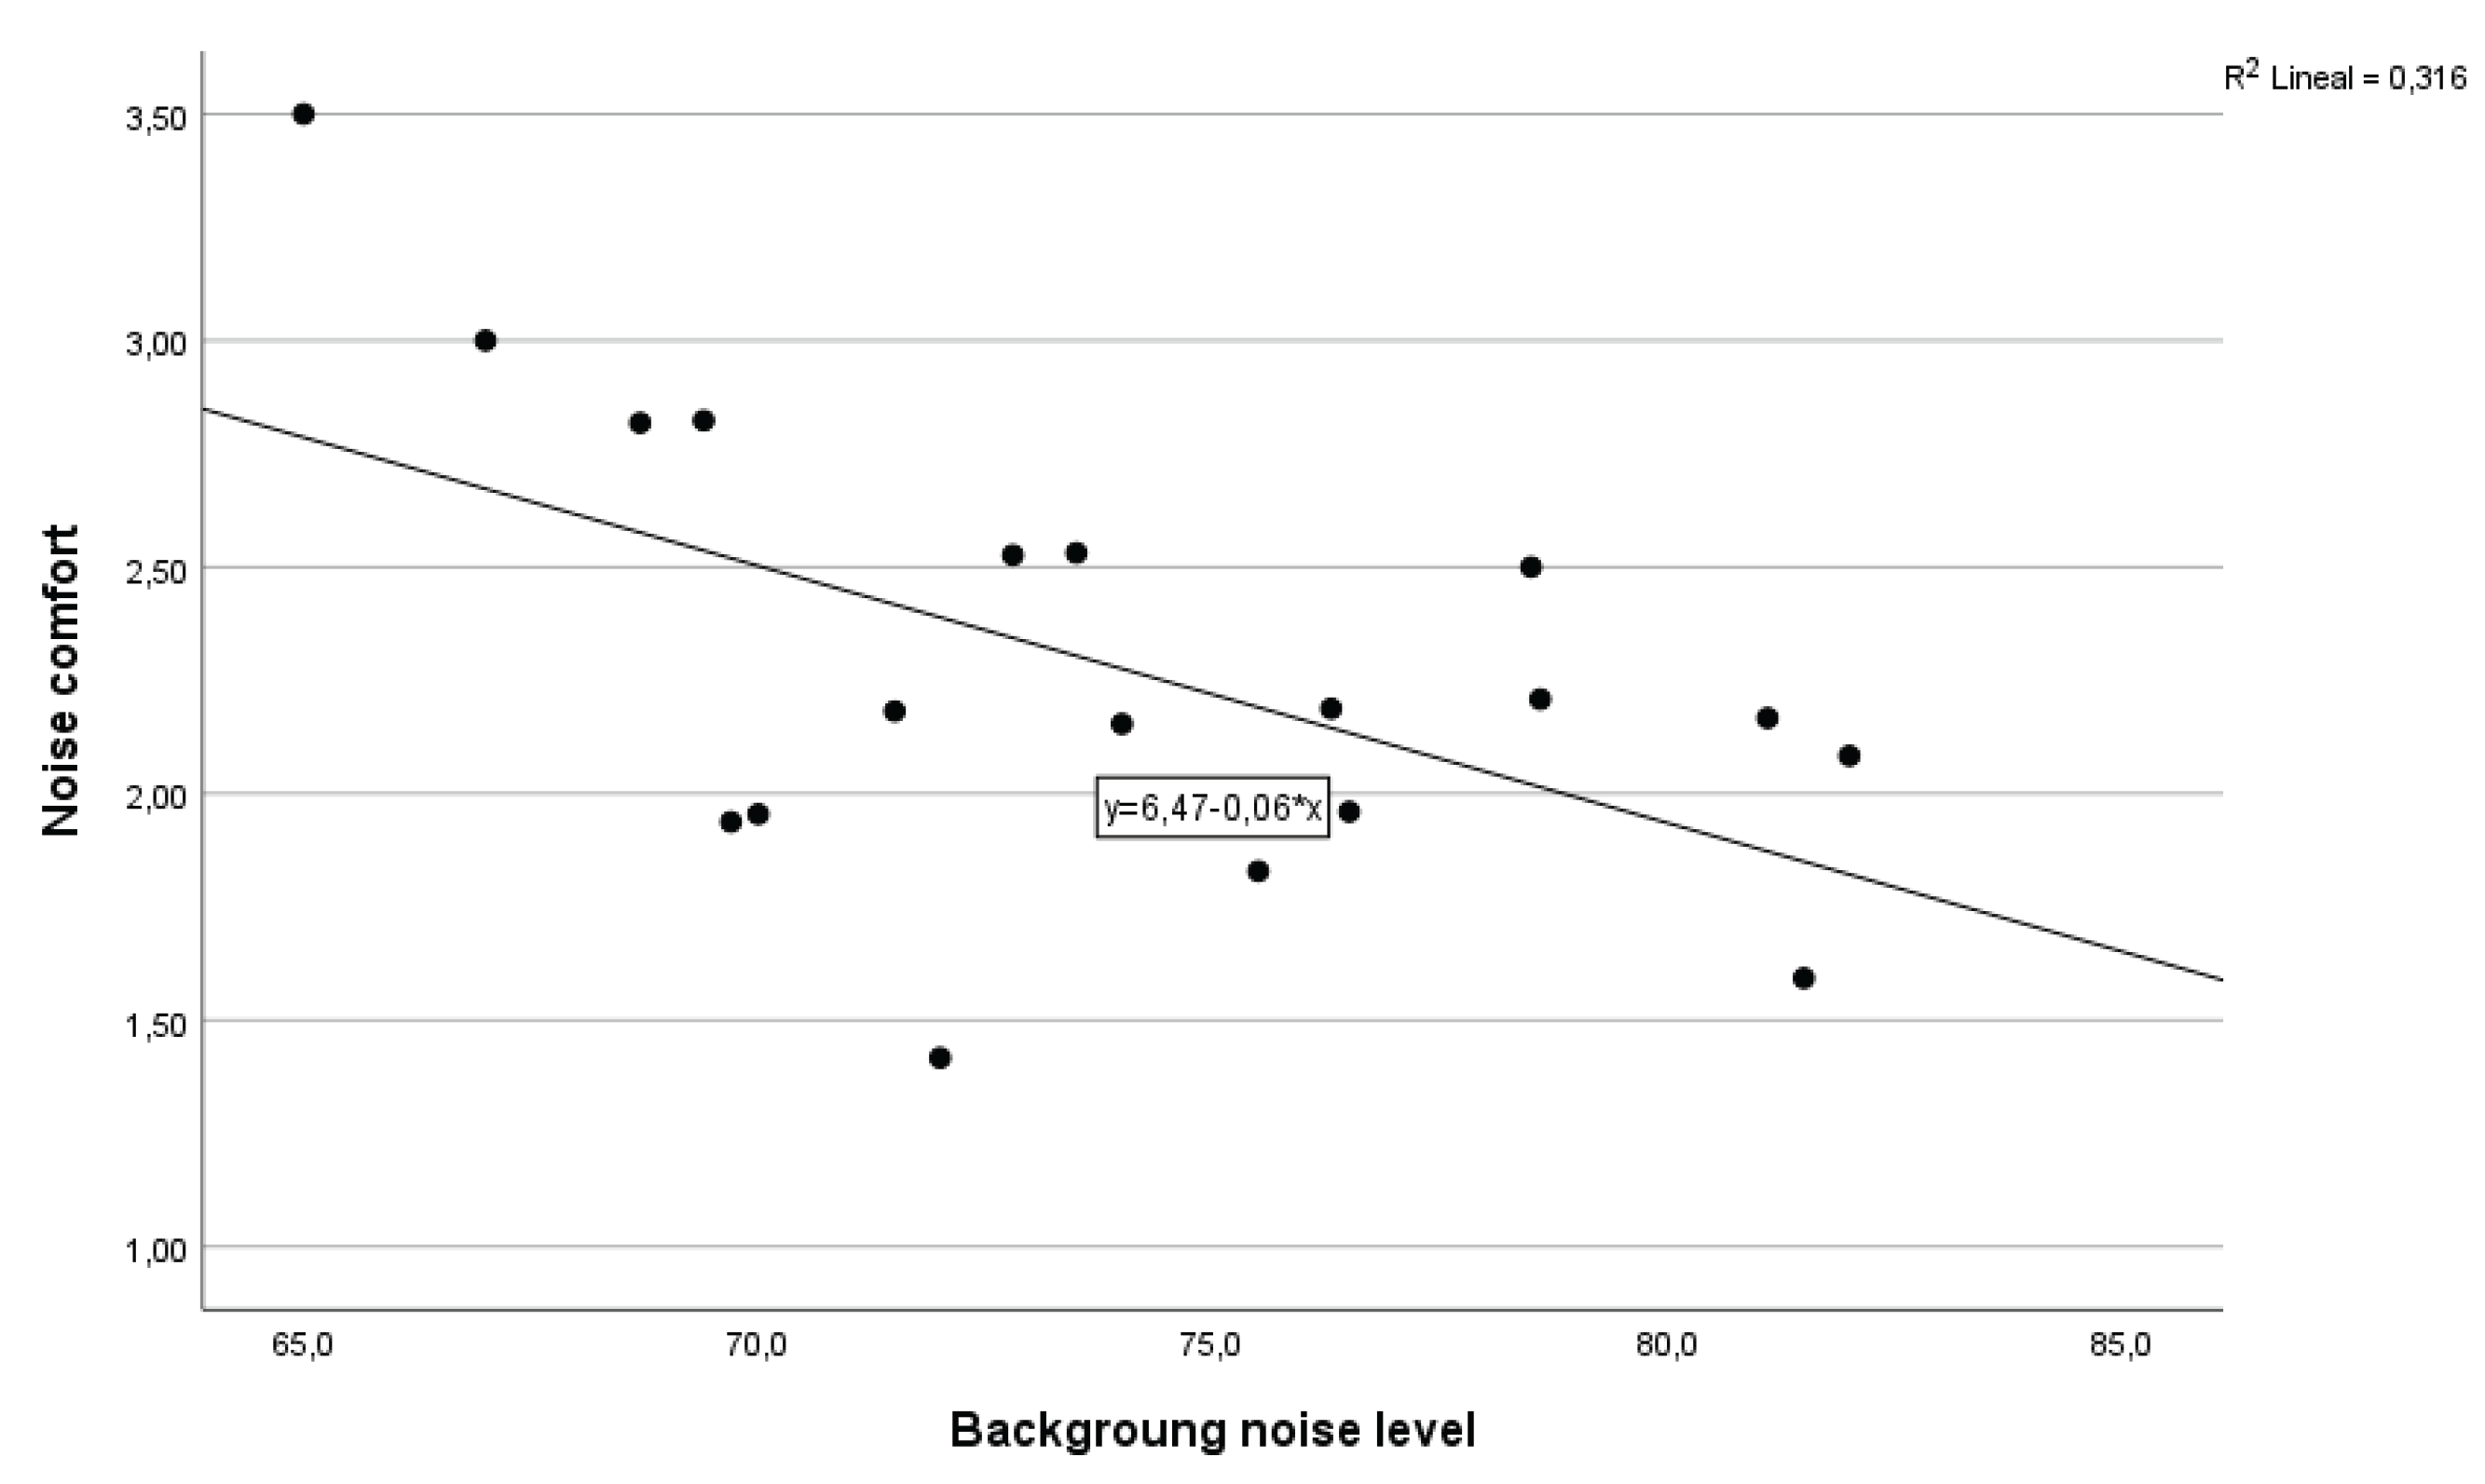
Figure 10 displays the regression lines between occupied background noise level (Ln) and subjective responses. Firstly, the equation representing noise comfort perception (IEQ04) and Ln (
Figure 7) was found to be statistically significant with F
(1,17) = 7.84, p=0.012, and R
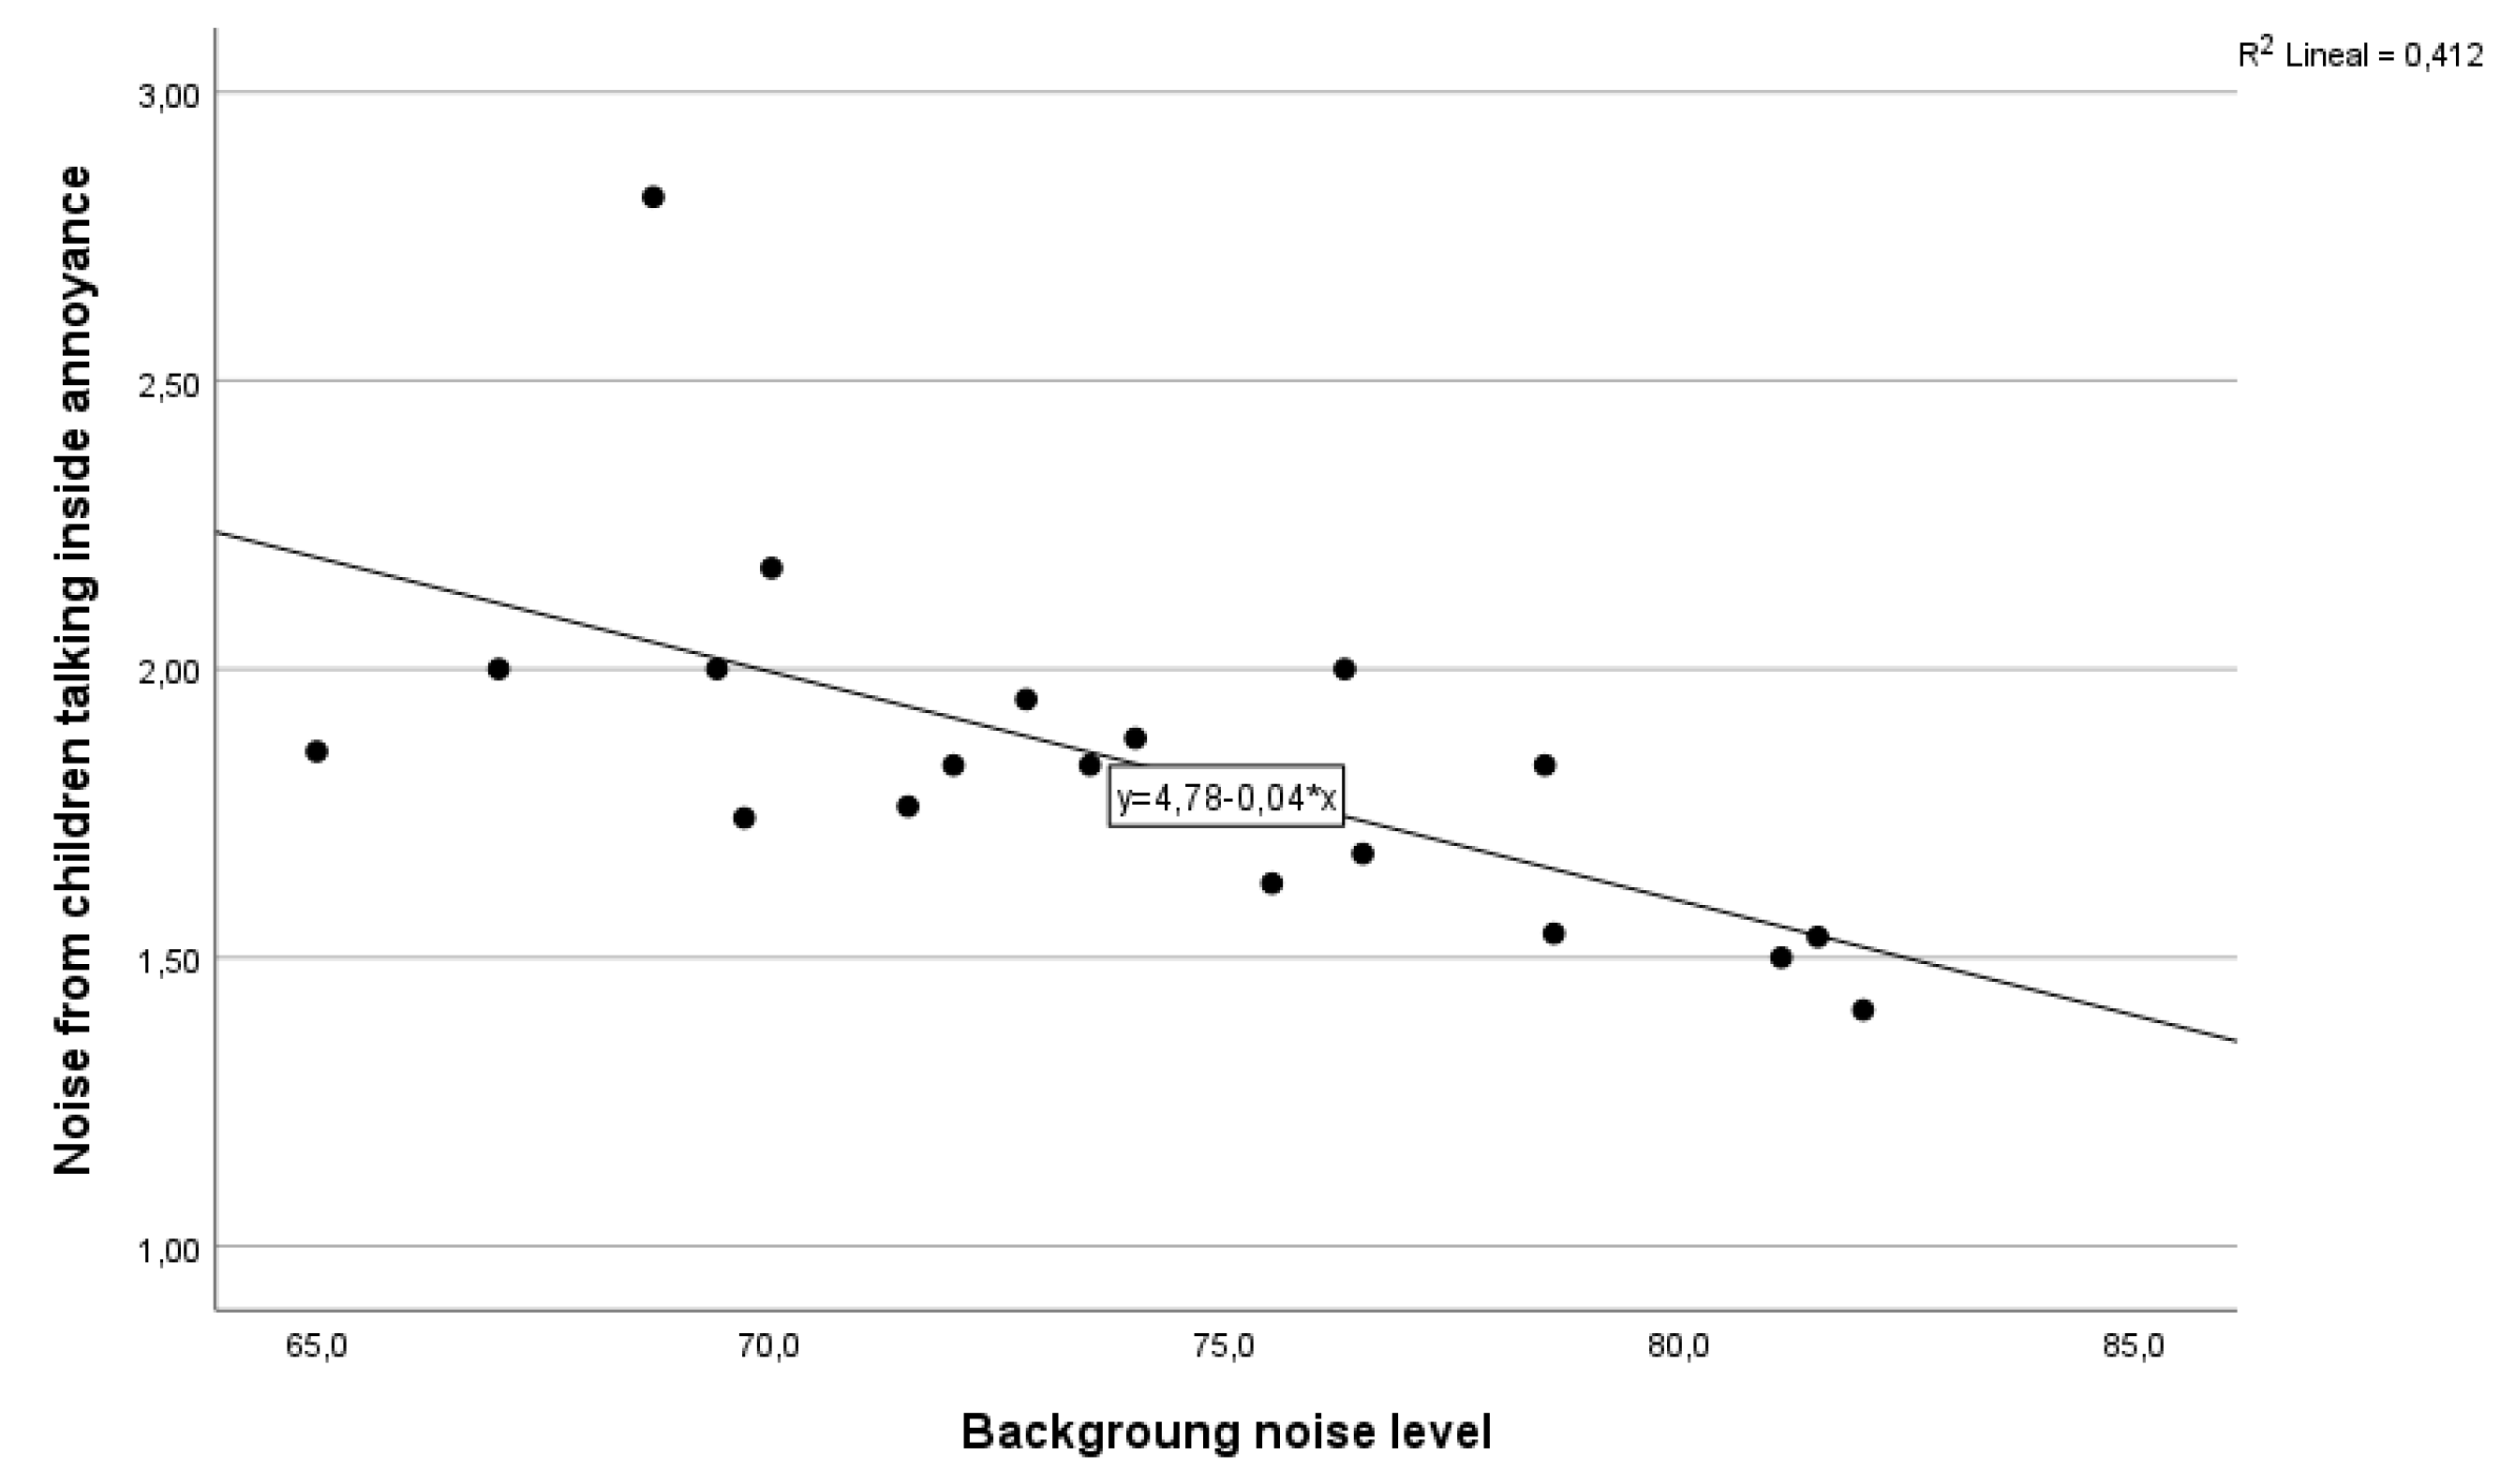
2 value suggesting that 32% of the variation in noise comfort responses can be explained by the level of background noise measured during the survey. Additionally, the relationship between annoyance caused by noise from children talking inside (NA05) and noise level (
Figure 8) shown a statistically significant equation with F
(1,17) = 11.9 , p=0.003, indicating that 41% of the variation in annoyance responses can be attributed to the occupied background noise level.
Figure 9 suggests that the 46% of responses regarding noise annoyance from children moving inside the spaces (NA06) can be explained by the background noise level (F
(1,17) = 14.6 , p=0.001). On the other hand, the equation representing noise preference (AP01) and Ln (
Figure 10) revealed that 22% of the acoustic preference was explained by the noise level at the time of the study, with a statistically significant equation F
(1,17) = 4.67, p=0.045.
4. Discussion
The aim of this research was to identify the characteristics of physical learning space that influence the acoustic environment as perceived by students. To reach this purpose, two main aspects were explored: (i) the differences in the perception of the acoustic environment according to the type of learning space, including layout (flexible or traditional) and the acoustic treatment; (ii) the association between the design parameters of learning spaces and the perception of the acoustic environment.
4.1. Impact of the Learning Space Space on Acoustic Environment Perceived
Finding suggest that the layout of the learning space (traditional or flexible setting) has a significant influence on acoustic perception, particularly concerning noise discomfort and acoustic preference. Traditional learning spaces without acoustic treatment (TRA.NA) exhibited higher levels of noise discomfort and a need of a much quieter environment. Significant differences on noise comfort were also found between the groups of learning spaces. These outcomes corroborate previous surveys studies [
25,
40] that identified noise as the most uncomfortable IEQ aspect compared to daylight, air quality, and temperature in classrooms. Additionally, in the context of public libraries, other study has found a correlation between space layout and acoustic comfort [
41].
Regarding noise source annoyance, it has been suggested that noise made by students was rated as the situation which most interfered with their ability to hear the teacher [
42]. In our study, noise annoyance caused by children talking inside the space was more prevalent in all group of spaces, except in flexible learning environments with acoustic treatment (FLE.AA), where external noise from schoolyards or hallways was more dominant in annoyance ratings. Although noise annoyance has been associated more with its intrusiveness than its proximity level [
43], there is no consensus about which type of noise source causes more bother. Some research has found higher annoyance rating with noise sources from traffic or adjacent school environments [
44], while others have identified children talking as more bothersome [
25].
In flexible learning spaces, similar patterns were observed; spaces lacking acoustic treatment (FLE.NA) showed higher levels of noise discomfort and annoyance compared to those with acoustic treatment (FLE.AA). Thus, the presence of acoustic treatment appeared to influence the students’ perception within each typology group (FLE or TRA). This is consistent with previous research [
44,
45] which found that poor classrooms acoustics are related to an increased perception of noise intensity and disturbance.
In line with Connolly et al. [
42], in rating of hearing ability across the groups of spaces, no significant differences were found that suggest pupils differentiate their hearing conditions based on both the typology of learning space and the acoustic treatment. However, flexible learning spaces were rated as slightly more challenging for hearing in group work scenarios, whereas traditional spaces were rated as more problematic during silent tasks.
Although there are various categories for evaluating acoustic preference [
46,
47,
48], which include a range of psychological indicators such as soundscape, acoustic environment, and background noise, this study’s rating of acoustic preference was developed according to ISO 28802 [
37] through the evaluation of current acoustic environment preference. Similarly to the results of noise comfort, the preference rating showed significant differences between learning spaces, more between those with different space layouts than between different acoustic treatments.
4.2. Association between Design Parameters and Perceived Acoustic Environment
The study found architectural design parameters as key factors influencing students’ assessments of their learning environments. This finding can guide designers in their efforts to enhance the functionality and well-being of these crucial spaces, especially given that design parameters have not been extensively explored in previous studies on students’ perception of acoustical environment.
Particularly, the results revealed a significant relationship between the levels of background noise in occupied conditions and noise comfort, annoyance from both external and internal noise sources, and acoustic preferences. External noise sources encompassed noises from outside, such as traffic or from other learning spaces, while internal noise sources referred to noise generated by children talking or moving within the learning spaces. This outcome aligns with previous research that found a significant association between noise levels measured within classrooms and perception of outdoor noise sources [
44].
These results underscore the importance of properly considering and managing background noise, particularly given that background noise levels measured under occupied conditions exceeded recommended thresholds of 65 dBA, compared to the recommended levels of below 55 dB for primary school classrooms and 45 dB for classrooms catering to hearing/language impaired children [
49]. Furthermore, a notable correlation was observed between noise levels and the square meters of sound-absorption materials, as well as space density.
The percentage of sound-absorption material was found to be linked to varying degrees of annoyance external and internal noise sources, as well as the teacher’s ability to hear during quiet tasks. Conversely, prior research indicated that students were not annoyed by noise in untreated learning spaces with a spatial density exceeding 2.1 m
2 per student [
40], highlighting the impact of spatial density on experience. Another study focusing on students’ perceptions of suitability of the physical environment, with an emphasis on acoustics, for their learning activities in informal learning spaces [
50], found that crowded spaces negatively affected acoustic perception, suggesting that density play a more significant role than sound levels in perceptions of informal learning spaces.
4.3. Strenghts and Limitation
The results presented in this study confirm the impact of the physical learning space on the perception of the acoustic environment, especially on comfort, noise annoyance, and acoustic preference. The main strength of the study is the wide range of learning spaces where the layout type and acoustic treatment played a crucial role in the analysis of the data. This is a first study that examine the combined effect of design parameters, noise measurement, and perception, considering traditional and flexible learning spaces with and without acoustic treatment in the global south.
There are also several limitations and further studies are required to validate the presents results. In Chile, most schools lack acoustic conditioning due to the absence of regulatory requirements. Consequently, the small number of learning spaces included in the research was limited by the schools’ willingness to participate, especially those with acoustic treatment, which were more difficult to find it. Therefore, only tentative conclusions can be suggested regarding the impact of design parameters on acoustic perception. On the other hand, the questionnaire was completed by children aged 8-11 years old, who may have faced post-COVID-19 challenges in reading comprehension. Although these questions were explained with the assistance of teachers, it could have introduced bias in the responses.
Additionally, occupant noise levels were measured during the survey procedure. Noise situation during lessons in different scenarios such as presentation of teacher and group work could be more accurate for final conclusions.
5. Conclusions
Considering the transition from traditional to more flexible learning environments, these findings highlight the role of design parameters in shaping the acoustic environment and its impact on students’ learning experiences. Especially, the type of learning space, whether traditional or flexible settings, has a significant impact on the acoustic perception among primary students. Flexible spaces with acoustic treatment were associated with improved acoustic comfort, less noise annoyance, and enhanced hearing abilities compared to traditional spaces without acoustic treatment. Notably, traditional learning environments exhibited higher levels of noise discomfort and annoyance from various sources, such as children talking and moving inside the space. In contrast, flexible learning spaces with acoustic treatment showed better outcomes in terms of acoustic preference and noise perception. These results underline the importance of optimizing the acoustic experience in educational spaces for the well-being and learning of students. Moving forward, it will be essential to align the architectural design with contemporary educational needs, providing acoustic comfort but also supporting dynamic pedagogical approaches for the 21st century.
Author Contributions
Conceptualization, C.I; methodology, C.I., M.T. and M.T; software, C.I.; validation, C.I. and B.P.; formal analysis, C.I.; investigation, C.I.; resources, C.I.; data curation, C.I.; writing—original draft preparation, C.I.; writing—review and editing, C.I, B.P., M.T.; visualization, C.I.; supervision, B.P. and M.T.; project administration, C.I..; funding acquisition, C.I. All authors have read and agreed to the published version of the manuscript.
Funding
This research was funded by Agencia Nacional de Investigación y Desarrollo (DOCTORADO NACIONAL 2020-70220191).
Acknowledgments
The authors thank Fondecyt Regular Nº 1210701 for their support. Furthermore, the authors extend their appreciation to the teachers, students, and school administrations whose collaboration made this work possible.
Conflicts of Interest
The authors declare no conflict of interest. The funders had no role in the design of the study; in the collection, analyses, or interpretation of data; in the writing of the manuscript; or in the decision to publish the results.
References
- Dovey, K.; Fisher, K. The Journal of Architecture Designing for adaptation: the school as socio-spatial assemblage. The Journal of Architecture 2014, 19, 43–63. [Google Scholar] [CrossRef]
- Niemi, K. ‘The best guess for the future?’ Teachers’ adaptation to open and flexible learning environments in Finland. Education Inquiry 2021, 12, 282–300. [Google Scholar] [CrossRef]
- Kokko, A.K.; Hirsto, L. From physical spaces to learning environments: processes in which physical spaces are transformed into learning environments. Learn Environ Res 2021, 24, 71–85. [Google Scholar] [CrossRef]
- Imms, W.; Kvan, T. Teacher Transition into Innovative Learning Environments: A Global Perspective. Springer Singapore, 2020.
- Imms, W.; Mahat, M.; Byers, T.; Murphy, D. (2017) Type and Use of Innovative Learning Environments in Australasian Schools ILETC Survey No. 1. Melbourne.
- Deed, C.; Blake, D.; Henriksen, J. , et al. Teacher adaptation to flexible learning environments. 2020, 23, 153–165. [Google Scholar] [CrossRef]
- Attai, S.L.; Reyes, J.C.; Davis, J.L.; et al. Investigating the impact of flexible furniture in the elementary classroom. Learn Environ Res 2021, 24, 153–167. [Google Scholar] [CrossRef]
- Charteris, J.; Smardon, D.; Nelson, E. Innovative learning environments and new materialism: A conjunctural analysis of pedagogic spaces. Educational Philosophy and Theory 2017, 49, 808–821. [Google Scholar] [CrossRef]
- Barrett, P.; Davies, F.; Zhang, Y.; Barrett, L. The impact of classroom design on pupils’ learning: Final results ofaholistic, multi-level analysis. Build Environ 2015, 89, 118–133. [Google Scholar] [CrossRef]
- Barrett, P.; Treves, A.; Shmis, T. The Impact of School Infrastructure on Learning: A Synthesis of the Evidence. World Bank Group, Washington, DC, 2019.
- López-Chao, V.; Lorenzo, A.A.; Saorín, J.L.; et al. Classroom indoor environment assessment through architectural analysis for the design of efficient schools. Sustainability (Switzerland) 2020, 12, 1–12. [Google Scholar] [CrossRef]
- Piderit-Moreno, M.B.; Leighton, J.; Chandia, V.; Perez-Fargallo, A. Method to assess the integration of personalization, stimulus and environmental design principles in school classrooms. In: Journal of Physics: Conference Series. Institute of Physics 2023.
- Carlos, V.; Reses, G.; Soares, S.C. Active learning spaces design and assessment: a qualitative systematic literature review. Interactive Learning Environments 2023. [Google Scholar] [CrossRef]
- Mealings, K.T.; Buchholz, J.M.; Demuth, K.; Dillon, H. Investigating the acoustics of a sample of open plan and enclosed Kindergarten classrooms in Australia. Applied Acoustics 2015, 100, 95–105. [Google Scholar] [CrossRef]
- Vijapur, D.; Candido, C.; Göçer, Ö. A Ten-Year Review of Primary School Flexible Learning Environments: Interior Design and IEQ Performance. 2021, 11, 183. [CrossRef]
- Dockreill, J.E.; Shield, B.M. Acoustical barriers in classrooms: The impact of noise on performance in the classroom. Br Educ Res J 2006, 32, 509–525. [Google Scholar] [CrossRef]
- Klatte, M.; Hellbrück, J.; Seidel, J.; Leistner, P. Effects of Classroom Acoustics on Performance and Well-Being in Elementary School Children: A Field Study. Environ Behav 2010, 42, 659–692. [Google Scholar] [CrossRef]
- Shield, B.; Greenland, E.; Dockrell, J. Noise in open plan classrooms in primary schools: A review. Noise Health 2010, 12, 225–234. [Google Scholar] [CrossRef] [PubMed]
- Liebl, A.; Haller, J.; Jödicke, B.; et al. Combined effects of acoustic and visual distraction on cognitive performance and well-being. Appl Ergon 2012, 43, 424–434. [Google Scholar] [CrossRef]
- Shield, B.M.; Dockrell, J.E. The effects of environmental and classroom noise on the academic attainments of primary school children. Citation: The Journal of the Acoustical Society of America 2008, 123, 2964. [Google Scholar] [CrossRef] [PubMed]
- Mealings, K.; Buchholz, J.M. The effect of classroom acoustics and noise on high school students’ listening, learning and well-being: a scoping review. Facilities. 2024. [Google Scholar] [CrossRef]
- Geller, R.J.; Rubin, I.L.; Nodvin, J.T.; et al. Safe and Healthy School Environments. Pediatr Clin North Am 2007, 54, 351–373. [Google Scholar] [CrossRef] [PubMed]
- Karjalainen, S.; Brännström, J.K.; Christensson, J.; et al. A Pilot Study on the Relationship between Primary-School Teachers’ Well-Being and the Acoustics of their Classrooms. International Journal of Environmental Research and Public Health Article 2020, 17. [Google Scholar] [CrossRef]
- Turunen, M.; Toyinbo, O.; Putus, T.; et al. Indoor environmental quality in school buildings, and the health and wellbeing of students. Int J Hyg Environ Health 2014, 217, 733–739. [Google Scholar] [CrossRef]
- Bluyssen, P.M.; Zhang, D.; Kurvers, S.; et al. Self-reported health and comfort of school children in 54 classrooms of 21 Dutch school buildings. Build Environ 2018, 138, 106–123. [Google Scholar] [CrossRef]
- Alterator, S.; Deed, C. Teacher adaptation to open learning spaces. Issues in Educational Research 2013, 23, 315–330. [Google Scholar]
- Åhlander, V.L.; Rydell, R.; Löfqvist, A. Speaker’s Comfort in Teaching Environments: Voice Problems in Swedish Teaching Staff. Journal of Voice 2011, 25, 430–440. [Google Scholar] [CrossRef] [PubMed]
- Mogas-Recalde, J.; Palau, R.; Márquez, M. How Classroom Acoustics Influence Students and Teachers: A Systematic Literature Review. J Technol Sci Educ 2021, 11, 245–259. [Google Scholar] [CrossRef]
- Ipinza, C.; Trebilcock-Kelly, M.; Piderit-Moreno, M.B. (2023) Barriers and Challenges of Acoustic Design in Flexible Learning Spaces for Schools in Chile. In: Green Energy and Technology. Springer Science and Business Media Deutschland GmbH, pp 295–310.
- Shield, B.; Conetta, R.; Dockrell, J.; et al. A survey of acoustic conditions and noise levels in secondary school classrooms in England. J Acoust Soc Am 2015, 137, 177–188. [Google Scholar] [CrossRef]
- Greenland, E.E.; Shield, B.M. A survey of acoustic conditions in semi-open plan classrooms in the United Kingdom. J Acoust Soc Am 2011, 130, 1399–1410. [Google Scholar] [CrossRef]
- Aguilar, J.R. Una mirada a los criterios de diseño acústico de la infraestructura educacional en Chile. Revista ingeniería de construcción 2019, 34, 115–123. [Google Scholar] [CrossRef]
- MINEDUC (2016) Criterios de diseño para los nuevos espacios educativos. Santiago.
- Nair, P. (2014) Blueprint for Tomorrow: Redesigning Schools for Student-Centered Learning. Harvard Education Press.
- Ministry of Education (2020) Designing Quality Learning Spaces (DQLS) Acoustics. New Zealand.
- Mealings, K.T.; Dillon, H.A.; Buchholz, J.M.; Demuth, K. An assessment of open plan and enclosed classroom listening environments for young children: Part 1-Children’s questionnaires. 2015; 1. [Google Scholar]
- ISO 28802 (2012) ISO 28802, Ergonomics of the physical environment-Assessment of environments by means of an environmental survey involving physical measurements of the environment and subjective responses of people.
- World Health Organization (2018) NOISE GUIDELINES for the European Region EXECUTIVE SUMMARY.
- Guski, R.; Schreckenberg, D.; Schuemer, R. WHO environmental noise guidelines for the European region: A systematic review on environmental noise and annoyance. Int J Environ Res Public Health 2017, 14. [Google Scholar] [CrossRef]
- Ipinza-Olatte, C.; Piderit-Moreno, M.B.; Bluyssen, P.; Trebilcock-Kelly, M. Students’ Perceptions of acoustic comfort in traditional and flexible learning environments: a study in Chile. J Phys Conf Ser 2023, 2600, 122001. [Google Scholar] [CrossRef]
- Xiao, J.; Aletta, F. A soundscape approach to exploring design strategies for acoustic comfort in modern public libraries: A case study of the Library of Birmingham. Noise Mapping 2016, 3, 264–273. [Google Scholar] [CrossRef]
- Connolly, D.; Dockrell, J.; Shield, B.; et al. Adolescents’ perceptions of their school’s acoustic environment: The development of an evidence based questionnaire. Noise Health 2013, 15, 269–280. [Google Scholar] [CrossRef]
- Guski, R.; Felscher-Suhr, U.; Schuemer, R. THE CONCEPT OF NOISE ANNOYANCE: HOW INTERNATIONAL EXPERTS SEE IT. J Sound Vib 1999, 223, 513–527. [Google Scholar] [CrossRef]
- Astolfi, A.; Puglisi, G.E.; Murgia, S.; et al. Influence of Classroom Acoustics on Noise Disturbance and Well-Being for First Graders. Front Psychol 2019, 10. [Google Scholar] [CrossRef] [PubMed]
- Zhang, D.; Tenpierik, M.; Bluyssen, P.M. The effect of acoustical treatment on primary school children’s performance, sound perception, and influence assessment. E3S Web of Conferences 2019, 111, 1–8. [Google Scholar] [CrossRef]
- Hamida, A.; Zhang, D.; Ortiz, M.A.; Bluyssen, P.M. Indicators and methods for assessing acoustical preferences and needs of students in educational buildings: A review. Applied Acoustics 2023, 202. [Google Scholar] [CrossRef]
- Çankaya, S.; Yilmazer, S. The effect of soundscape on the students’ perception in the high school environment.
- Hamida, A.; Eijkelenboom, A.; Bluyssen, P.M. Profiling university students based on their acoustical and psychosocial preferences and characteristics of their home study places. Build Environ 2024, 253, 111324. [Google Scholar] [CrossRef]
- Mealings, K. Classroom acoustic conditions: Understanding what is suitable through a review of national and international standards, recommendations, and live classroom measurements. 2nd Australasian Acoustical Societies Conference, ACOUSTICS 2016, 2, 1047–1056. [Google Scholar]
- Brännström, K.J.; Johansson, E.; Vigertsson, D.; et al. How Children Perceive the Acoustic Environment of Their School. Noise Health 2017, 19, 84–94. [Google Scholar] [CrossRef]
Figure 1.
Plans of learning environments studied by groups TLE.NA, TLE.AA, FLE.NA, FLE.AA.
Figure 1.
Plans of learning environments studied by groups TLE.NA, TLE.AA, FLE.NA, FLE.AA.
Figure 2.
Average of Ln,15 min (dBA) per group of learning space.
Figure 2.
Average of Ln,15 min (dBA) per group of learning space.
Figure 3.
Students’ answers regarding IEQ conditions by type of learning space.
Figure 3.
Students’ answers regarding IEQ conditions by type of learning space.
Figure 4.
Students’ answers regarding different noise sources by type of learning space.
Figure 4.
Students’ answers regarding different noise sources by type of learning space.
Figure 5.
Students’ answers regarding hearing abilities in different learning scenarios by type of learning space.
Figure 5.
Students’ answers regarding hearing abilities in different learning scenarios by type of learning space.
Figure 6.
Students’ answers regarding acoustic preference by type of learning space.
Figure 6.
Students’ answers regarding acoustic preference by type of learning space.
Figure 7.
Linear regression graph between Ln (dBA) and noise comfort perception (IEQ04).
Figure 7.
Linear regression graph between Ln (dBA) and noise comfort perception (IEQ04).
Figure 8.
Linear regression graph between Ln (dBA) and annoyance by noise from children talking inside (NA05).
Figure 8.
Linear regression graph between Ln (dBA) and annoyance by noise from children talking inside (NA05).
Figure 9.
Linear regression graph between Ln (dBA) and Noise annoyance from children moving inside (NA06).
Figure 9.
Linear regression graph between Ln (dBA) and Noise annoyance from children moving inside (NA06).
Figure 10.
Linear regression graph between Ln (dBA) and noise preference (AP01).
Figure 10.
Linear regression graph between Ln (dBA) and noise preference (AP01).
Table 1.
Learning space characteristics.
Table 1.
Learning space characteristics.
| ID |
Acoustic Design Parameters |
Flexible Design Parameters |
| Height (m) |
Area (m2) |
Volume (m3) |
Absorption (%) |
Glass (%) |
Window
material* |
Potential noise sources |
Ln (dBA)** |
Spatial
Density (m2/student) |
Learning
zones (n) |
Diversity of furniture (n) (n) |
Space
adaptability |
| TLE.NA01 |
2.9 |
51.6 |
147.1 |
0.0 |
9.1 |
PVC/DVH |
No |
81.5 |
1.7 |
1.0 |
1.0 |
No |
| TLE.NA02 |
3.1 |
51.6 |
157.4 |
0.0 |
9.9 |
PVC/DVH |
Yes |
82.0 |
1.4 |
1.0 |
1.0 |
No |
| TLE.NA03 |
3.1 |
49.7 |
151.5 |
0.0 |
14.7 |
PVC/DVH |
Yes |
78.6 |
1.5 |
1.0 |
1.0 |
No |
| TLE.NA04 |
3.1 |
51.9 |
161.0 |
0.0 |
9.7 |
PVC/DVH |
Yes |
76.5 |
2.1 |
1.0 |
1.0 |
No |
| TLE.NA05 |
2.8 |
51.0 |
142.9 |
0.0 |
7.3 |
PVC/DVH |
Yes |
69.7 |
1.3 |
1.0 |
1.0 |
No |
| TLE.AA01 |
2.9 |
77.3 |
220.2 |
37.8 |
7.9 |
Alum/DVH |
Yes |
75.5 |
2.7 |
1.0 |
1.0 |
No |
| TLE.AA02 |
3.1 |
44.5 |
137.8 |
63.9 |
5.9 |
PVC/DVH |
Yes |
65.0 |
3.4 |
1.0 |
1.0 |
No |
| TLE.AA03 |
3.1 |
49.7 |
154.0 |
68.0 |
7.8 |
PVC/DVH |
No |
70.0 |
1.5 |
1.0 |
1.0 |
No |
| FLE.NA01 |
3.1 |
70.8 |
215.0 |
0.0 |
9.0 |
PVC/DVH |
No |
81.1 |
1.9 |
3.0 |
4.0 |
No |
| FLE.NA02 |
3.1 |
52.5 |
160.2 |
0.0 |
9.8 |
PVC/DVH |
No |
72.8 |
1.8 |
2.0 |
4.0 |
Yes |
| FLE.NA03 |
3.0 |
103.2 |
309.7 |
0.0 |
10.2 |
PVC/DVH |
Yes |
69.4 |
3.4 |
3.0 |
5.0 |
No |
| FLE.NA04 |
3.1 |
103.2 |
314.9 |
0.0 |
11.5 |
PVC/DVH |
Yes |
76.3 |
3.4 |
2.0 |
4.0 |
Yes |
| FLE.NA05 |
2.8 |
49.0 |
137.1 |
0.0 |
10.7 |
PVC/DVH |
Yes |
78.5 |
1.3 |
2.0 |
3.0 |
No |
| FLE.NA06 |
3.1 |
70.8 |
219.5 |
0.0 |
10.2 |
PVC/DVH |
Yes |
72.0 |
2.0 |
3.0 |
5.0 |
No |
| FLE.NA07 |
3.1 |
70.8 |
219.5 |
0.0 |
10.2 |
PVC/DVH |
Yes |
74.0 |
2.4 |
2.0 |
4.0 |
Yes |
| FLE.NA08 |
3.1 |
93.8 |
286.1 |
0.0 |
9.1 |
PVC/DVH |
Yes |
73.5 |
2.5 |
4.0 |
6.0 |
No |
| FLE.NA09 |
2.6 |
156.9 |
400.1 |
0.0 |
5.0 |
Alum/DVH |
Yes |
71.5 |
5.2 |
4.0 |
4.0 |
No |
| FLE.AA01 |
3.0 |
109.1 |
327.2 |
100.0 |
16.2 |
PVC/DVH |
Yes |
68.7 |
2.3 |
3.0 |
3.0 |
Yes |
| FLE.AA02 |
2.6 |
100.8 |
262.1 |
100.0 |
13.7 |
PVC/DVH |
No |
67.0 |
2.8 |
3.0 |
2.0 |
Yes |
*PVC: polyvinyl chloride; DVH: Hermetic Double glazing; Alum: Aluminum.
**Ln (dBA): background noise level in occupied conditions
|
Table 2.
Administered questionnaire on the acoustic environment perceived with scales and labels question by question.
Table 2.
Administered questionnaire on the acoustic environment perceived with scales and labels question by question.
| Topic |
ID |
Question |
Scale |
Labels |
| IEQ comfort perception |
|
|
|
Very uncomfortable (1), Uncomfortable (2) Slightly uncomfortable (3), Not uncomfortable (4) |
| Temperature |
IEQ01 |
How do you feel NOW:
with the temperature inside? |
1-4 |
| Air quality |
IEQ02 |
with the smell inside? |
1-4 |
| Daylight |
IEQ03 |
with the Daylight inside? |
1-4 |
| Noise |
IEQ04 |
with the Noise inside? |
1-4 |
| Noise annoyance |
|
|
|
|
Noise from outside
|
NA01
|
Are you bothered by the noise from outside?
(traffic, construction, siren, etc.) |
1-3 |
Always (1) Sometimes (2) Never (3) |
Noise from schoolyard or
hallway |
NA02 |
Are you bothered by the noise from schoolyard or hallways? |
1-3 |
| Noise from other spaces |
NA03 |
Are you bothered by the noise from other learning spaces? |
1-3 |
| Noise from fans or air conditioning |
NA04 |
Are you bothered by the noise from fans or air conditioning? |
1-3 |
| Noise from children talking inside |
NA05 |
Are you bothered by the noise from children talking inside the space? |
1-3 |
| Noise from children moving inside |
NA06 |
Are you bothered by the noise from children moving inside the space? |
1-3 |
| Hearing ability |
|
|
|
|
| During silent task |
HA01 |
Your class is quiet, and your teacher is speaking in front of the class: how well can you hear what the teacher is saying? |
1-5 |
Very well (1) Well (2) Not very well (3) Bad (4) Very bad (5) |
| HA02 |
A classmate is giving a response to your teacher when the class is quiet: how well can you hear what the teacher is saying? |
1-5 |
| During group activity |
HA03 |
Your class is working in groups and your teacher is talking to your group: how well can you hear what the teacher is saying? |
1-5 |
| HA04 |
Your class is working in groups: How well can you hear what your group mates are saying? |
1-5 |
| Acoustic preference |
AP01 |
How would you prefer the sound environment to be NOW? |
1-4 |
Much quieter (1) Quieter (2) Slightly quieter (3) No change (4) |
Table 3.
Demographics of the 465 respondents.
Table 3.
Demographics of the 465 respondents.
| Type of learning space |
TLE.NA |
TLE.AA |
FLE.NA |
FLE.AA |
All |
| |
|
n:131 |
n:87 |
n:203 |
n:39 |
n:465 |
| Gender* |
Female (%)
|
73 (57.9%)
|
49 (56.3%)
|
119 (58%)
|
21 (52.5%)
|
262 (59.0%)
|
| Male (%)
|
48 (36.1%)
|
36 (41.4%)
|
72 (35.1%)
|
16 (40.0%)
|
172 (38.7%)
|
| Non-binary (%)
|
5 (3.8%)
|
0 (0.0%)
|
4 (2.0%)
|
1 (2.5%)
|
10 (2.3%)
|
| Age |
Years (SD)
|
10(1) |
10(1)
|
10(1)
|
9(1)
|
10 (1)
|
| Mother tongue** |
Spanish (%)
|
128 (97.7%)
|
85 (98.8%)
|
195 (97.5%)
|
40 (100%)
|
448 (98.0%)
|
| Other (%)
|
3 (2.3%)
|
1 (1.2%)
|
5 (2.4%)
|
0 (0.0%)
|
9 (2.0%) |
| *21 missing values |
| **8 missing values |
Table 4.
Learning space characteristics by group.
Table 4.
Learning space characteristics by group.
| Type of learning space |
TLE.NA (n:5) |
TLE.AA (n:3) |
FLE.NA
(n:9) |
FLE.AA (n:2) |
All
(n:19) |
| Acoustic design parameters |
|
|
|
|
|
| Geometry of the space |
Height (mt) |
2.8 (0.1) *
|
3.0 (0.9)
|
3.0 (0.2)
|
2.8 (0.3)
|
2.9 (0.2)
|
| Floor area (m2) |
51.0 (0.9)
|
57.1 (17.6)
|
57.7 (33.3)
|
104.9 (5.8)
|
71.6 (27.8)
|
| Volume (m2) |
142.9 (7.4)
|
170.0 (43.7)
|
251.4 (83.2)
|
294.6 (46)
|
208.2 (73.0)
|
| Acoustic conditioning |
Absorbent material (%) |
0.0% |
56.6% (16.4)
|
0.0% |
100.% |
19.0% (33.4)
|
| Percentage of glass (%) |
7.3 (2.7) |
7.2 (1.1)
|
9.5 (1.9)
|
15.0 (1.8)
|
9.7 (2.4)
|
| Acoustic insulation |
Windows DVH/PVC (yes) |
100% |
67% |
89% |
100% |
88% |
| Windows DVH/aluminum (yes) |
0% |
33% |
11% |
0% |
12% |
| Potential noise sources (yes) |
80% |
67% |
78% |
50% |
67% |
| Flexible design parameters |
|
|
|
|
|
| Use |
spatial density (m2/student) |
1.3 (0.3)
|
2.5 (1.0)
|
2.6 (1.2)
|
2.5 (0.4)
|
2.2 (0.9)
|
| Learning zones (n) |
1.0 (0.0)
|
1.0 (0.0)
|
2.8 (0.8)
|
3.0 (0.0)
|
2.0 (1.0)
|
| Diversity of furniture (n) |
1.0 (0.0)
|
1.0 (0.0)
|
4.6 (1.0)
|
2.5 (0.7)
|
2.7 (1.8)
|
| Space |
Space adaptability (yes) |
0% |
0% |
33% |
50% |
18% |
| *In brackets and italics standard deviation (SD) |
Table 5.
Subjective responses on the perceived acoustic environment with the sample grouped per four learning spaces.
Table 5.
Subjective responses on the perceived acoustic environment with the sample grouped per four learning spaces.
| Topic |
ID |
Scale |
TLE.NA |
TLE.AA |
FLE.NA |
FLE.AA |
KW |
| |
|
|
M (SD)
|
M (SD)
|
M (SD)
|
M (SD)
|
(p-value) |
| IEQ comfort perception |
|
|
|
|
|
|
|
| Temperature |
IEQ01 |
1-4 |
3.25 (0.96)
|
3.13 (1.04)
|
3.27 (0.97)
|
3.50 (0.68)
|
0.39 |
| Air quality |
IEQ02 |
1-4 |
2.89 (1.14)
|
2.60 (1.15)
|
3.08 (1.03)
|
3.50 (0.80)
|
0.00 |
| Daylight |
IEQ03 |
1-4 |
3.61 (0.84)
|
3.39 (0.94)
|
3.52 (0.85)
|
3.73 (0.55)
|
0.08 |
| Noise |
IEQ04 |
1-4 |
1.95 (1.08)
|
2.05 (1.14)
|
2.33 (1.16)
|
2.95 (0.97)
|
0.00 |
| Noise annoyance |
|
|
|
|
|
|
|
| Noise from outside |
NA01 |
1-3 |
1.98 (0.79)
|
2.21 (0.71)
|
2.13 (0.71)
|
2.49 (0.61)
|
0.00 |
| Noise from schoolyard or hallway |
NA02 |
1-3 |
1.75 (0.77)
|
1.93 (0.74)
|
1.96 (0.74)
|
1.94 (0.78)
|
0.07 |
| Noise from other spaces |
NA03 |
1-3 |
2.09 (0.86)
|
2.43 (0.72)
|
2.35 (0.75)
|
2.94 (2.40)
|
0.00 |
| Noise from fans or air conditioning |
NA04 |
1-3 |
2.70 (0.66)
|
2.83 (0.46)
|
2.75 (0.56)
|
2.65 (0.60)
|
0.27 |
| Noise from children talking inside |
NA05 |
1-3 |
1.59 (0.74)
|
1.91 (0.74)
|
1.83 (0.72)
|
2.26 (0.85)
|
0.00 |
| Noise from children moving inside |
NA06 |
1-3 |
1.98 (0.81)
|
2.13 (0.82)
|
2.11 (0.77)
|
2.40 (0.70)
|
0.04 |
| Hearing ability |
|
|
|
|
|
|
|
| During silent task |
HA01 |
1-5 |
1.79 (1.08)
|
1.83 (1.03)
|
1.89 (1.06)
|
1.62 (0.70)
|
0.58 |
| HA02 |
1-5 |
2.11 (1.24)
|
2.12 (1.01)
|
2.29 (1.18)
|
2.11 (1.02)
|
0.37 |
| During group activity |
HA03 |
1-5 |
1.95 (1.06)
|
2.05 (1.03)
|
2.08 (1.00)
|
2.03 (0.83)
|
0.51 |
| HA04 |
1-5 |
1.82 (1.07)
|
1.86 (1.01)
|
1.93 (1.09)
|
2.03 (1.01)
|
0.43 |
| Acoustic preference |
|
|
|
|
|
|
|
| Noise preference now |
AP01 |
1-4 |
1.99 (1.01)
|
2.28 (1.07)
|
2.42 (1.09)
|
2.80 (1.08)
|
0.00 |
| Mean (M), standard deviation (SD) values are provided. The p-values of Kruskal-Wallis H test for the differences between the four types of learning spaces. Statistically significance differences with p-values <0.05 are reported in bold. |
Table 6.
Mann–Whitney U test for the differences between two groups organized according to acoustic treatment and typology.
Table 6.
Mann–Whitney U test for the differences between two groups organized according to acoustic treatment and typology.
| Topic |
ID |
TLE.NA/TLE.AA |
FLE.NA/FLE.AA |
TLE.NA/FLE.NA |
TLE.AA/FLE.AA |
| |
|
WMU (p-value) |
WMU (p-value) |
WMU (p-value) |
WMU (p-value) |
| IEQ comfort perception |
|
|
|
|
|
| Temperature |
IEQ01 |
0.40 |
0.34 |
0.74 |
0.09 |
| Air quality |
IEQ02 |
0.06 |
0.01 |
0.16 |
0.00 |
| Daylight |
IEQ03 |
0.02 |
0.26 |
0.16 |
0.06 |
| Noise |
IEQ04 |
0.57 |
0.00 |
0.00 |
0.00 |
| Noise annoyance |
|
|
|
|
|
| Noise from outside |
NA01 |
0.04 |
0.01 |
0.86 |
0.05 |
| Noise from schoolyard or hallway |
NA02 |
0.08 |
0.91 |
0.01 |
0.93 |
| Noise from other spaces |
NA03 |
0.00 |
0.00 |
0.00 |
0.00 |
| Noise from fans or air conditioning |
NA04 |
0.19 |
0.22 |
0.81 |
0.04 |
| Noise from children talking inside |
NA05 |
0.00 |
0.00 |
0.00 |
0.03 |
| Noise from children moving inside |
NA06 |
0.20 |
0.04 |
0.14 |
0.10 |
| Hearing ability |
|
|
|
|
|
| During silent task |
HA01 |
0.54 |
0.33 |
0.23 |
0.53 |
| HA02 |
0.45 |
0.51 |
0.09 |
0.98 |
| During group activity |
HA03 |
0.40 |
0.97 |
0.14 |
0.87 |
| HA04 |
0.50 |
0.42 |
0.24 |
0.29 |
| Acoustic preference |
|
|
|
|
|
| Noise preference now |
AP01 |
0.06 |
0.06 |
0.00 |
0.02 |
| |
Statistically significance differences with p-values <0.05 are reported in bold. |
Table 7.
Correlation matrix of the acoustic environment perception and design parameters among learning spaces.
Table 7.
Correlation matrix of the acoustic environment perception and design parameters among learning spaces.
Question or
Parameter |
|
Acoustic Design Parameters |
Flexible Design Parameters |
| ID |
Ln (dBA) |
Height |
Floor area |
Volume |
%Absorption |
%Glass |
Space
Density |
Learning
zones |
Diversity of furniture |
| Occupied background noise level |
Ln (dBA) |
1 |
|
|
|
-0.60** |
|
-0.46* |
|
|
| Noise comfort |
IEQ04 |
-0.56* |
|
|
|
|
|
|
|
|
| Noise from outside |
NA01 |
-0.58* |
|
0.55* |
0.61** |
0.46* |
|
0.63** |
|
|
| Noise from schoolyard or hallway |
NA02 |
|
|
|
|
|
|
|
|
0.46* |
| Noise from other spaces |
NA03 |
-0.76** |
|
|
0.50* |
0.56* |
|
0.46* |
0.48* |
|
| Noise from fans or air conditioning |
NA04 |
|
|
|
|
|
|
|
|
|
| Noise from children talking inside |
NA05 |
-0.64** |
|
|
|
0.50* |
|
|
|
|
| Noise from children moving inside |
NA06 |
-0.68** |
|
|
|
0.56* |
|
|
|
|
| Hearing teacher during silent task |
HA01 |
|
|
|
|
0.56* |
|
|
|
|
| Hearing classmates during silent task |
HA02 |
|
|
|
|
|
|
|
|
|
| Hearing teacher during group work |
HA03 |
|
|
|
|
|
|
|
|
|
| Hearing classmates during group work |
HA04 |
|
|
|
|
|
|
|
|
|
| Noise preference now |
AP01 |
-0.46* |
|
|
|
|
|
|
|
|
| *Spearman or Pearson correlation coefficients are given for significant relationship with a p-value <0.05 |
| **Spearman or Pearson correlation coefficients are given for significant relationship with a p-value <0.01 |
|
Disclaimer/Publisher’s Note: The statements, opinions and data contained in all publications are solely those of the individual author(s) and contributor(s) and not of MDPI and/or the editor(s). MDPI and/or the editor(s) disclaim responsibility for any injury to people or property resulting from any ideas, methods, instructions or products referred to in the content. |
© 2024 by the authors. Licensee MDPI, Basel, Switzerland. This article is an open access article distributed under the terms and conditions of the Creative Commons Attribution (CC BY) license (http://creativecommons.org/licenses/by/4.0/).
