1. Introduction
The Shannonian entropic measure,
[
1] reads:
The probability of the
event is given by the equation
. This entropy,
defines the concept of information in information theory.
Most importantly,
Generalized Rényian Entropy of order
and
namely
to read as
With
and
Notably, as and for
reduces to the Rényian Entropy [
3] of order
And for,
reduces to the Shannonian entropic formula (1.1).
Entropy and fractal dimension are related because entropy is a statistical measure of complexity in spatial dimensions. Fractals measure a pattern’s ability to fill space because of its distinctive scaling behaviour. This connection aids in our comprehension of the complex interrelationship between information theory and pattern geometry [
4,
5,
6,
7,
8,
9]. Lewis Fry Richardson investigated in [
10] how the length of the stiff stick used to measure coastlines can affect the measured length of the shoreline. Mandelbrot referenced this earlier research in [
10,
11,
12].
There are numerous formal mathematical definitions that can be used to study fractal dimension
). One formulation of this kind establishes relationships between
), the scaling factor (𝜀), and the number of sticks (
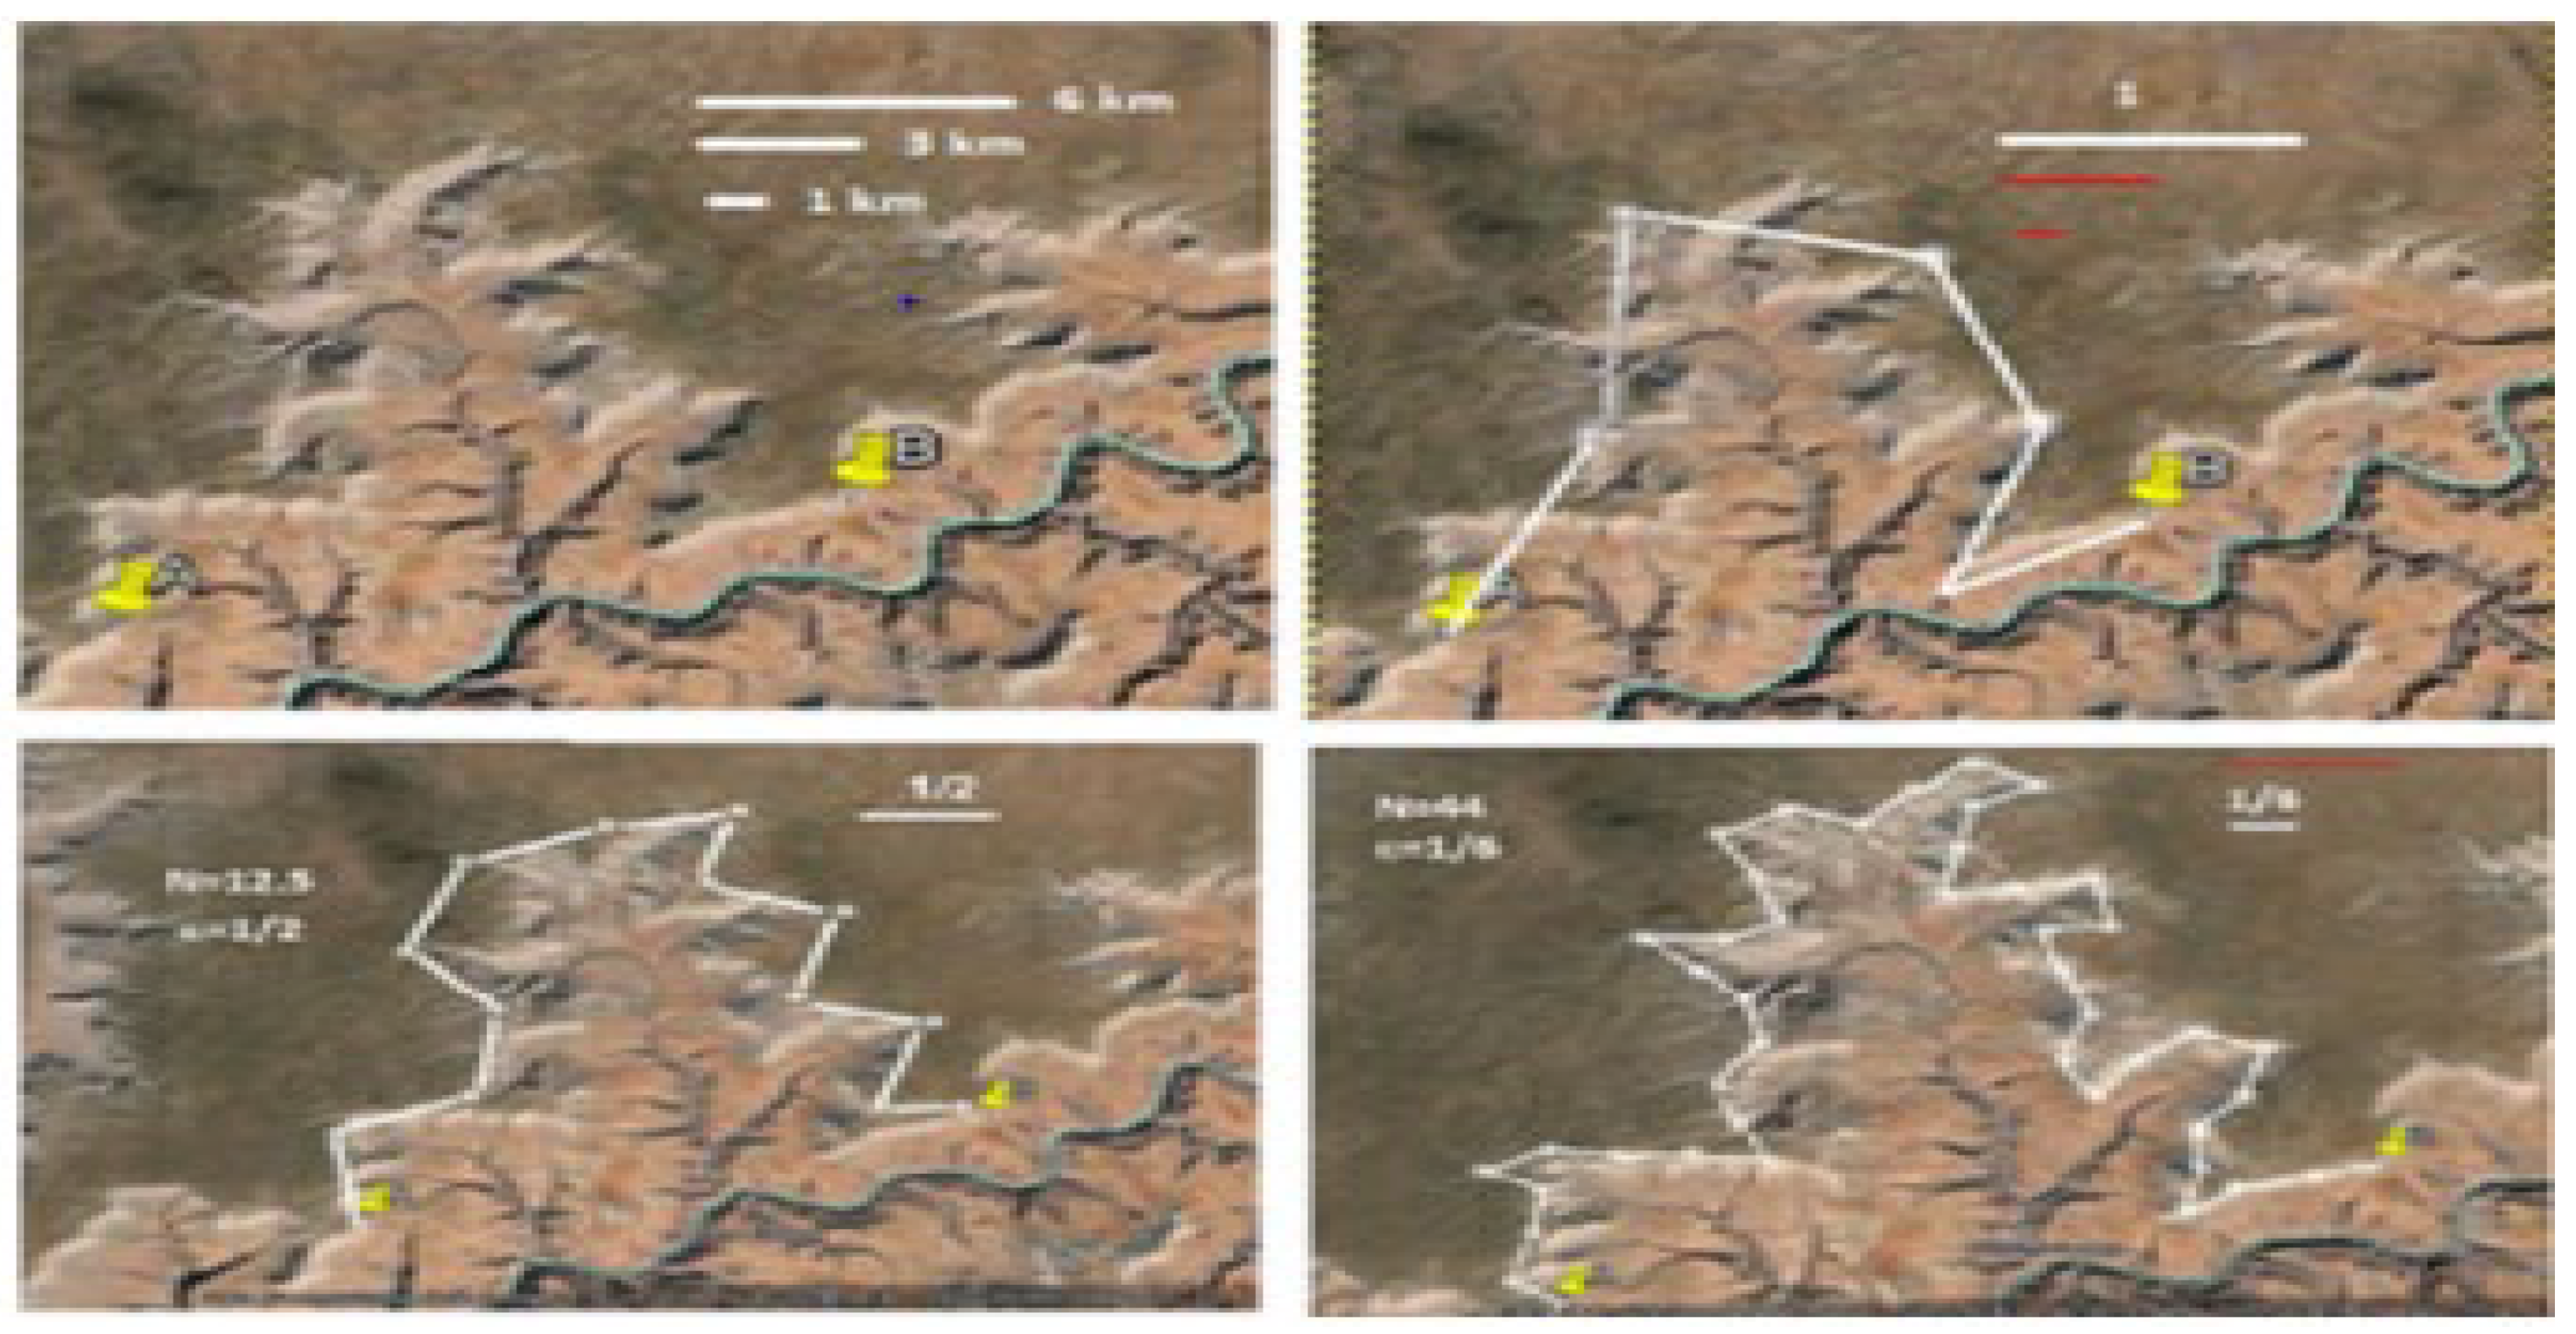
) required to cover a coastline. These formulas help quantify the complexity and scaling properties of fractal patterns in spatial dimensions. An area of Arizona’s Grand Canyon is reproduced with the help of the GNU Image Manipulation Programme and Google Earth satellite images. These tools can be used to paint portraits or create various depictions of the aspects of the canyon, as seen in
Figure 1 (c.f., [
12]).
It is possible to see how painted portraits were created by using Google Earth satellite photographs of a section of the Grand Canyon in Arizona.
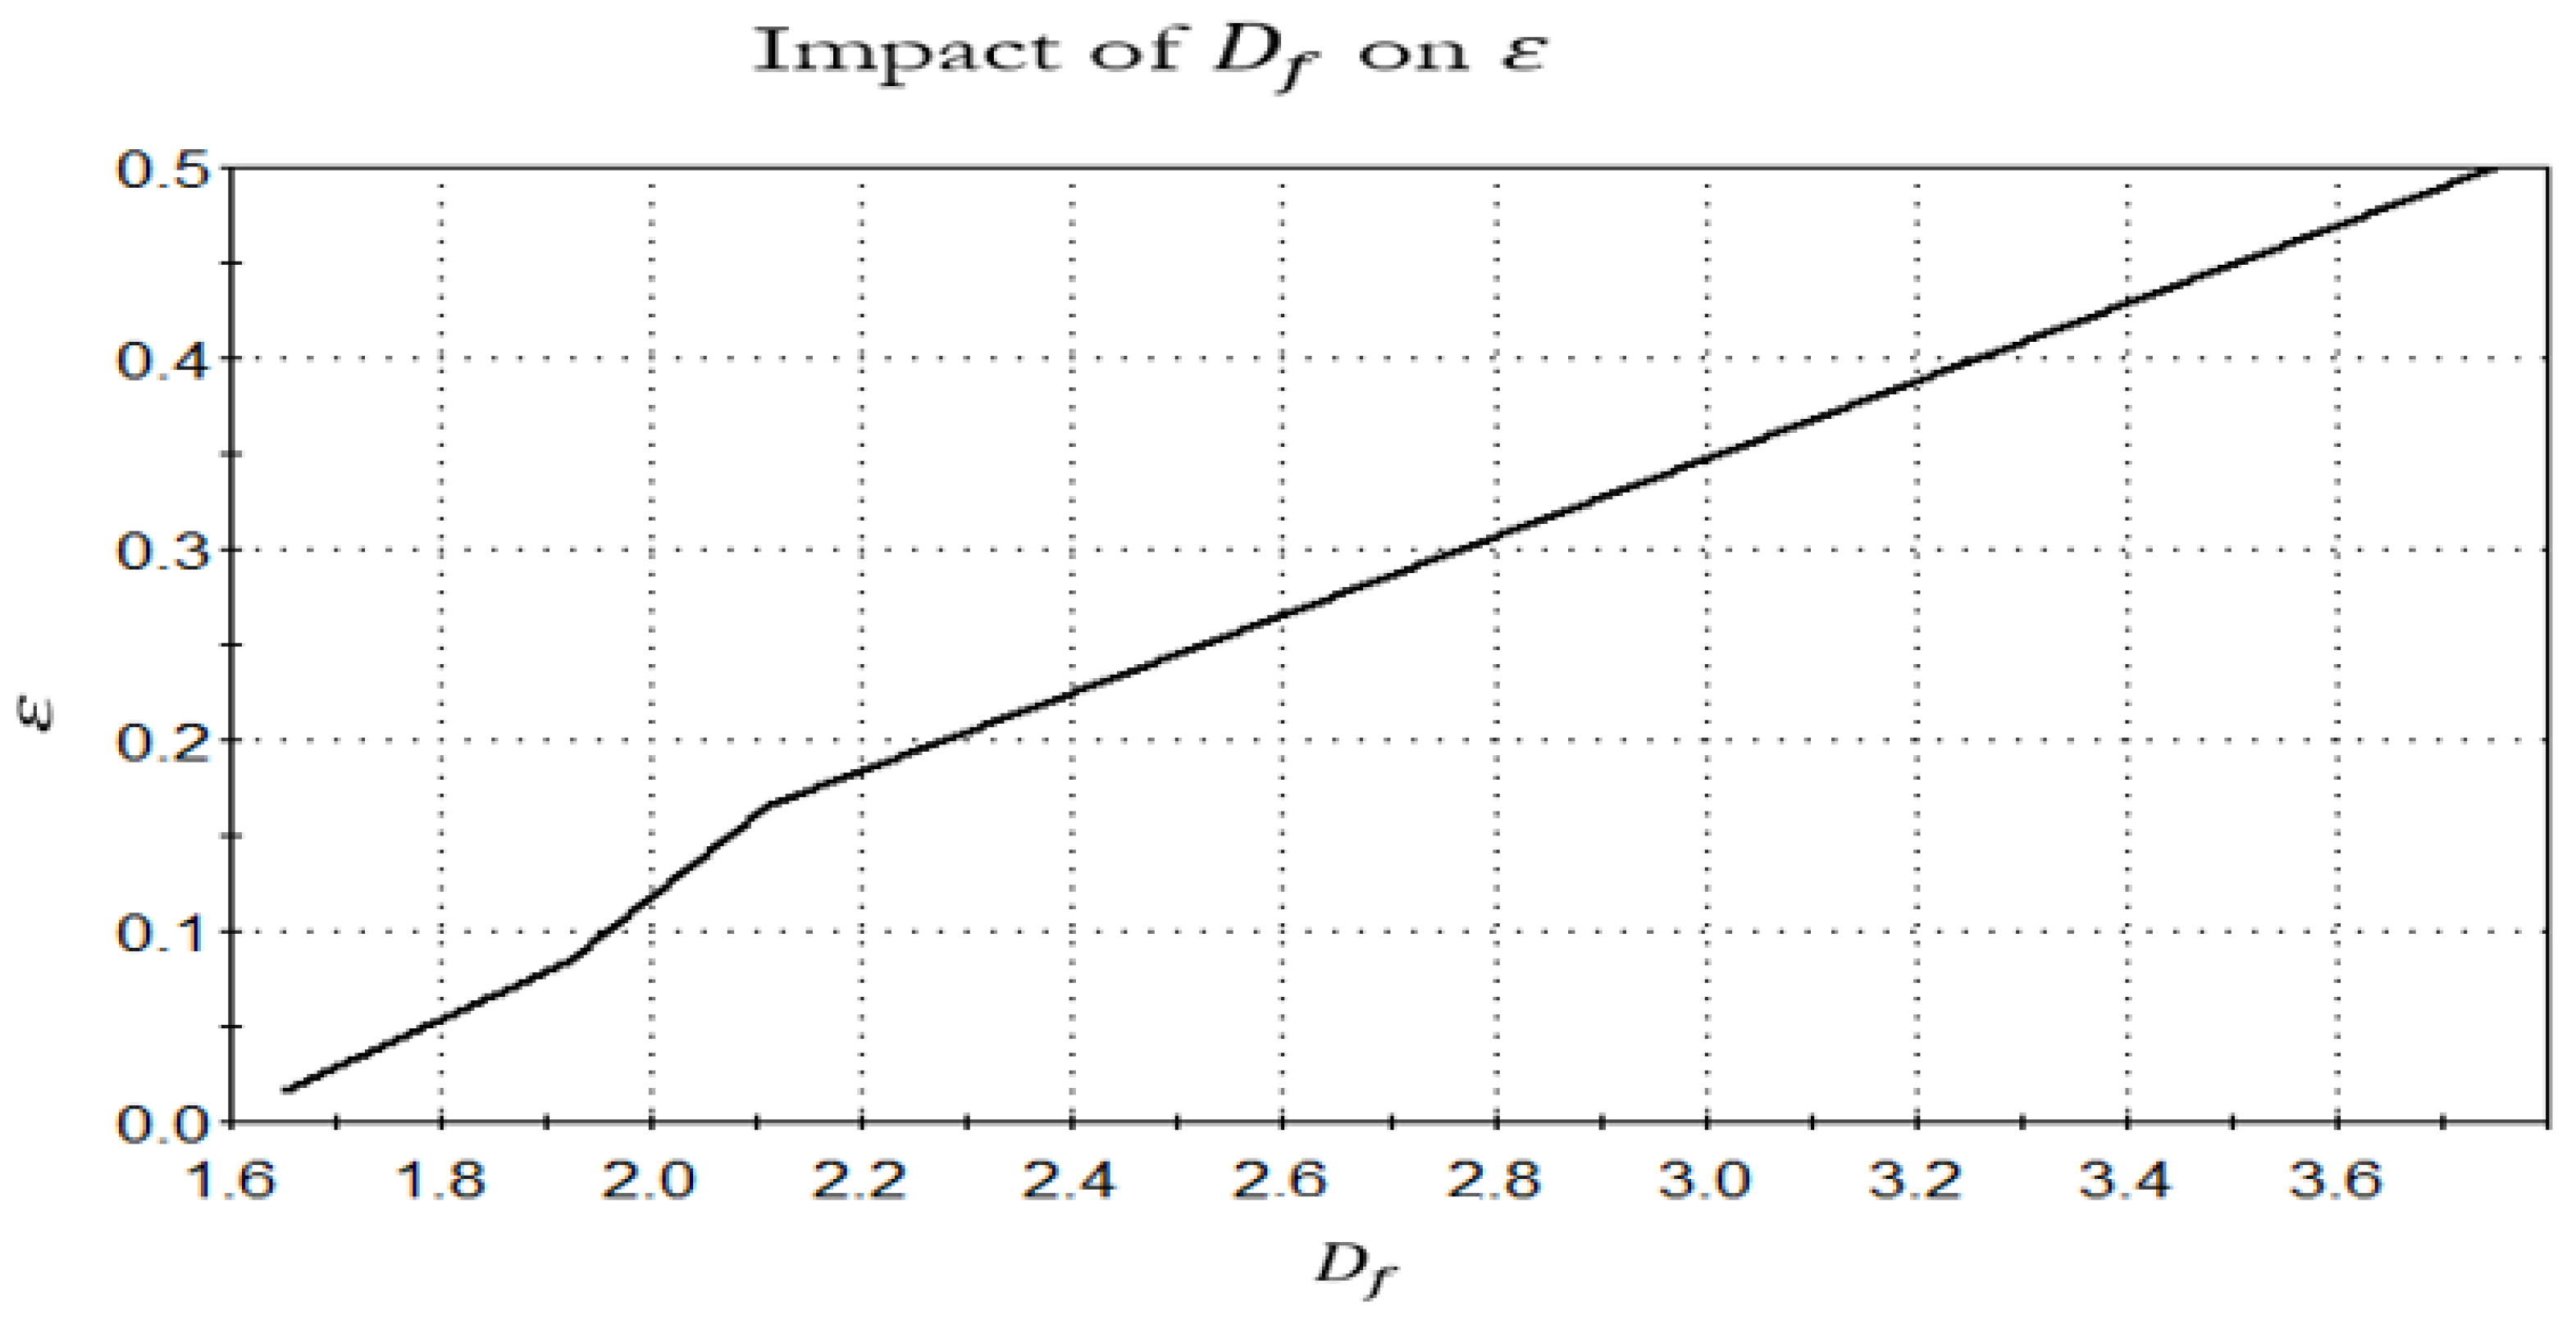
Figure 2 and
Figure 3 show how the
. of the canyon’s rim was determined by using the ruler tool in Google Earth to set a reference length of 6 km. While
Figure 3 shows the simultaneous decline of
. and 𝜀,
Figure 2 shows the abrupt heavy-tailed declination that 𝜀 (an additional variable) experiences in response to the continuous growth of
(a variable).
Section 2 of the present work mind map reviews earlier research on the connection between entropy and
, with an emphasis on Shannon and Rényi entropies. It also explains how entropy principles can be used to get
. This review of earlier research sheds light on the fractal dimension’s entropic genesis.
Section 3 of the paper is dedicated to deriving new results and presenting a numerical analysis that strongly supports the idea that the logarithmic base
has a substantial impact on the behavior of the
Koch snowflakes
. This section focuses on explaining and demonstrating how different values of the logarithmic base influence the behavior of the fractal dimension in the context of the Koch snowflake.
Section 4 addresses the significant impact of fractal dimension on smart cities.
Section 5 covers the conclusion and future work.
3. Results and Discussion
Theorem 1:
For, it holds that:
Proof: Engaging (2.3), it is implied that
Engaging (2.1) and (2.2), the proof follows.□
Corollary 2
satisfies:
Proof: Taking the limit of
(c.f., (2.3)) as
This proves 1.
The proof of 2 is immediate by (2.3) and the well-known formula:
Notably, by changing the indices of the generalised dimensions, we can observe how they affect the behaviour of
s.□
Clearly,
is significantly impacted by
. For
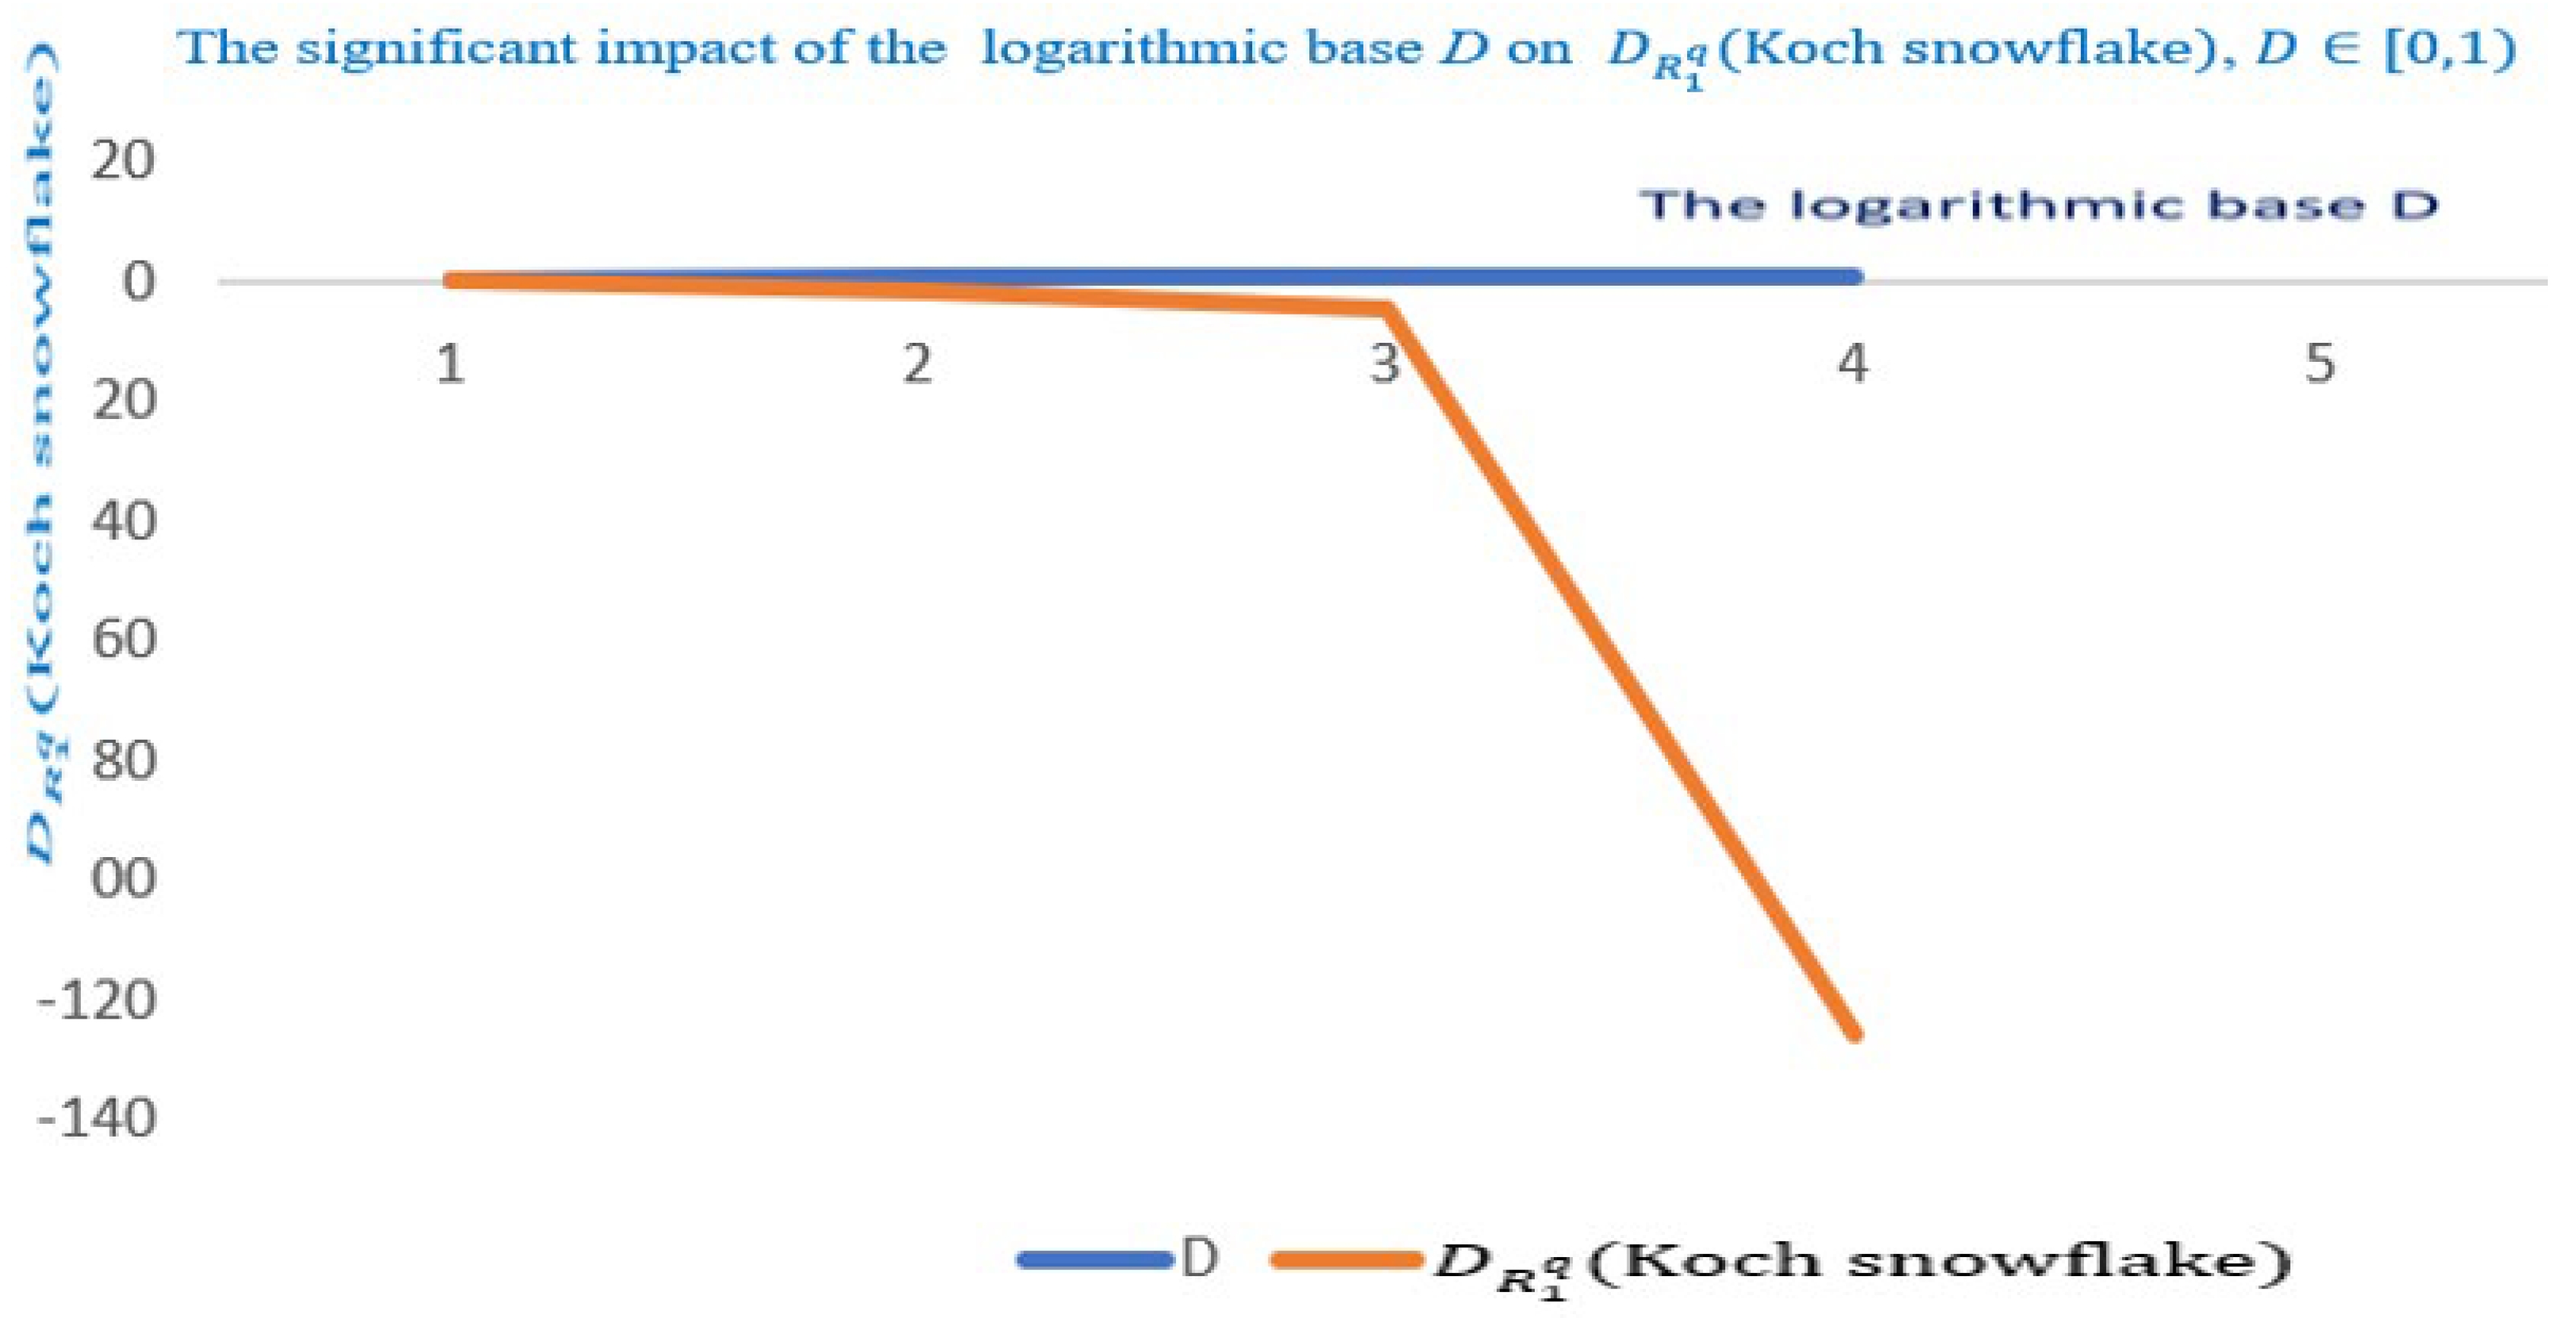
vanishes and starts to negatively decrease immensely for
Unexpectedly,
tends to infinity as
approaches 1, as visualized by
Figure 4. As
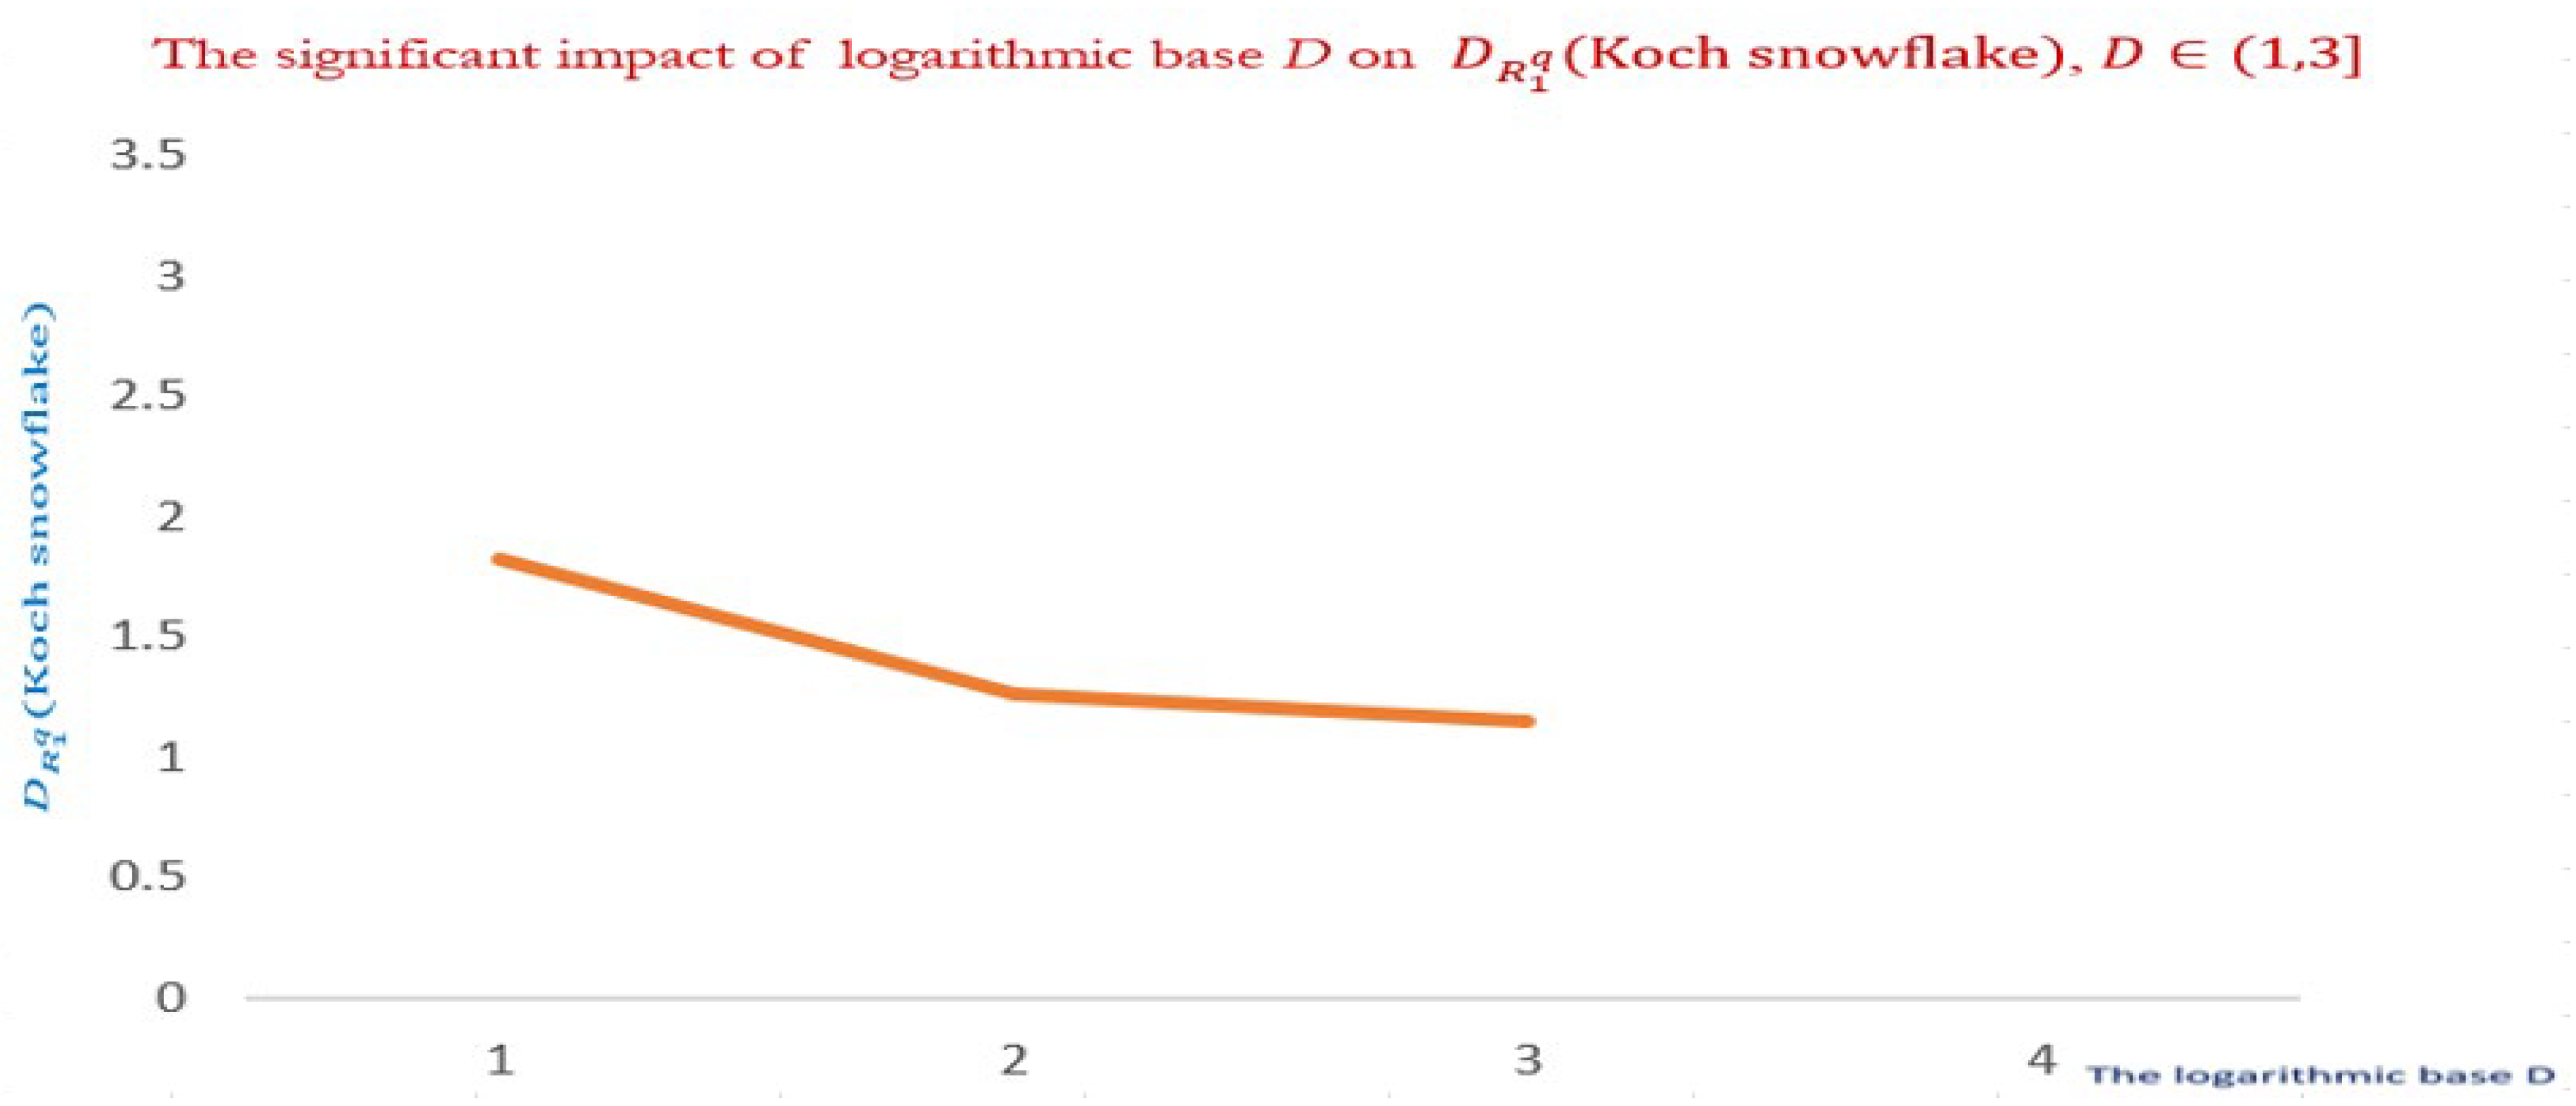
progresses to increase, the corresponding
significantly decreases, which is shown by
Figure 5. As expected, as
increases,
will tend to zero. Notably, the attained negative values of
are physically interpreted by the measurements of the degrees of emptiness in an empty set, non-conclusion, model architectures with various sorts of inhomogeneity non scattered particle distributions are described as being empty (lacunar).
More interestingly, the Sierpiniski Gasket (SG) fractal dimension follows by putting N = 3 and 𝜀 = 1/2.
Engaging (2.3), one gets:
In the following experiment, the information theoretic impact of the non-extensive parameter
will be addressed.
Obviously,
is significantly impacted by
. The none-extensivity of the parameter
enforces
to increase drastically as it can be visualized by
Figure 6 that as
approaches unity
tends to infinity. Notably,
lies in the extensivity domain, which physically translates to short-range interactions.
4. Applications to Smart Cities:
Local or microscopic chaos and global or macroscopic disorder are the two types of chaos covered by chaos theory [
16]. Local chaos is mostly investigated by dissipative structure theory and synergetic theory since it primarily deals with the relationships and interconnections within a system. Chaos theory, on the other hand, focuses specifically on global chaos, which is described as deterministic patterns and behaviours that arise from complex systems.
[
16] looked at the growth of smart cities, particularly in China, and stressed how evaluation and planning may suffer from a lack of a basic understanding of smart city systems. Consequently, [
14] offered a complete framework for assessing and regulating the operations of smart cities that considers smart gadgets, ICT, and the dynamics of development. It also implied that the self-organizing system theory could potentially be able to accommodate for the complexity of smart cities.
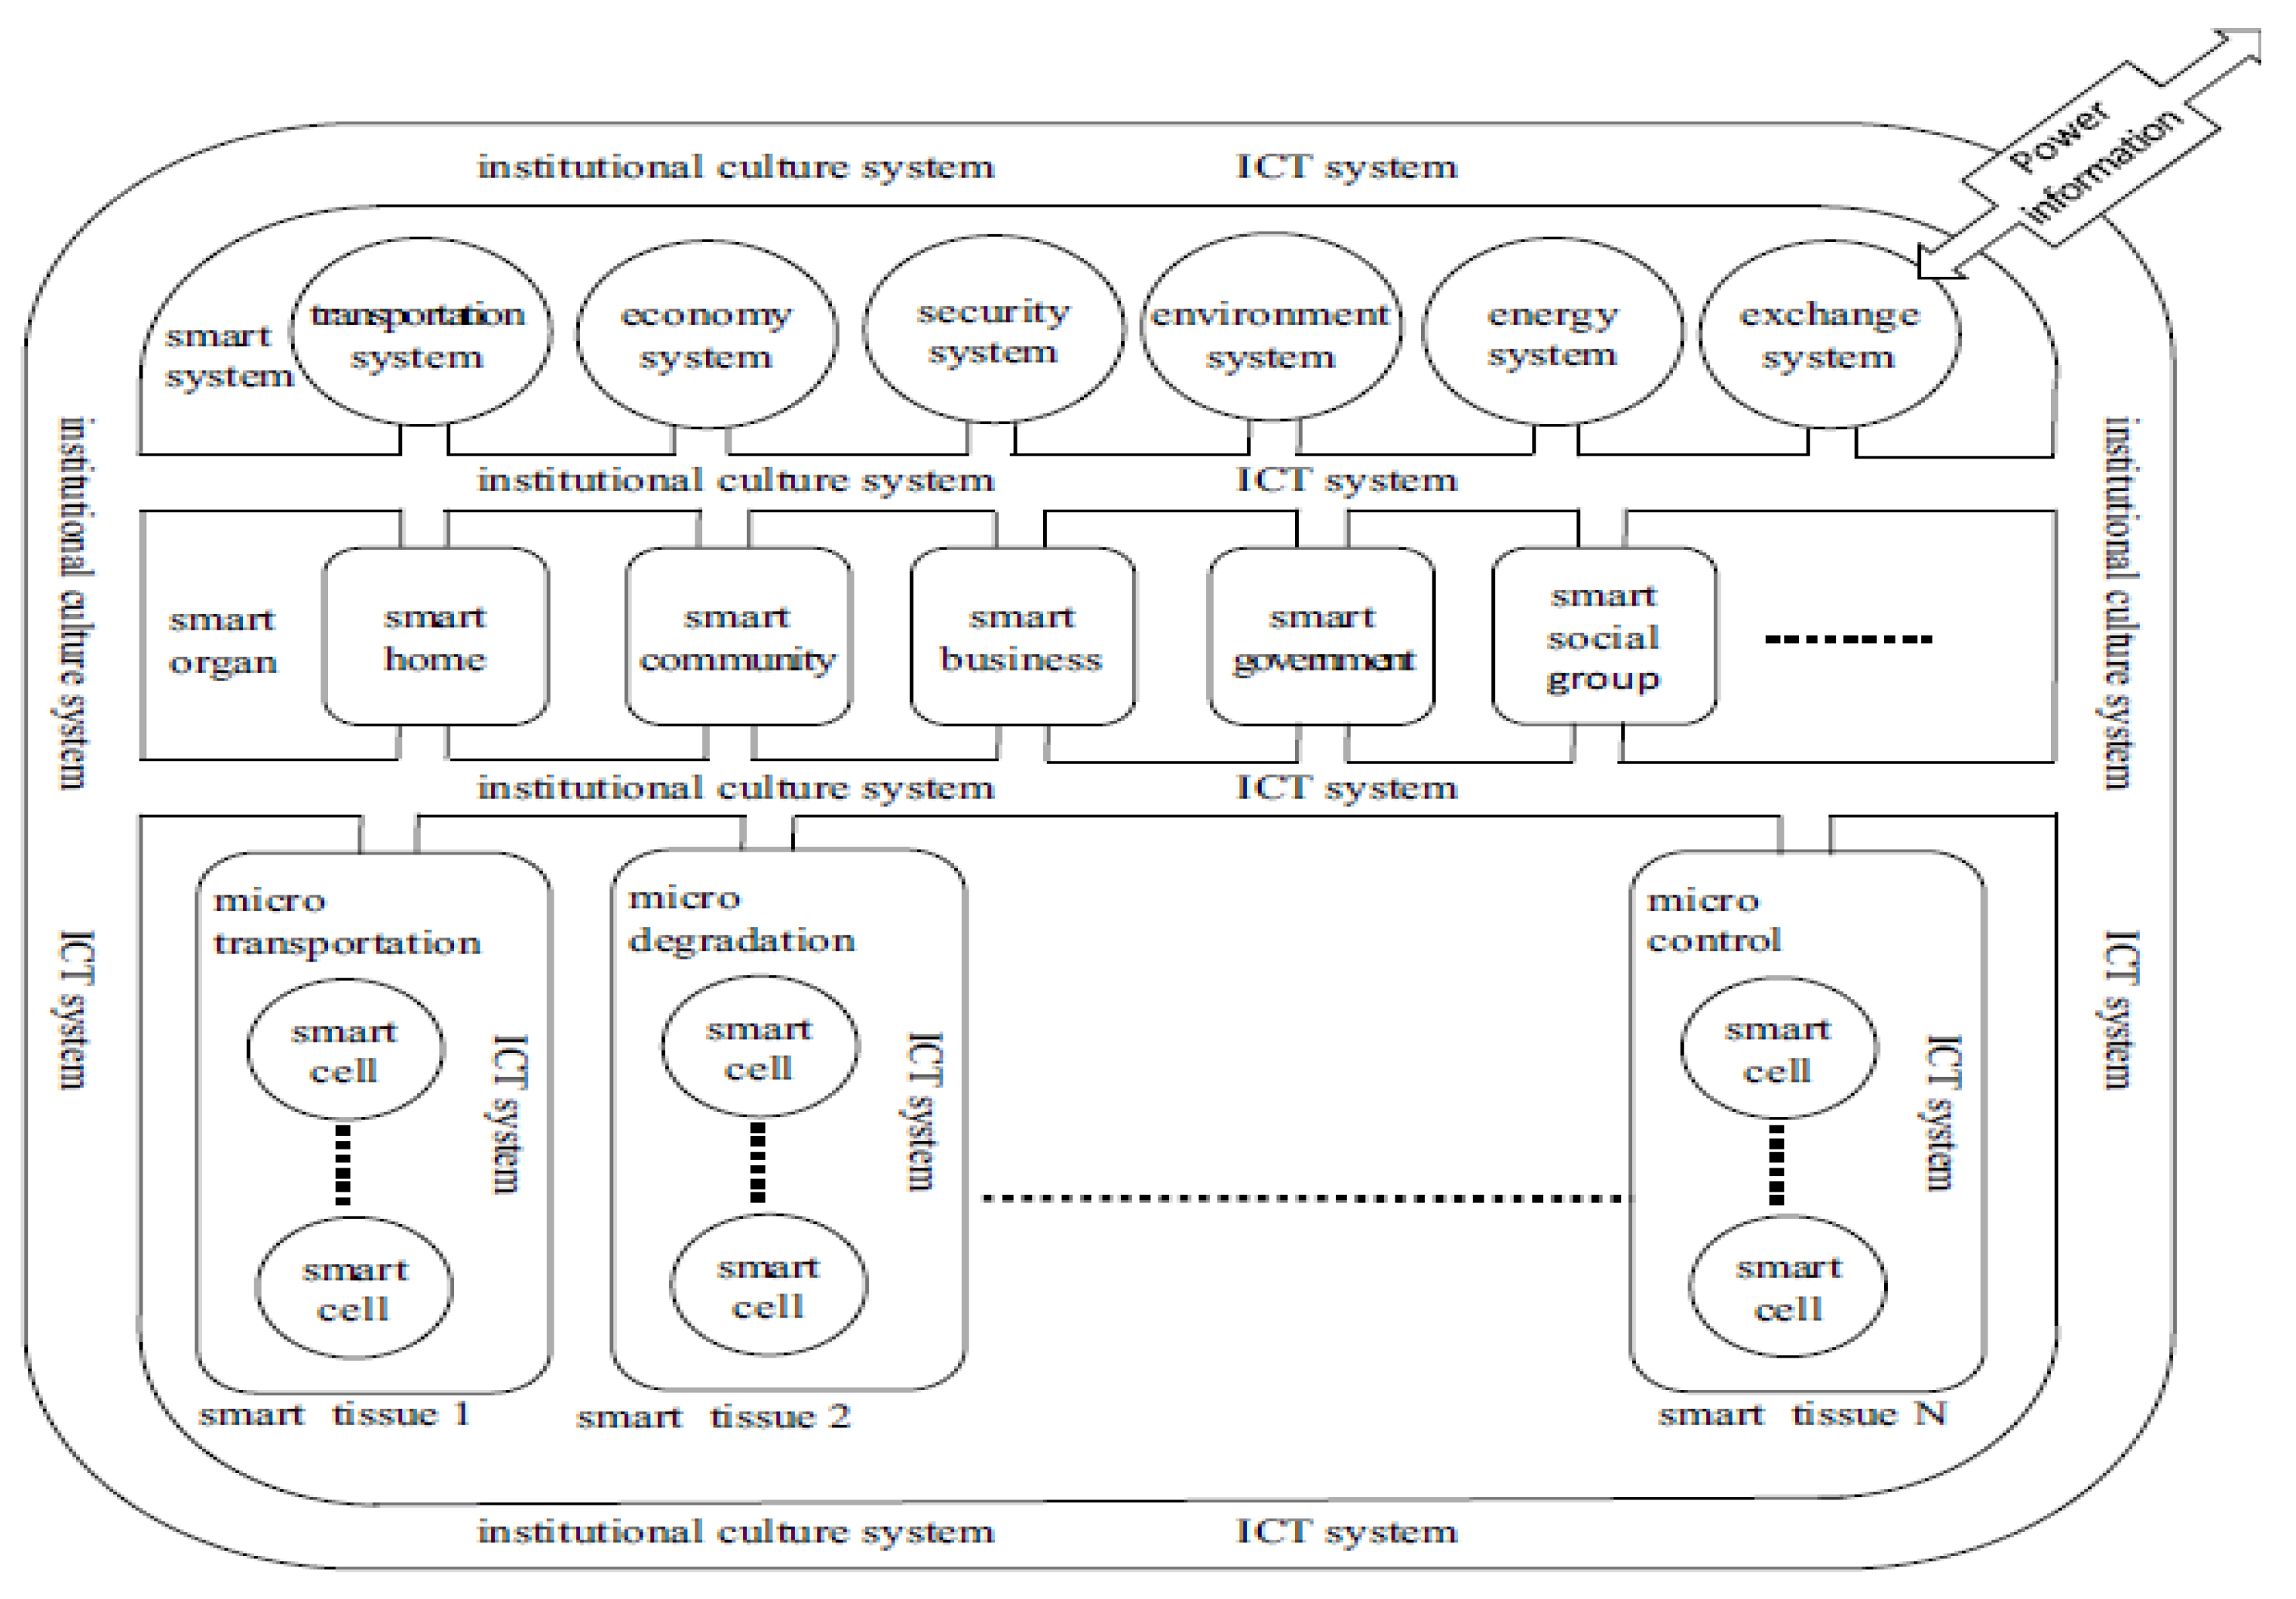
Smart systems [
16] are made up of several interrelated parts, including systems for energy, ICT, economics, security, and institutional culture. As smart city systems are developed, these systems, which are driven by internal institutional culture and ICT mechanisms, evolve from simple smart cell components to more complex entities.
Figure 7 (c.f., [
16]) demonstrates how these open systems interact with the outside world to exchange information and energy to create a full self-organizing framework.
The entire functioning and quality of service provided by an urban road network are directly influenced by its structural features [
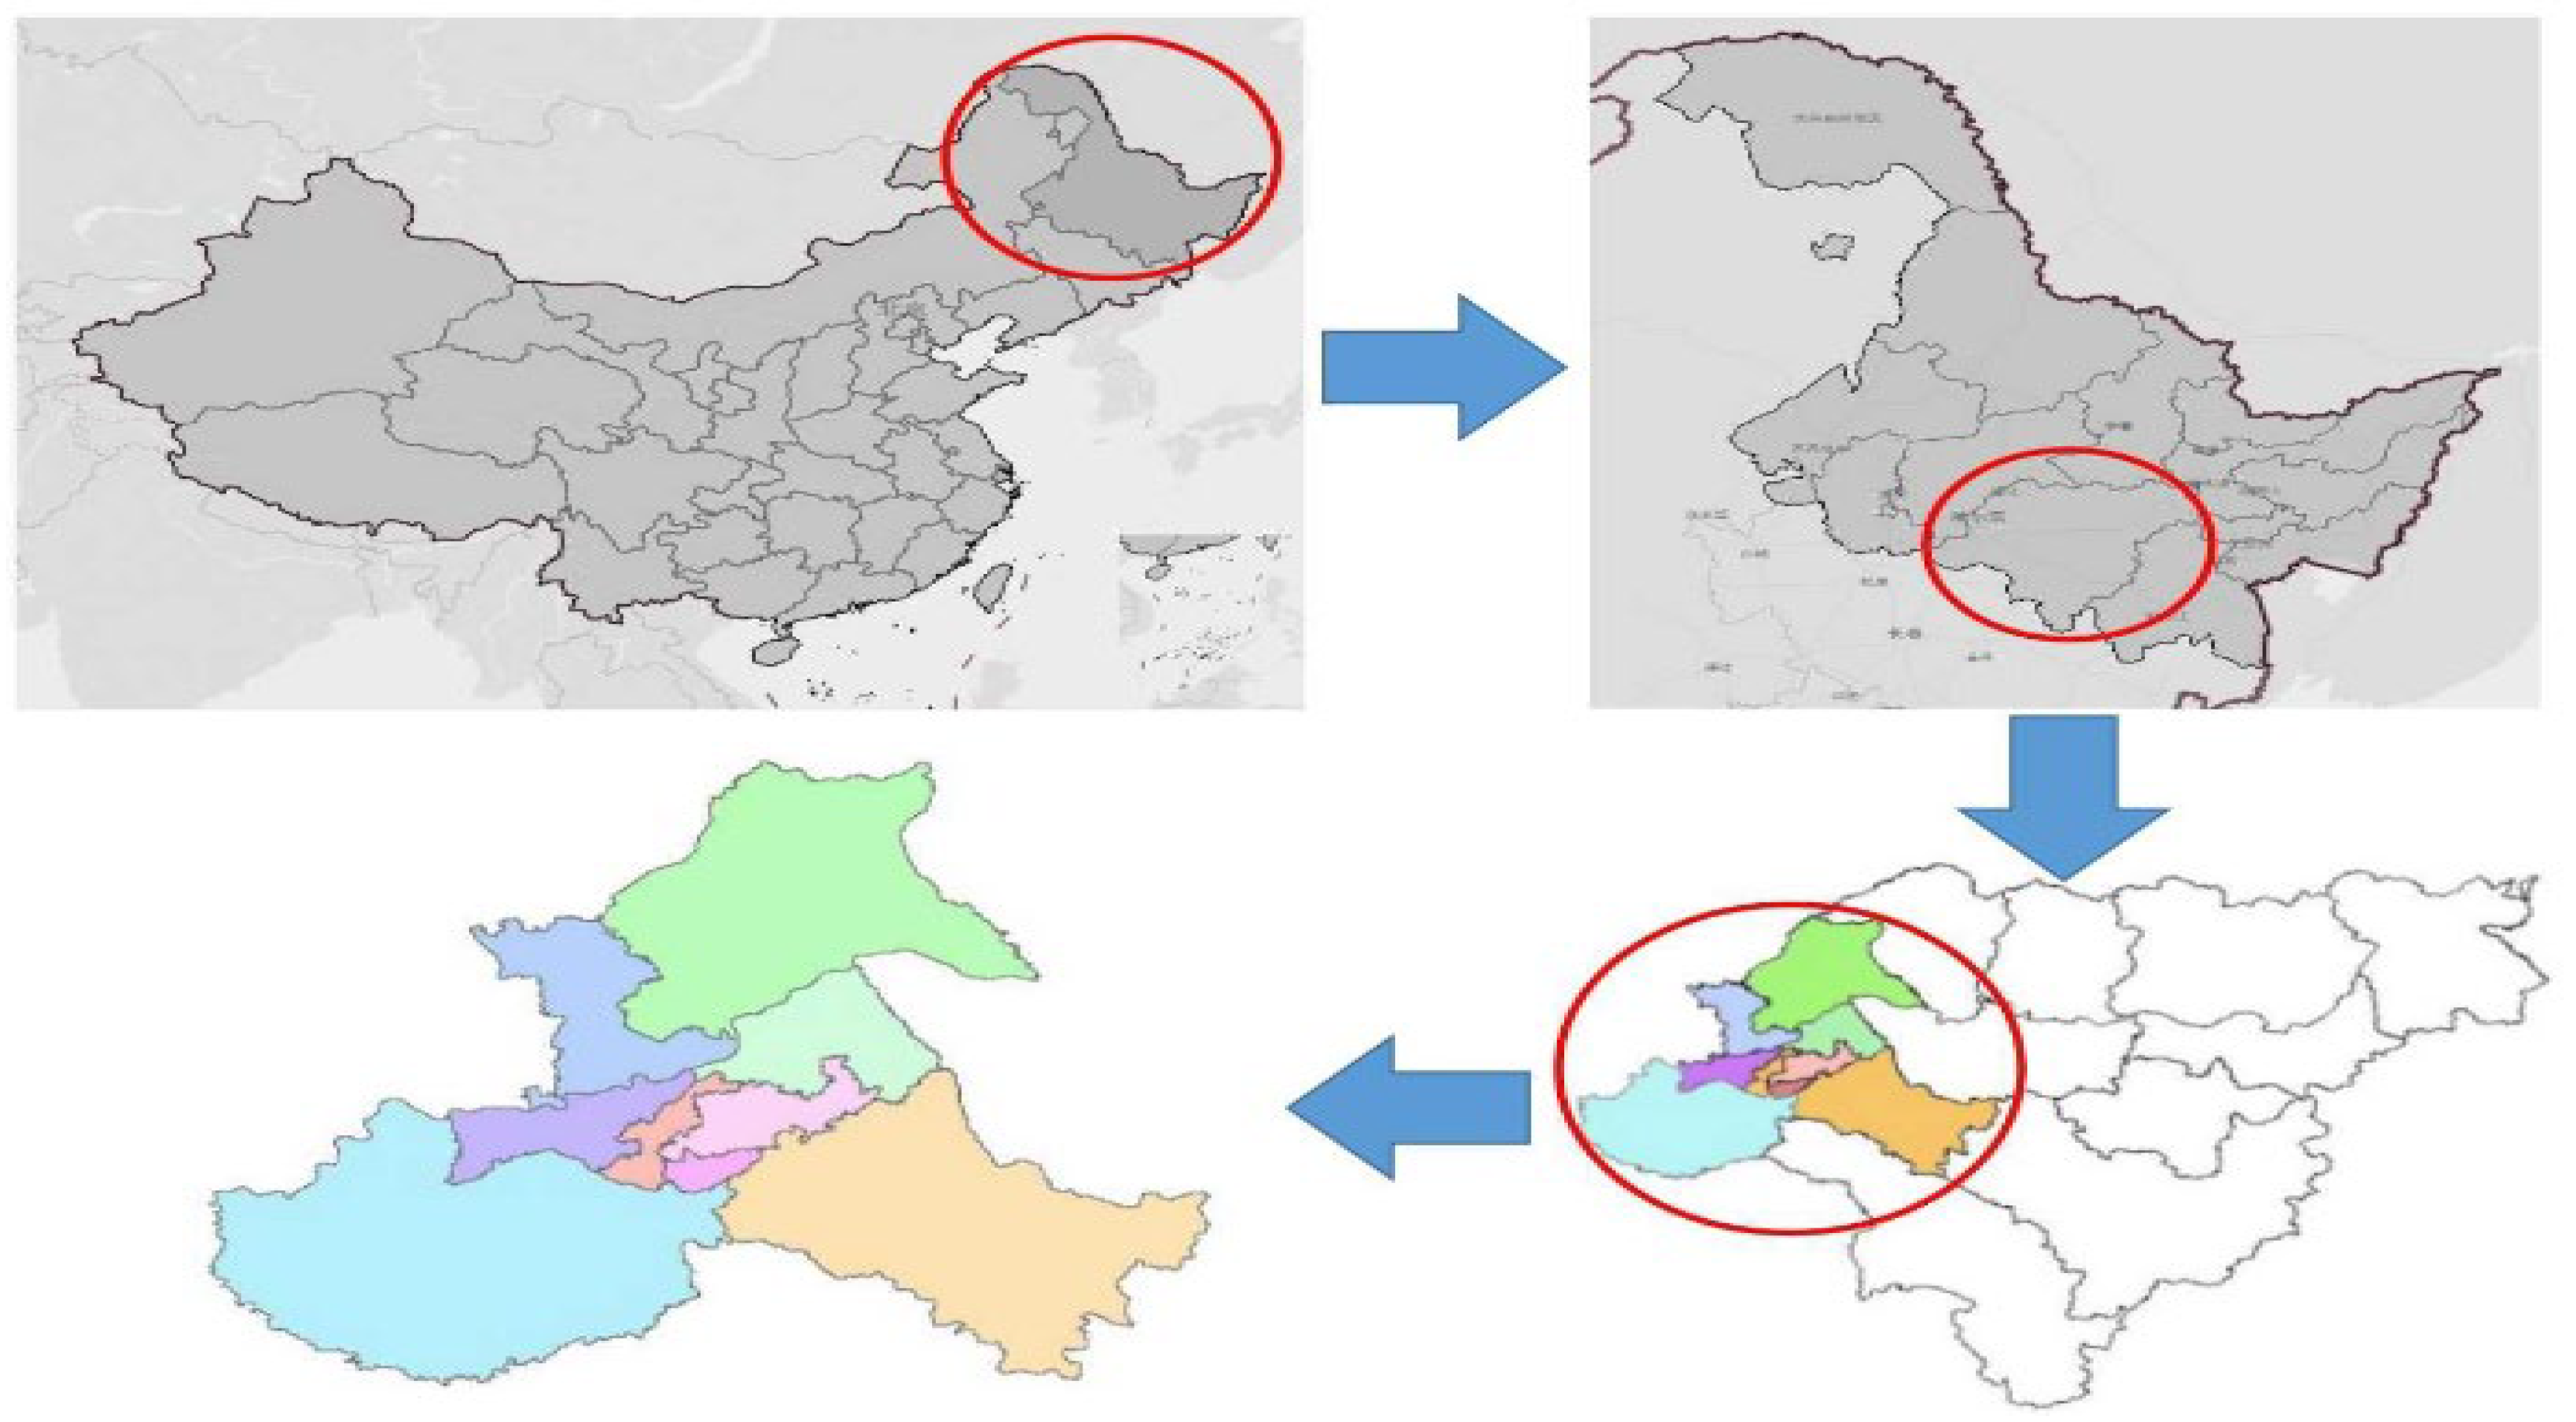
17]. Because fractal theory is self-similar and scale invariant, it can be used to examine urban road networks. To evaluate and enhance urban road networks, this research computes and examines nine Harbin districts’ five fractal dimensions, as well as their relationships to area, population, road length, and building density.
Figure 8(c.f., [
17]) portrays the map of Harbin, a Chinese city. The main urban area of Harbin has a total of 12,800 roads and the combined length of these roads is 9757.934 kilometres.
Data including the road network map, area, population, building area, road number, and building number were collected for 9 districts in Harbin, China, to compute the road work’s
[
17]. Shape files were utilised for downloading the information about the metropolitan road network from Open Street Map (OSM).
Figure 9 illustrates how this information will be utilised to examine the fractal characteristics of the Harbin Road network.
In their research, [
17] measured five different types of fractal dimensions using images in BMP file format (.bmp). The images in question had a black backdrop with white elements that represented roads and boundaries on them.
Figure 10 illustrates the conversion of nine maps into the appropriate BMP format with varied sizes (width and height) and a resolution of 500 dpi from the GIS software-generated shape file data.
The urban climate is influenced by various factors [
18] and understanding them can help mitigate heat stress in the context of urbanization and climate change. In a study focusing on European cities, it was found that the Urban Heat Island (UHI) phenomenon is influenced by city size, fractality (complexity of urban form), and anisometry (degree of stretching). According to the study, UHI intensity decreases with anisometry and rises with city size and fractal dimension. Smaller, dispersed, and stretched cities are considered preferable for mitigating UHI, although trade-offs must be made considering the positive effects of large cities.
The UHI was determined by the researchers [
18] using land cover data and temperature data from remote sensing. The disparity between the mean temperature inside an urban cluster and the mean temperature outside is how they characterised the severity of the urban heat island (UHI). The study examined how the size, fractality, and anisometry of the city clusters affect the UHI during the summer of 2006–2013, focusing on the 5,000 largest urban clusters in Europe.
Multiplying the number of cells in a city cluster by the area of each cell yields the city size . Due to Zipf’s law, which states that there are many small cities and few large ones, the logarithm of city is used to reduce the skewness in the data.
To measure the fractal dimension of city clusters, [
18] used the box counting method, which involves counting the number of square boxes needed to cover the structure.
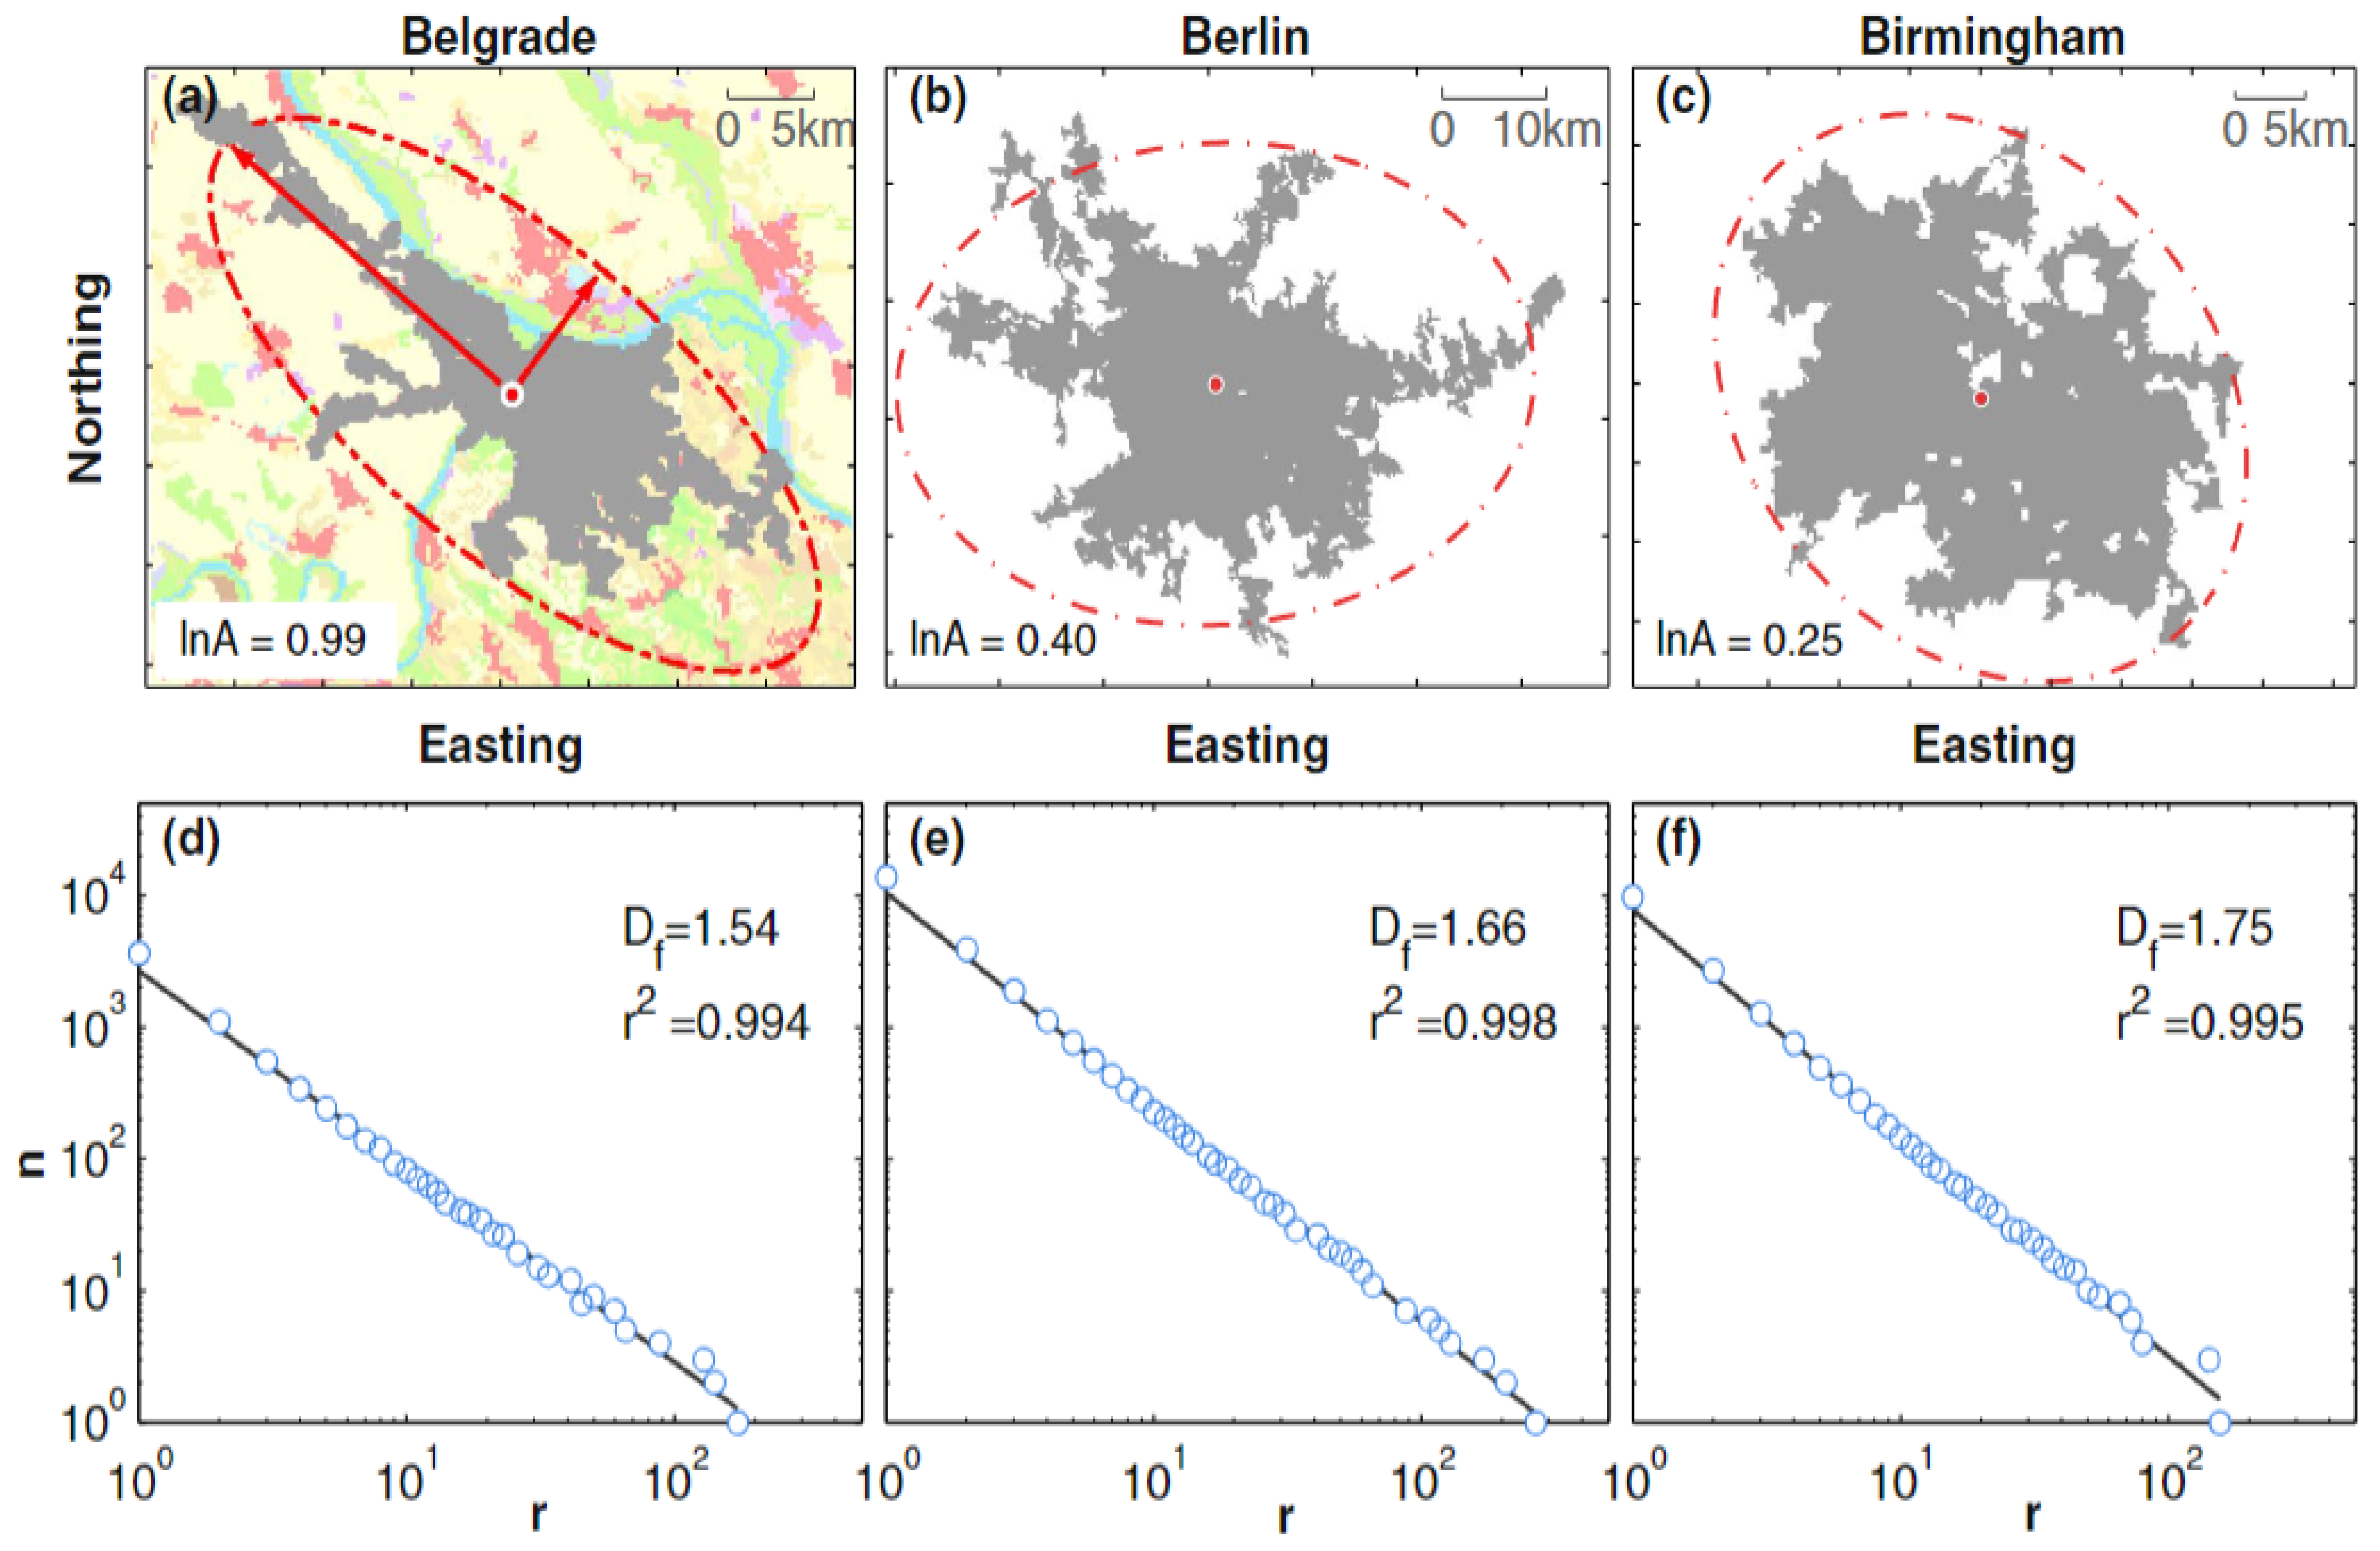
Figure 11a–c of the study shows three examples of city clusters with different sizes and levels of fractality, illustrating the concept visually. The box-counting method is used to calculate
of city clusters, which provides a measure of their compactness. By analyzing the linear regressions of the log-log scale plots of box-counting results, the slopes of the lines estimate the fractal dimensions, indicating that cities with larger
values are generally more compact in shape.
Anisometry of a city cluster is the degree of deviation of a city from a circular shape. It is computed using the main axis to minor axis ratio of the city cluster’s equivalent ellipse. A higher value of anisometry indicates that the city is more elongated or stretched in shape, as illustrated by the example of Belgrade in
Figure 11a–c (c.f., [
18]).
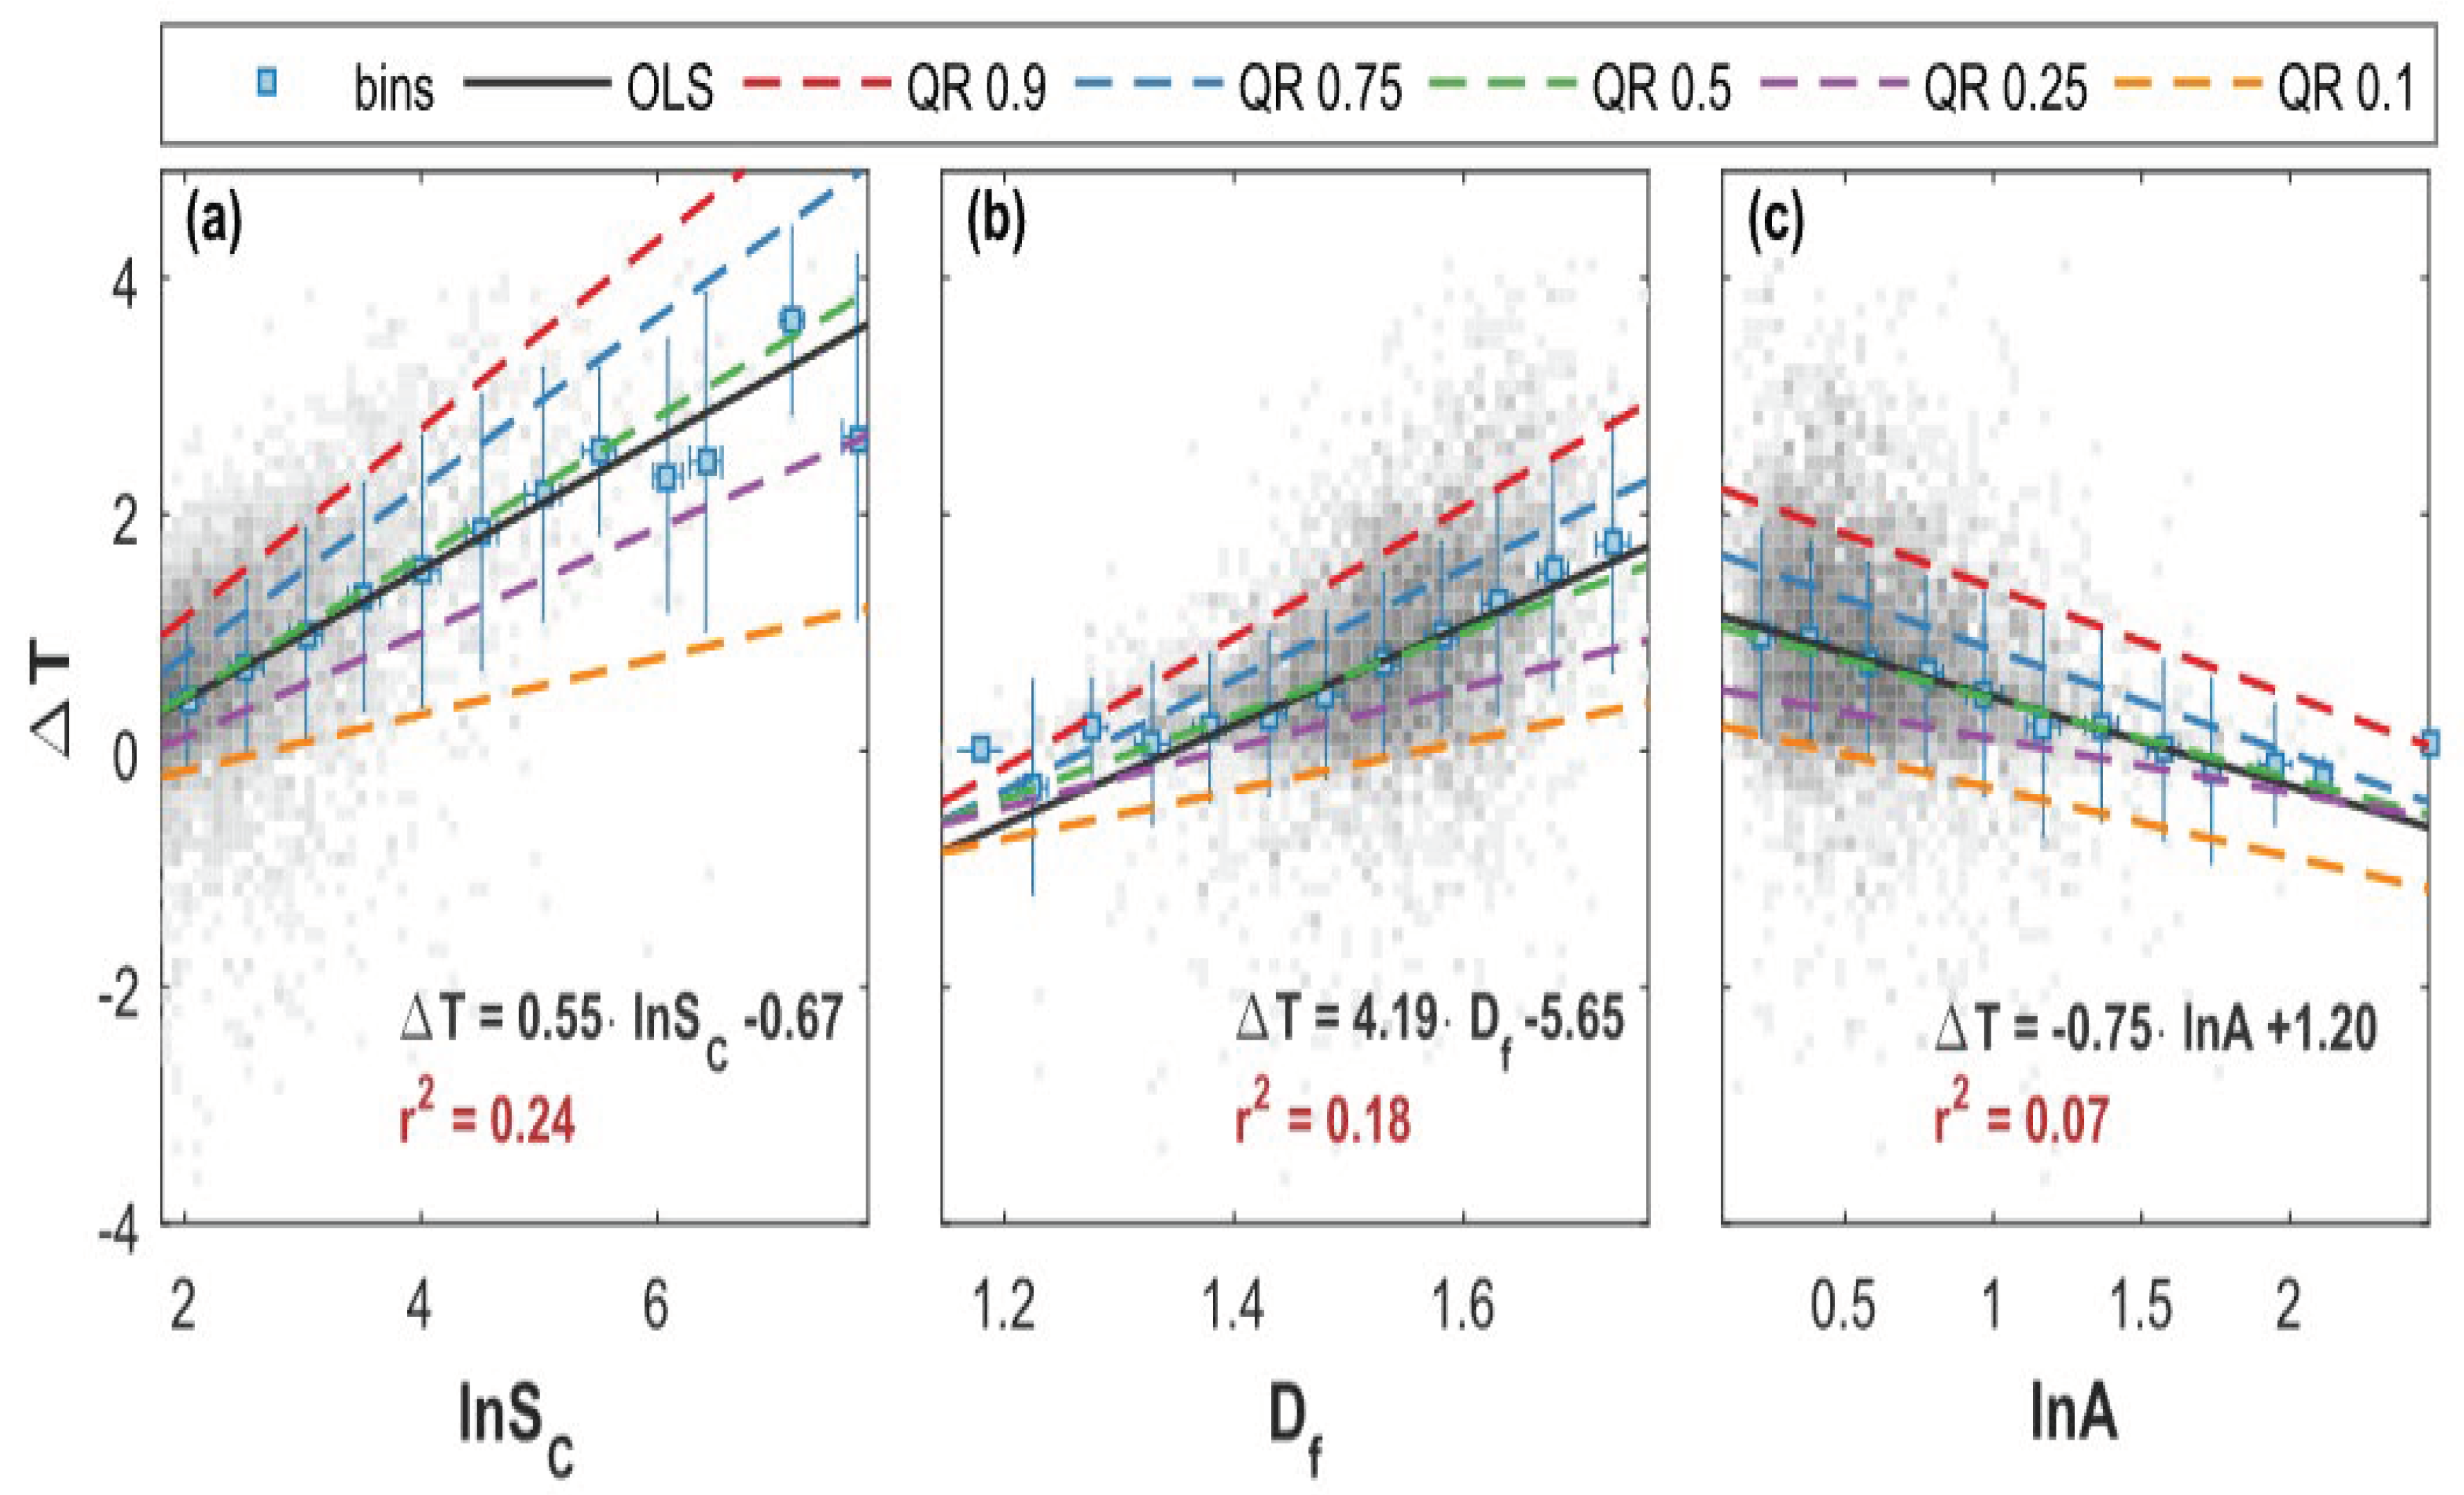
Scatterplots in
Figure 12 (c.f., [
18]) show the associations between three parameters and the midday UHI intensity in the setting. The UHI intensity increases with city growth, as seen in
Figure 12a, with an increase in UHI intensity of roughly 0.4 °C occurring for every doubling of city size. Moreover, there is a substantial correlation between population size and UHI intensity [
18]. Quantile regressions also show heteroscedasticity, which suggests a stronger dispersion of UHI severity among major cities. The association between
and UHI intensity is seen in
Figure 12b. The findings reveal that more compact cities often have larger UHI effects, with an average UHI intensity rise of about 2 °C as
increases. Additionally, in
Figure 12c, it is observed that the UHI intensity decreases with increasing anisometry, with more circular cities exhibiting higher UHI intensities.
5. Conclusion and Future Work
On a very strong note, this current study adds to the existing knowledge, based on only one single paper in literature [
9], where the undertaken research was mainly of the fractal dimensions of the very basic Shannonian entropic form. More importantly, this paper extends the Information Theoretic Fractal Geometry (ITFG) to the highest level, by obtaining
, as a potential generalization to [
9]. It is worth noting that the first author of the current paper has published two seminal papers(see, [
21,
22]) to set the cornerstones of ITFG based on the
theory of both Ismail’s Second and Fourth Entropies, namely (
) and (
). Potentially,
and
are considered as ultimate generalization to numerous entropy measures within the literature. Based on these consolidated facts, the current paper provides another ground-breaking discovery that adds to ITFG. The study has shown the existence of negative values of
, which links to very interesting mathematical and physical avenues of research. More fundamentally, the information-theoretic impact on Sierpiniski Gasket dimension of
that corresponds to
was addressed. The influential impact of fractal dimension to advance smart cities was overviewed. Future work involves finding the fractal dimension of available entropies in the literature [
19,
20] to draw a detailed comparison between these derived fractal dimensions, which will open new grounds towards a revolutionary ITFG. The next research phase includes the exploration of the threshold theorems for
and in terms of
more potentially, exploring for a first-time ever the corresponding arbitrary Sierpinski Gasket for the newly derived
. On another applicative note, more applications of fractal dimension to smart cities, engineering and other interdisciplinary themes of research will be addressed.
