Submitted:
05 April 2024
Posted:
05 April 2024
You are already at the latest version
Abstract
Keywords:
1. Introduction
2. Materials and Methods
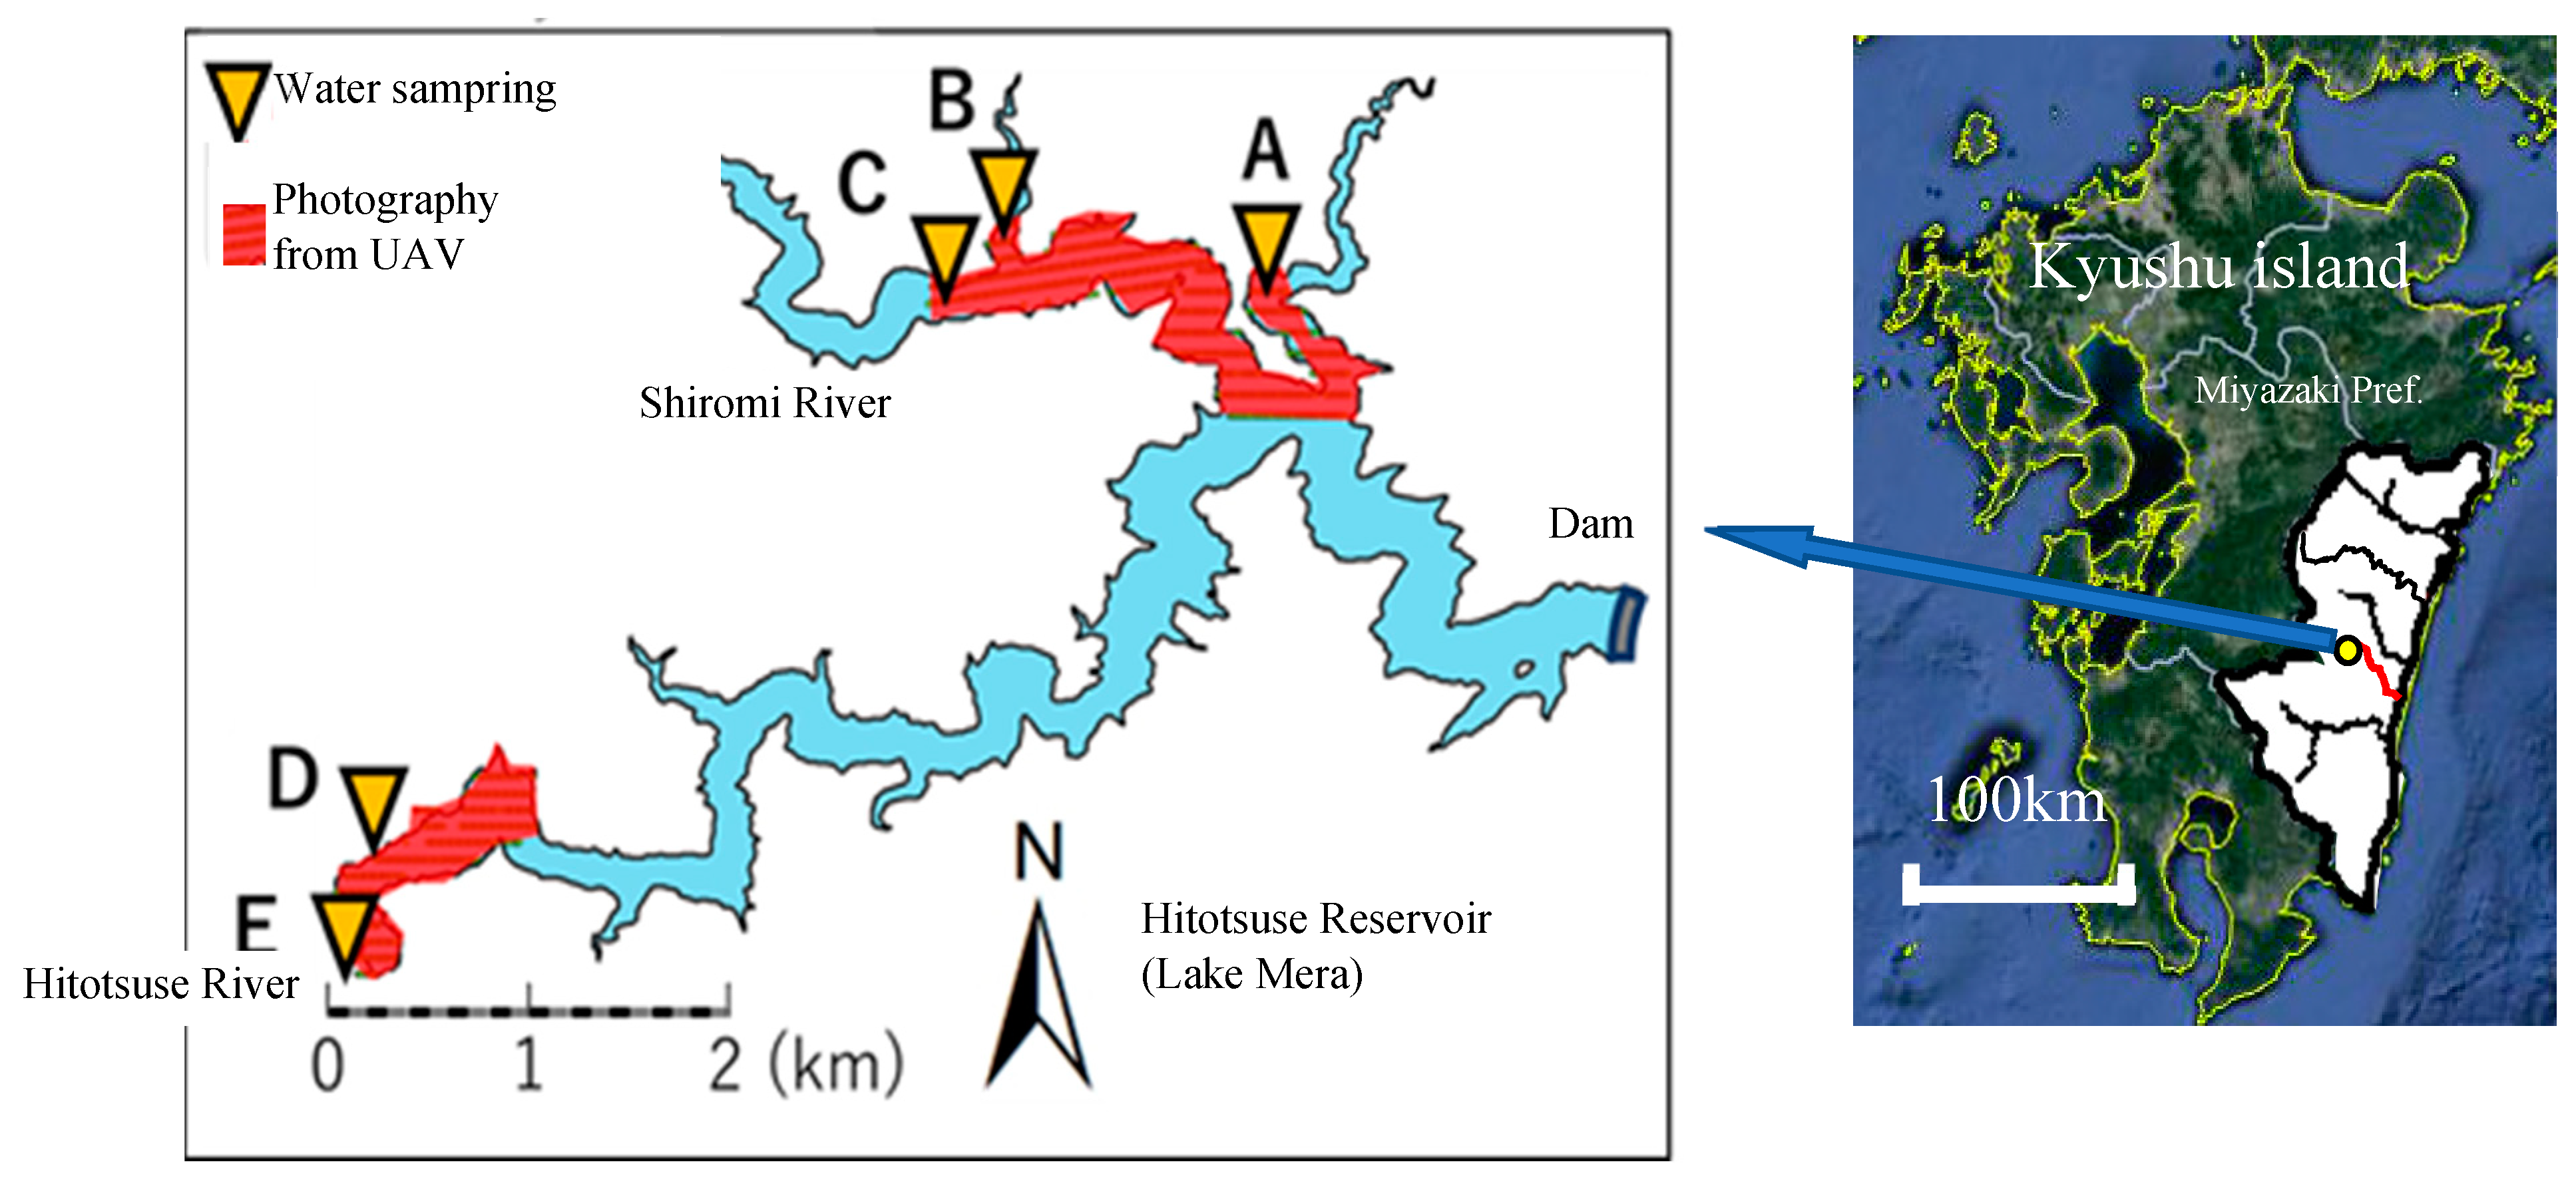
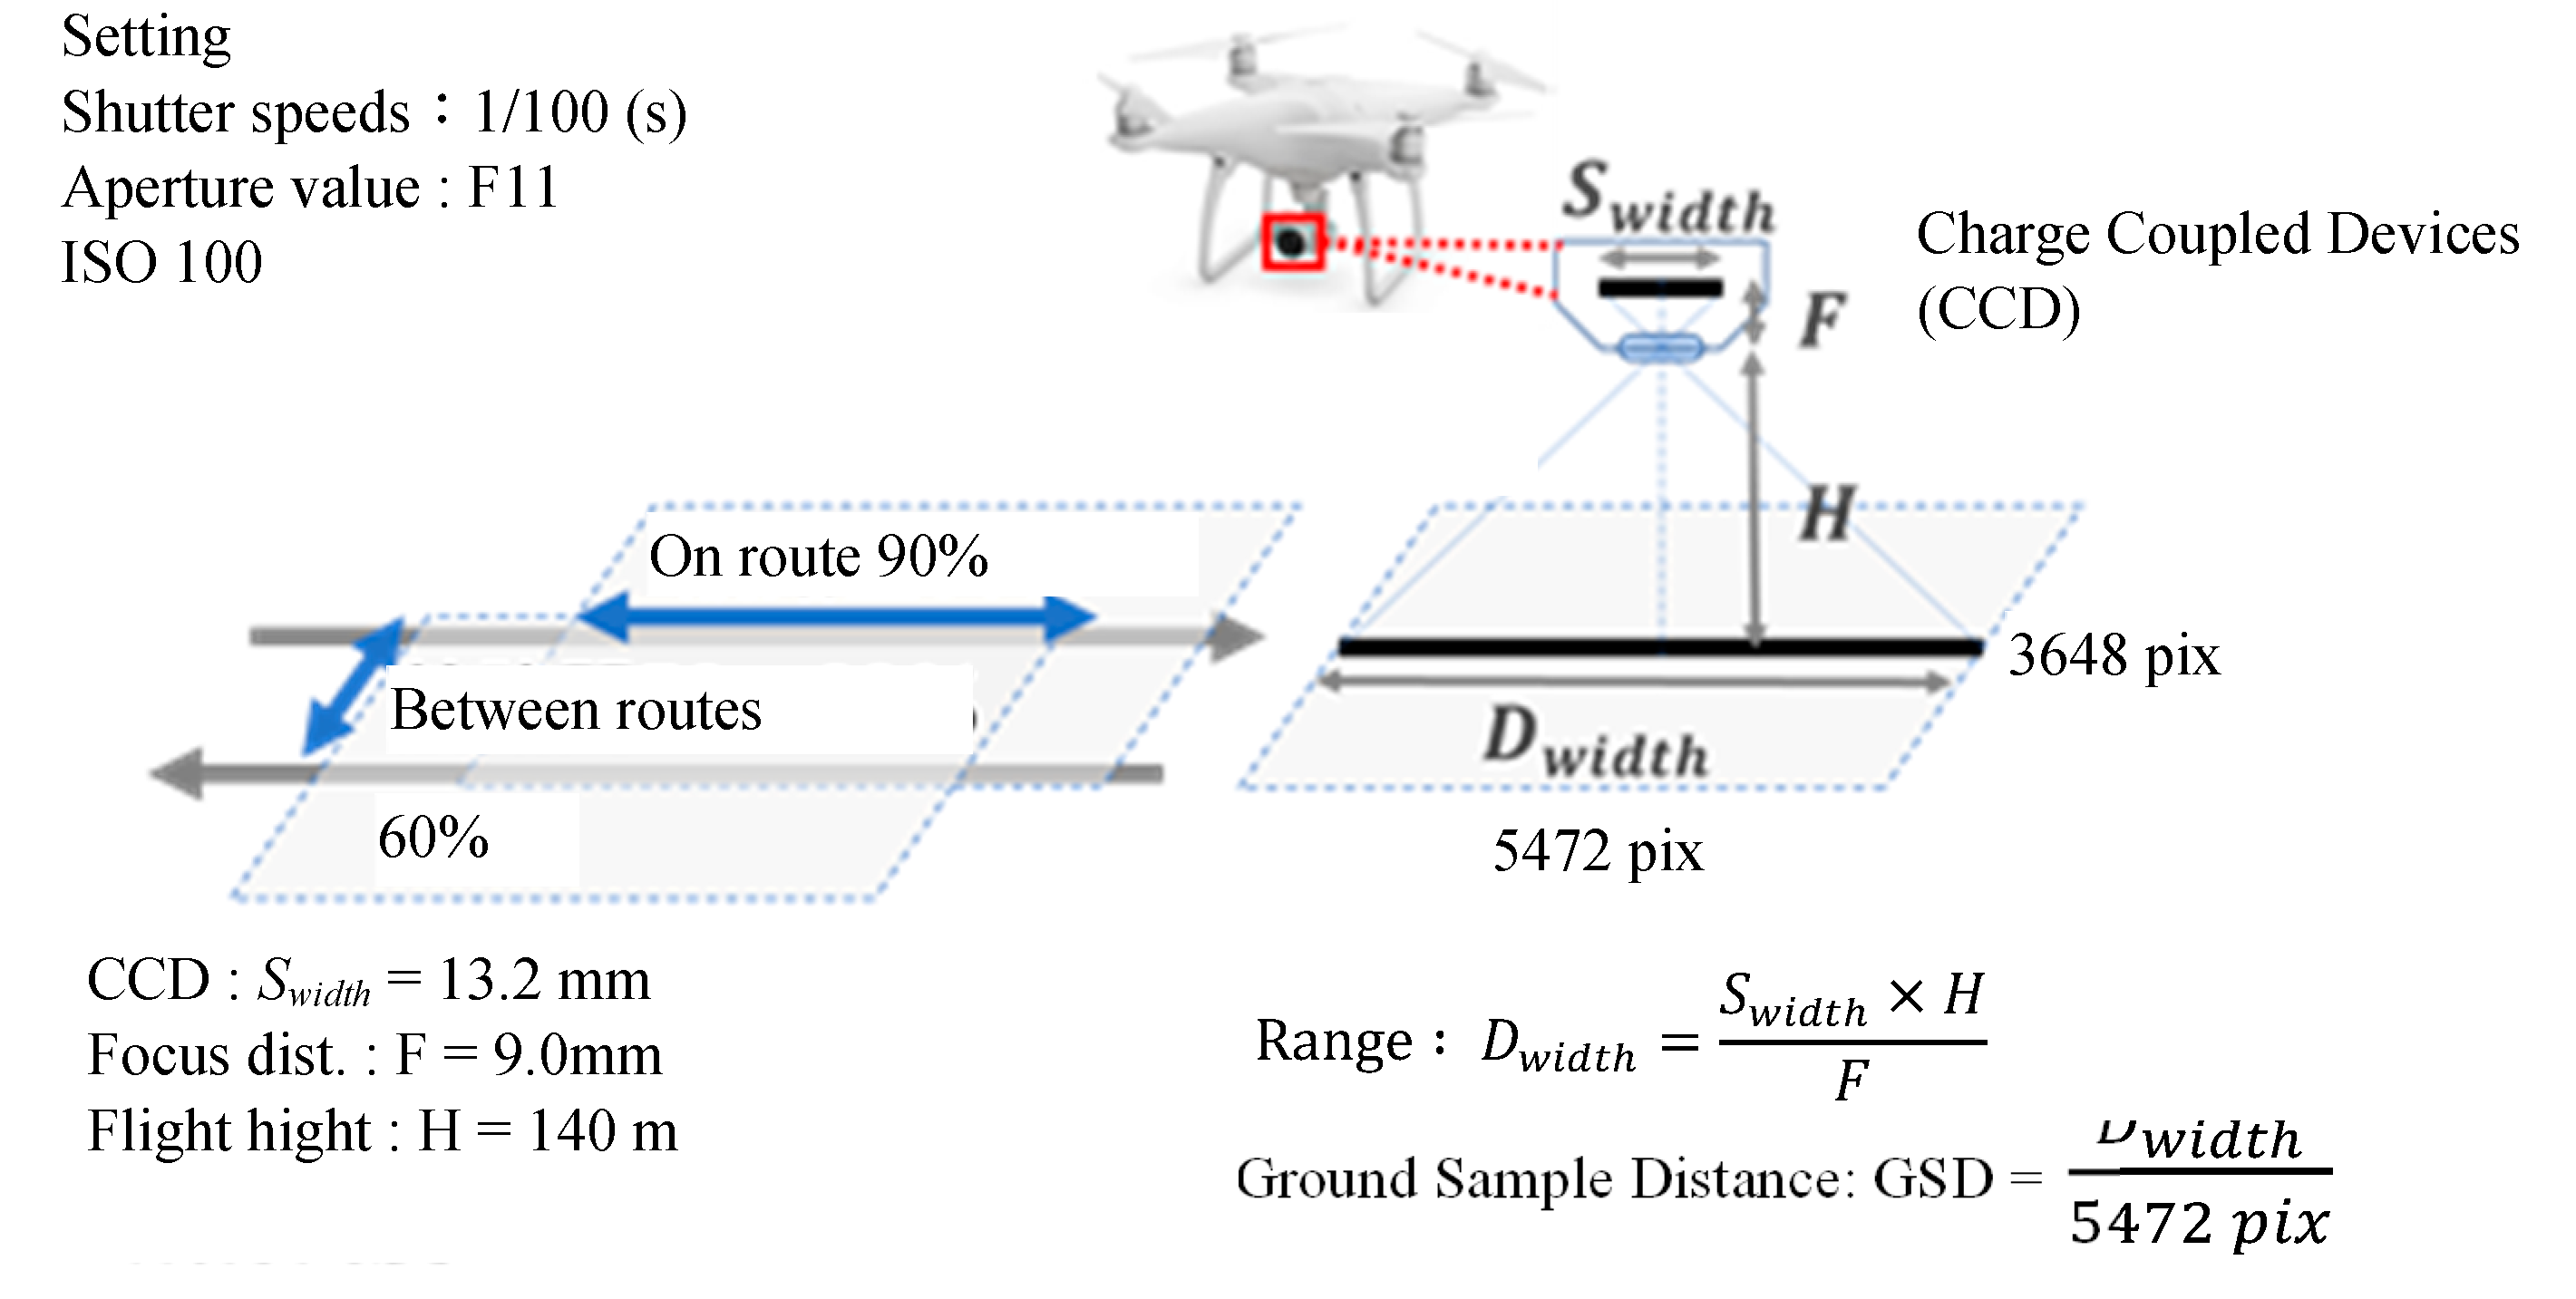
2.1. Study Site and Photography from UAV
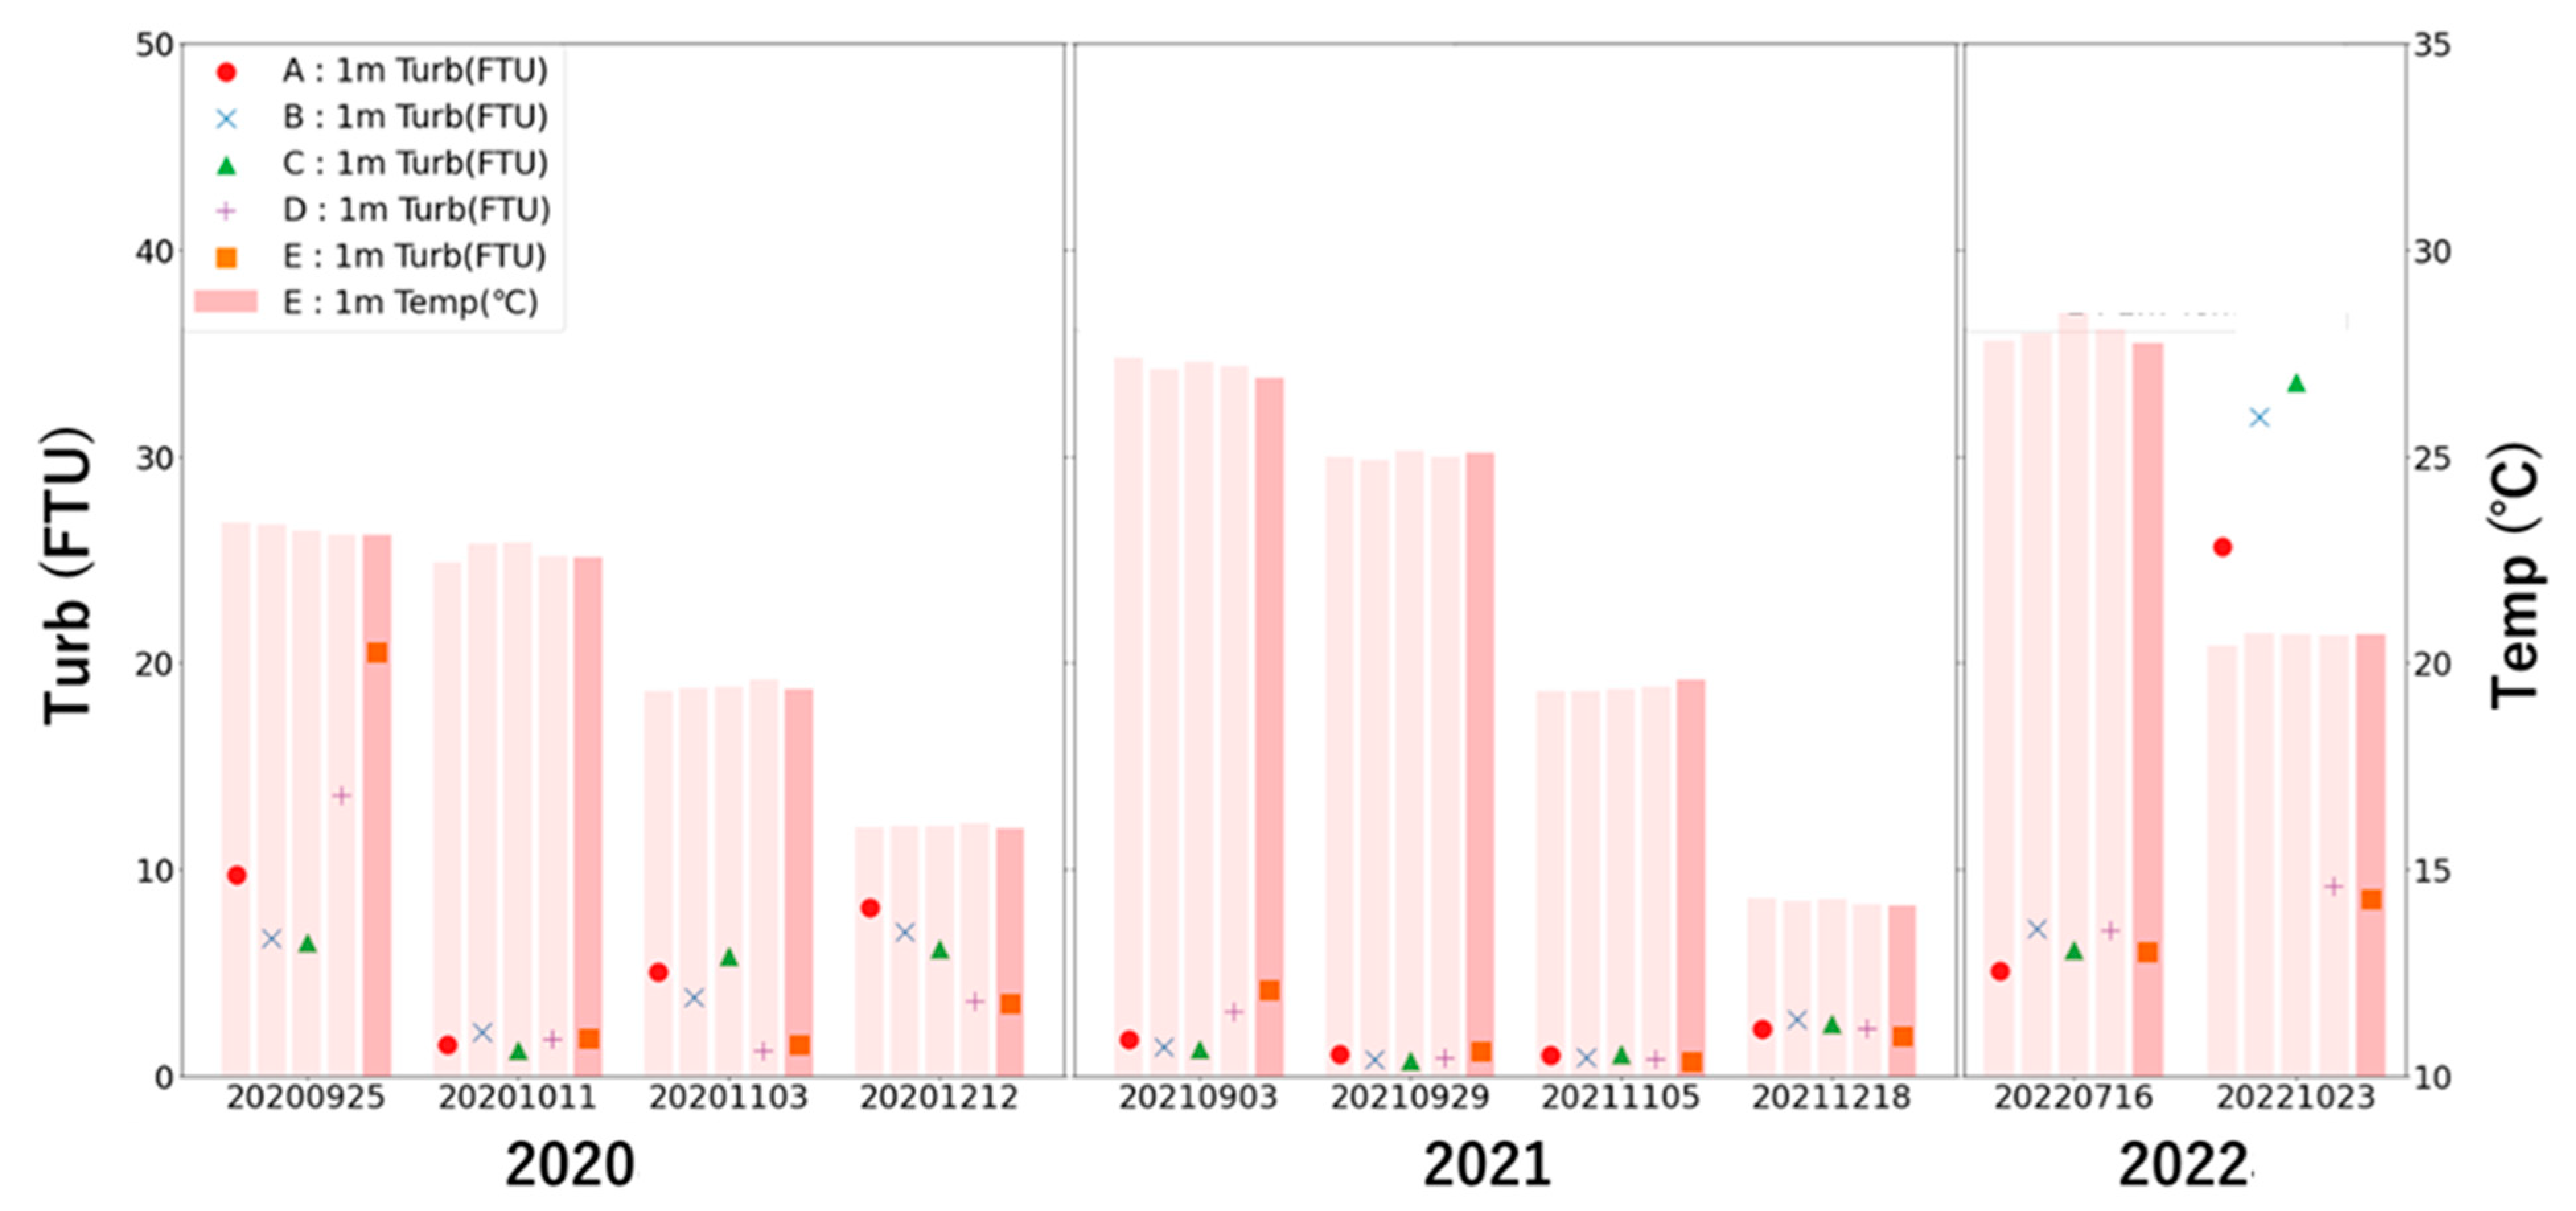
2.2. Water Sampling and Vertical Profiling
2.3. Distribution of Turbidity
2.4. The Flow Chart of Overall Processes for Machine Learning
2.5. Rectification of the Coordinates (Georeferencing)
3. Results and Discussion
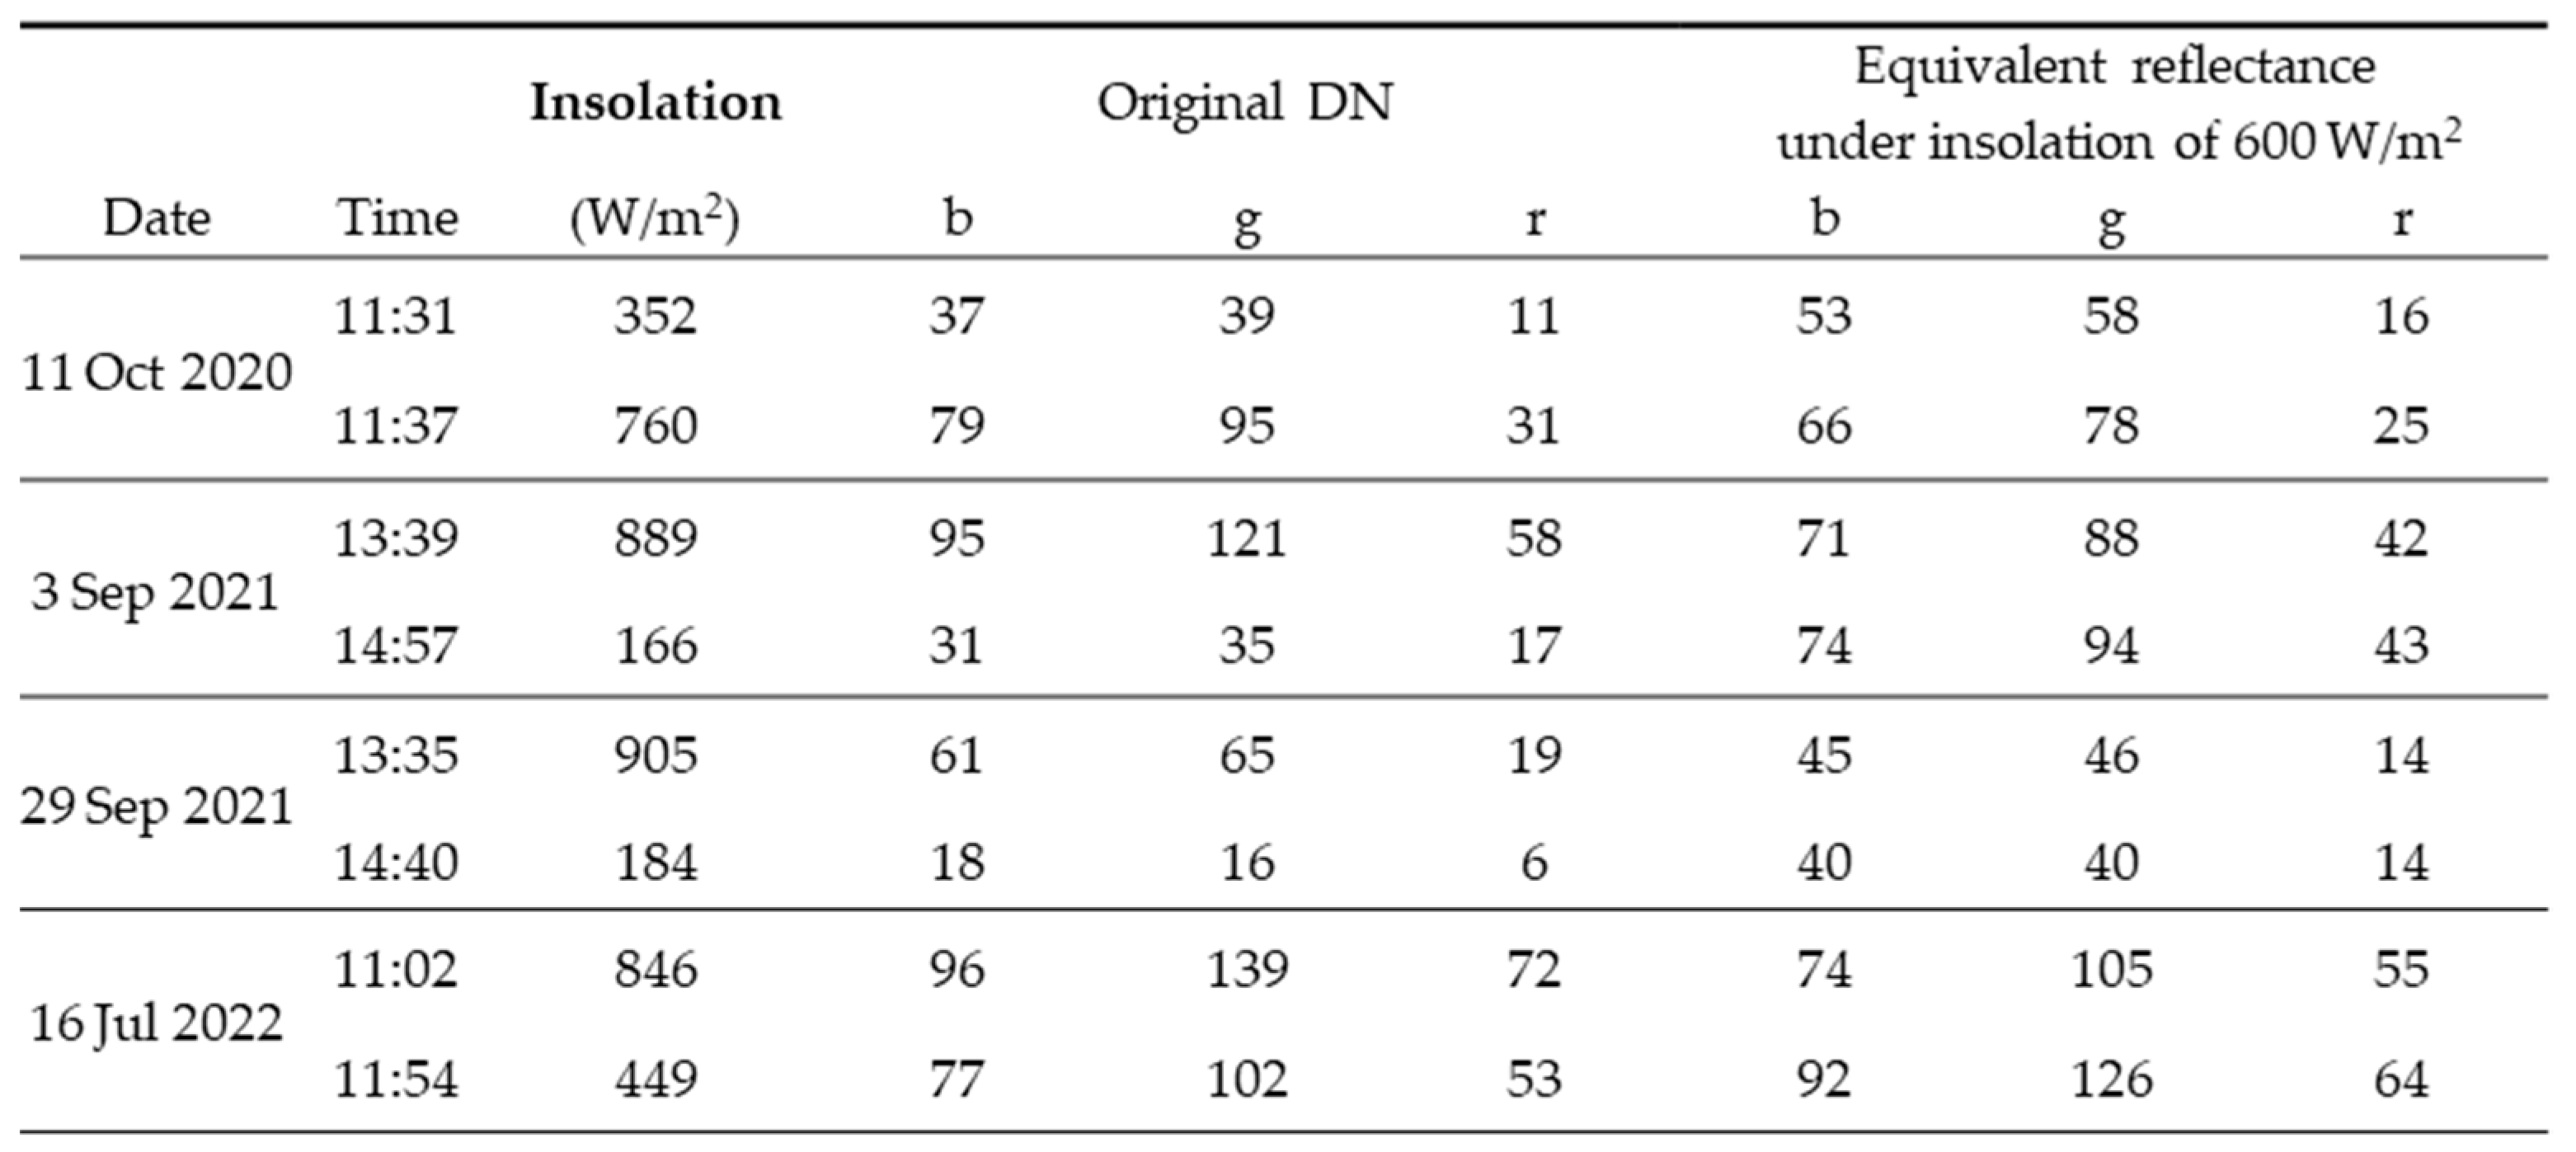
3.1. Calibration of the Reflectance
3.2. Turbidity Estimation from Satellite Images
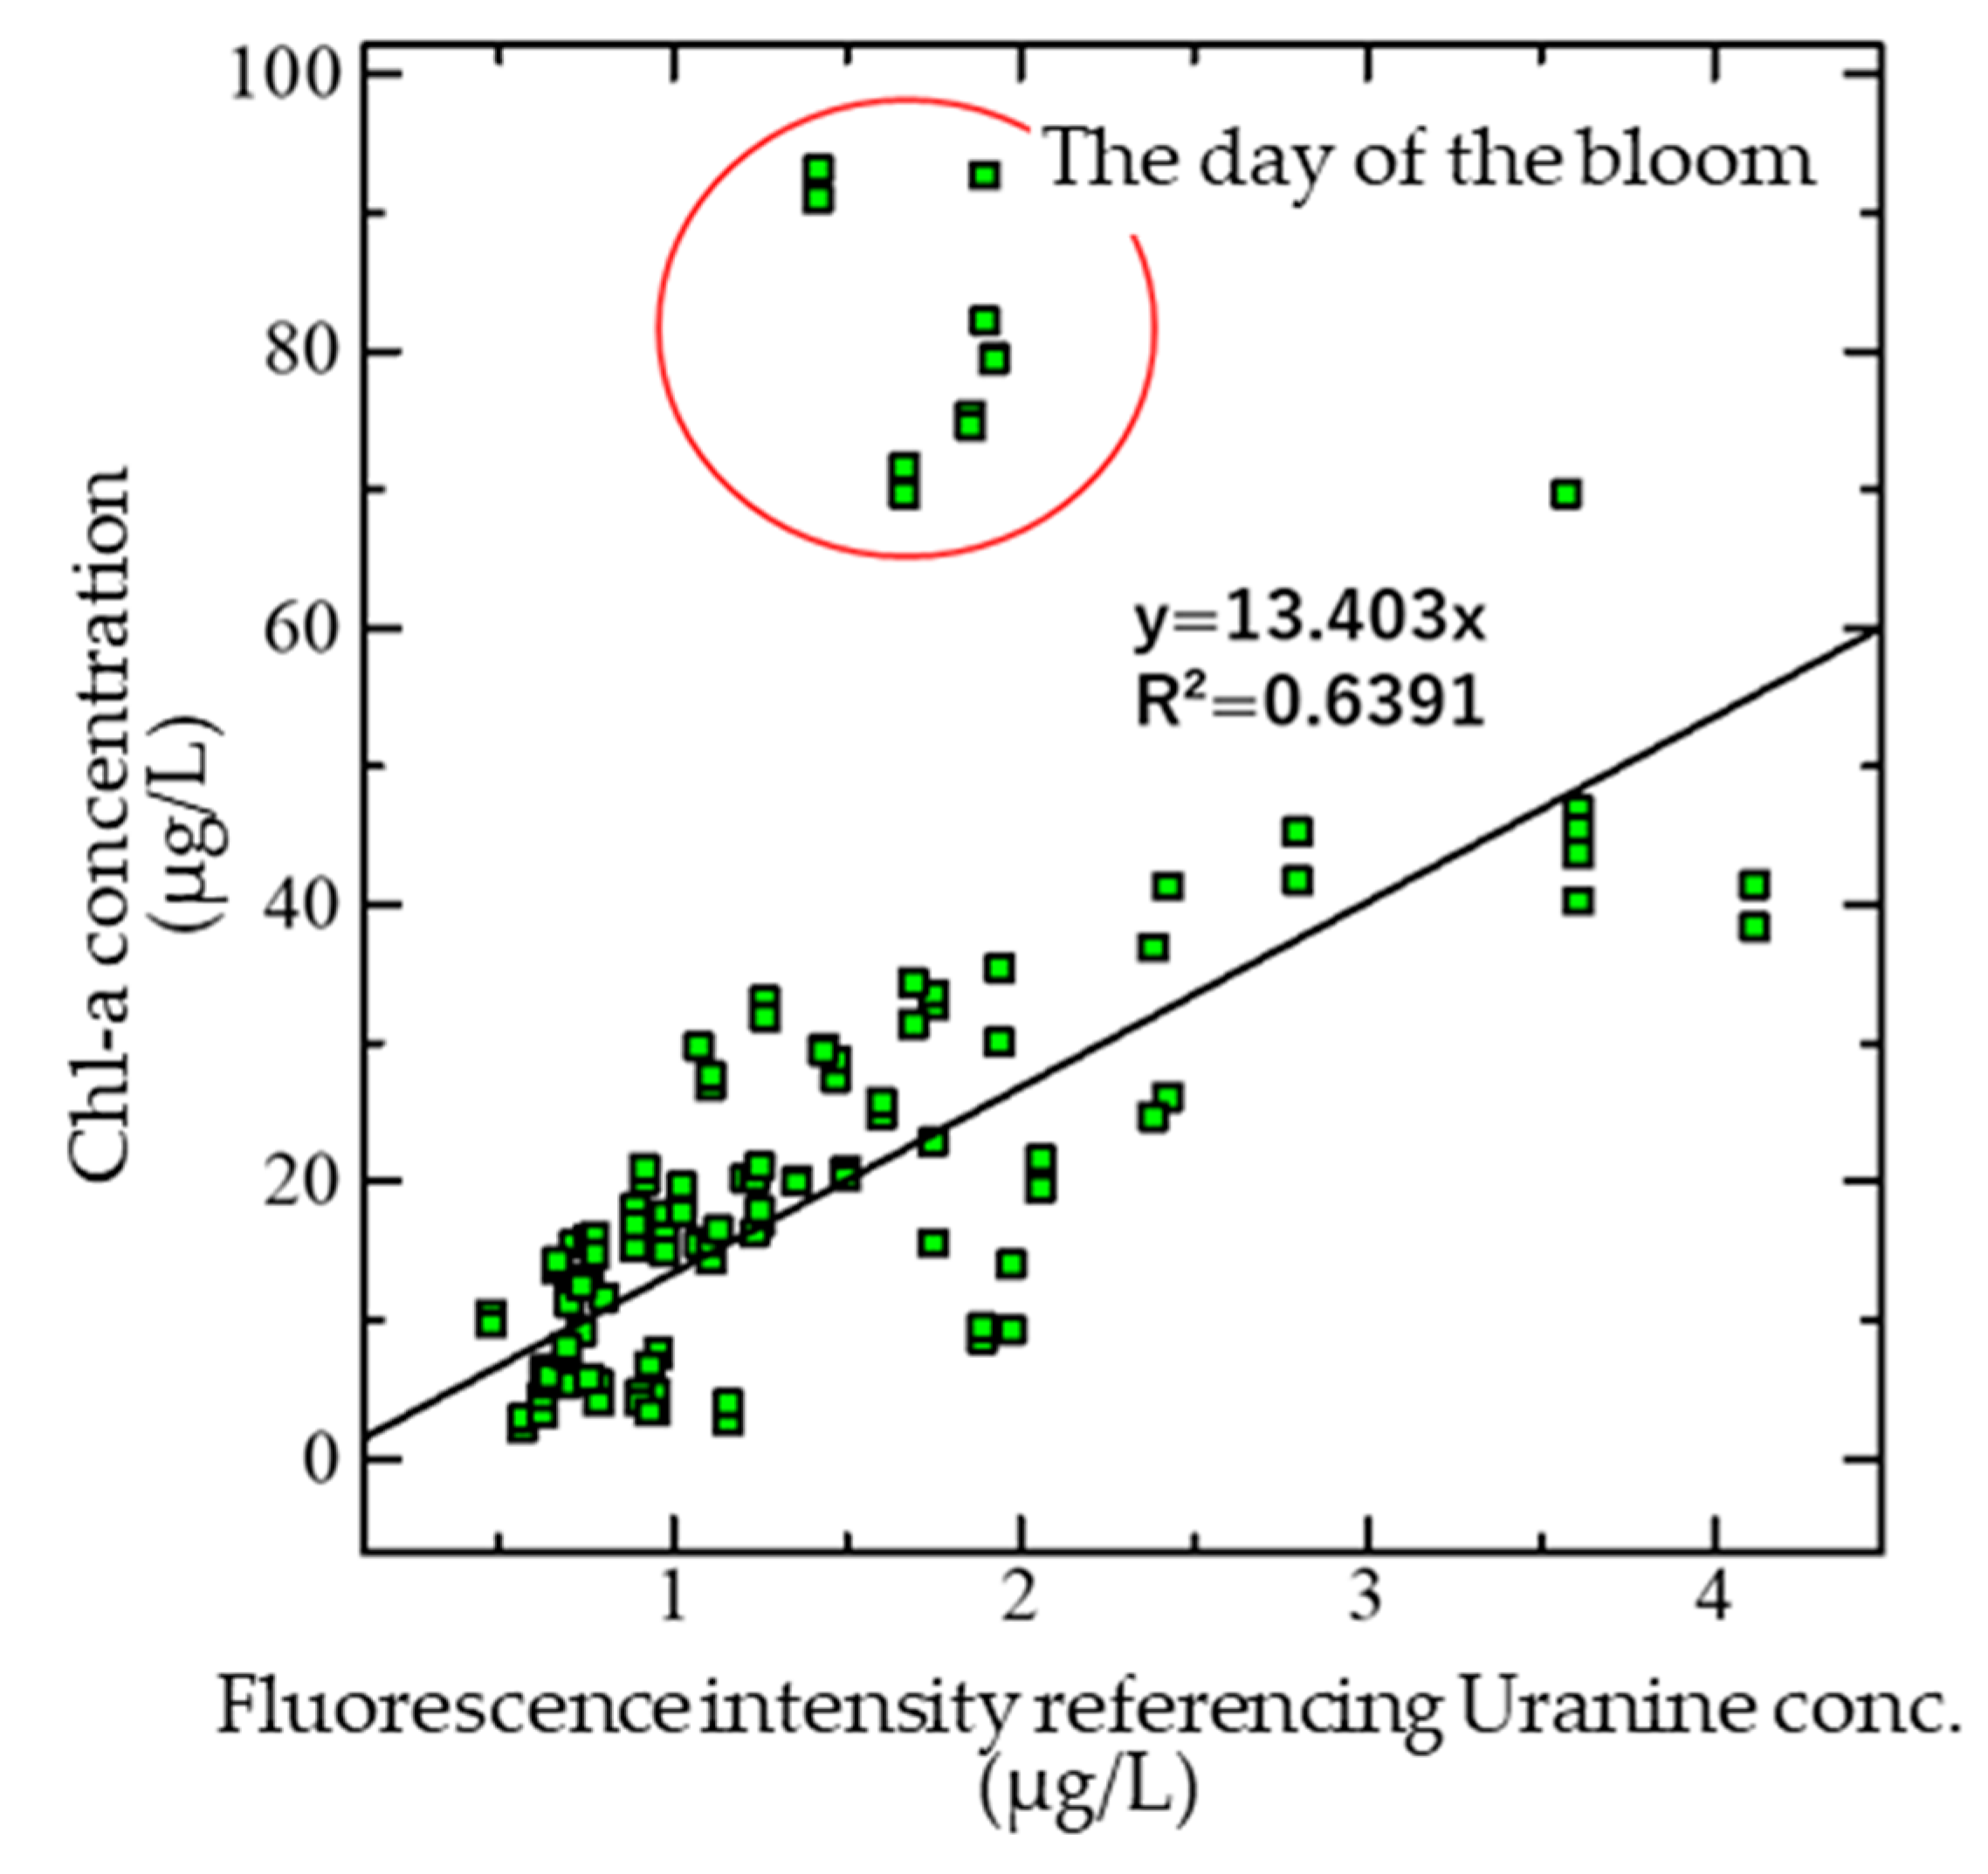
3.3. Classification of Presence or Absence of Bloom and Regression of Chl-a Concentration
3.5. Distribution of the Concentration of Chl-a Estimated by the Proposed Method
5. Conclusions
Author Contributions
Funding
Conflicts of Interest
References
- Ellison, M.E.; Brett, M.T. Particulate phosphorus bioavailability as a function of stream flow and land cover. Water Res. 2006, 40, 1258–1268. [Google Scholar] [CrossRef] [PubMed]
- Azhikodan, G.; Yokoyama, K. Spatio-temporal variability of phytoplankton (Chlorophyll-a) in relation to salinity, suspended sediment concentration, and light intensity in a macrotidal estuary. Cont. Shelf Res. 2016, 126, 15–26. [Google Scholar] [CrossRef]
- Allison, A.O.; Randy, A.D.; Michae, L.D. The upside-down river: Reservoirs, algal blooms, and tributaries affect temporal and spatial patterns in nitrogen and phosphorus in the Klamath River, USA. J. Hydrol. 2014, 519, 164–176. [Google Scholar]
- Dabrowski, T.; Lyons, K.; Nolan, G.; Berry, A.; Cusack, C.; Silke, J. Harmful algal bloom forecast system for SW Ireland. Part I: Description and validation of an operational forecasting model. Harmful Algae 2016, 53, 64–76. [Google Scholar] [CrossRef] [PubMed]
- Welch, E.B. Ecological Effects of Wastewater: Applied Limnology and Pollutant Effects. Second ed. CRC Press, London, UK, 1992. [CrossRef]
- Carmichael, W.W. The Toxins of Cyanobacteria. Sci. Am. 1994, 270, 78–86. [Google Scholar] [CrossRef]
- Downing, J.A.; Watson, S.B.; McCauley, E. Predicting cyanobacteria dominance in lakes. Can. J. of Fish. Aquat. Sci. 2001, 58, 1905–1908. [Google Scholar] [CrossRef]
- Jilbert, T.; Couture, R.-M.; Huser, B.J.; Salonen, K. Preface: Restoration of eutrophic lakes: current practices and future challenges. Hydrobiologia 2020, 847, 4343–4357. [Google Scholar] [CrossRef]
- Anderson, D.M.; Fensin, E.; Gobler, C.J.; Hoeglund, A.E.; Hubbard, K.A.; Kulis, D.M.; Landsberg, J.H.; Lefebvre, K.A.; Provoost, P.; Richlen, M.L.; et al. Marine harmful algal blooms (HABs) in the United States: History, current status and future trends. Harmful Algae 2021, 102, 101975–101975. [Google Scholar] [CrossRef] [PubMed]
- Anderson, D.M.; Cembella, A.D.; Hallegraeff, G.M. Progress in Understanding Harmful Algal Blooms: Paradigm Shifts and New Technologies for Research, Monitoring, and Management. Annu. Rev. Mar. Sci. 2012, 4, 143–176. [Google Scholar] [CrossRef]
- Díaz, P.A.; Ruiz-Villarreal, M.; Pazos, Y.; Moita, T.; Reguera, B. Climate variability and Dinophysis acuta blooms in an upwelling system. Harmful Algae 2016, 53, 145–159. [Google Scholar] [CrossRef]
- Houliez, E.; Lizon, F.; Lefebvre, S.; Artigas, L.F.; Schmitt, F.G. Phytoplankton photosynthetic activity dynamics in a temperate macrotidal ecosystem (the Strait of Dover, eastern English Channel): Time scales of variability and environmental control. J. Mar. Syst. 2015, 147, 61–75. [Google Scholar] [CrossRef]
- Azevedo, I.C.; Duarte, P.M.; Bordalo, A.A. Understanding spatial and temporal dynamics of key environmental characteristics in a mesotidal Atlantic estuary (Douro, NW Portugal). Estuarine, Coast. Shelf Sci. 2008, 76, 620–633. [Google Scholar] [CrossRef]
- Mori, M.; Flores, R.G.; Suzuki, Y.; Nukazawa, K.; Hiraoka, T.; Nonaka, H. Prediction of Microcystis Occurrences and Analysis Using Machine Learning in High-Dimension, Low-Sample-Size and Imbalanced Water Quality Data. Harmful Algae 2022, 117, 102273. [Google Scholar] [CrossRef] [PubMed]
- Shan, K.; Wang, X.; Yang, H.; Zhou, B.; Song, L.; Shang, M. Use statistical machine learning to detect nutrient thresholds in Microcystis blooms and microcystin management. Harmful Algae 2020, 94, 101807. [Google Scholar] [CrossRef] [PubMed]
- Wang, L.; Zhang, T.; Wang, X.; Jin, X.; Xu, J.; Yu, J.; Zhang, H.; Zhao, Z. An approach of improved Multivariate Timing-Random Deep Belief Net modelling for algal bloom prediction. Biosyst. Eng. 2019, 177, 130–138. [Google Scholar] [CrossRef]
- Jiang, Y.-J.; He, W.; Liu, W.-X.; Qin, N.; Ouyang, H.-L.; Wang, Q.-M.; Kong, X.-Z.; He, Q.-S.; Yang, C.; Yang, B.; et al. The seasonal and spatial variations of phytoplankton community and their correlation with environmental factors in a large eutrophic Chinese lake (Lake Chaohu). Ecol. Indic. 2014, 40, 58–67. [Google Scholar] [CrossRef]
- Dale, B.; Murphy, M. A retrospective appraisal of the importance of high-resolution sampling for harmful algal blooms: Lessons from long-term phytoplankton monitoring at Sherkin Island, S.W. Ireland. Harmful Algae 2014, 40, 23–33. [Google Scholar] [CrossRef]
- Nwe, L.W.; Yokoyama, K.; Azhikodan, G. Phytoplankton habitats and size distribution during a neap-spring transition in the highly turbid macrotidal Chikugo River estuary. Sci. Total. Environ. 2022, 850, 157810. [Google Scholar] [CrossRef]
- Veerapaga, N.; Shintani, T.; Azhikodan, G.; Yokoyama, K. Study on Salinity Intrusion and Mixing Types in a Conceptual Estuary Using 3-D Hydrodynamic Simulation: Effects of Length, Width, Depth, and Bathymetry. In: Nguyen, K., Guillou, S., Gourbesville, P., Thiébot, J. (eds) Estuaries and Coastal Zones in Times of Global Change. Springer Water. Springer, Singapore, 2020. [CrossRef]
- Chaffin, J.D.; Kane, D.D.; Stanislawczyk, K.; Parker, E.M. Accuracy of data buoys for measurement of cyanobacteria, chlorophyll, and turbidity in a large lake (Lake Erie, North America): implications for estimation of cyanobacterial bloom parameters from water quality sonde measurements. Environ. Sci. Pollut. Res. 2018, 25, 25175–25189. [Google Scholar] [CrossRef]
- Nakayama, K.; Komai, K.; Amano, M.; Horii, S.; Somiya, Y.; Kumamoto, E.; Oyama, Y. Ideal water temperature environment for giant Marimo (Aegagropila linnaei) in Lake Akan, Japan. Sci. Rep. 2023, 13, 1–10. [Google Scholar] [CrossRef]
- Le, H.N.; Shintani, T.; Nakayama, K. A Detailed Analysis on Hydrodynamic Response of a Highly Stratified Lake to Spatio-Temporally Varying Wind Field. Water 2023, 15, 565. [Google Scholar] [CrossRef]
- Xu, X.; Ishikawa, T.; Nakamura, T. THREE-DIMENSIONAL MODELING OF HYDRODYNAMICS AND DISSOLVED OXYGEN TRANSPORT IN TONE RIVER ESTUARY. J. JSCE 2013, 1, 194–213. [Google Scholar] [CrossRef] [PubMed]
- Huang, J.; Zhang, Y.; Huang, Q.; Gao, J. When and where to reduce nutrient for controlling harmful algal blooms in large eutrophic lake Chaohu, China? Ecol. Indic. 2018, 89, 808–817. [Google Scholar] [CrossRef]
- Maguire, J.; Cusack, C.; Ruiz-Villarreal, M.; Silke, J.; McElligott, D.; Davidson, K. Applied simulations and integrated modelling for the understanding of toxic and harmful algal blooms (ASIMUTH): Integrated HAB forecast systems for Europe's Atlantic Arc. Harmful Algae 2016, 53, 160–166. [Google Scholar] [CrossRef]
- Li, D.; Gao, Z.; Song, D.; Shang, W.; Jiang, X. Characteristics and influence of green tide drift and dissipation in Shandong Rongcheng coastal water based on remote sensing. Estuarine, Coast. Shelf Sci. 2019, 227. [Google Scholar] [CrossRef]
- Hu, L.; Zeng, K.; Hu, C.; He, M.-X. On the remote estimation of Ulva prolifera areal coverage and biomass. Remote. Sens. Environ. 2019, 223, 194–207. [Google Scholar] [CrossRef]
- Chen, X.; Shang, S.; Lee, Z.; Qi, L.; Yan, J.; Li, Y. High-frequency observation of floating algae from AHI on Himawari-8. Remote. Sens. Environ. 2019, 227, 151–161. [Google Scholar] [CrossRef]
- Ma, J.; Jin, S.; Li, J.; He, Y.; Shang, W. Spatio-Temporal Variations and Driving Forces of Harmful Algal Blooms in Chaohu Lake: A Multi-Source Remote Sensing Approach. Remote. Sens. 2021, 13, 427. [Google Scholar] [CrossRef]
- Zhang, T.; Hu, H.; Ma, X.; Zhang, Y. Long-Term Spatiotemporal Variation and Environmental Driving Forces Analyses of Algal Blooms in Taihu Lake Based on Multi-Source Satellite and Land Observations. Water 2020, 12, 1035. [Google Scholar] [CrossRef]
- Liu, M.; Ling, H.; Wu, D.; Su, X.; Cao, Z. Sentinel-2 and Landsat-8 Observations for Harmful Algae Blooms in a Small Eutrophic Lake. Remote. Sens. 2021, 13, 4479. [Google Scholar] [CrossRef]
- Soomets, T.; Uudeberg, K.; Jakovels, D.; Brauns, A.; Zagars, M.; Kutser, T. Validation and Comparison of Water Quality Products in Baltic Lakes Using Sentinel-2 MSI and Sentinel-3 OLCI Data. Sensors 2020, 20, 742. [Google Scholar] [CrossRef] [PubMed]
- Toth, C.; Jóźków, G. Remote sensing platforms and sensors: A survey. ISPRS J. Photogramm. Remote Sens. 2016, 115, 22–36. [Google Scholar] [CrossRef]
- Qu, M.; Anderson, S.; Lyu, P.; Malang, Y.; Lai, J.; Liu, J.; Jiang, B.; Xie, F.; Liu, H.H.; Lefebvre, D.D.; et al. Effective aerial monitoring of cyanobacterial harmful algal blooms is dependent on understanding cellular migration. Harmful Algae 2019, 87, 101620. [Google Scholar] [CrossRef]
- Guimarães, T.T.; Veronez, M.R.; Koste, E.C.; Gonzaga, L.; Bordin, F.; Inocencio, L.C.; Larocca, A.P.C.; De Oliveira, M.Z.; Vitti, D.C.; Mauad, F.F. An Alternative Method of Spatial Autocorrelation for Chlorophyll Detection in Water Bodies Using Remote Sensing. Sustainability 2017, 9, 416. [Google Scholar] [CrossRef]
- Su, T.-C.; Chou, H.-T. Application of Multispectral Sensors Carried on Unmanned Aerial Vehicle (UAV) to Trophic State Mapping of Small Reservoirs: A Case Study of Tain-Pu Reservoir in Kinmen, Taiwan. Remote Sens. 2015, 7, 10078–10097. [Google Scholar] [CrossRef]
- Cheng, K.; Chan, S.; Lee, J.H. Remote sensing of coastal algal blooms using unmanned aerial vehicles (UAVs). Mar. Pollut. Bull. 2020, 152, 110889. [Google Scholar] [CrossRef] [PubMed]
- Cao, Z.; Duan, H.; Feng, L.; Ma, R.; Xue, K. Climate- and human-induced changes in suspended particulate matter over Lake Hongze on short and long timescales. Remote Sens. Environ. 2017, 192, 98–113. [Google Scholar] [CrossRef]
- Hu, C.; Chen, Z.; Clayton, T.D.; Swarzenski, P.; Brock, J.C.; Muller–Karger, F.E. Assessment of estuarine water-quality indicators using MODIS medium-resolution bands: Initial results from Tampa Bay, FL. Remote Sens. Environ. 2004, 93, 423–441. [Google Scholar] [CrossRef]
- Kishino, M.; Tanaka, A.; Ishizaka, J. Retrieval of Chlorophyll a, suspended solids, and colored dissolved organic matter in Tokyo Bay using ASTER data. Remote. Sens. Environ. 2005, 99, 66–74. [Google Scholar] [CrossRef]
- Sakuno, Y.; Yajima, H.; Yoshioka, Y.; Sugahara, S.; Elbasit, M.A.M.A.; Adam, E.; Chirima, J.G. Evaluation of Unified Algorithms for Remote Sensing of Chlorophyll-a and Turbidity in Lake Shinji and Lake Nakaumi of Japan and the Vaal Dam Reservoir of South Africa under Eutrophic and Ultra-Turbid Conditions. Water 2018, 10, 618. [Google Scholar] [CrossRef]
- Palmer, S.C.; Hunter, P.D.; Lankester, T.; Hubbard, S.; Spyrakos, E.; Tyler, A.N.; Présing, M.; Horváth, H.; Lamb, A.; Balzter, H.; et al. Validation of Envisat MERIS algorithms for chlorophyll retrieval in a large, turbid and optically-complex shallow lake. Remote. Sens. Environ. 2015, 157, 158–169. [Google Scholar] [CrossRef]
- Yamagata, Y.; Wiegand, C.; Akiyama, T.; Shibayama, M. Water turbidity and perpendicular vegetation indices for paddy rice flood damage analyses. Remote. Sens. Environ. 1988, 26, 241–251. [Google Scholar] [CrossRef]
- Murakami, T.; Suzuki, Y.; Oishi, H.; Ito, K.; Nakao, T. Tracing the source of difficult to settle fine particles which cause turbidity in the Hitotsuse reservoir, Japan. J. Environ. Manag. 2013, 120, 37–47. [Google Scholar] [CrossRef]
- Murakami, T.; Nakayama, H.; Mizuguchi, S.; Sugio, S.; Ootawara, N. Effective Countermeasures to long-term Turbid Water Effluence from the Hitotsuse Dam Reservoir, In Proceedings of the 6th Int. Symp. Environ. Hyd., Athens, Greece, 23-25, June, 2010. [CrossRef]
- Chen, T.; Guestrin, C. XGBoost: A Scalable Tree Boosting System. In KDD ‘16: Proc. 22nd ACM SIGKDD Int. Conf. Knowledge Discovery and Data Mining, San Francisco, California, USA, 13-17, August, 2016.
- https://microsoft-image-composite-editor-64bits.en.softonic.com/?ex=RAMP-1768.3.
- Irie, M.; Arakaki, S.; Suto, T.; Umino, T. Classification of River Sediment Fractions in a River Segment including Shallow Water Areas Based on Aerial Images from Unmanned Aerial Vehicles with Convolution Neural Networks. Remote. Sens. 2024, 16, 173. [Google Scholar] [CrossRef]

 |
 |
 |
Disclaimer/Publisher’s Note: The statements, opinions and data contained in all publications are solely those of the individual author(s) and contributor(s) and not of MDPI and/or the editor(s). MDPI and/or the editor(s) disclaim responsibility for any injury to people or property resulting from any ideas, methods, instructions or products referred to in the content. |
© 2024 by the authors. Licensee MDPI, Basel, Switzerland. This article is an open access article distributed under the terms and conditions of the Creative Commons Attribution (CC BY) license (http://creativecommons.org/licenses/by/4.0/).


