1. Introduction
Continued advances in control technology and power electronics have expanded the applications of power conversion systems in spacecraft, aircraft, ships, telecommunications networks, and electric vehicles, aiming to reduce size, weight, and cost, and to improve reliability, power quality, efficiency, and flexibility [
1]. Some modern industries, whose processes require high dynamic performance, have used various types of power converters for applications, such as variable speed drivers [
2], renewable energy systems [
3,
4], transportation systems [
5,
6], hybrid energy storage systems [
7,
8], and communication systems [
9].
In several of these applications, switching power converters are controlled by PWM techniques to transfer power from a source to loads that typically have constant power characteristics. Because of the switching, the converters have some inherent nonlinear behaviors, such as high switching frequency, increasing harmonics in the system, current and voltage distortion, and instabilities that can occur due to these effects [
10,
11]. Therefore, it is a challenging task to ensure stability, transient performance, and higher efficiency of such converters.
In order to reduce the weight reduction as well as to allow different regulated levels of DC voltage at the converter outputs, several studies [
12,
13,
14] have recently proposed new converter topologies by sharing a single inductive element. One of the prominent topologies is the family of non-isolated DC-DC converters, i.e., single inductor multiple output (SIMO) DC-DC converters [
15,
16]. SIMO converters offer a good compromise in terms of the cost, efficiency, and diversity of potential applications. However, to operate effectively, a SIMO converter requires a high-performance control strategy, which leads to a number of challenging engineering problems, such as cross-regulation, high switching frequency, and severe nonlinearities. The main control challenge arises from the need (to reduce weight and cost) to share a single inductive element in a circuit. In short, a SIMO converter behaves similarly to a multivariable system with highly coupled loops, resulting in high dependencies between the main variables: the output voltages, coil current, and DC voltage gains [
17].
Therefore, a complex automatic control system is required to maintain good performance regulation at different output voltage levels while minimizing the negative effects of the strong coupling between control loops. To this end, several studies have proposed solutions to mitigate coupling effects in DC-DC SIMO converters [
12,
15,
18,
19,
20,
21,
22,
23,
24].
In other cases, a cascade of power electronic converters is a common feature of almost all converter-domain power systems to help provide the necessary load point regulation. However, tightly regulated electronic switching power converters act as constant power loads (CPLs) and tend to destroy the stability of power systems and upstream converters [
25,
26]; therefore, CPL can affect the power quality of the power systems and cause its instability and may eventually lead to system failure [
27,
28].
Despite the many advantages of DC power systems, ensuring their robust stability and performance remains an important technical challenge. This is mainly due to the non-linearities introduced by the CPL operation of the switching power converters and the non-linear characteristics of the converter itself. The problem is further aggravated by the interaction of different subsystems [
29]. Therefore, the overall stability of the system cannot be guaranteed even if the individual subsystems are stable. It guarantees the analysis of the steady state and dynamic stability of the aggregated system under different loading curves.
Furthermore, most of the papers published so far have focused on mitigating the destabilizing effects of CPL without considering the uncertainty of the system parameters [
30]. Therefore, there is still a lack of studies in the literature reporting robust parametric approaches for DC-DC converters driving CPLs to mitigate oscillation effects caused by CPL. The main contributions of this work are briefly summarized as follows:
A decentralized robust control design methodology based on the LQR technique is described and applied to a multivariable dual-output DC-DC converter.
A decentralized robust control design method based on the decoupled PID technique is described and applied to a multivariable dual-output DC-DC converter.
The proposed methods are compared with one classical approach [
31] to decentralized control. To this end, extensive experimental tests demonstrate the effects of different controllers, showing that the proposed LQR technique has better performance indices than other methods when the system is subjected to parametric variations (input DC voltage and resistance loads) and when a CPL is connected in each output once a time. Performance indices (ISE and ISU) are calculated to analyze the performance of the control method.
For this purpose, a pilot plant (single inductor dual output DC-DC converter) was designed to implement the controllers and perform various tests to collect experimental data. The device allows the variation of physical parameters of the converter (input DC voltage and load resistances) and uses a programmable electronic load to emulate the behavior of the CPL.
The remainder of this article is organized as follows. Section II introduces the system description and problem formulation to solve the nonlinear analysis of the system; Section III briefly discusses the robust control methods proposed in this work. Section IV introduces the experimental environment that describes the experiments to be performed in this paper; Section V discusses the result. Finally, the main conclusions are presented in Section VI.
2. System Description and Problem Formulation
2.1. Mathematical Model for a SIMO Converter
To represent the dynamic behavior of a single inductor multiple-output DC-DC converter system, the small-signal approximation model is adopted as an effective mathematical model [
32].
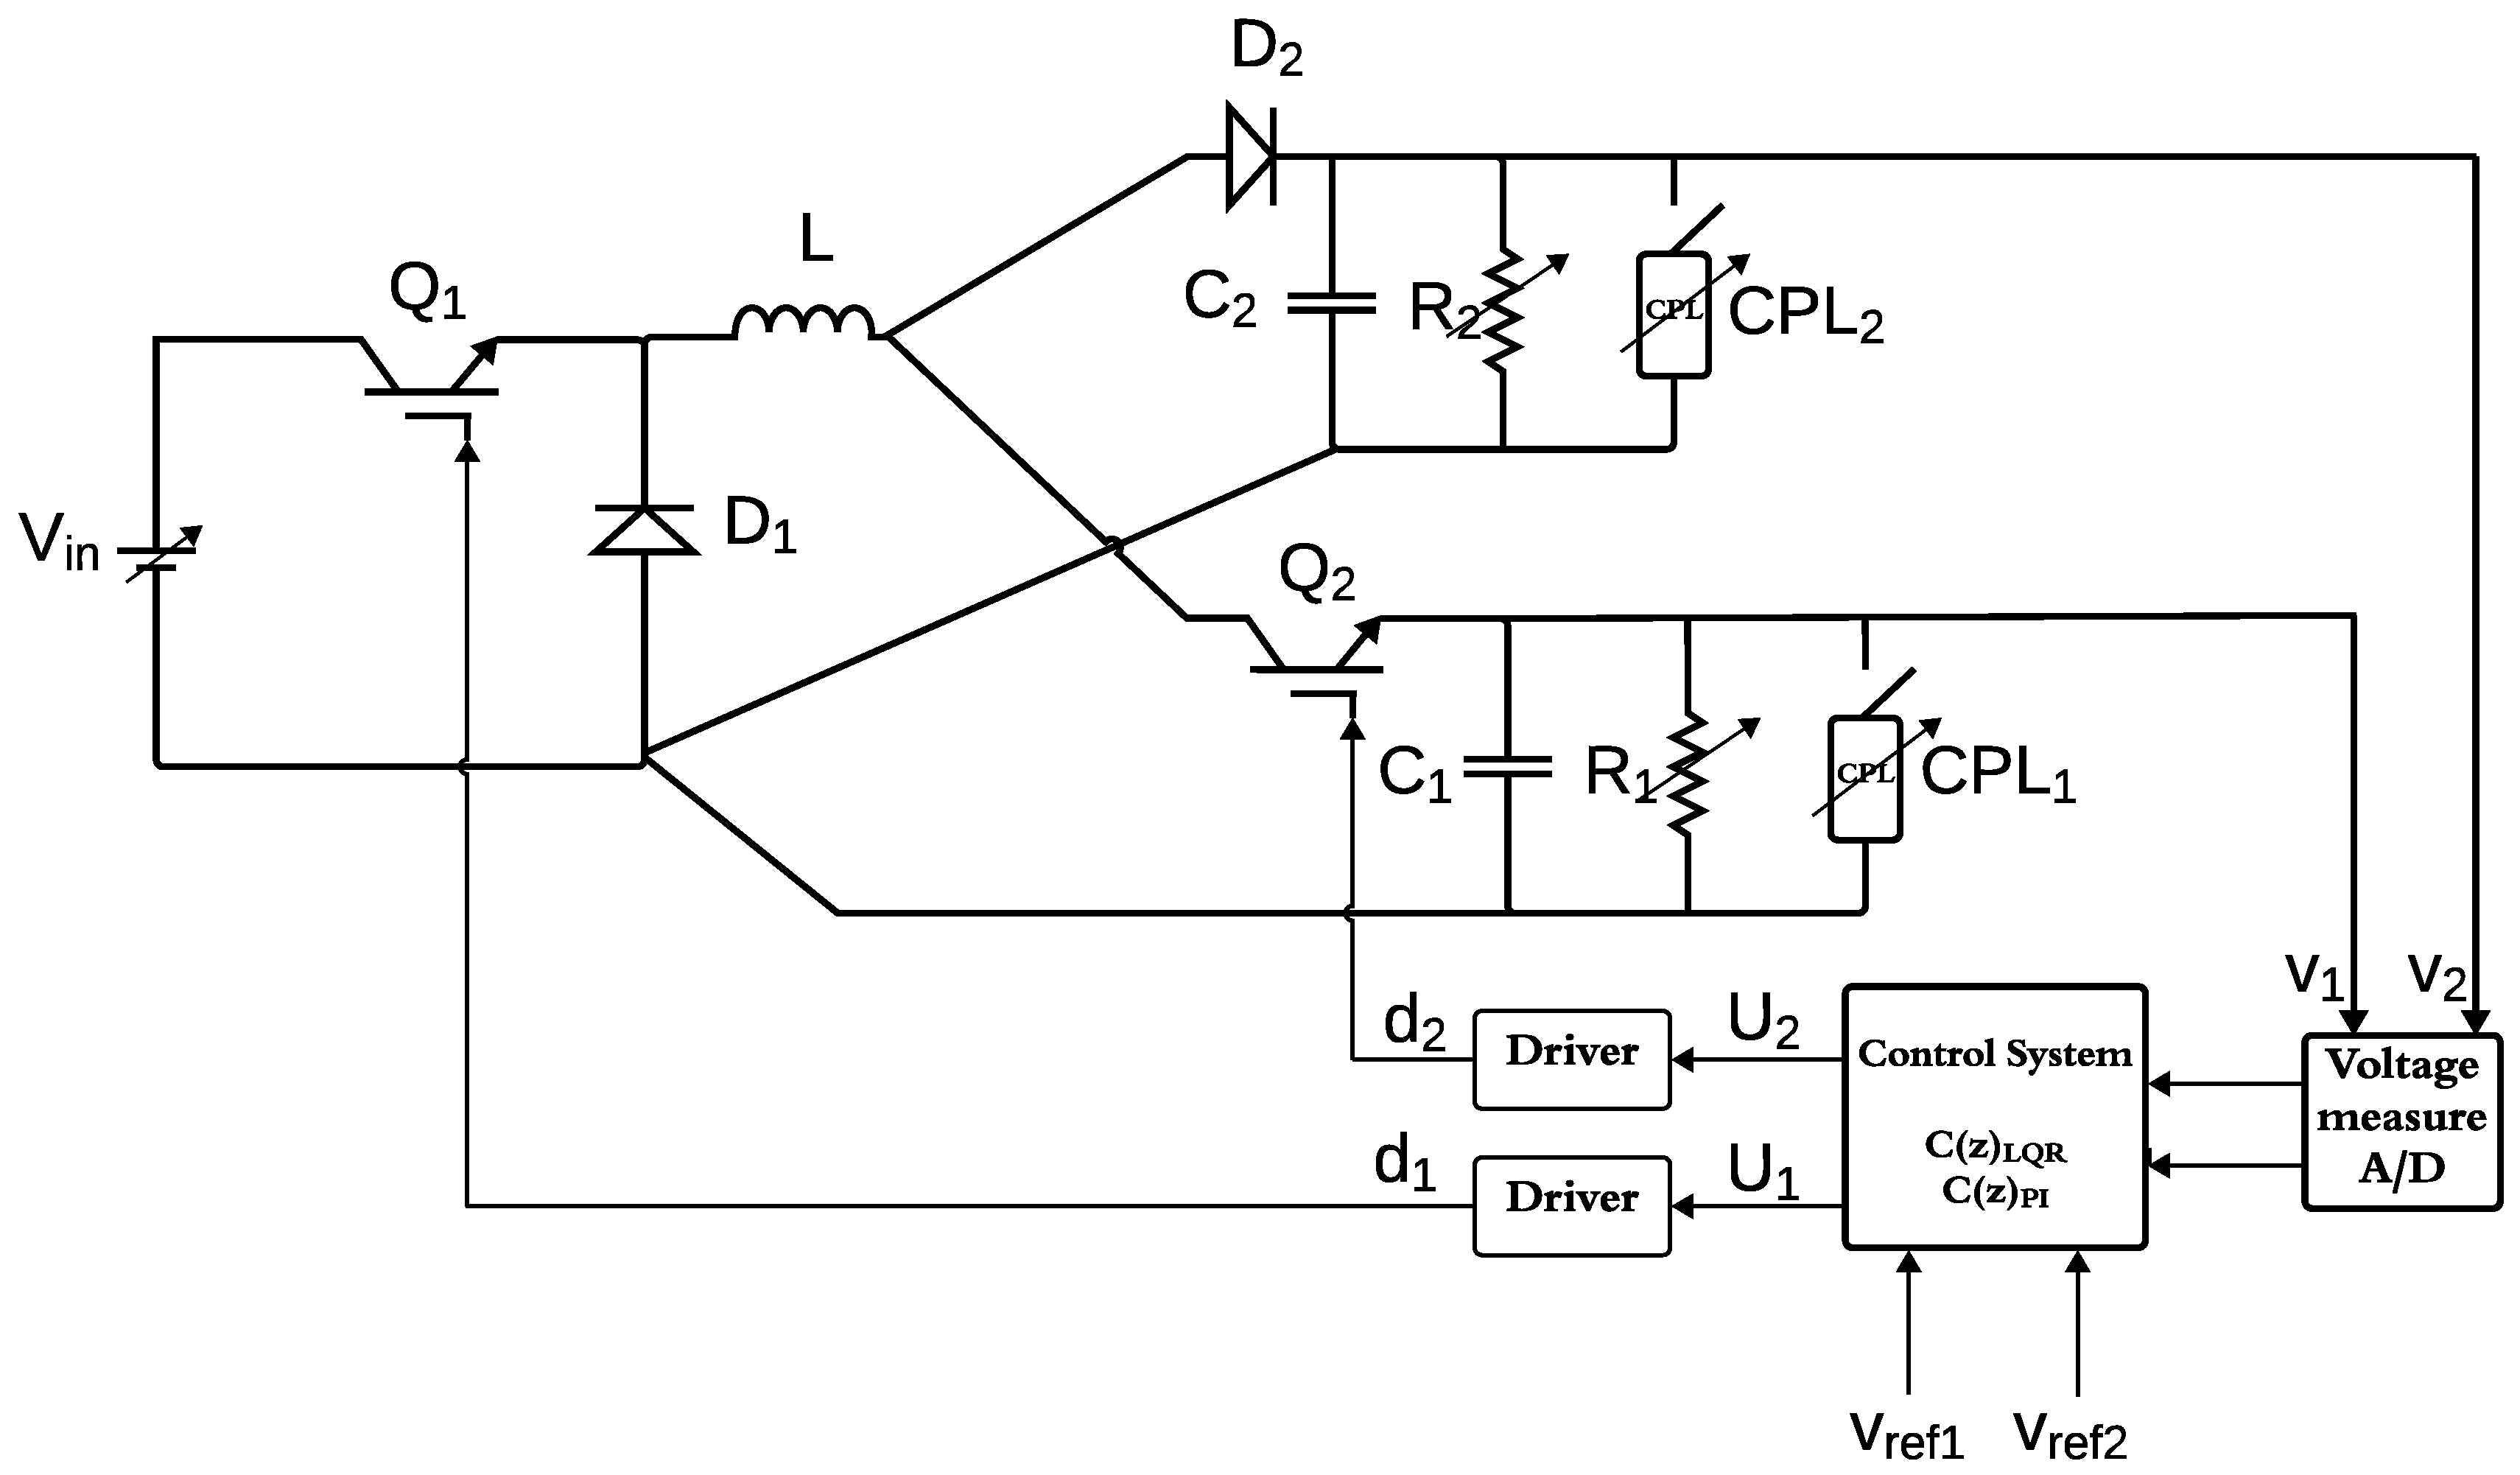
Figure 1 shows a SIMO DC-DC converter with two outputs V
1 and V
2 and the topology used for the control system. The main feature of this converter is that the single inductor current I
L is split into two currents I
1 and I
2 at converter outputs 1 and 2 respectively. The uncertainties of the system are represented by arrows, i.e., loads and input voltage changes. These uncertainties often occur in real converters and affect performance. Therefore, control strategies must address this issue.
SIMO converters can be divided into three categories depending on the relationship between the duty cycle inputs d
1 and d
2, which control the MOSFET switches Q1 and Q2 (see
Figure 1). In this study, a DC-DC SIMO converter operating according to Class-C (i. e. d
1 < d
2) is used [
32]. In this case, the nonlinear average model of the converter is a third-order system given by the set of equations (1), whose state variables are the inductor current i
L and the voltages of the capacitors V
1 and V
2, and whose control inputs are the duty cycle of switches Q
1 and Q
2.
where V
in is the input unregulated voltage source value.
In the SIMO converter of
Figure 1, the steady-state value
of the duty cycle d
1 (switch Q
1) regulates the total input power and thus the coil current of the SIMO converter, while the steady-state value of the duty cycle d
2 (of switch Q
2),
, determines how the coil current is divided between the converter output loads R
1 and R
2. Assuming that the electronic switches and diodes are ideal, the components of the open-loop control-to-output 2x2 transfer function matrix at the operational point,
and
of the linearized model of the SIMO converter are given by the following formulas
where:
For the study presented in this paper, the nominal values and assumed variation ranges for the SIMO converter circuit components are given in
Table 1.
3. Proposals of Robust Controller Strategies for the SIMO Power Converter
3.1. Pairing Analysis for the SIMO Converter
The first step in the control design process is to perform a pairwise analysis to determine which output is most affected by a given plant input. There are several ways to do pairwise analysis in this topic. Nevertheless, the effective relative gain array (ERGA) is easy to implement and understand, and is more efficient than others arrays founded in the literature, e.g., relative gain array (RGA) or dynamic relative gain array (DRGA) [
17].
The ERGA method is commonly used to determine the sensitivity of each output to each input. This procedure is provided by [
33,
34]. The main steps of the ERGA-based pairwise analysis are as follows.
1) Determine DC gain array using the DC gain for each element of the transfer function matrix.
2) Obtain the cutoff frequency for each element of the transfer function matrix.
3) Compute the energy transmission ratio array based on the DC gain and cutoff frequencies.
4) Compute the effective gains matrix that indicates the sensitivity between each I/O pair.
5) Compute the ERGA number and check for diagonal head dominance.
The effective gain matrix shown in (9) as a result of the ERGA pair analysis shows the optimal pairing, i.e., the first (V
1) and the second output (V
2) are respectively more sensitive to the first (d
1) and the second input (d
2).
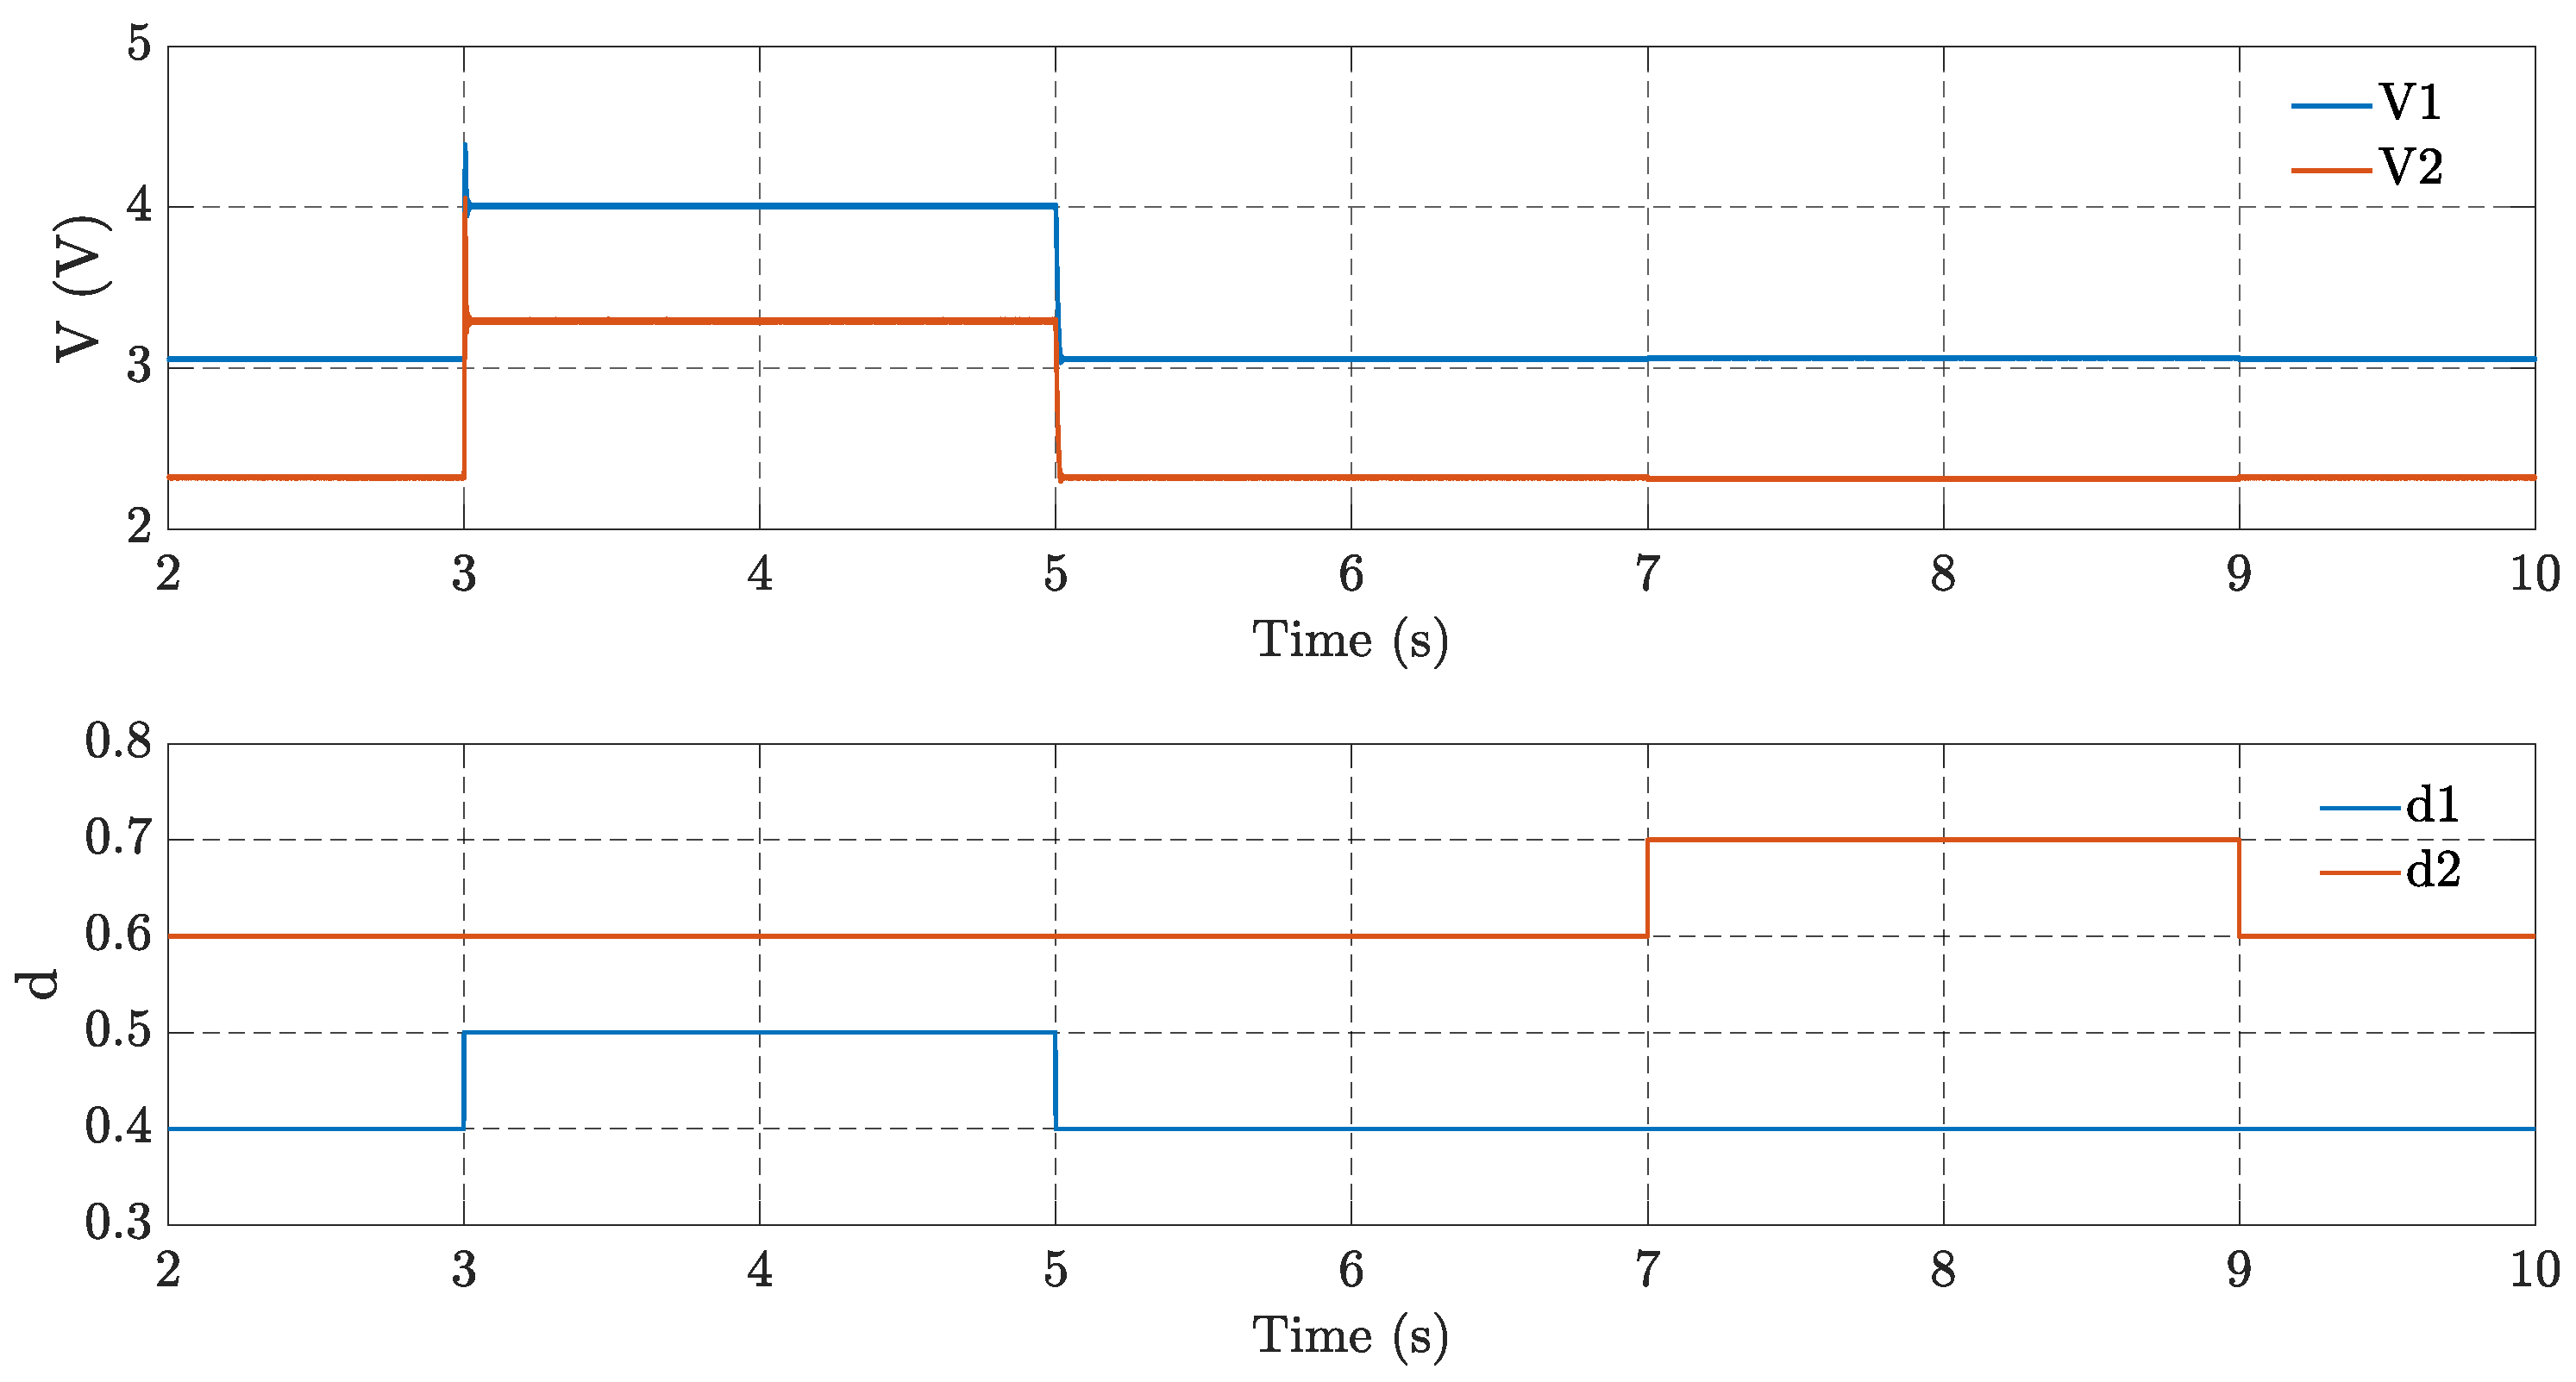
Therefore, a simulation evaluation is performed to check the coupling between the system outputs. So first a pulse is applied to the duty cycle of switch Q1 and the system is run in open loop (without any controller) mode and then the same process is repeated for the switch Q2.
Figure 2 shows the resulting coupling for the SIMO converter test system. The results show that V
2 is very sensitive to changes in duty cycle d
2, while V
1 is very sensitive to changes in duty cycle d
1. However, V
1 and V
2 are greatly affected by changes in d
1, although changes in d
2 don’t have much relevant in the outputs of the system. This finding reflects the coupling between the loops of the system, which shows the efficient pairing of the ERGA analysis.
3.2. Linear Quadratic Regulator Design
The LQR control is a well-known optimal-based approach to state feedback controller that can solve some problems in systems like instability or low stability margins, manipulating the system inputs and avoiding some typical problems on the stabilization problem like saturation control signal and fast actuator degradation [
35]. This controller design is based on the choice of weight matrices of the states and control signal, Q and R respectively, which is used in the minimizing cost function.
The minimization of the cost function results in a feedback control law.
Positive-definite matrix “S” is a solution of the discrete-time algebraic Ricatti equation.
In this structure the LQR control on closed loop has not guaranteed perturbation reject in low frequency, however, this problem can be solved by an integrator addition on system input, creating a different model called “velocity model” [
35]. The discrete integrator
is inserted on the system plant, by this way creating a new state variable ∆x(k).
Calling a new state vector
and applying in the incremental model, the velocity model is presented.
Inserting the augmented space state in the Ricatti transforms the feedback control law structure on a rejection perturbation problem.
Then the control law of the digital LQR for stabilization and perturbation reject problem is presented.
The Q and R weight matrices correct selection is important because it is responsible for the penalization of the dynamic states and input signal, respectively, in a way that Q and R inform the priority minimization order in the cost function, giving a trade-off balance between conflicting control objectives, such as minimizing control effort and regulation [
36,
37]. In this work, this selection is based on the loop-shaping of process singular values for improving robustness in high and low frequencies where stability Phase Margin, PM, and Gain Margin, GM, are used in the robustness design and bandwidth frequency is used in the converter velocity. This method is an interesting solution to controller’s synthesis for Multiple Input Multiple Output process because of the difficulty in the frequency analysis in each loop [
38]. For analysis of minimal stability margins (Phase Margin and Gain Margin) in the frequency singular values, the following constraints formulation, proposed in [
39], is used:
where
and
, with
meaning the maximum singular value of a given transfer function matrix.
For LQR design purposes, assuming that the SIMO converter operates, in steady state, around operation point:
0.485 A and
= 7 V. Then the corresponding matrices A, B, C and D of the linearized state-space model are:
By using the A, B, C and D matrices values given by (20), the corresponding open-loop transfer function matrix
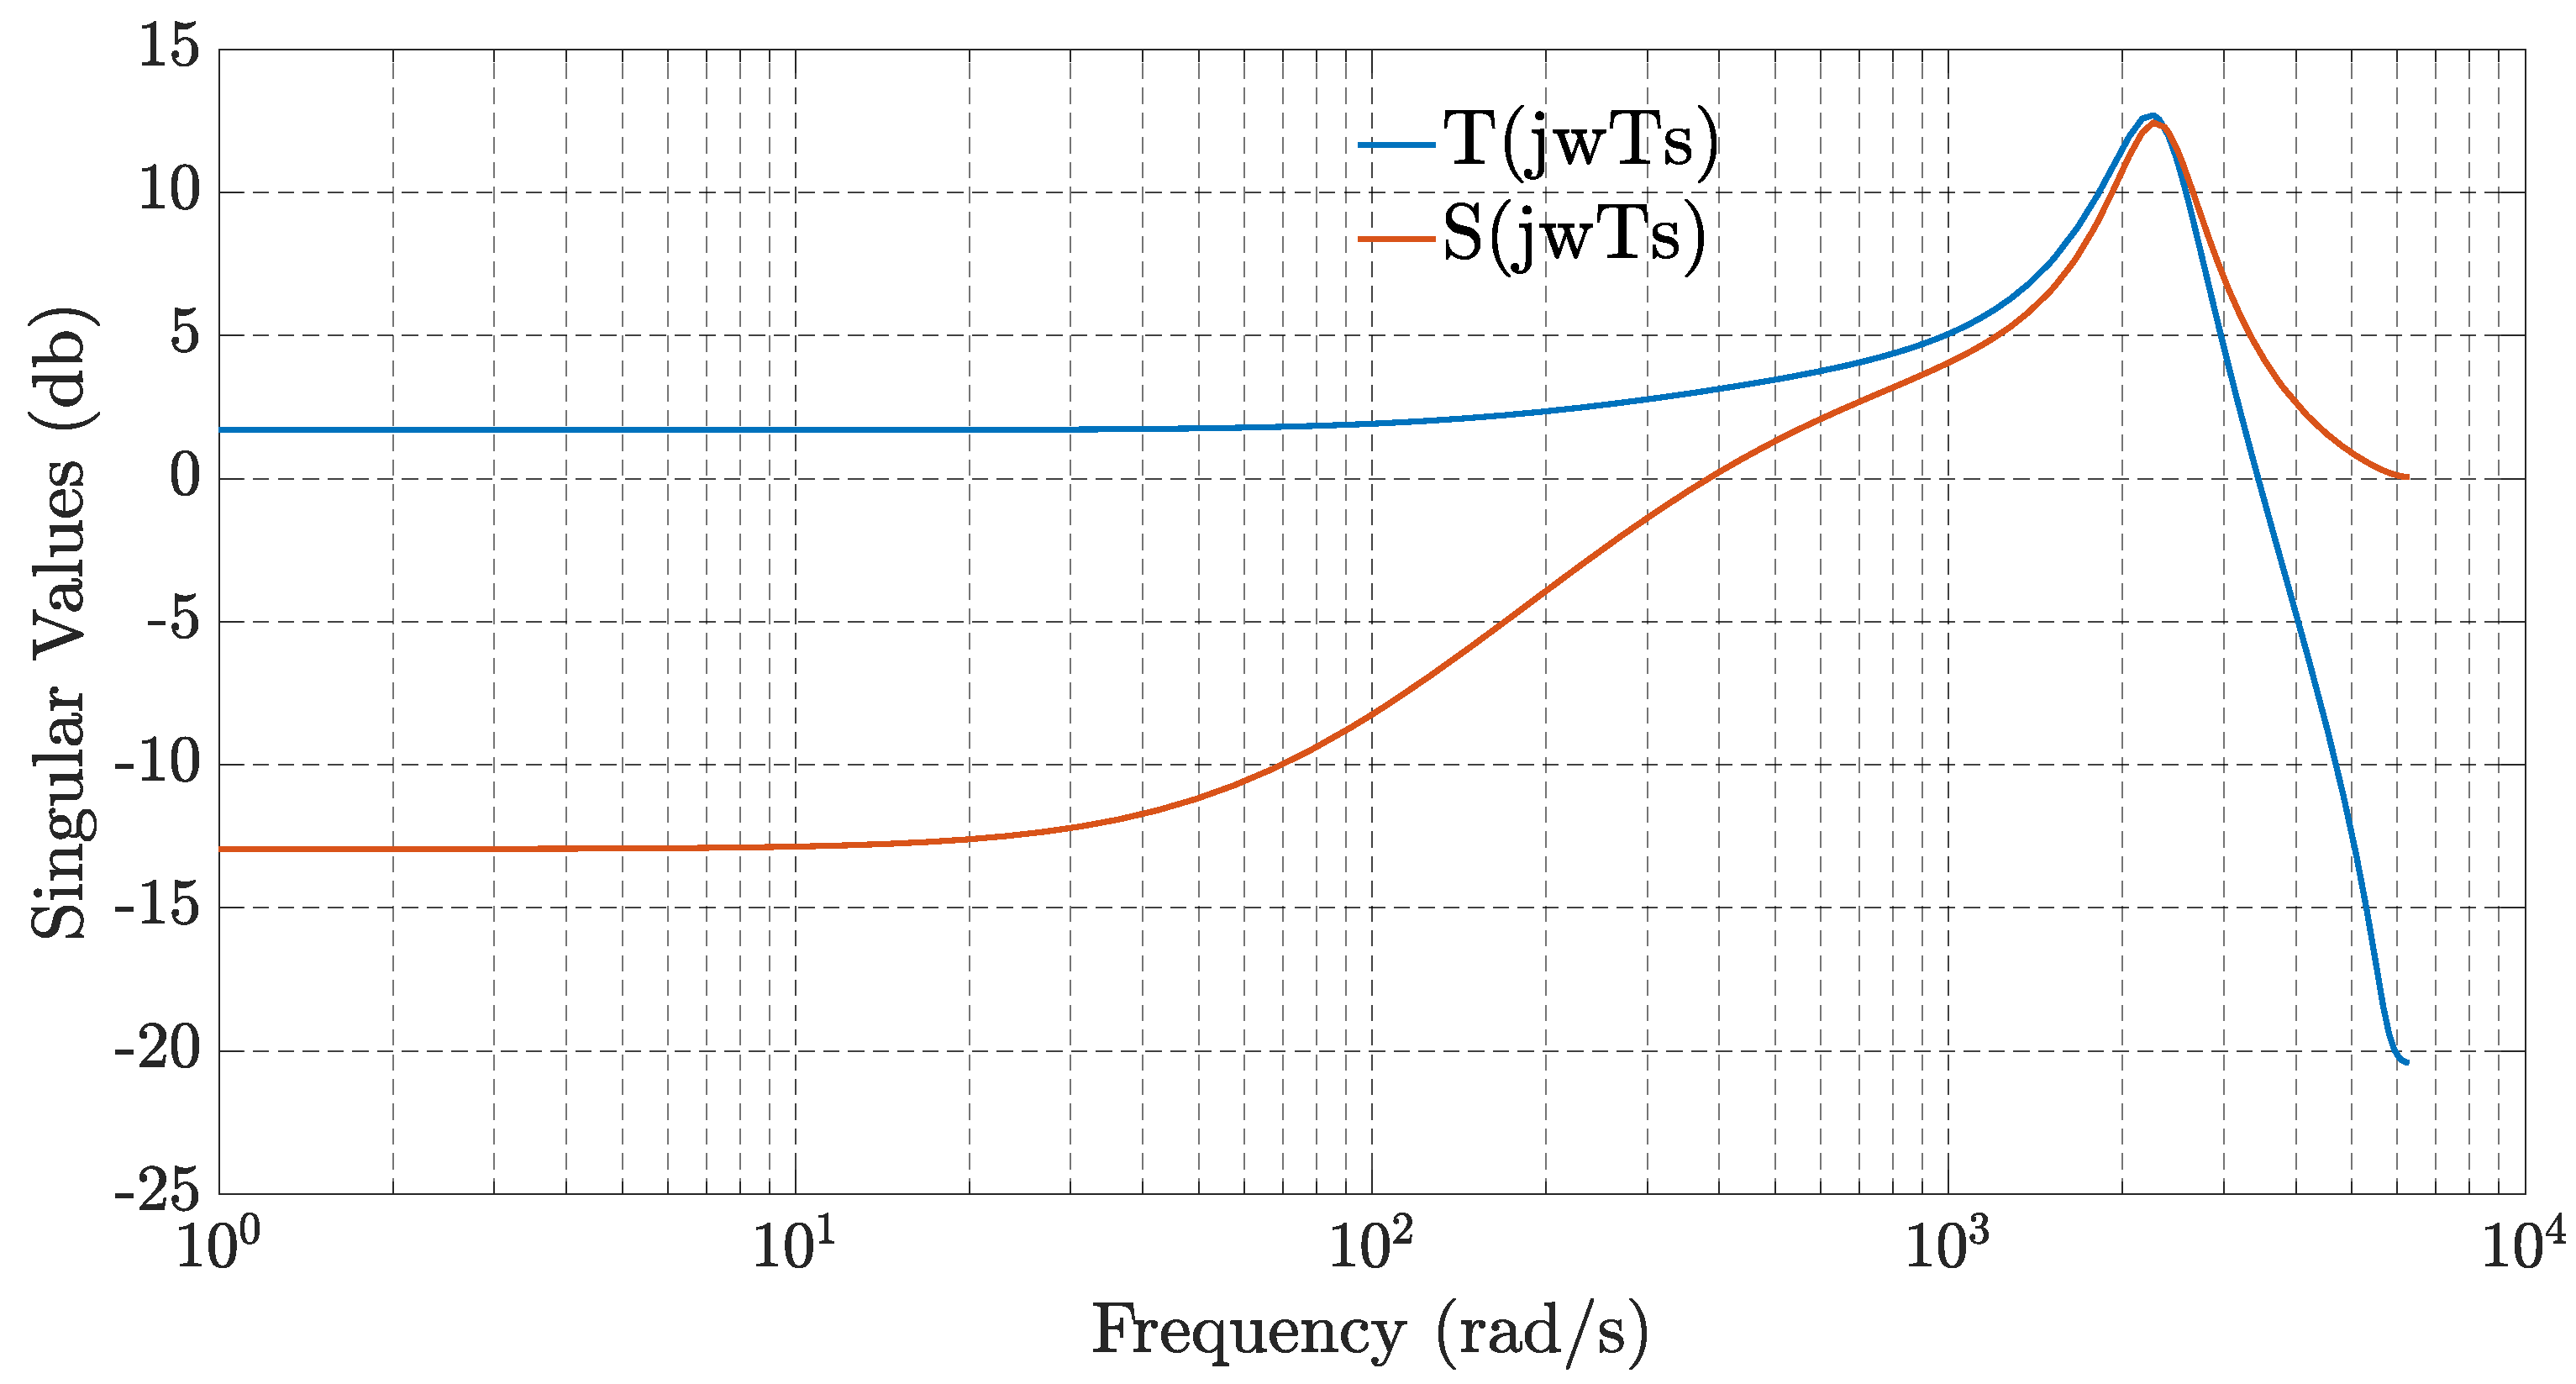
has been computed. For discrete system model with sample time (ts=0.5 ms) the resulting maximum singular values for the sensitivity and complementary matrices transfer functions, S(z
-1) and T(z
-1), for the uncompensated closed-loop system (i. e., with an initial controller matrix K
0=I
2x2) are presented in
Figure 3.
As can be seen, the maximum singular values for the sensitivity and complementary sensitivity transfer function matrices show very large peaks in high frequency, meaning that the uncompensated converter plant is very sensitive to high frequency noise and could become unstable due low attenuation property in high frequency band. Other problem, in this uncompensated plant, is its low capacity in tracking reference setpoint, due the reduced gain presented by T(s) at the low-frequency band. For this uncompensated system, the computed margins index shows low stability margins and , which confirms the singular values analysis.
For this case, low stability margins could be a problem, because uncertainty in circuit parameters (e.g., capacitors, inductors, and resistors) and in the input voltage are very common. Other problems are associated to noisy measurement (high frequency) and perturbations in low frequency. Aiming at improving the stability margins, the initial specified design requirements were:
,
and
, where
is the angular frequency such that the modulus of T(s=jω) is -3dB. By using the augmented state-space matrices given by (15), along with choosing weighting states and control matrices,
and
, in LQR cost function (10), the computed value for the control vector gain was:
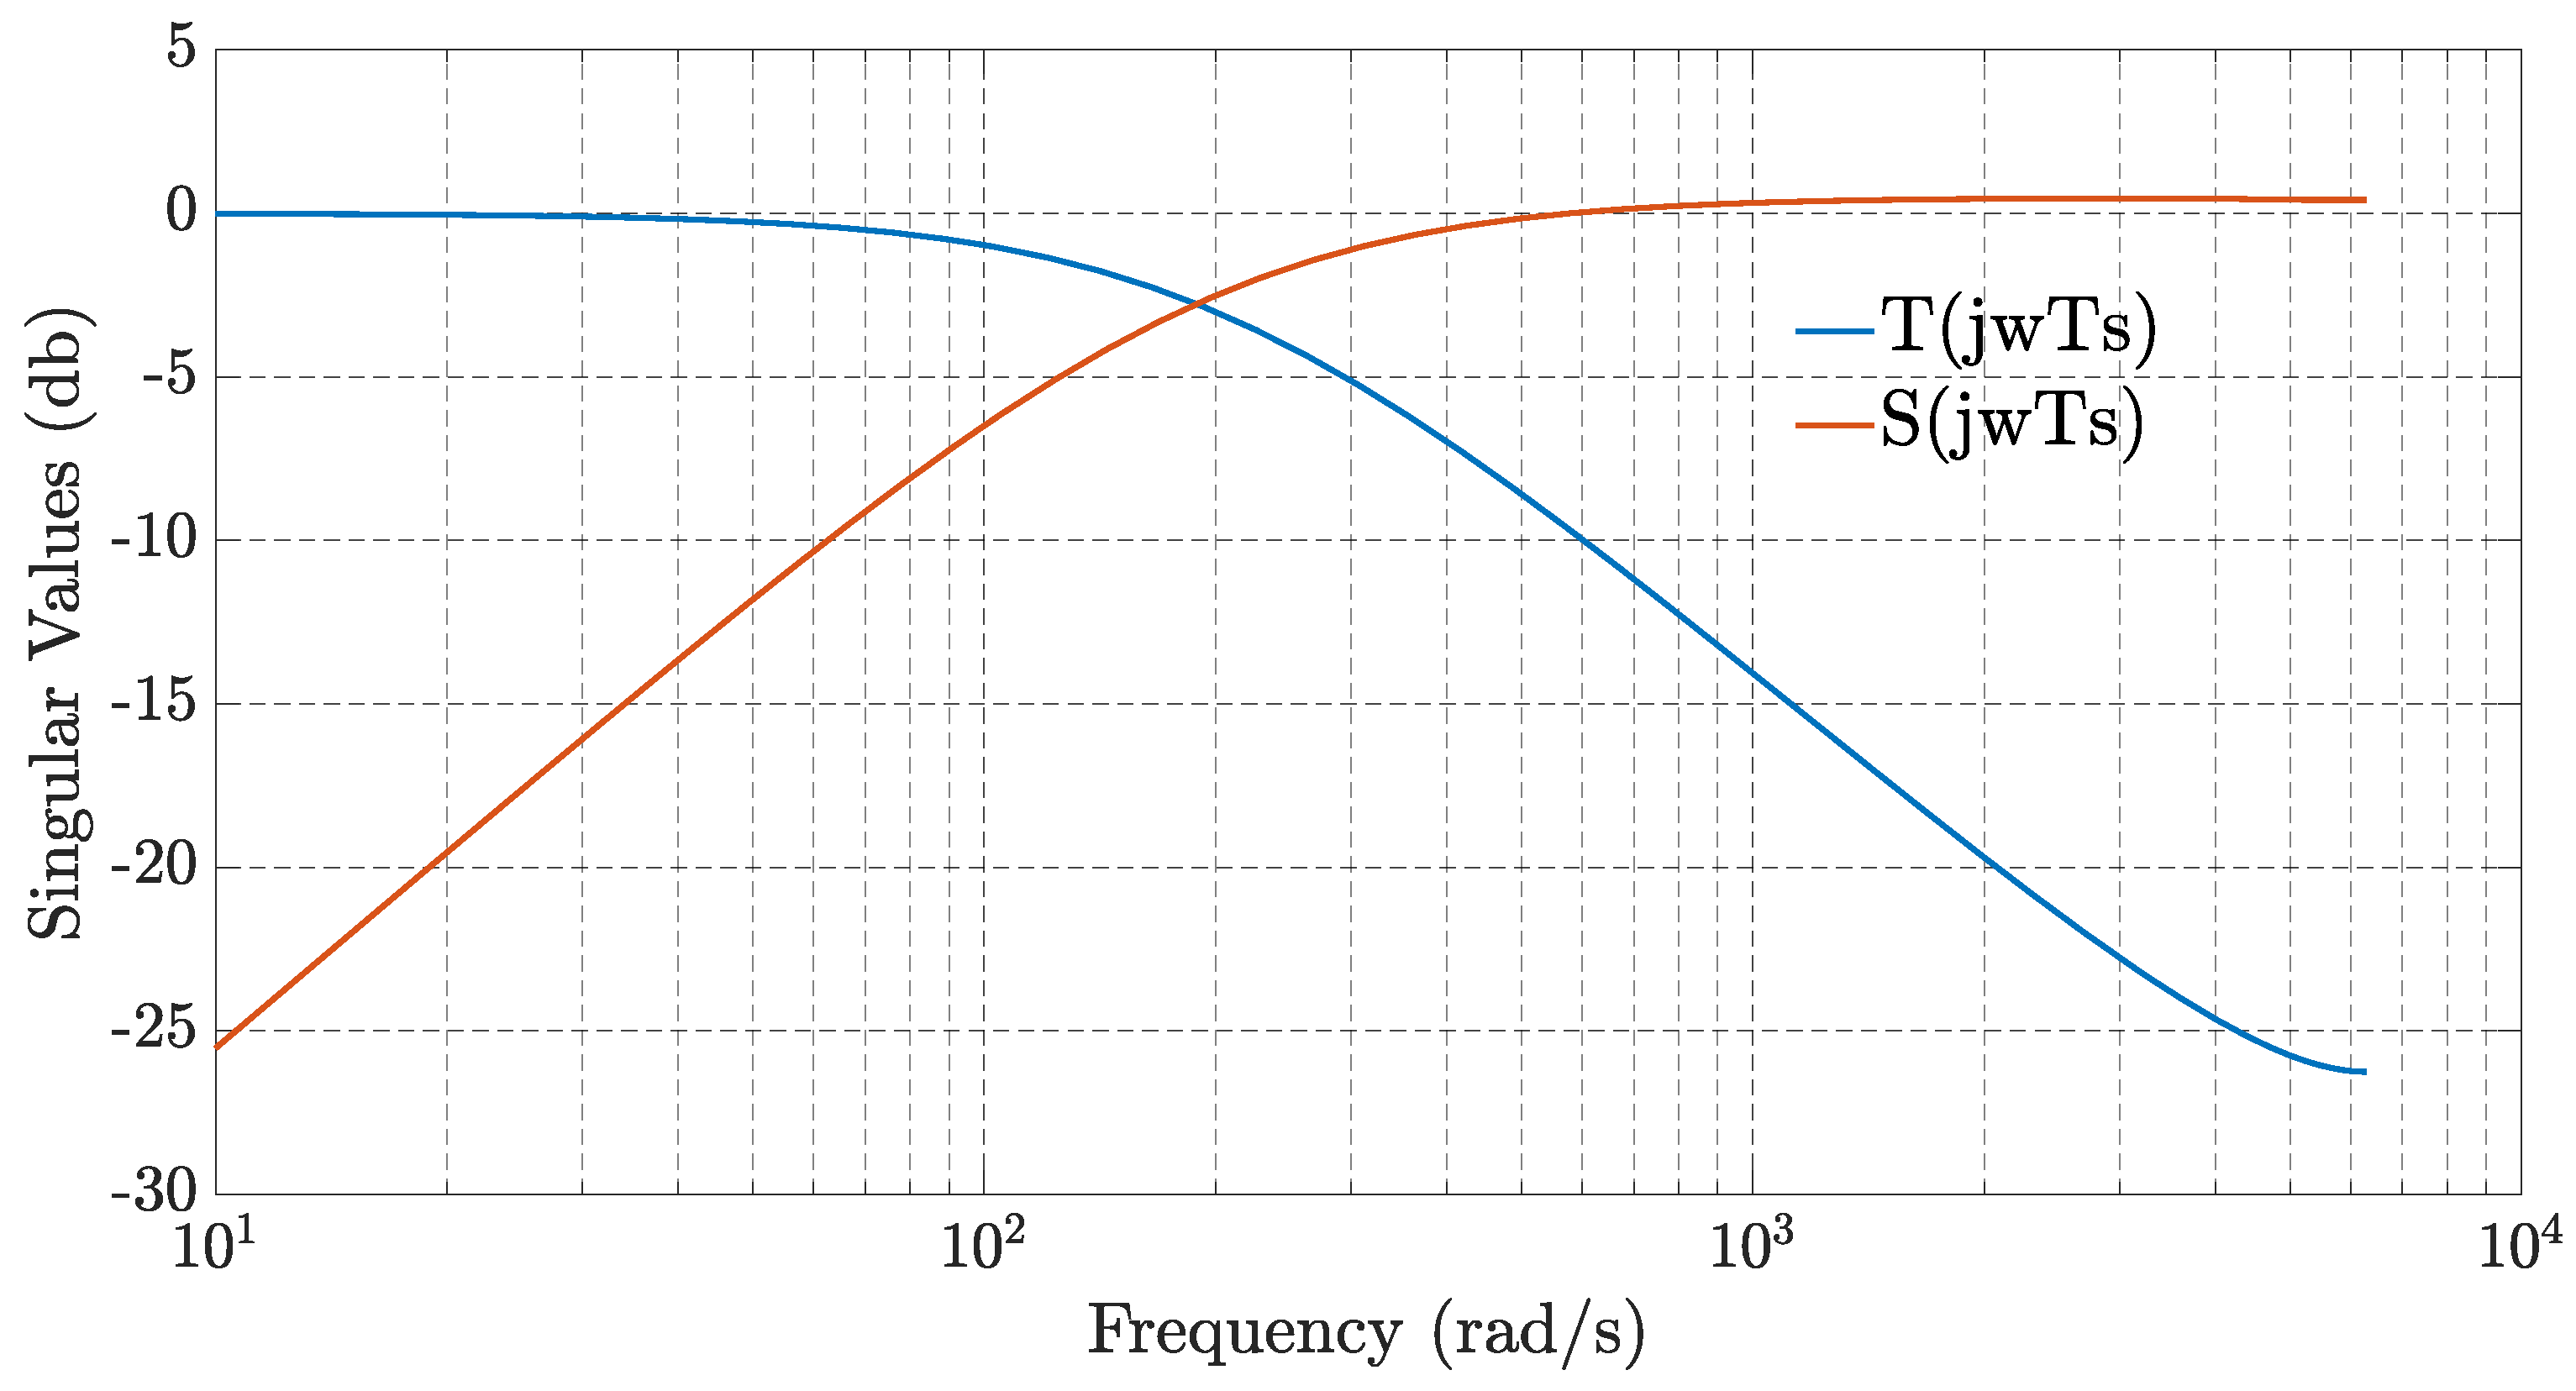
The resulting maximum singular values for the sensitivity and complementary matrices transfer functions S(z
-1) and T(z
-1), for the compensated closed-loop system, are presented in
Figure 4.
As can be seen, in
Figure 4, the computed controller is able to decrease the sensibility peaks which improve the process robustness. Furthermore, the perturbation rejection is also improved due to decreasing sensibility gain values in low frequency band. For this compensated system, the computed minimal stability margins and bandwidth frequency of the system are
,
and
, which satisfy the design specifications.
3.3. Decoupled Multiloop PI Controller
The presentation is limited to two-input, two-output systems. Our approach was to explore standard PI multivariable (multi-loop) tuning [
40] and observe what can be achieved by adding simple interactions between the feedback loops. The proposed scheme is based on a simple decoupling, which means that it can be easily implemented at the loop level [
41]. The advantage is that it improves performance in frequency ranges that modeling predictive control typically cannot handle.
The designable controller is a static decoupler combined with a decentralized PI controller with setpoint weighting. The control law can be written as:
where U is the control signal, Y the process output, and Y
r the reference. The decoupler:
is a constant matrix. The PI controller
is different from
to allow for setpoint weighting [
42]. The controllers are of the form:
The static decoupler is given by:
where G(0) is non-singular. The transfer function of the decoupled system is given by:
A Taylor series expansion of the transfer function Q(s), for a small s, gives:
for some constants k
12 e k
21. Then it´s possible to introduce the interaction indices:
where M
s1 and M
s2 are the maximum sensitivities of each loop. The indices k
1 and k
2 describe the interaction between the loops. The indices are the result of two terms: one is system dependent and the other is directly the integral gain of the PI controller. Therefore, the interaction can be reduced by decreasing the controller gains [
36]. To find the decentralized PI controllers, we need to consider the diagonal terms of Q(s). Hence, standard methods can be used to design the PI controllers for each transfer function q
kk(s).
By considering the same operating point used for the design of the LQR controller (
0.485 A and
= 7 V) the following values were computed for the transfer functions
:
Thus, it’s possible to determine the matrix static decoupler D by using (27), the computed value obtained of D was:
The transfer function of the decoupled system can be obtained considering the equations (28) to (31), hence, to design the decentralized PI controllers we have to consider the diagonal terms of Q(s):
Therefore, for each transfer function
and
, the root-locus design method for the PI controllers is used with the chosen requirements: settling time less than 0.5 s and damping factor greater than 0.2 (these nominal specifications give reasonable performance for DC-DC power converters [
42]), the corresponding parameters were obtained:
Thus, the corresponding transfer functions of the controllers PI
1 and PI
2 have the structures of the equations (25) and (26). Thus, the corresponding state-space representation is:
Thereby, the control law equation can be represented like
4. Experimental Methodology and Tests
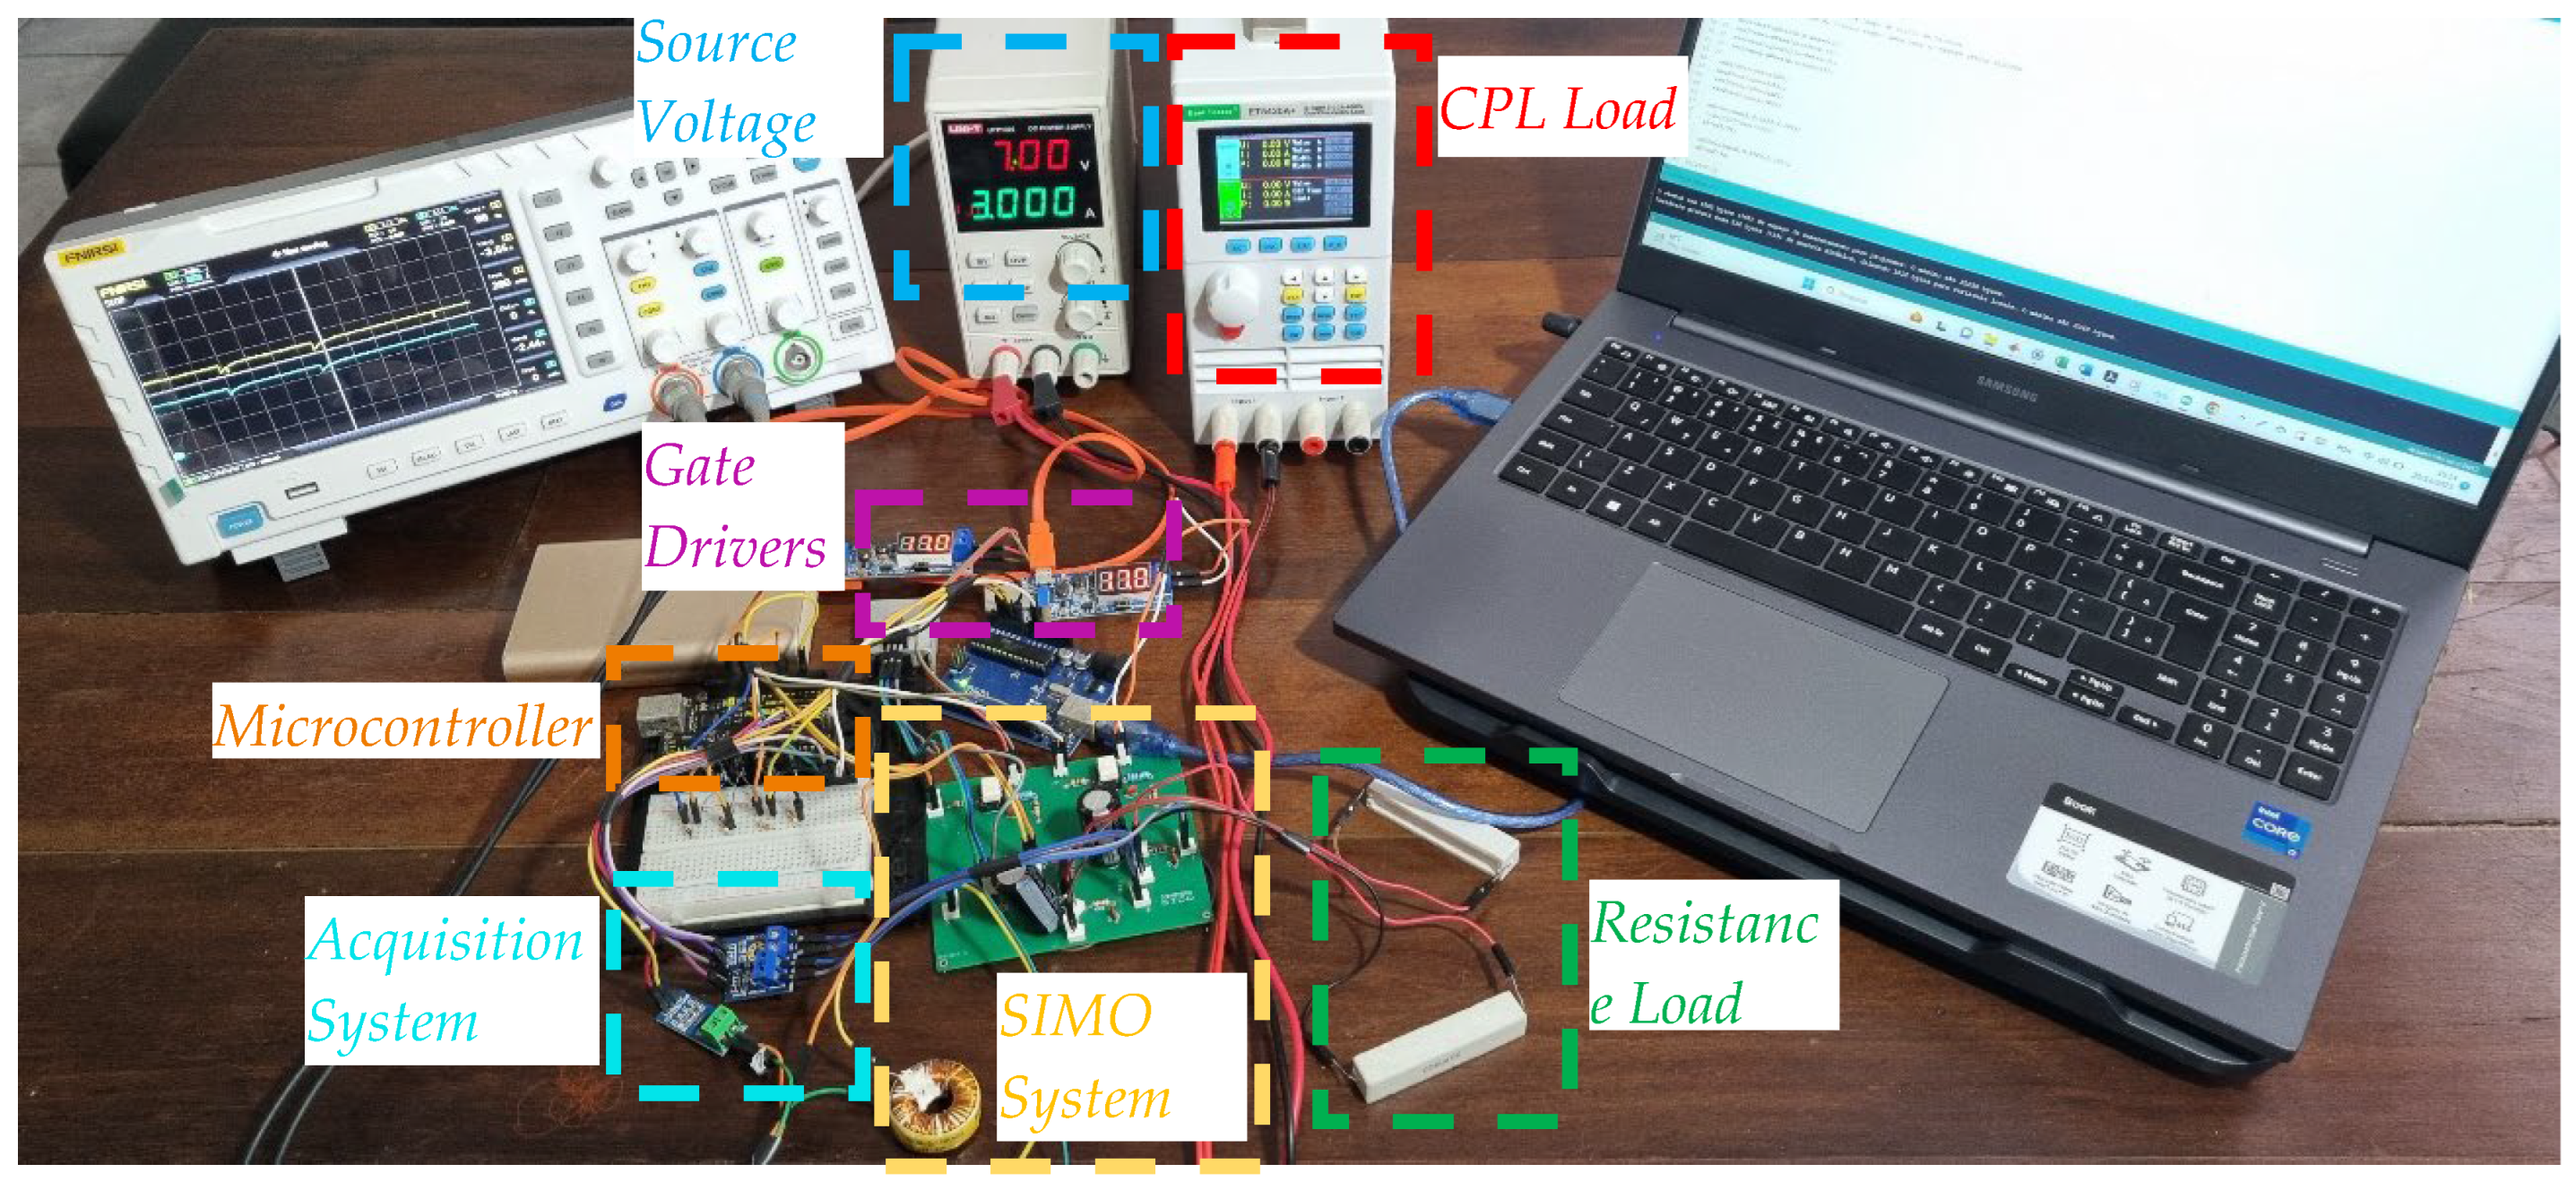
4.1. Description of the SIMO Converter System Test Board
To allow the experimental performance and robustness evaluation of the proposed control methods, namely LQR and Decoupled PI (see
Figure 1), a single-inductor dual-output DC-DC Buck converter board test system was developed. This test board (together with the measuring equipment) is shown in
Figure 5. This test system was designed according to the specifications in
Table 1. It allows two different levels of regulated DC voltage and allows for variations in the input voltage and loads converter outputs. A microcomputer system that communicates via USB is used to set the desired set point and to monitor and acquire converter relevant signals (i.e., voltages, inductor current and control efforts). Note that the special design of the power converter allows the circuit parameter values to be easily changed to emulate parametric uncertainties as well as changing operating conditions.
The SIMO test system (
Figure 5) implements the control laws, LQR and Decoupled PI, by using vector and matrices structures in a 32-bit ARM core microcontroller AT91SAM3X8E, with the programming done by a C compiler.
In addition, two other subsystems have been developed for the use of parametric variations. The first allows performing variations on the input voltage value, while the second allows to change the load conditions of the converter using parallel addition (or deleted) resistances to the converter output, or by adding a CPL with variations in its power consumption. In addition, the microcomputer system uses an application that allows real-time visualization of data and recording of data for posterior analysis.
4.2. Description of Experiments
Tree experiments are performed to evaluate the performance and robustness of the real closed-loop SIMO converter system. The first experiment is designed to evaluate the controller performance for variations on the value of converter input voltage, V
in. With the system operating in steady state at the operating point provided in
Table 1, a step variation was applied in Vin, from 7V to 6 V.
Remark 1. Note that it is not advisable to reduce the input voltage of the SIMO converter to a greater extent as it will reduce the inductor current, which would then change the operational conduction mode of the converter from the continuous to discontinuous conduction mode.
The second experiment evaluates the performance of the controller for a single variation of the load resistance R1 and R2 after the steady state is achieved at the nominal operation point, from R = 10 Ω to R = 5 Ω in each case.
Remark 2. Note that the rig system’s physical limits are limited by the maximum operation of the voltage source power, while the minimum operation is limited by the current level that maintains the operational conduction mode of the SIMO converter.
The third experiment evaluates the closed-loop performance when the CPLs undergoes negative power variations in parallel with R1 and R2. When the SIMO converter system reaches its stable state, CPL1 is connected in parallel with R1 and after a few seconds a negative power change is given to CPL1 (CPL2 is not yet connected). The same procedure is adopted for the output voltage at R2. The exact values of the CPLs variations are described in
Section 5.3.
The aim of these experiments is to show that the proposed controllers can compensate for the perturbations when the input voltage and load change, thereby maintaining the desired performance in the uncertainty region and at different operation points without increasing the measurement noise. The integral square error (ISE) and the integral square control (ISU) indices are used to evaluate the performance of the control strategies.
5. Experimental Results and Discussion
5.1. Input Voltage Variation
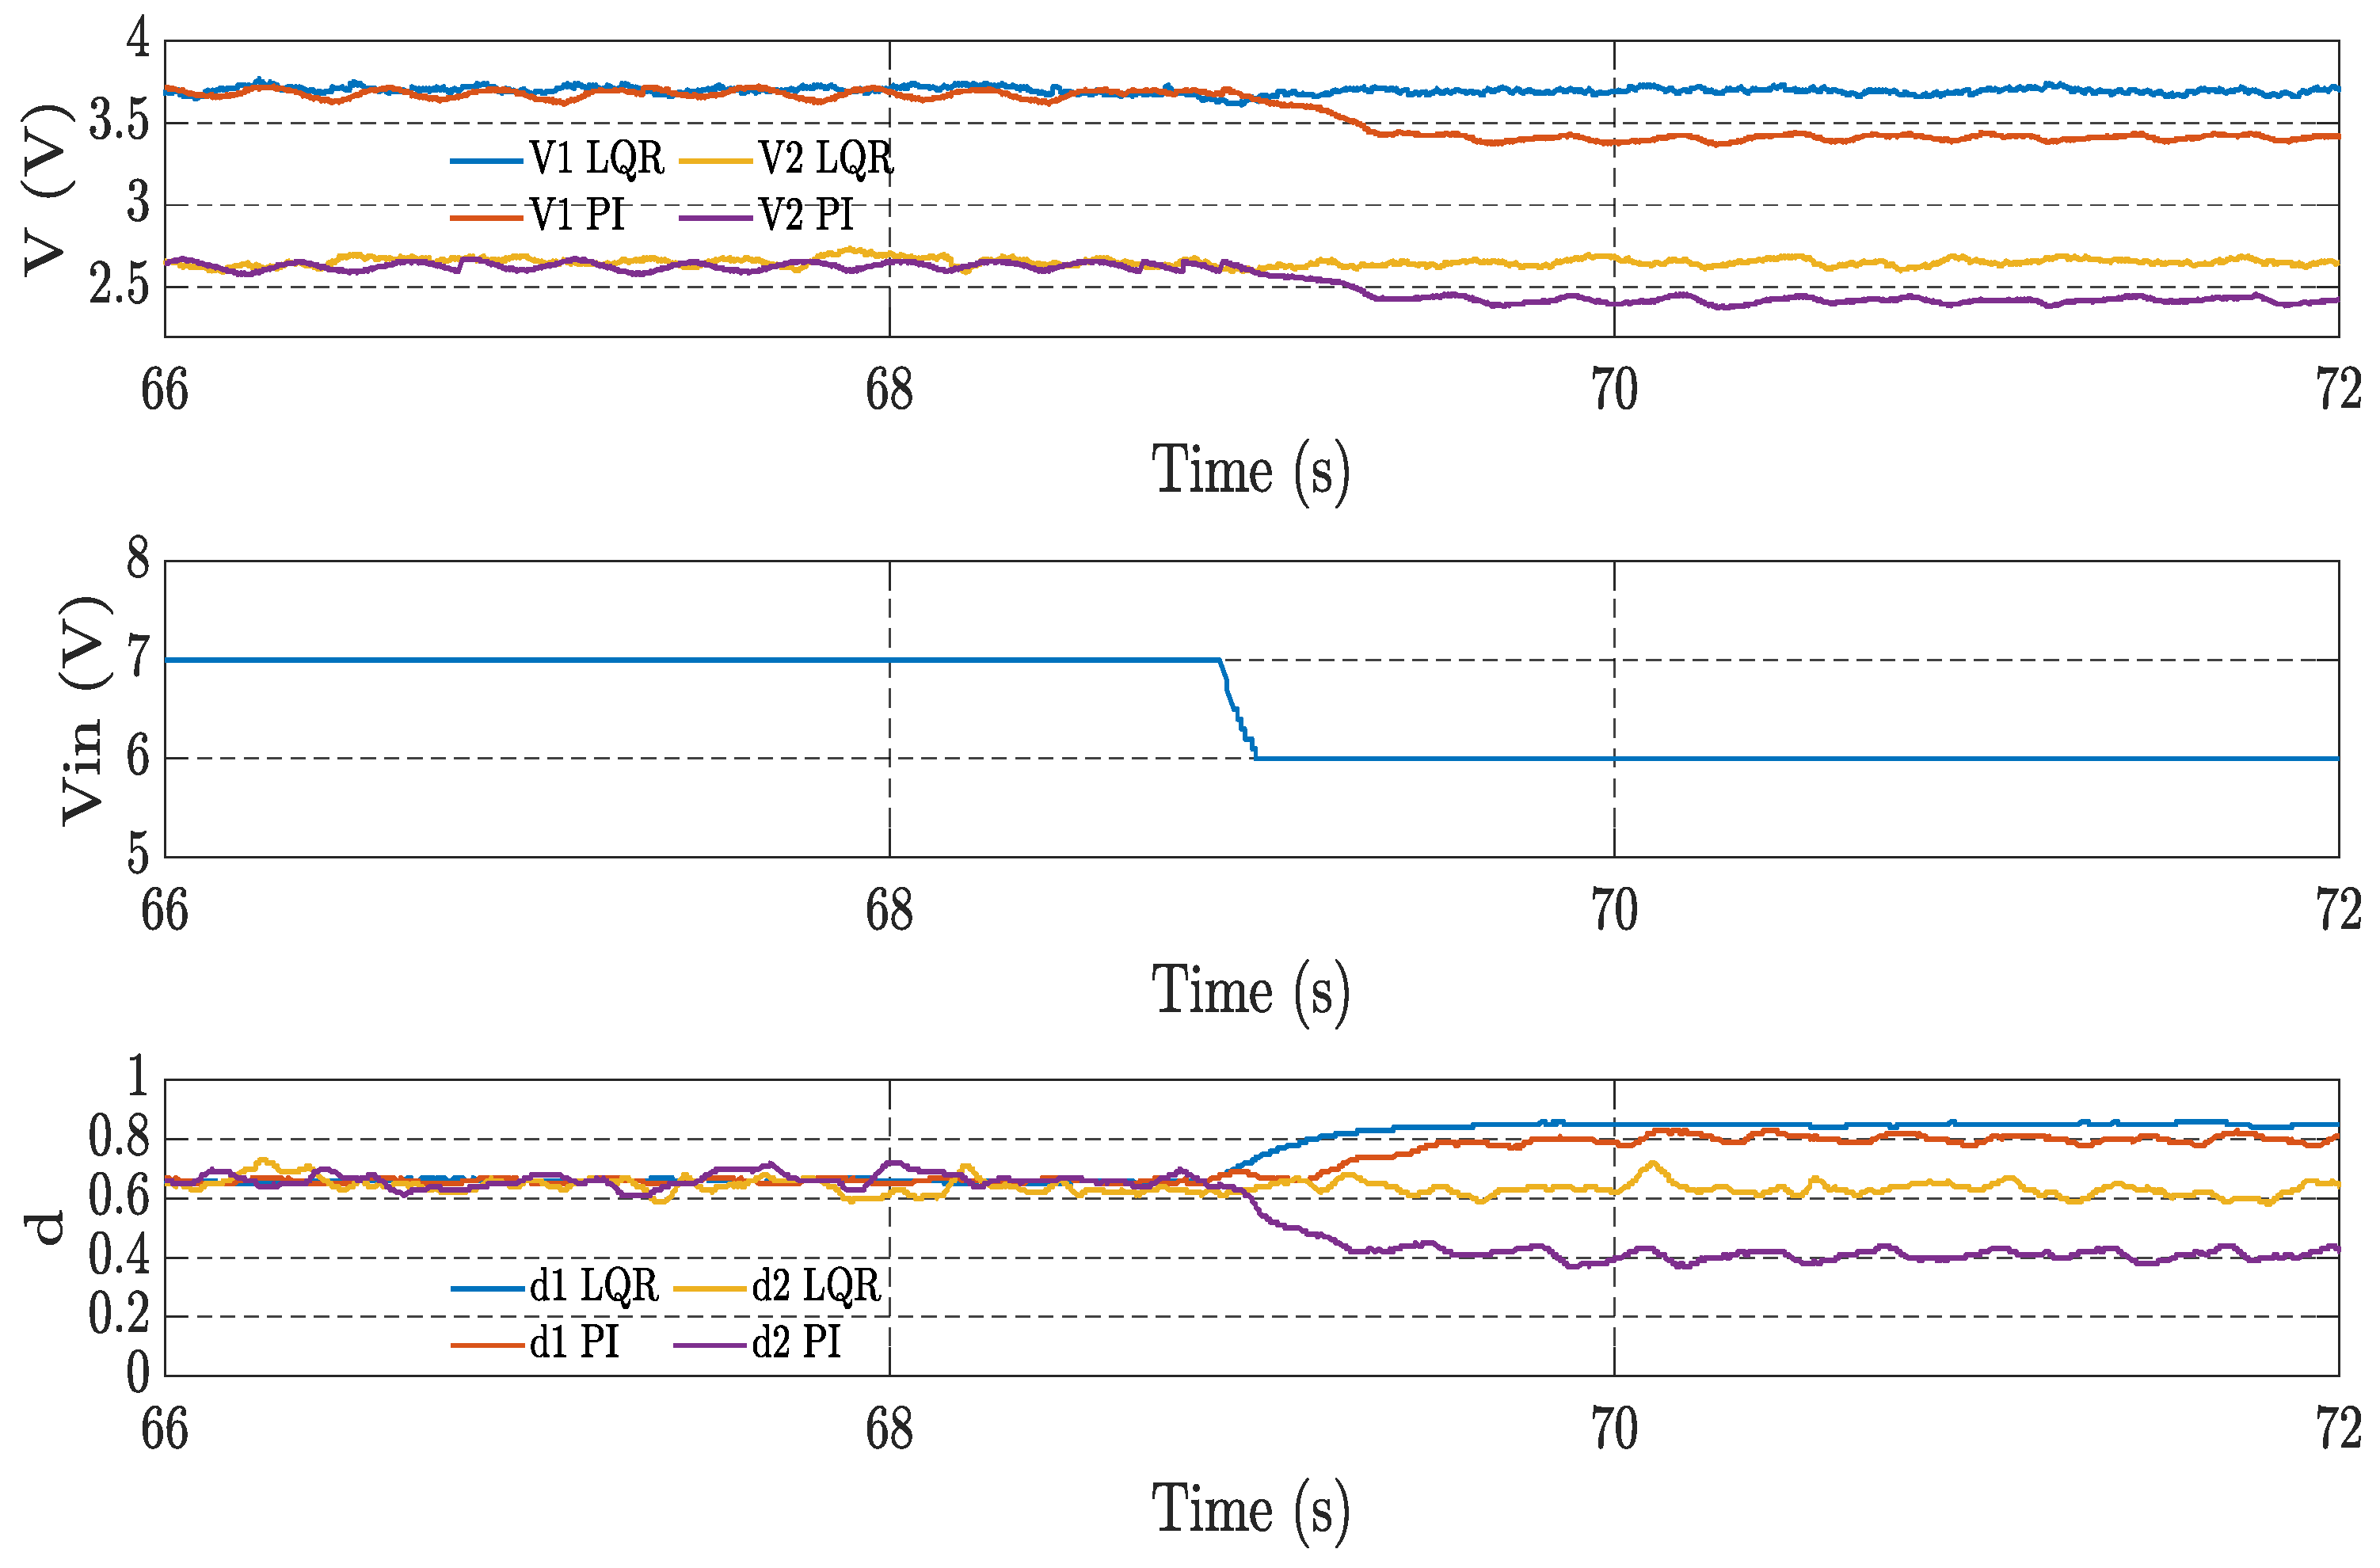
With the real SIMO converter test system (see in
Figure 4), operating in steady state around the operating point (
, a negative step variation was applied on the value of the external converter input voltage, Vin, from 7.0 to 6.0 Volts, at the time instant t = 69.0. In
Figure 6 are presented the acquired signals of output voltages, V
1 and V
2, as well as the corresponding control efforts, d
1 and d
2, provided by LQR and Decoupled PI controllers, respectively. As can be observed, both designed controllers, LQR and Decoupled PI, were able to ensure the system stability. However, only the LQR strategy have succeeded in compensates for the variation in Vin, by adequately regulating both outputs, V
1 and V
2, for their respective pre-disturbance values, without excessive control effort or saturation in both duty cycle signals d
1 and d
2, showing a good performance obtained by the LQR strategy. In contrast,
Figure 6 also shows that the experimental results obtained for the Decoupled PI strategy, at the same test, was not satisfactory. Although the PI strategy was able to provides a stable closed-loop system, it fails in adequately regulate the voltage outputs V
1 and V
2 to their respective pre-disturbance values. A possible cause may reside in the assumed degree of decoupling imposed in the PI design, which could be an excessive requirement. Further research is needed in this particular point.
Table 2 shows the comparison of ISE and ISU performance indices for the single inductor dual output converter test system between two approaches.
Those evaluates the impact of voltage variation on the controller performance. In the case of the output V1, it is possible to notice that ISE index value of the LQR strategy is almost one hundred times smaller in comparison with the decoupled PI index value. Furthermore, the ISU index values show that the improvement in the voltage regulation happened with less than 10 percent increase in the LQR ISU index in comparison with the PI ISU index. In the case of the output V2, it is possible to notice that ISE index value of the LQR strategy is about ten times smaller in comparison with the decoupled PI index value. Moreover, the ISU index values show that the improvement in the voltage regulation happened with less than 30 percent increase in the LQR ISU index in comparison with the PI ISU index. Therefore, the preview analysis supports improving robustness of the proposed LQR control.
5.2. Load Variation
The load variation test is performed by changing the load at each converter output, keeping the value V
in = 7 V. The load resistance value at each converter output is gradually reduced by adding resistors in parallel with it. As a result, the corresponding output current value changes.
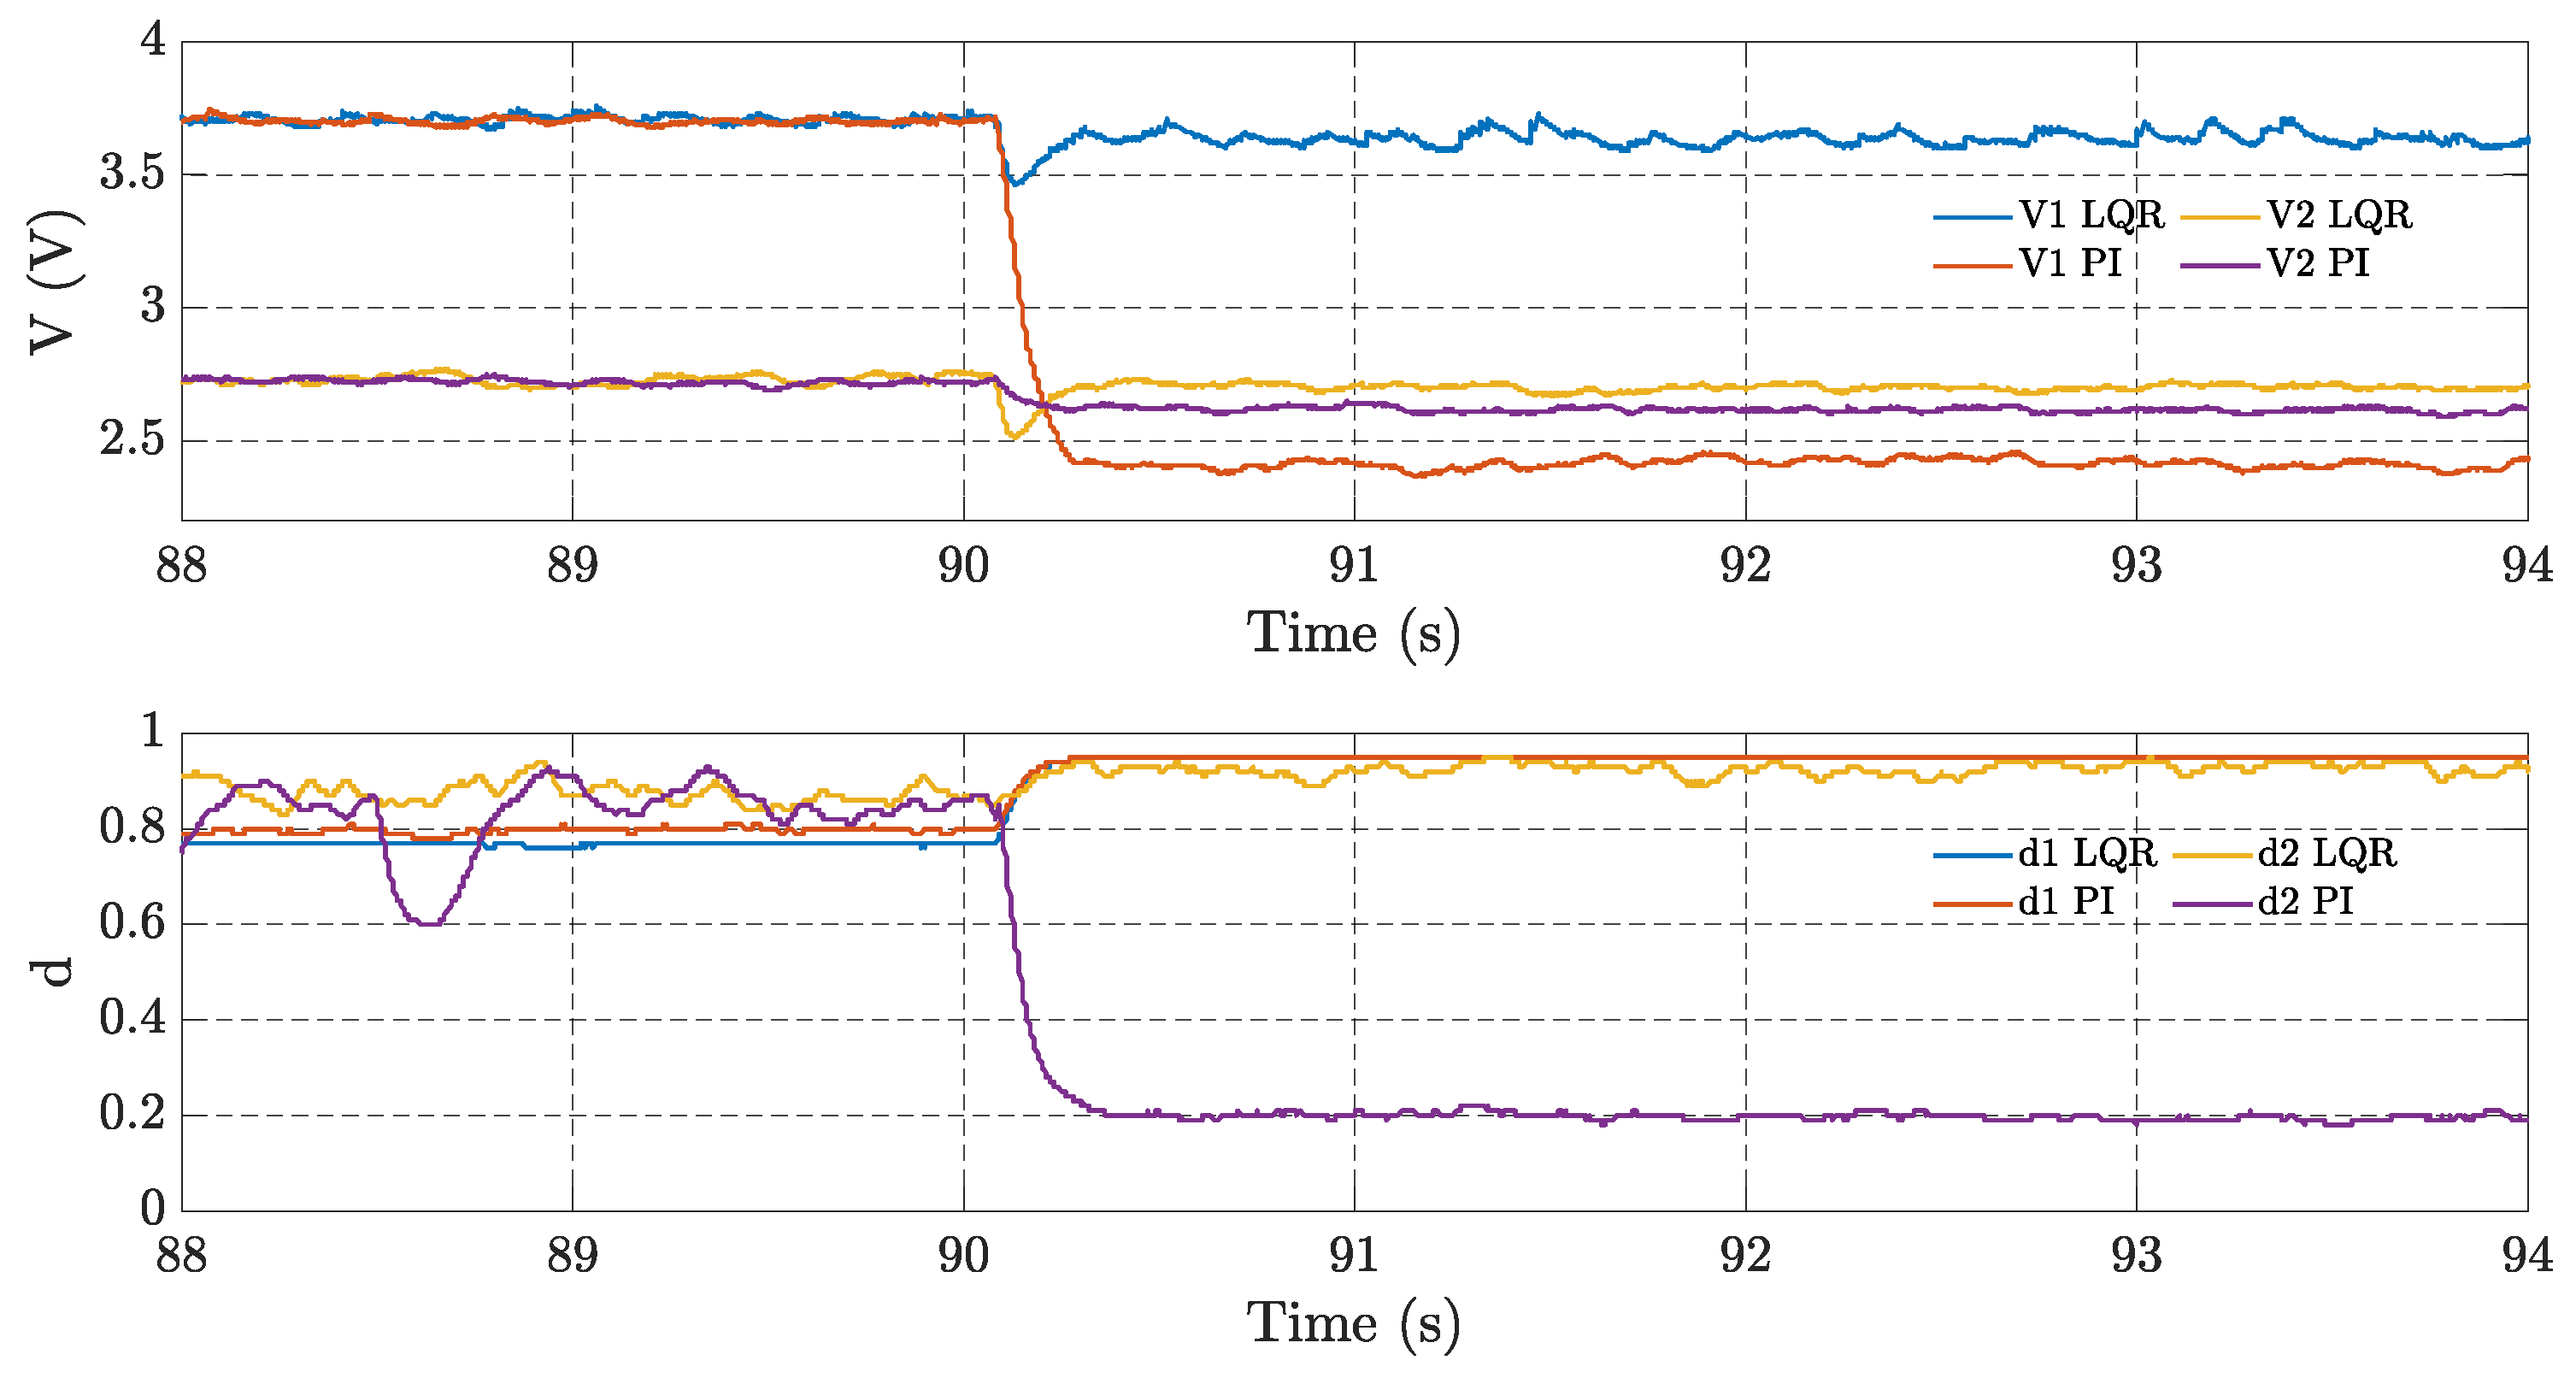
Figure 7 shows the closed-loop response of voltages V
1 and V
2 using LQR and Decoupled PI controllers, and the corresponding control efforts, d
1 and d
2. The system starts with a load resistance of R
1 = 10 Ω. At t = 90 s, a 10 Ω resistor is inserted in parallel, reducing the load resistance value to 5 Ω. It can be seen that only the controller method using the LQR strategy can effectively regulates the two outputs, V
1 and V
2 to reach their respective pre-disturbance values without excessive control effort or saturation of the duty cycle signals d
1 and d
2 and has a fast response. Furthermore, the Decoupled PI controller causes steady state errors mainly at V
1, and it can also be seen that V
1 is more affected because its more sensitivity to loop interactions.
Similar results were obtained for the load variations in output 2 of the LQR strategy and the Decoupled PI control structure, as shown in
Figure 8. However, the controller designed with the LQR strategy correctly compensated the oscillations due to load variation in output 2 of single inductor dual output converter. The results for outputs 1 and 2 were collected simultaneously for the same load variation, i.e., adding a 10 Ω resistor in parallel with the resistor R
2 = 10 Ω. The LQR strategy is capable of quickly compensating for the load variation, nearly eliminating steady-state error in V
1 and V
2 without saturating the control signals. On the other hand, the Decoupled PI controller method cannot compensate for the load variations at outputs 1 and 2, resulting in significant performance degradation, which is mainly reflected in output 2´s high steady-state error value.
Table 3 shows the ISE and ISU indices for each output due to the load changes at output 1 for the LQR strategy and the Decoupled PI control structure. Compared to the Decoupled PI structure values, the ISE of the proposed LQR strategy is lower for both outputs. However, it can be seen that the ISU index value of the LQR case is much higher than in the Decoupled PI case, especially for output 2. Also,
Table 4 shows the same index values for variations in output 2 for LQR strategy and Decoupled PI control structure. The proposed LQR strategy offers lower ISE values compared to the Decoupled PI values. These results show that the proposed LQR strategy provides significant performance improvements and justifies its application in single inductor dual output converter systems.
5.3. CPL Power Variation
The CPL power variation test is performed by placing the CPL in parallel with the load resistor and varying its power value at each output of the converter. The load resistance value at each converter output is fixed at 10 Ω. By using a Programmable DC Electronic Load in parallel with each resistor, the CPL power value at each output of the converter is gradually increased. As a result, the corresponding output current value is changed.
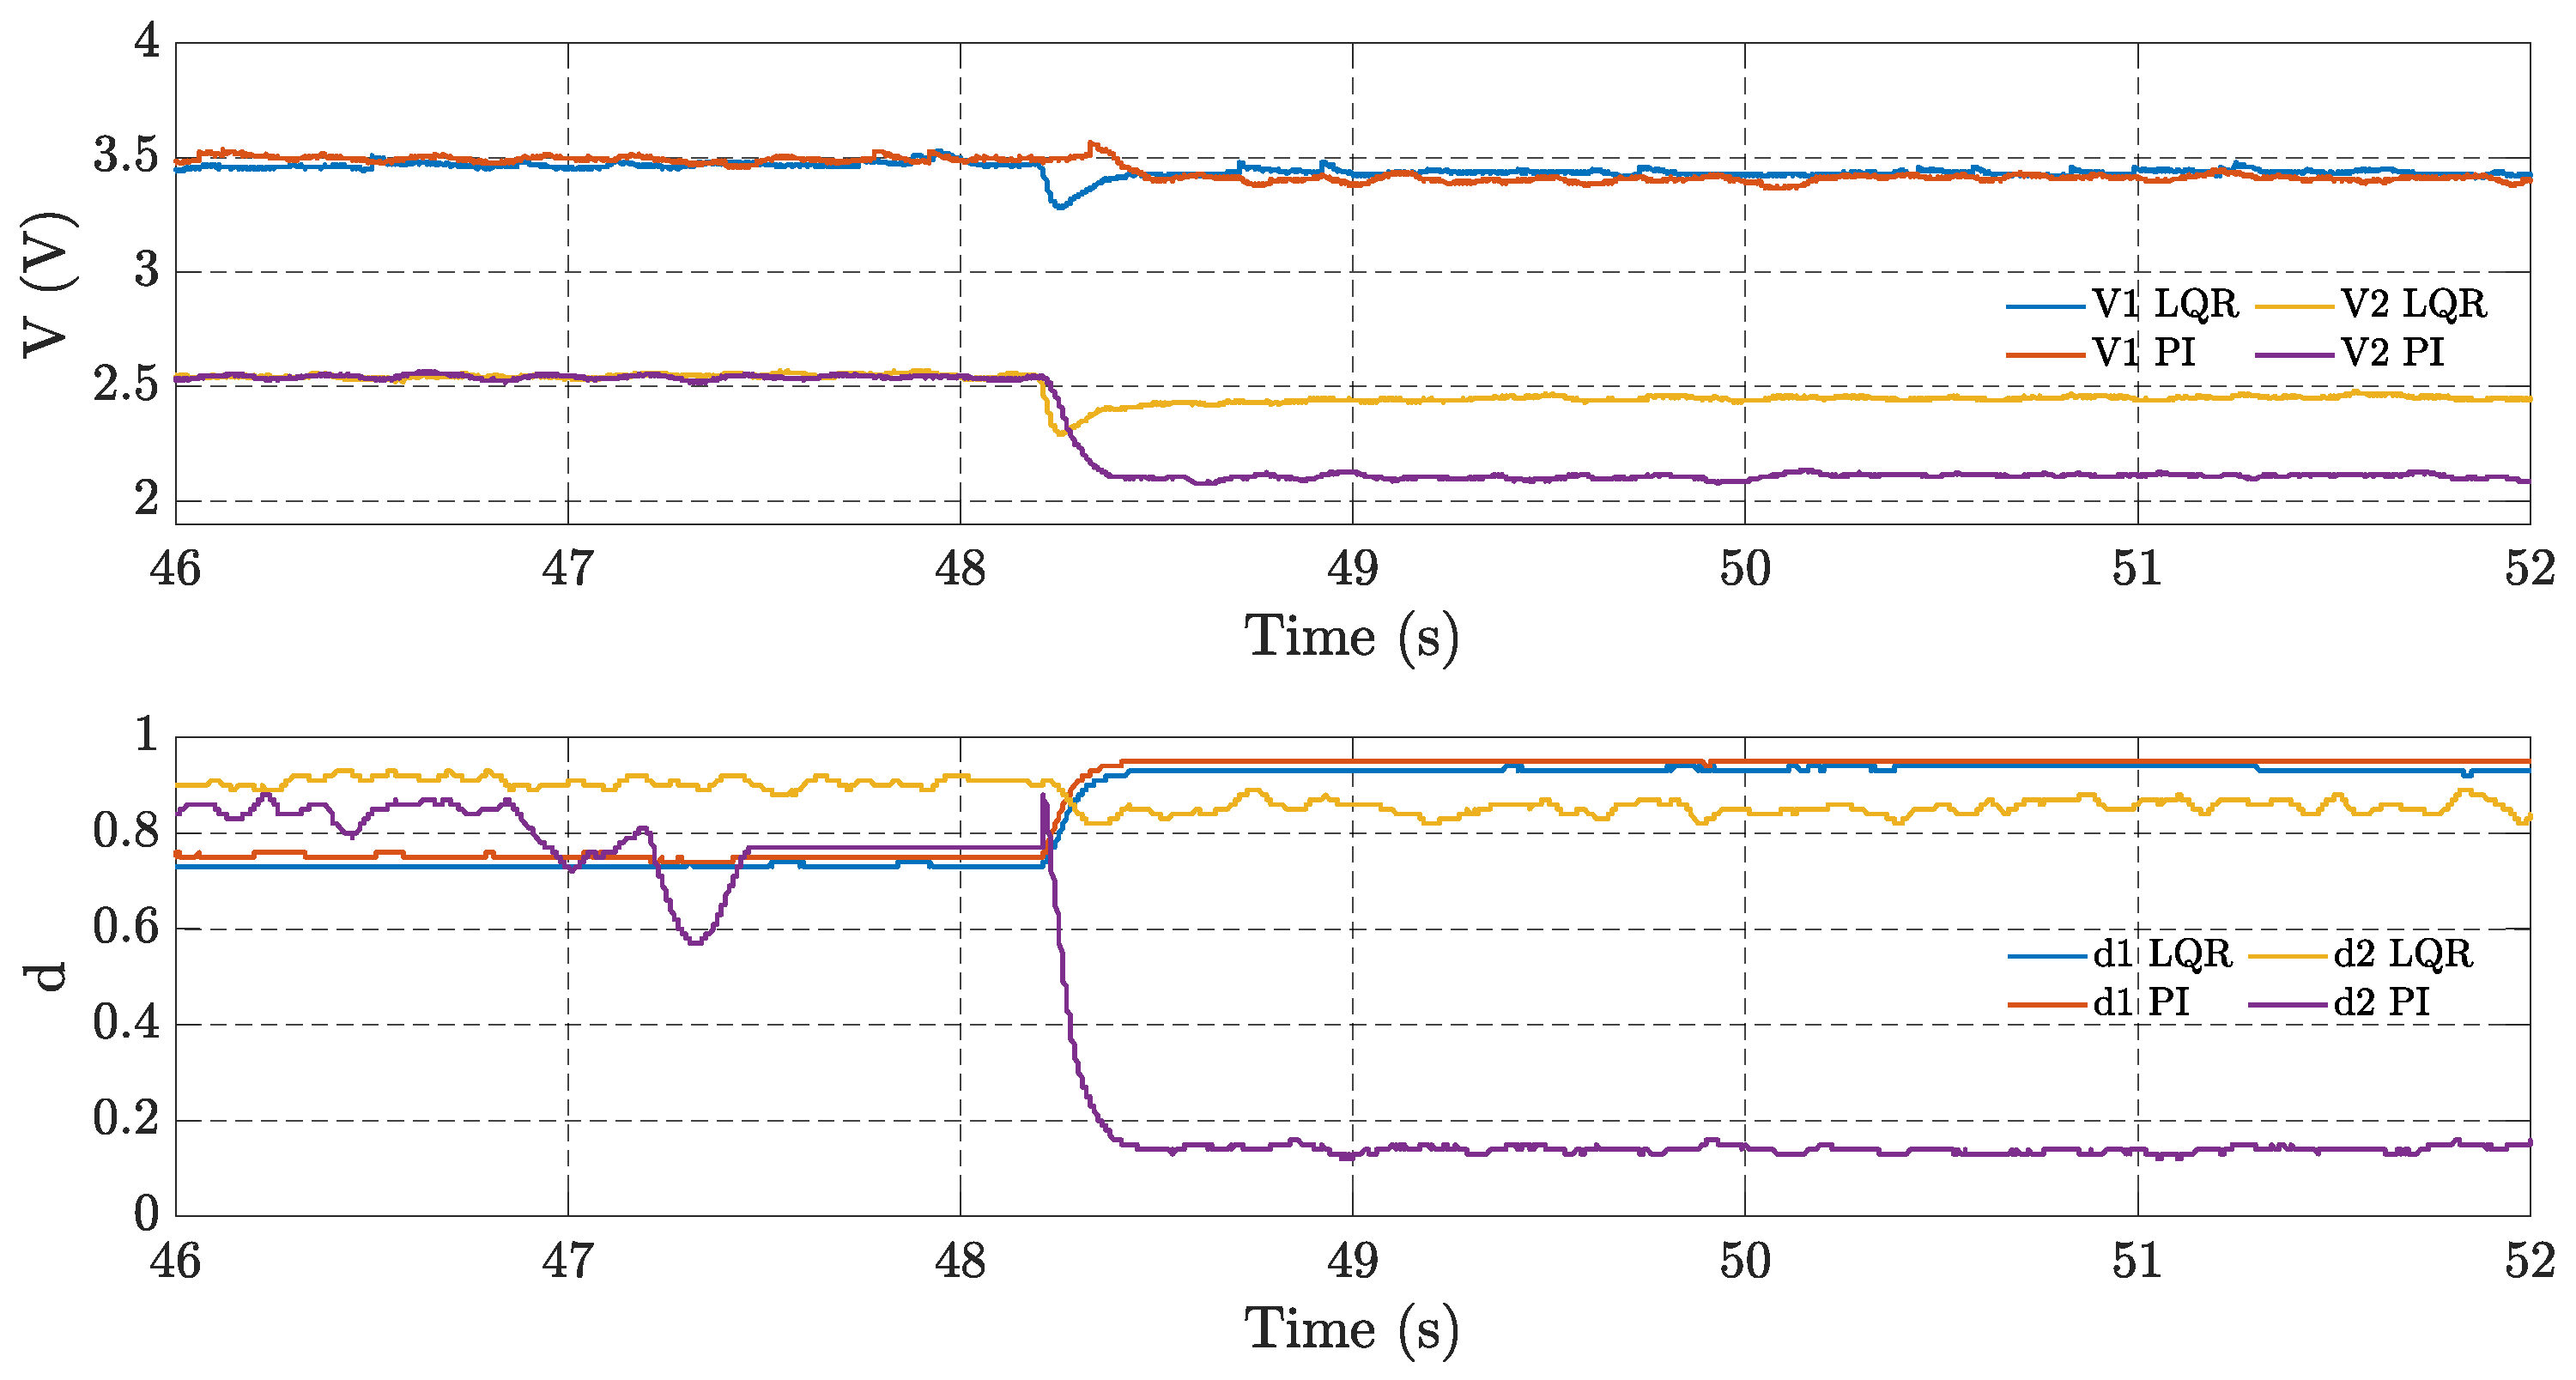
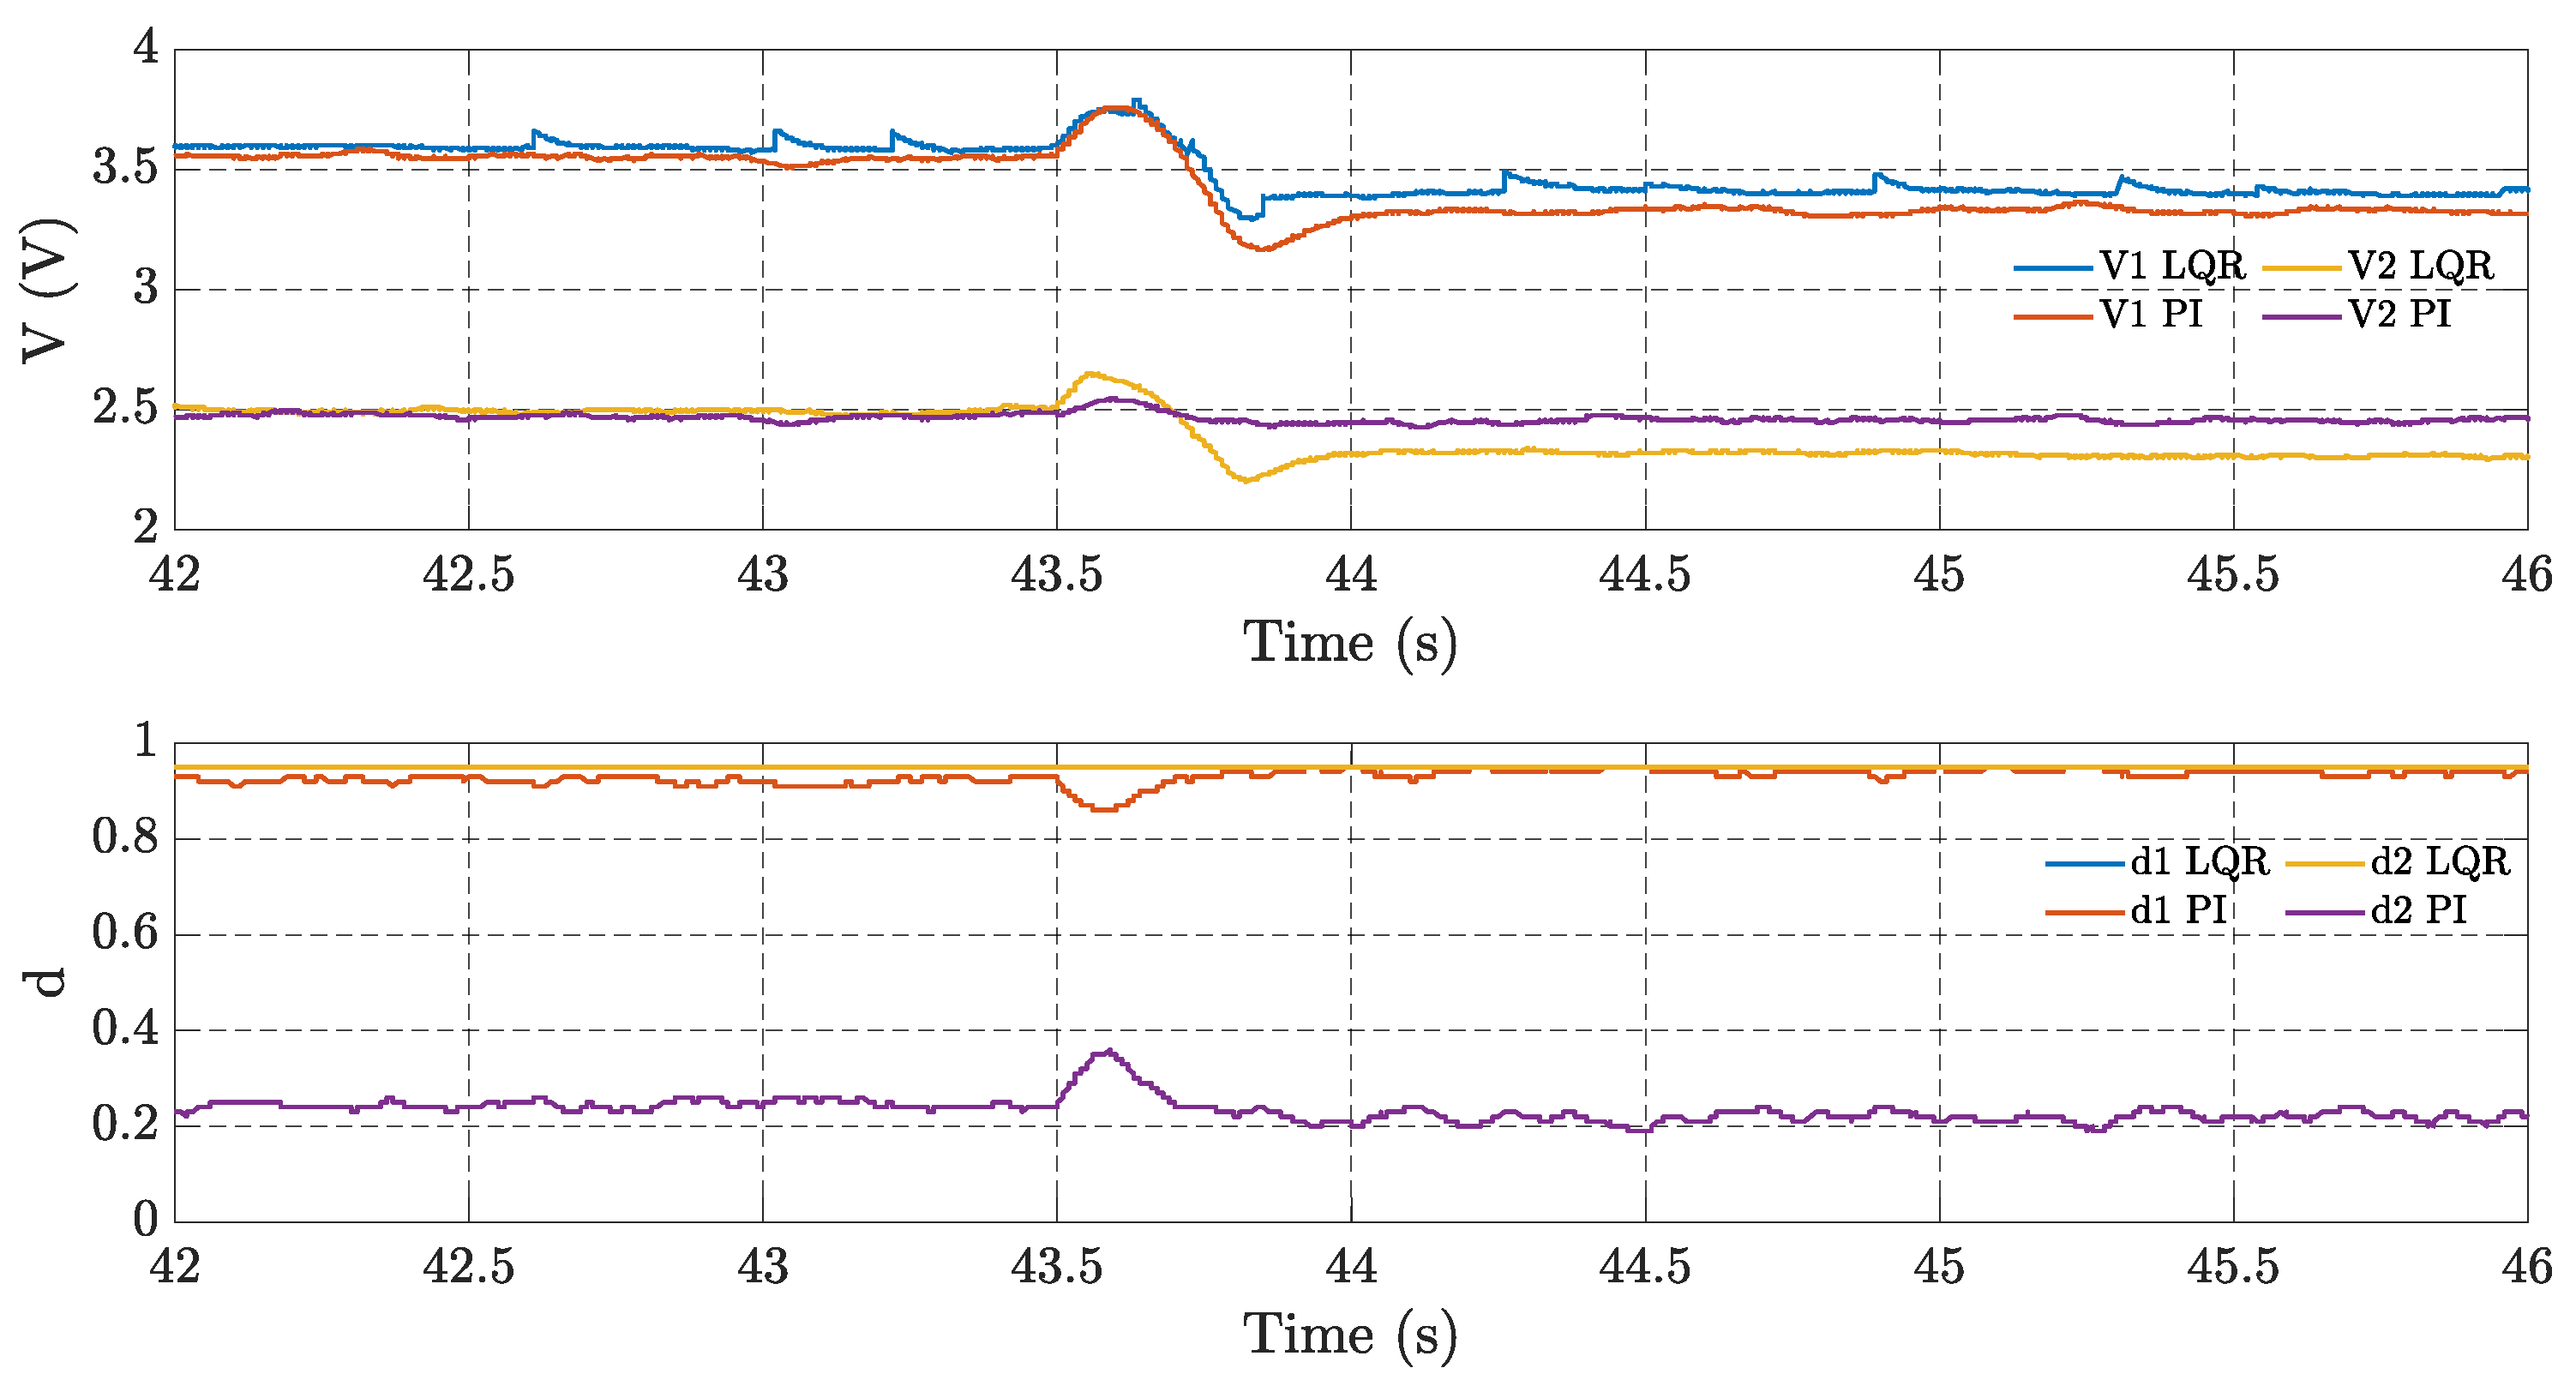
Figure 9 shows the closed-loop response of the V
1 voltage using the LQR strategy and the Decoupled PI controller. The system starts with CPL power value CPL
1 = 0.5 W. At t = 43.6 s, the power value of CPL
1 becomes 0.7 W. It can be observed that when CPL
1 is connected, all the control efforts of loop 1 remain saturated, while the control effort of the Decoupled PI controller of loop 2 drops to a very low value. Although these control methods cannot compensate for the output errors caused by the CPL
1 perturbation (only the Decoupled PI controller can mitigate the steady-state error of V
2), they can ensure system stability and fast response.
Similar results are also obtained for the CPL
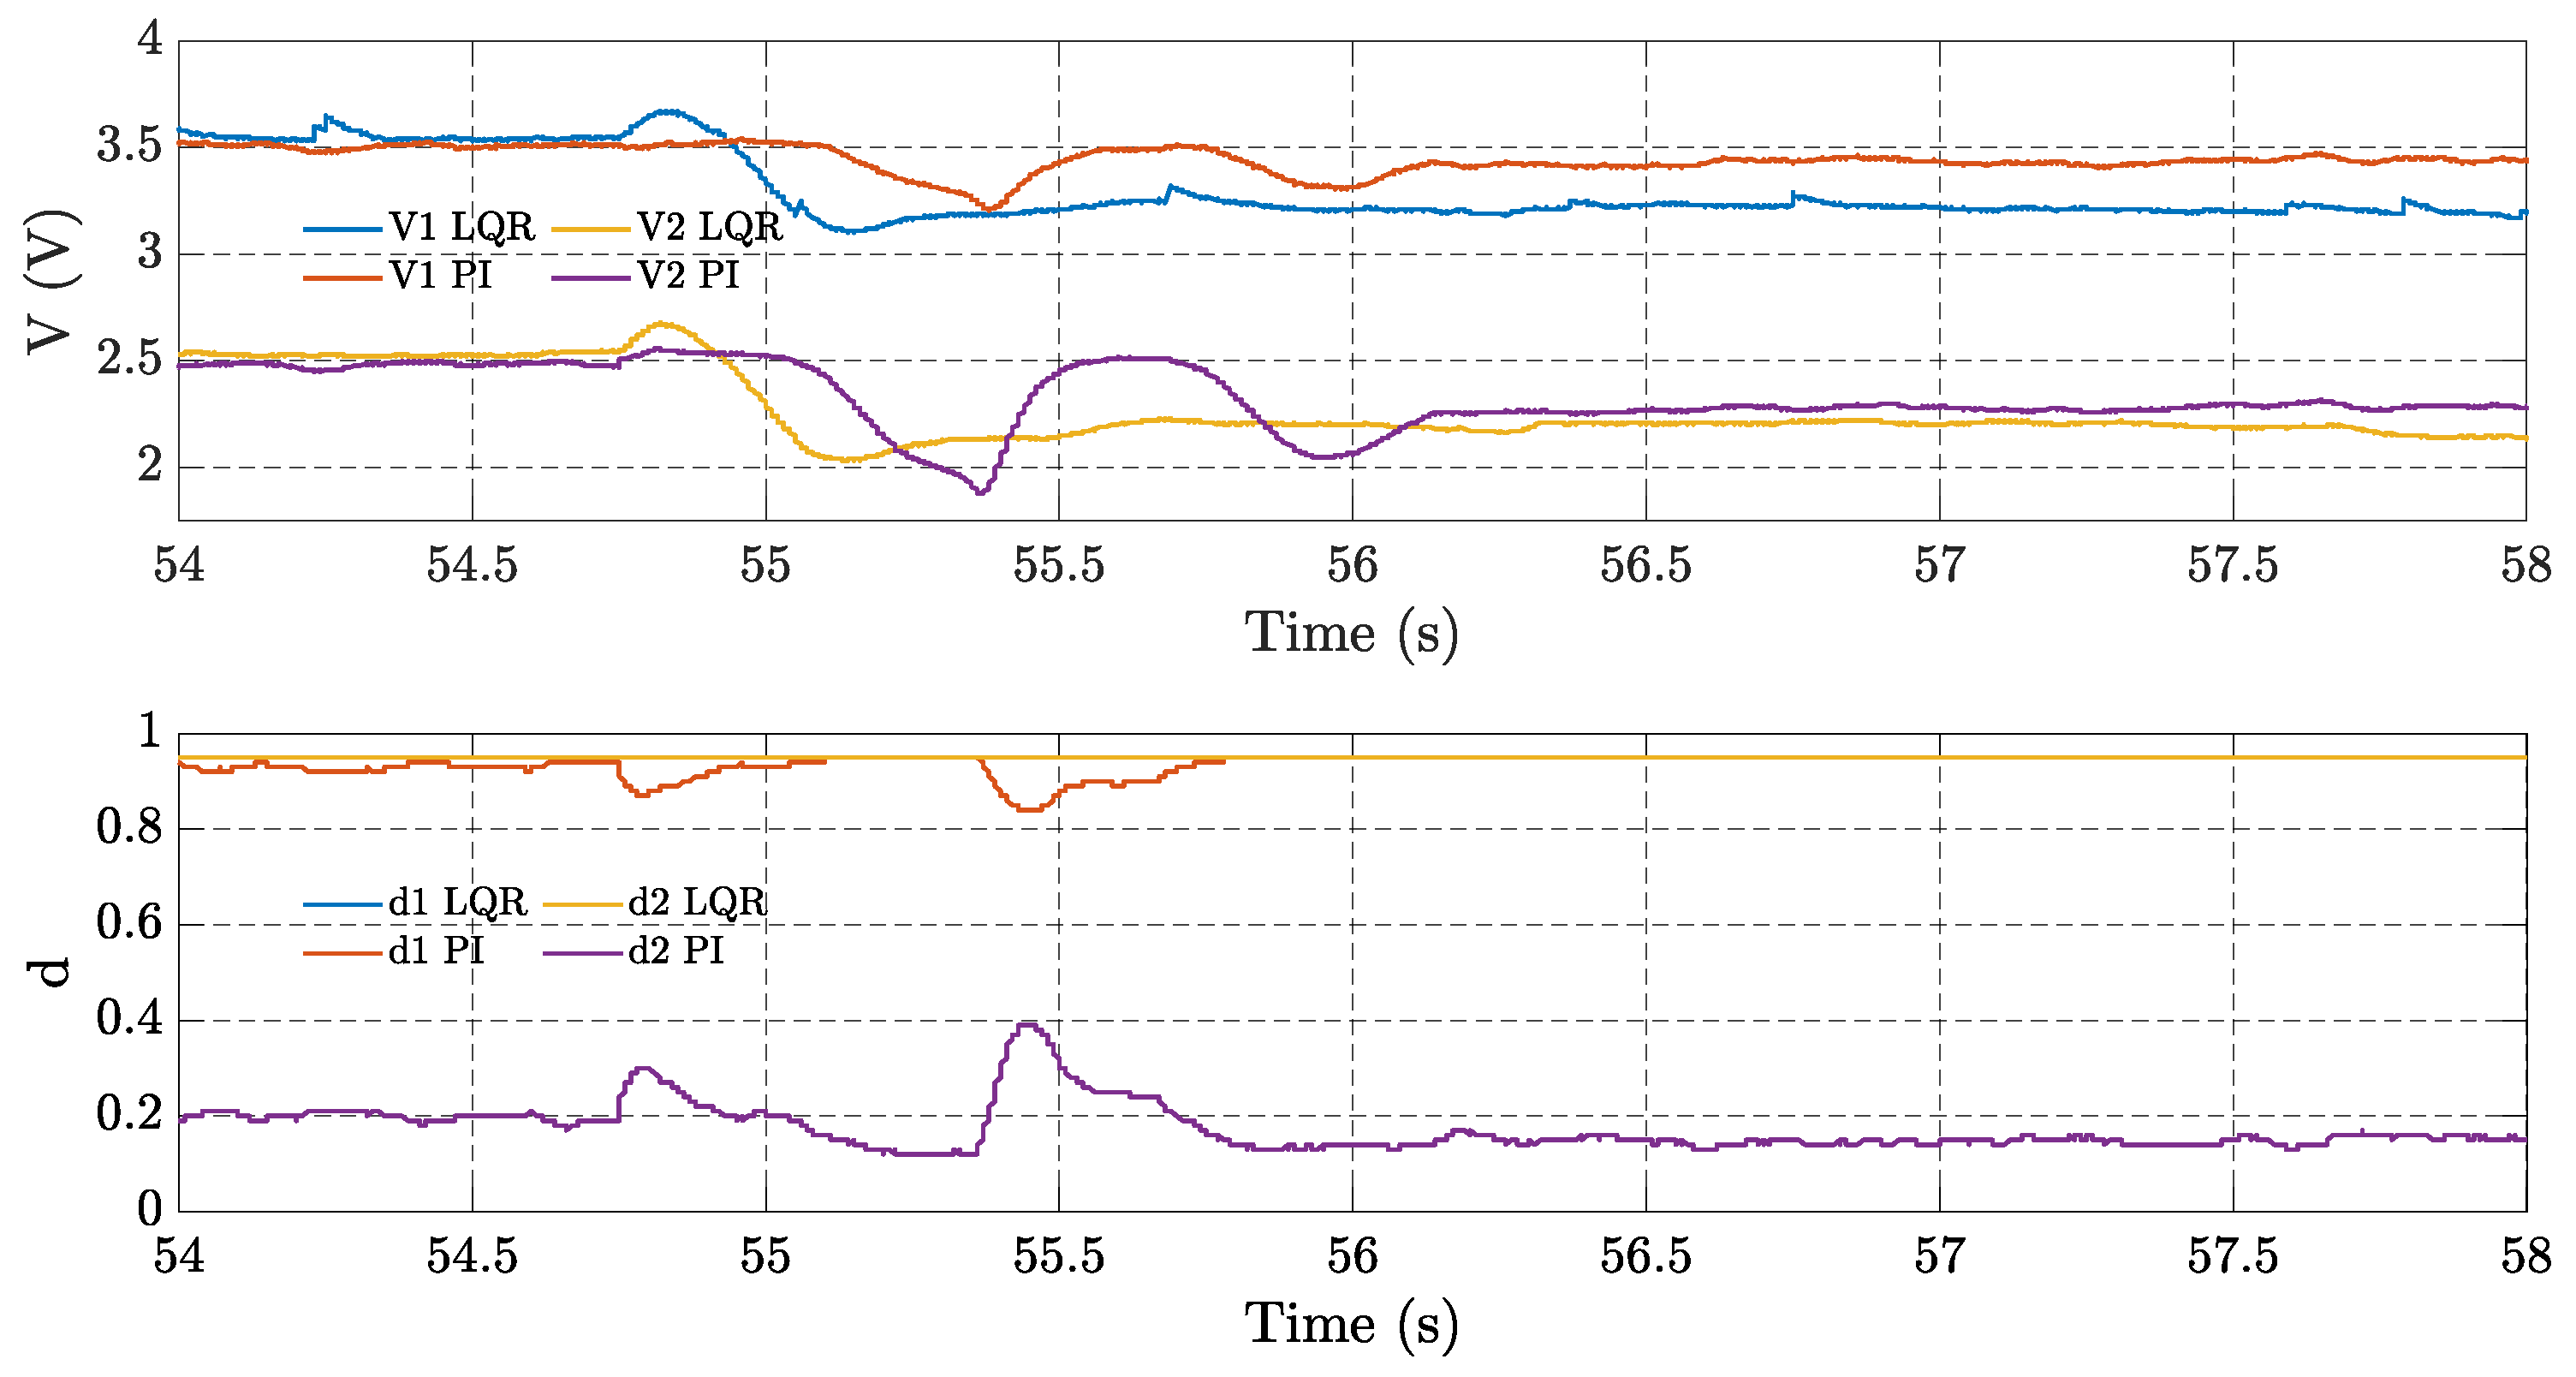
2 variation at output 2 for LQR strategy and Decoupled PI control structure, as shown in
Figure 10, nevertheless, the Decoupled PI controller can compensate the oscillations in output 1 due to the power variation of the CPL
2. The system starts with a CPL power value of CPL
2 = 0.25 W, then at t = 54.8 s, the power value of the CPL
2 changes to 0.35 W. It can be observed that the control efforts of the loop 2 stay saturated when the CPL
2 is connected, on the other hand, the control effort of the Decoupled PI controller of the loop 2 falls to a very low value. Although, the control methodologies cannot compensate the error at the outputs due the perturbation in CPL
2 (only the Decoupled PI controller can mitigate the steady state error in V
1), but they can ensure the stability of the system with a quick response.
Table 5 shows the ISE index for each output resulting from the CPL power change at output 1 for the LQR strategy and the Decoupled PI control structure. The ISE of the Decoupled PI controller is low for both outputs. Also,
Table 6 shows the same indices for power variations in CPL at output 2, using the LQR strategy and the Decoupled PI control structure. The Decoupled PI approach has lower ISE values compared to the LQR strategy. These results show that the proposed Decoupled PI controller has significant performance improvements in this case and demonstrate its application in single-inductor-dual-output converter systems under such conditions.
6. Conclusions
This paper proposes the use of a robust LQR strategy and a Decoupled PI controller in a single-inductor dual-output DC-DC converter system to ensure robust stability and performance over the entire predetermined uncertain region, thereby reducing oscillations effects caused by the connection and variation of a constant power load, in parallel with a resistor of each converter output.
The proposed controllers have been exhaustively evaluated in physical experiments performed on a DC-DC SIMO converter board. The performances of the proposed methods, the LQR strategy, and the Decoupled PI structure are compared. Based on the experimental results, it is concluded that the proposed LQR strategy is able to maintain the required performance and reduce the steady-state errors V1 and V2 without excessive control effort or saturation of the duty cycle signals d1 and d2, which indicates good performance. On the other hand, when a CPL is connected to the outputs of the system, and it is subjected to a certain variation in the power of each CPL, both strategies are able to maintain the system stable, however, none of the controllers can mitigate the steady-state errors in V1 and V2 under these conditions. Thus, the results indicate that the proposed LQR strategy approach is reasonable and provides adequate performance improvements in the SIMO converter controls, offering robust performance and stability, while more research is needed to handle constant power loads (CPL). The authors are currently investigating strategies to deal with CPL, and results will be reported in future papers.
Author Contributions
Conceptualization, A.C.M.S., W.B.J. and R.L.P.d.M; methodology, W.B.J., R.L.P.d.M., and A.C.M.S., software, A.C.M.S. and A.S.G.; validation, A.C.M.S., W.B.J., R.L.P.d.M., and C.R.J.; formal analysis, A.C.M.S., W.B.J., R.L.P.d.M. and C.R.J.; investigation, A.C.M.S.; data processing A.C.M.S.; writing—original draft preparation, A.C.M.S.; writing—review and editing, A.C.M.S.; W.B.J. and R.L.P.d.M.
Funding
The first author of this paper acknowledges the support received from Conselho Nacional de Desenvolvimento Científico e Tecnológico (CNPq-Brazil), the Organization of American States (OAS) and the Coimbra Group of Brazilian Universities (GCUB).
Conflicts of Interest
The authors declare no conflicts of interest.
References
- Emadi A, Ehsani M. Multi-converter power electronic systems: definition and applications, In: Proceedings of the Power Electronics Specialists Conference, 2001. PESC. 2001 IEEE 32nd Annual, vol. 2. IEEE, 2001, pp. 1230–6.
- Bhaumik, Y. Kumar, S. Srivastava, and M. Islam, ``Performance studies of a separately excited DC motor speed control fed by a buck converter using optimized PIλDµ controller,’’ in Proc. Int. Conf. Circuit, Power Comput. Technol. (ICCPCT), Nagercoil, India, Mar. 2016, pp. 1-6.
- M. Hassanalieragh, T. Soyata, A. Nadeau, and G. Sharma,” UR-SolarCap: An open-source intelligent auto-wakeup solar energy harvesting system for supercapacitor-based energy buffering.” IEEE Access, vol. 4, pp. 542-557, 2016.
- D. Kumar, F. Zare, and A. Ghosh, “DC microgrid technology: System architectures, AC grid interfaces, grounding schemes, power quality, communication networks, applications, and standardizations aspects,” IEEE Access, vol. 5, pp. 12230-12256, 2017.
- Chang, H.-C.; Liaw, C.-M. An Integrated Driving/Charging Switched Reluctance Motor Drive Using Three-Phase Power Module. IEEE Trans. Ind. Electron. 2010, 58, 1763–1775, . [CrossRef]
- Ghiasi, M.I.; Golkar, M.A.; Hajizadeh, A. Lyapunov Based-Distributed Fuzzy-Sliding Mode Control for Building Integrated-DC Microgrid With Plug-In Electric Vehicle. IEEE Access 2017, 5, 7746–7752, . [CrossRef]
- Xiong, X.; Tse, C.K.; Ruan, X. Bifurcation Analysis of Standalone Photovoltaic-Battery Hybrid Power System. IEEE Trans. Circuits Syst. I: Regul. Pap. 2013, 60, 1354–1365, . [CrossRef]
- Xu, Q.; Hu, X.; Wang, P.; Xiao, J.; Tu, P.; Wen, C.; Lee, M.Y. A Decentralized Dynamic Power Sharing Strategy for Hybrid Energy Storage System in Autonomous DC Microgrid. IEEE Trans. Ind. Electron. 2016, 64, 5930–5941, . [CrossRef]
- X. Xiong, X. Ruan, H. Xi, and J. Ge, “Feed-forwarding the output voltage to improve efficiency for envelope-tracking power supply based on a switch-linear hybrid scheme,” IEEE Trans. Power Electron., vol. 26, no. 8, pp. 2106-2111, Aug. 2011.
- N. Mohan, T. M. Undeland, and W. P. Robbins, Power Electronics: Converters, Applications, and Design. Hoboken, NJ, USA: Wiley, 2002.
- Salimi, M.; Zakipour, A. Direct voltage regulation of DC–DC buck converter in a wide range of operation using adaptive input–output linearization. IEEJ Trans. Electr. Electron. Eng. 2014, 10, 85–91, . [CrossRef]
- Dasika, J.D.; Bahrani, B.; Saeedifard, M.; Karimi, A.; Rufer, A. Multivariable Control of Single-Inductor Dual-Output Buck Converters. IEEE Trans. Power Electron. 2014, 29, 2061–2070, . [CrossRef]
- Weiwei, X.; Xiaoting, Z.; Zhiliang, H.; D, K. A single-inductor dual-output switching converter with average current mode control. J. Semicond. 2009, 30, 115–120, . [CrossRef]
- Ma D, Ki WH, Tusi CY. A pseudo-CCM/DCM SIMO switching converter with freewheel switching. IEEE J Solid-State Circuits Jun. 2003;38(6):1007e14. [CrossRef]
- Kwon, D.; Rincon-Mora, G.A. Single-Inductor–Multiple-Output Switching DC–DC Converters. IEEE Trans. Circuits Syst. II: Express Briefs 2009, 56, 614–618, . [CrossRef]
- Trevisan, D.; Mattavelli, P.; Tenti, P. Digital Control of Single-Inductor Multiple-Output Step-Down DC–DC Converters in CCM. IEEE Trans. Ind. Electron. 2008, 55, 3476–3483, . [CrossRef]
- de Medeiros, R.L.P.; Barra, W.; de Bessa, I.V.; Filho, J.E.C.; Ayres, F.A.d.C.; das Neves, C.C. Robust decentralized controller for minimizing coupling effect in single inductor multiple output DC-DC converter operating in continuous conduction mode. ISA Trans. 2018, 73, 112–129, . [CrossRef]
- Le, H.-P.; Chae, C.-S.; Lee, K.-C.; Wang, S.-W.; Cho, G.-H. A Single-Inductor Switching DC–DC Converter With Five Outputs and Ordered Power-Distributive Control. IEEE J. Solid-state Circuits 2007, 42, 2706–2714, . [CrossRef]
- Shen, Z.; Chang, X.; Wang, W.; Tan, X.; Yan, N.; Min, H. Predictive Digital Current Control of Single-Inductor Multiple-Output Converters in CCM With Low Cross Regulation. IEEE Trans. Power Electron. 2011, 27, 1917–1925, . [CrossRef]
- Nayak, G.; Nath, S. Decoupled Voltage-Mode Control of Coupled Inductor Single-Input Dual-Output Buck Converter. IEEE Trans. Ind. Appl. 2020, 56, 4040–4050, doi:10.1109/tia.2020.2991650.
- Wang, Y.; Xu, J.; Yin, G. Cross-Regulation Suppression and Stability Analysis of Capacitor Current Ripple Controlled SIDO CCM Buck Converter. IEEE Trans. Ind. Electron. 2018, 66, 1770–1780, . [CrossRef]
- Dong, Z.; Li, X.L.; Tse, C.K.; Zhang, Z. Derivation of Single-Input Dual-Output Converters With Simple Control and No Cross Regulation. IEEE Trans. Power Electron. 2020, 35, 11930–11941, . [CrossRef]
- Zhou, S.; Zhou, G.; Liu, G.; Mao, G. Small-Signal Modeling and Cross-Regulation Suppressing for Current-Mode Controlled Single-Inductor Dual-Output DC–DC Converters. IEEE Trans. Ind. Electron. 2020, 68, 5744–5755, . [CrossRef]
- Nayak, G.; Nath, S. Decoupled Average Current Control of Coupled Inductor Single-Input Dual-Output Buck Converter. IEEE J. Emerg. Sel. Top. Ind. Electron. 2020, 1, 152–161, . [CrossRef]
- Shekel, J. Nonlinear Problems in the Design of Cable-Powered Distribution Networks. IEEE Trans. Cable Telev. 1976, CATV-1, 11–17, . [CrossRef]
- Hodge C, Flower J, Macalindin A. Dc power system stability. In: Proceedings of the IEEE Electric Ship Technologies Symposium, 2009. ESTS 2009, pp. 433–9.
- Rivetta, C.;Williamson, G.A.; Emadi, A. Constant power loads and negative impedance instability in sea and undersea vehicles: Statement of the problem and comprehensive large-signal solution. In Proceedings of the IEEE Electric Ship Technologies Symposium, Philadelphia, PA, USA, 27 July 2005, pp. 313–320.
- Ghisla, U.; Kondratiev, I.; Dougal, R. Protection of medium voltage DC power systems against ground faults and negative incremental impedances. In Proceedings of the IEEE SoutheastCon 2010 (SoutheastCon), Concord, NC, USA, 18–21 March 2010, pp. 259–263.
- Suresh, S.; Aditya, R.;Deepak, F. Constant power loads and their effects in DC distributed power systems: A review. In: Renewable and Sustainable Energy Reviews, 2017, pp. 407-421.
- Marcillo, K.E.L.; Guingla, D.A.P.; Barra, W.; De Medeiros, R.L.P.; Rocha, E.M.; Benavides, D.A.V.; Nogueira, F.G. Interval Robust Controller to Minimize Oscillations Effects Caused by Constant Power Load in a DC Multi-Converter Buck-Buck System. IEEE Access 2019, 7, 26324–26342, . [CrossRef]
- Xiong, Q.; Cai, W.-J. Effective transfer function method for decentralized control system design of multi-input multi-output processes. J. Process. Control. 2006, 16, 773–784, . [CrossRef]
- Lin K, Huang C, Chen D, Liu KH. Modeling and design of feedback loops for a voltage-mode single-inductor dual-output buck converter. In: IEEE PESC - power electronics specialists conference; Jun. 2008. [CrossRef]
- Xiong, Q.; Cai, W.-J. Effective transfer function method for decentralized control system design of multi-input multi-output processes. J. Process. Control. 2006, 16, 773–784, . [CrossRef]
- Xiong, Q.; Cai, W.-J.; He, M.-J. A practical loop pairing criterion for multivariable processes. J. Process. Control. 2005, 15, 741–747, . [CrossRef]
- Castro, L.; Cunha, L.; Dutra, B.; Silveira, A. Digital LQG Controller Design Applied to an Electronic System. IEEE Lat. Am. Trans. 2020, 18, 581–588, . [CrossRef]
- Hespanha, J. P. (2018, February 13). Linear Systems Theory. Princeton University Press.
- Pérez, P. A., Albertos, P., Sala, D. A., & Antonio, S. (2004, January 1). Multivariable Control Systems. Springer Science & Business Media.
- Skogestad, S., & Postlethwaite, I. (2005, November 4). Multivariable Feedback Control. John Wiley & Sons.
- Stevens, B.L.; Lewis, F.L. Aircraft Control and Simulation. Aircr. Eng. Aerosp. Technol. 2004, 76, . [CrossRef]
- K. J. Aström and T. Hägglund. PID Controllers: Theory, Design, and Tuning. Instrument Society of America, Research Triangle Park, NC, 1995.
- K. J. Aström, K. H. Johansson, and Q. Wang. Design of Decoupled PID Controllers, for MIMO Systems. In: Proceedings of the American Control Conference, Arlington, VA, USA, 27 June 2001, pp. 2015-2020.
- Erickson RW, Maksimovic D. Fundamentals of power electronics. 2 Edition. Kluwer Academic Publishers; 2001.
Figure 1.
A two-output SIMO DC–DC buck converter system.
Figure 1.
A two-output SIMO DC–DC buck converter system.
Figure 2.
Simulation evaluation of switch duty cycle changes and corresponding output voltage variations.
Figure 2.
Simulation evaluation of switch duty cycle changes and corresponding output voltage variations.
Figure 3.
Maximum singular values of S(z-1) and T(z-1) for the uncompensated system.
Figure 3.
Maximum singular values of S(z-1) and T(z-1) for the uncompensated system.
Figure 4.
Maximum singular values of S(z-1) and T(z-1) for the compensated system.
Figure 4.
Maximum singular values of S(z-1) and T(z-1) for the compensated system.
Figure 5.
Overview of the single inductor multiple output DC-DC converter test system developed for the experimental tests.
Figure 5.
Overview of the single inductor multiple output DC-DC converter test system developed for the experimental tests.
Figure 6.
Experimental results for a step variation on the value of the input source voltage in the single inductor dual output converter system, using LQR strategy and Decoupled PI structure.
Figure 6.
Experimental results for a step variation on the value of the input source voltage in the single inductor dual output converter system, using LQR strategy and Decoupled PI structure.
Figure 7.
Experimental results for the test of load variation R1 in output 1 of the single inductor dual output converter system, using LQR strategy and Decoupled PI structure.
Figure 7.
Experimental results for the test of load variation R1 in output 1 of the single inductor dual output converter system, using LQR strategy and Decoupled PI structure.
Figure 8.
Experimental results for the test of load variation R2 in output 2 of the single inductor dual output converter system, using LQR strategy and Decoupled PI structure.
Figure 8.
Experimental results for the test of load variation R2 in output 2 of the single inductor dual output converter system, using LQR strategy and Decoupled PI structure.
Figure 9.
Experimental results for the test of power variation of the CPL1 in output 1 of the single inductor dual output converter system, using LQR strategy and Decoupled PI structure.
Figure 9.
Experimental results for the test of power variation of the CPL1 in output 1 of the single inductor dual output converter system, using LQR strategy and Decoupled PI structure.
Figure 10.
Experimental results for the test of power variation of the CPL2 in output 2 of the single inductor dual output converter system, using LQR strategy and decoupled PI structure.
Figure 10.
Experimental results for the test of power variation of the CPL2 in output 2 of the single inductor dual output converter system, using LQR strategy and decoupled PI structure.
Table 1.
DC – DC SIMO converter board test system parameters.
Table 1.
DC – DC SIMO converter board test system parameters.
| Parameter |
Unit |
Nom. Value |
Variation |
Description |
| Vin
|
V |
7 |
[6-7] |
Source input voltage |
| R1
|
Ω |
10 |
[5-10] |
Loading at output 1 |
| R2
|
Ω |
10 |
[5-10] |
Loading at output 2 |
| CPL1
|
W |
0.5 |
[0.6-0.5] |
Output power of CPL1 |
| CPL2
|
W |
0.25 |
[0.35-0.25] |
Output power of CPL2 |
| C1
|
µF |
2200 |
- |
Capacitor at output 1 |
| C2
|
µF |
1000 |
- |
Capacitor at output 2 |
| L |
µH |
330 |
- |
Inductor |
| D10
|
% |
40 |
- |
Operational point for duty cycle of output 1 |
| D20
|
% |
60 |
- |
Operational point for duty cycle of output 2 |
| V10
|
V |
3.11 |
- |
Operational point for output voltage 1 |
| V20
|
V |
1.74 |
- |
Operational point for output voltage 2 |
| I10
|
A |
0.311 |
- |
Operational point for current of the output 1 |
| I20
|
A |
0.174 |
- |
Operational point for current of the output 2 |
| fsw
|
kHz |
7.8 |
- |
Switching frequency |
| fs
|
kHz |
2.0 |
- |
Sampling frequency |
Table 2.
Values of the ISE and ISU indexes of the experimental data collected when the system submitted a parametric variation in input voltage.
Table 2.
Values of the ISE and ISU indexes of the experimental data collected when the system submitted a parametric variation in input voltage.
Table 3.
Values of the ISE and ISU indexes of the experimental data collected when the system submitted a parametric variation in load R1.
Table 3.
Values of the ISE and ISU indexes of the experimental data collected when the system submitted a parametric variation in load R1.
Table 4.
Values of the ISE and ISU indexes of the experimental data collected when the system submitted a parametric variation in load R2.
Table 4.
Values of the ISE and ISU indexes of the experimental data collected when the system submitted a parametric variation in load R2.
Table 5.
Values of the ISE and ISU indexes of the experimental data collected when the system submitted a parametric variation in the added CPL1.
Table 5.
Values of the ISE and ISU indexes of the experimental data collected when the system submitted a parametric variation in the added CPL1.
Table 6.
Values of the ISE and ISU indexes of the experimental data collected when the system submitted a parametric variation in the added CPL2.
Table 6.
Values of the ISE and ISU indexes of the experimental data collected when the system submitted a parametric variation in the added CPL2.
|
Disclaimer/Publisher’s Note: The statements, opinions and data contained in all publications are solely those of the individual author(s) and contributor(s) and not of MDPI and/or the editor(s). MDPI and/or the editor(s) disclaim responsibility for any injury to people or property resulting from any ideas, methods, instructions or products referred to in the content. |
© 2024 by the authors. Licensee MDPI, Basel, Switzerland. This article is an open access article distributed under the terms and conditions of the Creative Commons Attribution (CC BY) license (http://creativecommons.org/licenses/by/4.0/).
