Submitted:
05 April 2024
Posted:
05 April 2024
You are already at the latest version
Abstract
Keywords:
1. Introduction
2. Data and Methods
2.1. Study Area
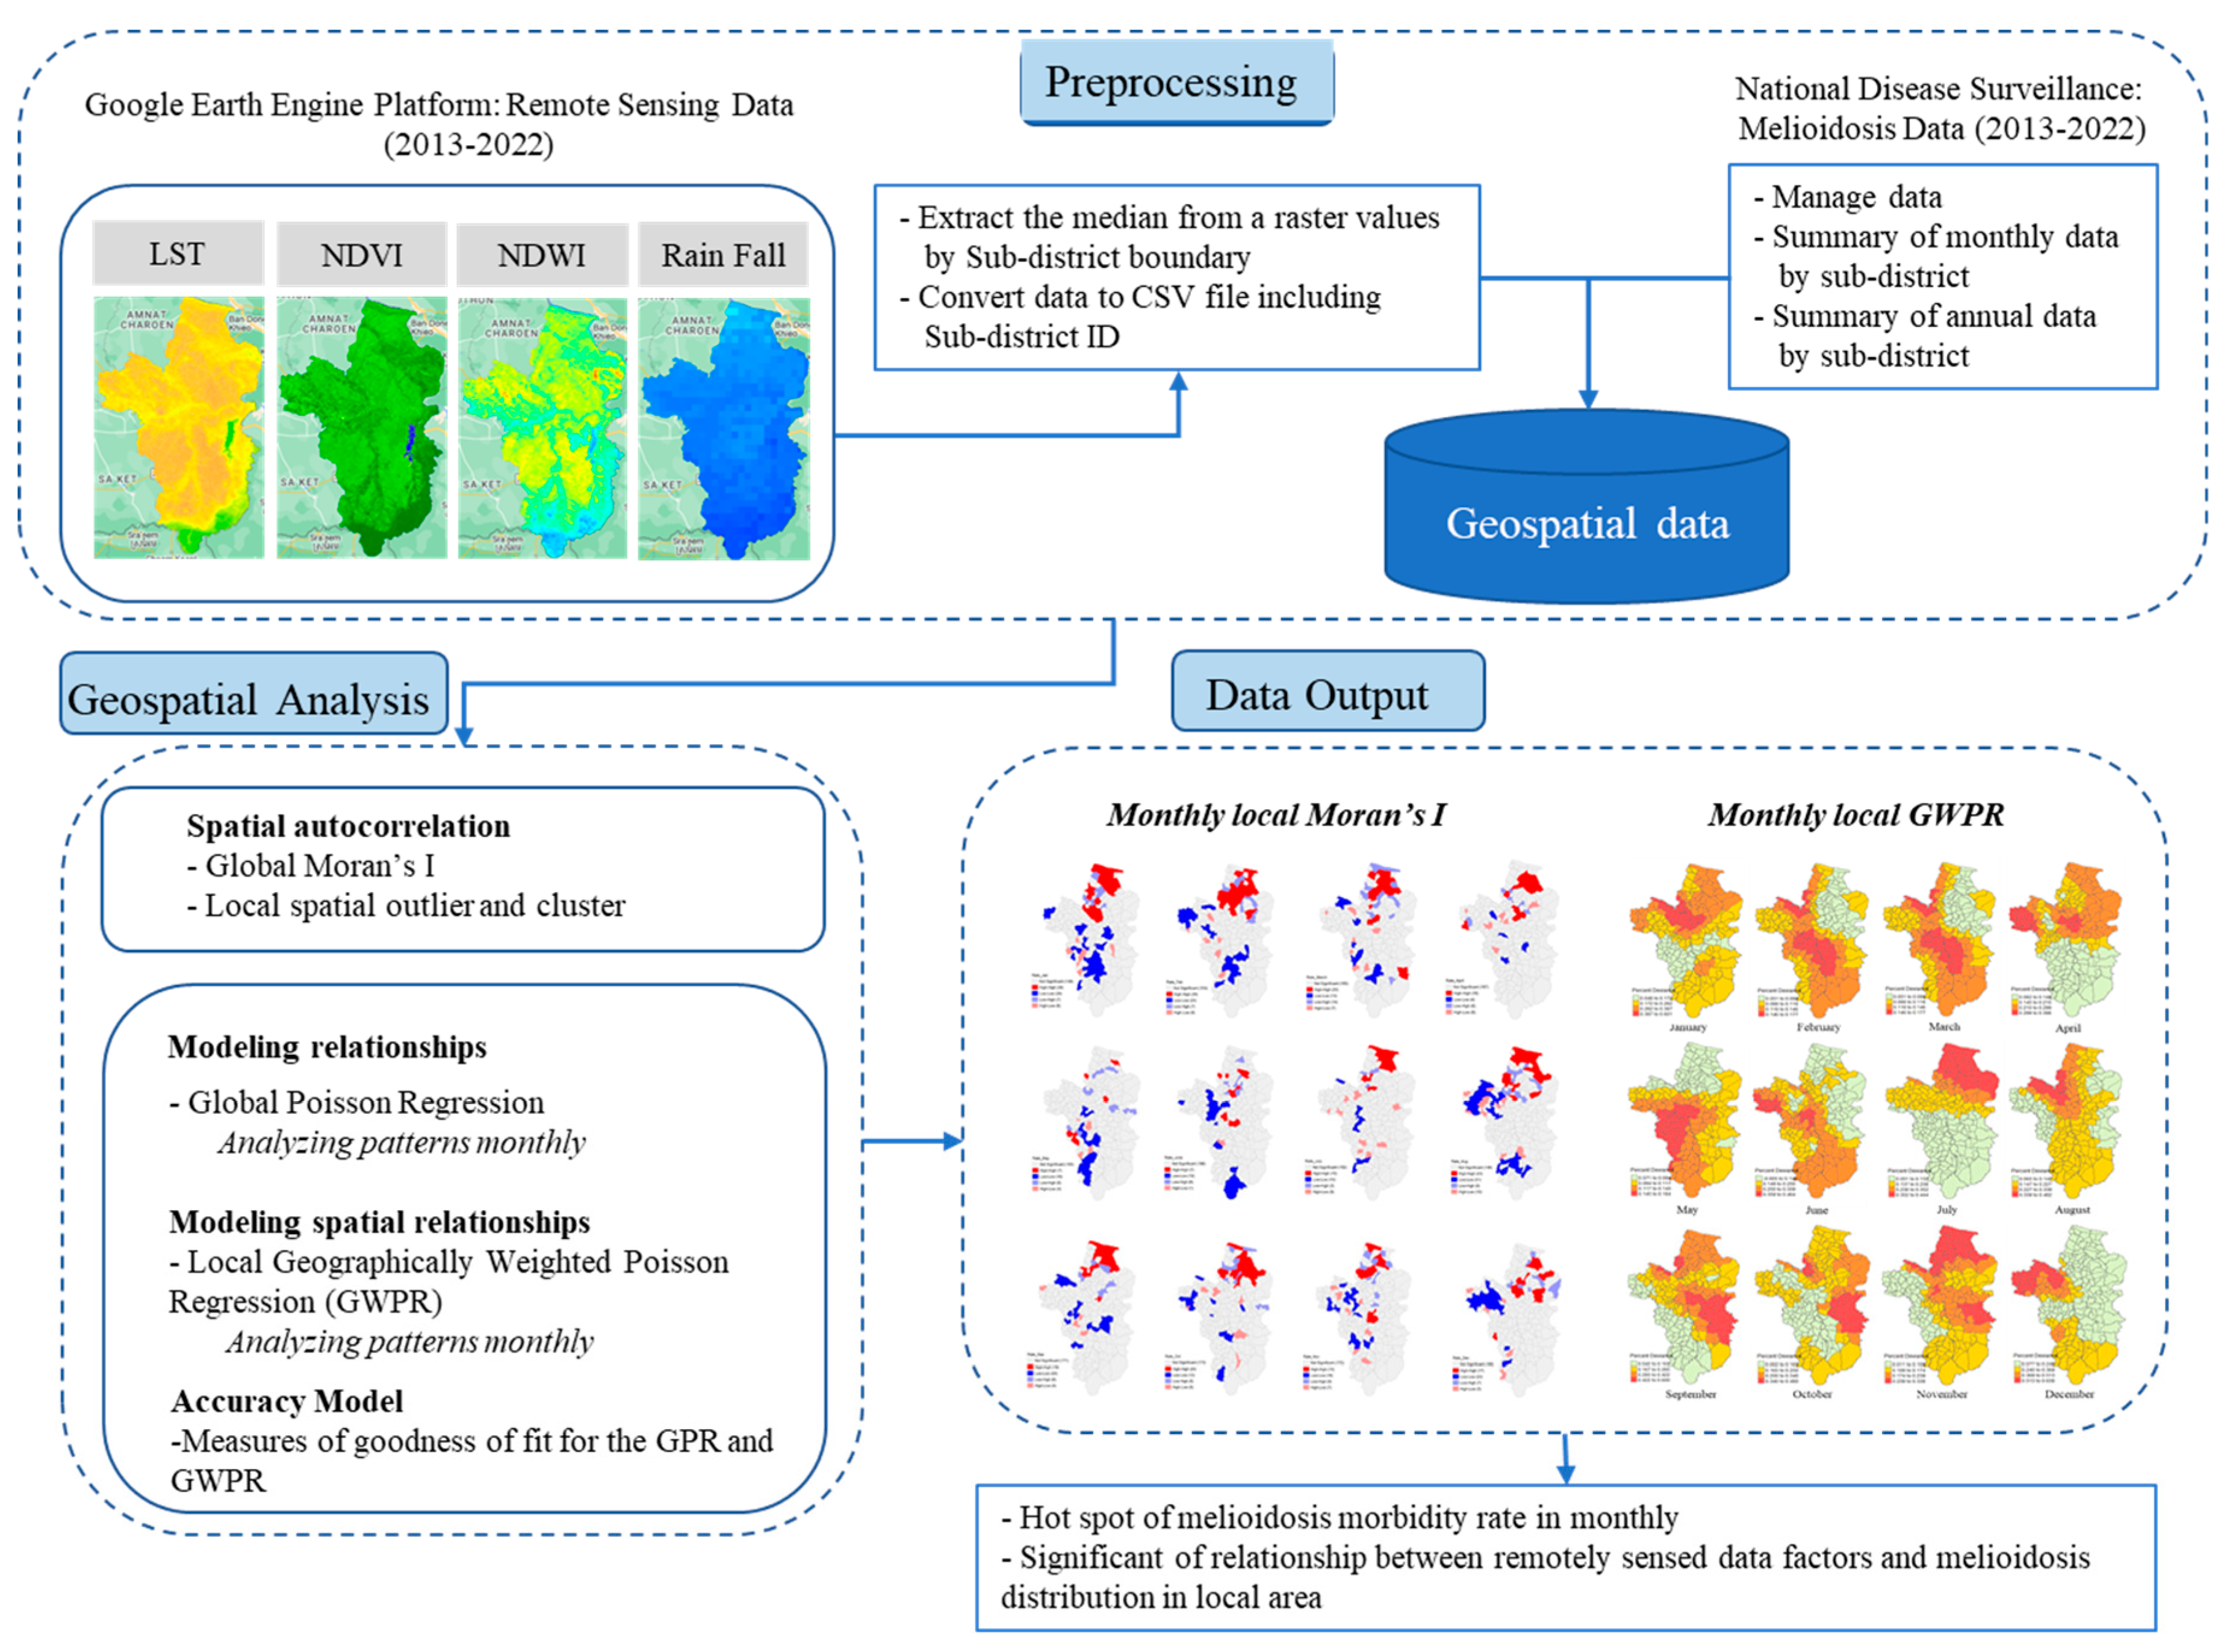
2.2. Conceptual Framework
2.3. Melioidosis Data
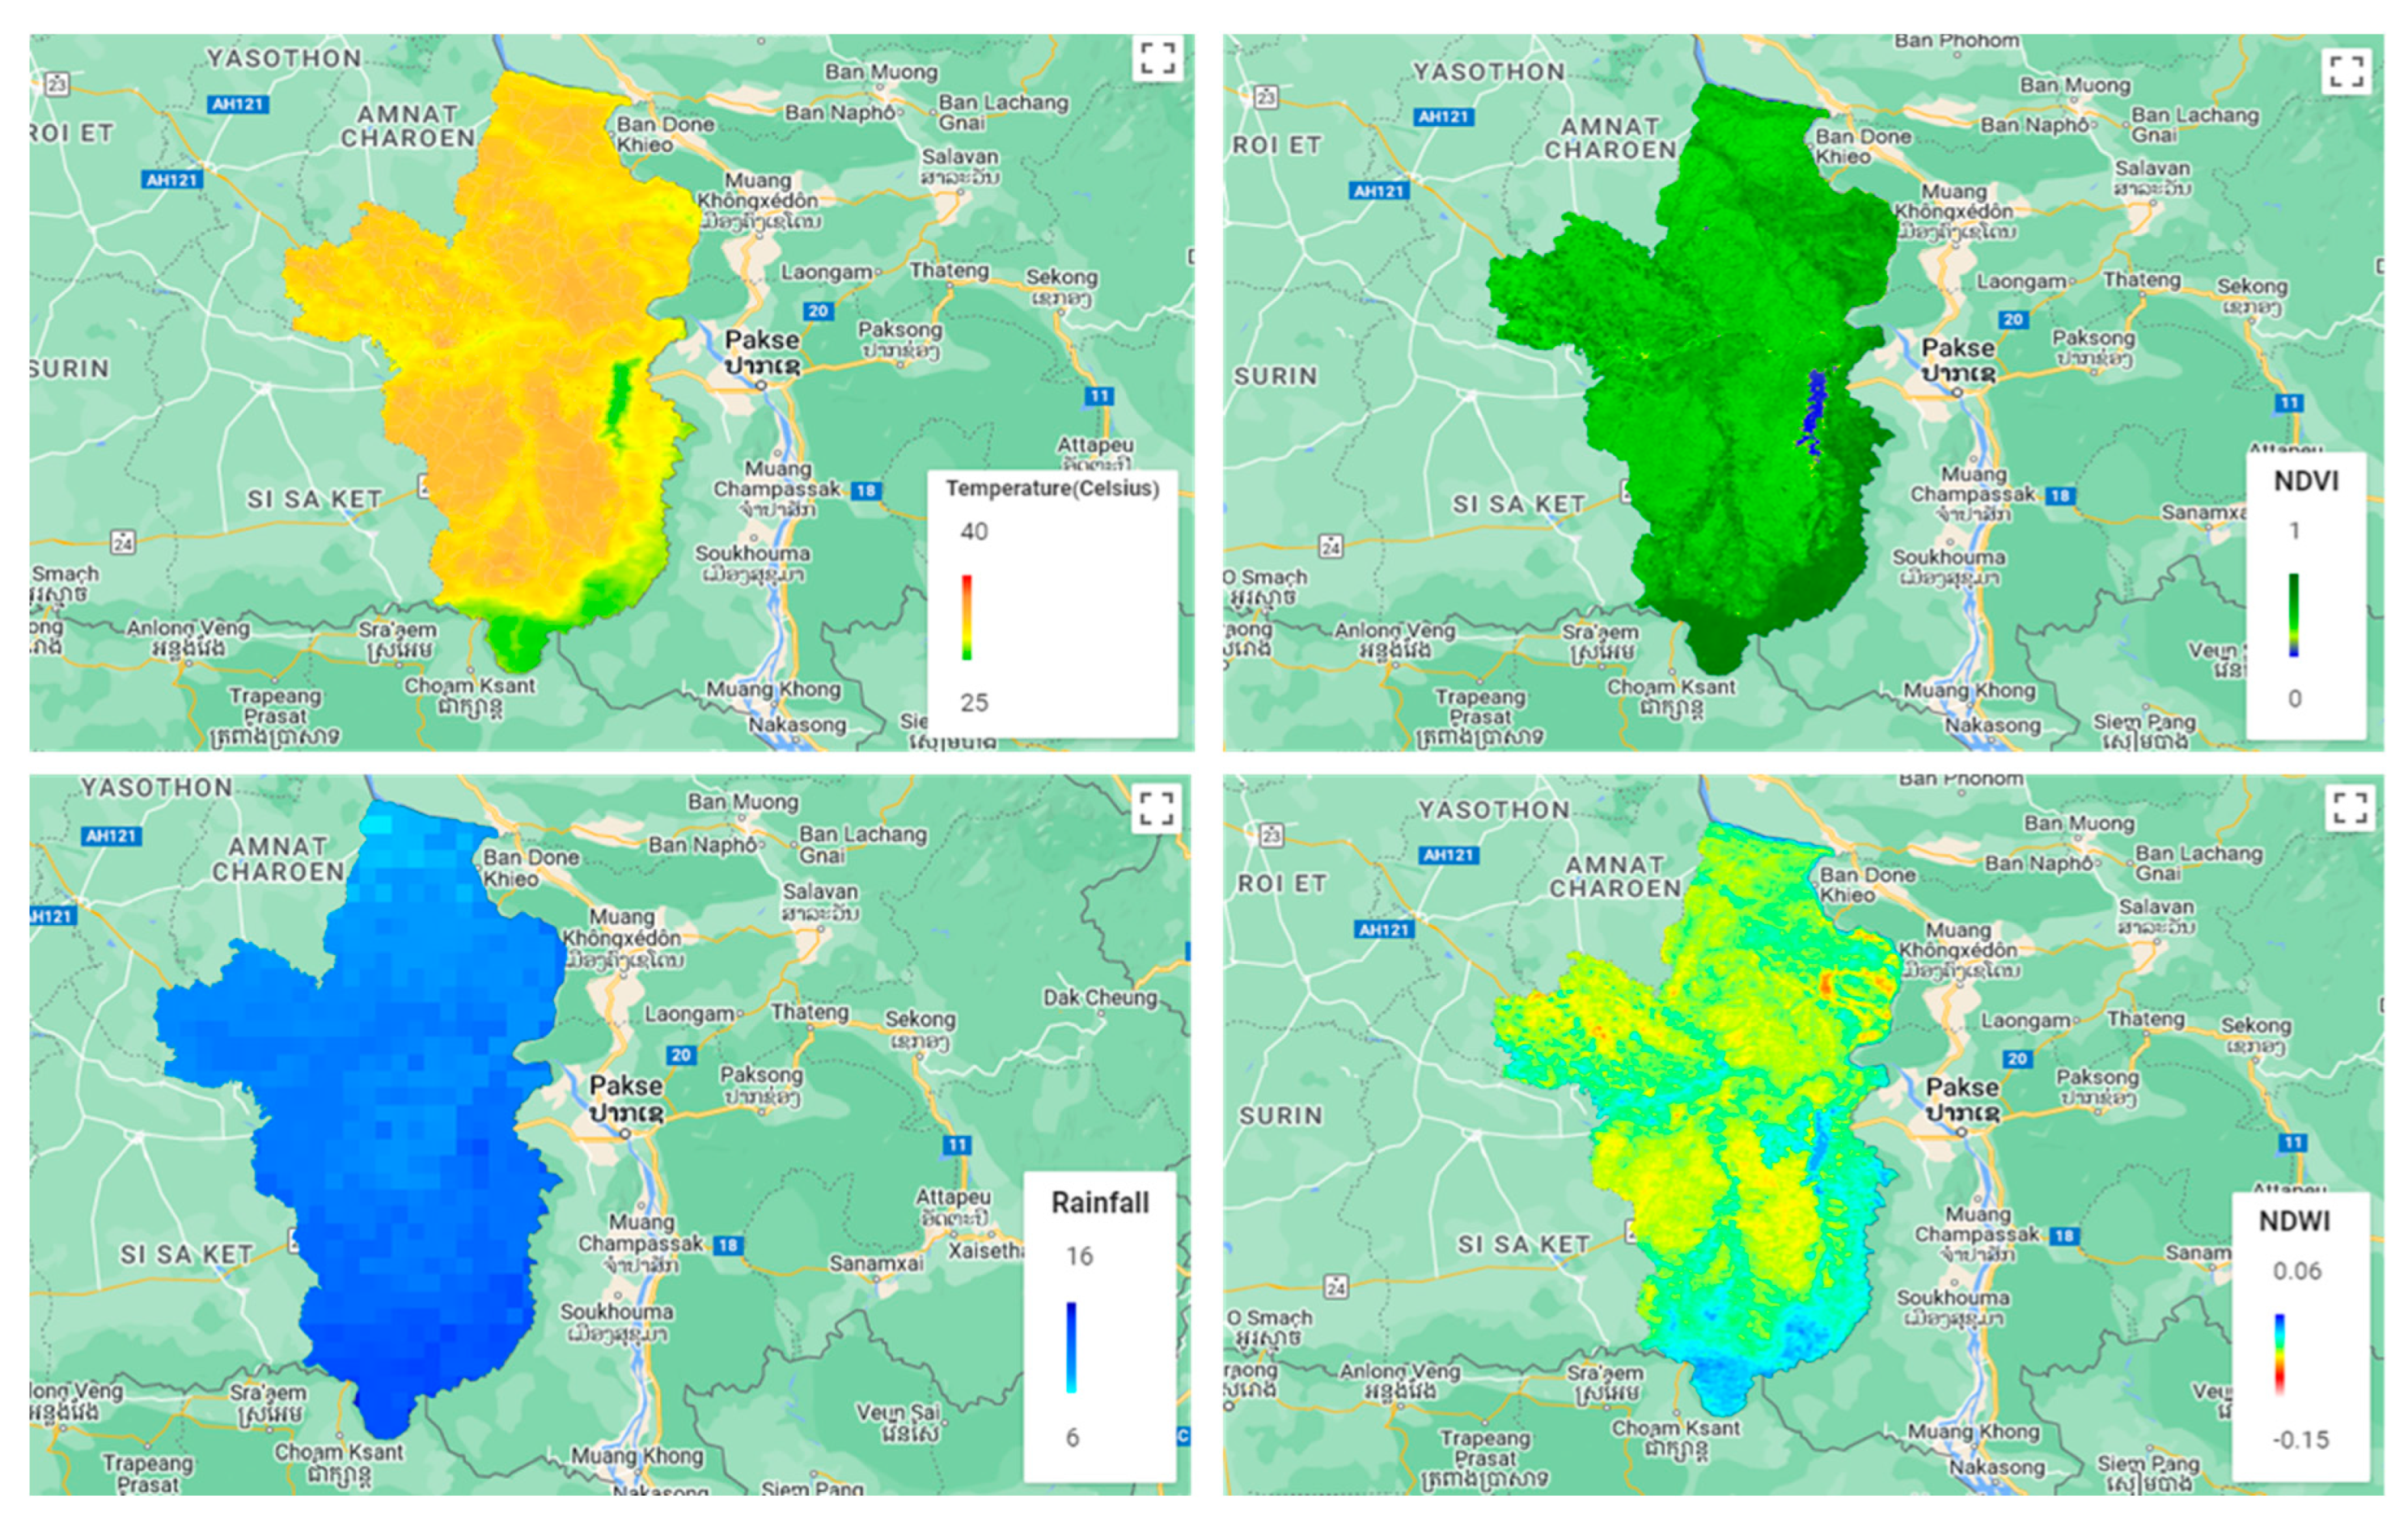
2.4. Spatial Data
2.4.1. LST
2.4.2. Vegetation
2.4.3. Soil Moisture
2.4.4. Rainfall
2.5. Data Preparation and Pre-Processing
2.6. Spatial Statistics
2.6.1. Spatial Autocorrelation
2.6.2. Global Poisson Regression (GPR)
2.6.3. Local Poisson Regression
3. Results
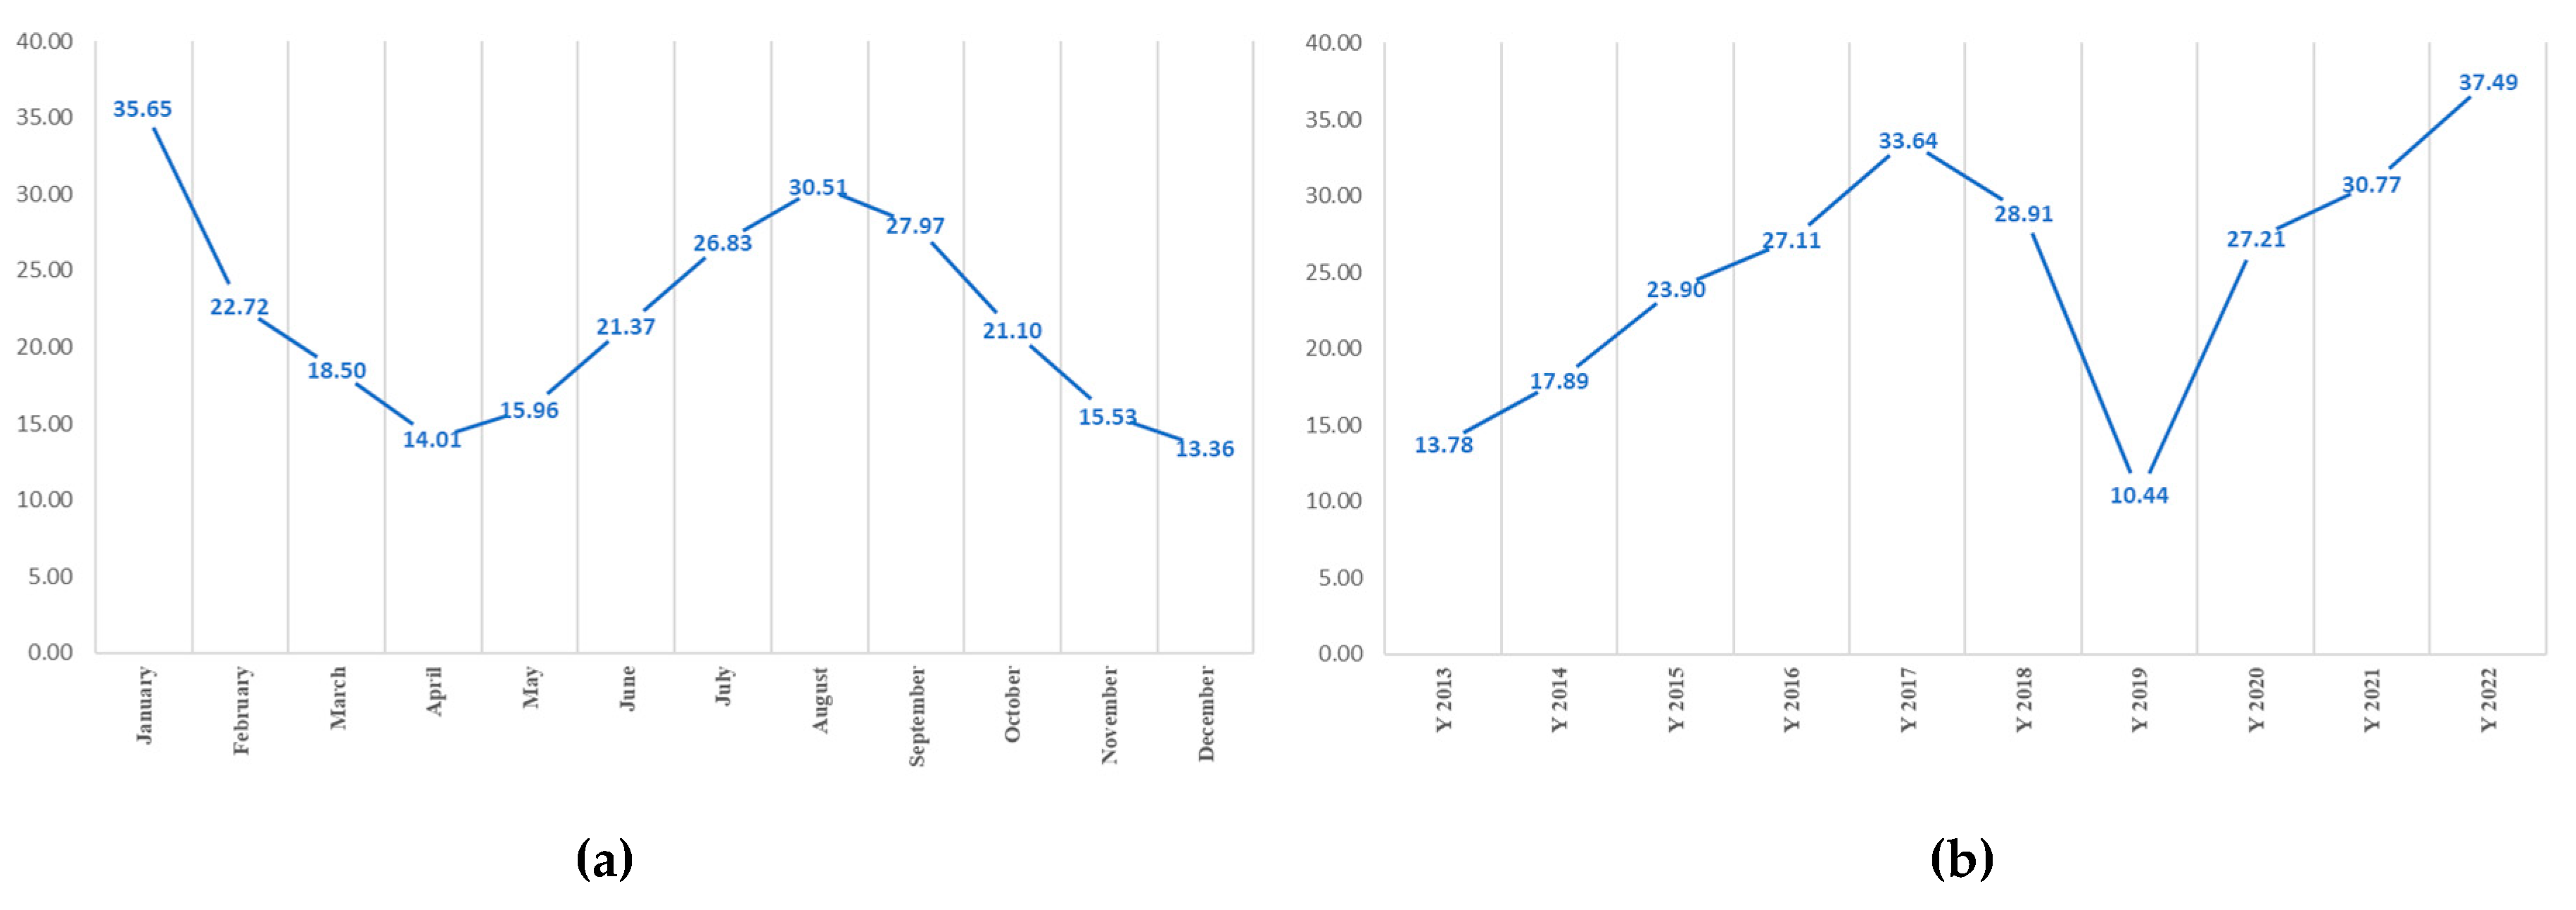
3.1. Melioidosis Morbidity Rate
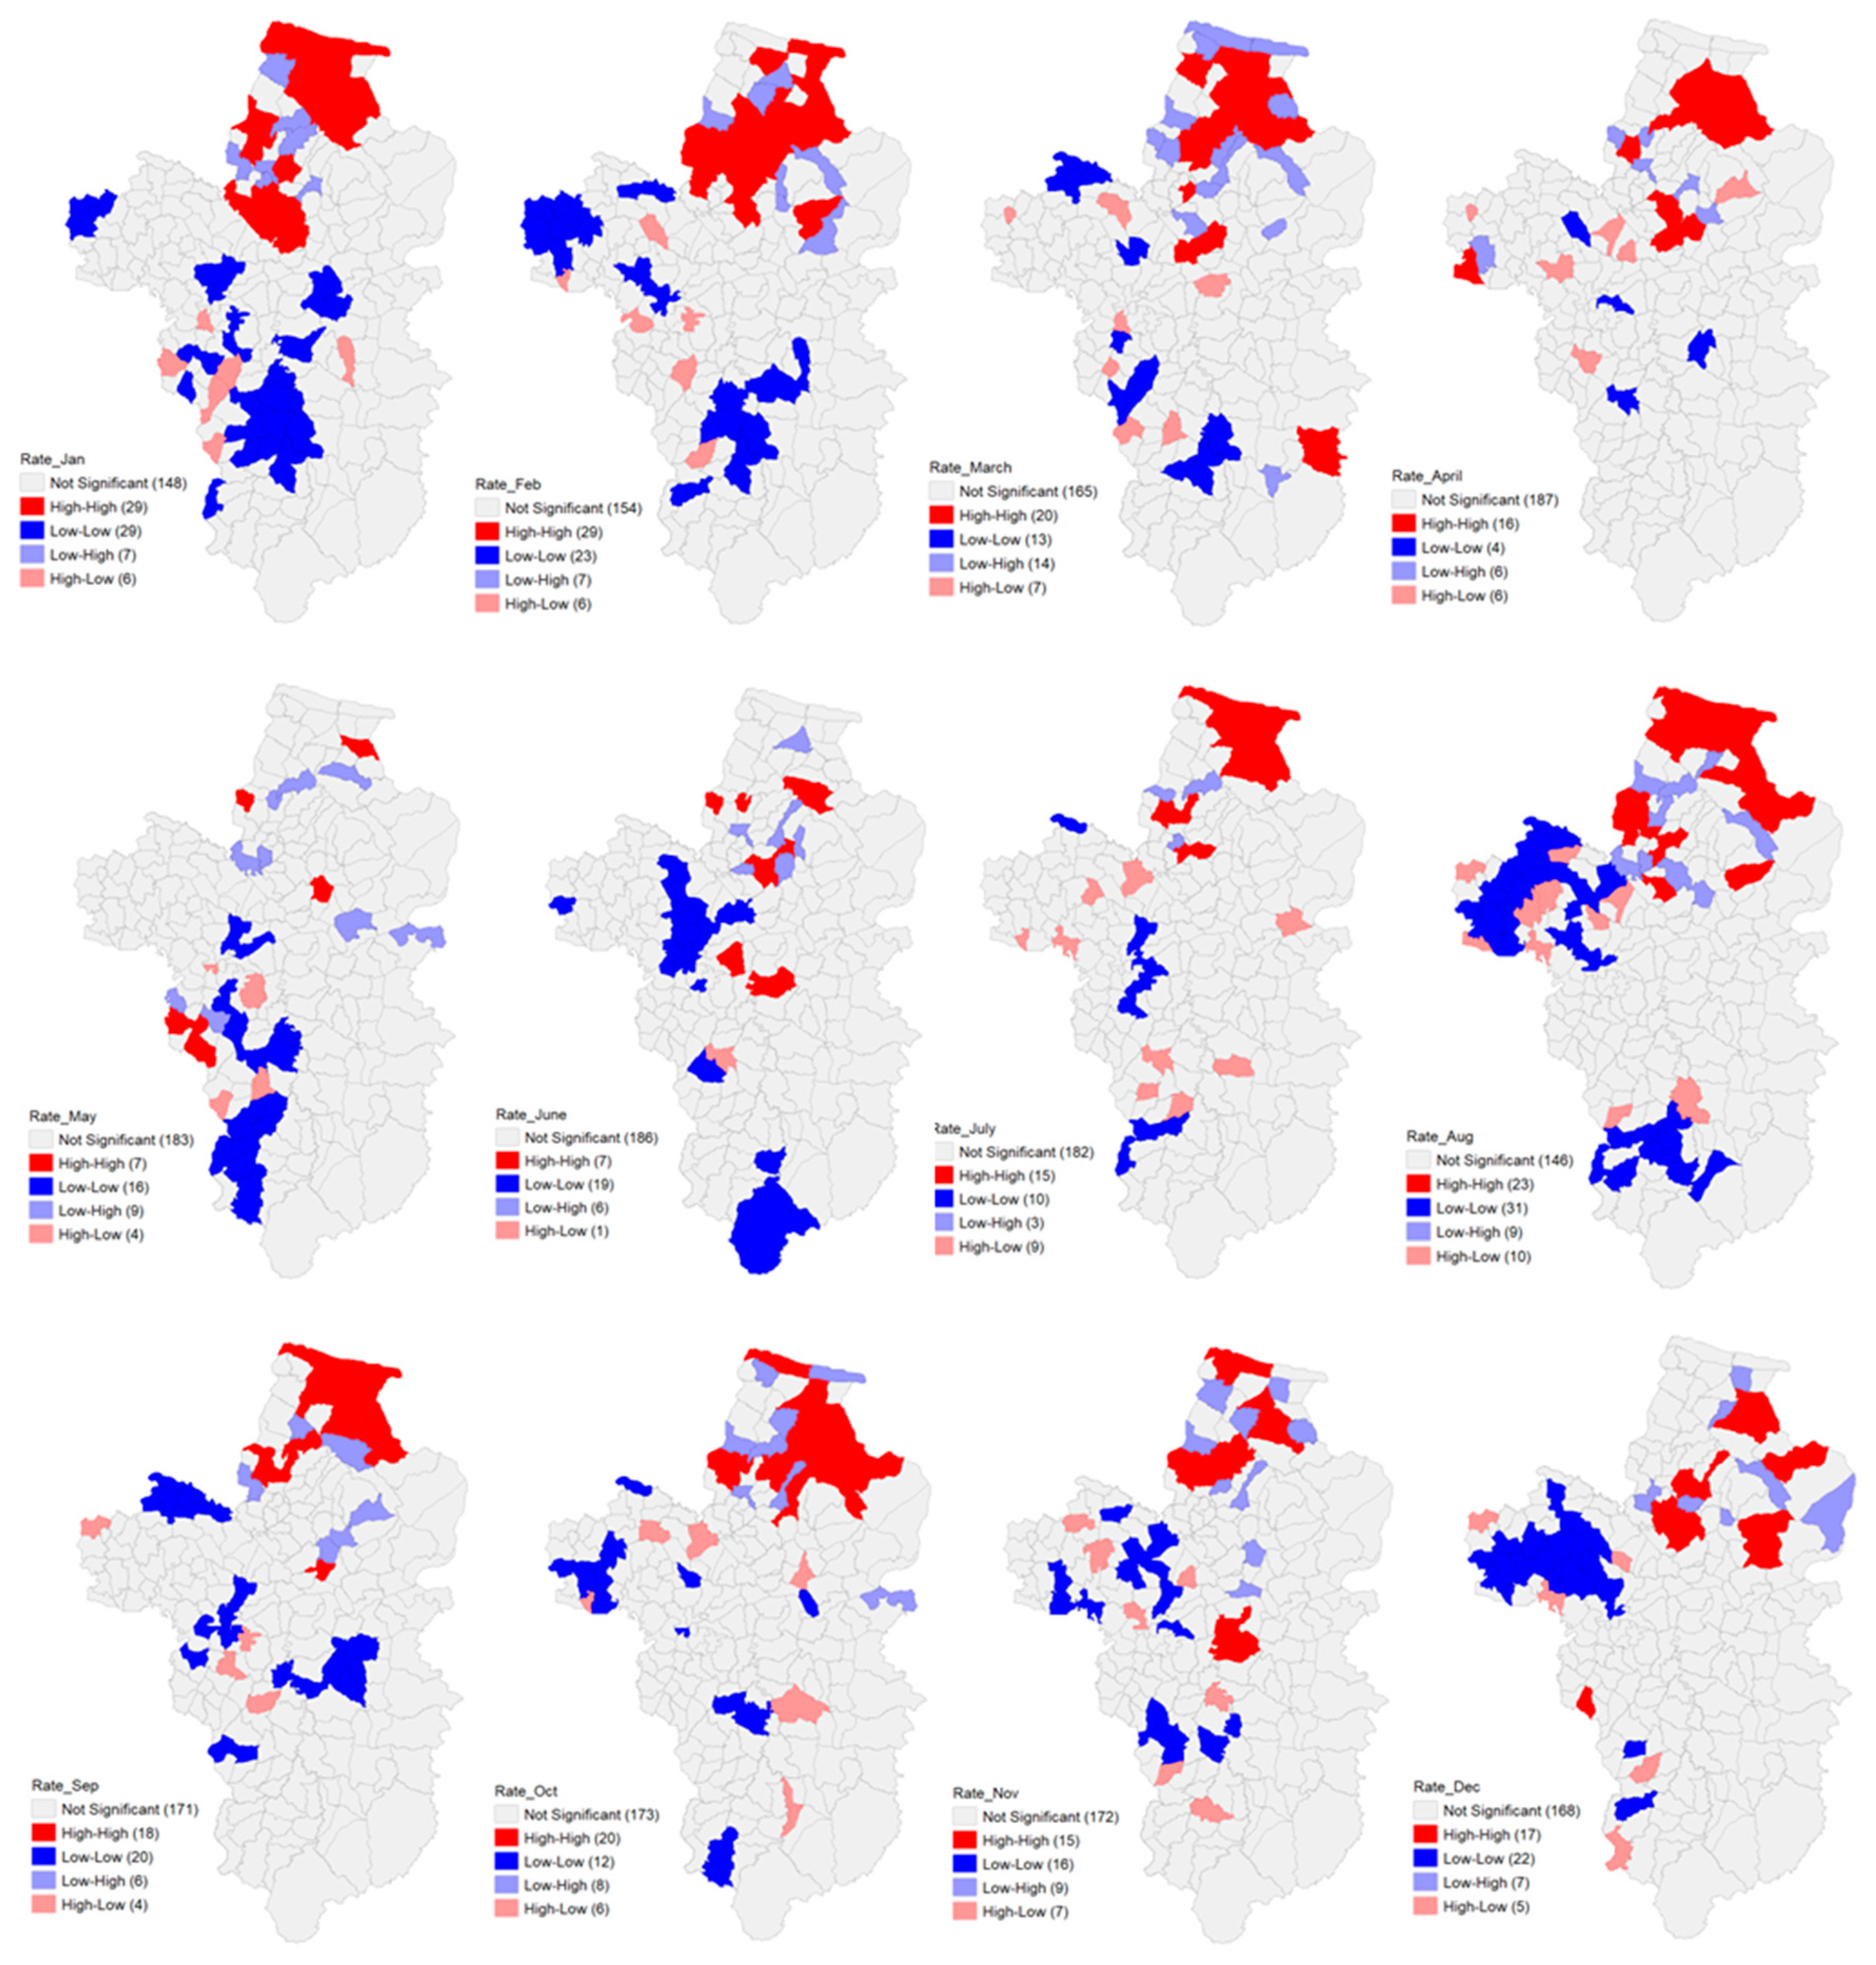
3.2. Spatial Autocorrelation
3.3. GPR Model
3.4. Local Poisson Regression
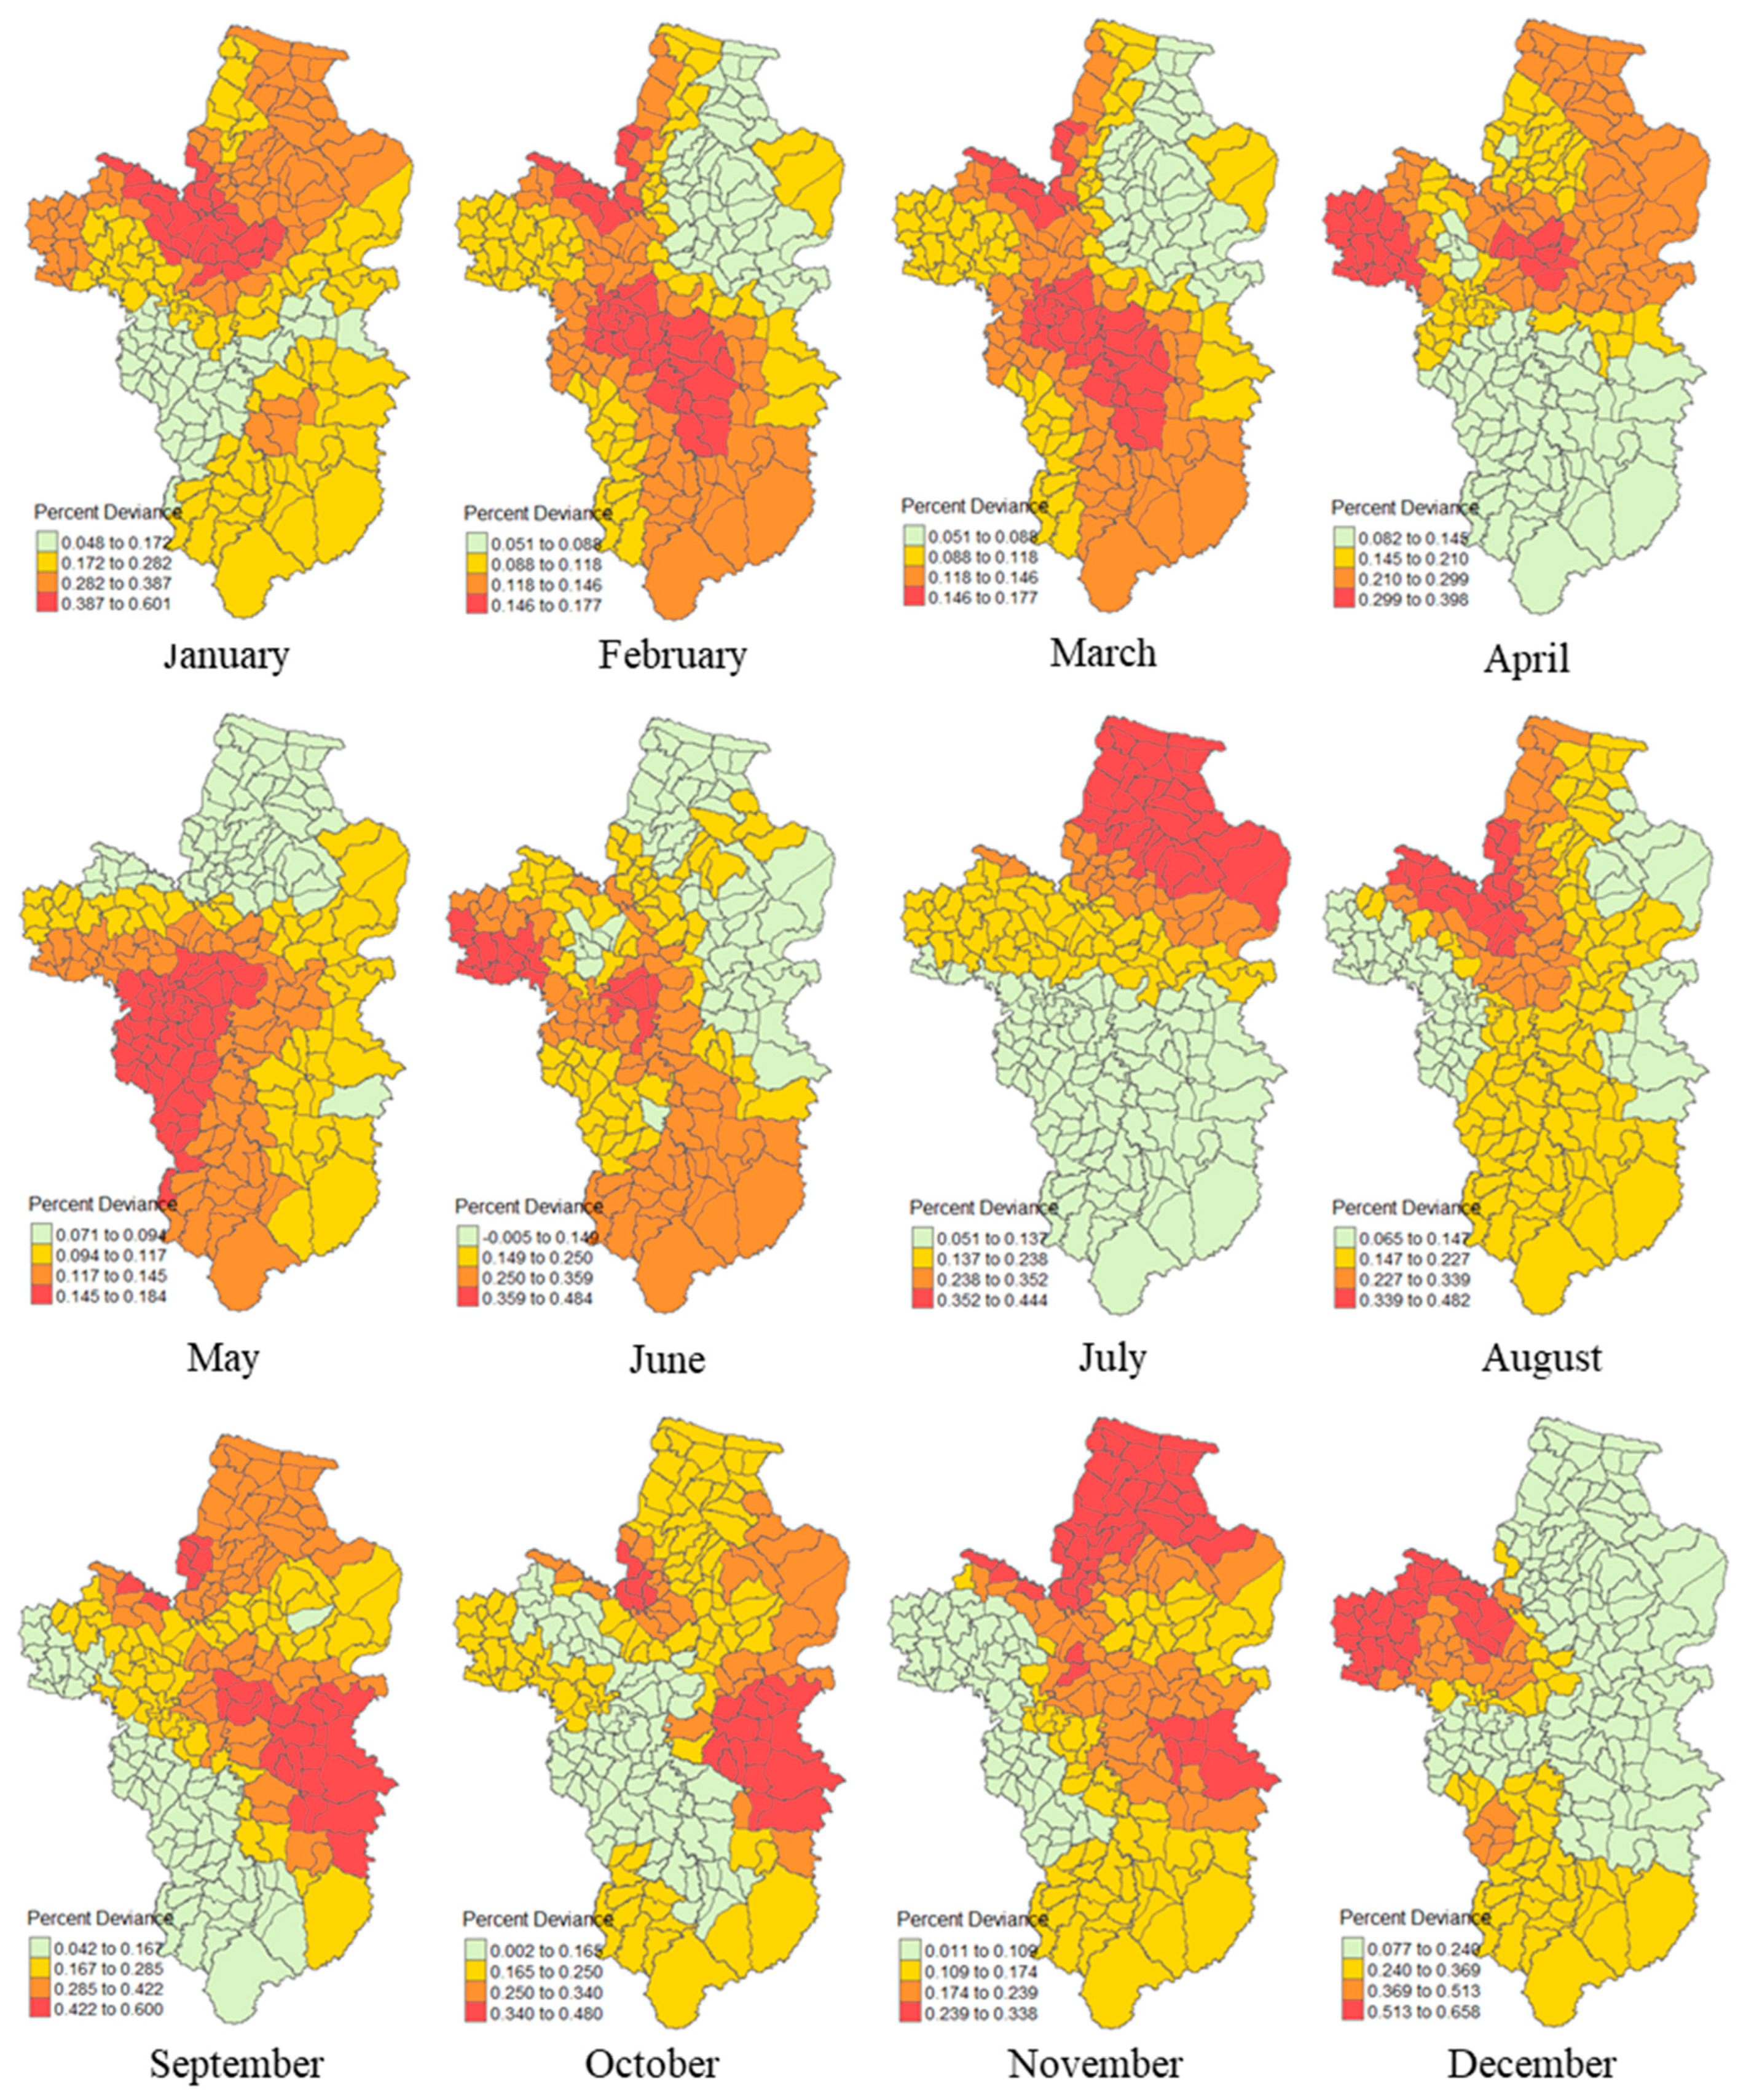
3.5. Local Percent Deviance
3.6. Comparison between GPR and GWPR
4. Discussion
5. Conclusions
Supplementary Materials
Author Contributions
Funding
Data Availability Statement
Acknowledgments
Conflicts of Interest
References
- Currie, B. J.; Dance, D. A.; Cheng, A. C., The global distribution of Burkholderia pseudomallei and melioidosis: an update. Trans R Soc Trop Med Hyg 2008, 102 Suppl 1, S1-4. [CrossRef]
- Corkeron, M. L.; Norton, R.; Nelson, P. N., Spatial analysis of melioidosis distribution in a suburban area. Epidemiol Infect 2010, 138 (9), 1346-52. [CrossRef]
- Limmathurotsakul, D.; Golding, N.; Dance, D. A.; Messina, J. P.; Pigott, D. M.; Moyes, C. L.; Rolim, D. B.; Bertherat, E.; Day, N. P.; Peacock, S. J.; Hay, S. I., Predicted global distribution of Burkholderia pseudomallei and burden of melioidosis. Nat Microbiol 2016, 1 (1). [CrossRef]
- Wiersinga, W. J.; Virk, H. S.; Torres, A. G.; Currie, B. J.; Peacock, S. J.; Dance, D. A. B.; Limmathurotsakul, D., Melioidosis. Nature Reviews Disease Primers 2018, 4 (1), 17107.
- Liu, X.; Pang, L.; Sim, S. H.; Goh, K. T.; Ravikumar, S.; Win, M. S.; Tan, G.; Cook, A. R.; Fisher, D.; Chai, L. Y., Association of melioidosis incidence with rainfall and humidity, Singapore, 2003-2012. Emerg Infect Dis 2015, 21 (1), 159-62. [CrossRef]
- Bulterys, P. L.; Bulterys, M. A.; Phommasone, K.; Luangraj, M.; Mayxay, M.; Kloprogge, S.; Miliya, T.; Vongsouvath, M.; Newton, P. N.; Phetsouvanh, R.; French, C. T.; Miller, J. F.; Turner, P.; Dance, D. A. B., Climatic drivers of melioidosis in Laos and Cambodia: a 16-year case series analysis. Lancet Planet Health 2018, 2 (8), e334-e343. [CrossRef]
- Kaewpan, A.; Duangurai, T.; Rungruengkitkun, A.; Muangkaew, W.; Kanjanapruthipong, T.; Jitprasutwit, N.; Ampawong, S.; Sukphopetch, P.; Chantratita, N.; Pumirat, P., Burkholderia pseudomallei pathogenesis in human skin fibroblasts: A Bsa type III secretion system is involved in the invasion, multinucleated giant cell formation, and cellular damage. PLoS One 2022, 17 (2), e0261961. [CrossRef]
- Limmathurotsakul, D.; Dance, D. A.; Wuthiekanun, V.; Kaestli, M.; Mayo, M.; Warner, J.; Wagner, D. M.; Tuanyok, A.; Wertheim, H.; Yoke Cheng, T.; Mukhopadhyay, C.; Puthucheary, S.; Day, N. P.; Steinmetz, I.; Currie, B. J.; Peacock, S. J., Systematic review and consensus guidelines for environmental sampling of Burkholderia pseudomallei. PLoS Negl Trop Dis 2013, 7 (3), e2105. [CrossRef]
- Chen, Y. S.; Chen, S. C.; Kao, C. M.; Chen, Y. L., Effects of soil pH, temperature and water content on the growth of Burkholderia pseudomallei. Folia Microbiol (Praha) 2003, 48 (2), 253-6.
- Palasatien, S.; Lertsirivorakul, R.; Royros, P.; Wongratanacheewin, S.; Sermswan, R. W., Soil physicochemical properties related to the presence of Burkholderia pseudomallei. Trans R Soc Trop Med Hyg 2008, 102 Suppl 1, S5-9. [CrossRef]
- Tong, S.; Yang, S.; Lu, Z.; He, W., Laboratory investigation of ecological factors influencing the environmental presence of Burkholderia pseudomallei. Microbiol Immunol 1996, 40 (6), 451-3. [CrossRef]
- McMichael, A. J.; Lindgren, E., Climate change: present and future risks to health, and necessary responses. J Intern Med 2011, 270 (5), 401-13. [CrossRef]
- Guo, Y.; Gasparrini, A.; Armstrong, B. G.; Tawatsupa, B.; Tobias, A.; Lavigne, E.; Coelho, M.; Pan, X.; Kim, H.; Hashizume, M.; Honda, Y.; Guo, Y. L.; Wu, C. F.; Zanobetti, A.; Schwartz, J. D.; Bell, M. L.; Scortichini, M.; Michelozzi, P.; Punnasiri, K.; Li, S.; Tian, L.; Garcia, S. D. O.; Seposo, X.; Overcenco, A.; Zeka, A.; Goodman, P.; Dang, T. N.; Dung, D. V.; Mayvaneh, F.; Saldiva, P. H. N.; Williams, G.; Tong, S., Heat Wave and Mortality: A Multicountry, Multicommunity Study. Environ Health Perspect 2017, 125 (8), 087006. [CrossRef]
- Chai, L. Y. A.; Fisher, D., Earth, wind, rain, and melioidosis. Lancet Planet Health 2018, 2 (8), e329-e330.
- Kamal, A.; Al-Montakim, M. N.; Hasan, M. A.; Mitu, M. M. P.; Gazi, M. Y.; Uddin, M. M.; Mia, M. B., Relationship between Urban Environmental Components and Dengue Prevalence in Dhaka City-An Approach of Spatial Analysis of Satellite Remote Sensing, Hydro-Climatic, and Census Dengue Data. Int J Environ Res Public Health 2023, 20 (5).
- Sewe, M. O.; Ahlm, C.; Rocklöv, J., Remotely Sensed Environmental Conditions and Malaria Mortality in Three Malaria Endemic Regions in Western Kenya. PLoS One 2016, 11 (4), e0154204. [CrossRef]
- Dhewantara, P. W.; Hu, W.; Zhang, W.; Yin, W. W.; Ding, F.; Mamun, A. A.; Soares Magalhães, R. J., Climate variability, satellite-derived physical environmental data and human leptospirosis: A retrospective ecological study in China. Environ Res 2019, 176, 108523. [CrossRef]
- Goodrick, I.; Stewart, J.; Todd, G., Soil characteristics influencing the spatial distribution of melioidosis in Far North Queensland, Australia. Epidemiology and Infection 2018, 146 (12), 1602-1607. [CrossRef]
- Kanjaras, P.; Bumrerraj, S.; Seng, R.; Noradee, S.; Nithikathkul, C., Geospatial Analysis and Modeling of Melioidosis Prevention and Control in Si Sa Ket Province, Thailand. Journal of Geoinformatics 2023, 19 (1), 57-65. [CrossRef]
- Wongbutdee, J.; Saengnill, W.; Jittimanee, J.; Panomket, P.; Saenwang, P., The Association between the Mapping Distribution of Melioidosis Incidences and Meteorological Factors in an Endemic Area: Ubon Ratchathani, Thailand (2009–2018). Chiang Mai University (CMU) Journal of Natural Sciences 2021, 20 (4). [CrossRef]
- Wongbutdee, J.; Jittimanee, J.; Saengnill, W., Spatiotemporal distribution and geostatistically interpolated mapping of the melioidosis risk in an endemic zone in Thailand. Geospat Health 2023, 18 (2). [CrossRef]
- Wuthiekanun, V.; Mayxay, M.; Chierakul, W.; Phetsouvanh, R.; Cheng, A. C.; White, N. J.; Day, N. P.; Peacock, S. J., Detection of Burkholderia pseudomallei in soil within the Lao People's Democratic Republic. J Clin Microbiol 2005, 43 (2), 923-4.
- Limmathurotsakul, D.; Wuthiekanun, V.; Chantratita, N.; Wongsuvan, G.; Amornchai, P.; Day, N. P. J.; Peacock, S. J., Burkholderia pseudomallei Is Spatially Distributed in Soil in Northeast Thailand. PLOS Neglected Tropical Diseases 2010, 4 (6), e694. [CrossRef]
- Saengnill, W.; Charoenjit, K.; Hrimpeng, K.; Jittimanee, J., Mapping the probability of detecting Burkholderia pseudomallei in rural rice paddy soil based on indicator kriging and spatial soil factor analysis. Trans R Soc Trop Med Hyg 2020, 114 (7), 521-530. [CrossRef]
- Wimberly, M. C.; Nekorchuk, D. M.; Kankanala, R. R., Cloud-based applications for accessing satellite Earth observations to support malaria early warning. Sci Data 2022, 9 (1), 208. [CrossRef]
- Li, Z.; Gurgel, H.; Xu, L.; Yang, L.; Dong, J., Improving Dengue Forecasts by Using Geospatial Big Data Analysis in Google Earth Engine and the Historical Dengue Information-Aided Long Short Term Memory Modeling. Biology (Basel) 2022, 11 (2). [CrossRef]
- Ghosh, S.; Kumar, D.; Kumari, R., Google earth engine based computational system for the earth and environment monitoring applications during the COVID-19 pandemic using thresholding technique on SAR datasets. Phys Chem Earth (2002) 2022, 127, 103163. [CrossRef]
- Nafiz Rahaman, S.; Shehzad, T.; Sultana, M., Effect of Seasonal Land Surface Temperature Variation on COVID-19 Infection Rate: A Google Earth Engine-Based Remote Sensing Approach. Environ Health Insights 2022, 16, 11786302221131467. [CrossRef]
- Bureau of Epidemiology, D. o. D. C., Thailand. National Disease Surveillance (Report 506): Melioidosis. http://doe.moph.go.th/surdata/y62/rate_Melioidosis_62.rtf.
- Bureau of Epidemiology, D. o. D. C., Thailand. National Disease Surveillance (Report 506): Melioidosis. http://doe.moph.go.th/surdata/y63/mcd_Melioidosis_63.rtf.
- Tennekes, M., tmap: Thematic Maps in R. Journal of Statistical Software 2018, 84 (6), 1 - 39.
- Didan., K.; Barreto-Muñoz., A. MODIS Collection 6.1 (C61) VegetationIndex Product UserGuide. https://lpdaac.usgs.gov/documents/621/MOD13_User_Guide_V61.pdf (accessed 11 March 2024).
- Gao, B.-c., NDWI—A normalized difference water index for remote sensing of vegetation liquid water from space. Remote Sensing of Environment 1996, 58 (3), 257-266. [CrossRef]
- Ceccato, P.; Flasse, S.; Tarantola, S.; Jacquemoud, S.; Grégoire, J.-M., Detecting vegetation leaf water content using reflectance in the optical domain. Remote Sensing of Environment 2001, 77 (1), 22-33. [CrossRef]
- Funk, C.; Peterson, P.; Landsfeld, M.; Pedreros, D.; Verdin, J.; Shukla, S.; Husak, G.; Rowland, J.; Harrison, L.; Hoell, A.; Michaelsen, J., The climate hazards infrared precipitation with stations--a new environmental record for monitoring extremes. Sci Data 2015, 2, 150066.
- Chaithong, T. Flash Flood Susceptibility Assessment Based on Morphometric Aspects and Hydrological Approaches in the Pai River Basin, Mae Hong Son, Thailand Water [Online], 2022. [CrossRef]
- Puttanapong, N.; Martinez, A.; Bulan, J. A.; Addawe, M.; Durante, R. L.; Martillan, M. Predicting Poverty Using Geospatial Data in Thailand ISPRS International Journal of Geo-Information [Online], 2022.
- Rojpratak, S.; Supharatid, S., Regional-scale flood impacts on a small mountainous catchment in Thailand under a changing climate. Journal of Water and Climate Change 2023, 14 (12), 4782-4801.
- Nakaya, T.; Fotheringham, A. S.; Brunsdon, C.; Charlton, M., Geographically weighted Poisson regression for disease association mapping. Stat Med 2005, 24 (17), 2695-717.
- Fotheringham, A. S.; Brunsdon, C.; Charlton, M., Geographically weighted regression: the analysis of spatially varying relationships. John Wiley & Sons: 2003.
- Hadayeghi, A.; Shalaby, A.; Persaud, B., Development of Planning-Level Transportation Safety Models using Full Bayesian Semiparametric Additive Techniques. Journal of Transportation Safety & Security 2010, 2 (1), 45-68.
- Hantrakun, V.; Kongyu, S.; Klaytong, P.; Rongsumlee, S.; Day, N. P. J.; Peacock, S. J.; Hinjoy, S.; Limmathurotsakul, D., Clinical Epidemiology of 7126 Melioidosis Patients in Thailand and the Implications for a National Notifiable Diseases Surveillance System. Open Forum Infect Dis 2019, 6 (12), ofz498.
- Dai, D.; Chen, Y. S.; Chen, P. S.; Chen, Y. L., Case cluster shifting and contaminant source as determinants of melioidosis in Taiwan. Trop Med Int Health 2012, 17 (8), 1005-13.
- Seng, R.; Saiprom, N.; Phunpang, R.; Baltazar, C. J.; Boontawee, S.; Thodthasri, T.; Silakun, W.; Chantratita, N., Prevalence and genetic diversity of Burkholderia pseudomallei isolates in the environment near a patient's residence in Northeast Thailand. PLoS Negl Trop Dis 2019, 13 (4), e0007348. [CrossRef]
- Currie, B. J.; Jacups, S. P., Intensity of rainfall and severity of melioidosis, Australia. Emerg Infect Dis 2003, 9 (12), 1538-42. [CrossRef]
- Kaestli, M.; Grist, E. P. M.; Ward, L.; Hill, A.; Mayo, M.; Currie, B. J., The association of melioidosis with climatic factors in Darwin, Australia: A 23-year time-series analysis. J Infect 2016, 72 (6), 687-697.
- Mu, J. J.; Cheng, P. Y.; Chen, Y. S.; Chen, P. S.; Chen, Y. L., The occurrence of melioidosis is related to different climatic conditions in distinct topographical areas of Taiwan. Epidemiol Infect 2014, 142 (2), 415-23.
- Jiee, S.; Lim, K.; Choon Vui, D.; Marius, D.; Illyana, N.; Jantim, A., Extreme Weather and Melioidosis: An endemic tropical disease in Penampang district of Sabah, Malaysia. J Health Res 2023, 37 (5), 297-305. [CrossRef]
- Limmathurotsakul, D.; Wongratanacheewin, S.; Teerawattanasook, N.; Wongsuvan, G.; Chaisuksant, S.; Chetchotisakd, P.; Chaowagul, W.; Day, N. P.; Peacock, S. J., Increasing incidence of human melioidosis in Northeast Thailand. Am J Trop Med Hyg 2010, 82 (6), 1113-7. [CrossRef]
- John Braun, W.; Rousson, V., An autocorrelation criterion for bandwidth selection in nonparametric regression ∗. Journal of Statistical Computation and Simulation 2000, 68 (1), 89-101. [CrossRef]
- Tavares, J. P.; Costa, A. C. Spatial Modeling and Analysis of the Determinants of Property Crime in Portugal ISPRS International Journal of Geo-Information [Online], 2021.
- Zeleke, A. J.; Miglio, R.; Palumbo, P.; Tubertini, P.; Chiari, L., Spatiotemporal heterogeneity of SARS-CoV-2 diffusion at the city level using geographically weighted Poisson regression model: The case of Bologna, Italy. Geospat Health 2022, 17 (2).
- Paksanont, S.; Sintiprungrat, K.; Yimthin, T.; Pumirat, P.; Peacock, S. J.; Chantratita, N., Effect of temperature on Burkholderia pseudomallei growth, proteomic changes, motility and resistance to stress environments. Sci Rep 2018, 8 (1), 9167. [CrossRef]
- Kaestli, M.; Mayo, M.; Harrington, G.; Ward, L.; Watt, F.; Hill, J. V.; Cheng, A. C.; Currie, B. J., Landscape changes influence the occurrence of the melioidosis bacterium Burkholderia pseudomallei in soil in northern Australia. PLoS Negl Trop Dis 2009, 3 (1), e364. [CrossRef]
- Ribolzi, O.; Rochelle-Newall, E.; Dittrich, S.; Auda, Y.; Newton, P. N.; Rattanavong, S.; Knappik, M.; Soulileuth, B.; Sengtaheuanghoung, O.; Dance, D. A.; Pierret, A., Land use and soil type determine the presence of the pathogen Burkholderia pseudomallei in tropical rivers. Environ Sci Pollut Res Int 2016, 23 (8), 7828-39. [CrossRef]
- Shaw, T.; Assig, K.; Tellapragada, C.; Wagner, G. E.; Choudhary, M.; Göhler, A.; Eshwara, V. K.; Steinmetz, I.; Mukhopadhyay, C., Environmental Factors Associated With Soil Prevalence of the Melioidosis Pathogen Burkholderia pseudomallei: A Longitudinal Seasonal Study From South West India. Front Microbiol 2022, 13, 902996. [CrossRef]
- Kaestli, M.; Mayo, M.; Harrington, G.; Watt, F.; Hill, J.; Gal, D.; Currie, B. J., Sensitive and specific molecular detection of Burkholderia pseudomallei, the causative agent of melioidosis, in the soil of tropical northern Australia. Appl Environ Microbiol 2007, 73 (21), 6891-7.
- Chuah, C. J.; Tan, E. K. H.; Sermswan, R. W.; Ziegler, A. D., Hydrological connectivity and Burkholderia pseudomallei prevalence in wetland environments: investigating rice-farming community's risk of exposure to melioidosis in North-East Thailand. Environ Monit Assess 2017, 189 (6), 287. [CrossRef]
- Shaharudin, R.; Ahmad, N.; Kamaluddin, M. A.; Veloo, Y., DETECTION OF BURKHOLDERIA PSEUDOMALLEI FROM POST-FLOOD SOIL SAMPLES IN KELANTAN, MALAYSIA. Southeast Asian J Trop Med Public Health 2016, 47 (5), 951-6.
| Monthly | Moran’s I | Mean | S.D. | z-value | Pseudo p-Value |
|---|---|---|---|---|---|
| January | 0.462 | –0.004 | 0.039 | 11.673 | 0.002 |
| February | 0.317 | –0.007 | 0.040 | 8.021 | 0.002 |
| March | 0.162 | –0.004 | 0.039 | 4.178 | 0.004 |
| April | 0.187 | –0.007 | 0.042 | 4.639 | 0.002 |
| May | 0.068 | –0.008 | 0.038 | 1.990 | 0.042 |
| June | 0.076 | –0.005 | 0.042 | 1.913 | 0.034 |
| July | 0.246 | –0.006 | 0.038 | 6.570 | 0.002 |
| August | 0.351 | –0.0003 | 0.040 | 8.780 | 0.002 |
| September | 0.253 | –0.004 | 0.040 | 6.390 | 0.002 |
| October | 0.244 | –0.003 | 0.040 | 6.083 | 0.002 |
| November | 0.187 | –0.006 | 0.038 | 4.994 | 0.002 |
| December | 0.257 | –0.001 | 0.039 | 6.610 | 0.002 |
| Monthly | Intercept | LST | NDVI | NDWI | Rainfall |
|---|---|---|---|---|---|
| January | –4.546 | 0.135 | 1.82 | –2.329 | 0.077 |
| February | –2.289 | 0.046 | –0.055 | 1.34 | 0.16 |
| March | 2.804 | –0.082 | –0.193 | –6.077 | –0.025 |
| April | 1.762 | –0.054 | –3.555 | –6.519 | 0.005 |
| May | –0.546 | 0.004 | –1.581 | –10.219 | –0.003 |
| June | –2.625 | 0.073 | 3.209 | 4.1483 | –0.001 |
| July | 5.14 | –0.11 | –3.195 | 31.425 | 0.0008 |
| August | –2.808 | 0.045 | 0.72 | 34.014 | 0.003 |
| September | 2.068 | 0.033 | 0.705 | –8.659 | –0.003 |
| October | –2.948 | 0.056 | 6.686 | 1.9126 | –0.006 |
| November | 1.991 | –0.018 | –0.823 | 4.952 | –0.023 |
| December | 6.755 | –0.208 | 0.088 | –10.567 | 0.130 |
| Monthly | GPR | GWPR | Moran’s I | z-Score | p-Value | ||
|---|---|---|---|---|---|---|---|
| AICc | Deviance | AICc | Deviance | ||||
| January | 1197.00 | 0.144 | 432.808 | 0.526 | 0.008 | 0.318 | 0.374 |
| February | 924.00 | 0.157 | 403.175 | 0.395 | –0.056 | –1.275 | 0.898 |
| March | 859.00 | 0.053 | 430.776 | 0.231 | –0.019 | –0.373 | 0.645 |
| April | 828.00 | 0.025 | 431.394 | 0.280 | –0.035 | –0.753 | 0.774 |
| May | 850.00 | 0.037 | 436.957 | 0.145 | –0.025 | –0.520 | 0.698 |
| June | 952.00 | 0.018 | 441.450 | 0.299 | –0.104 | –2.435 | 0.992 |
| July | 974.00 | 0.204 | 406.892 | 0.325 | –0.072 | –1.656 | 0.951 |
| August | 1087.00 | 0.121 | 421.122 | 0.416 | –0.048 | –1.071 | 0.858 |
| September | 1075.00 | 0.087 | 439.833 | 0.442 | –0.092 | –2.154 | 0.984 |
| October | 899.00 | 0.132 | 408.941 | 0.378 | –0.047 | –1.059 | 0.855 |
| November | 837.00 | 0.022 | 418.079 | 0.275 | –0.035 | –0.747 | 0.772 |
| December | 751.00 | 0.156 | 402.712 | 0.422 | 0.014 | 0.475 | 0.317 |
Disclaimer/Publisher’s Note: The statements, opinions and data contained in all publications are solely those of the individual author(s) and contributor(s) and not of MDPI and/or the editor(s). MDPI and/or the editor(s) disclaim responsibility for any injury to people or property resulting from any ideas, methods, instructions or products referred to in the content. |
© 2024 by the authors. Licensee MDPI, Basel, Switzerland. This article is an open access article distributed under the terms and conditions of the Creative Commons Attribution (CC BY) license (http://creativecommons.org/licenses/by/4.0/).


