Preprint
Article

Soil Extracellular Enzyme Activities and Microbial Nutrient Limitation during the Primary Succession of Lava Platform in Wudalianchi, China

Altmetrics

Downloads

108

Views

46

Comments

0

Submitted:

05 April 2024

Posted:

05 April 2024

You are already at the latest version

Alerts
Abstract
Soil extracellular enzyme activity (EEAs) and enzymatic stoichiometry (ES) can provide a crucial indication of changes in soil ecosystem's nutrient availability and the microbial resource limitations. However, the changing characteristics of soil EEAs and ES at different stages of the native succession process and their key drivers are unclear. In order to investigate the soil EEAs, ES and driving factors of soil under vegetation at different succession stages, we adopted the "spatio-temporal substitution" method to collect the surface soil of bryophyte community, herbaceous community, shrub community and tree community in the new volcanic lava platform of Wudalianchi Volcanic Nature Reserve. We measured seven soil EEA, including carbon(C)-acquiring enzyme (β-1,4-glucosidase (BG)), N-acquiring enzymes (β-N-acetyl-glucosaminidase (NAG) and leucine aminopeptidase (LAP)) and phosphorus (P)-acquiring enzyme (acid phosphatase (AP)) activities. The length and angle of vectors defined by ratios of enzyme activities (BG/(NAG + LAP) vs. BG/AP) were used to indicate relative microbial investments in C- (length), and N- and P- (angle) acquiring enzymes. Our results showed that the contents of TC, TN, TP, MBC, DOC and NO3-N in shrub community soil were significantly higher than those in bryophyte, herb and tree communities, and increased by 441%, 246%, 137%, 5570%, 12% and 484%, respectively. The highest soil EEA of C-, N- and P-acquiring were found in shrub community, and the soil EEAs/MBC of C-, N- and P-acquiring were the highest in bryophyte community. Enzyme C:N, C:P and N:P ratios increased progressively in the order of bryophyte, herb and shrub community, but the enzyme C:N, C:P and N:P ratios of tree community were both far less than shrub community. Vector lengths increased progressively in the order of bryophyte (1.16), herb (1.27), tree (1.29) and shrub (1.40), and Vector angles decreased progressively in the order of bryophyte (49.15°), herb (45.65°), Tree (45.31°) and shurb (44.54°), suggested that as succession progresses, soil microbial nutrients transforms from P limitation (angle>45°) to N limitation (angle<45°). Redundancy analysis showed that TC, TN, EC and C:N were important drivers of variation in soil EEAs and ES in vegetation at different succession stages. Our findings highlight that the primary succession process cause nutrient limitation transformation. Soil ES might be a sensitive indicator mediated by soil microorganisms to the relative resource limitation at different stages of the primary succession process.
Keywords: 
Subject: Environmental and Earth Sciences  -   Ecology

1. Introduction

Soil extracellular enzymes are regulated by the decomposition and mineralization of soil organic matter (SOM) [1,2]. They play a crucial role in driving biogeochemical cycles within terrestrial ecosystems [3,4]. These enzymes break down complex organic compounds, such as organic matter, into smaller molecules that can be utilized by microorganisms [5,6]. In nutrient-deficient conditions, microorganisms can synthesize extracellular enzymes by utilizing their own carbon sources and energy to meet their nutrient requirements. This mechanism is vital for maintaining nutrient balance in microorganisms [7]. Soil extracellular enzyme activity (EEAs) serves as an excellent indicator of changes in soil ecosystem's nutrient availability, substrate availability, microbial energy requirements, and nutrient demands [4,8]. Enzyme stoichiometry (ES), which represents the ratio of soil EEAs involved in carbon (C), nitrogen (N), and phosphorus (P) cycles, reflects both the metabolic needs of soil microorganisms and the limited environmental availability of resources [8]. It provides insights into soil energy limitations and nutrient constraints on microbial communities' function [9,10,11]. Studies have demonstrated that vegetation type significantly influences soil enzyme activity [12]. To gain a better understanding of how vegetation succession impacts biogeochemical cycles, it is imperative to comprehend how soil EEAs and ES respond to changes in plant communities.
Microorganisms secrete a plethora of extracellular enzymes to acquire limited nutrient elements from complex substrates, and this process is regulated by both biotic (e.g., plant nutrient and vegetation types) and abiotic (e.g., climate and soil properties) factors [13,14]. However, due to variations in vegetation types, soil properties, and climatic conditions among the studied ecosystems [15,16], different ecosystems exhibit diverse impacts. For instance, soil ES has been reported to be modified by plant diversity and species richness in arid grasslands on the Loess Plateau in China [17] and vegetation type rather than climate modulated the variation in soil ES in subalpine forests on the eastern Tibetan Plateau of China [12]. In an arid-hot valley in southwest China, vegetation rehabilitation increases soil EEA in degraded land via carbon supply and nitrogen retention [18]. In temperate grasslands in China, abiotic factors exert a greater influence on soil EEAs than biological factors do, with total carbon (C), nitrogen (N), and phosphorus (P) contents being the primary drivers of soil EEAs variation in soils [19]. Soil physical properties such as texture and water availability drive changes in soil EEAs, the variation in soil ES was better explained by biotic than by abiotic factors within degraded grasslands on the arid Loess Plateau of northern China [20,21]. In forest ecosystems in eastern China, there exists a positive correlation between soil pH and EEA while an inverse relationship with average annual precipitation is observed [22]. In alpine ecosystems in China, EEAs and ES were directly regulated by soil nutrient stoichiometry, followed by nutrient availability [23]. A recent meta-analysis revealed that temperature and soil carbon-to-nitrogen ratio are key determinants explaining changes in soil EEAs within Chinese forest ecosystems [11].
Previous studies have reported associations between soil EEAs and nutrient concentrations [24,25]. Soil nutrient concentration may affect soil EEAs by influencing effective substrate concentration [19], since limited substrate for enzymatic reactions leads to significant declines in enzyme activity [26]. In the early stage of nutrition-deficient primary succession, microorganisms acquire nutrients by increasing extracellular enzymes that decompose soil organic matter [20], and soil organic nitrogen mineralization is also closely related to extracellular nitrogen acquisition enzymes of soil microorganisms [27]. Therefore, differences in biomass, coverage and suitable habitat among different vegetation types could result in significant variations in soil EEAs.
Microorganisms release extracellular enzymes to obtain energy and nutrients [28]. Since these enzymes are produced by cell metabolism and in response to nutrient availability in the environment, soil EEAs represents a major link between ecological metabolic theory and ecological stoichiometry theory [3]. Utilizing EEA ratios and stoichiometric invariance (i.e., the need for elements to be present at certain relative levels to sustain metabolism), ES has been used to predict the availability of nutrients in the environment and the metabolic activity of microorganisms [3,29]. For example, soil microbial metabolism was limited by P in highly weathered tropical ecosystems [14], but P limitation was also found in temperate forest ecosystems [30,31]. Yang et al [32] confirmed the shift from P- to N-limitation of microorganisms with grassland restoration based on soil extracellular enzyme stoichiometry. Cui et al [20] in desert steppe and Wang et al [32] in the desert of Northwest China (One of the most eroded and nutrient-starved areas in China) using threshold element ratio analysis found that microorganisms were limited by both N and P. Rosinger et al [2] found that soil microorganisms in subtropical steppe were not only limited by P, but also limited by C and N. Therefore, microorganisms in a single ecosystem may be limited by different nutrients, and microorganisms in different ecosystems may also be limited by the same nutrient. Although there is an increasing number of studies on microbial metabolic limitation at difference regions and ecosystems [2,14,17,31], the inconsistencies of these findings urgently require us to determine the characteristics and key drivers of microbial metabolic limitation in unexplored regions and ecosystems.
Nitrogen and phosphorus are considered the most limiting nutrients in terrestrial ecosystems [33,34] with previous studies indicating that vegetation type is a key factor affecting both soil enzyme activity and its stoichiometric ratio [12]. During vegetation succession, nutrient limitation may shift from nitrogen to phosphorus restriction due to differences in their sources and availability. While atmospheric deposition is the primary source of nitrogen for ecosystems, rock weathering releases phosphorus into soils. However, P uptake mainly occurs through decomposition and mineralization of SOM via extracellular enzymes produced by microorganisms and plants [35,36], which lags behind N input via multiple pathways such as microbial mineralization or atmospheric deposition [37]. Thus, increasing demand for nutrients during vegetation succession may lead to shifts from N limitation to P limitation or both N and P limitations.
Wudalianchi New Volcano, located in the southwest of Heihe City, Heilongjiang Province, is located in the transition zone between the southwestern foothills of the Lesser Khingan Mountains and the Songnen Plain, known as the "volcano textbook". It was formed between 1719 and 1721, during which time it experienced numerous eruptions of high potassium basaltic lava flows. Scorching ejections damage soil, affecting soil development and soil erosion. The volcanic lava and pumice formed after cooling of ejections lack nutrients, especially nitrogen, which cannot meet the nutrients necessary for plant growth, resulting in slow vegetation succession [38]. Vegetation regeneration succession and biogeochemical cycles have changed [39]. Under different vegetation conditions, soil microorganisms catalyzed the decomposition of macromolecular organic matter into soluble nutrients by secreting extracellular enzymes for assimilation and utilization by microorganisms [40], which affected the turnover of organic matter in plant communities [41], especially in the succession process of volcanic vegetation in the new period. However, the study of soil extracellular enzyme activity and its stoichiometric characteristics during vegetation succession, especially during primary succession, is still insufficient.
This study investigated the impacts of seven soil environmental enrichment agents (EEAs) and soil physicochemical factors on C-, N- and P-access, as well as nutrient limitation in soils at different stages of vegetation succession. Specifically, we examined the following hypotheses: (1) soil EEAs uptake of soil carbon, nitrogen, and phosphorus increases with succession; (2) Soil nitrogen and phosphorus levels generally exert a significant limiting effect on microorganisms, with nitrogen often being the most limiting nutrient. As succession progresses, the restrictive impact of nitrogen will be amplified and exacerbated over time, leading to a shift in microbial nutrient restriction from phosphorus to nitrogen.

2. Materials and Methods

2.1. Research Site

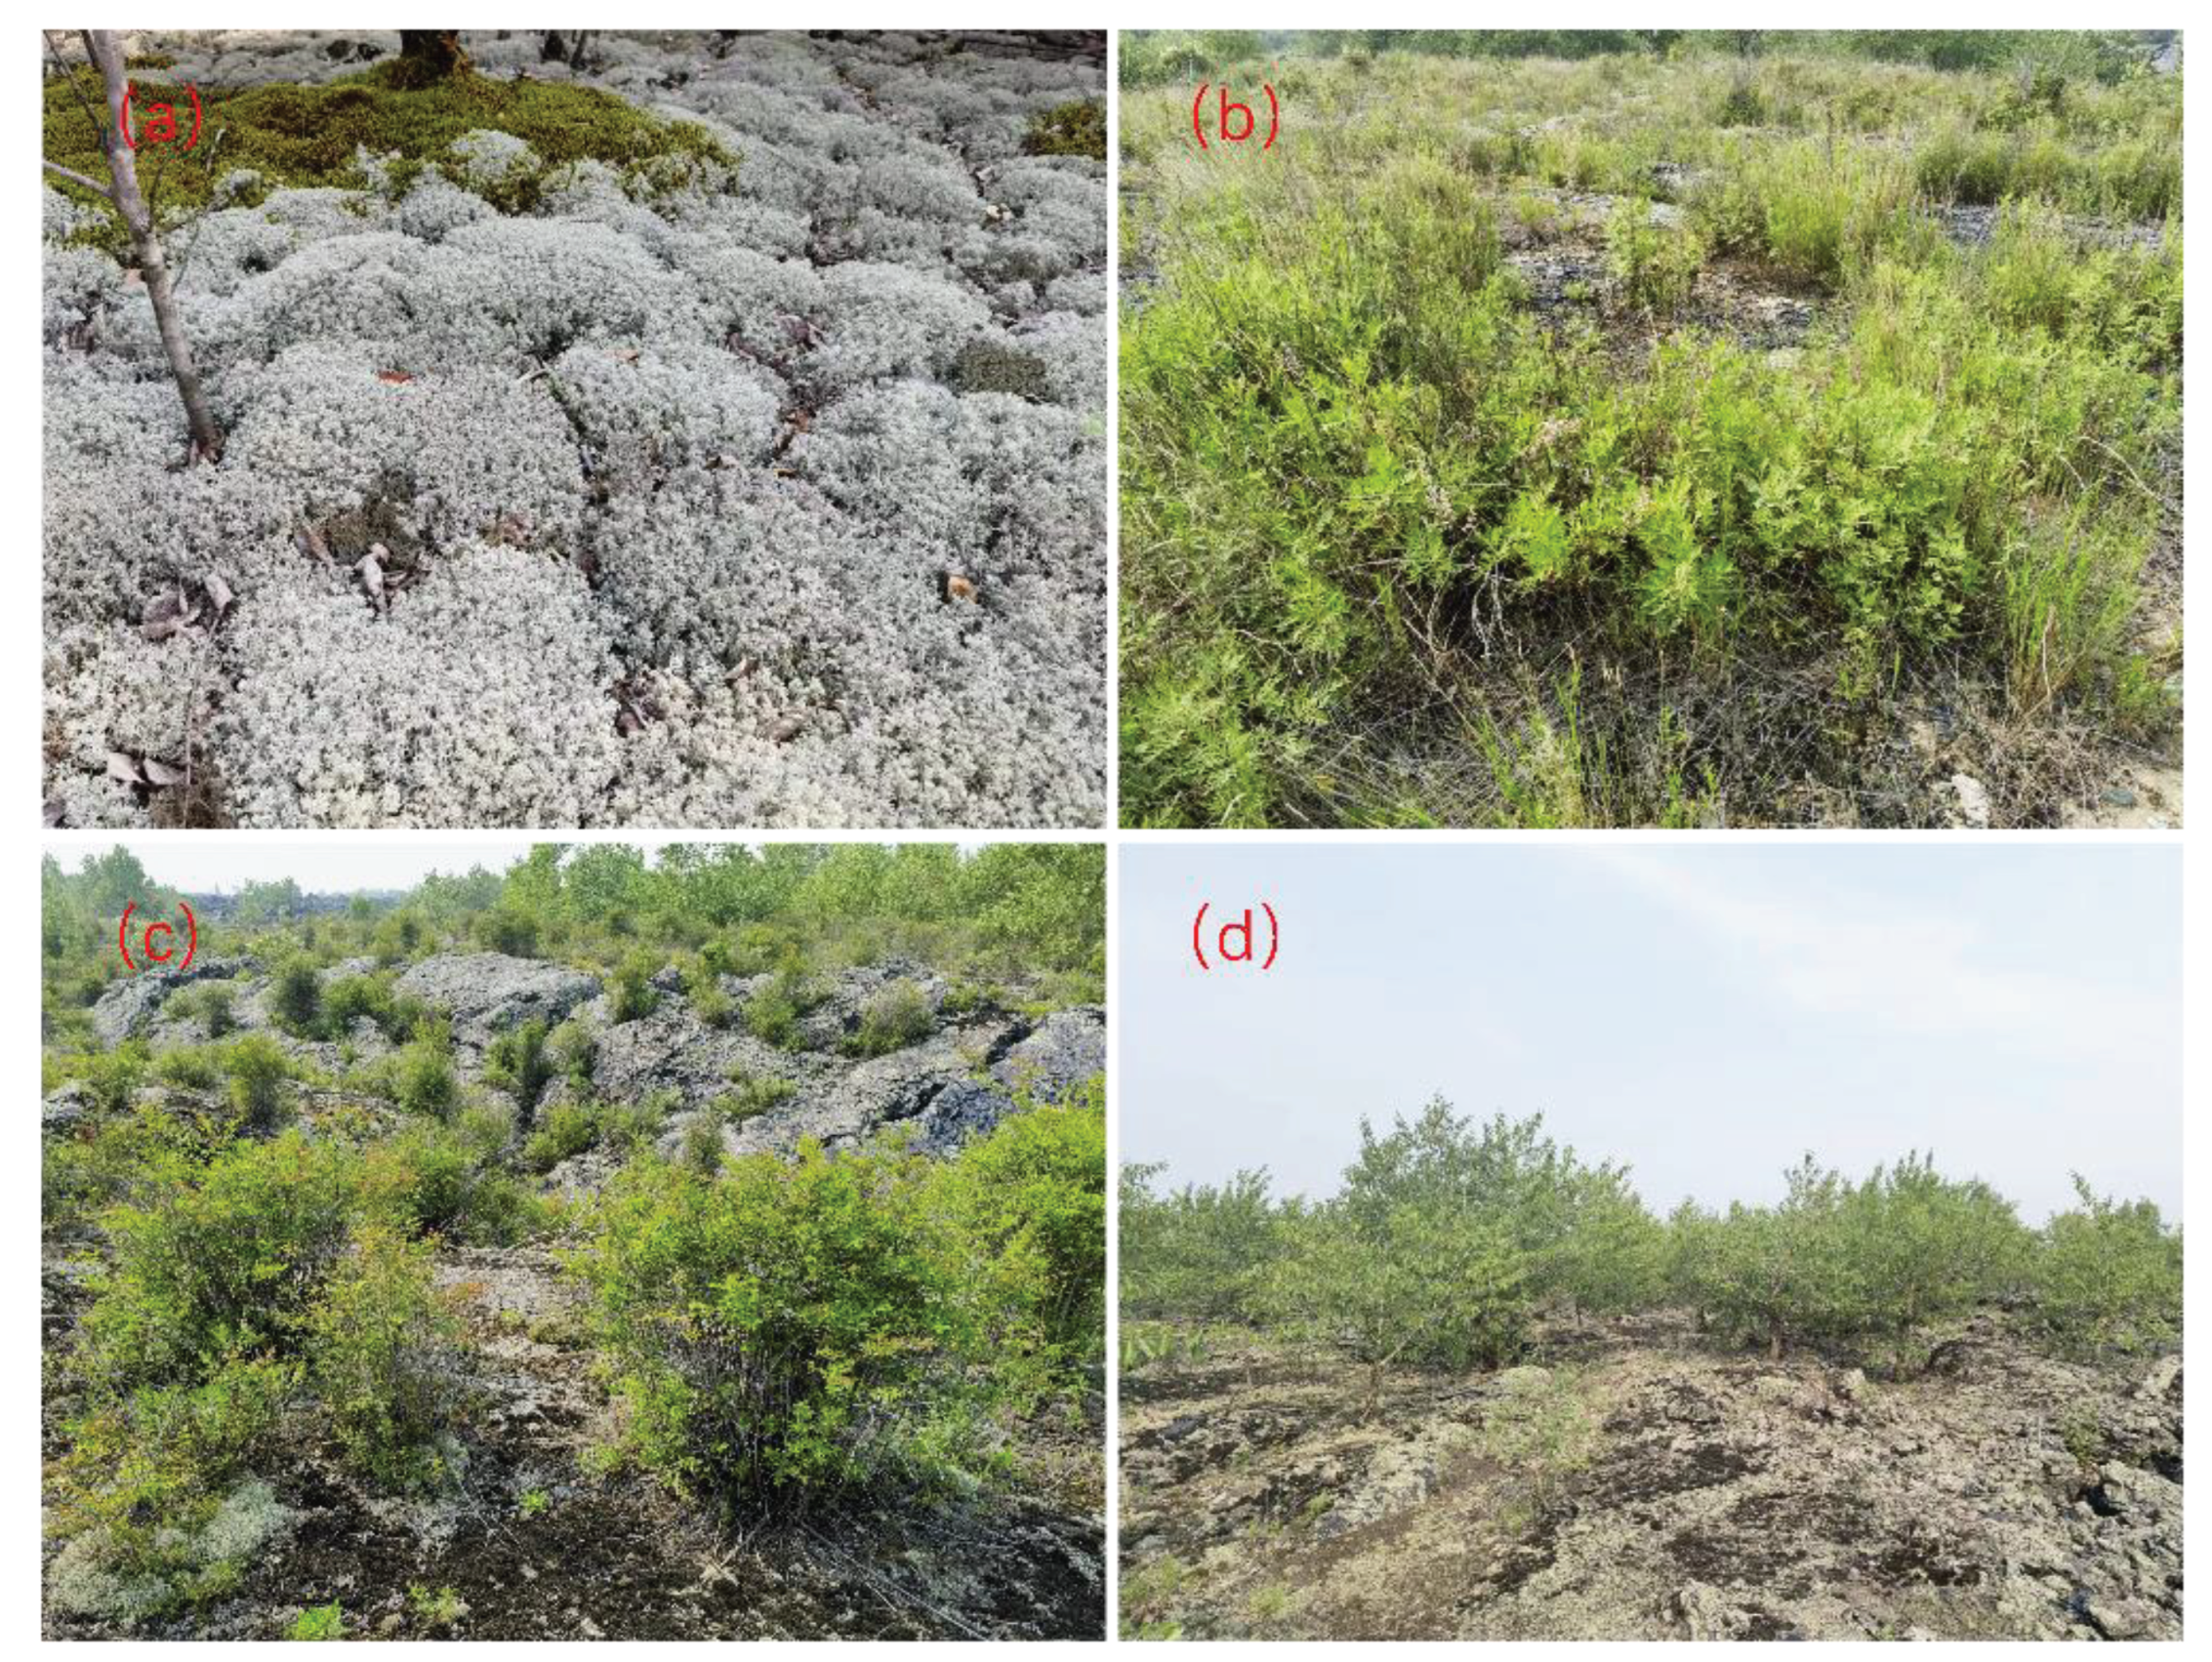
The research site is located in Wudalianchi Volcanic Nature Reserve, which has Heilongjiang Heihe (Wudalianchi) National Forest ecosystem positioning observation and research Station. The reserve is located in the southwest of Heihe City, Heilongjiang Province, in the transition zone between the southwest foothills of the Lesser Hinggan Mountains and the Songnen Plain. Its geographical location is 126°00 '-126°45' east longitude, 48°30'-48°50' north latitude, with a total area of 988.66 km2Figure 1). It is a temperate continental monsoon climate area with long and cold winters and short and cool summers. The annual average temperature is -0.5 ℃, the frost-free period is 121 days, the annual average rainfall is 476.33 mm, and the annual average relative humidity is 69.2%. The lava platform of Old Black Mountain in Wudalianchi covers an area of 65 km2 and erupted 300 years ago, the surface is dominated by large-scale massive volcanic lava, volcanic gravel, volcanic slag and volcanic ash. The lava weathering speed is slow, no obvious soil level has been formed, and there is insufficient water and nutrients, which cannot meet the necessary nutrients for plant growth, resulting in slow vegetation succession. Affected by the surrounding environment, plant communities in different stages of succession are distributed, mainly including: bryophyte community, herbaceous community, shrub community and tree community (Figure 2), and different community types Mosaic distribution.

2.2. Sampling Design

Site selection and sample collection will be conducted in July 2022. Select Bryophyte community (Br), Herb community (He), Shrub community (Sh), and Tree community (Tr) Four typical vegetation types represent different succession stages, and three plots are set for each vegetation type, each covering an area of about 100m2. The composition of dominant species in the plots is shown in Table 1. After removing the surface litter, 500 g of surface soil (0-10 cm) was collected using alcohol-sterilized stainless steel. A total of 15 samples were collected from each community quadrate. After removing the plant debris, the samples were screened 2 mm, and the soil samples were divided into 3 parts. Some soil samples were put into a sterile bag of about 200 g and transferred back to the laboratory in an incubator with an ice pack, and stored in the refrigerator at 4℃. Used for soil extracellular enzyme activity (EEA), Microbial biomass carbon (MBC) and Microbial biomass nitrogen (MBN) and other indicators measurement; Take about 200 g of soil samples and put them in a plastic seal bag, and carry them back to the laboratory for natural air drying. For soil pH, soil Total carbon concentration (TC), soil Total nitrogen concentration, TN), Total Phosphorus concentration (TP), soil available phosphorus (SAP), ammonium nitrogen, Nitrate nitrogen (NH4-N), nitrate nitrogen (NO3-N) and Soil electrical Conductivity (EC) were determined. The remaining part of the soil sample is placed in the plastic sealing pocket for soil moisture content (moisture) determination.

2.3. Soil Extracellular Enzyme Assays

Standard fluorescence technique was adopted [42,43] measured the activity of C, N and P harvesting enzymes in various soil samples. C-acquiring enzymes include α-1,4-glucosidase (AG), β-1, 4-glucosidase (BG), β-D-cellobiohydrolase (CB), and xylosidase (XYL). N-acquiring enzymes include β-n-acetylglucosaminidase (NAG) and leucine aminopeptidase (LAP). The phosphorous acquiring enzyme is acid phosphatase (AP). The compounds used in this study are conjugates of the highly fluorescent compounds 4-methylumbelliferone (MUB) and 7-amino-4-methylcoumarin (MUC). The activities of AG, BG, CB, XYL, NAG and AP were measured by 200 μΜ MUB, while the activities of LAP were measured by 200 μΜ MUC [44,45]. During the measurement of soil EEAs, MUB or MUC is released once the bond between MUB or MUC and the attached substrate is enzymatically hydrolyzed, and its fluorescence can be easily measured and correlates with the activity of the hydrolase [42,43]. The measurement is as follows: A sample suspension is obtained by homogenizing a mixture of 2.5g of soil and 91 ml of ultrapure water for about 1 minute using a homogenizer (Blender 8010s, Waring, USA). We used 96-well microplates for soil EEA measurements. In each well, we added 200 microliters of soil suspension, followed by 50 microliters of specific enzyme substrate. Each soil sample was measured for six analytical replicates. Here, we measured the soil EEAs of each soil sample using standard curves (sample suspension +0, 2.5, 5, 10, 25, 50, and 100 μM MUB/MUC standards). Incubate the mixture at 25 ℃ for 3 hours. Fluorescence values were measured at 365 nm excitation and 450 nm emission using an enzyme labeler (Cytation 5, BioTek, USA) [45]. The unit of soil EEA is nmol activity g−1 Dry soil h−1. Soil EEA is standardized with microbial weight C (EEA/MBC) in μmol h−1 g−1 MBC.
The activity ratios of C-acquiring enzyme (BG), N-acquiring enzyme (NAG+LAP) and P-acquiring enzyme (AP) reflect the stoichiometric ratio of the enzyme. The ratios of the enzymes C: N, N: P and C: P are calculated as follows: ln (BG)/ln (NAG+LAP), ln (NAG+LAP)/ln (AP) and ln (BG)/ln (AP). In previous studies, these enzymes (BG, NAG+LAP, AP) have been used globally[28] and regionally [19,46] indicators of C-, N- and P-acquisition. Nutrient restriction was determined using vector analysis of enzyme activity (vector length and vector Angle) [9,46,47]. The logarithmic conversion ratio is used to calculate the vector length (no units) and the vector Angle (°).
V e c t o r   L e n g t h = [ ln B G / ln ( N A G + L A P ) ] 2 + ( ln B G / ln A P ) 2
V e c t o r   A n g l e = D e g r e e s { A T A N 2 [ ( ln B G / ln A ) , ( ln B G / ln ( N A G + L A P ) ) ] }
Relatively long vector lengths indicate a greater C constraint; The vector Angle is < 45° or > 45°, indicating the relative degree of N-restriction or P-restriction, respectively [9,46]. The principle of this method is based on stoichiometric and metabolic ecosystem theory [48,49,50], that is, the necessary resources that microorganisms obtain from the environment through the action of extracellular enzymes are relatively limited by their elemental composition and metabolic requirements [7].

2.4. Microbial Biomass and Soil Properties Measurement

2.4.1. Microbial Biomass Measurement

The chloroform fumigation extraction method was used to measure MBC and microbial biomass N (MBN) [51]. Soil samples were extracted in 0.5 M K2SO4 for 60 min after fumigation with ethanol-free chloroform for 24 h. Meanwhile, soil samples were directly extracted in the same way without being fumigated. Both fumigated and nonfumigated extracts were analyzed for dissolved organic C (DOC) and dissolved N (DN). DOC and DN concentrations in the extracts were measured by total organic C analyzer (Multi N/C 2100S, Analytik Jena, Germany). The differential concentration between the fumigated and nonfumigated extracts was used as an estimate of MBC and MBN. Microbial biomass phosphorous (MBP) was measured as described by Brookes et al [52], MBP and dissolved P were measured by continuous flow automatic analyzer (SKALAR SAN++, Netherlands). Considering incomplete extractability, we applied an extraction efficiency factor of 0.45 for MBC, 0.54 for MBN and 0.40 for MBP [51].

2.4.2. Soil Properties Measurement

Air-dried soil was used to determine soil pH with a pH meter (1:2.5 w/v) (Model PHS-2, INESA Instrument, Shanghai, China) [46]. Air-dried soil was used to determine soil EC with a Conductivity meter (1:2.5 w/v) (Model 308F, INESA Instrument, Shanghai, China). Gravimetric soil moisture content was measured using the gravimetric method. Soil samples were weighed before and after being oven dried at 105 °C for 48 h [53]. Total carbon (TC) and total nitrogen (TN) were determined with an elemental analyzer (EA3000, EuroVector, Italy) after grinding. Total phosphorous (TP) and Soil available phosphorous (SAP) were determined by melt molybdenum, antimony, and scandium colorimetry at a wavelength of 700 nm [20]. NH4-N and NO3-N concentrations in the extracts were measured by total organic C analyzer (Multi N/C 2100S, Analytik Jena, Germany) after extraction with 2 M KCl with a 1:5 ratio [23]. The measurement of soil DOC and DN was performed as described in Section 2.4.1.

2.5. Statistical Analyses

Two-way analysis of variance (ANOVA) using the general linear model was used to test the variations in soil EEAs, ES, vector length, vector angle, abiotic factors (soil pH, soil EC, soil gravimetric moisture content, soil DOC, DN, TC, TN, TP, SAP, NO3-N and NH4-N) and biotic factors (MBC and MBN) under vegetation types. The pairwise correlations among all variables were analyzed by Pearson correlation, and the relative contributions of different physicochemical factors to soil extracellular enzyme activity, soil extracellular enzyme specific activity and enzyme stoichiometric ratio were distinguished by redundancy analysis. One-way ANOVA was mapped using SPSS 25.0 (IBM Corporation, Armonk, NY, USA), soil extracellular enzyme activity, soil exocellular enzyme specific activity, enzyme stoichiometric ratio, vector length and vector angle changes were plotted using Origin pro 2021 (Origin Lab, USA), and redundancy analysis (RDA) was performed using Vegan and rdacca.ph packages. Mapping with ggplot2 (4.2.2 R Core Team 2022). A significance level of P<0.05 was used for all analyses.
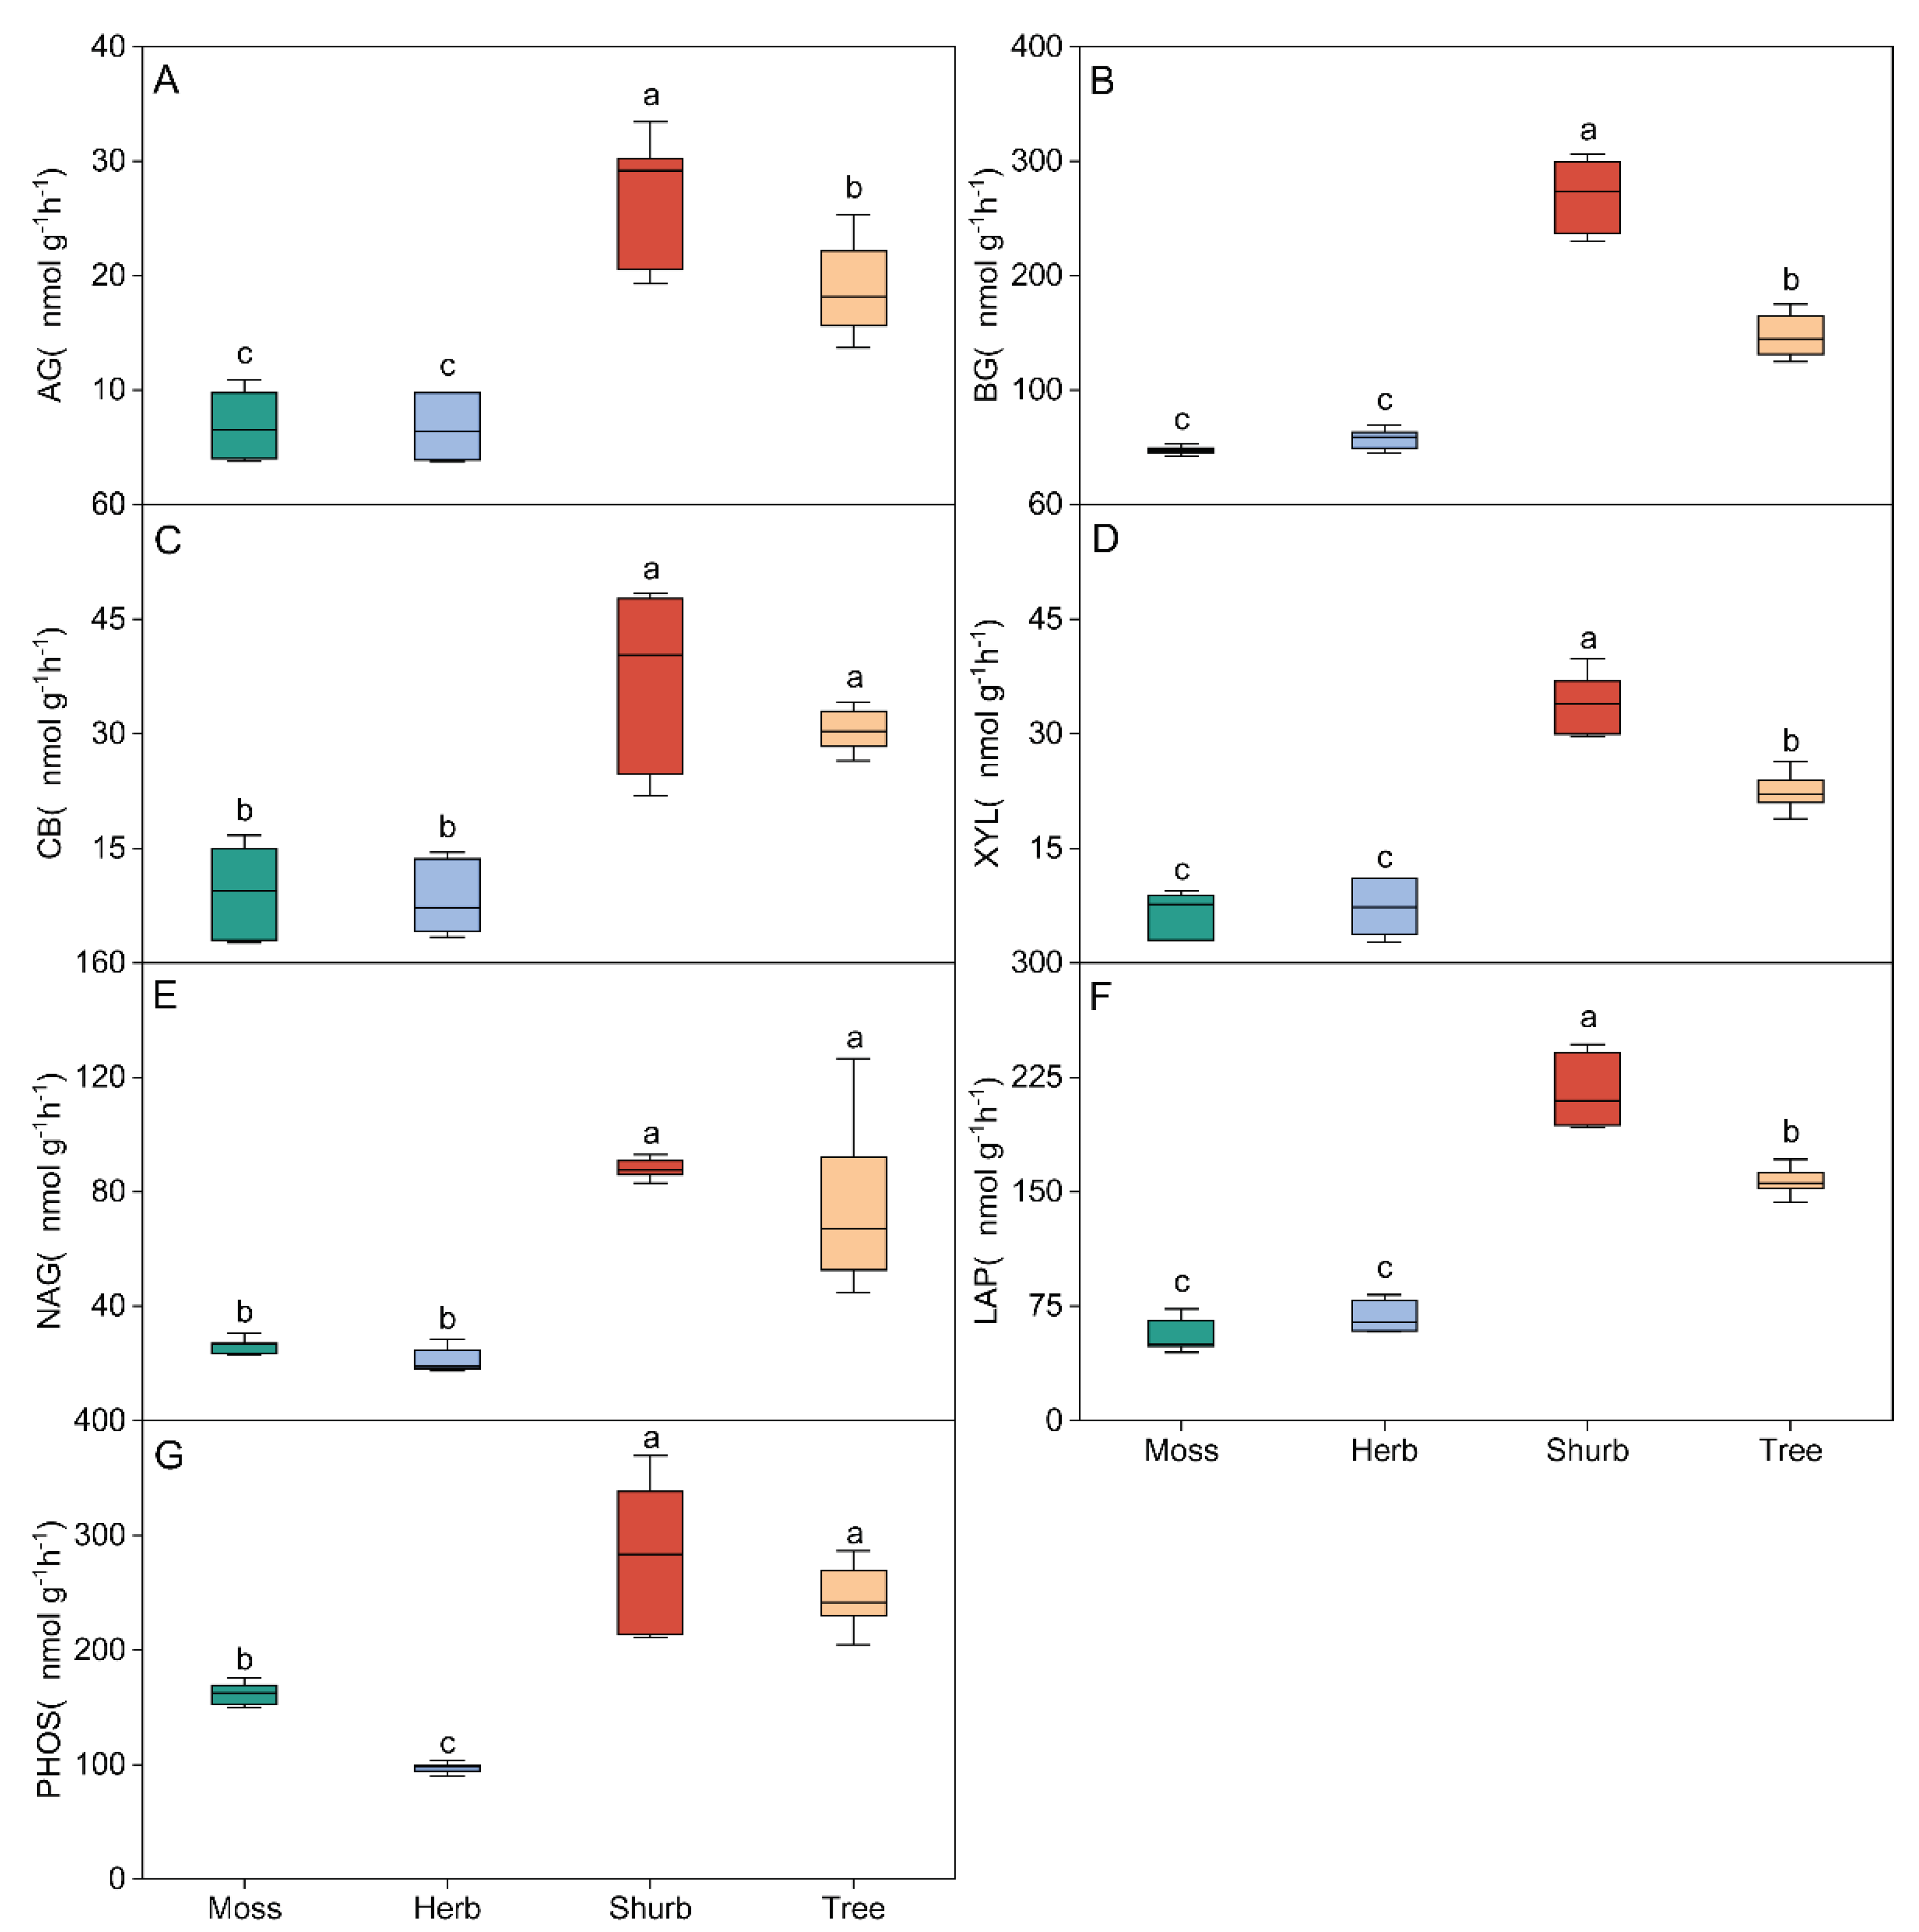
Figure 2. Variations in the activities of soil carbon (C)-, nitrogen (N)- and phosphorus (P)-acquiring enzymes (EEA) in different vegetation types. Soil EEAs were calculated in units of nmol h−1 g−1 dry soil. All values are presented as the means ± standard errors (SE). One-way ANOVA results are inserted into the figure to explore the effects of different vegetation types. Lowercase letters indicate the result of the Dunn-Sidak test for variations in soil EEAs among different vegetation types (P < 0.05). Different colors represent the different vegetation types. Br: Bryophyte communities; He: Herbaceous communities; Sh: Shrub communities; Tr: Tree communities. AG: α-1,4-glucosidase(A); BG: β-1,4-glucosidase(B); CB: β-Dcellobiohydrolase(C); XYS: xylosidase(D); NAG: β-N-acetylglucosaminidase(E); LAP: leucine aminopeptidase(F); AP: acid phosphatase(G).
Preprints 103188 g003
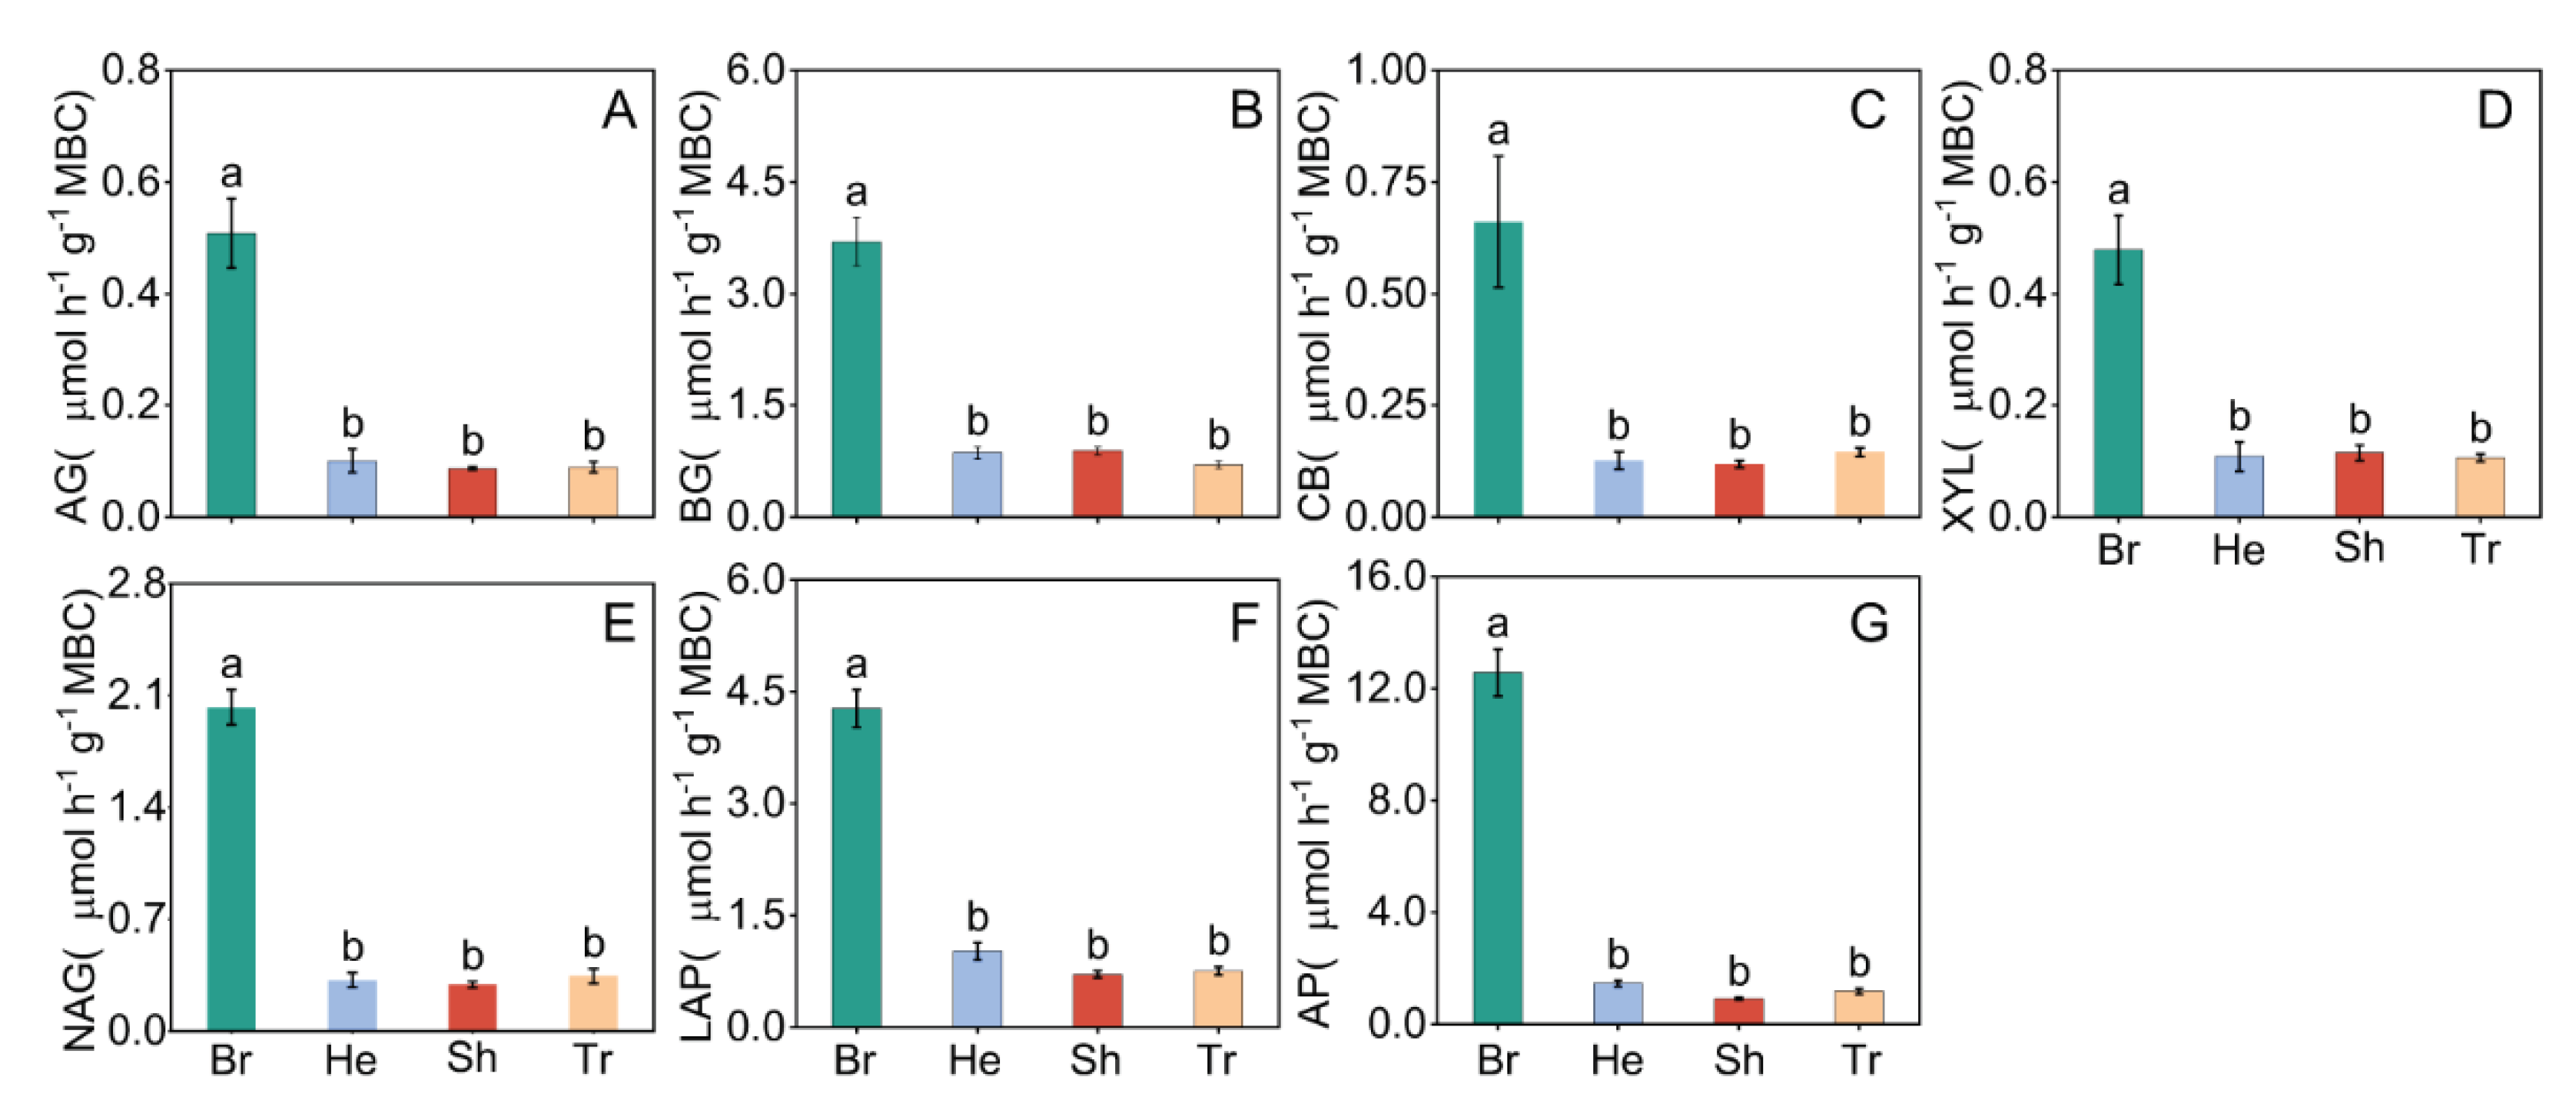
Figure 3. Variations in soil extracellular enzyme activity normalized by microbial biomass carbon (EEA/MBC) in different vegetation types. Soil EEA/MBC was calculated in units of μmol h−1 g−1 MBC. All values are presented as the means ± standard errors (SE). Lowercase letters indicate the result of the Dunn-Sidak test for variations in soil EEA/MBC among different vegetation types (P < 0.05). Different colors represent the different vegetation types. Br: Bryophyte communities; He: Herbaceous communities; Sh: Shrub communities; Tr: Tree communities. AG: α-1,4-glucosidase/ MBC(A); BG: β-1,4-glucosidase/ MBC(B); CB: β-D-cellobiohydrolase/ MBC(C); XYL: xylosidase/ MBC(D); LAP: leucine aminopeptidase/ MBC(E); NAG: β-N-acetylglucosaminidase/ MBC(F); AP: acid phosphatase/ MBC(G).
Preprints 103188 g004

3. Results

3.1. Soil Physicochemical Properties and Soil Extracellular Enzyme Activity in Different Vegetation Types

The vegetation types with different stages of succession significantly affected soil physicochemical properties, and the soil TC, TN, TP, MBC, MBN, MBP, DOC and NO3-N contents in shrubland communities were significantly higher than those in bryophyte community, herb community and tree community, and increased by 441%, 246%, 137%, 5570%, 12% and 484% compared with bryophyte community, respectively. The SAP content of shrub community was significantly higher than that of bryophyte community and herbaceous community, but there was no significant difference with that of arbor community. The soil pH of shrubland communities was significantly lower than that of bryophyte communities, herbaceous communities and arbor communities. There were no significant differences in NH4-N and DON content between different vegetation types (P < 0.05, Table 2 ) 。
All the measured soil EEA of C-, N- and P-acquiring differed significantly among the vegetation types with different stages of succession (P < 0.05, Figure 2). The highest soil EEA of C-, N- and P-acquiring were found in shrub community, and the soil EEAs of C-, N- and P-acquiring in the bryophyte and herb community significantly lower than shurb and tree community (P < 0.05). All the measured soil EEA/MBC of C-, N- and P-acquiring were the highest in bryophyte community, but there was no significant difference among herb, shurb and tree community (P < 0.05, Figure 3).
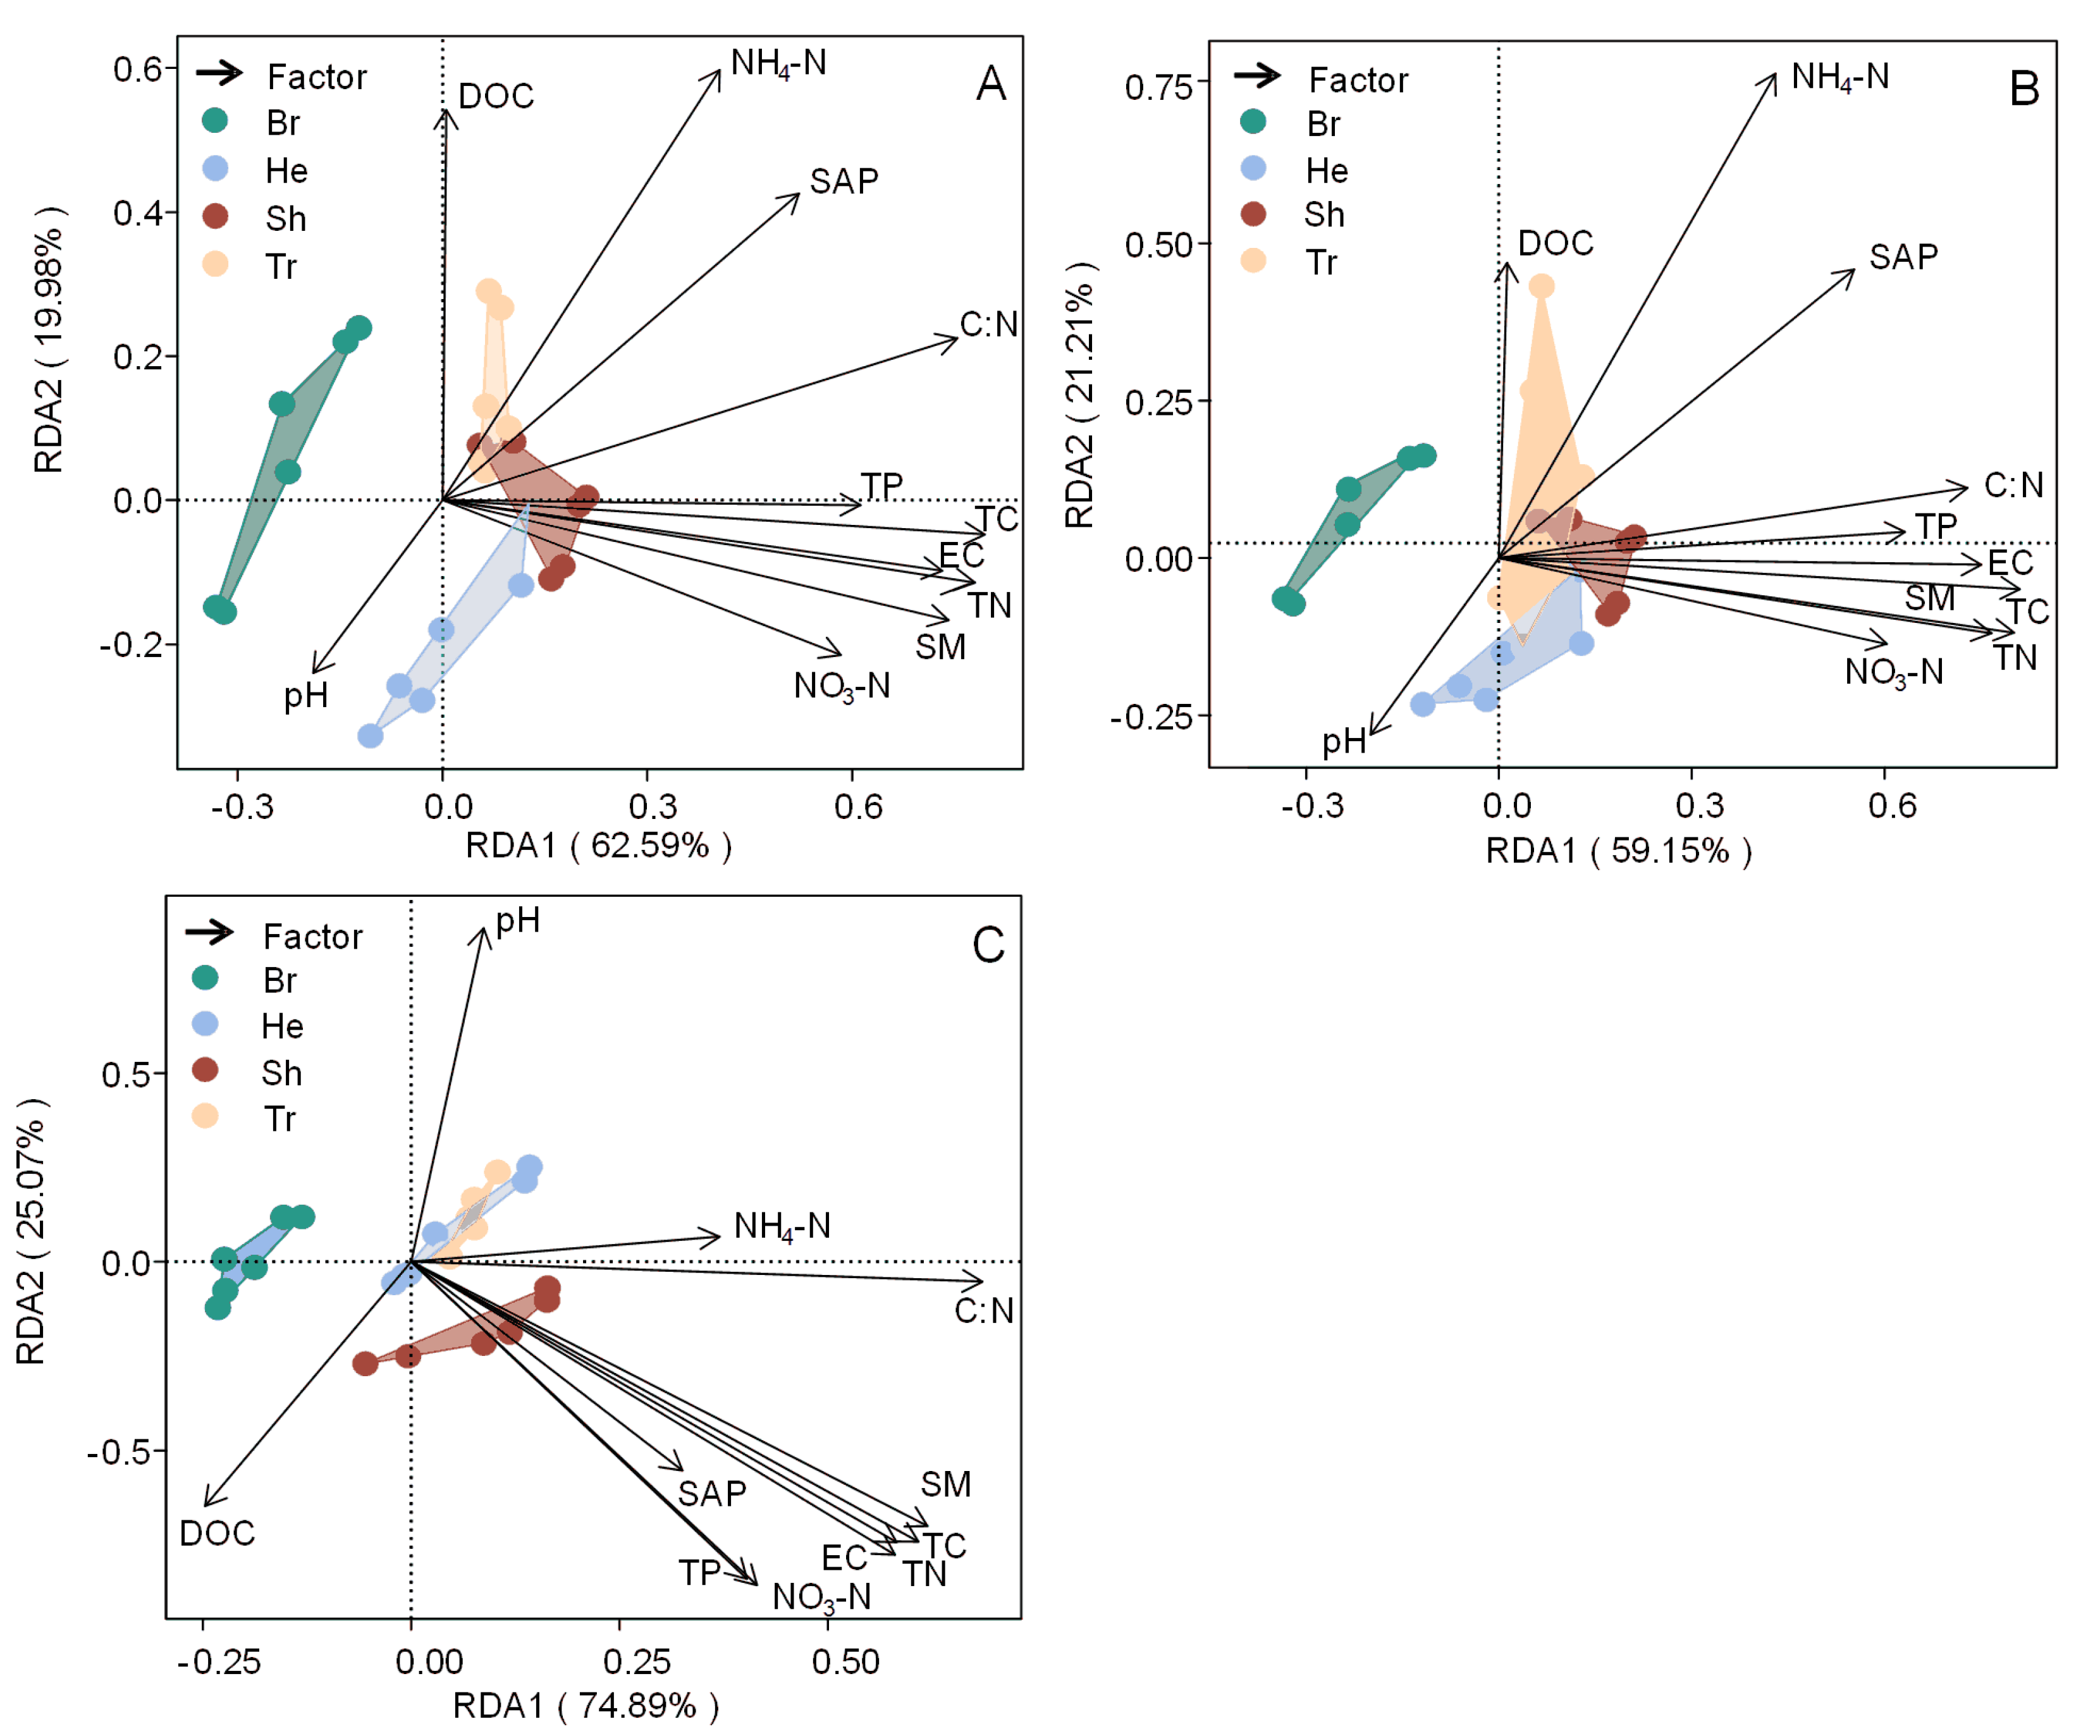
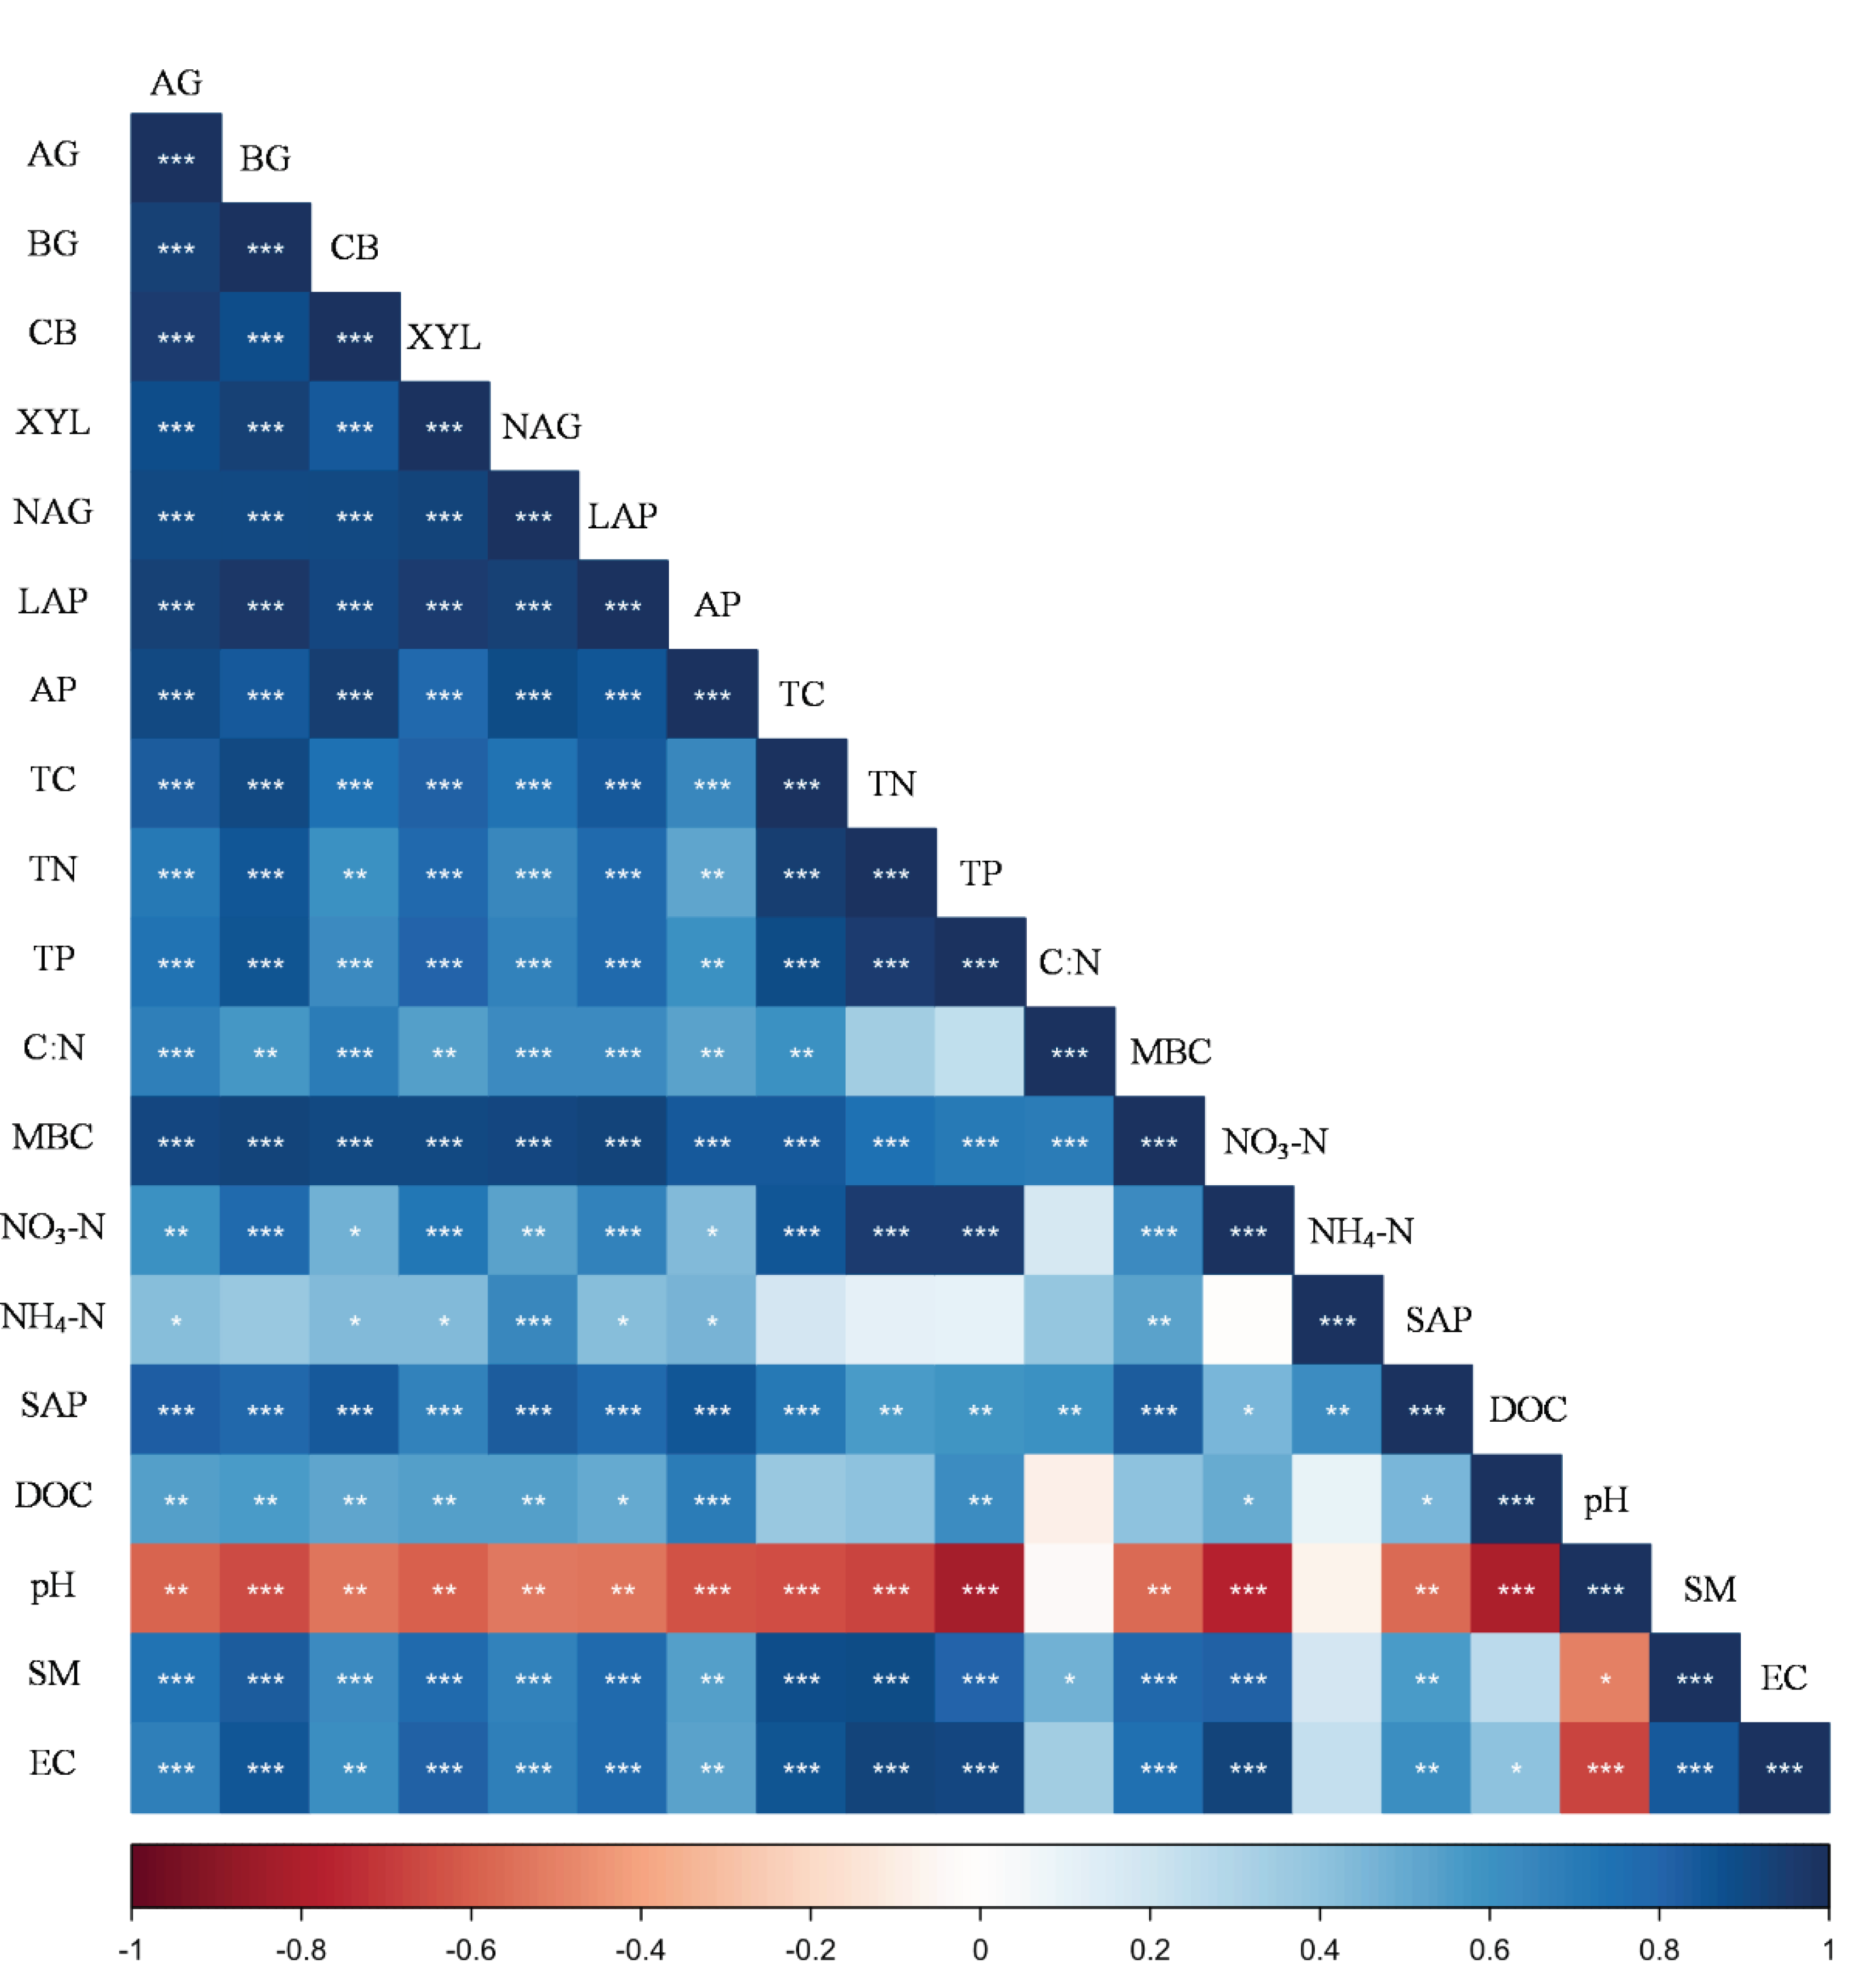
The soil factors were significant in constraining soil EEAs (P < 0.05, Table S1 ). Soil EEA were significantly positively correlated with TC, TN, TP, SAP, NO3-N, moisture content, EC and C:N (P < 0.05, Figure 7 ). Soil EEAs were significantly negatively correlated with the soil pH value (P < 0.05, Figure 7 ). The first and second principal components explained 62.59% and 19.98% of the variation in soil EEA, respectively ( Figure 6 A). Soil EEAs in bryophyte community differed from soil EEAs in higher plant communities, but there was no significant difference among the three higher plant communities. TC, TN, TP, NO3-N, pH, SM, EC and C:N accounted for 10.00%, 9.34%, 5.88%, 9.68%, 6.89%, 5.09%, 6.94%, 8.04% and 9.60% of the variations in soil EEAs, respectively, ( Table S2 ). Redundancy analysis for soil EEAs/MBC showed that the first and second principal components explained 59.15% and 21.21% of the variation in soil EEAs/MBC, respectively ( Figure 6 B). TC, TN, TP, NO3-N, NH4-N, pH, SM, EC and C:N accounted for 9.06%, 8.92%, 5.42%, 6.38%, 7.62%, 5.37%, 6.80%, 7.41% and 7.28% of the variations in soil EEAs/MBC, respectively, ( Table S2 ).

3.2. Soil Enzymatic Stoichiometry in Different Vegetation Types

The enzyme C:N ratio and C:P ratio of shrub community were approximately equal to 1, but the enzyme C:N and C:P ratios of bryophyte, herb and tree community were both far less than 1 (Figure 4A, 4B). The enzyme N:P ratio of bryophyte, herb and tree community were approximately equal to 1, but the enzyme C:P ratios of bryophyte community was far less than 1 (Figure 4C). Enzyme C:N, C:P and N:P ratios increased progressively in the order of bryophyte, herb and shrub community, but the enzyme C:N, C:P and N:P ratios of tree community were both far less than shrub community(Figure 4).
Figure 4. Variations in enzymatic stoichiometry (ES) in different vegetation types.
Preprints 103188 g005
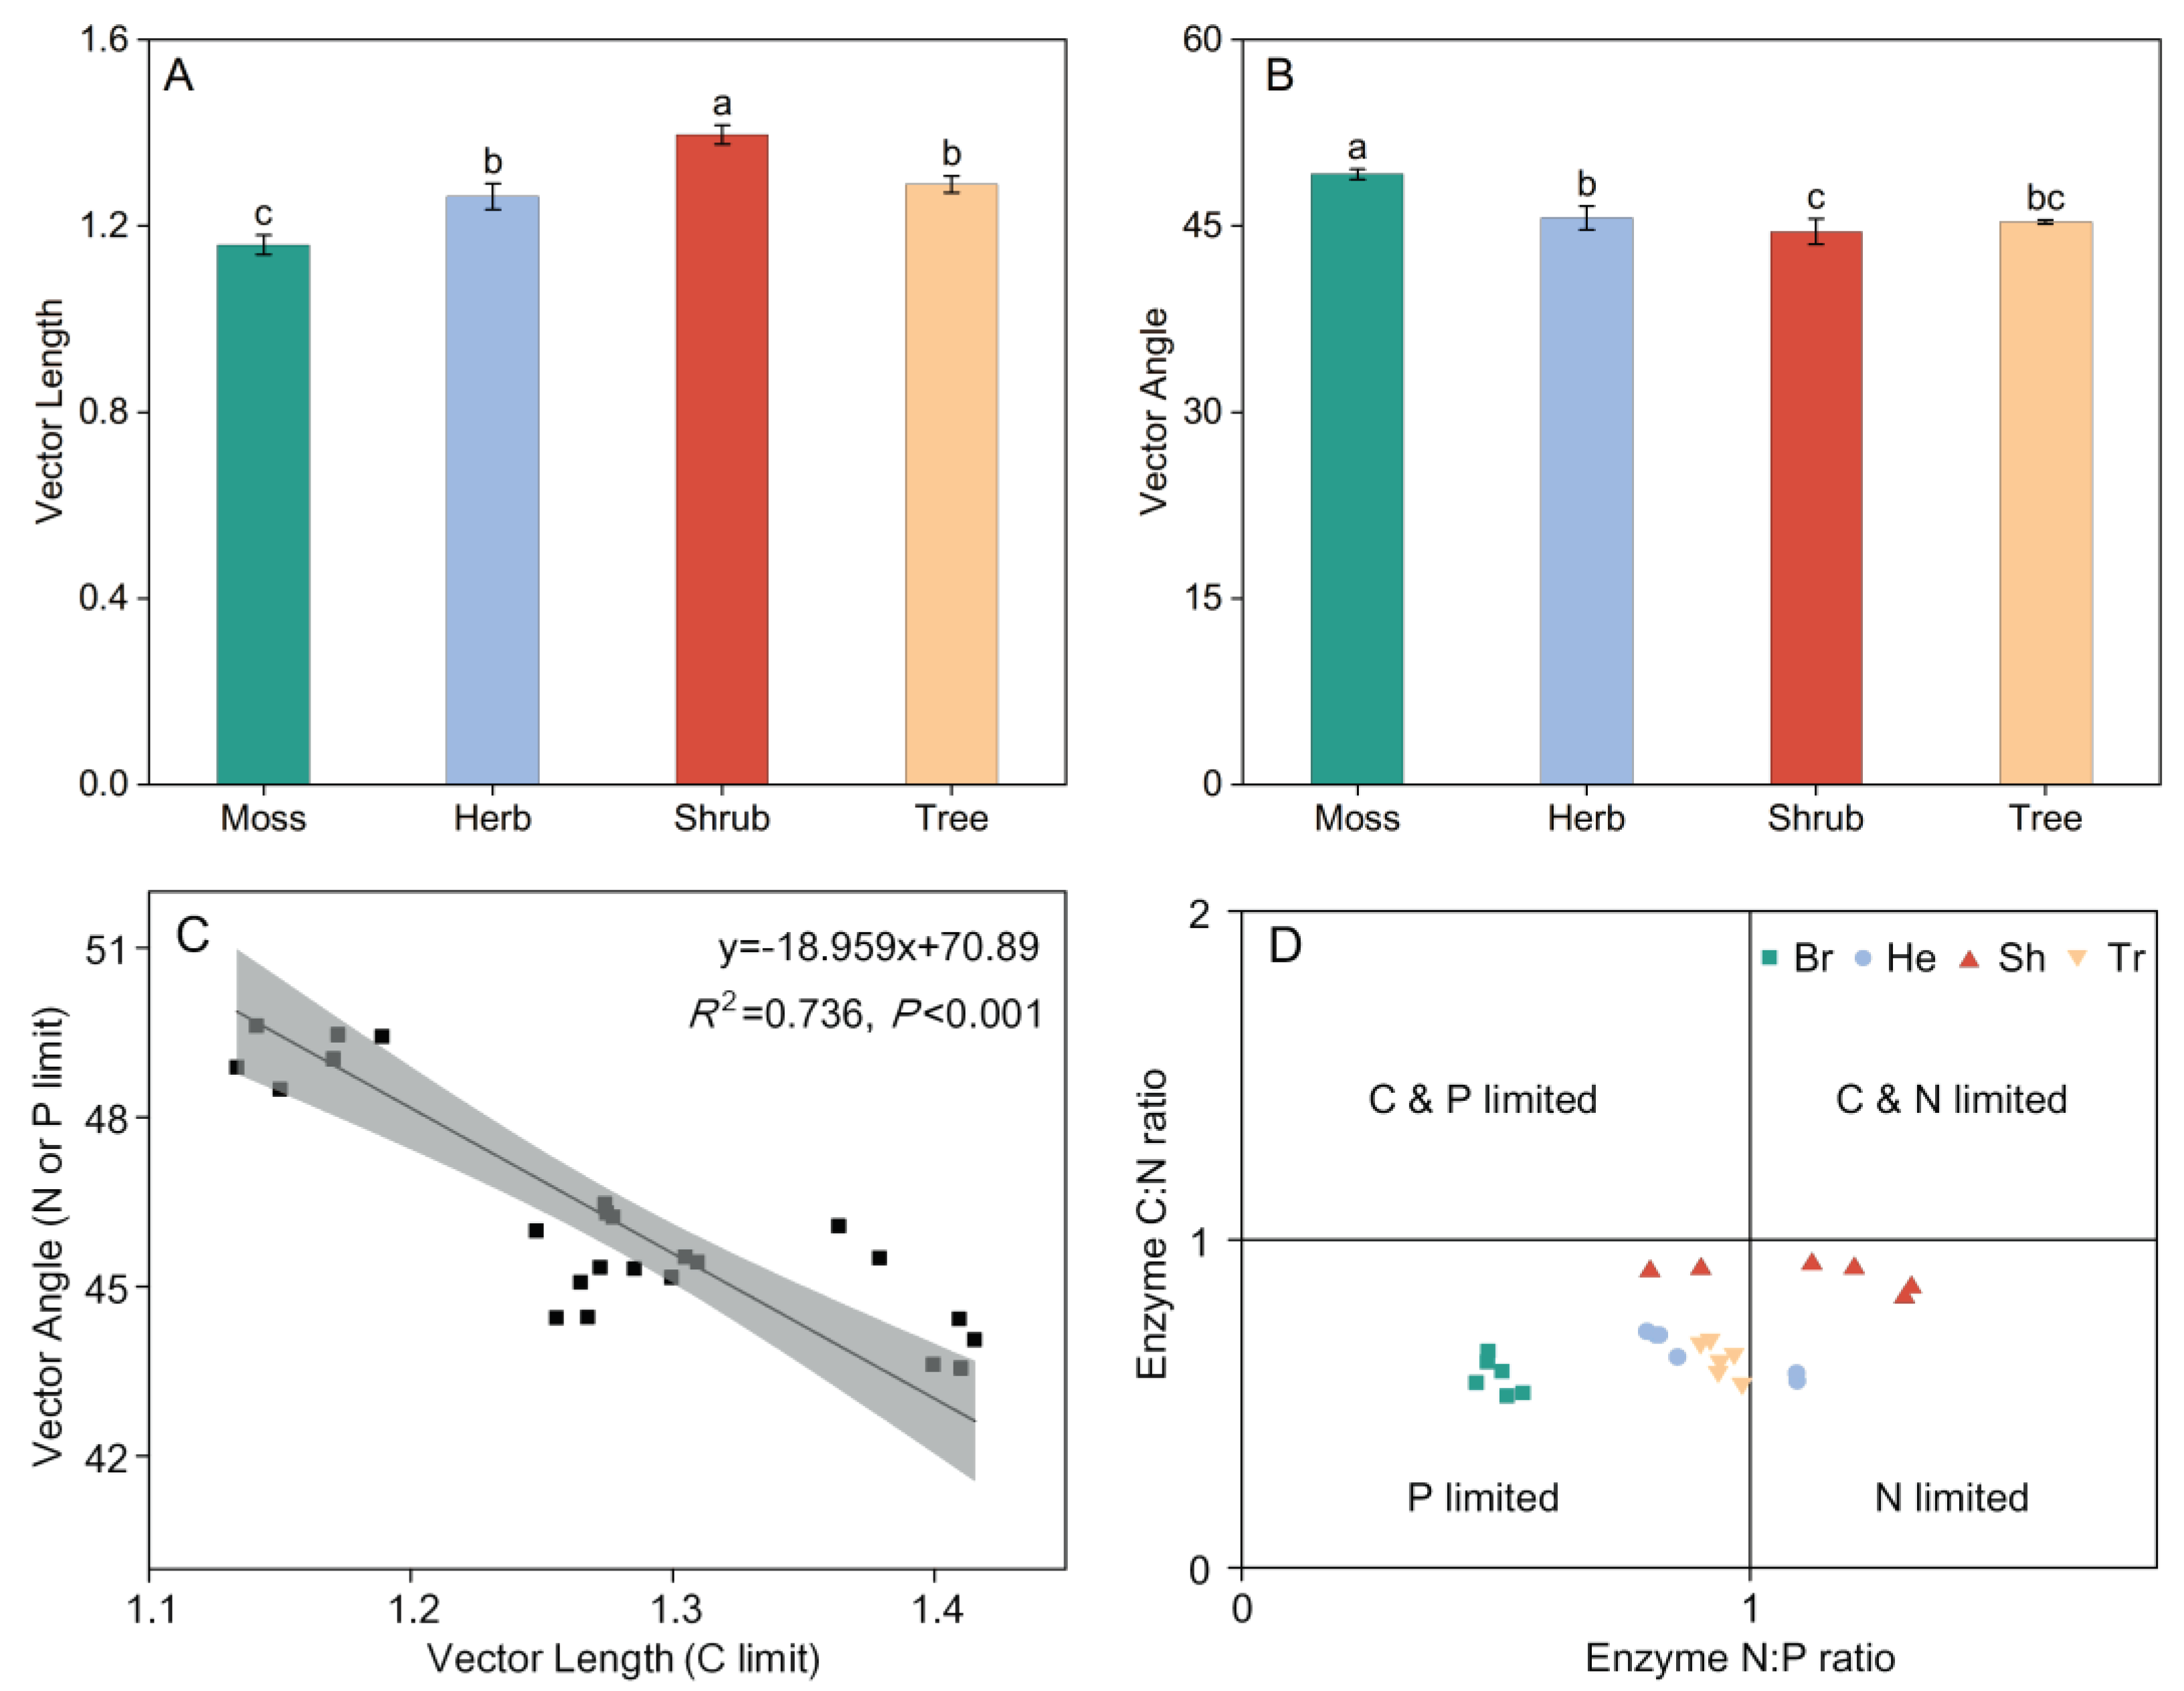
Vector length differed greatly among the four vegetation types with different stages of succession. Vector lengths in shrub community were higher than those in bryophyte, herb and tree community, and Vector lengths increased progressively in the order of bryophyte (1.16), herb (1.27), tree (1.29) and shrub (1.40) (P < 0.05; Figure 5A). Vector angles in bryophyte, herb and tree communities were > 45°, and Vector angles in shrub community were lower than those in bryophyte, herb and tree community. Vector angles decreased progressively in the order of bryophyte (49.15°), herb (45.65°), Tree (45.31) and shurb (44.54°) (P < 0.05; Figure 5B). Vector length and vector angle exhibited a significant negative correlation, and microbial P-limitation was switched to microbial N-limitation with C limitation increasing (Figure 5C). As shown by enzyme stoichiometry, soil microorganisms of bryophyte and tree communities were all P-limited. P limitation on herb and shurb communities were shifted to N limitation through vegetation restoration (Figure 5D).
The soil factors were significant in constraining soil ES (P < 0.05, Table S1). Redundancy analysis showed that the soil factors explained 43.7% of the difference in soil EEAs (P < 0.05, Figure 6C). TC, TN, pH, EC and C:N accounted for 7.99%, 8.33%, 9.46%, 6.11% and 11.62% of the variation in ES, respectively, (P < 0.05,Table S2).
Variations in enzymatic stoichiometry (ES) in different vegetation types. The enzyme C:N, N:P and C:P ratios were calculated by ln(BG):ln(NAG + LAP)(A), ln (NAG + LAP):ln(AP)(B) and ln(BG):ln(AP)(C), respectively. All values are presented as the means ± standard errors (SE). One-way ANOVA results are included in the Figure to explore the effect of vegetation type. Lowercase letters indicate the result of the Dunn-Sidak test for variation in ES among different vegetation types (P < 0.05). Different colors represent the different vegetation types. Br: Bryophyte communities; He: Herbaceous communities; Sh: Shrub communities; Tr: Tree communities. BG: β-1,4-glucosidase; LAP: leucine aminopeptidase; NAG: β-N-acetylglucosaminidase; AP: acid phosphatase.
Figure 5. Variations of vector characteristics and microbial homeostasis in different vegetation types.
Preprints 103188 g006
Variations in (A) vector length and (B) vector angle different vegetation types. All values are presented as the means ± standard errors (SE). One-way ANOVA results are included in the Figure to explore the effect of vegetation type. Lowercase letters indicate the result of the Dunn-Sidak test for variation in ES among different vegetation types (P < 0.05). (C) the relationship of vector length and angle; (D) microbial resource limitation. Different colors represent the different vegetation types. Br: Bryophyte communities; He: Herbaceous communities; Sh: Shrub communities; Tr: Tree communities.
Figure 6. Results of redundancy analysis (RDA) explained by factors for (A) all measured extracellular enzyme activities, (B) soil extracellular enzyme activities normalized by microbial biomass carbon and (C) enzymatic stoichiometry.
Preprints 103188 g007
Results of redundancy analysis (RDA) explained by factors for (a) all measured extracellular enzyme activities, (b) soil extracellular enzyme activities normalized by microbial biomass carbon and (c) enzymatic stoichiometry. Significance was assessed using 999 permutations of the full RDA model with P < 0.05. TC: total carbon concentration, TN: total nitrogen concentration, TP: total phosphorus concentration, SAP: soil available phosphorus concentration, DOC: dissolved organic carbon, NO3-N: nitrate nitrogen concentration, NH4-N: ammonium nitrogen concentration, Moisture: soil moisture content, EC: soil electrical conductivity, pH: soil pH value, C:N: soil carbon to nitrogen ratio, Different colors represent the different vegetation types. Br: Bryophyte communities; He: Herbaceous communities; Sh: Shrub communities; Tr: Tree communities.
Figure 7. Correlations between soil nutrient, microbial biomass and enzyme activity. TC, TN, TP, C:N, MBC, NO3-N, NH4-N, SAP, DOC, pH, Moisture and EC represent the abbreviations of total carbon, total nitrogen, total phosphorus, soil carbon to nitrogen ratio, microbial biomass carbon, soil nitrate nitrogen, soil ammonium nitrogen, soil available phosphorus concentration, dissolved organic carbon, soil pH value, soil water content and soil electrical conductivity, respectively. AG, α-1,4-glucosidase; BG, β-1,4-glucosidase; CB, β-D-cellobiohydrolase; XYL, xylosidase; LAP, leucine aminopeptidase; NAG, β-N-acetylglucosaminidase; AP, acid phosphatase. * represent P <0.05, ** represent P < 0.01, *** represent P < 0.001.
Preprints 103188 g008

4. Discussion

4.1. Variations in Soil Extracellular Enzyme Activity

Since microorganisms obtain nutrients from organic matter by secreting extracellular enzymes [2], this activity is interpreted as the nutritional needs of microorganisms [3]. This demand is determined by the availability of environmental nutrients [54]. During the process of vegetation succession, vegetation and soil components are closely linked via increasing nutrient contents, improving soil physical properties (e.g., aggregate stability and water holding capacity), and promoting soil C sequestration [55], coevolved vegetation-soil interactions can significantly influence ecological processes [56]. Soil SOC and TN can provide C and N sources for microbial growth, affecting enzyme synthesis [15]. Previous studies have shown that soil C and N related indexes can explain most of the changes in soil EEAs [24]. In this study, the contents of TC, TN, TP, DOC, NO3-N, NH4-N, SAP、moisture content, EC, C:N and soil EEAs were closely related (Figure 6A), similar to the study by Kivlin and Treseder in California, soil C and nutrient concentration may be the most prevalent factors affecting soil EEAs on both global and regional scales [27]. A large number of previous studies have found that pH is an important factor affecting enzyme activity [14,58]. However, in this study, the effect of pH on soil EEAs were not significant (Figure 7), which may be related to the small range of pH change in this study area (5.76~6.86, table 2).
Soil EEAs are closely linked to the primary productivity of ecosystems, and generally have a substantial impact on nutrient cycling, soil structure, and soil function [59], and therefor, in the process of vegetation succession, we predicted that soil EEA would be lower in the early stage of vegetation succession when the substrate of enzymatic reactions was limited [26]. This was verified by the result that all measured soil EEAs were lower in bryophyte and herb community than shrub and tree community. Enzyme production was closely related to the soil nutrient concentration [24,25]. Soil nutrient concentration might largely influence the available substrate concentration [19]. In our study, the creasing soil EEAs along plant communities with different stages of vegetation succession were in consistent with the patterns of soil nutrient concentration. Soil TC, TN and C:N ratio were important factor explaining the lower soil EEAs in bryophyte and herb community than shrub and tree community (accounting for 10.00%, 9.34% and 9.60% of the variation,Table S2). Low TC and TN content in the early stage of vegetation succession would decrease the substrate availability for soil extracellular enzyme production [60], which ultimately limited soil EEAs [10,61]. In contrast, shrub and tree communities have greater root and plant biomass in the middle and late stages of vegetation succession, and use more microbial available resources for synthetic soil EEA in the form of aboveground and subsurface litter inputs [62], Soil EEA was significantly higher in shrub and tree communities than in bryophyte and herbaceous community (Figure 2). At the same time, with the deepening of rock weathering and soil development in the lava platform and the progress of vegetation succession, the content of soil available P gradually increased with the succession (Table 2), which may be due to the fact that the input of plant root secretions and the increase of microbial quantity promoted the separation of P in the soil and increased the availability of P in the soil [63]. The p-related soil EEAs of shrub and tree communities were significantly increased.
The soil EEAs normalized by MBC exhibited the highest values in the bryophyte community (Figure 3), despite having the lowest soil nutrient concentration (Table 2). We observed that soil nutrient concentration (TC, TN, NH4-N and EC) could be the major driver of the pattern of soil EEA/MBC (TC, TN, NH4-N and EC accounted for 9.06%, 8.92%, 7.62% and 7.41%, respectively, Table S2). The increased normalized soil EEAs in bryophyte community reflected a greater nutrient allocation to enzyme production responding to decreased resource availability rather than microbial growth [64]. This result was consistent with the strategy that soil microorganisms mined nutrients in SOM through soil extracellular enzymes to meet their nutrient requirements when nutrient availability is low [65]. A similar finding was reported by Dong et al who conducted a comparative the difference in soil EEA normalized by MBC across various levels of degraded grasslands in Ulan Buton, located in the eastern region of Inner Mongolia [16]. In contrast, with the progress of vegetation succession, when sufficient C and N were injected in the form of litter to meet the needs of microorganisms for C and N uptake [32], there were no significant difference in the soil EEAs normalized by MBC of the herb, shrub and tree communities, and the soil EEAs normalized by MBC were significantly lower than those of bryophyte communities (Figure 3). Previous studies have shown that microorganisms mediate the effects of environmental factors on soil EEA by altering the enzyme production efficiency [66]. There were no significant differences in the soil EEAs normalized by MBC among herbaceous community, shrub community and tree community. However, comparing with bryophyte community, soil microbial biomass carbon content in herbaceous community, shrub community and tree community have significantly increased. These indicates that soil microorganisms had no significant difference in the production efficiency of soil C, N and P enzymes at the late stage of vegetation succession.

4.2. Nutrient Limitation as Indicated by Enzymatic Stoichiometry

Soil extracellular enzyme stoichiometry (ES) related to the acquisition of nutrients such as C, N and P, reflects microbial nutrient acquisition and the availability of limiting resources [11,17]. An excellent approach to gain deep insight into microbial metabolic limitation is to quantify the relative investment in C, N, and P acquisition, which can be calculated using the vector characteristics of C-, N-, and P-related enzymes [29,67]. According to the existing research results, the relatively long vector length indicates C limitation; the vector angle is <45° or >45°, indicating the relative degree of N-limitation or P-limitation, respectively [9,46]. Our results show that the vector angle of bryophyte and herb communities were >45°, while the vector angle of shrub and tree communities were<45°, i.e., the C restriction of different vegetation communities gradually increases as succession progresses (Figure 5A), and shifts from relative P limitation to relative N limitation (Figure 5B). Our results supported our second hypothesis that, with the succession progressing, the restrictive impact of nitrogen will be amplified and exacerbated over time, leading to a shift in microbial nutrient limitation from phosphorus to nitrogen. Possible reasons for the shift from P restriction to N restriction in plant communities during the succession phase of vegetation are that ecosystems mainly decompose and mineralize SOM by soil extracellular enzymes to obtain P for microbial and plant uptake [35,36]. On the one hand, as vegetation succession proceeds, the organic acids secreted by plant roots and extracellular enzymes secreted by microorganisms promote soil P content and availability (Table 2) [14,68]. On the other hand, in the later stages of vegetation succession, larger community biomass may input more available resources into the soil, increasing soil carbon and nitrogen content, where the increase of soil carbon is greater than the increase of soil nitrogen, and the C:N of the soil increases, resulting in a decrease in soil nitrogen availability [2,11]. However, with the succession progressing, the C and N restriction of the community in the tree community stage slows down. This is because in the late stage of vegetation succession, with the increase of plant litter and secretions, the number of microorganisms proliferate, the activity of extracellular enzymes in soil increases (Figure 2G), and the ability of soil extracellular enzymes to decompose and mineralize SOM is enhanced.
The stoichiometry ratio of extracellular enzyme activity participating in the C and N cycles can reflect the balance between microbial nutrient requirements and nutrient availability. According to the theory of resource allocation [69], microorganisms consume large amounts of energy to produce extracellular enzymes to obtain relatively limited nutrients. A global meta-analysis by Sinsabaugh et al demonstrated that globally, the ratio of C:N:P obtained from enzymes in topsoil is 1:1:1, suggesting that there are broad patterns in microorganisms maintaining the stoichiometric balance of C, N, and P in different ecosystems [28]. However, this proportion varies greatly depending on the type of ecosystem and regional environmental conditions. For example, the acquisition of enzyme C:N:P in the topsoil of forest ecosystems in eastern China is close to 1:1:1 [14], but the acquisition of enzyme C:N:P from forest soils in China based on nationwide datasets deviates from 1:1:1 [11]. In temperate grassland ecosystems in northern China, Peng and Wangreported a C:N:P ratio of 1:1.2:1.4 for acquiring enzymes [19]. In the Loess Plateau of China, the average ratio of C:N:P acquisition enzyme was 1:1.08:1.28 [21]. In this study, the average ratio of C:N:P of the acquiring enzyme was 1:0.89:1.25 (Figure 4), which also deviated from 1:1:1, indicating that (1) the N-acquiring enzyme activity was relatively less than C or P-acquiring enzyme activity, and (2) the P-acquiring enzyme activity was relatively greater than the C or N-acquiring enzyme activity.
The influence of vegetation type on soil microbial metabolic activities can be attributed to two points, one is the effect of plant residues entering the soil on soil physicochemical and nutrient status [70,71], secondly, the effects of root system material exchange through the root-soil interface on microbial activity, community structure and soil microenvironment [20,72]. TC, TN, MBC, NH4-N, NO3-N and AP accompanied the change of vegetation type (Shurb>Herb> bryophyte), which further confirmed that the difference between soil physicochemical properties [58] and plant residue properties caused by vegetation type change affected soil EEAs [73].

5. Conclusions

Compared with bryophyte and herbaceous communities in the early stage of succession, soil nutrient content and enzyme activity of shrub and tree communities increased significantly in the middle and late stages of succession. Soil microbial nutrients transforms from P limitation (angle>45°) to N limitation (angle<45°). Redundancy analysis showed that TC, TN, EC and C:N were important drivers of variation in soil EEAs and ES in vegetation at different succession stages. Overall, our results suggest that primary succession processes lead to nutrient restriction transformation. Soil ES can be used as a sensitive index of relative resource constraints at different stages of primary succession mediated by soil microorganisms.

Supplementary Materials

The following supporting information can be downloaded at the website of this paper posted on Preprints.org. Table S1 Correlation and significance of EEAs, EEAs/MBC and ES and environmental factors; Table S2 Individual effect of each environmental factor.

Author Contributions

Hongbin Yin: Methodology, Formal analysis, Writing-original draft. Mingyi Xu: Conceptualization, Methodology, Writing-original draft. Qingyang Huang: Formal analysis. Lihong Xie: Formal analysis, Visualization, Software. Yang Fan: Investigation; Chao Zhang: Data curation, Validation. Gang Sha: Investigation, Formal analysis. Hongjie Cao: Writing-review, editing & funding acquisition. Yingnan Liu: Supervision, Project administration. Hongbin Yin and Mingyi Xu contributed equally to this work. All authors have read and agreed to the published version of the manuscript.

Funding

This research was supported by the Key Research & Development Program funding project of Heilongjiang Province (GA21C030), the Key Research & Development Program funding project of Heilongjiang Academy of Sciences (ZDYF2024ZR03), and the Research Funds of Provincial Research Institutes of Heilongjiang Province (ZNBZ2022ZR07).

Data Availability Statement

Data are contained within the article and Supplementary Materials.

Acknowledgments

We would like to thank the Wudalianchi National Nature Reserve Management Committee for providing study sites.

Conflicts of Interest

The authors declare no conflicts of interest.

References

  1. Liu, Q.; Xu, X.; Wang, H.; Blagodatskaya, E.; Kuzyakov, Y. Dominant extracellular enzymes in priming of SOM decomposition depend on temperature. Geoderma 2019, 343, 187–195. [Google Scholar] [CrossRef]
  2. Rosinger, C.; Rousk, J.; Sandén, H. Can enzymatic stoichiometry be used to determine growth-limiting nutrients for microorganisms? - A critical assessment in two subtropical soils. Soil Biol. Biochem. 2018, 128, 115–126. [Google Scholar] [CrossRef]
  3. Waring, B.G.; Weintraub, S.R.; Sinsabaugh, R.L. Ecoenzymatic stoichiometry of microbial nutrient acquisition in tropical soils. Biogeochemistry 2013, 117, 101–113. [Google Scholar] [CrossRef]
  4. López-Aizpún, M.; Arango-Mora, C.; Santamaría, C.; Lasheras, E.; Santamaría, J.; Ciganda, V.; Cárdenas, L.; Elustondo, D. Atmospheric ammonia concentration modulates soil enzyme and microbial activity in an oak forest affecting soil microbial biomass. Soil Biol. Biochem. 2018, 116, 378–387. [Google Scholar] [CrossRef]
  5. Sinsabaugh, R.L.; Manzoni, S.; Moorhead, D.L.; Richter, A. Carbon use efficiency of microbial communities: stoichiometry, methodology and modelling. Ecol. Lett. 2013, 16, 930–939. [Google Scholar] [CrossRef]
  6. Lalanne, J.-B.; Taggart, J.C.; Guo, M.S.; Herzel, L.; Schieler, A.; Li, G.-W. Evolutionary Convergence of Pathway-Specific Enzyme Expression Stoichiometry. Cell 2018, 173, 749–761. [Google Scholar] [CrossRef]
  7. Sinsabaugh, R.L.; Shah, J.J.F. Ecoenzymatic Stoichiometry and Ecological Theory. Annu. Rev. Ecol. Evol. Syst. 2012, 43, 313–343. [Google Scholar] [CrossRef]
  8. Mori, T. Does ecoenzymatic stoichiometry really determine microbial nutrient limitations? Soil Biol. Biochem. 2020, 146, 107816. [Google Scholar] [CrossRef]
  9. Cui, Y.; Bing, H.; Fang, L.; Jiang, M.; Shen, G.; Yu, J.; Wang, X.; Zhu, H.; Wu, Y.; Zhang, X. Extracellular enzyme stoichiometry reveals the carbon and phosphorus limitations of microbial metabolisms in the rhizosphere and bulk soils in alpine ecosystems. Plant Soil 2019, 458, 7–20. [Google Scholar] [CrossRef]
  10. Li, J.; Shangguan, Z.; Deng, L. Dynamics of soil microbial metabolic activity during grassland succession after farmland abandonment. Geoderma 2020, 363. [Google Scholar] [CrossRef]
  11. Bai, X.; Dippold, M.A.; An, S.; Wang, B.; Zhang, H.; Loeppmann, S. Extracellular enzyme activity and stoichiometry: The effect of soil microbial element limitation during leaf litter decomposition. Ecol. Indic. 2020, 121, 107200. [Google Scholar] [CrossRef]
  12. He, Q.; Wu, Y.; Bing, H.; Zhou, J.; Wang, J. Vegetation type rather than climate modulates the variation in soil enzyme activities and stoichiometry in subalpine forests in the eastern Tibetan Plateau. Geoderma 2020, 374. [Google Scholar] [CrossRef]
  13. Manzoni, S.; Čapek, P.; Mooshammer, M.; Lindahl, B.D.; Richter, A.; Šantrůčková, H. Optimal metabolic regulation along resource stoichiometry gradients. Ecol. Lett. 2017, 20, 1182–1191. [Google Scholar] [CrossRef]
  14. Xu, Z.; Yu, G.; Zhang, X.; He, N.; Wang, Q.; Wang, S.; Wang, R.; Zhao, N.; Jia, Y.; Wang, C. Soil enzyme activity and stoichiometry in forest ecosystems along the North-South Transect in eastern China (NSTEC). Soil Biol. Biochem. 2017, 104, 152–163. [Google Scholar] [CrossRef]
  15. Bowles, T.M.; Acosta-Martínez, V.; Calderón, F.; Jackson, L.E. Soil enzyme activities, microbial communities, and carbon and nitrogen availability in organic agroecosystems across an intensively-managed agricultural landscape. Soil Biol. Biochem. 2014, 68, 252–262. [Google Scholar] [CrossRef]
  16. Dong, C.C.; Wang, W.; Liu, H.Y.; Xu, X.T.; Zeng, H. Temperate grassland shifted from nitrogen to phosphorus limitation induced by degradation and nitrogen deposition: Evidence from soil extracellular enzyme stoichiometry. Ecol. Indic. 2019, 101, 453–464. [Google Scholar] [CrossRef]
  17. Cui, Y.; Fang, L.; Guo, X.; Han, F.; Ju, W.; Ye, L.; Wang, X.; Tan, W.; Zhang, X. Natural grassland as the optimal pattern of vegetation restoration in arid and semi-arid regions: Evidence from nutrient limitation of soil microbes. Sci. Total. Environ. 2018, 648, 388–397. [Google Scholar] [CrossRef]
  18. Yan, B.; Wang, X.; Sun, Y.; Fan, B.; Shi, L.; Liu, G. Vegetation rehabilitation increases soil enzyme activities in degraded land via carbon supply and nitrogen retention. Eur. J. Soil Biol. 2020, 98, 103186. [Google Scholar] [CrossRef]
  19. Peng, X.; Wang, W. Stoichiometry of soil extracellular enzyme activity along a climatic transect in temperate grasslands of northern China. Soil Biol. Biochem. 2016, 98, 74–84. [Google Scholar] [CrossRef]
  20. Cui, Y.; Fang, L.; Guo, X.; Wang, X.; Zhang, Y.; Li, P.; Zhang, X. Ecoenzymatic stoichiometry and microbial nutrient limitation in rhizosphere soil in the arid area of the northern Loess Plateau, China. Soil Biol. Biochem. 2018, 116, 11–21. [Google Scholar] [CrossRef]
  21. Yang, Y.; Liang, C.; Wang, Y.; Cheng, H.; An, S.; Chang, S.X. Soil extracellular enzyme stoichiometry reflects the shift from P- to N-limitation of microorganisms with grassland restoration. Soil Biol. Biochem. 2020, 149, 107928. [Google Scholar] [CrossRef]
  22. Zheng, H.; Liu, Y.; Chen, Y.; Zhang, J.; Li, H.; Wang, L.; Chen, Q. Short-term warming shifts microbial nutrient limitation without changing the bacterial community structure in an alpine timberline of the eastern Tibetan Plateau. Geoderma 2019, 360, 113985. [Google Scholar] [CrossRef]
  23. Cui, Y.; Bing, H.; Fang, L.; Jiang, M.; Shen, G.; Yu, J.; Wang, X.; Zhu, H.; Wu, Y.; Zhang, X. Extracellular enzyme stoichiometry reveals the carbon and phosphorus limitations of microbial metabolisms in the rhizosphere and bulk soils in alpine ecosystems. Plant Soil 2019, 458, 7–20. [Google Scholar] [CrossRef]
  24. Banerjee, S.; Bora, S.; Thrall, P.H.; Richardson, A.E. Soil C and N as causal factors of spatial variation in extracellular enzyme activity across grassland-woodland ecotones. Appl. Soil Ecol. 2016, 105, 1–8. [Google Scholar] [CrossRef]
  25. Cenini, V.L.; Fornara, D.A.; McMullan, G.; Ternan, N.; Carolan, R.; Crawley, M.J.; Clément, J.-C.; Lavorel, S. Linkages between extracellular enzyme activities and the carbon and nitrogen content of grassland soils. Soil Biol. Biochem. 2016, 96, 198–206. [Google Scholar] [CrossRef]
  26. Allison, S.D.; Gartner, T.; Holland, K.; Weintraub, M.; Sinsabaugh, R.L. Soil enzymes: linking proteomics and ecological process. In: Hurst, C., Crawford, R., Garland, J., Lipson, D., Mills, A., Stetzenbach, L. (Eds.), Manual of Environmental Microbiology. American Society of Microbiology Press, Washington D.C. 2007, pp.704-711. [CrossRef]
  27. Wang, J.; Huang, S.; He, Q.; Bing, H.; Chen, X.; Zhang, X.; Tian, X.; Zhou, J.; Wilcke, W.; Wu, Y. Microplate fluorimetric assay of soil leucine aminopeptidase activity: alkalization is not needed before fluorescence reading. Biol. Fertil. Soils 2019, 56, 281–285. [Google Scholar] [CrossRef]
  28. Sinsabaugh, R.L.; Lauber, C.L.; Weintraub, M.N.; Ahmed, B.; Allison, S.D.; Crenshaw, C.; Contosta, A.R.; Cusack, D.; Frey, S.; Gallo, M.E.; et al. Stoichiometry of soil enzyme activity at global scale. Ecol. Lett. 2008, 11, 1252–1264. [Google Scholar] [CrossRef]
  29. Moorhead, D.L.; Sinsabaugh, R.L.; Hill, B.H.; Weintraub, M.N. Vector analysis of ecoenzyme activities reveal constraints on coupled C, N and P dynamics. Soil Biol. Biochem. 2016, 93, 1–7. [Google Scholar] [CrossRef]
  30. Jiang, C.; Zhu, B.; Zeng, H. Soil extracellular enzyme stoichiometry reflects the unique habitat of karst tiankeng and helps to alleviate the P-limitation of soil microbes. Ecol. Indic. 2022, 144. [Google Scholar] [CrossRef]
  31. Cui, Y.; Bing, H.; Moorhead, D.L.; Delgado-Baquerizo, M.; Ye, L.; Yu, J.; Zhang, S.; Wang, X.; Peng, S.; Guo, X.; et al. Ecoenzymatic stoichiometry reveals widespread soil phosphorus limitation to microbial metabolism across Chinese forests. Commun. Earth Environ. 2022, 3, 1–8. [Google Scholar] [CrossRef]
  32. Wang, X.; Li, Y.; Wang, L.; Duan, Y.; Yao, B.; Chen, Y.; Cao, W. Soil extracellular enzyme stoichiometry reflects microbial metabolic limitations in different desert types of northwestern China. Sci. Total. Environ. 2023, 874, 162504. [Google Scholar] [CrossRef] [PubMed]
  33. Elser, J.J.; Bracken, M.E.S.; Cleland, E.E.; Gruner, D.S.; Harpole, W.S.; Hillebrand, H.; Ngai, J.T.; Seabloom, E.W.; Shurin, J.B.; Smith, J.E. Global analysis of nitrogen and phosphorus limitation of primary producers in freshwater, marine and terrestrial ecosystems. Ecol. Lett. 2007, 10, 1135–1142. [Google Scholar] [CrossRef] [PubMed]
  34. Li, Y.; Niu, S.; Yu, G. Aggravated phosphorus limitation on biomass production under increasing nitrogen loading: a meta-analysis. Glob. Chang. Biol. 2015, 22, 934–943. [Google Scholar] [CrossRef]
  35. Richardson, A.E.; Barea, J.-M.; McNeill, A.M.; Prigent-Combaret, C. Acquisition of phosphorus and nitrogen in the rhizosphere and plant growth promotion by microorganisms. Plant Soil 2009, 321, 305–339. [Google Scholar] [CrossRef]
  36. Bell, C.; Carrillo, Y.; Boot, C.M.; Rocca, J.D.; Pendall, E.; Wallenstein, M.D. Rhizosphere stoichiometry: are C : N : P ratios of plants, soils, and enzymes conserved at the plant species-level? New Phytol. 2013, 201, 505–517. [Google Scholar] [CrossRef]
  37. Mahowald, N.; Jickells, T.D.; Baker, A.R.; Artaxo, P.; Benitez-Nelson, C.R.; Bergametti, G.; Bond, T.C.; Chen, Y.; Cohen, D.D.; Herut, B.; et al. Global distribution of atmospheric phosphorus sources, concentrations and deposition rates, and anthropogenic impacts. Glob. Biogeochem. Cycles 2008, 22. [Google Scholar] [CrossRef]
  38. del Moral, R.; Wood, D.M. Early primary succession on the volcano Mount St. Helens. J. Veg. Sci. 1993, 4, 223–234. [Google Scholar] [CrossRef]
  39. Huang, Q.Y.; Wang, J.F.; Zhu, D.G.; Ni, H.W. Species Composition and Succession Discipline on Lava Flow of Different Periods Volcano, Wudalianchi China. Appl. Mech. Mater. 2014, 496-500:3005-3008. [CrossRef]
  40. Burns, R.G.; DeForest, J.L.; Marxsen, J.; Sinsabaugh, R.L.; Stromberger, M.E.; Wallenstein, M.D.; Weintraub, M.N.; Zoppini, A. Soil enzymes in a changing environment: Current knowledge and future directions. Soil Biol. Biochem. 2013, 58, 216–234. [Google Scholar] [CrossRef]
  41. Sinsabaugh, R.L. Phenol oxidase, peroxidase and organic matter dynamics of soil. Soil Biol. Biochem. 2010, 42, 391–404. [Google Scholar] [CrossRef]
  42. Freeman, C.; Liska, G.; Ostle, N.J.; Jones, S.E.; Lock, M.A. The use of fluorogenic substrates for measuring enzyme activity in peatlands. Plant Soil 1995, 175, 147–152. [Google Scholar] [CrossRef]
  43. Marx, M.-C.; Wood, M.; Jarvis, S. A microplate fluorimetric assay for the study of enzyme diversity in soils. Soil Biol. Biochem. 2001, 33, 1633–1640. [Google Scholar] [CrossRef]
  44. German, D.P.; Chacon, S.S.; Allison, S.D. Substrate concentration and enzyme allocation can affect rates of microbial decomposition. Ecology 2011, 92, 1471–1480. [Google Scholar] [CrossRef] [PubMed]
  45. Steinweg, J.M.; Dukes, J.S.; Paul, E.A.; Wallenstein, M.D. Microbial responses to multi-factor climate change: effects on soil enzymes. Front. Microbiol. 2013, 4, 146. [Google Scholar] [CrossRef]
  46. Chen, H.; Li, D.; Xiao, K.; Wang, K. Soil microbial processes and resource limitation in karst and non-karst forests. Funct. Ecol. 2018, 32, 1400–1409. [Google Scholar] [CrossRef]
  47. Moorhead, D.L.; Rinkes, Z.L.; Sinsabaugh, R.L.; Weintraub, M.N. Dynamic relationships between microbial biomass, respiration, inorganic nutrients and enzyme activities: informing enzyme-based decomposition models. Front. Microbiol. 2013, 4, 223. [Google Scholar] [CrossRef]
  48. Sterner, R.W.; Elser, J.J. Ecological Stoichiometry: The Biology of Elements from Molecules to the Biosphere. Princeton University Press, Princeton, 2002. [CrossRef]
  49. Gillooly, J.F.; Allen, A.P.; Brown, J.H.; Elser, J.J.; del Rio, C.M.; Savage, V.M.; West, G.B.; Woodruff, W.H.; Woods, H.A. The metabolic basis of whole-organism RNA and phosphorus content. Proc. Natl. Acad. Sci. 2005, 102, 11923–11927. [Google Scholar] [CrossRef]
  50. Allison, S.D.; Wallenstein, M.D.; Bradford, M.A. Soil-carbon response to warming dependent on microbial physiology. Nat. Geosci. 2010, 3, 336–340. [Google Scholar] [CrossRef]
  51. Joergensen, R.G. The fumigation-extraction method to estimate soil microbial biomass: Calibration of the kEC value. Soil Biol. Biochem. 1996, 28, 25–31. [Google Scholar] [CrossRef]
  52. Brookes, P.C.; Powlson, D.S.; Jenkinson, D.S. Measurement of microbial biomass phosphorus in soil. Soil Biol. Biochem. 1982, 14, 319–329. [Google Scholar] [CrossRef]
  53. Bai, Y.; Wu, J.; Clark, C.M.; Naeem, S.; Pan, Q.; Huang, J.; Zhang, L.; Han, X. Tradeoffs and thresholds in the effects of nitrogen addition on biodiversity and ecosystem functioning: evidence from inner Mongolia Grasslands. Glob. Chang. Biol. 2010, 16, 358–372. [Google Scholar] [CrossRef]
  54. Caldwell, B.A. Enzyme activities as a component of soil biodiversity: A review. Pedobiologia 2005, 49, 637–644. [Google Scholar] [CrossRef]
  55. Shu, X.; Hu, Y.; Liu, W.; Xia, L.; Zhang, Y.; Zhou, W.; Liu, W.; Zhang, Y. Linking between soil properties, bacterial communities, enzyme activities, and soil organic carbon mineralization under ecological restoration in an alpine degraded grassland. Front. Microbiol. 2023, 14, 1131836. [Google Scholar] [CrossRef] [PubMed]
  56. Xiao, L.; Liu, G.; Li, P.; Xue, S. Ecological stoichiometry of plant-soil-enzyme interactions drives secondary plant succession in the abandoned grasslands of Loess Plateau, China. CATENA 2021, 202, 105302. [Google Scholar] [CrossRef]
  57. Kivlin, S.N.; Treseder, K.K. Soil extracellular enzyme activities correspond with abiotic factors more than fungal community composition. Biogeochemistry 2013, 117, 23–37. [Google Scholar] [CrossRef]
  58. Zuo, Y.; Li, J.; Zeng, H.; Wang, W. Vertical pattern and its driving factors in soil extracellular enzyme activity and stoichiometry along mountain grassland belts. Biogeochemistry 2018, 141, 23–39. [Google Scholar] [CrossRef]
  59. Raiesi, F.; Salek-Gilani, S. The potential activity of soil extracellular enzymes as an indicator for ecological restoration of rangeland soils after agricultural abandonment. Appl. Soil Ecol. 2018, 126, 140–147. [Google Scholar] [CrossRef]
  60. Keeler, B.L.; Hobbie, S.E.; Kellogg, L.E. Effects of Long-Term Nitrogen Addition on Microbial Enzyme Activity in Eight Forested and Grassland Sites: Implications for Litter and Soil Organic Matter Decomposition. Ecosystems 2008, 12, 1–15. [Google Scholar] [CrossRef]
  61. Liu, H.; Mi, Z.; Lin, L.; Wang, Y.; Zhang, Z.; Zhang, F.; Wang, H.; Liu, L.; Zhu, B.; Cao, G.; et al. Shifting plant species composition in response to climate change stabilizes grassland primary production. Proc. Natl. Acad. Sci. 2018, 115, 4051–4056. [Google Scholar] [CrossRef] [PubMed]
  62. Zhang, W.; Xu, Y.; Gao, D.; Wang, X.; Liu, W.; Deng, J.; Han, X.; Yang, G.; Feng, Y.; Ren, G. Ecoenzymatic stoichiometry and nutrient dynamics along a revegetation chronosequence in the soils of abandoned land and Robinia pseudoacacia plantation on the Loess Plateau, China. Soil Biol. Biochem. 2019, 134, 1–14. [Google Scholar] [CrossRef]
  63. Yu, P.; Zhang, X.; Gu, H.; Pan, J.; Chen, X. Soil phosphorus fractions and their availability over natural succession from clear-cut of a mixed broadleaved and Korean pine forest in northeast China. J. For. Res. 2021, 33, 253–260. [Google Scholar] [CrossRef]
  64. Allison, S.D.; Weintraub, M.N.; Gartner, T.B.; Waldrop, M.P. Evolutionary-Economic Principles as Regulators of Soil Enzyme Production and Ecosystem Function. In Soil Enzymology; Springer: Berlin/Heidelberg, Geramny, 2010. [Google Scholar] [CrossRef]
  65. Craine, J.M.; Morrow, C.; Fierer, N. Microbial nitrogen limitation increases decomposition. Ecology 2007, 88, 2105–2113. [Google Scholar] [CrossRef] [PubMed]
  66. Bell, T.H.; Klironomos, J.N.; Henry, H.A.L. Seasonal Responses of Extracellular Enzyme Activity and Microbial Biomass to Warming and Nitrogen Addition. Soil Sci. Soc. Am. J. 2010, 74, 820–828. [Google Scholar] [CrossRef]
  67. Gai, X.; Li, S.; Zhang, X.; Bian, F.; Yang, C.; Zhong, Z. Effects of chicken farming on soil extracellular enzyme activity and microbial nutrient limitation in Lei bamboo forest (Phyllostachys praecox) in subtropical China. Appl. Soil Ecol. 2021, 168, 104106. [Google Scholar] [CrossRef]
  68. Zhu, H.; Bing, H.; Wu, Y.; Sun, H.; Zhou, J. Low molecular weight organic acids regulate soil phosphorus availability in the soils of subalpine forests, eastern Tibetan Plateau. CATENA 2021, 203. [Google Scholar] [CrossRef]
  69. Bloom, A.J.; Chapin, F.S., III; Mooney, H.A. Resource Limitation in Plants-An Economic Analogy. Annu. Rev. Ecol. Evol. Syst. 1985, 16, 363–392. [Google Scholar] [CrossRef]
  70. Wang, B.; Xue, S.; Bin Liu, G.; Zhang, G.H.; Li, G.; Ren, Z.P. Changes in soil nutrient and enzyme activities under different vegetations in the Loess Plateau area, Northwest China. CATENA 2012, 92, 186–195. [Google Scholar] [CrossRef]
  71. Yin, R.; Deng, H.; Wang, H.-L.; Zhang, B. Vegetation type affects soil enzyme activities and microbial functional diversity following re-vegetation of a severely eroded red soil in sub-tropical China. CATENA 2014, 115, 96–103. [Google Scholar] [CrossRef]
  72. Okubo, A.; Matsusaka, M.; Sugiyama, S. Impacts of root symbiotic associations on interspecific variation in sugar exudation rates and rhizosphere microbial communities: a comparison among four plant families. Plant Soil 2015, 399, 345–356. [Google Scholar] [CrossRef]
  73. Zheng, H.; Liu, Y.; Zhang, J.; Chen, Y.; Yang, L.; Li, H.; Wang, L. Factors influencing soil enzyme activity in China’s forest ecosystems. Plant Ecol. 2017, 219, 31–44. [Google Scholar] [CrossRef]
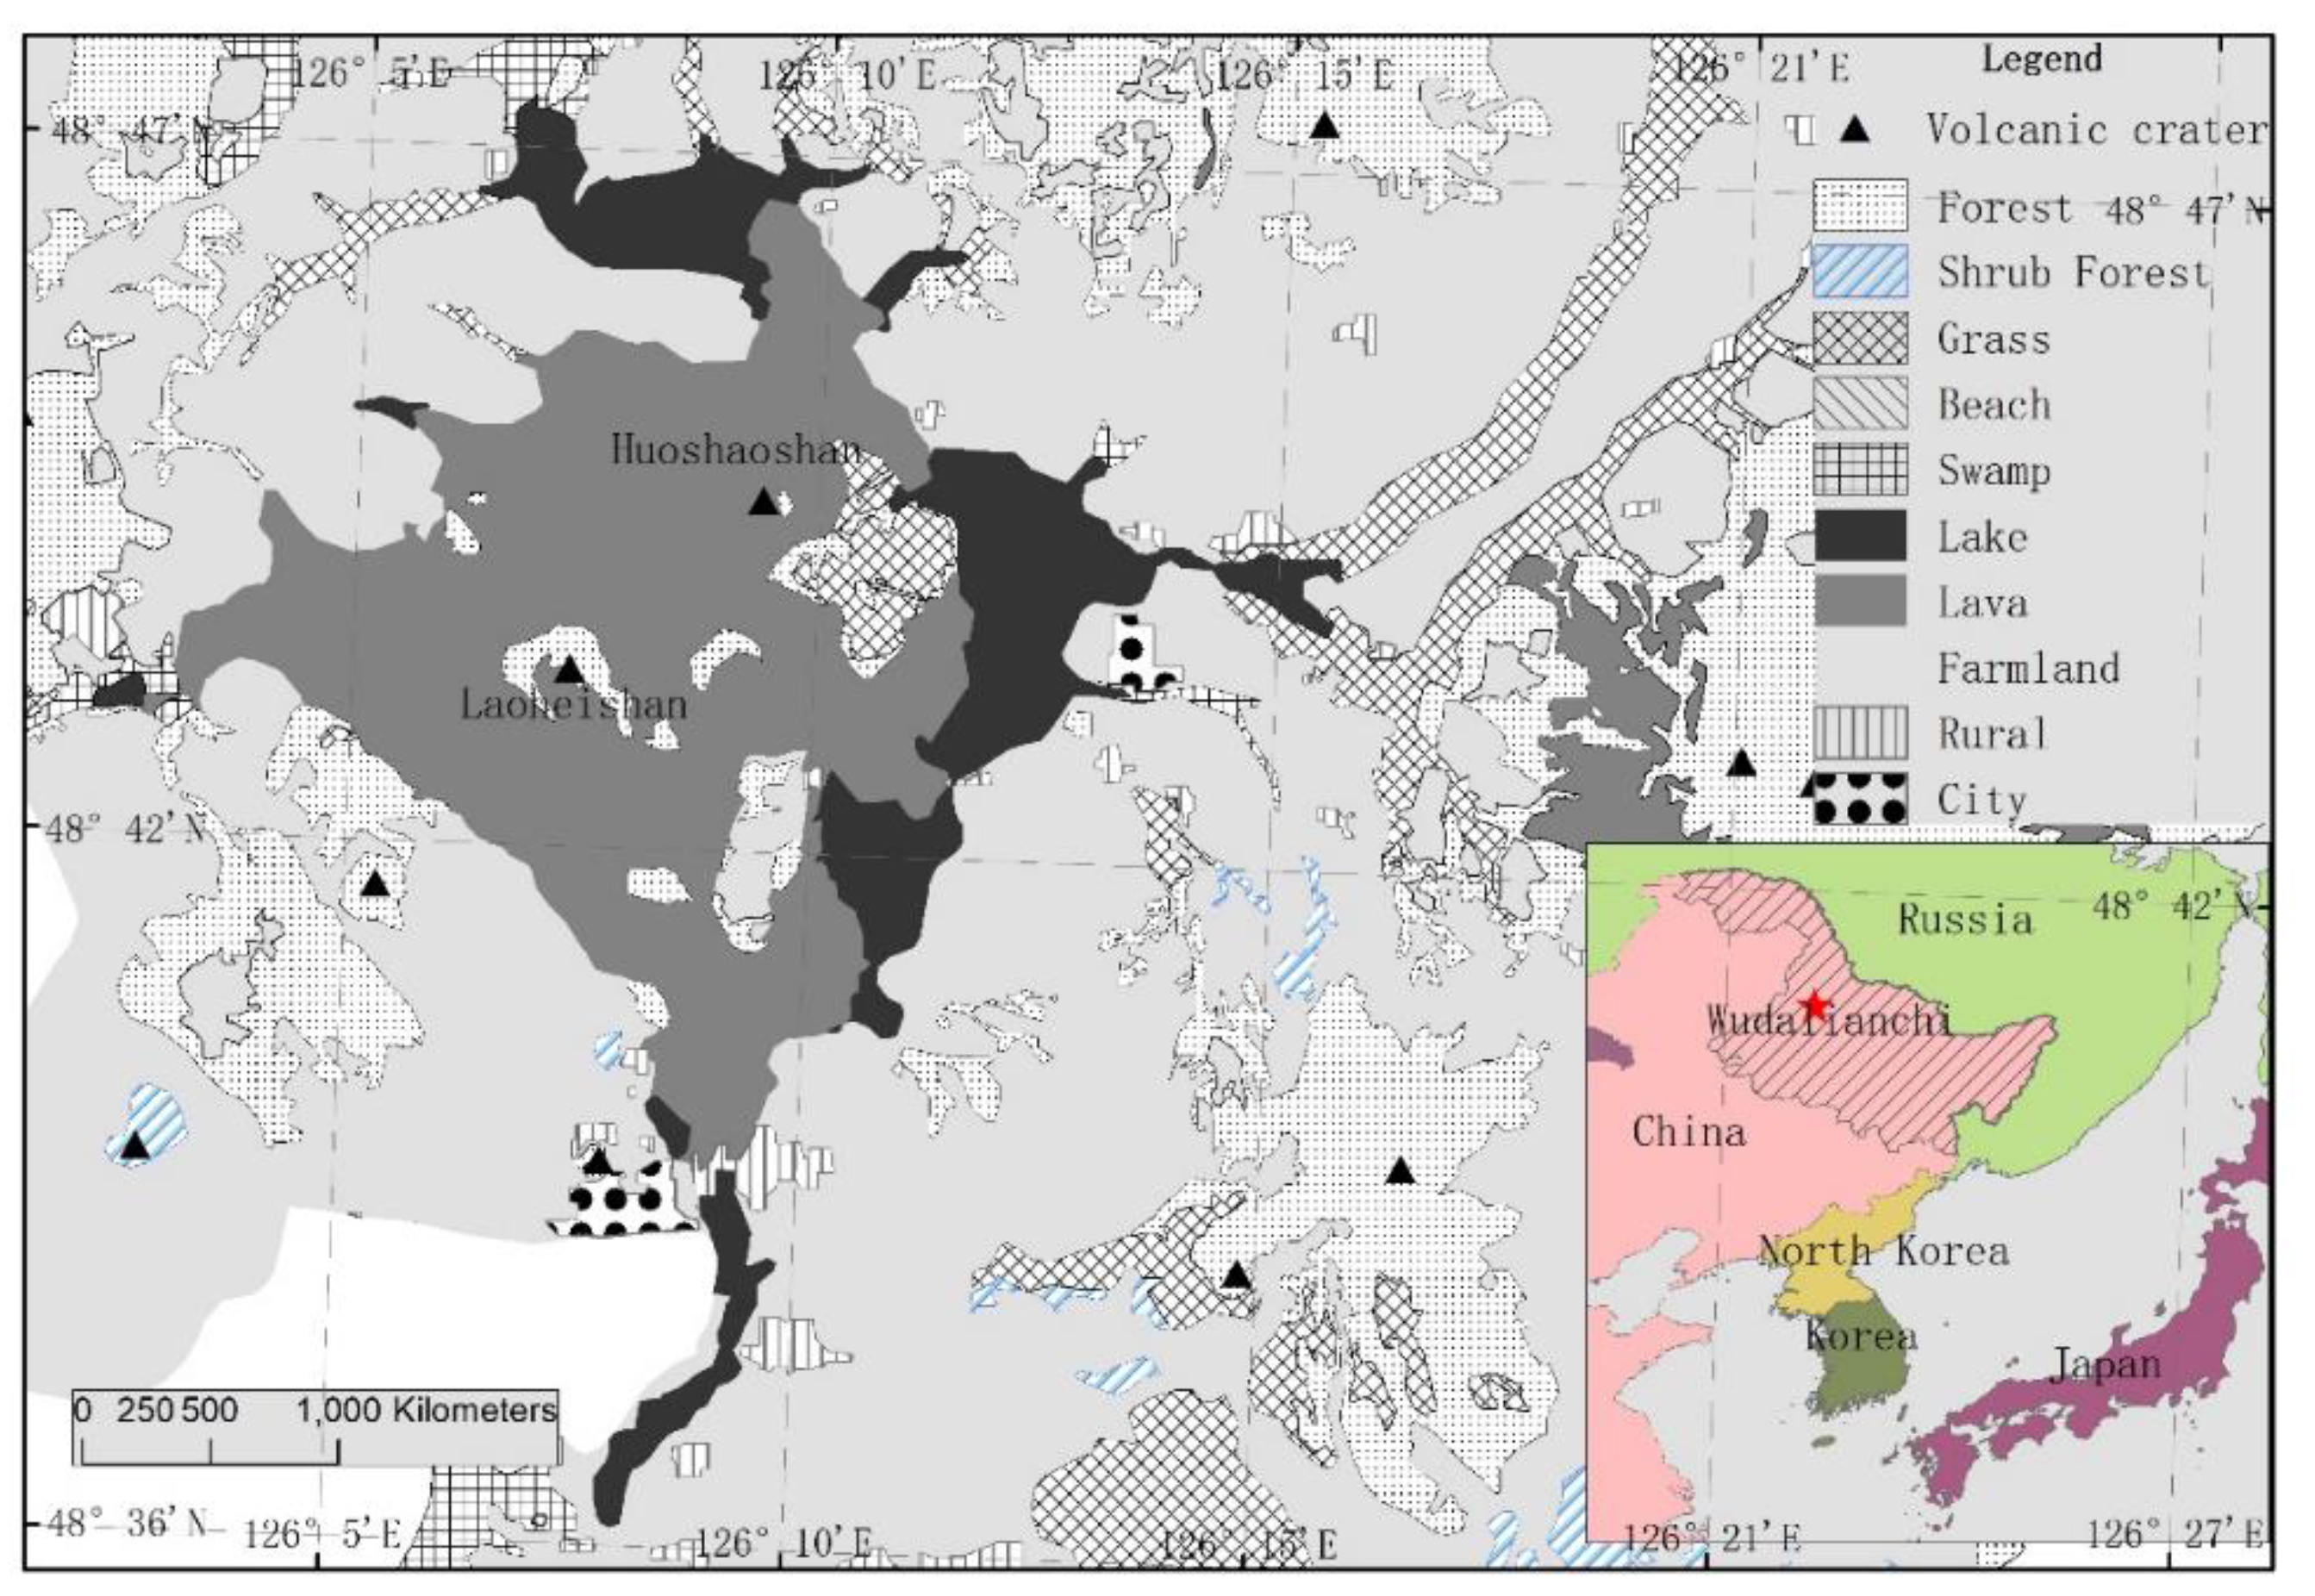
Figure 1. Location and basic information of experiment sites.
Preprints 103188 g001
Figure 2. Four vegetation types in the new volcanic lava terraces of Wudalianchi Volcano Nature Reserve: (a) Bryophyte community, (b) Herb community, (c) Shrub community, (d) Tree community.
Preprints 103188 g002
Table 1. Site characteristics of different vegetation types.
Succession stages Dominate Species
Bryophyte Racomitrium canescens, Grimmia pilifera, Bryum argenteum, Heddigia ciliata
Herb Artemisia sacrorum, Patrinia rupestris, Orostachys malacophyllus, Potentilla chinensis, Setaria viridis
Shurb Sorbaria sorbifolia, Spiraea media, Rubus matsumuranus
Tree Populus koreana, P.davidiana, Betula platyphylla, Larix gmelini
Table 2. Physicochemical properties of soils sampled from different vegetation types.
Vegetation type Br He Sh Tr
TC g kg-1 4.93±0.13c 11.87±0.52b 26.68±1.62a 11.76±0.58b
TN g kg-1 0.63±0.02d 1.07±0.03c 2.18±0.08a 0.88±0.03b
TP g kg-1 0.19±0.01b 0.19±0.01b 0.45±0.01a 0.18±0.01b
MBC mg kg-1 13.22±1.74d 68.90±8.37c 310.15±24.45a 215.98±17.94b
MBN mg kg-1 5.47±0.70c 9.31±0.54c 34.10±1.38a 23.07±1.95b
MBP mg kg-1 2.54±0.36c 2.83±0.19c 8.37±0.24a 5.55±0.36b
DOC mg kg-1 114.95±10.24b 117.23±24.87b 129.44±12.45a 98.72±14.25c
DON mg kg-1 2.29±0.15a 2.19±0.16a 2.13±0.12a 2.48±0.17a
NH4-N mg kg-1 1.29±0.09b 1.56±0.12b 4.06±0.32ab 6.79±2.22a
NO3-N mg kg-1 5.45±0.49c 9.13±0.36b 31.83±1.64a 3.17±0.42c
SAP mg kg-1 1.31±0.06b 1.37±0.07b 3.44±0.51a 2.62±0.38a
EC μs cm-1 27.12±1.32c 44.98±2.76b 106.48±7.34a 43.20±4.38b
pH 6.37±0.06b 6.86±0.04a 5.76±0.14c 6.75±0.06a
SM 0.10±0.01c 0.15±0.01b 0.23±0.01a 0.15±0.01b
Note: Br, Bryophyte communities; He, Herb communities; Sh, Shrub communities; Tr, Tree communities. TC: total carbon concentration, TN: total nitrogen concentration, TP: total phosphorus concentration, MBC: microbial biomass carbon, MBN: microbial biomass nitrogen, MBP: microbial biomass phosphorus, DOC: dissolved organic carbon, DON: dissolved organic nitrogen, NH4-N: ammonium nitrogen concentration, NO3-N: nitrate nitrogen concentration, SAP: soil available phosphorus concentration, EC: soil electrical conductivity, pH: soil pH, SM: soil moisture content. Values were means ± SE.
Disclaimer/Publisher’s Note: The statements, opinions and data contained in all publications are solely those of the individual author(s) and contributor(s) and not of MDPI and/or the editor(s). MDPI and/or the editor(s) disclaim responsibility for any injury to people or property resulting from any ideas, methods, instructions or products referred to in the content.
Copyright: This open access article is published under a Creative Commons CC BY 4.0 license, which permit the free download, distribution, and reuse, provided that the author and preprint are cited in any reuse.
Prerpints.org logo

Preprints.org is a free preprint server supported by MDPI in Basel, Switzerland.

Subscribe

© 2024 MDPI (Basel, Switzerland) unless otherwise stated