
Submitted:
05 April 2024
Posted:
08 April 2024
You are already at the latest version
Abstract
A novel concept of ion separation Anisotropic Diffusion Mobility Analyser (ADMA) with Individual Ion Counter (IIC) was shown by numerical modelling to be able to separate ions with high resolution and ultra-high sensitivity. An ADMA-IIC device has been developed and tested at sheath flow rates below 40 l/min with a number of chemicals relevant to airport security and military applications. The resolving power of the ADMA was observed to be in the range of 40 to 80. These data were close to the resolution obtained in numerical modelling predictions. It is greater than or comparable with the RP of currently available on-the-market devices for airport security and other applications. It was also confirmed that the ADMA technology enables very fast detection of analytes, at least 100 times faster than ion mobility spectrometers. It was shown that Brownian diffusion can be controlled and even overpowered by generating highly anisotropic diffusion in the ADMA device. The ultimate sensitivity of single-ion detection below the ppq range has been demonstrated.
Keywords:
ion cloud engineering
; ion mobility
; verification of numerical modelling
; ultra-sensitive ion detection
; airport security
1. Introduction
Airport security is a highly sophisticated industry that continually evolves to address existing and emerging chemical terrorist threats. The currently deployed explosive trace detectors are based on Ion Mobility Spectrometry (IMS), which has been developed over many decades, e.g., Eiceman and Karpas (2005). However, there are many challenges remaining, and a more capable solution is now required to keep passengers and the airways safe. There are many issues that need to be addressed to improve trace detection. The main technology challenges include:
- The specificity of threat detection to reduce false alarm rates due to interference from common harmless chemicals, perfumes, and other odour management compounds, e.g., Existing and Potential Standoff Explosives Detection Techniques (2004). This is especially important for challenging local environments with a high level of air pollution.
- Sensitivity is another major factor in the detection of concealed threats such as explosives that have a very low vapour pressure, e.g., Geng et al. (2015). This challenge is linked to passenger throughput in airports. Currently, detection of threats involves collecting a sample, e.g., by swabs, processing the sample with an IMS device, and deciding whether threats are present or not. Often, security staff randomly swabs a small fraction of passengers' hands; therefore, the majority of passengers are not tested for the presence of threats. It was recognised that the future of threat detection is non-contact sampling when a device operates in a similar way as explosive detection canine teams. This is based on detection via vapour emissions, also known as Threat Vapour Detection (TVD).
- The affordability, ease of operation, speed of detection, and dimensions (footprint) of trace detectors are also challenges to be addressed. For example, mass spectrometers and other vacuum technologies have not been accepted by the airport security market due to these factors.
Many interesting techniques have been developed in the last few years to improve trace threat detection; see, for example, Lichtenstein et al. (2014) and Geng et al. (2015). Another relevant method is the Differential Mobility Analyser (DMA), which was developed in the middle of the 20th century for the characterization of nanoparticles (Kulkarni et al., 2011). Recently, the DMA was successfully expanded to detect ionised molecules of explosives. In a conventional ion DMA, a high Resolving Power (RP) can be obtained with very high sheath flow rates; e.g., a planar DMA with a performance close to the theoretical limit has been reported by Labowsky and de la Mora (2006). Amo-Gonzaĺez and Peŕez (2018) enable the RP to be 110 at sheath flow rates of circa 1000 l/min.
Earlier, Gorbunov and Limanskii (2023) reported numerical modelling results for a novel concept of ion cloud engineering termed the Anisotropic Diffusion Mobility Analyser (ADMA) that predicted high-resolution analyte spectra to be obtained at low or medium flow rates. The concept of anisotropic diffusion is based on Gorbunov’s US10458946 (2018), where a miniature ion-selecting device for the identification of ions in gaseous media was described. In an ADMA device, conditions are created when diffusivity becomes anisotropic in one dimension, reducing the thickness of the ion cloud. This can be done either before the ion cloud enters the ion separation zone or even within the separation zone (US10458946). The narrowing of the thickness of the ion cloud enables the specificity of ion detection to be improved.
The ADMA device in this work incorporates a high-sensitivity detector where ions are counted individually. This Individual Ion Counting (IIC) detector is based on tagging ions with neutral aerosol particles and then counting them individually (Gorbunov 2017). The sensitivity of this detector is circa 1000 times higher than the sensitivity of Faraday plate electrometers (Burton and Gorbunov, 2018). The finite element numerical modelling predicted high sensitivity and specificity for the ADMA device with the IIC detector. Here, predictions of the modelling are tested experimentally on some explosives and organophosphorus compounds.
2. Experimental
Several different geometries of ADMA with different dimensions were modelled, built, and tested. Here we present a design of ADMA developed according to Gorbunov and Limanskii (2023). The main electrodes were manufactured from stainless steel and enclosed in a temperature-resistant PEEK casing (Figure 1). The electrodes were separated by a 2 mm-thick PEEK spacer. The sample inlet to the ADMA was stainless steel (Gorbunov, 2019). The ionisation chamber contains a cylindrical ionisation source (63Ni).
The selected ion outlet was integrated with the ADMA body (Figure 1). The pneumatic schematic of the device was similar to a planar DMA except for the detection of ionised species (Steer et al., 2014). The selected ion outlet has a tag flow supply from the IIC ion detector, the outlet slit of the ADMA and the tagged ion outlet connected to the IIC separation chamber (Figure 2). The outlet flow was driven by IIC, Gorbunov (2017). PTFE tubing was used. All tubing connections have been upgraded to brass Swagelok fittings (Figure 1).
- A sample vapour preparation module (8) with an analyte source with the required temperature-controlled dilution facilities and the supply of clean air or N2 from cylinders.
- An ionisation chamber (9) of diameter 4mm with a 63Ni radiation source, an ion cloud shaping section, and a bypass flow. The ion cloud shaping section enables to reshape the initially circular cross-section on the ion cloud in the ionisation chamber to a rectangular cross-section ion cloud. The rectangular-shaped cloud is introduced into the ion sample inlet of the ADMA. The ADMA electrodes are arranged to provide an ion-separating electric field across the ion-selecting section (7), positioned on the left (selected ion outlet) and on the right (ionised ion sample inlet) of the chamber.
- An ADMA ion separation chamber (7) with a sheath flow outlet (11), the sheath flow inlet (10) connected to a supply of sheath flow generated with the scroll pump (not shown) connected with PTFE tubing. The internal dimensions of the separation chamber are W = 3mm, H = 2mm, and the length L = 100mm. The width of the ion sample inlet slit was 0.6mm.
- A selected ion mobility outlet (12) with the IIC tagging chamber through which the ions of predetermined ion mobility can be directed to an ion detector. The selected ion outlet slit width was 0.2 mm. The distance between the ion inlet and ion outlet (the ion separation length) was 3 mm.
- An ADMA interface to the ion detector (IIC), wherein a tagging chamber (12) has a circular inlet that supplies a flow of tags from the tag generator (6).
All conductive elements of the ADMA and IIC were manufactured from stainless steel. The non-conductive elements were made from PEEK or PTFE.
The ADMA can work as an ion filter at a constant voltage difference between the electrodes or as a spectrometer in a scanning mode (variable voltage difference). In the filter mode, a sample is generated in the preparation module (8), where an analyte in solid or liquid form is evaporated at a given temperature in a flow of clean air or nitrogen and then diluted in a system of dynamic diluters. The system of diluters uses clean air or nitrogen from cylinders and enables the reduction of analyte concentrations down to ppb or low ppt levels.
A sample generated at the required mixing ratio is directed to the ionisation chamber combined with the ion cloud shaping section (9). The ion cloud is formed in the chamber, then shaped in the shaping section as described by Gorbunov and Limanskii (2023), and then directed to the ADMA ion separation zone (7). There is a bypass flow in the ion cloud shaping section that removes some of the flow before the sample enters the ADMA sample inlet slit. This is necessary in some cases to form the required ion cloud shape (Gorbunov, 2019; Steer et al., 2014).
The ionisation chamber and an ion cloud shaping section (9) are mounted on the right electrode of the ADMA next to the sample inlet slit (Figure 2). In the ADMA separation chamber, the ion cloud sample flow is exposed to the drag force generated by the sheath flow and the electric force field formed between ADMA electrodes (7). The electric force moves ions across the sheath flow direction according to ion mobility, and the drag force carries ions along the sheath flow as in a DMA (Steer et al., 2014). Therefore, it is possible to select the electric field strength that allows the target analyte to be directed to the selected ion outlet slit in the left ADMA electrode (Figure 2).
From the selected ion outlet slit, the ion cloud enters the tagging chamber (12), where ions are tagged with neutral aerosol particles of diameter 0.3 μm (the geometric standard deviation σg = 1.4) generated from a low-volatility organic compound in the tag generator (6), see Gorbunov (2017). The mixture of tagged ions with neutral tagging particles is directed to the IIC tagged ion extractor (4), where all tagged ions are separated from the neutral tagging particles and individually counted by an optical particle counter (5). The IIC ion counter enables close to 100% of ions to be detected. This provides a higher sensitivity of IIC than electrometers based on the Faraday plate, Burton and Gorbunov (2018). In this way, a predetermined analyte is selected from a mixture of various chemical compounds.
The sheath flow ranged from 35 l/min to 40 l/min. The sample flow rate was in the range of 0.05 to 0.3 l/min. The flow rate of the selected ADMA ions to the IIC detector was 0.2 to 0.3 l/min.
In the spectrometry mode, the varying electric potential difference between ADMA electrodes enables a spectrum of ions of different mobility in a sample to be recorded. In this mode, the ADMA resolution can be measured from the analyte peak parameters. Resolving power (RP) is defined by the following expressions
where kmax is the ion mobility of the peak maximum and FWHM(Δk) is the Full Width at Half Maximum (FWHM) of the peak ion mobility. The voltage difference of the peak maximum is Vmax, and FWHM(ΔV) is the FWHM of the peak in the voltage difference. The ion mobility k is a function of the voltage difference between the ADMA electrodes (V), the sheath flow (Qsh), and the geometry of the separation zone, defined as
Here H is the gap between ADMA electrodes, W is the width of the sheath flow, and L is the ion separating distance along the sheath flow (the distance between the centres of the ion sample inlet slit and the selected ion outlet slit). Expression (2) is obtained for an approximation of the uniform flow and the electric field strength in the separation zone of the ADMA. For a flow in a turbulent regime, this approximation gives a rough estimate of mobility, e.g., Gorbunov and Limanskii (2023).
The shape of the ion cloud in the ion sample inlet to the ADMA is crucial for the resolving power of the device. A PCB-based multi-electrode assembly probe has been built to measure the dimensions of the ion cloud; see Supplementary Materials (1. ADMA Focusing Array).
Results and discussion
The ADMA-IIC assembly (Figure 2) was used to obtain spectra of several explosives and other chemicals that are relevant to security threats as well as military applications. One of often used Chemical Warfare Agent (CWA) proxies is the organophosphorus compound diisopropyl methylphosphonate (DIMP). The DIMP spectra (Figure 3) were obtained with the flow rates and concentrations as described in the experimental section. There are four narrow peaks centred at 585 V, 872 V, 1168 V, and 1433 V. The first peak at 585 V was identified as the RIP peak; the peak at 872 V was DIMP monomer; the peak at 1168 V was dimer; and the last one (1433 V) was trimer.
Figure 3 shows raw data from the OPC that have not been processed to reduce the noise level. The noise level was < 1 count per second. This confirms that the thermal noise does not affect the readings of the IIC.
The intensity of the spectra is the number of counts per second measured by the IIC. The ion concentration (IC per cm3) measured by the OPC was for example, for the trimer (the largest peak maximum) IC is 960 cm-3, or 36 ppq. The smaller trimer peak has IC = 600 cm-3, or 22 ppq.
The dimer’s largest peak IC is 950 cm-3 or 35 ppq. The smallest dimer peak has an IC of 20 cm-3, or 0.7 ppq or 700 parts per quintillion (700 ppl).
The monomer’s largest peak IC is 1,510/5 = 302 cm-3, or 11 ppq. The smallest monomer peak has an IC = 50/5 = 10 cm-3 or 0.35 ppq, or 350 parts per quintillion (350 ppql).
The evolution of DIMP spectra is a complex process because of non-linear ion-molecular and ion-ion reactions that produce different clusters. The monomer appeared at the smallest concentrations. An increase in concentrations causes the formation of dimers and then trimers. This indicated a competition for ions between the RIP and DIMP clusters.
The resolving power of the system ADMA-IIC was estimated according to expression (1). For the trimer at the highest concentration, the ratio of Vmax/FWHM(DV) = 59. At the lower concentration, the RP of the system was even higher: RP = Vmax/FWHM(DV) =79. Therefore, the RP for the trimer was increasing with decreasing the analyte concentration.
Another organophosphorus compound tested was dimethyl methylphosphonate (DMMP), which shows similar spectra (Figure 4). The mobility of DMMP ions, according to expression (2), is slightly higher than the mobility of DIMP ions. For example, the DMMP dimer peak maximum is at 925 V, but the DIMP dimer peak maximum is at a higher voltage of 1168 V. The ion mobility is proportional to the maximum peak voltage ~ Vmax-1; therefore, the mobility of the DMMP (kDMMP) is greater than the mobility of the DIMP (kDIMP), or kDMMP = 1.26 ⋅ kDIMP.
The ion mobility is influenced by the molecular weight and the collision cross-section of the ion (Ω); k ~ [(m+M)/(m·M)]1/2/Ω; see, e.g., Kiss and Heeren (2011). For the DIMP, the molecular weight is 180 g/mol, while for the DMMP, it is 124 g/mol. Here m is the mass of the buffer gas, and M is the mass of the analyte molecule. For the spherical model of molecules, the ratio of kDIMP to kDMMP was 1.2. This estimate is in good agreement with the experimental data (1.26), given that the spherical model does not account for the real shape of molecules.
The RP for the DMMP dimer is 46 at low concentration, but for the DIMP dimer, it is 50. This is not surprising, given that the diffusion coefficient is proportional to the mobility k. The influence of ion mobility on the RP is clearly shown in the supplement materials (3. Influence of ion mobility on the resolving power).
The DMMP results confirmed very low background noise (Figure 4). This shows that the digital ion current quantification by the IIC sims is favourable for low-concentration threat detection. This could potentially provide a method for earlier warning against various threats.
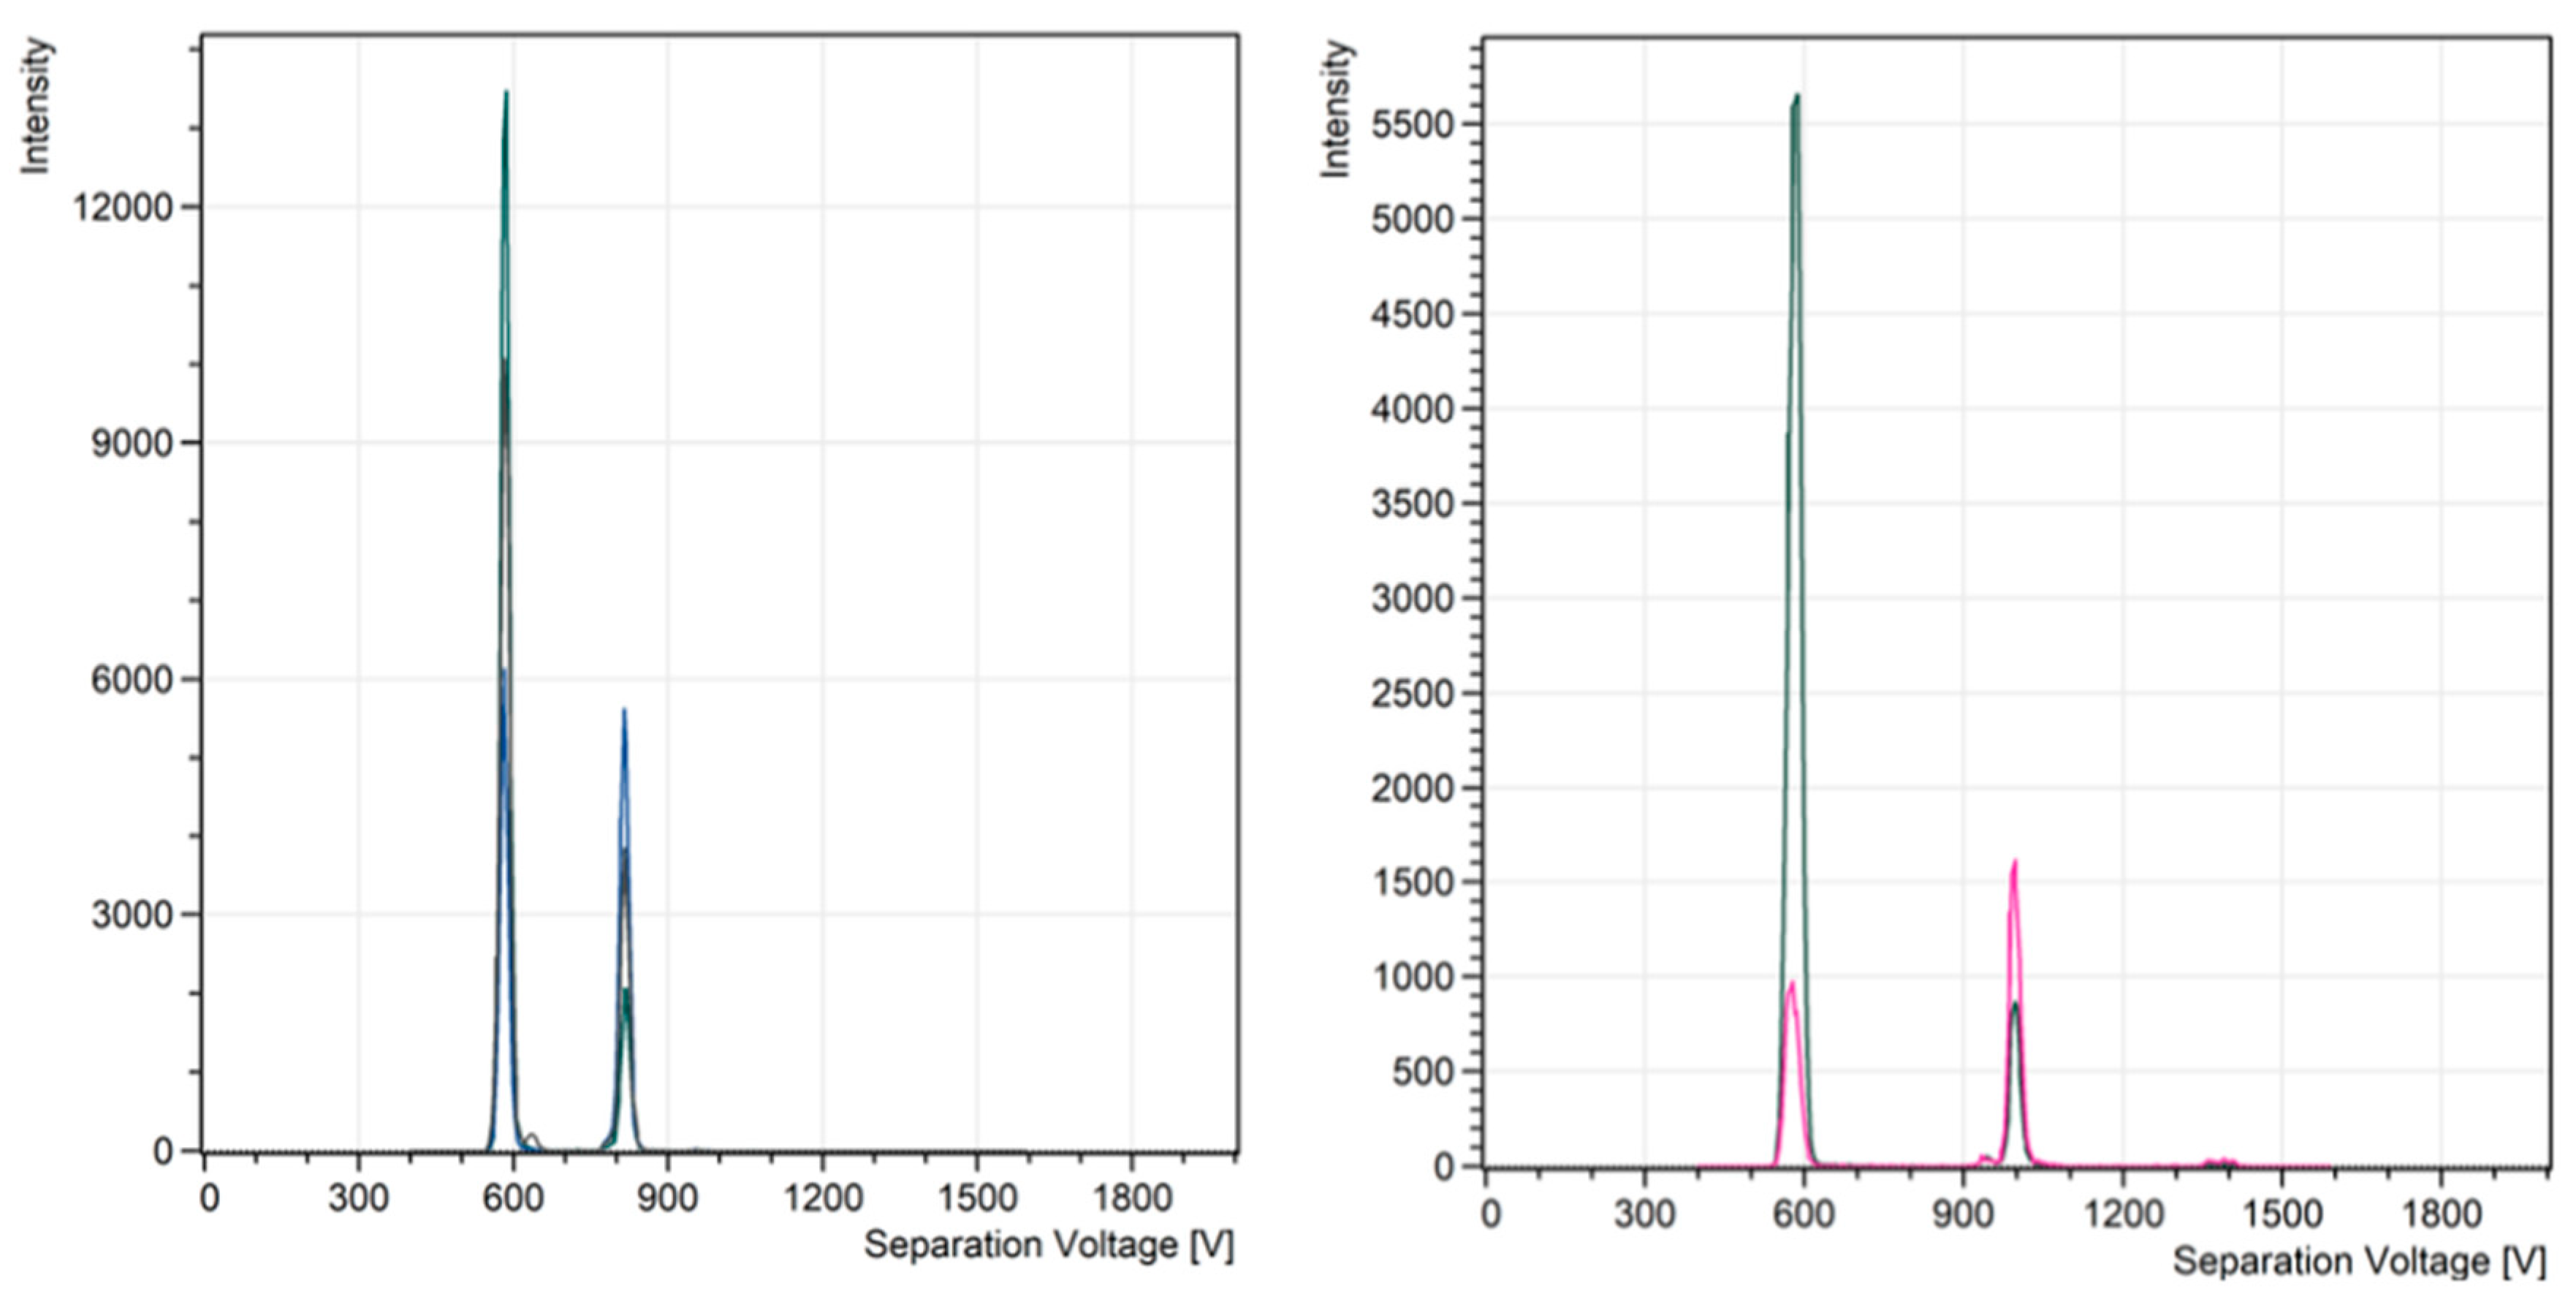
Samples of two explosives, TNT (2,4,6-trinitrotoluene) and PETN (pentaerythritol tetranitrate), were also investigated. The TNT monomer peak at 822 V is clearly separated from the RIP peak (580 V); see Figure 5. The resolving power of the TNT monomer was 46. The background noise was as low as it was for organophosphorus compounds (Figure 3 and Figure 4). Similar spectra were recorded for PETN (Figure 5). A monomer signal was at ~1,000 V. The resolving power for the monomer was RP=77.
The range of resolving power for the organophosphorus compounds and explosives was from 50 to 79. This range does not contradict the numerical modelling results (Gorbunov and Limanskii, 2023). For example, for the TNT measured in this paper, RP was 46, and in the numerical modelling, the RP ranges from 64 (zero turbulent diffusion coefficient) to ~20 for the turbulent diffusivity of ~0.4 cm2/s. To achieve a good agreement between the experiment and the numerical modelling, the turbulent diffusivity coefficient should be 0.05 cm2/s.
It is very difficult to measure the turbulent diffusion coefficient in the ADMA separation zone (3mm x 3mm x 3mm). However, all the RP data obtained indicate that the unknown turbulent diffusivity coefficient should be smaller than 0.05 cm2/s to avoid a contradiction with the experimental measurements and numerical modelling. The Brownian diffusion coefficient for the TNT at STP is 0.057 cm2/s; therefore, it seems that in the ADMA, a contribution from the turbulence diffusivity to the broadening of the ion cloud is less than that from Brownian diffusion.
The spectra (Figure 3, Figure 4 and Figure 5) were obtained without any post-processing or electronic filtration. The noise level was very low compared to the IMS spectra. This is because of the IIC detection method, where ion current is quantified by the number of individual ions counted with an optical particle counter. The ions, after tagging, increase in size up to 0.3 μm in diameter (tag particle diameter) and become single-charged aerosol particles. For sub-micron particles, false signal counting rates are practically zero; they are much less than 1 count per second. This feature of the IIC enables the detection of extremely low concentrations of analytes (Gorbunov et. al., 2018).
Electrometers with Faraday plates or cups are commonly used for ion detection at atmospheric pressure. In this work, we count ions individually because it is a more sensitive method, enabling a number of advantages. First, it’s truly digital ion detection when each ion is tagged with a larger neutral aerosol particle and counted with OPC (Gorbunov, 2017). This enables greater sensitivity than with electrometers (Burton and Gorbunov, 2018). Another advantage of the IIC is its very low noise level, which limits the sensitivity of electrometers, e.g., the thermal Johnson-Nyquist noise. This unavoidable noise in the electrometers is not essential in the IIC due to the fact that the electric current of the signal caused by the scattered light by a single tagged ion in an OPC is much greater than the thermal noise (Gorbunov, Burton, and Paling, 2018).
The mixing ratios of ions in the IIC device were in the ppq and ppql ranges. This is an important advantage of the ADMA-IIC method for the detection of trace compounds in air. To fully evolve the full potential of the IIC’s ultra-high sensitivity, the analyte molecules should be effectively ionised (Ewing et al., 2001), transferred through the ion cloud-forming region into the ADMA ion separation zone, and finally efficiently tagged and extracted to the OPC. Analyte ions can be lost at all these steps. The first two steps have been examined in many papers, e.g., Cumeras et al. (2015), Ryan et al. (2011), and Woodbury et al. (2020). Further quantification of the losses at these steps was not the subject of this paper.
The sensitivity of an ideal 100% ion transfer from the ionisation chamber to the OPC can be evaluated from the background obtained in this paper. If we assume a worst-case scenario when the background noise level is in the range of 1 to 3 counts per cm-3, then the ideal minimal detection limit would be ~ 0.01 ppq or 10 ppql. This ultra-low detection level confirms the zepto-ampere detection limit obtained experimentally with the IIC by Gorbunov at al., (2018).
The sensitivity achieved to date could be estimated from the ideal evaluation, the ionisation efficiency (from 1% to 10%), the transfer efficiency from the ionisation chamber to the ADMA separation zone (about 50%), the tagging efficiency (close to 100%), and the ion extraction efficiency that ranges from 70% to 95%. Thus, the high estimate of low-level detection of threat samples is 3 ppq.
A direct evaluation of the ADMA-IIC sensitivity was rather difficult. The main reasons were a number of challenges to developing a stable and reproducible generator of threats at the ppt and ppq levels. This was not the subject of this paper.
The ADMA device enables quantification of threats in the air with the highest sensitivity reported to date. It seems possible to expect that the ADMA-based ion separation method could open doors for selective non-contact detection of various compounds for airport security and other applications in a way that is similar to sniffing dogs. The possibility of TVD detection via vapour emissions with the ADMA-IIC is supported by the unprecedented high sensitivity and selectivity of the threat detection observed in this paper.
There are publications of the ppq level of detection with nanosensors. A promising supersensitive fingerprinting of explosives by chemically modified nanosensor arrays enables detection of threat molecules down to the ppq level (Lichtenstein et al., 2014; Engel et al., 2010). The fingerprinting of explosives is based on pattern recognition of the kinetics and thermodynamics of the interaction between the nanosensor array and the molecular analytes. To form a pattern, a plurality of non-specific chemical receptors was used.
This technique is a further development of the electronic nose concept that has been widely explored for detection of security threats and breath biomarkers since the middle of the 20th century but is still struggling to get to the market, e.g., Narayan (2023); Amman and Smith (2013). There are many challenges that electronic nose development faces; see Supplementary Materials (2. Comparison of the ADMA and DMA with electronic nose methods).
The importance of anisotropic diffusion for ion selection was verified directly by the comparison of the RP for the portable ADMA to the RP of portable ion selective devices developed without anisotropic diffusion. The RP for the ADMA device was ~30% greater than the RP for the latter devices.
Additional numerical modelling confirms that the anisotropic diffusion conditions are generated in the ion cloud shaping section (Figure 2) and at the beginning of the ion separation zone, close to the ion inlet electrode. According to modelling, the anisotropic diffusion zone occupies about 10% to 20% of the gap between the ADMA electrodes. It seems to be a small part of the ion separation zone. However, diffusion widening is a non-linear process; the ion cloud width is proportional to ~ √tR, where tR is the time in the separation zone. This gives us the relative widening of the ion cloud, which ranges from 20% to 40% in the space near the ion inlet. This estimate is based on a linear relationship between the displacement of the ion cloud and time. Therefore, it seems possible that the increase in the RP for ADMA cases at relatively low sheath flow rates could be attributed to the concept of anisotropic diffusion.
The main attractiveness of the ADMA-IIC method is the state of hardware and software development. Both portable ADMA and IIC are at the technical readiness level (TRL) of 6 or 7. The manufacturing cost of the ADMA and IIC is similar to the cost of currently available on market devices for swab-based threat detection in airports. Therefore, the ADMA-IIC method is in a sufficiently mature stage for trials in real environments for non-contact TVD threat screening.
Supplementary Materials
The following supporting information can be downloaded at the website of this paper posted on Preprints.org.
Conflicts of Interest
The authors declare no conflicts of interest.
References
- Amo-González, M.; Pérez, S. Planar Differential Mobility Analyzer with a Resolving Power of 110. Anal. Chem. 2018, 90, 6735–6741. [Google Scholar] [CrossRef] [PubMed]
- Amman, A.; Smith, D. Volatile Biomarkers; Elsevier: Amsterdam, The Netherlands, 2013. [Google Scholar]
- Burton, M.; Gorbunov, B. NMT–A new individual ion counting method: Comparison to a Faraday cup. Chem. Phys. 2018, 502, 60–65. [Google Scholar] [CrossRef]
- Cumeras, R.; Figueras, E.; Davis, C.E.; Baumbach, J.I.; Gràcia, I. Review on Ion Mobility Spectrometry. Part 1: Current instrumentation. Analyst 2014, 140, 1376–1390. [Google Scholar] [CrossRef] [PubMed]
- Engel, Y.; Elnathan, R.; Pevzner, A.; Davidi, G.; Flaxer, E.; Patolsky, F. Supersensitive Detection of Explosives by Silicon Nanowire Arrays. Angew. Chem. Int. Ed. 2010, 49, 6830–6835. [Google Scholar] [CrossRef] [PubMed]
- Ewing, R.; Atkinson, D.; Eiceman, G.; Ewing, G. A critical review of ion mobility spectrometry for the detection of explosives and explosive related compounds. Talanta 2001, 54, 515–529. [Google Scholar] [CrossRef] [PubMed]
- National Research Council. Existing and Potential Standoff Explosives Detection Techniques; The National Academies Press: Washington, DC, USA, 2004. [Google Scholar] [CrossRef]
- Geng, Y.; Ali, M.A.; Clulow, A.J.; Fan, S.; Burn, P.L.; Gentle, I.R.; Meredith, P.; Shaw, P.E. Unambiguous detection of nitrated explosive vapours by fluorescence quenching of dendrimer films. Nat. Commun. 2015, 6, 8240. [Google Scholar] [CrossRef]
- Gorbunov, B. Counting individual ions in the air by tagging them with particles. Chem. Phys. 2017, 492, 1–4. [Google Scholar] [CrossRef]
- Gorbunov, B.; Burton, M.; Paling, S. Zeptoampere electric current measurements with molecular tagging. Chem. Phys. 2018, 513, 112–115. [Google Scholar] [CrossRef]
- Gorbunov, B.; Limanskii, V. Anisotropic Diffusion Mobility Analyser Modelling. Numerical, 2023. [Google Scholar] [CrossRef]
- Eiceman, G.; Karpas, Z. Ion Mobility Spectrometry; Taylor & Francis Ltd.: London, UK, 2005. [Google Scholar] [CrossRef]
- Kiss, A.; Heeren, R.M.A. Size, weight and position: Ion mobility spectrometry and imaging MS combined. Anal. Bioanal. Chem. 2011, 399, 2623–2634. [Google Scholar] [CrossRef] [PubMed]
- Kulkarni, P.; Baron, P.A.; Willeke, K. Aerosol Measurement - Principles, Techniques, and Applications; John Wiley & Sons: Hoboken, NJ, USA, 2011. [Google Scholar]
- Labowsky, M.; Fernández de la Mora, J. Novel Ion Mobility Analyzers and Filters. J. Aerosol Sci. 2006, 37, 340–362. [Google Scholar] [CrossRef]
- Lichtenstein, A.; Havivi, E.; Shacham, R.; Hahamy, E.; Leibovich, R.; Pevzner, A.; Krivitsky, V.; Davivi, G.; Presman, I.; Elnathan, R.; et al. Supersensitive fingerprinting of explosives by chemically modified nanosensors arrays. Nat. Commun. 2014, 5, 4195. [Google Scholar] [CrossRef] [PubMed]
- Narayan, R. (Ed.) Encyclopedia of Sensors and Biosensors V. 1; Elsevier: Amsterdam, The Netherlands, 2023. [Google Scholar]
- Blase, R.C.; Silveira, J.A.; Gillig, K.J.; Gamage, C.M.; Russell, D.H. Increased ion transmission in IMS: A high resolution, periodic-focusing DC ion guide ion mobility spectrometer. Int. J. Mass Spectrom. 2011, 301, 166–173. [Google Scholar] [CrossRef]
- Steer, B.; Gorbunov, B.; Muir, R.; Ghimire, A.; Rowles, J. Portable Planar DMA: Development and Tests. Aerosol Sci. Technol. 2014, 48, 251–260. [Google Scholar] [CrossRef]
- US10458946, Miniature Ion Selecting Device for Identification of Ions in Gaseous Media. B. Gorbunov.
- Woodbury, D.; Schwartz, R.M.; Rockafellow, E.; Wahlstrand, J.K.; Milchberg, H.M. Absolute Measurement of Laser Ionization Yield in Atmospheric Pressure Range Gases over 14 Decades. Phys. Rev. Lett. 2020, 124, 013201. [Google Scholar] [CrossRef] [PubMed]
Figure 1.
A view of the ADMA assembly with the tagging chamber and the tagged ion outlet.
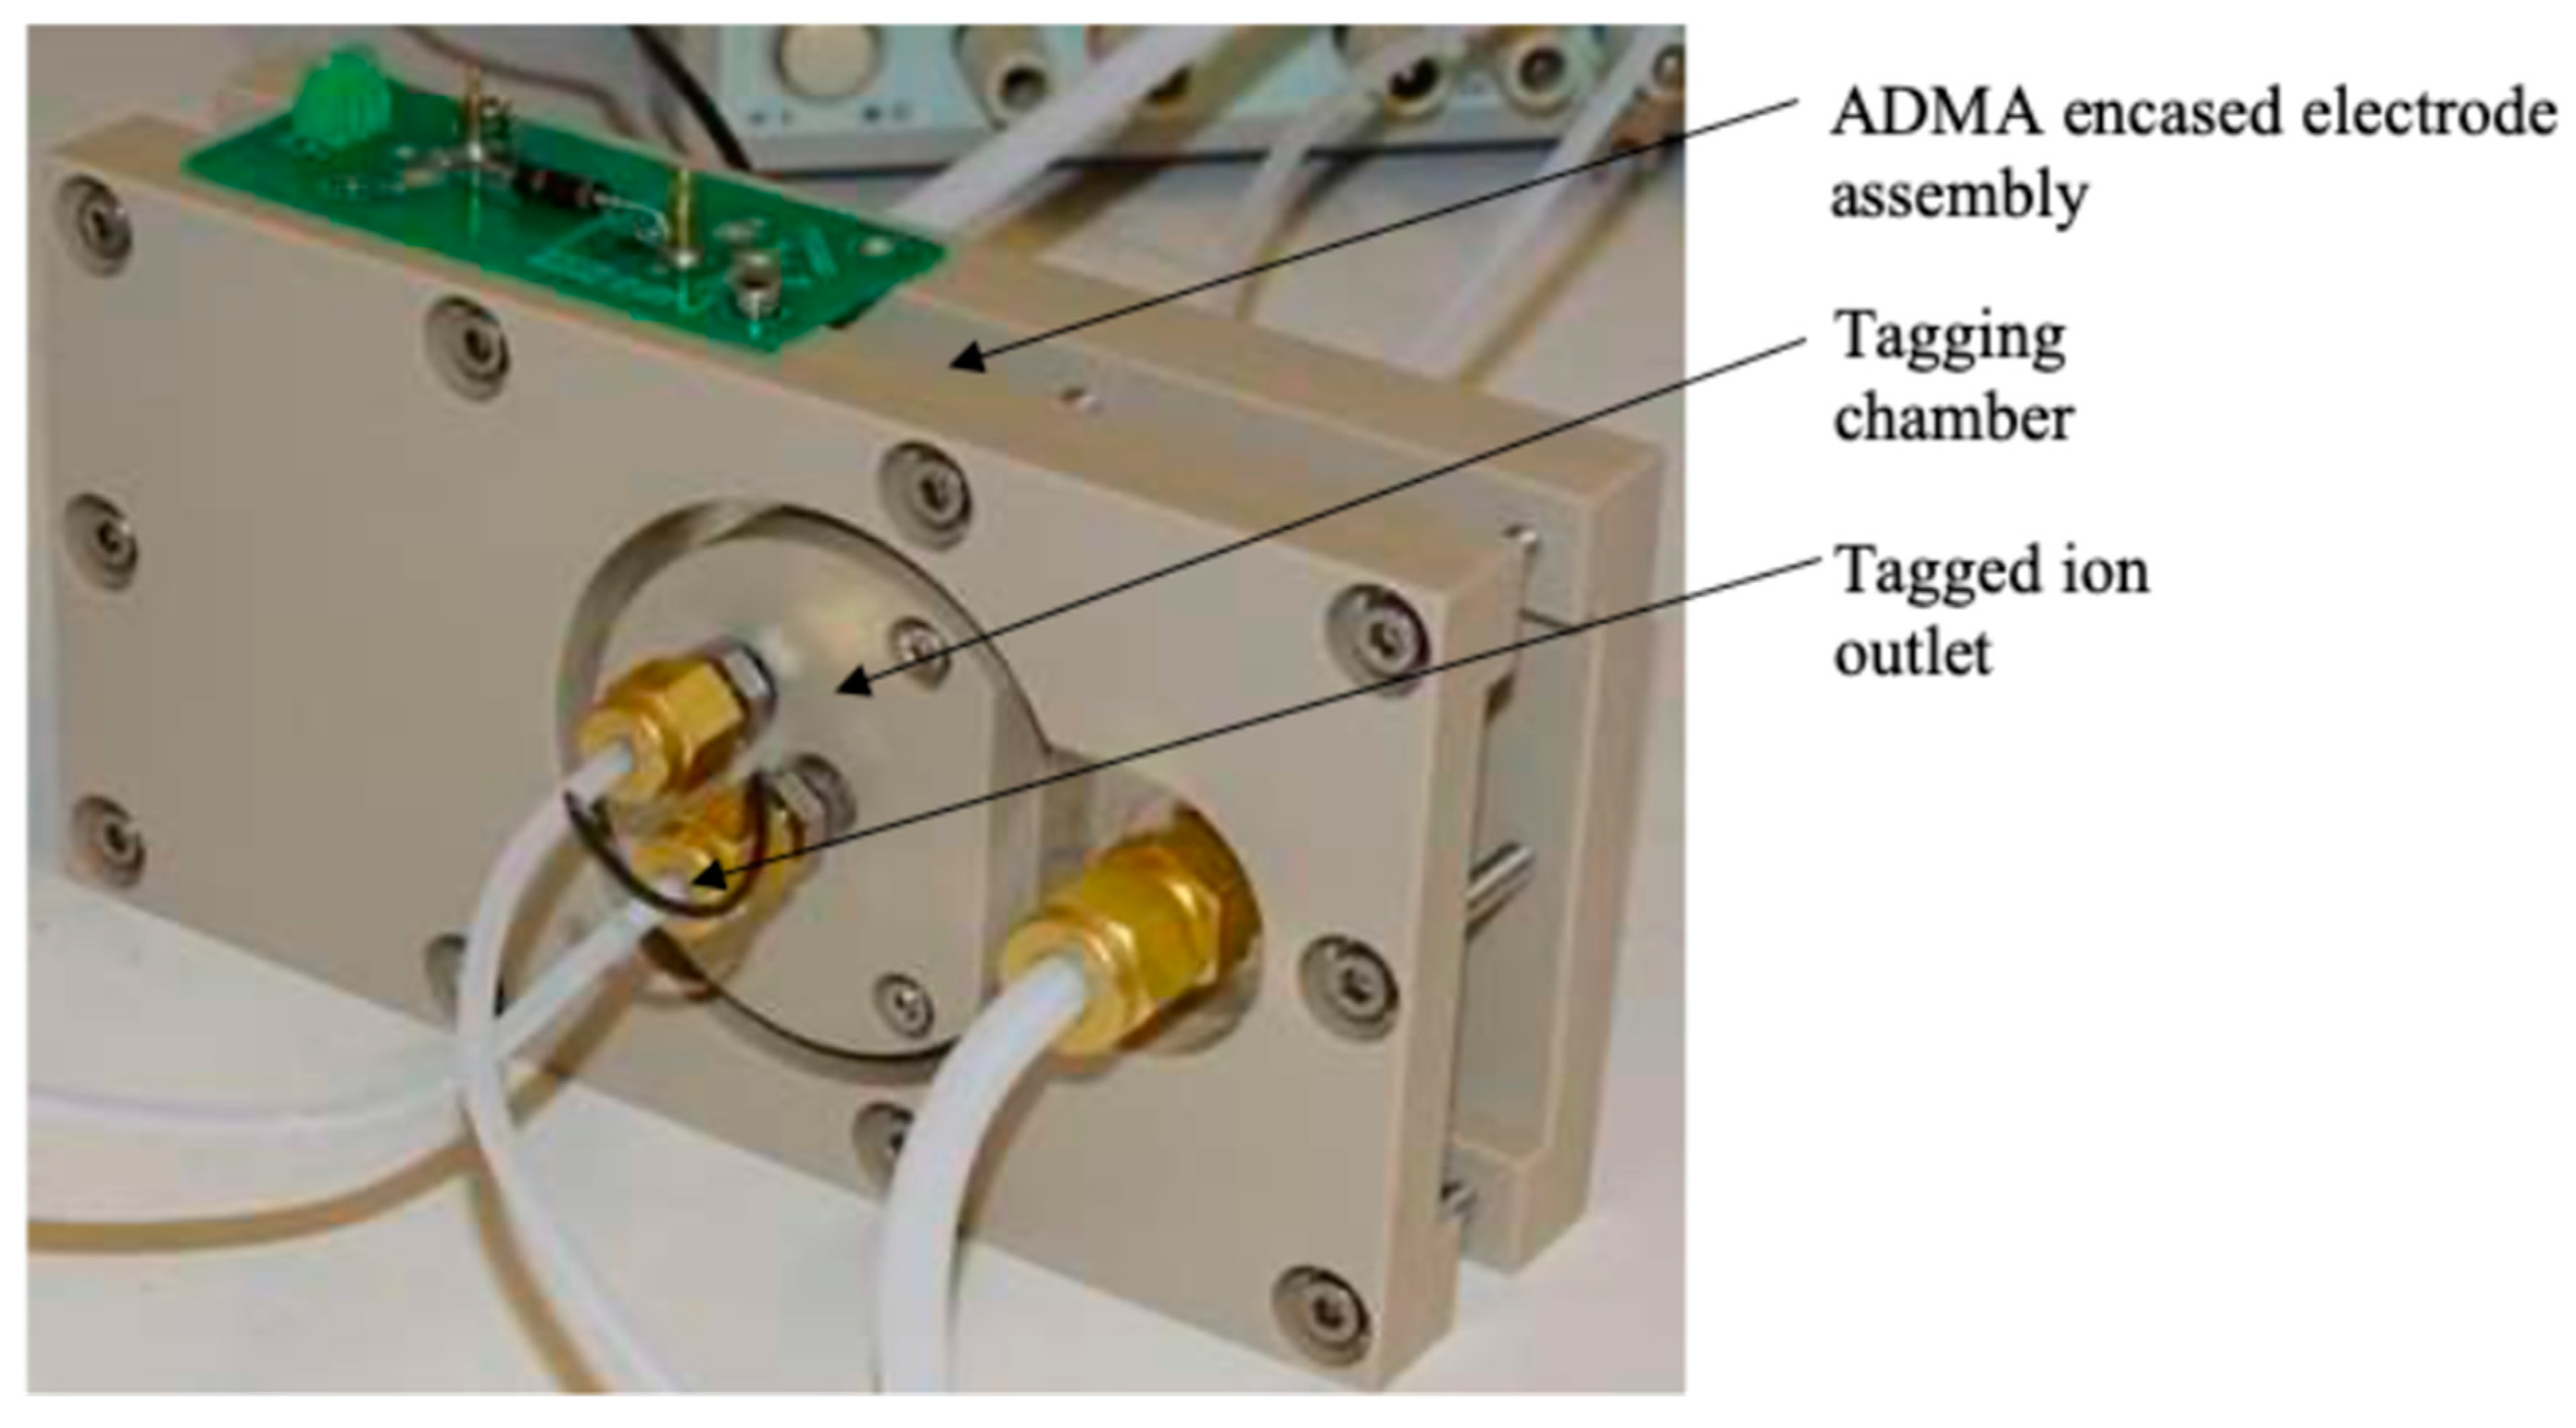
Figure 2.
Schematic of the ADMA with IIC detector. 1: Sterapore filter; 2: flow measurement orifices; 3: Micro-blower bank with an arrow showing flow direction; 4: IIC-tagged ion extractor; 5: optical particle counter of IIC; 6: tag particle generator; 7: ADMA ion selecting unit with the sheath flow inlet 10 and the sheath flow outlet 11; 8: sample vapour preparation module; 9: the ionisation chamber and an ion cloud shaping section shown as a grey cross-section with a bypass flow coming out to an adjacent flow measuring orifice; and 12: selected ion outlet with a tagging chamber and a tag flow inlet connected to the IIC tag generator 6.
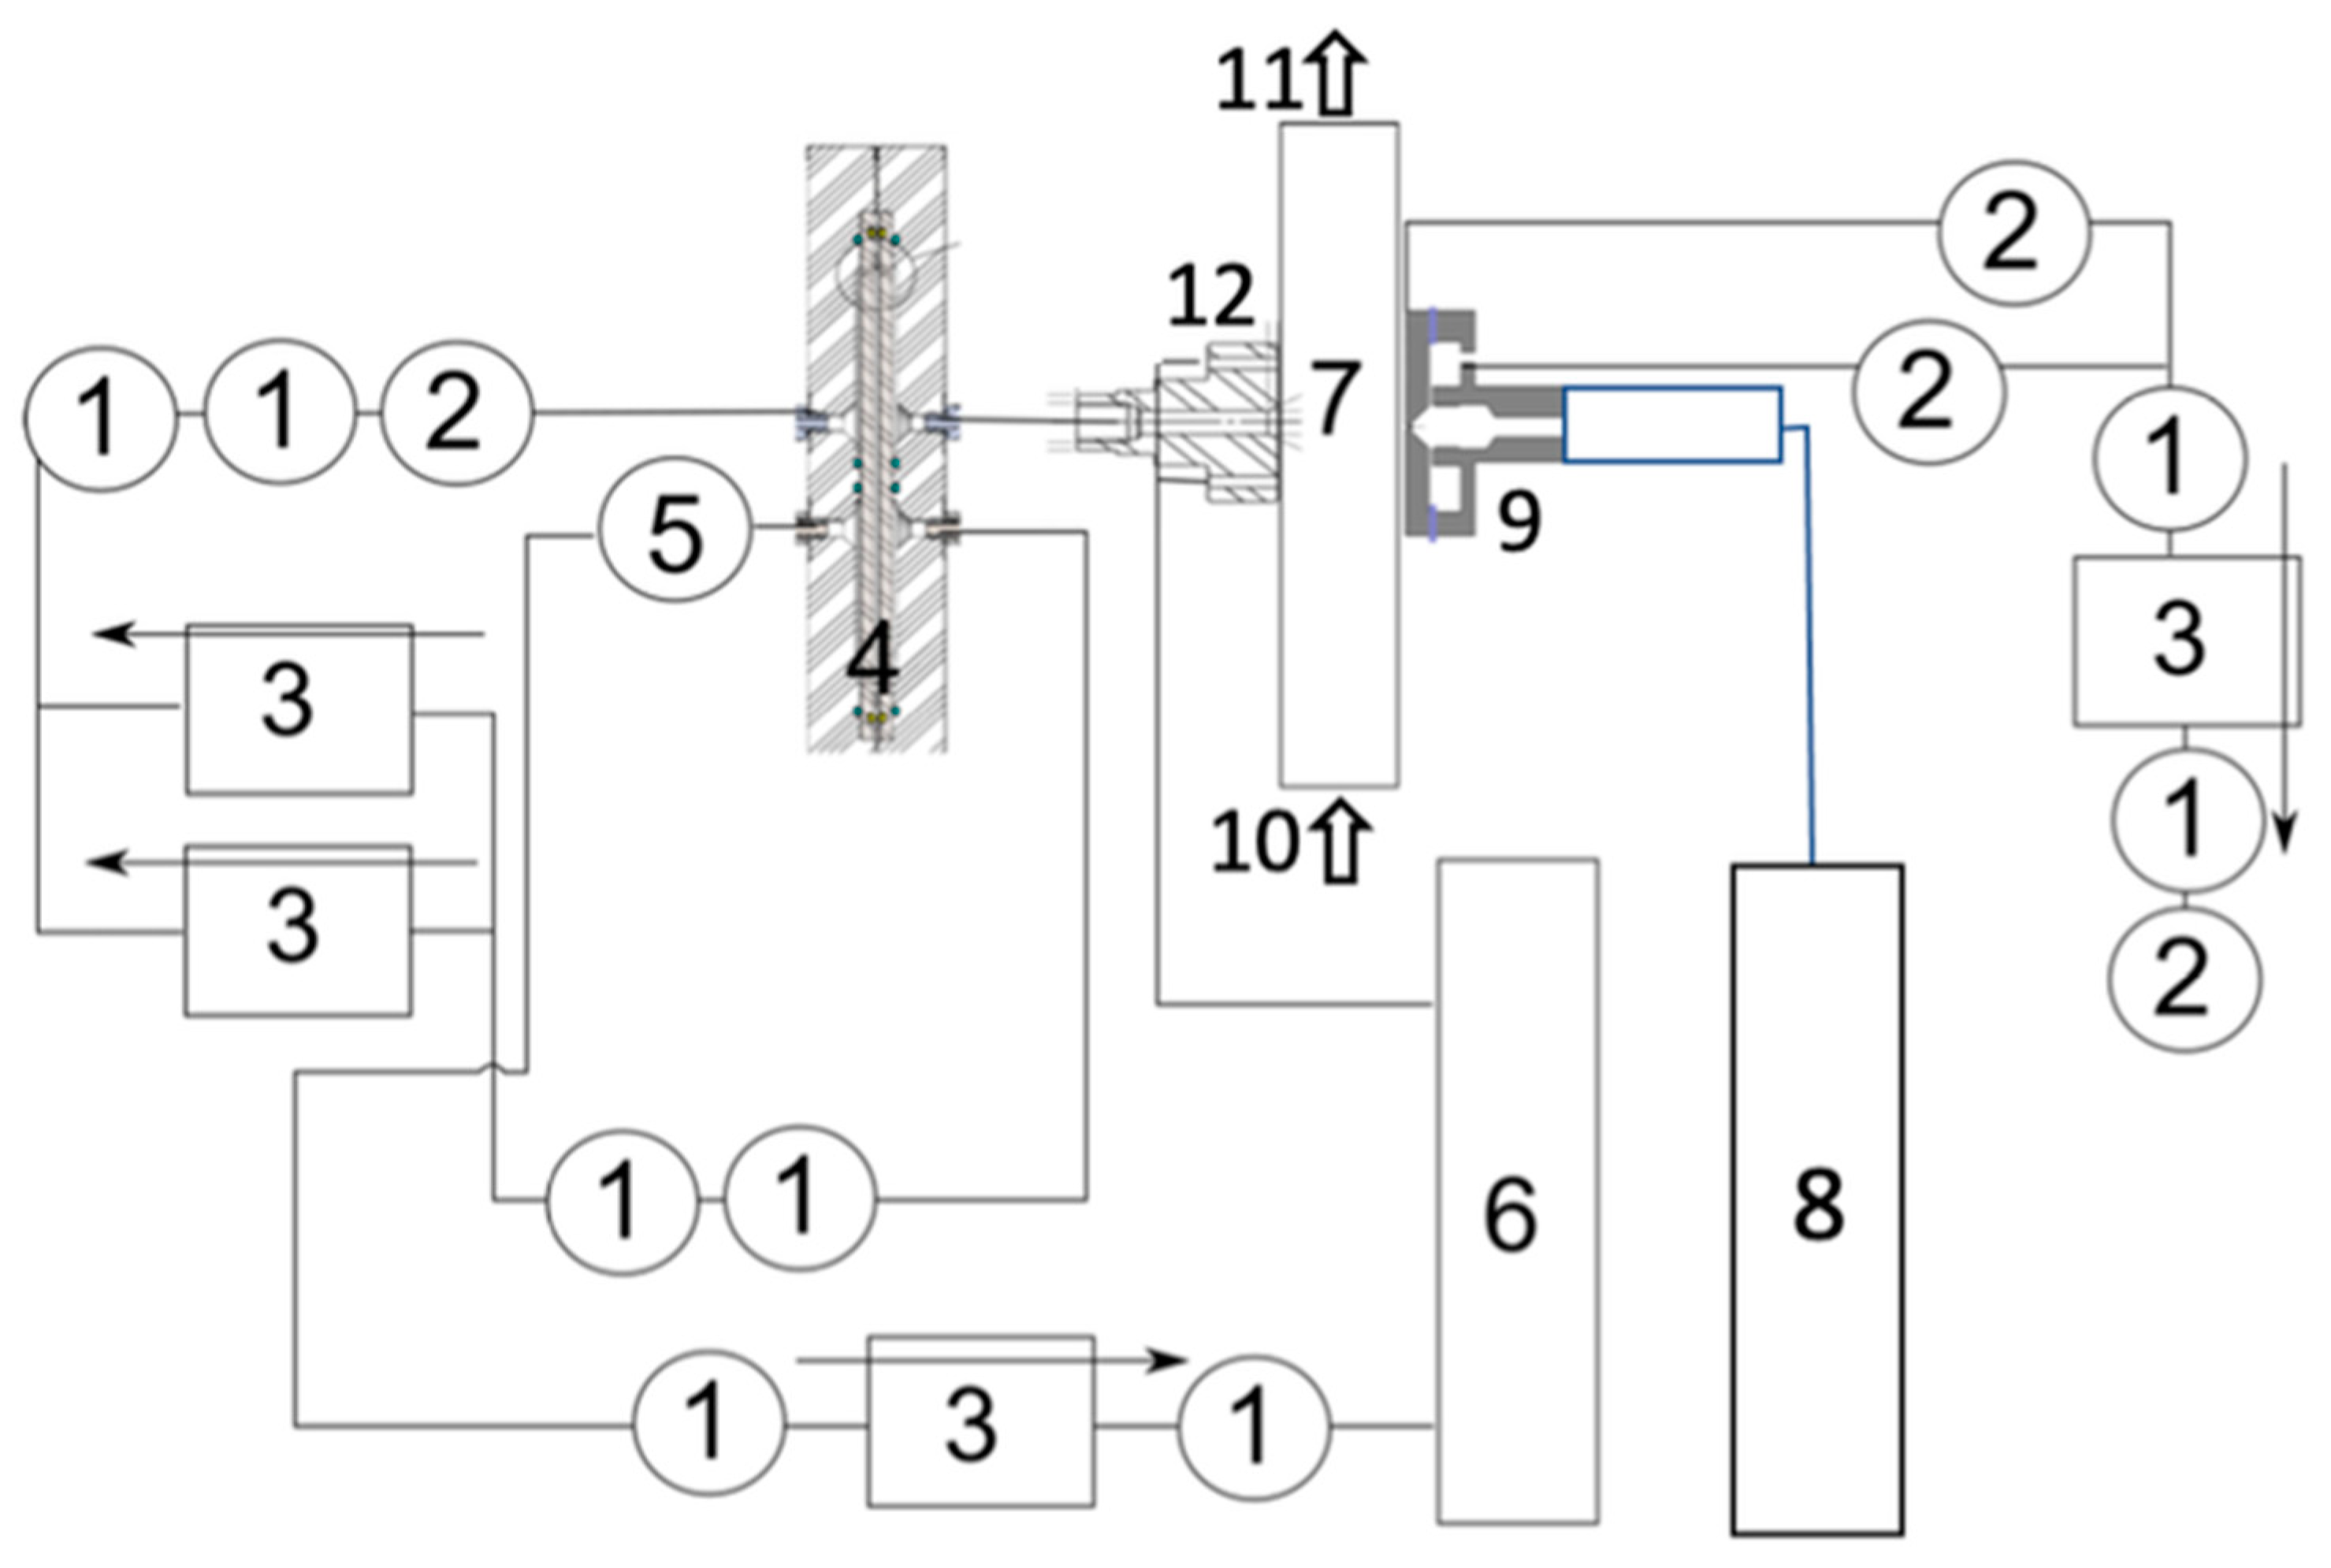
Figure 3.
IIC ion counts (intensity) of the samples of DIMP (Diisopropyl methylphosphonate) vs. ADMA separation voltage (V) at different concentrations; see Supplementary Materials (4. Concentration of analytes in the sample and the IIC detector). .
Figure 3.
IIC ion counts (intensity) of the samples of DIMP (Diisopropyl methylphosphonate) vs. ADMA separation voltage (V) at different concentrations; see Supplementary Materials (4. Concentration of analytes in the sample and the IIC detector). .
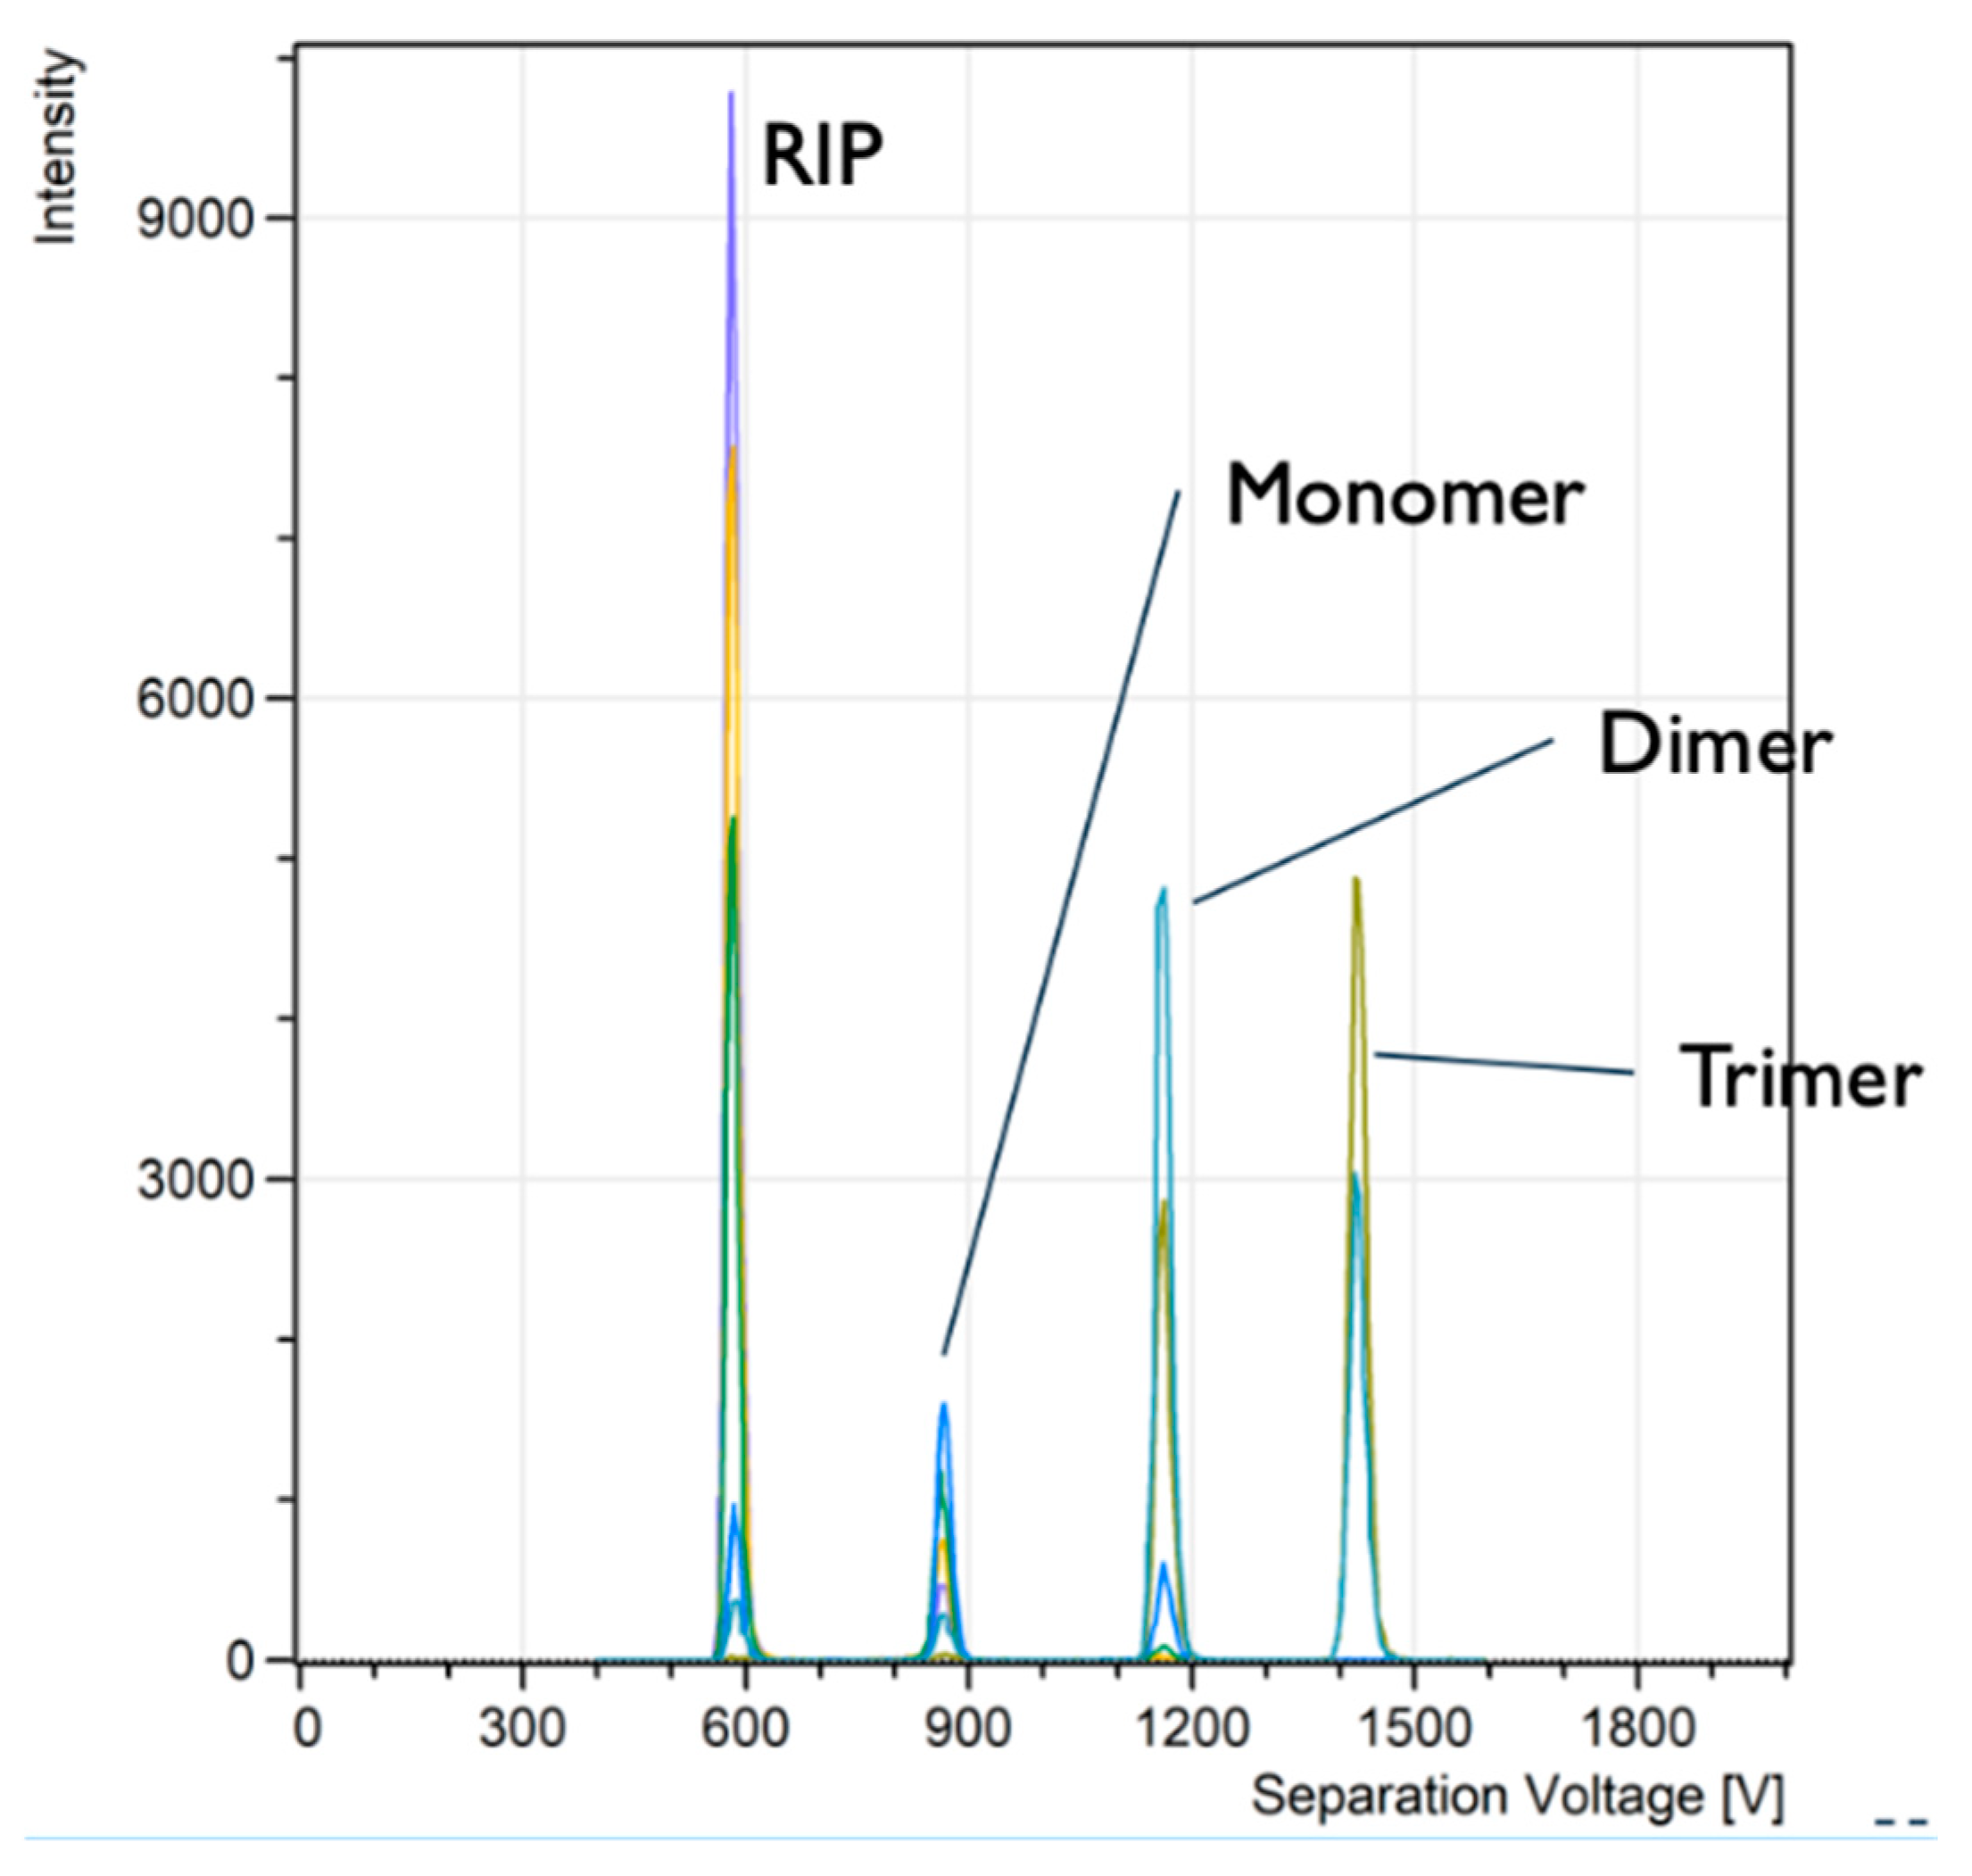
Figure 4.
IIC ion counts (intensity) of the samples of DMMP vs. ADMA separation voltage (V) at different concentrations, similar to those shown in Figure 3. Qsh = 35 l/min, Qsample =0.05 l/min. .
Figure 4.
IIC ion counts (intensity) of the samples of DMMP vs. ADMA separation voltage (V) at different concentrations, similar to those shown in Figure 3. Qsh = 35 l/min, Qsample =0.05 l/min. .
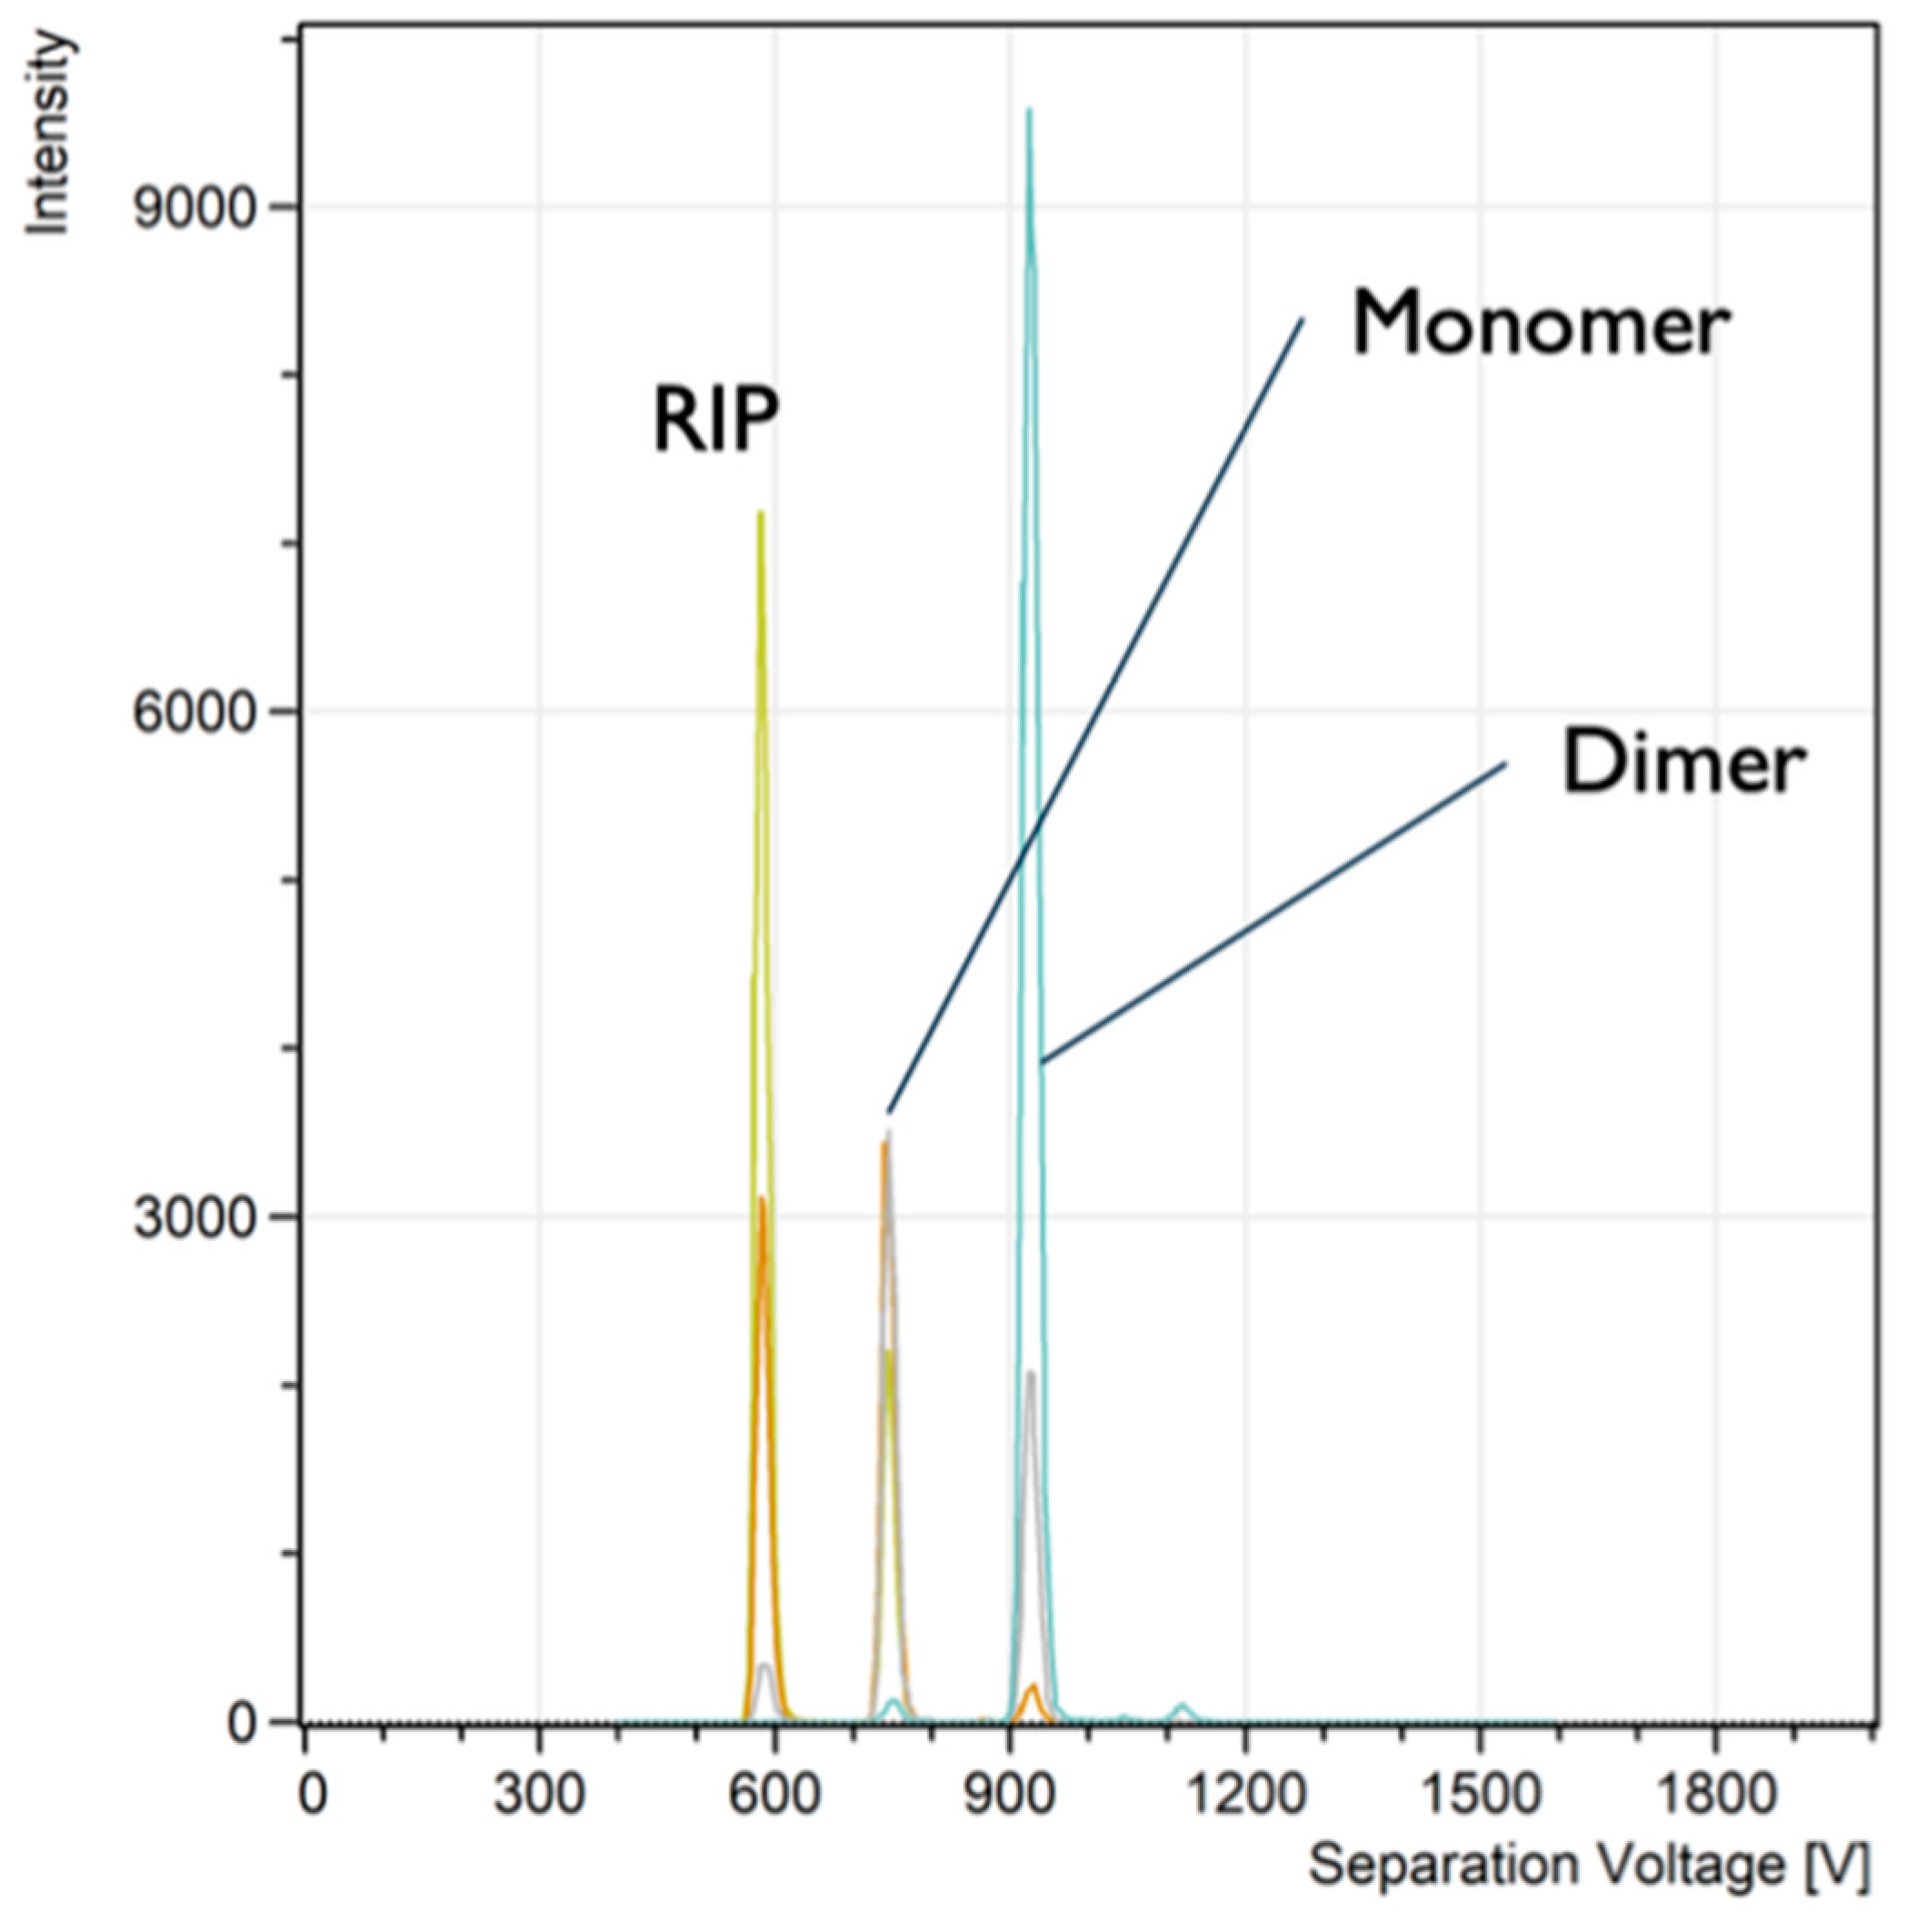
Figure 5.
IIC ion counts (intensity) of TNT (2,4,6-trinitrotoluene) samples vs. ADMA separation voltage (V) at different concentrations. Qsh = 35 l/min, Qsample = 0.1 l/min (left), and IIC ion counts (intensity) of PETN (pentaerythritol tetranitrate) samples vs. ADMA separation voltage (V) at different concentrations. Qsh = 35 l/min, Qsample =0.1 l/min (right).
Disclaimer/Publisher’s Note: The statements, opinions and data contained in all publications are solely those of the individual author(s) and contributor(s) and not of MDPI and/or the editor(s). MDPI and/or the editor(s) disclaim responsibility for any injury to people or property resulting from any ideas, methods, instructions or products referred to in the content. |
© 2024 by the authors. Licensee MDPI, Basel, Switzerland. This article is an open access article distributed under the terms and conditions of the Creative Commons Attribution (CC BY) license (http://creativecommons.org/licenses/by/4.0/).
Copyright: This open access article is published under a Creative Commons CC BY 4.0 license, which permit the free download, distribution, and reuse, provided that the author and preprint are cited in any reuse.


