1. Introduction
Atmospheric gravity waves (GWs) play a significant role in maintaining the global circulation of the atmosphere. These waves can transfer energy and momentum from troposphere to middle atmosphere and affect the structure and dynamics of the mesosphere and lower thermosphere (MLT) region. These waves will be generated mostly in the troposphere mainly via convection, wind shear and topography. Convection can generate waves via mechanical oscillator effect, obstacle effect and thermal forcing [Fritts and Alexander, 2003, Kim et al., 2010]. In thermal forcing, convective clouds can generate GWs in a stably stratified atmosphere above the clouds [e.g. Salby and Garcia, 1987, Alexander et al., 1995; Piani et al., 2000; Fritts and Alexander, 2003; Fritts et al., 2006; Kim et al. 2010]. In mechanical oscillator mechanism, oscillations within the convective system overshoot the tropopause and generate waves above the clouds [e.g., Clark et al., 1986, Pfister et al., 1993, Vincent and Alexander, 2000, Kim et al., 2010]. In the obstacle effect mechanism, it is assumed that GWs are generated by the relative flow over the convective obstacles which are analogous to topographic wave generation (this mechanism represents wave generation by shallow convection) [e.g. Clark et al., 1986; Fovell et al., 1992; Lane and Clark, 2002; Kim et al., 2010]. Identifying the sources for the generation of the GWs is important in their parameterization in general circulation models (GCM) which remained as a challenge [Geller et al., 2013].
In order to identify the sources of GWs, in general, hodograph method is being used but it is applicable for low frequency and monochromatic waves. This method is employed to identify the sources of the GWs which are present in the lower stratosphere. Using this, convection and wind shear are identified as the sources over Indian region [e.g., Venkat Ratnam et al., 2008; Leena et al., 2012]. But it is difficult to use hodograph method for MLT region because simultaneous observation of temperature with winds in general will not be available. Ray tracing method is widely used to identify the sources for the GWs which are observed at mesospheric altitudes [Hecht et al., 1994; Taylor et al., 1997; Nakamura et al., 2003; Gerrard et al., 2004; Brown et al.,2004; Wrasse et al., 2006; Vadas et al., 2009; Pramitha et al., 2015].
In the present study, we tried to identify the sources for the GWs which are observed on 29 May 2014 at the OH airglow layer (~87 km) over a tropical region Gadanki (13.5oN, 79.2oE), India, with the help of GROGRAT (Gravity-wave Regional Or Global Ray Tracer) reverse ray tracing method. For this, background atmosphere profiles are constructed using different data sets covering entire lower and middle atmospheres. We also used real-time background atmosphere profiles using a suite of instruments located at Gadanki. An exercise is also made to investigate which waves can propagate to the upper mesosphere over Indian region by launching waves at different periods and horizontal wavelengths.
2. Database
2.1. Airglow Imager Measurements
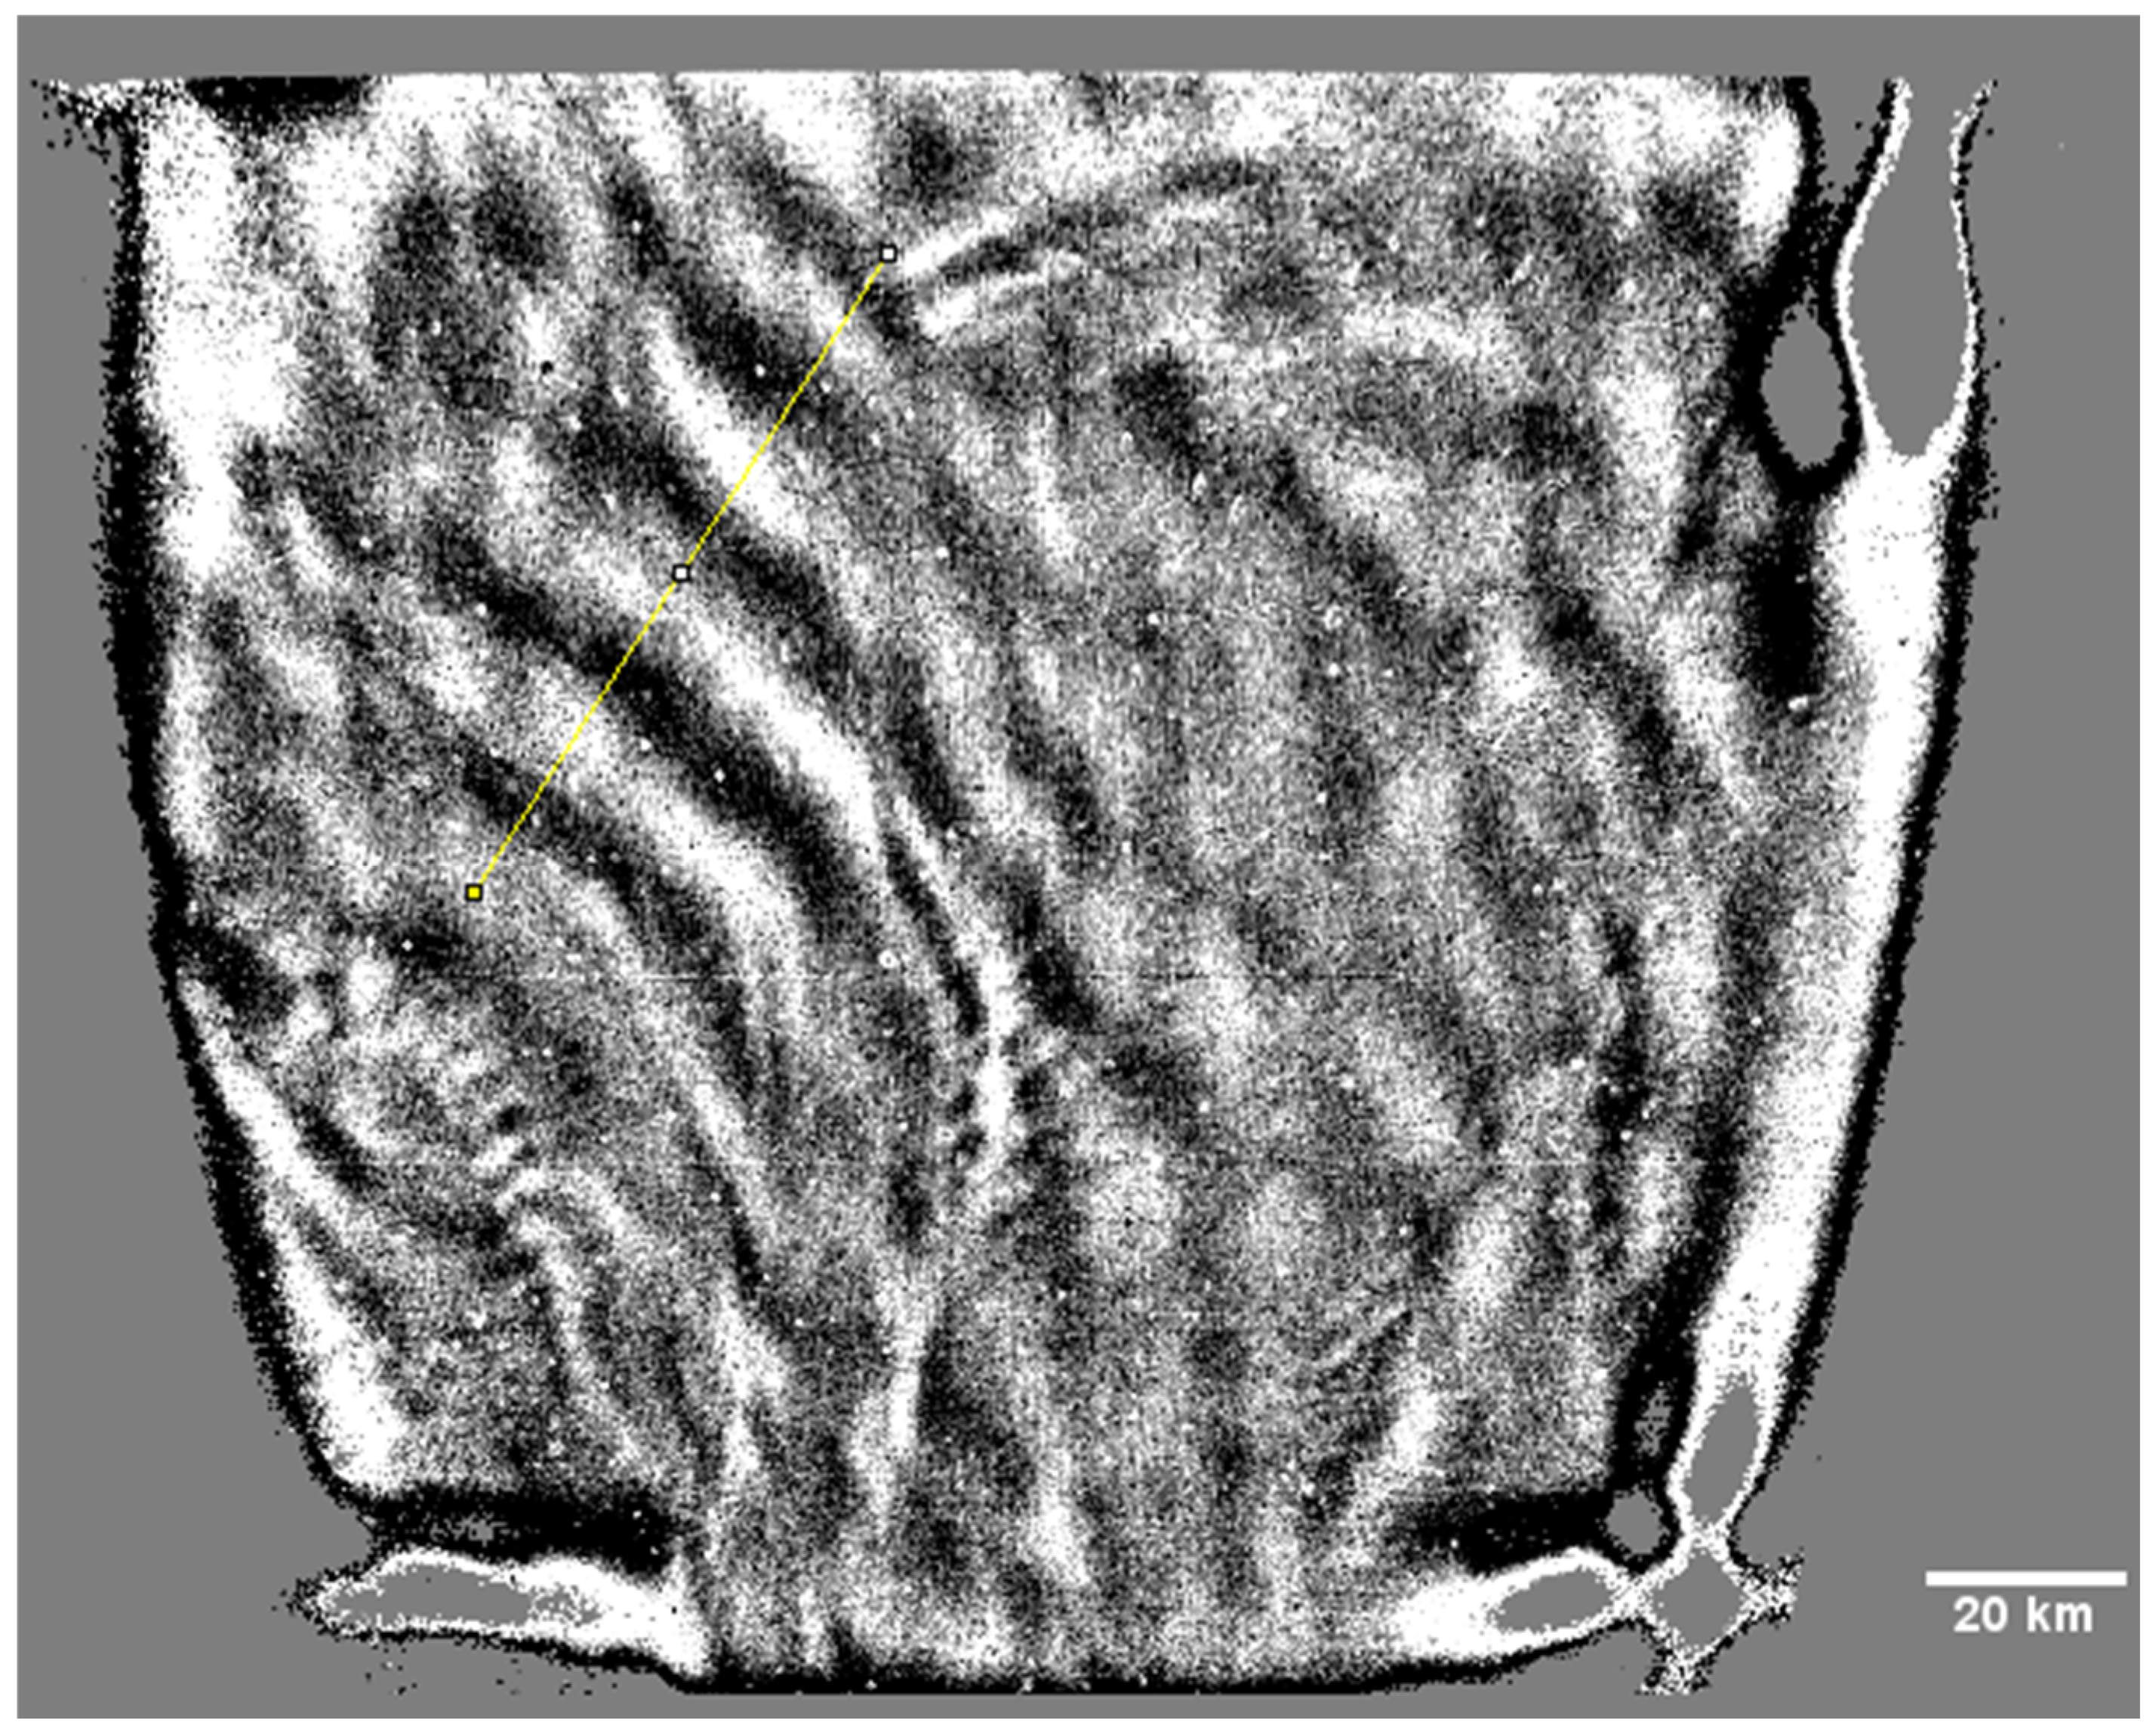
The Short-Wave InfraRed (SWIR) camera operated by the French Aerospace lab ONERA (Fig. 2) is based on a thermoelectric cooled InGaAs detector (640x512 pixels) whose spectral bandwidth ranges from 0.9 to 1.7 μm. This bandwidth corresponds to vibrational transitions Δν = 2 and 3 of the OH Meinel band system. The integration time used for present investigation is 400 ms with a frame rate of 30 s. Thus, for a whole night we acquire roughly one thousand images. An 8 mm focal lens was mounted on the camera giving a 90°x77° field of view (FOV) which leads to a 168x134 km area observation at the OH layer level (~84 km in case of SWIR measurements) for a zenith viewing. The camera is radiometrically calibrated in laboratory leading to absolute integrated radiance measurements (in photons/s/m2/sr). The acquired raw images are finally unwrapped and filtered to remove stars to obtain only mean and high spatial resolution events following the method elaborated by Taori et al. (2013). We have observed 17 wave events corresponding to waves packets of few oscillations between 14:46-22:27 UTC on 29 May 2014 in the OH airglow emission intensities. A snapshot of the one wave event is shown in
Figure 1, where yellow line shows the direction of wave motion. Horizontal wavelengths of the GWs are determined by applying 2D FFT to the observed airglow images and direction of propagation and phase speed of GWs are identified using successive images. The wave parameters including the time of observation, horizontal wavelength and horizontal phase speed azimuth and period are given in
Table 1. From this table it is clear that, in general, GWs with very short horizontal wavelengths (ranging from 4 km to 18 km), high phase speeds (ranging from 15 m/s to 75 m/s) propagating towards north-east direction are observed. In order to trace these waves we require zonal and meridional components of the wave. Zonal (
) and meridional (
) wave numbers are calculated using the relations
and
where
is the horizontal wave number and
is the horizontal direction of propagation observed from the airglow imager. Using horizontal phase speed (c
h) and horizontal wavelength (
kh), we calculated the ground based frequency of the wave (
ω) using the relation
ω=ch/kh.
2.2. IRBT TRMM Merged Products
Infrared brightness temperature (IRBT) obtained by merging data from five geostationary satellites (GOES-8/10, METEOSAT-7/5, GMS) from Climate Prediction Center, National Centre for Environment Prediction (NCEP) (source: ftp://disc2.nascom.nasa.gov/data/s4pa/ TRMM_ ANCILLARY/MERG/) is used as proxy for the tropical convection. These products have typical spatial scales of 4 km and are available from 60◦N~60◦S. The data starts from longitude 0.0820E with increment of 0.03670 and latitude from 59.9820N with the same increment. These data sets are retrieved for every half-an-hour for 29 May 2014 to check the presence of convection near the terminal points or along the ray path.
2.3. GPS Radiosonde Measurements
Data of GPS radiosonde launched on 29 May 2014 at 1730 IST (IST = UT + 5.5 h) from Gadanki is also used for this analysis. The meteorological parameters like temperature, relative humidity, wind speed and wind direction are obtained at 1s interval. The radiosonde can measure temperature from -90oC to 50oC with resolution of 0.1oC and accuracy of ±0.5oC. Wind speed resolution is 0.1m/s with an accuracy of ±0.2m/s. These meteorological parameters are interpolated to 100 m vertical resolution so as to remove outliers that may occur due to random motion of the balloon. Further details of this radiosonde system, data base and quality checks applied to the data are reported in Venkat Ratnam et al. [2014].
2.4. Meteor Radar Measurements
The advanced meteor radar located in the S.V. University, Tirupati (13.63oN, 79.4oE) which is located ~35 km away from Gadanki is used to obtain real time background zonal and meridional winds on the same day. This radar is a five channel coherent pulsed detection radar which employs the interferometer technique for the detection of meteor echoes. This radar operates at a frequency of 35.25MHz corresponding to a wavelength (λ) of 8.5m with a peak transmitter power of 40 kW with a duty cycle up to 12%. Meteor trail reflections are coherently received on five Yagi antennas positioned on two orthogonal baselines, with one antenna in the center of the array common to both baselines, forming an interferometer and the transmitting antenna is located 50 m away from the center of the receiving antenna. The horizontal wind fields over the altitude region 70–110 km are estimated by implementing a least squares fit of the radial wind components with 2 km as a vertical resolution. Details of this radar and method of analysis is given in Rao e al. [2014].
2.5. TIMED/SABER Measurements
The Sounding of the Atmosphere using Broadband Emission Radiometry (SABER) instrument is one of four instruments on NASA's TIMED (Thermosphere Ionosphere Mesosphere Energetics Dynamics) satellite. Vertical profiles of the kinetic temperature are retrieved from CO2 15µm limb emission measurements, details of which are given in Mertens et al. [2002]. For the present study we have used the temperature data obtained on 29 May 2014 from 20 km to 100 km.
3. GROGRAT Model
GROGRAT model is a four dimensional algorithm for GWs which is described by Marks and Eckermann, [1995] and Eckermann and Marks [1997]. It can trace non-hydrostatic waves in a 4-Dimensional gridded atmosphere. It can trace the waves forward and reverse way. For the present study we have taken static background atmosphere, i.e., no temporal variation is included. The sources for the GWs which are observed on 29 May 2014 are investigated here. Estimated GW parameters like zonal and meridional wave numbers and wave frequency are given as input parameters to the model. GROGRAT model is based on the GW dispersion relation which is given by
where , is the intrinsic frequency (frequency relative to the mean wind), U and V are the zonal and meridional winds, N is the Brunt-Väisälä frequency, , and are the zonal, meridional and vertical wavenumber components, respectively, and is the Coriolis parameter, , and H is the density scale height of the atmosphere. Using the ray tracing equations [Marks and Eckermann, 1995], during each time step this model will find (trace) the altitude, longitude, latitude from initial layer to subsequent layers. Ray tracing will stop 1) due to integration failure, 2) when wave may be evanescent, 3) when there is violation in the WKB approximation and 4) when the dissipation of the wave occurs (amplitude decreases). In reverse ray tracing, source region will be identified anywhere along the ray path to the terminal point. More details of this ray tracing are provided in Pramitha et al. [2015].
4. Background Atmosphere
In order to apply the reverse ray tracing and find the sources of the waves, we require three dimensional background atmospheric parameters like temperature, zonal winds and meridional winds. As the wave observations are in mesospheric altitude and the expected wave source is in troposphere region, we require atmospheric parameters from surface to wave observation altitude (87km). Since no instrument exists to probe atmosphere from surface to mesosphere and in three dimensional ways, we have employed model output data sets using MSIS E 90 model [Hedin, 1991] for temperature and HWM07 model [Drob et al., 2008] for winds with latitude ranging from 0
0 to 25
0 N and longitude ranging from 60
0 to 105
0E with 0.5
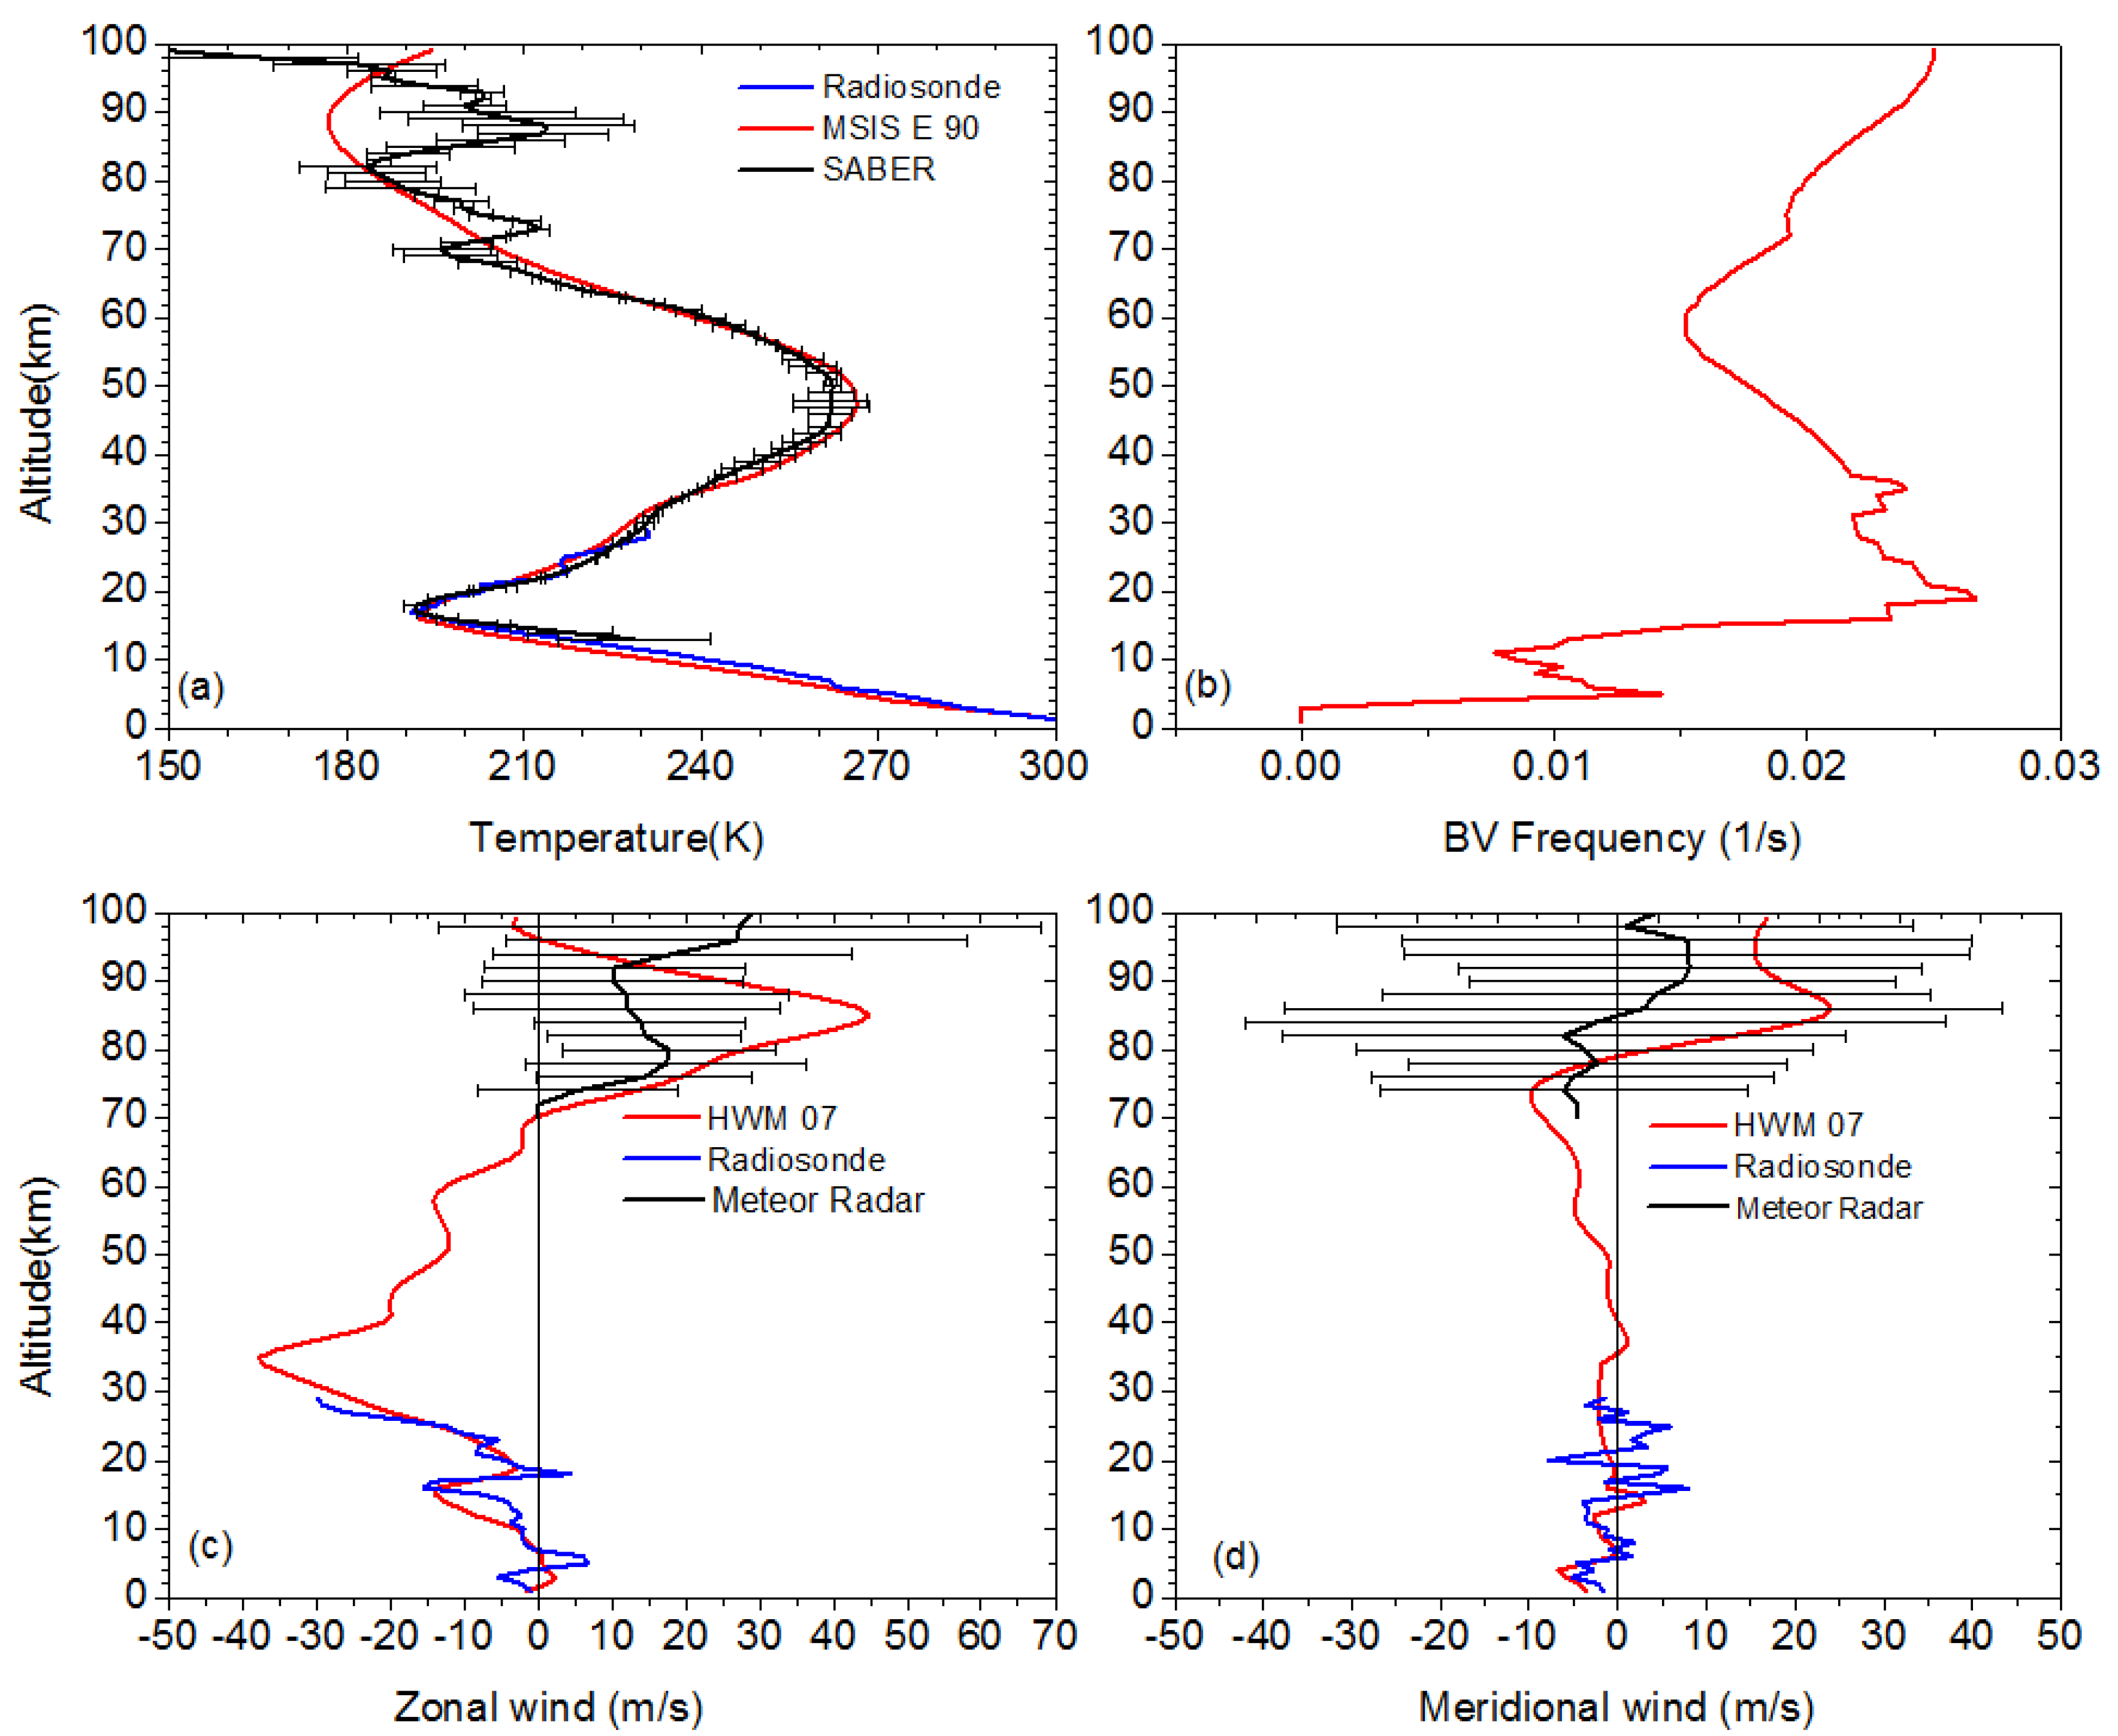
0 resolution. Note that these data sets are validated using a suite of instruments located at Gadanki and found they reasonably represent the background atmosphere [Pramitha et al., 2015]. Profiles of temperature and winds obtained respectively from MSIS E 90 model and HWM 07 model on 29 May 2014 are shown in
Figure 2. For troposphere and lower stratosphere we used ERA-Interim data of temperature (Fig.2a), zonal wind (Fig. 2c) and meridional wind (Fig. 2d) up to 29 km [Pramitha et al. 2015]. We have also compared these data with model data for 29 May 2014 and are shown in
Figure 2. The Brunt Väisälä frequency plotted in
Figure 2b shows the values around 0.01 per second in the troposphere and around 0.02 to 0.025 per second in the stratosphere. We have compared HWM07 model winds with radiosonde data from surface to 29 km and with meteor radar data from 70 to 110km. MSIS E 90 model temperature is compared with radiosonde temperature up to 29 km from surface and SABER temperature from 13 km to 100 km. In general, temperature profiles match well among different data sets from surface to 70 km but there are large differences between 80 and 95km among SABER and MSIS E 90 model values. In case of zonal and meridional winds shown in
Figure 2(c) and 2(d), respectively, at tropospheric region radiosonde measured winds are matching well with HWM 07 model but there is a large difference between the HWM 07 model and meteor radar winds between 70 km and 100 km. Though some values are within the standard deviation of meteor radar observations, the large difference could be due to the presence of tides. Note that tides are already included in HWM07 model but the difference is arising mainly due to its day-to-day variability at mesospheric altitudes [Pramitha et al., 2015]. In order to incorporate day-to-day variability of the tides in the background wind we used simultaneous meteor radar observations.
The detailed procedure followed to extract diurnal tide amplitude and phase is provided in Venkat Ratnam et al., [2014], however, we mention here again briefly for continuity. We first removed seasonal mean from the original data and obtained residual data. Later we extracted amplitudes and phases of the diurnal tide by subjecting the residual data to the least squares fitting method. A 3-daydata window, sliding forward by 1day each time, is used for extraction of the tides. The resulting amplitude and phases of the tides are attributed to the middle day. Each component of the wind and temperature can be expressed in terms of the prevailing and tidal components, as follows:
where t is the local time, A(t) is the parameter (U,V,T) to be fitted, A
o is the prevailing component, A and φ are the amplitude and phase of the tidal, and T
p=24 or 12 or 8 for diurnal, semi-diurnal and ter-diurnal tides, respectively [e.g., Venkateswara Rao et al., 2011]. The tidal parameters are individually estimated for U, V and T.
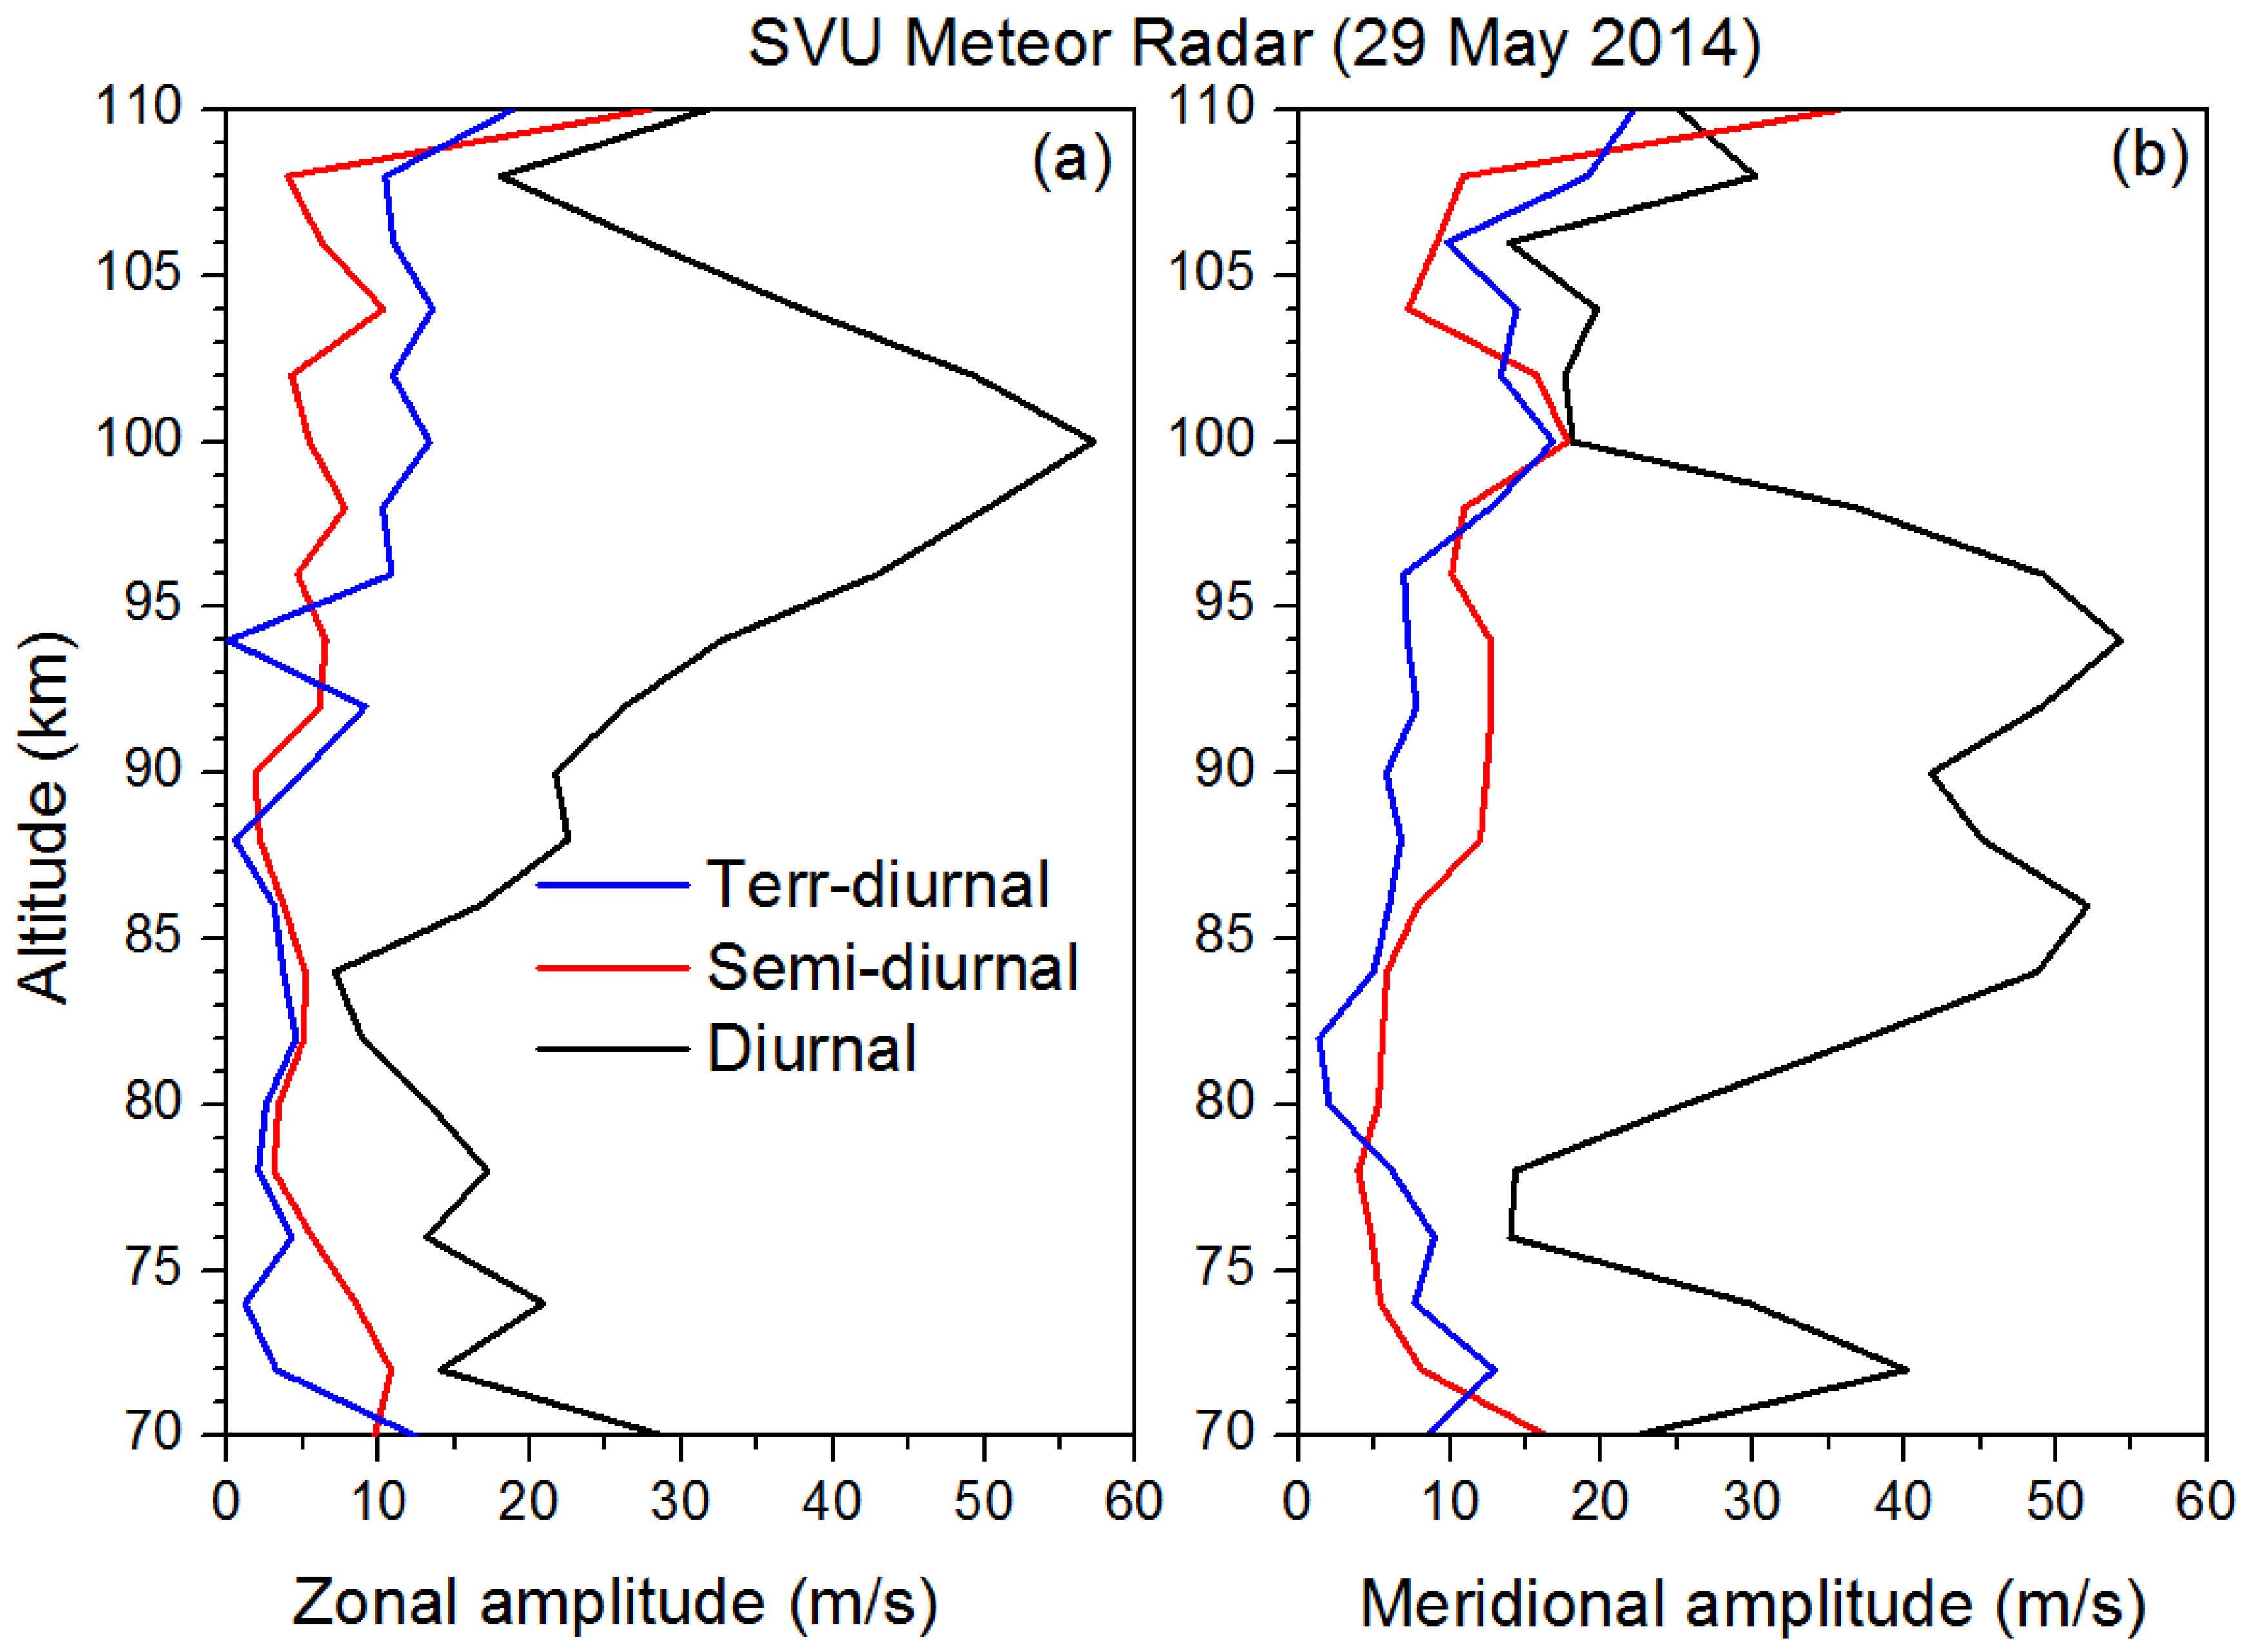
The amplitudes of diurnal, semi-diurnal and ter-diurnal tides observed in zonal and meridional components for the center day of 29 May 2014 is shown in
Figure 3. Note that the tidal amplitudes are given from 70 to 110 km. Diurnal tidal amplitudes of zonal wind is from 5 to 25m/s from 70 to 85 km and increase up to 55 m/s from 85 km to 100 km as shown in
Figure 3(a). Tidal amplitudes in the meridional winds range from 35 to 55m/s from 80-100km as shown in
Figure 3(b). Semi-diurnal tidal amplitudes are within 10 m/s for zonal and 20 m/s for meridional components which are also shown in Figures 3(a) and 3(b), respectively. Ter-diurnal tidal amplitudes in zonal component are less than 10 m/s up to 90 km and above that it varies from 10-15m/s as also shown in
Figure 3(a). Ter-diurnal tide amplitude in the meridional component reaches as high as 10m/s from 80-95 km and above that amplitude increases up to 20 m/s as shown in
Figure 3(b). In general, diurnal tide amplitudes are stronger in both zonal and meridional winds when compared to semi-diurnal and ter-diurnal tides. We have considered and included these tidal amplitudes at 87 km for the ray tracing, which is discussed in section 5. Since MSIS E90 model compares well below 70 km and HWM 07 compares well with radiosonde data, we considered this as background and feed to the model. For the altitudes above 70 km where large discrepancy appears we have included real time tidal amplitudes in the true background for the ray tracing.
5. Results and Discussion
As shown in
Table 1, on 29 May 2014 we have observed 17 wave events at OH Airglow layer during 1400 to 2200 h UTC. Note that horizontal wavelength of the observed 17 waves is very small and it ranges from 4 km to 18 km, with phase speeds ranging from 15 to 75 m/s and waves moving in all directions. In the present study we have avoided 7
th wave and 16
th wave as we could not obtain phase speeds and tried to identify the sources only for the rest of the waves.
As these observed wave parameters will have inherent (observational) errors, and in order to consider these errors in the input data we have used
k=k±nk/4,
l=l±nl/4,
ω=ω±nω/4 with all possible combinations, where
n=0,1,2,3, where
k is the zonal wave number,
l is meridional wave number and
ω is the ground based frequency. As mentioned earlier, for developing background atmosphere we have used ERA-Interim data up to 29 km and above that MSIS E 90 and HWM 07 model values for temperature and winds, respectively. Using developed background atmosphere and the GROGRAT model, we tried to identify the wave sources with a time step of 12 minutes. We have given initial parameters as initial longitude, latitude, altitude, zonal, meridional wave number, and ground based frequency to the model. As we do not have the observations of wave amplitudes, we have given it as unity in order to see the changes along the path. The initial longitude, latitude and altitude are 79.2
0, 13.45
0 and 87 km, respectively. Altitude variation of the ray path obtained for the 14
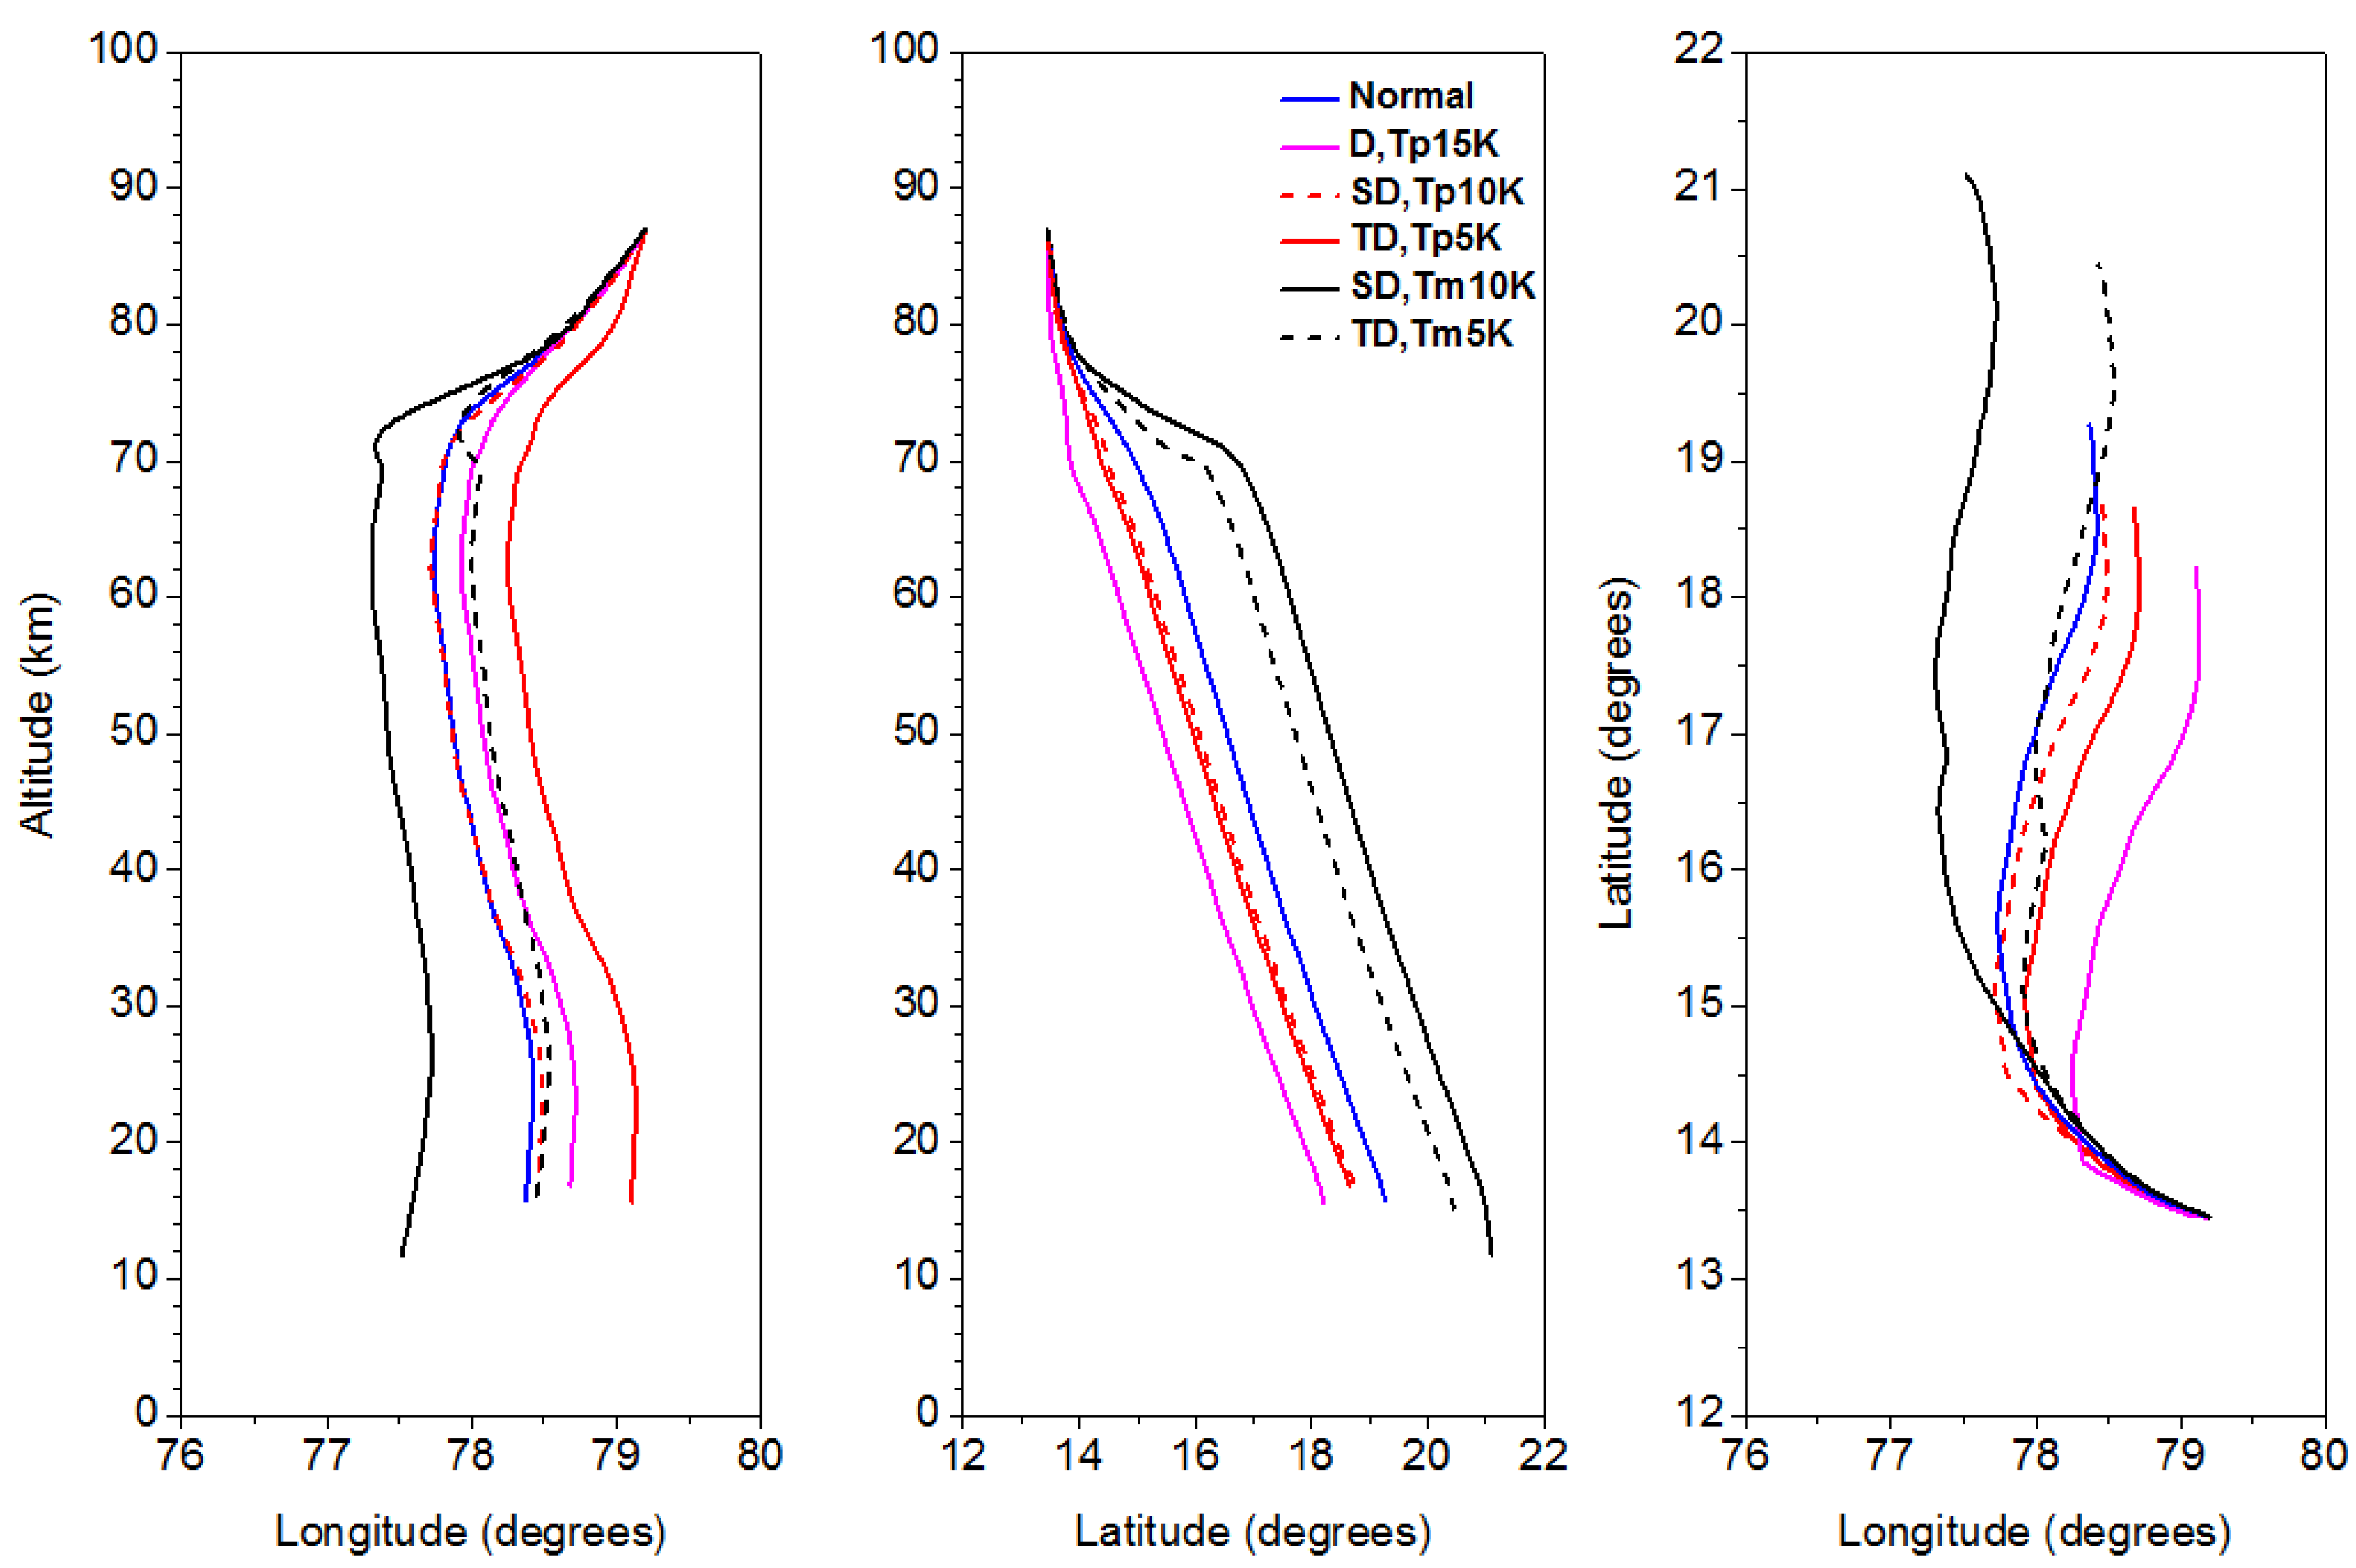
th wave with respect to the longitude and latitude is shown in
Figure 4a and
Figure 4b, respectively.
Figure 4c shows the variation of the ray path along the latitude and longitude for the same wave event. Note that the terminal point of this wave is located at 19.27
oN, 78.37
oE and reached the altitude of 15.73 km and the ray path covered from 77-79
oE and 13.5-19.5
oN using the normal wind as the background. As mentioned earlier, there exists large day to day variation in the tidal amplitudes which sometimes reaches as high as mean background wind. The ray path will be completely different by using these tidal amplitudes. We have included the tidal amplitudes shown in
Figure 3 obtained using SVU meteor radar on the same day. From
Figure 3, it is clear that the diurnal, semi-diurnal and ter-diurnal amplitudes are 20 m/s, 3 m/s and 2 m/s, respectively, at around 87km in the zonal component and 49 m/s,10 m/s and 6m/s, respectively, in the meridional component. Considering these tidal amplitude values from meteor radar winds we have also added and subtracted 5K, 10 K and 15 K to the temperature so as to consider the tidal amplitudes in the temperature also. For temperature we have given these values with exponentially decreasing amplitudes downward from 87km. With these combinations on the background winds and temperature we have traced back the waves from the initial point of 87 km. Ray paths obtained while using the actual diurnal (D), semi-diurnal (SD) and ter-diurnal (TD) amplitudes are also superimposed in the respective panels of
Figure 4. Ray paths obtained while including or excluding temperatures of 5K, 10K and 15K are also shown. While using ter-diurnal and semi-diurnal amplitudes and temperature of 5K and 10K, the variation in the terminal points are found within the 1500 km from the initial point. However, for the diurnal tidal amplitude and temperature of 15K, the terminal points are extended up to 2700 km.
The terminal points of the waves with different combinations of background winds and temperature are shown in
Figure 5. In general, while considering the waves that reach below 17 km only, the terminal points of the wave are in the longitude region 70
0 to 80
0 and latitudes of 6
0 to 22
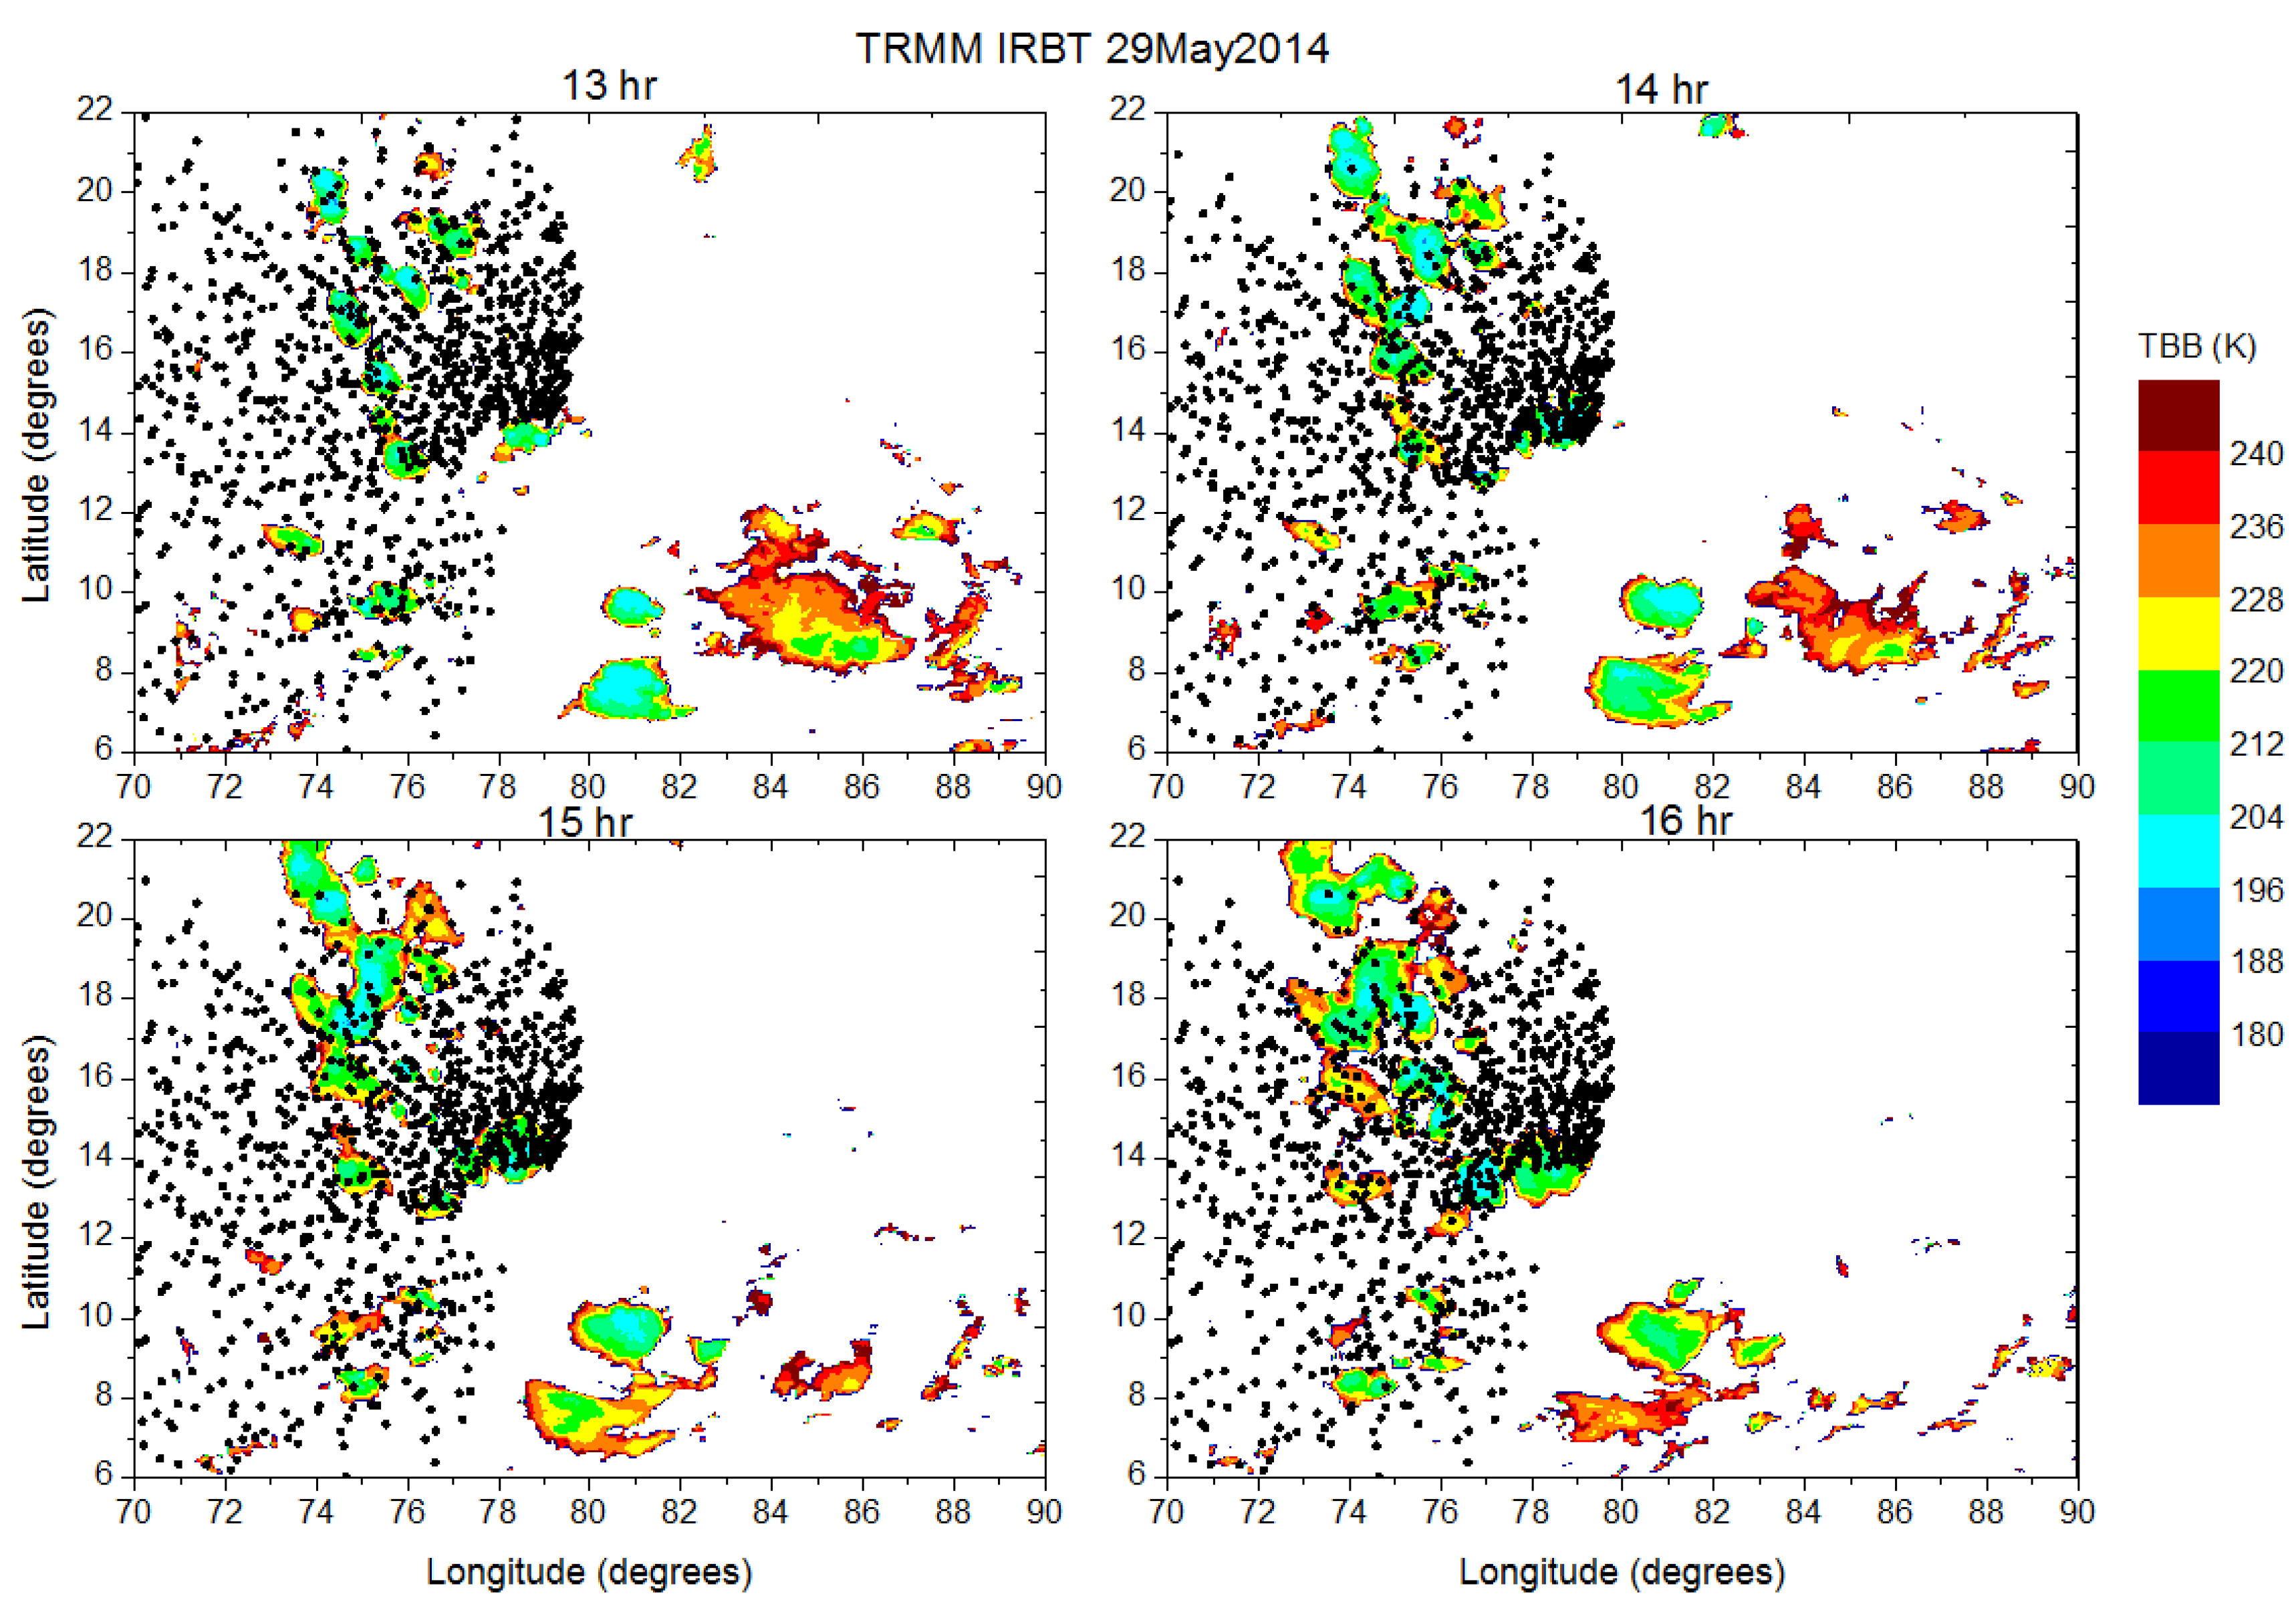
0. At the wave termination points and along the ray path we have checked for the sources. As mentioned earlier, TRMM satellite observed IRBT is used as proxy for the tropical convection. Contours of IRBT observed on 29 May 2014 at 1300 UTC, 1400 UTC, 1500 UTC and 1600 UTC is also shown in
Figure 5. Note that OLR vales less than 240 W/m
2 are only shown and low OLR value regions represents tropical deep convection centers. Interestingly, most of the terminal points are located near the terminal points with few of them located along the ray path. At the same time no strong wind shears are observed near these terminal points or along the ray path in ERA-Interim winds data (figure not shown). Thus, the localized convective centers are found to be the source for the GWs observed at the air glow altitudes.
As we observed that the sources of these waves are convection, we tried to check the possible short waves which can propagate up to mesosphere. For that we have selected different combinations of the horizontal wavelengths and periods of the waves. The horizontal wavelengths considered are 10, 20, 30, 40, 50, 60, 70, 80, 90, 100, 125, 150, 175 and 200 km and the periods considered are 10, 15, 20, 30, 45, 60, 90,120, 180, 240, 300 and 360 minutes with azimuth from 0 to 360o with spacing of 30o. Using all the possible combination of these waves we have done forward ray tracing using GROGRAT model with the same background atmosphere that we have used for the reverse ray tracing. The initial latitude longitude and altitude chosen was 13.450, 79.20 and 10 km, respectively. Using same wind and temperature that we used earlier (for May 29th 2014), we have found that the waves with period less than 10 minutes have not reached the mesospheric altitudes. However, waves with 20 minutes and horizontal wavelengths of 20 km, 30 km, 40 km which are in the westward direction only reached above 75 km. In general, most of the waves with periods of 30-70 minutes reached above 75 km.
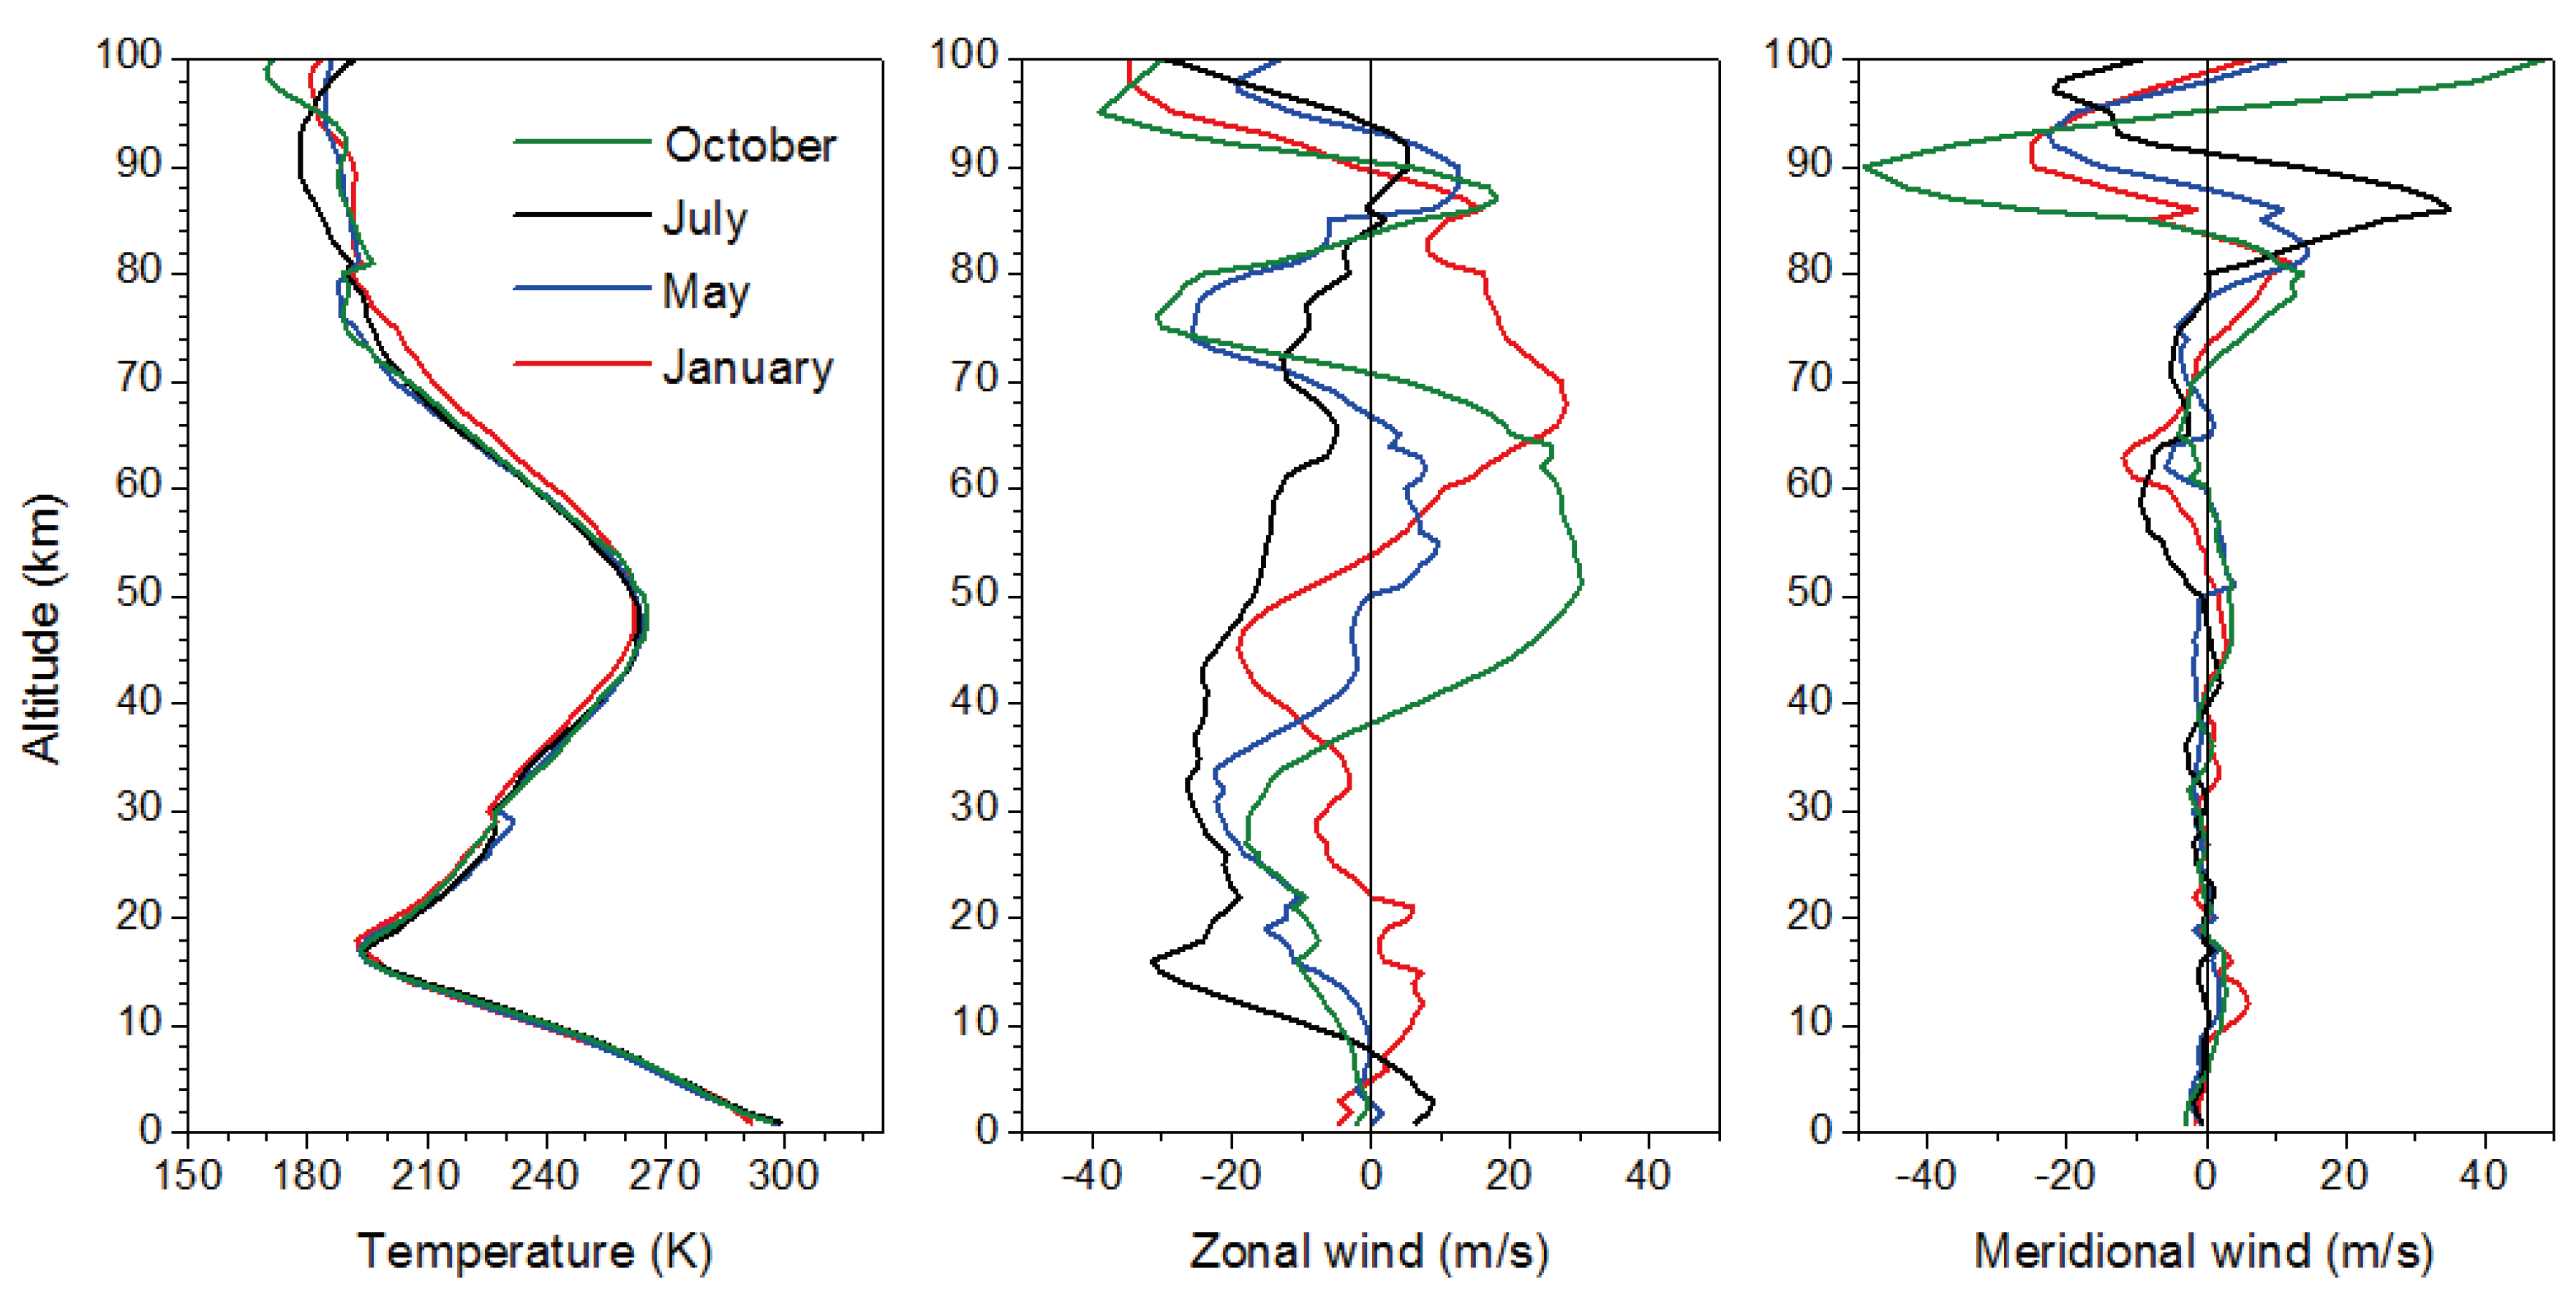
In order to check the characteristics of the waves that reach the mesospheric altitudes during different seasons (background wind conditions), we have considered different months representing different seasons namely winter (Dec.-Feb.), pre-monsoon (Mar.-Apr.), monsoon (Jun.-Aug.) and post-monsoon (Sep.-Oct.). For obtaining background winds and temperature for these seasons, we have developed monthly mean climatological background using MSIS E 90 model ERA-Interim and HWM 07 model. Monthly mean profiles of zonal, meridional and temperature obtained from this background atmosphere for Gadanki region is shown in
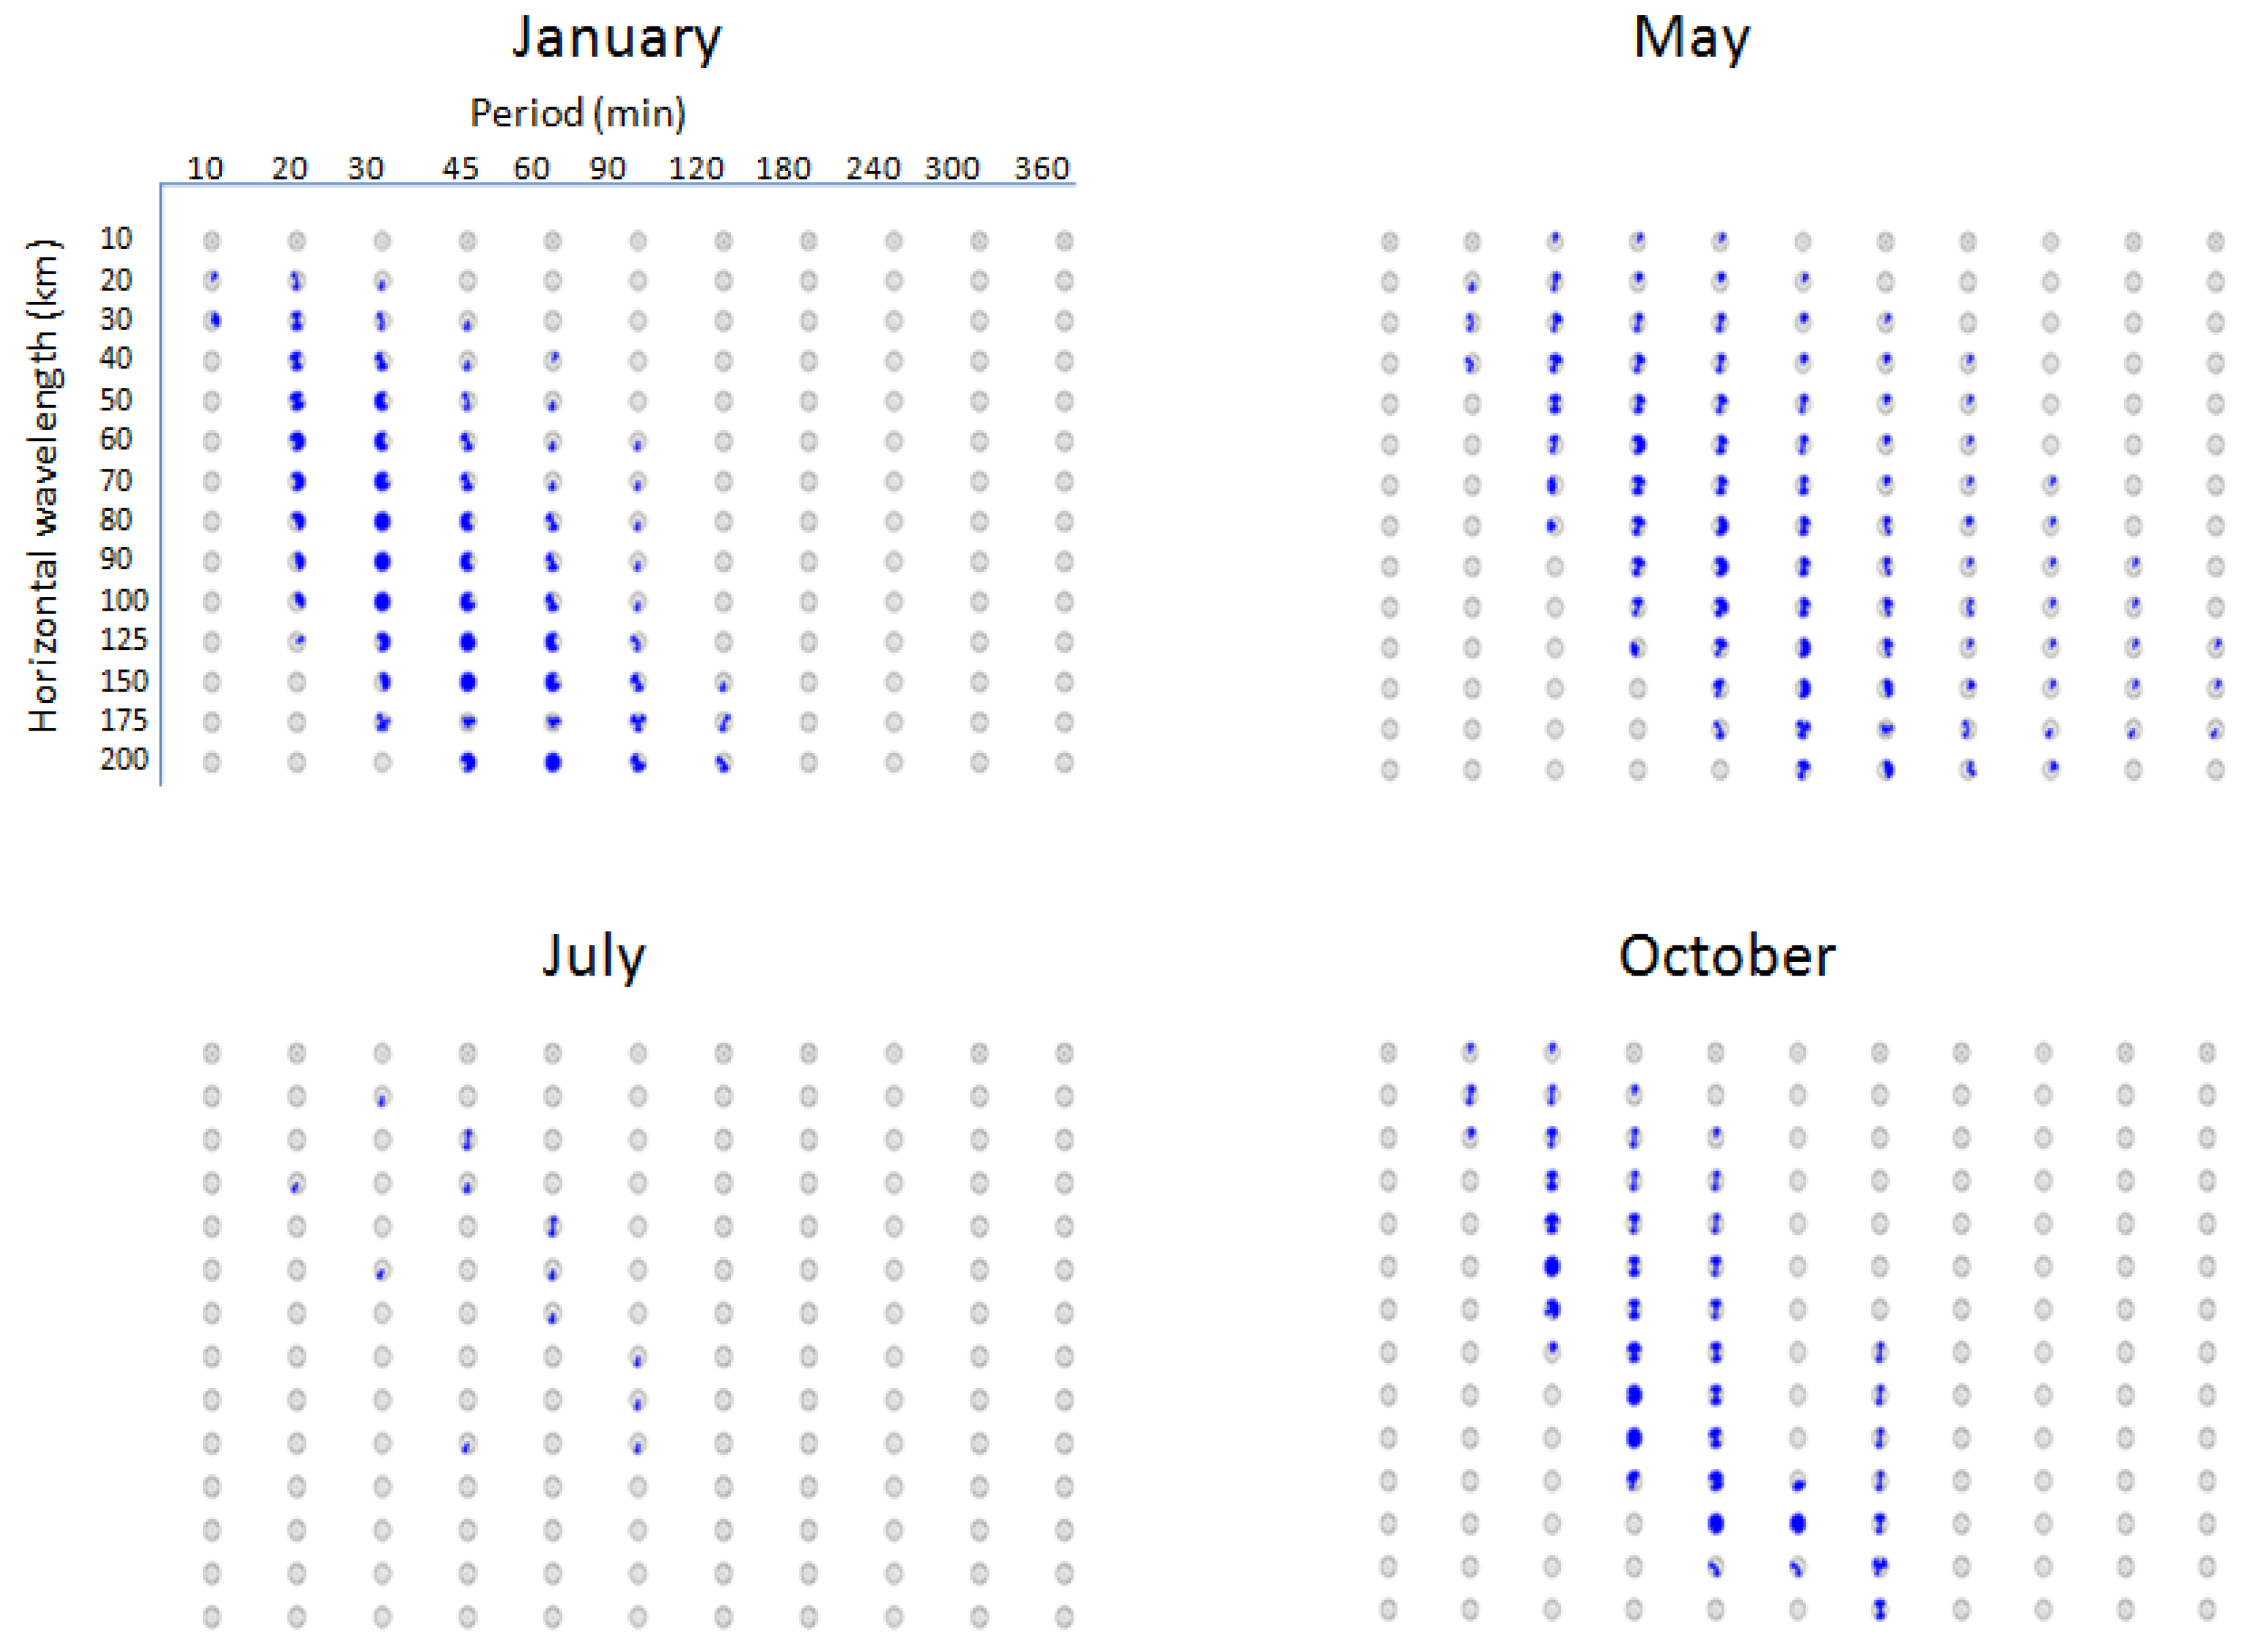
Figure 6. Using this as background atmosphere we investigate which type of the waves can reach altitudes above 75 km in each season. A recent studies using lidar data show that the potential energy of the gravity waves is largely reduced above 75 km (Mze et al., 2014). Note that we have considered only the vertical propagation of the waves. Direction of the propagation of the waves simulated with various combinations of the GW characteristics that are reaching mesosphere during winter, pre-monsoon, monsoon and post-monsoon seasons is shown in
Figure 7. Note that we have used typical month to represent season where large change in the background wind is noticed but not actual season. Along the rows and columns, the horizontal wavelengths and periods, respectively, are shown. It is observed that very few waves reached mesospheric altitude during monsoon season. During winter season, waves with 10-120 minutes and phase speed ranging from 11 to 100 m/s only reached mesosphere. In fall equinox, waves with 20-120 minutes with phase speed ranging 7 to 50 m/s have reached the mesosphere. Thus, in general, waves with periods 30-90 minutes and horizontal wavelengths of 30-100 km are only reaching the mesosphere. During January and October months, waves are reaching mostly from all direction and during May month eastward moving waves are more. Waves with very short horizontal wavelength are stopping at the lower altitudes itself due to evanescence, vertical reflection and violation in the WKB approximation. It is very interesting to note that only few waves have reached mesospheric altitudes during monsoon though large sources in the form of deep convection and strong wind shear persist in the troposphere during this season. Thus, background wind plays a significant role in allowing/stopping the vertical propagation of the GWs.
6. Summary and Conclusions
An Indo-French campaign is conducted at NARL located at Gadanki (13.5oN, 79.2oE) during May 2014 to investigate the coupling processes in the equatorial region. During this campaign, a suite of instruments is being operated continuously. On 29 May 2014, clear signatures of (17 events of) gravity waves (GWs) are identified in the airglow instrument at ~87 km. These waves have periods and horizontal wavelengths ranging from 1.5 to 8.6 minutes and 4 km to 18 km, respectively, with phase speeds ranging from 15 to 75 m/s and waves moving in all directions. We tried to identify the sources for those (15 events) waves using GROGRAT model. Using background atmosphere from MSIS E 90 model, HWM 07 model and radiosonde we traced back those waves to the source region.
We also considered real time winds in the mesosphere and lower thermosphere (MLT) region obtained from nearby SVU meteor radar located at Tirupati for the first time. While considering the tidal (diurnal, semi-diurnal and ter-diurnal) amplitudes which are stronger than the background mean wind itself, we could notice the terminal points locating in the range of 700 to 800 E longitudes and 60 to 220N latitudes. At the terminal points and along the ray path we searched for the sources. We used TRMM IRBT as proxy for the tropical convection and ERA-Interim winds for the shears. We could notice deep convective centers most of the time near the terminal points and/or along the ray path. No strong shear in the horizontal winds is observed near the terminal points and along the ray path. Thus, convection is identified as the source for the GWs observed at the mesospheric altitudes.
We also tried to check which types of high frequency GWs can reach MLT regions. For that we have taken waves with horizontal wavelengths in the range of 10 to 200 km, periods in the range of 10 to 360 minutes and the azimuth direction from 0 to 330o degree with 30o degree spacing. We launched all combination of these waves at 10 km altitude at Gadanki location and applied forward tracing using GROGRAT model. For the background atmosphere we have used MSIS E 90 model and HWM 07 model for temperature and winds, respectively. It is found that waves with horizontal wavelength 30 to 100 km and periods in the range of 30 to 90 minutes are only reaching mesospheric altitudes most of the time. During January and October months, waves from all the direction are reaching mostly in mesosphere but during May month eastward propagating waves are only reaching the mesosphere. Interestingly, only few waves reach the mesospheric altitudes during monsoon season though strong convection and wind shear co-exist in the troposphere which is believed to be dominant sources for the generation of GWs. Thus, background wind plays a significant role in deciding the waves reaching the higher altitudes.
Author Contributions
AT established the airglow imager at NARL and designed the experiment, MP and MVR carried out the wave trajectory analysis and prepared first draft of the paper, PS carried out the imager experiments at NARL Gadanki while PK supported through Indo-French collaboration and management. RG and NP helped in reading and finalizing the draft.
Funding
The present work is supported by the Department of Space, ISRO under the NICES program.
Data Availability Statement
The data can be obtained by requesting to the corresponding author.
Acknowledgements
We wish to thank Dr. V. Kamalakar, Dr. M. Sivakandan and other NARL staff for operating airglow and providing radiosonde data used in the present study. We thank ERA-Interim products team for providing the data used in the present study.
Conflicts of Interest
The authors declare no conflicts of interest.
References
- Alexander, M. J., J. R. Holton and D. R. Durran (1995), The gravity wave response above deep convection in a squall line simulation. J. Atmos. Sci., 52, 2212-2226.
- Brown, L. B., Gerrard, A. J., Meriwether, J. W., and Makela, J.J.: All-sky imaging observations of mesospheric fronts in OI 557.7 nm and broadband OH airglow emissions: Analysis of frontal structure, atmospheric background conditions, and potential sourcing mechanisms, J. Geophys. Res., 2004, 109, D19104. [CrossRef]
- Clark, T. L., T. Haufand J. P. Kuettner (1986), Convectively forced internal gravity waves: Results from two-dimensional numerical experiments, Q. J. R. Meteorol. Soc., 112, 899– 925. [CrossRef]
- Fritts, D.C., M.J. Alexander (2003), Gravity wave dynamics and effects in the middle atmosphere, Rev. Geophys., 41 (1). [CrossRef]
- Fritts, D.C., Sharon L. Vadas, Kam Wan, Joseph A. Werne (2006), Mean and variable forcing of the middle atmosphere by gravity waves, J. Atmos. and Sol. Terr. Phys., 68, 247–265. [CrossRef]
- Gerrard, A. J., Kane, T. J., Eckermann, S. D., and Thayer, J. P.: Gravity waves and mesospheric clouds in the summer middle at-mosphere: A comparison of lidar measurements and ray model-ing of gravity waves over Sondrestrom, Greenland, J. Geophys. Res., 2004, 109, D10103. [CrossRef]
- Hecht, J. H., Walterscheid, R. L., and Ross, M. N.: First measure-ments of the two-dimensional horizontal wave number spectrum from CCD images of the nightglow, J. Geophys. Res., 99, 11449–11460, 1994.
- Hedin, A.E (1991), Extension of the MSIS Thermosphere model into the middle and Lower atmosphere, J. Geophys. Res., 96, NO. A2, 1159-117. [CrossRef]
- Lane, T.P., and Clark, T.L., 2002, Gravity waves generated by the dry convective boundary layer: Two-dimensional scale selection and boundary-layer feedback, Q. J. R. Meteorol. Soc.(2002),128, pp. 1543–1570.
- Leena et al., 2012.
- Mertens, C. J., M. G. Mlynczak, M. Lo´pez-Puertas, P. P. Wintersteiner, R. H. Picard, J. R.Winick, L. L. Gordley, and J. M. Russell III (2002), Retrieval of kinetic temperature and carbon dioxide abundance from non-local thermodynamic equilibrium limb emission measurements made by the SABER experiment on the TIMED satellite, in Proceedings of SPIE,Remote Sensing of Clouds and the Atmosphere VII, Agia Pelagia, Crete, Greece, September 24–27 , vol. 4882, pp. 162–17.
- Mzé, N., A. Hauchecorne, P. Keckhut, M.Thétis, Vertical distribution of gravity wave potential energy from long-term Rayleigh lidar data at a northern middle latitude site, Journal of Geophysical Research: Atmospheres, 2014, 119 (21), pp.12069-12083. <10.1002/2014JD022035>. [CrossRef]
- Nakamura, T., Aono, T., Tsuda, T., Admiranto, A. G., and Achmad Suranto, E.: Mesospheric gravity waves over a tropical convec-tive region observed by OH airglow imaging in Indonesia, Geo-phys. Res. Lett., 30, 1882–1885, 2003.
- Pramitha, M., Venkat Ratnam, M., Alok Taori, Krishna Murthy, B. V., Pallamraju, D., Vijaya Bhaskara Rao, S.,2015. Evidence for tropospheric wind shear excitation of high phase-gravity waves reaching the mesosphere using ray tracing technique. Atmos. Chem. Phys. 15,2709-2721.
- Piani, C., D. Durran, M. J. Alexander, and J. R. Holton (2000), A numerical study of three- dimensional gravity waves triggered by deep tropical convection and their role in the dynamics of the QBO, J. Atmos. Sci., 57, 3689 – 3702. [CrossRef]
- Rao,S.V.B.,S.Eswaraiah,M. Venkat Ratnam, E. Kosalendra, K. Kishore Kumar, S. Sathish Kumar, P. T. Patil, and S. Gurubaran (2014), Advanced meteor radar installed at Tirupati: System details and comparison with different radars,J. Geophys. Res. Atmos., 119,11,893–11,904. [CrossRef]
- Salby, M. L., R.R. Garcia (1987), Transient response to localized episodic heating in the Tropics, Part1: Excitation and short- time Near field behavior, J. Atmos. Sci., 44(2).
- Taori, A., Jayaraman, A., and Kamalakar, V.: Imaging of mesosphere–thermosphere airglow emissions over Gadanki (13.5oN, 79.2oE) – first results, J. Atmos. Sol. Terres. Phys., 93, 21–28, 2013.
- Taylor, M. J., Pendleton, W. R. J., Clark, S., Takahashi, H., Gobbi, D., and Goldberg, R. A.: Image measurements of short-period gravity waves at equatorial latitudes, J. Geophys. Res., 102, 26283–26299, 1997. [CrossRef]
- Vadas, S. L., Taylor, M. J., Pautet, P.-D., Stamus, P. A., Fritts, D. C., Liu, H.-L., São Sabbas, F. T., Rampinelli, V. T., Batista, P., and Takahashi, H.: Convection: the likely source of the medium-scale gravity waves observed in the OH airglow layer near Brasilia, Brazil, during the SpreadFEx campaign, Ann. Geophys., 2009, 27, 231–259. [CrossRef]
- Venkat Ratnam, M., Narendra Babu, A., Jagannadha Rao, V. V. M., Vijaya Baskar Rao, S., and Narayana Rao, D.: MST radar and ra-diosonde observations of inertia-gravity wave climatology over tropical stations: source mechanisms, J. Geophys. Res., 2008, 113, D07109. [CrossRef]
- Venkat Ratnam, M., Pravallika, N., Ravindra babu, S., Basha, Ghouse, Pramitha, M. , Krishna Murthy, B.V., 2014. Assessment of GPS Radiosonde Descent Data, Atmospheric Measurement Techniques. 7, 1011–1025.
- Vincent, R. A., and M. J. Alexander (2000), Gravity waves in the tropical lower stratosphere: An observational study of seasonal and interannual variability, J. Geophys. Res., 105, 17,971-17,982. [CrossRef]
- Wrasse, C. M., Nakamura, T., Tsuda, T., Takahashi, H., Medeiros, A. F., Taylor, M. J., Gobbi, D., Salatun, A., Suratno, Achmad, E., and Admiranto, A. G.: Reverse ray tracing of the mesospheric gravity waves observed at 230S (Brazil) and 70S (Indonesia) in airglow imagers, J. Atmos. Sol. Terr. Phys., 68, 163–181, 2006. [CrossRef]
- Young-Joon Kim., Stephen D. Eckermann and Hye-Yeong Chun (2003), An Overview of the Past, Present and Future of Gravity-Wave Drag Parametrization for Numerical Climate and Weather Prediction Models, Atmosphere – Ocean,41, 65-98.
Figure 1.
Snapshot of the Airglow Imager data representing typical wave structures observed on 29 May 2014. The yellow line represents the direction of wave propagation.
Figure 1.
Snapshot of the Airglow Imager data representing typical wave structures observed on 29 May 2014. The yellow line represents the direction of wave propagation.
Figure 2.
Profiles of (a) temperature obtained using radiosonde, SABER/TIMED and MSISE 90 model. Horizontal bars indicate standard deviation. (b) Brunt Väisälä frequency profile obtained using the MSISE 90 temperature profile shown in (a). Profiles of (c) zonal wind and (d) meridional wind obtained using radiosonde, SVU meteor radar and HWM07 model representing the background atmosphere for Gadanki location. Horizontal bars in the SVU meteor radar indicate standard deviation in the winds obtain while averaging over a day. .
Figure 3.
Profiles of diurnal, semi-diurnal and terr-diurnal tidal amplitudes observed in the (a) zonal and (b) meridional components obtained using S.V.U meteor radar on 29 May 2014. Here we can compared with Maura Hagan model output.
Figure 3.
Profiles of diurnal, semi-diurnal and terr-diurnal tidal amplitudes observed in the (a) zonal and (b) meridional components obtained using S.V.U meteor radar on 29 May 2014. Here we can compared with Maura Hagan model output.
Figure 4.
(a) Altitude vs. longitude, (b) Altitude Vs. latitude and (c) latitude vs. longitude variation of the ray paths obtained for the one of waves observed on 29 May 2014 using different background conditions. Blue line shows the actual wind and temperature data path of the wave. Ray paths obtained while using the observed diurnal (D), semi-diurnal (SD) and ter-diurnal (TD) amplitudes are also superimposed in the respective panels. Ray paths obtained while adding (p, red lines) or subtracting (m, black lines) the tidal amplitudes are also shown.
Figure 5.
(Back ground color contours) TRMM satellite observed Infrared Brightness Temperature (IRBT) observed on 29 May 2014 at (a) 1300 UTC, (b) 1400 UTC, (c) 1500 UTC, and (d)1600 UTC. Black dots represent the terminal points of the waves observed on the same day.
Figure 5.
(Back ground color contours) TRMM satellite observed Infrared Brightness Temperature (IRBT) observed on 29 May 2014 at (a) 1300 UTC, (b) 1400 UTC, (c) 1500 UTC, and (d)1600 UTC. Black dots represent the terminal points of the waves observed on the same day.
Figure 6.
Monthly mean profiles of (a) temperature, (b) zonal wind and (c) meridional wind obtained from Gadanki model.
Figure 6.
Monthly mean profiles of (a) temperature, (b) zonal wind and (c) meridional wind obtained from Gadanki model.
Figure 7.
Direction of the propagation of the waves simulated with various combinations of the GW characteristics that are reaching mesosphere during (a) winter, (b) pre-monsoon, (c) monsoon, and (d) post-monsoon seasons. Along the rows show horizontal wavelengths of 10, 20, 30, 40, 50, 60, 70, 80, 90, 100, 125, 150, 175, 200 km and along the columns show the periods of 10, 20, 30, 45, 60, 90, 120, 180, 240, 300, 360 minutes. Each circle has 12 sections with 30o separation. Filled circle represents that waves observed in all the directions.
Table 1.
Time, horizontal wavelength, phase speed direction of propagation and period of the waves observed by Airglow Imager on 29 May 2014.
Table 1.
Time, horizontal wavelength, phase speed direction of propagation and period of the waves observed by Airglow Imager on 29 May 2014.
| Serial no. |
Time (UT) |
lx (km) |
vj (m/s) |
AZ (°) |
Period(min) |
| 1 |
14h46'20s |
18 |
75 |
320 |
4 |
| 2 |
15h34'20s |
7 |
75 |
323 |
1.5 |
| 3 |
-- |
7 |
41 |
50 |
2.9 |
| 4 |
16h06'20 |
4 |
33 |
315 |
2 |
| 5 |
16h23'20s |
12 |
40 |
50 |
5 |
| 6 |
16h43'20s |
4 |
22 |
310 |
3.03 |
| 7 |
-- |
- |
66 |
350 |
- |
| 8 |
-- |
13 |
42 |
48 |
5.2 |
| 9 |
17h24'20s |
16 |
44 |
50 |
6.1 |
| 10 |
18h06'20s |
4 |
25 |
300 |
2.7 |
| 11 |
18h17'20s |
7.5 |
50 |
300 |
2.5 |
| 12 |
19h02'20s |
4.5 |
0 |
333 |
- |
| 13 |
-- |
7 |
15 |
290 |
7.7 |
| 14 |
-- |
7 |
21 |
294 |
5.6 |
| 15 |
-- |
15 |
29 |
308 |
8.6 |
| 16 |
20h49'20s |
- |
- |
110 |
- |
| 17 |
22h27'20s |
12 |
66 |
146 |
3.03 |
|
Disclaimer/Publisher’s Note: The statements, opinions and data contained in all publications are solely those of the individual author(s) and contributor(s) and not of MDPI and/or the editor(s). MDPI and/or the editor(s) disclaim responsibility for any injury to people or property resulting from any ideas, methods, instructions or products referred to in the content. |
© 2024 by the authors. Licensee MDPI, Basel, Switzerland. This article is an open access article distributed under the terms and conditions of the Creative Commons Attribution (CC BY) license (http://creativecommons.org/licenses/by/4.0/).
