1. Introduction
Sustained drug delivery systems try to regulate the drug release rate to maintain targeted medication levels in the blood that are therapeutically effective for a prolonged time. Lowering the overall dosage of the medication given and the frequency of adverse side effects can, therefore, improve patient compliance. Adding the drug to a matrix system is the most popular way to control its release [
1,
2].
A centrally acting muscle relaxant, chlorzoxazone (5-chloro-2,3-dihydro-1,3-benzoxazol-2-one) (CLZ) has been licensed for the treatment of musculoskeletal disorders [
4] and is used to relieve muscle spasm and the pain and discomfort that follows [
3]. By predominantly acting at the level of the spinal cord and subcortical regions of the brain, CLZ prevents muscle spasms. The associated muscle is a decrease in skeletal muscular spasm accompanied by enhanced mobility and pain alleviation. Inhibiting calcium and potassium influx could be one-way Cks, resulting in muscular relaxation and neural inhibition. Following oral dosing, mice and rats tested on CLZ showed little to no muscle relaxant activity, and the drug is fully absorbed and quickly metabolized in the liver to 6-hydroxychlorzoxazone [
4,
5]. It takes action an hour after an oral dose and lasts for three to four hours. Most participants may attain peak levels of CLZ in 1 to 2 hours following oral administration, with blood levels typically noticed in persons during the first 30 minutes. The recommended starting oral dosage is 500 mg three or four times per day; however, this can frequently be lowered to 250 mg three or four times per day in the future. As part of compound preparation, CLZ is typically administered alongside analgesics. After being quickly digested, CLZ is mainly eliminated as the conjugated form of glucuronide in the urine. Within 24 hours, the urine excretes less than 1% of the administered dose of CLZ undisturbed. The three most typical side effects of CLZ are headache, lightheadedness, and drowsiness [
6]. Rarely reports of severe—even fatal—hepatocellular toxicity in CLZ recipients have surfaced. Although the process is unknown, it seems peculiar and erratic. It is unknown what factors predispose persons to this rare condition. Early hepatotoxicity signs and/or symptoms, such as fever, rash, anorexia, nausea, vomiting, lethargy, right upper quadrant pain, dark urine, or jaundice, should be reported by patients.
CLZ has a Pka value of 3.3 and is classified under the Biopharmaceutical Classification System II (BCS), it is a suitable candidate for formulation as a gastroretentive dose form. Longer stomach transit times contribute to increased solubility and, thus, absorption. Any active substance is gastrointestinal absorption is severely limited by its low water solubility. Water-soluble medicines have limited therapeutic effects due to low solubility and dissolving rates [
7]. In earlier research, we looked at different methods to improve the active ingredient's solubility and the impact of formulation parameters on CLZ stability [
8,
9,
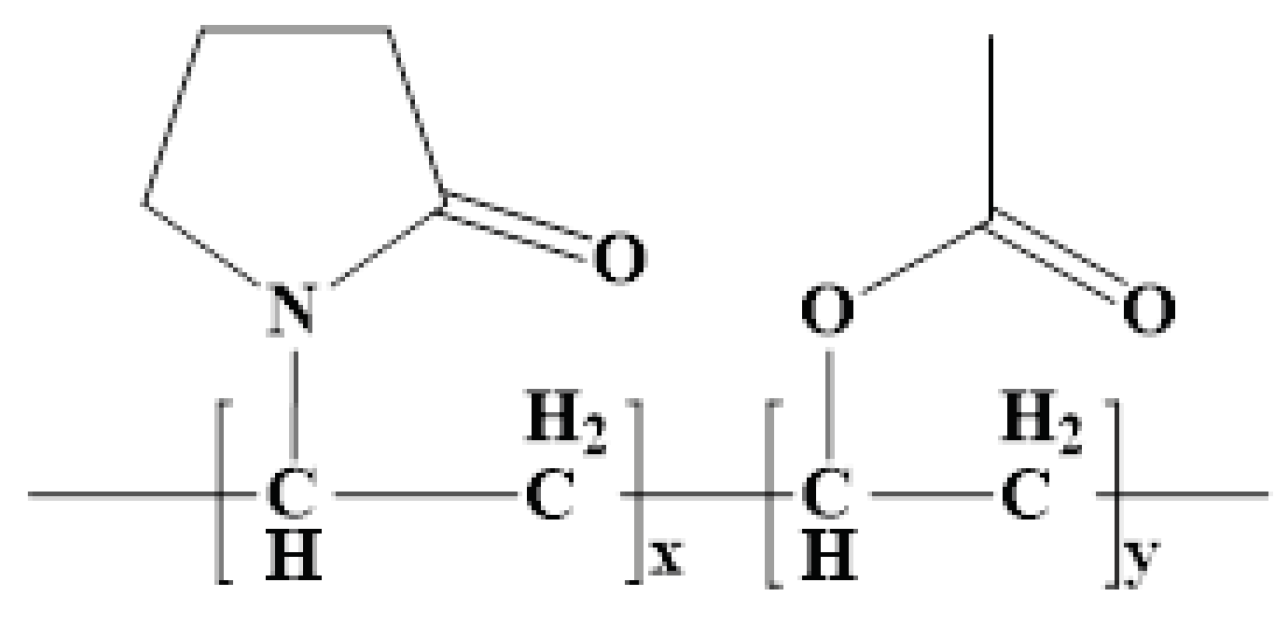
10]. The study is predicated on novel oral matrix tablets that were designed to maximize the low oral bioavailability using chitosan and Kollidon®SR. Made up of 80% polyvinyl acetate (Mr = 450000 Daltons) and 20% polyvinylpyrrolidone (povidone) (Mr = 40000 Daltons), Kollidon®SR (KOL) is a physical mixture of polymers [
11,
12]. KOL is one of the utilized hydrophilic excipients in the formulation and production of modified-release matrix tablets. The literature contains a wealth of research showcasing that matrix-forming agents are effective and adaptable. Analogous research was published in the literature [
13] (
Figure 1).
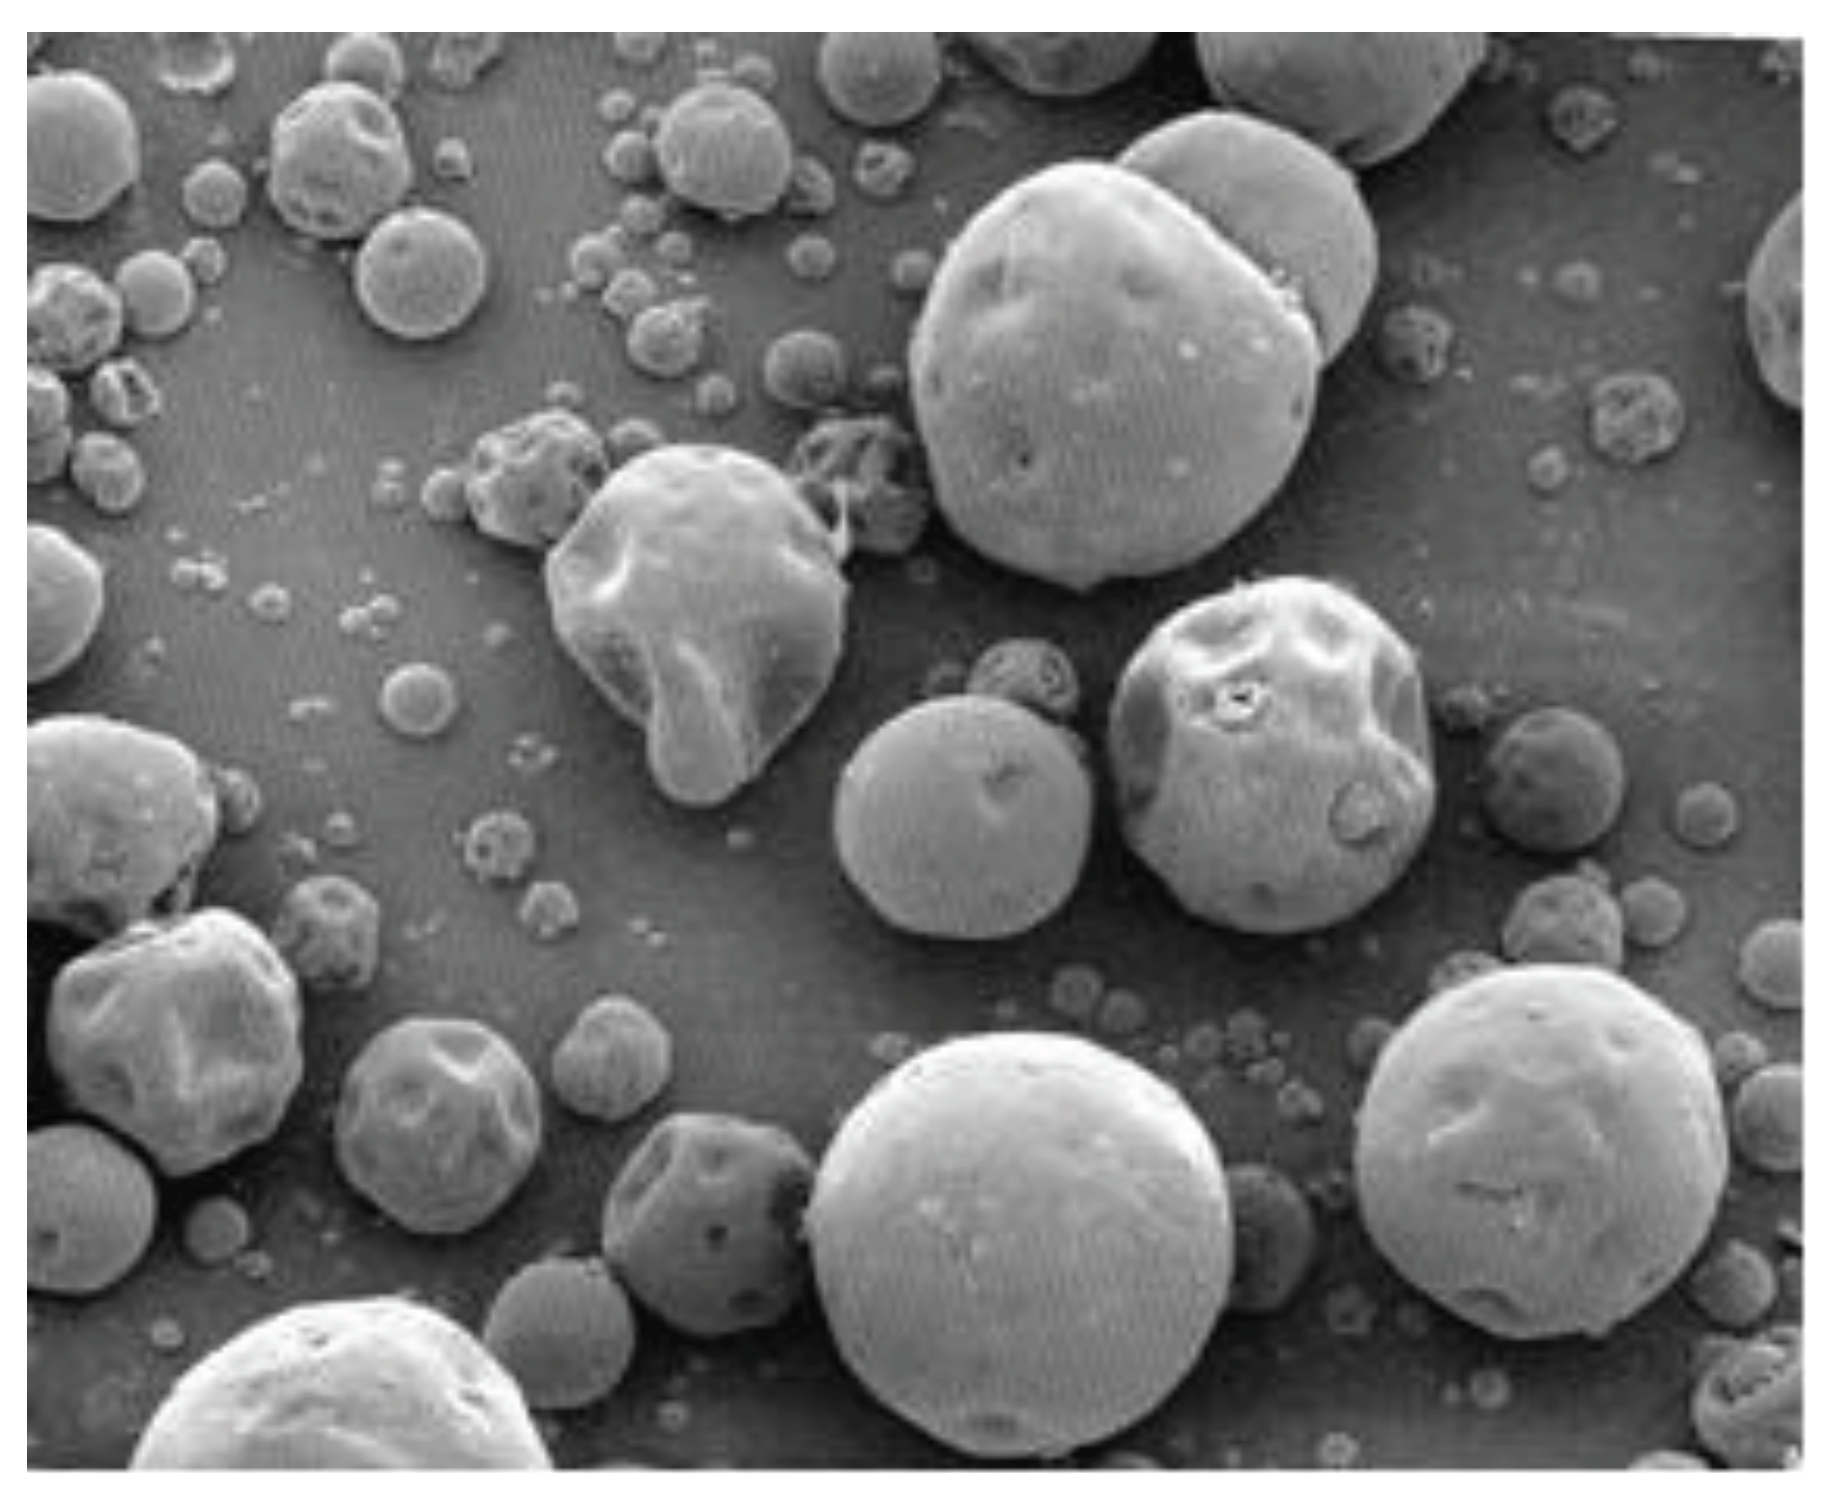
In
Figure 2, KOL particles are represente.
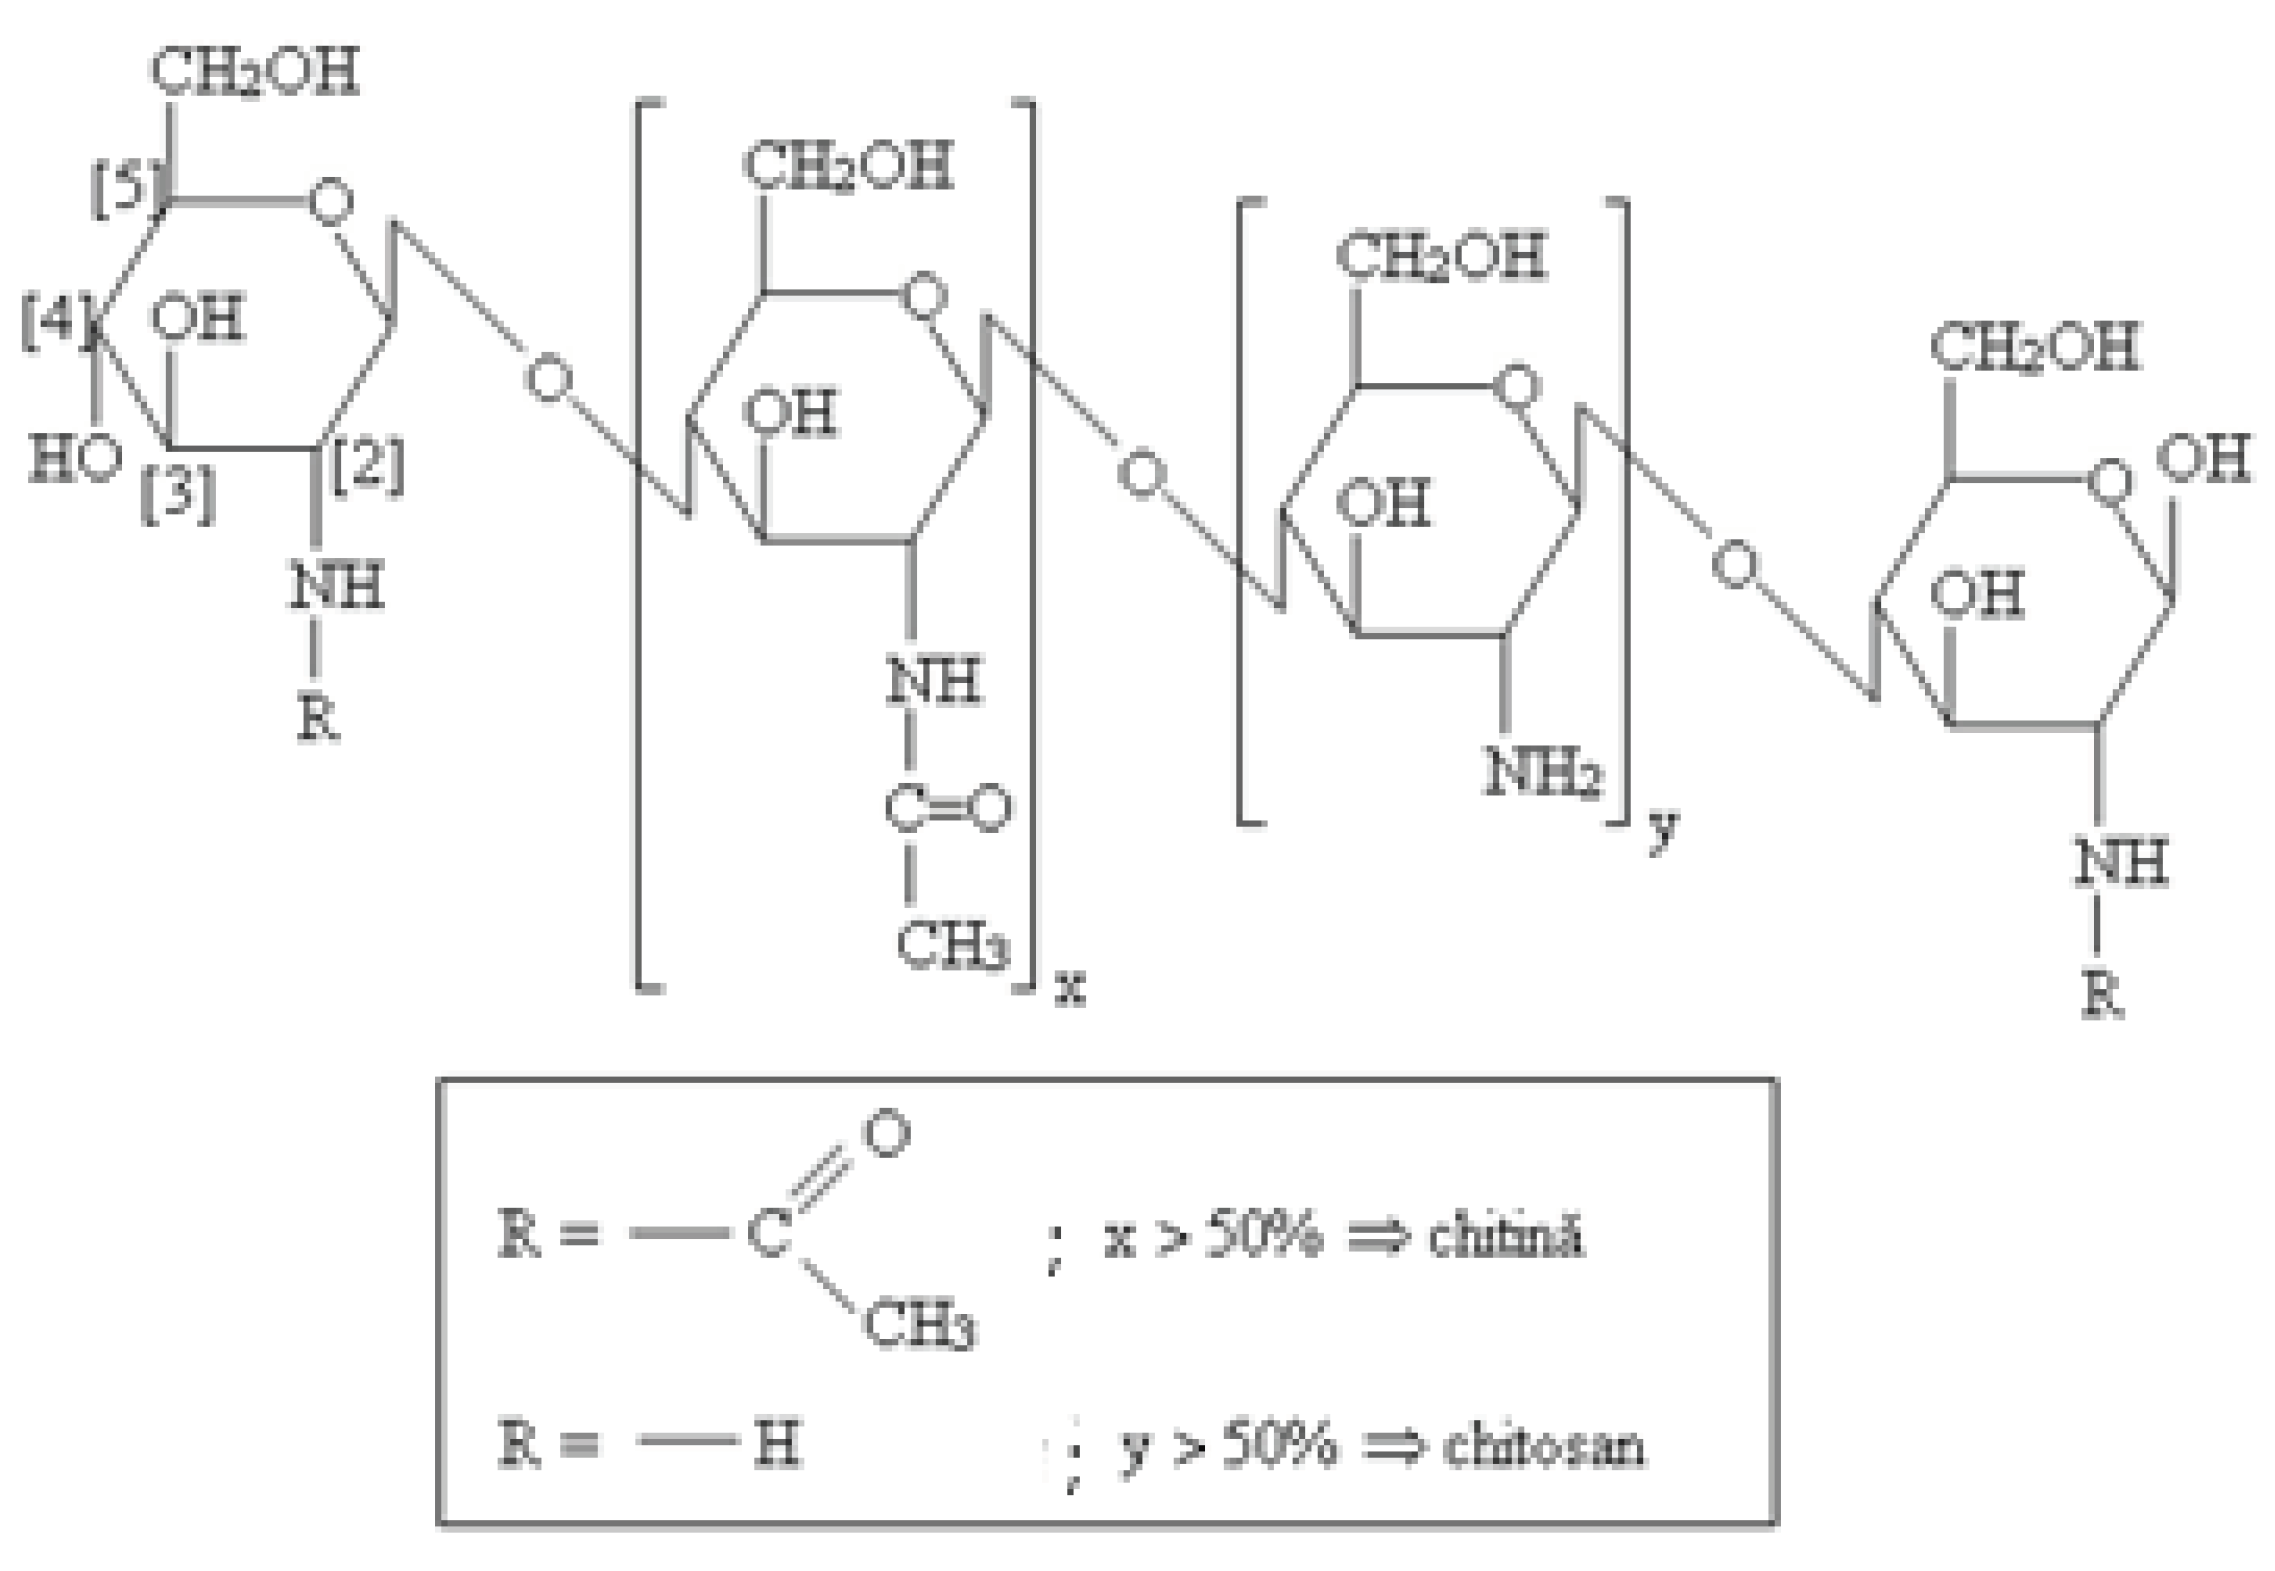
We have also associated chitosan (CHT) in the studied KOL-based formulations. The chemical structure of CHT (C6H11O4N) includes two copolymers, glucosamine and N-acetyl glucosamine, with high molecular weight Mw = 10000-1000000 Daltons, with a degree of deacetylation between 40- 98%. CHT is a biodegradable and biocompatible polymer that acts as an absorption promoter for hydrophobic active substances with high molecular weight in the gastrointestinal tract [
14,
15] (
Figure 3).
CHT with a degree of deacetylation from 51% to 65% only increases the absorption of active substances hydrophores with high molecular weight [
16,
17].
Avicel® PH (AV): Microcrystalline Cellulose.
Aerosil® (A): hydrophilic fumed silica with a specific surface area of 200 m² g-1.
Magnesium Stearate (ST) has also been used. All used compounds accomplish the quality requirements according to the laws of force. These excipients facilitate the application of the direct compression method to obtain optimal CLZ dispersibility in the powdered mixtures and the association of hydrophilic (CHT) and hydrophobic substances (CLZ).
The study's objective was to develop and pharmacologically characterize matrix tablets based on Kollidon®SR and chitosan, formulated to optimize the oral availability of CLZ, taking into account the pharmacodynamic and biopharmaceutical properties of the muscle relaxant drug. There is a need to develop and implement new delivery systems that combine safety and efficacy to improve the solubility of CLZ, either by increasing its oral bioavailability, reducing its adverse effects, or reducing the number of doses to improve patient compliance. The new oral matrix tablets with CLZ based on Kollidon®SR and chitosan, were developed as an alternative to oral solid dosage forms for pediatric and geriatric patients who have difficulties swallowing solid dosage forms.
2. Results
The results showed a good flow of KOL formulations in 20-30% (w/w) concentration. In contrast, the increase in KOL concentration above 40%( w/w) negatively influenced the flow properties, thus sorting the F1c, F2c, and F3c formulations as powders with deficient flow. The results obtained for the Hausner ratio and Carr index set the F1a, F1b, F2a, F2b, F3a, and F3b formulations into the group of powders with sound and excellent flow. The values of those two parameters proved that formulations with high concentrations of KOL, F1c, F2c, and F3c had poor flow.
The results of all flow parameters determined showed a positive influence of CHT on the flowability and compressibility properties.
Table 1 presents the results obtained when determining the flow and compressibility parameters of the studied formulations.
The results obtained for the pharmaco-technical parameters of matrix tablet formulations are shown in
Table 2.
The analysis of the values proved that formulations F1c, F2c, and F3c containing the highest percentage of KOL exhibited significant variations in mass uniformity, even beyond the 5% limit set by Romanian Pharmacopoeia, Xth Edition[
18]. It could also be correlated to the data recorded for the flow and compressibility parameters that indicated a poor flow for those formulations. Formulations F1a,b-F2a,b- F3a, and b showed variations in tablet mass within the limits set by Romanian Pharmacopoeia, Xth Edition[
19].
Mechanical strength varied between 82.45 and 99.75 N, and it was noticed that the values decreased directly proportionally to the increase in the concentration of KOL. Those results contradicted the technical specifications of KOL, which stated an increase in the mechanical strength of the tablets directly proportional to the rise in the concentration of polymer in the formulation as a result of its plastic behavior imprinted by the povidone-linked polyvinyl acetate [
20]. That behavior to compression had also been observed in other studies when KOL was combined with other matrix formers hydrophilic polymers [
21].
The mass uniformity shows a deviation of ± 5% compared to the mass of standard tablets of ≥250 mg (500 ± 25). The dose uniformity values correspond to each unit's individual content of active substance, which should be 95% to 105% concerning average content.
Table 3 showed that the average drug content of three tablets from each formula was 249 mg for F1, 165.66 mg for F2, and 124.67 mg for F3. The standard deviation (SD) values indicate that the sample processing made no significant modifications. All obtained values of the pharmaco-technical characteristics are within the limits of the specifications reported in the literature[
22].
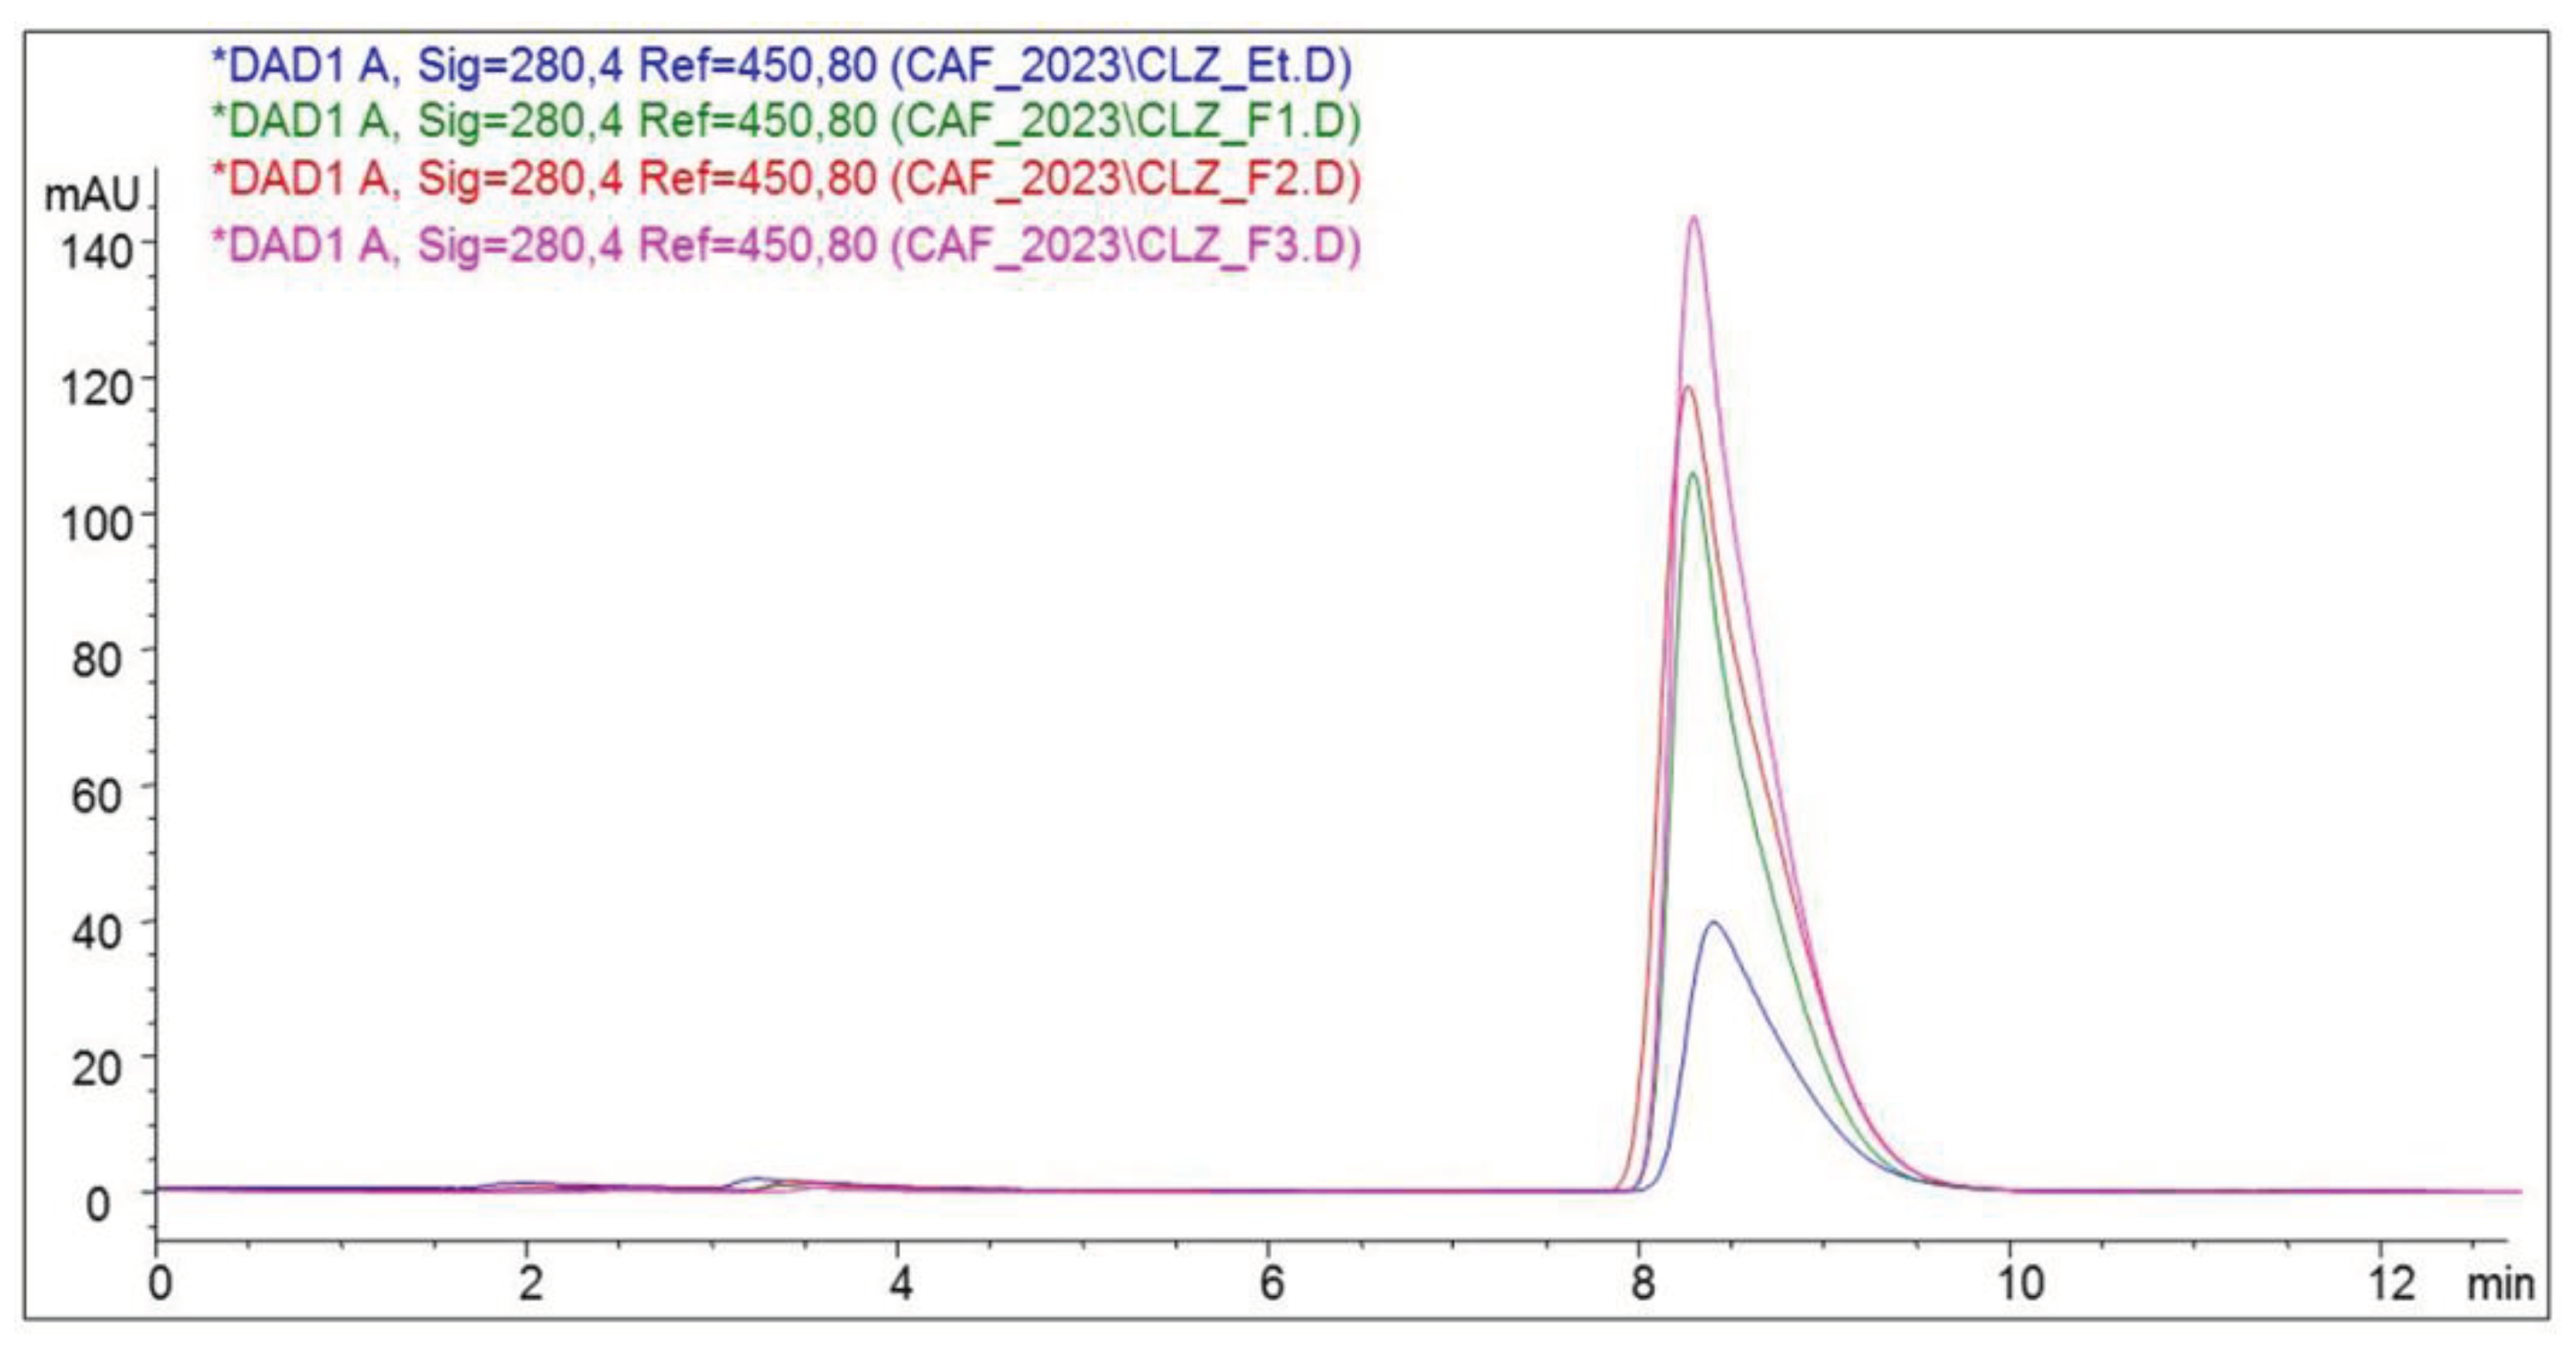
CLZ was quantitatively determined using an HPLC method. It was detected by the UV spectrum at its characteristic wavelength of 280.4 nm(
Figure 4) [
23].
The chromatogram highlights the quantitative difference in active substance from the three formulations. F1 has the highest peak, containing the highest amount of CLZ, followed by F2 with the smallest peak and F3 with the lowest peak, indicating the least CLZ titrates. The three formulations and the CLZ standard show an absorption maximum of 280.4 nm.
Friability, a pharmaco-technical parameter directly correlated with the mechanical strength of the tablets, showed increasing values directly proportional to the increase in the concentration of KOL in the formulation. As far as Friability was concerned, it was noticed that the decrease in mechanical strength had led to an increase in tablet friability. The F1c, F2c, and F3c formulations showed a stripping tendency during compression and friability tests.
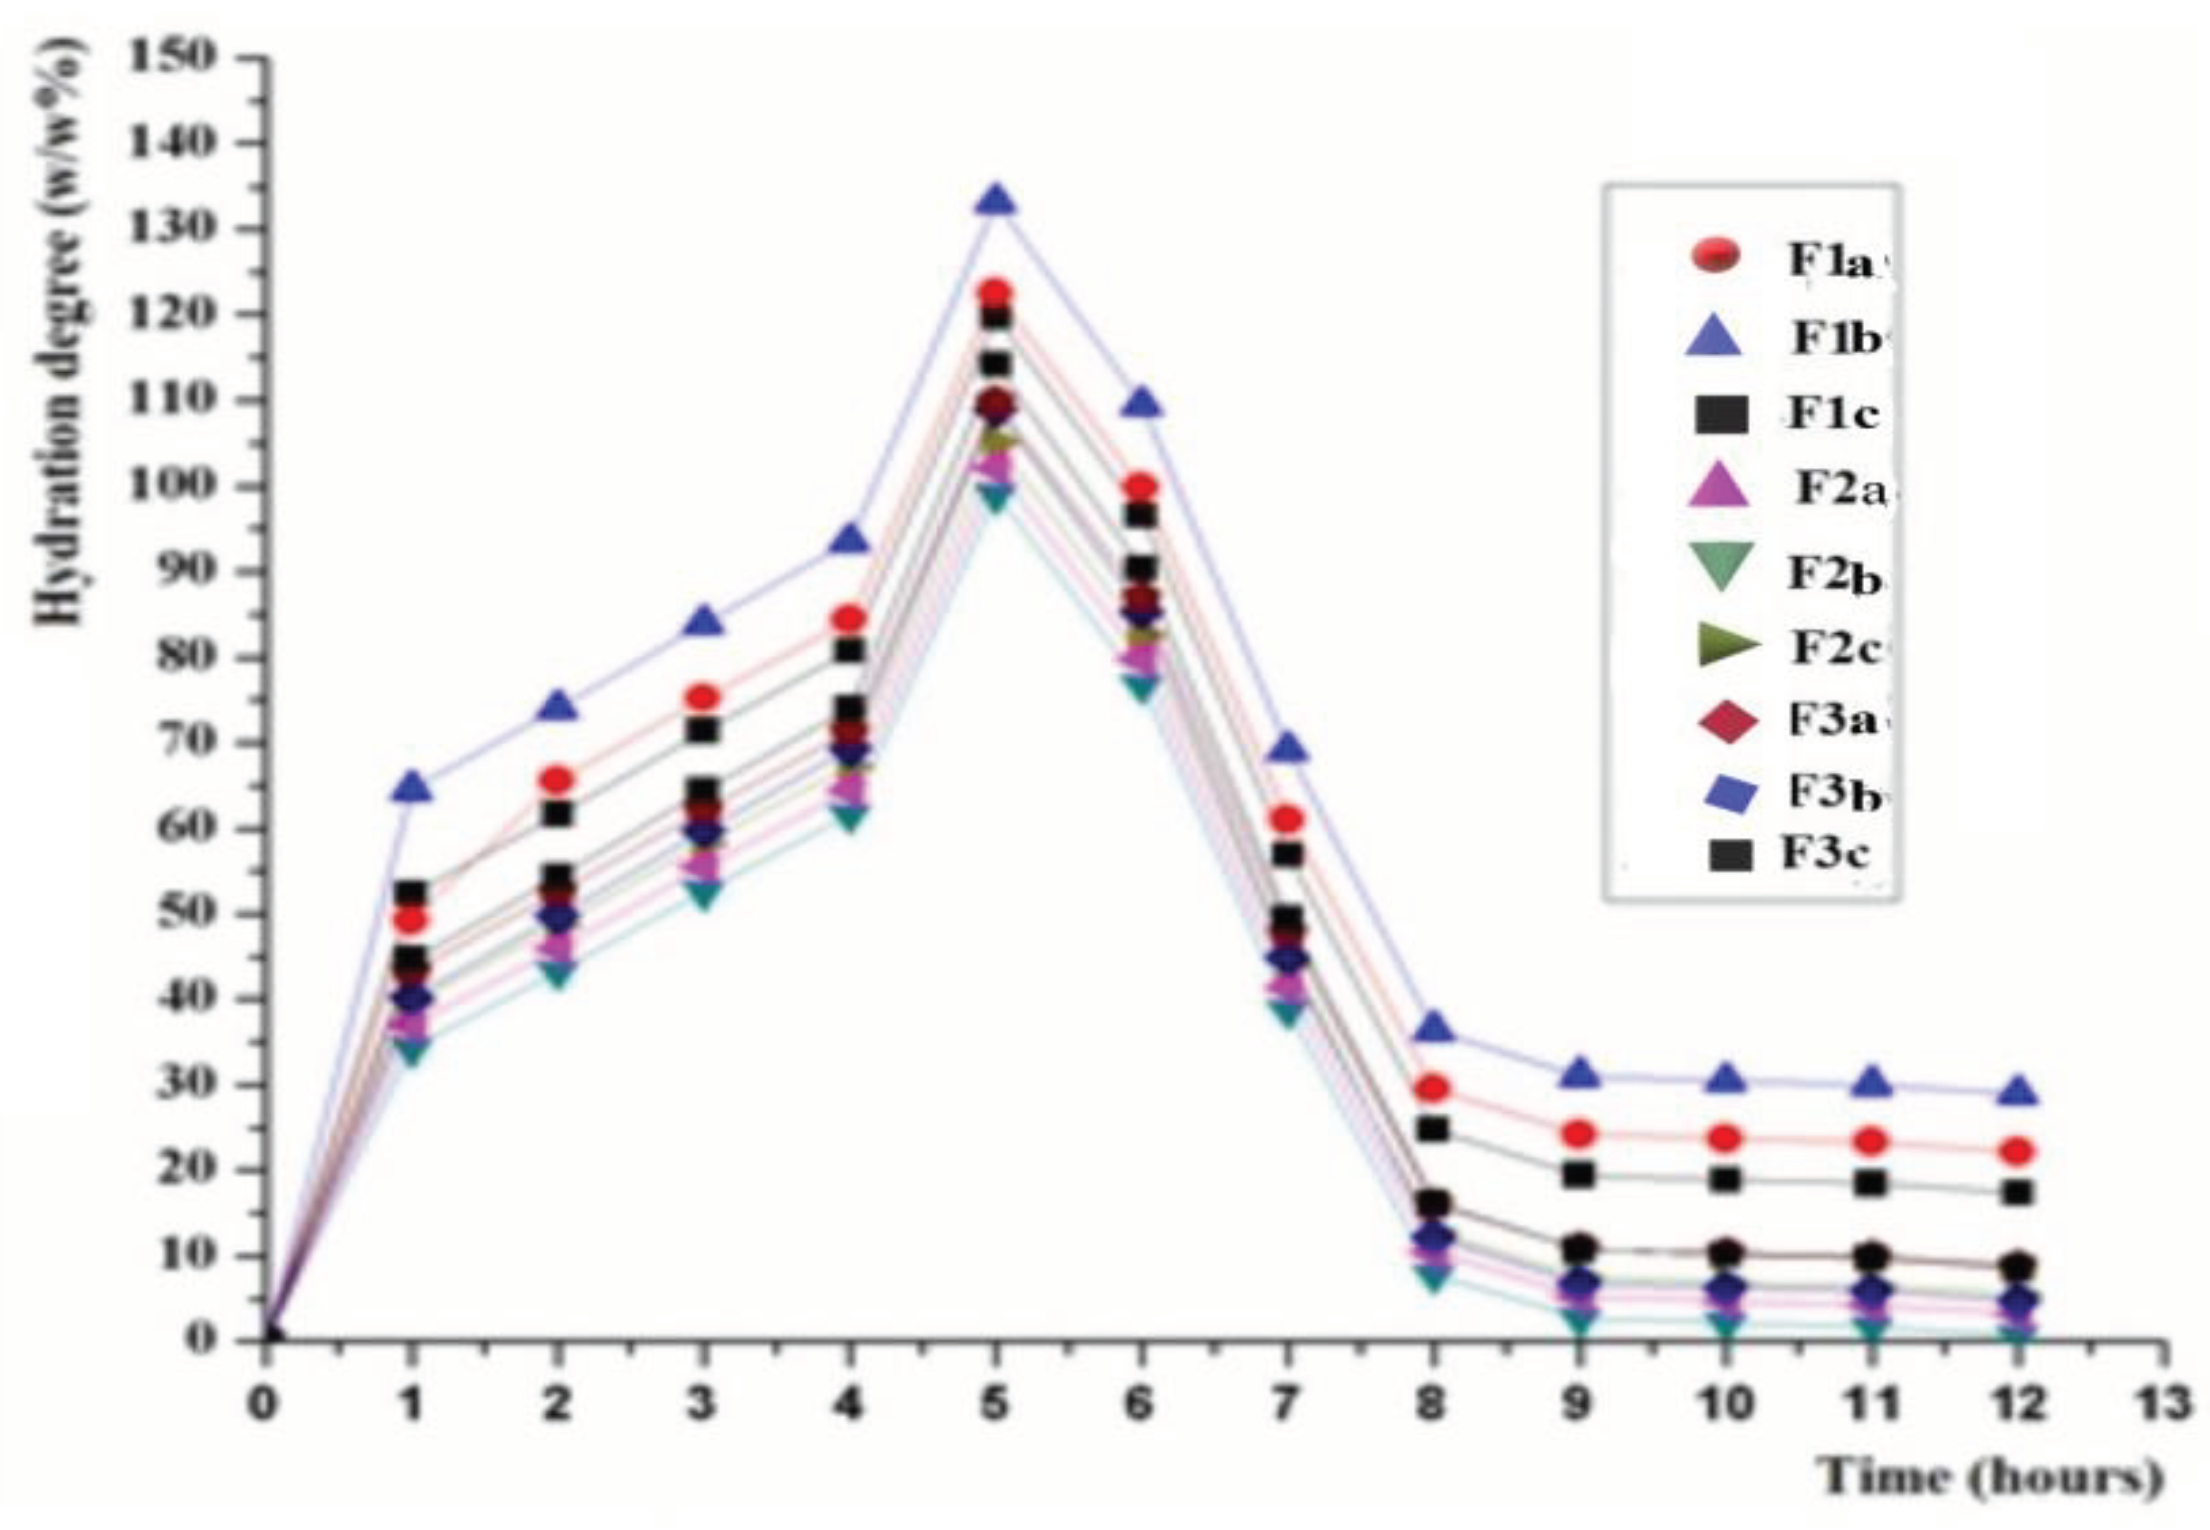
The hydration characteristics of the hydrophilic matrix tablets with CLZ are plotted in
Figure 5.
The matrix-forming polymers directly influenced the hydration characteristics of hydrophobic matrix tablets with modified release. Thus, F1a, F1b, F1c, F2a, F2b, F2c, F3a, F3b, and F3c formulations with 20-40% (w/w) KOL concentration exhibited absorbent properties in the first five h of the test, after that, there was a slight decrease in mass in the following 2-3 h. From the 8th hour, the matrix tablets were almost unchanged in size and mass. It is worth mentioning that formulations F1b, F2b, and F3b with 30% (w/w) KOL showed hydration properties superior to formulations with a content of KOL and CHT. Formulations F1c, F2c, and F3c with 40% (w/w) KOL and 7% (w/w) CHT were characterized by adsorbent properties inferior to the other formulations.
Only three formulations, F1b, F2b, and F3b, showed optimum pharmaco-technical properties. They were evaluated through Fourier-transform infrared spectrometry, X-ray diffraction, thermogravimetry, differential scanning calorimetry, and in vitro dissolution tests.
2.1. Drug-Excipients Compatibility Study
FT-IRspectroscopy performed the drug excipients compatibility studies.
2.1.1. Fourier Transform Infrared Spectroscopy
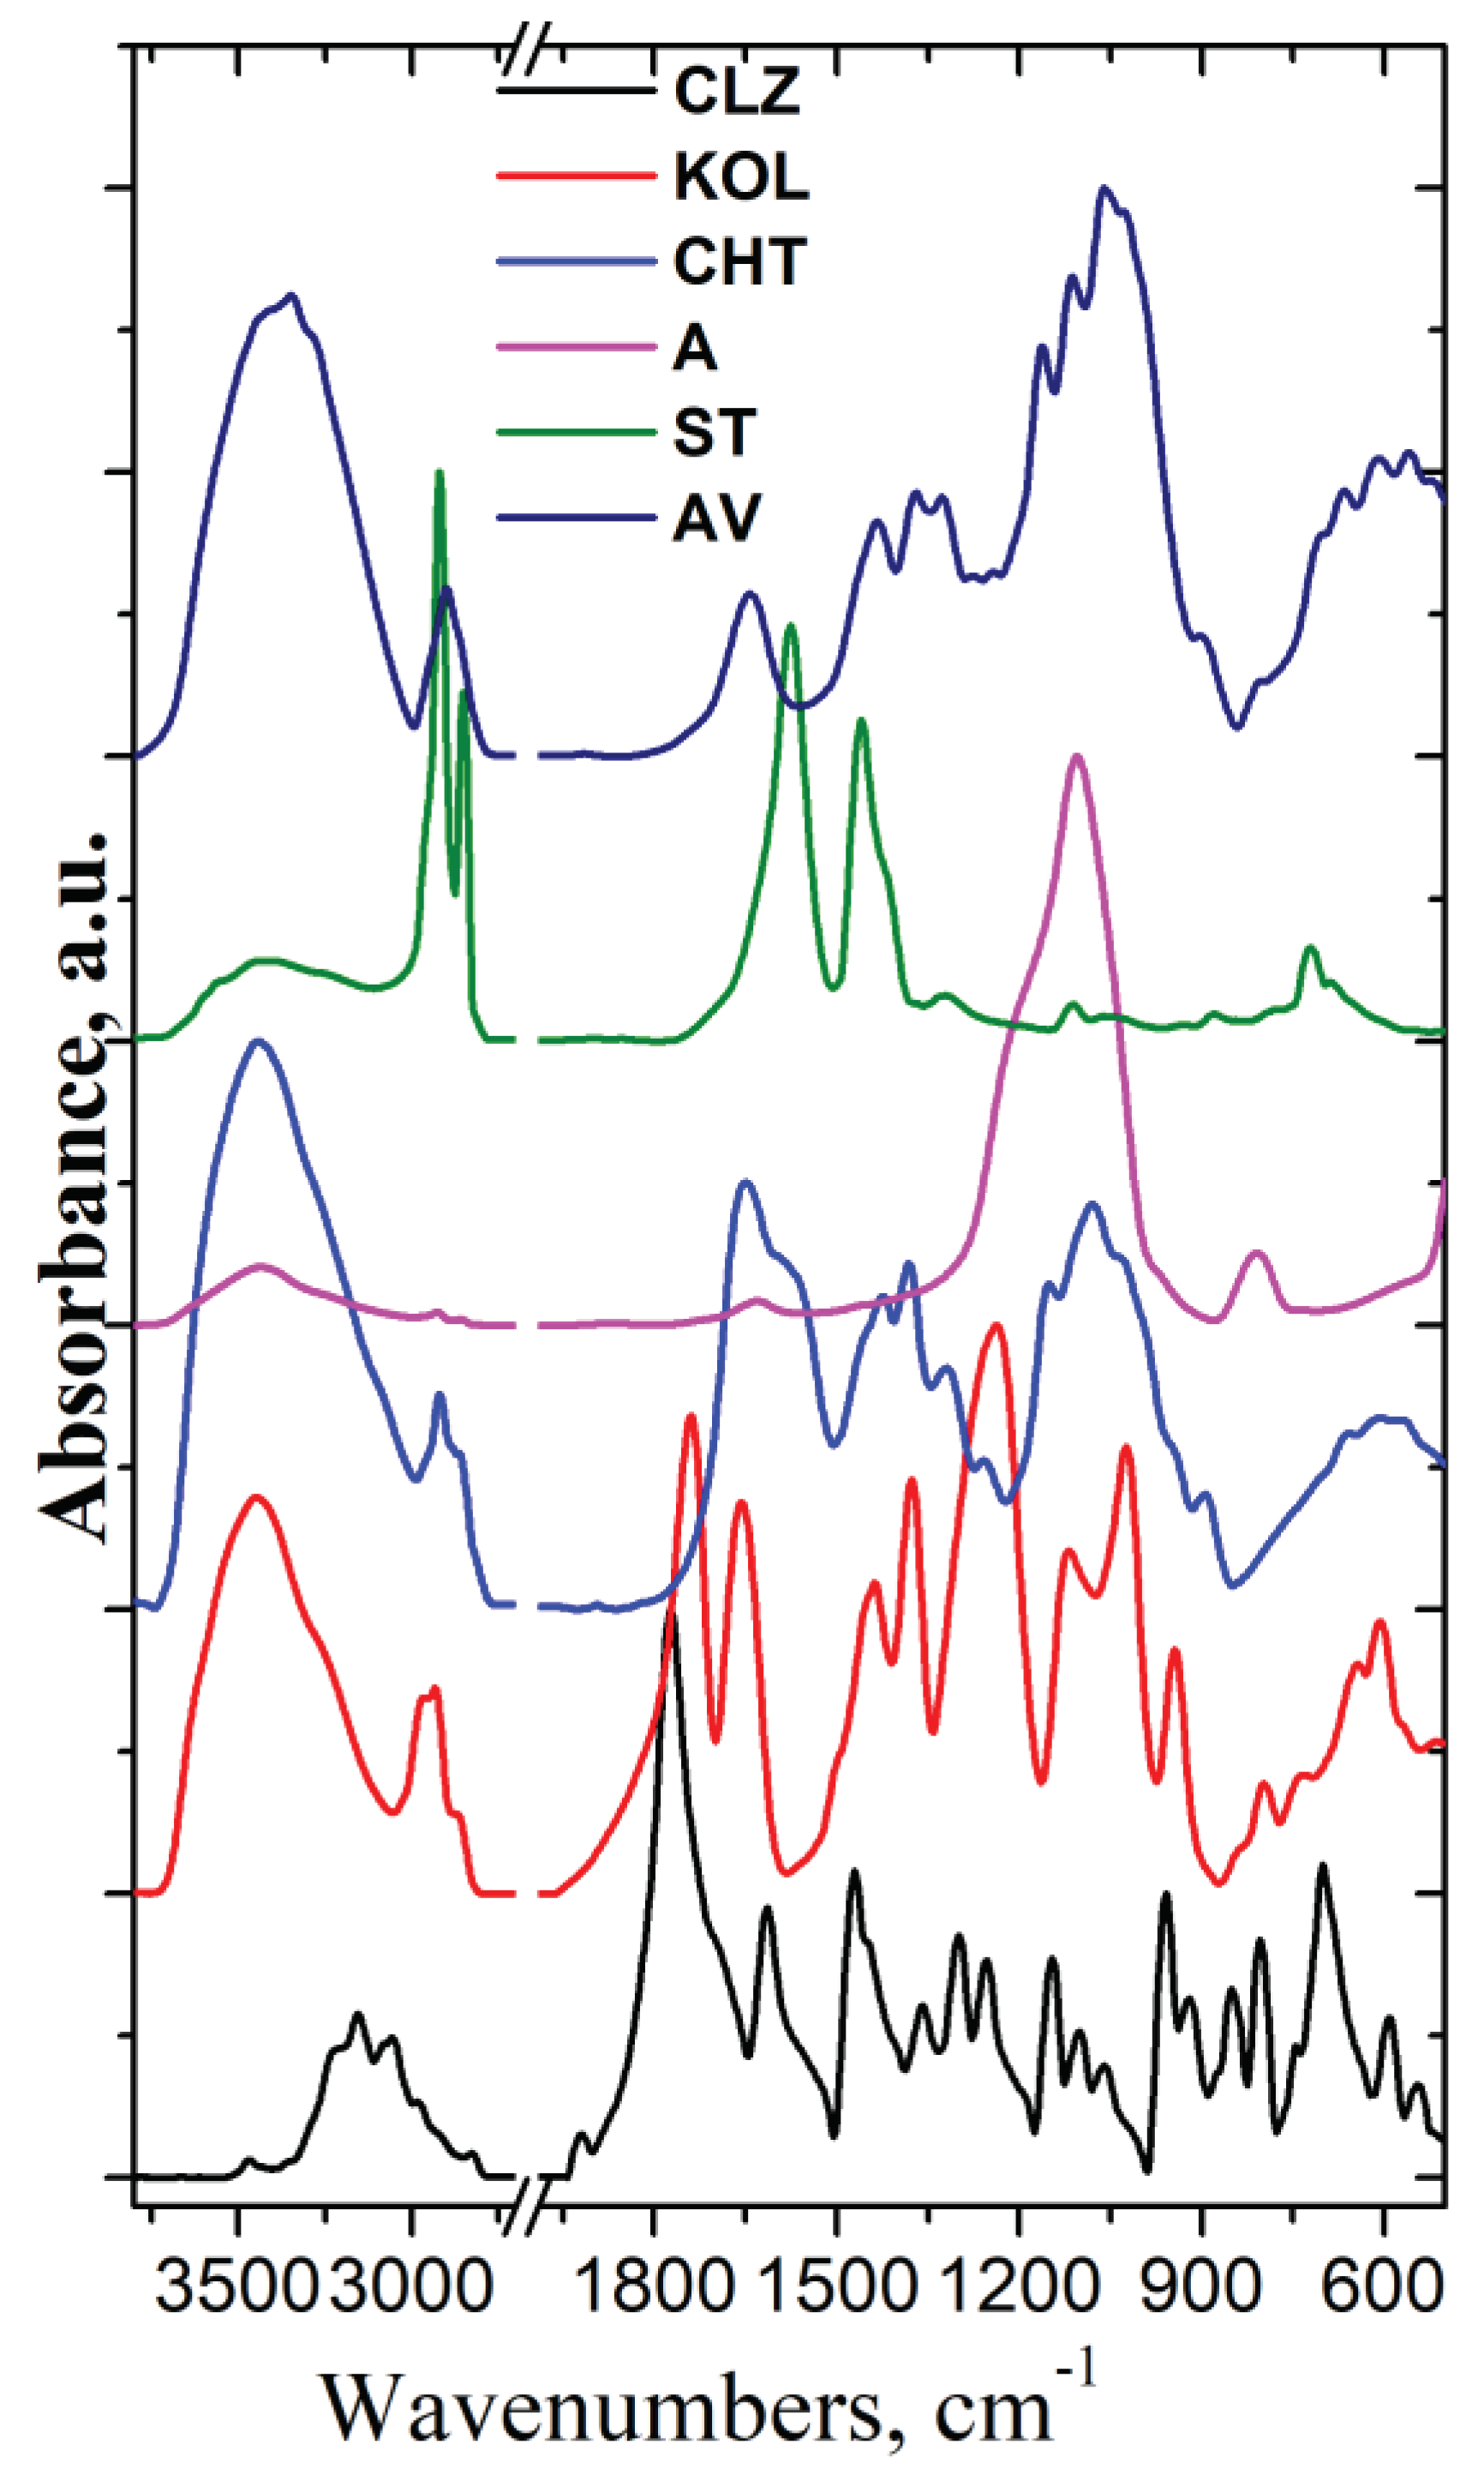
Figure 6 presents the FT-IR spectra of all components used in the formulation fabrication process.
As can be seen from
Figure 1, the IR spectrum of CLZ shows bands at 3468, 3204, 3156 cm
-1 assigned to stretching vibration of NH groups, at 3080 and 3055 cm
-1 assigned to stretching vibration of Ph-H groups, at 2982 and 2827 cm
-1 assigned to stretching vibration of CH groups, at 1773 cm
-1 assigned to stretching vibration of C=O groups, at 1614 cm
-1 assigned to C=C groups from aromatic rings, at 1471 cm
-1 assigned to stretching vibration of CC and CN groups and deformation vibration of CCH groups, at 1359 and 1255 cm
-1 assigned to stretching vibration of CC groups and deformation vibration of CCH and CNH groups, at 1100 cm
-1 assigned to stretching vibration of CN and CO groups and deformation vibration of CCH and CCC groups, at 1061 cm
-1 assigned to stretching vibration of CC and CCl groups and deformation vibration of CCH groups, at 958 cm
-1 assigned to stretching vibration of CN groups and deformation vibration of CCC groups, at 591 cm
-1 assigned to deformation vibration of CNO, CCO and CCN groups, and at 545 cm
-1 assigned to stretching vibration of CO and CCl groups and deformation vibration of CCC groups [
24,
25]. The IR spectrum of KOL shows bands at 3447 cm
-1 assigned to stretching vibration of OH groups, 2965, 2933, 2870 cm
-1 assigned to symmetric and asymmetric stretching vibration of CH groups, 1740 and 1658 cm
-1 assigned to stretching vibration of C=O groups from vinyl acetate and pyrrolidone ring, respectively; at 1375 cm
-1 assigned to stretching vibration of COO groups, at 1236 cm
-1 assigned to stretching vibration of CC groups and deformation vibration of CCH and CNH groups, at 1119 cm
-1 assigned to stretching vibration of CN and CO groups and deformation vibration of CCH and CCC groups, at 1024 cm
-1 assigned to stretching vibration of CC and CCl groups and deformation vibration of CCH groups, and at 944 cm
-1 assigned to stretching vibration of CN groups [
26].
The stretching vibrations of OH bonds of chitosan were evidenced at 3444 cm-1, and symmetric and asymmetric stretching vibrations of CH groups were observed at 2960, 2923, 2886, and 2866 cm
-1, respectively. The absorption bands at 1651cm
-1, 1597cm
-1, 1424cm
-1, and 1381 cm
-1 are assigned to the stretching vibration of C=O groups of amide I, deformation vibrations of the NH (N-acetylated residues, amide II band), deformation vibration of CH
2, CH
3 groups and deformation vibration of OH groups. The band at 1258 cm
-1 is assigned to the stretching vibration of NH, COC, and COH groups, and the bands at 1158 cm−1 and 1079 cm−1 are assigned to the stretching vibration of CO and COC groups [
27].
The FT-IR spectrum of the Aerosil (A) showed specific bands at 1106 cm–1 assigned to asymmetric stretching vibrations of the Si-O-Si bonds of silica oxide and a small band at 806 cm–1 assigned to symmetric deformation of the Si-O-Si groups.
In the IR spectrum of Mg stearate (ST), specific bands assigned to the stretching vibration of CH groups appear at 2921 and 2852 cm-1, while the bands allocated to the symmetric and asymmetric stretching vibration of (COO-) groups are identified at 1576 and 1456 cm-1, respectively. The band at about 3436 cm-1 is due to stretching vibrations of the associated water molecules.
The IR spectrum of Avicel (AV) presents characteristic bands of cellulose at 3413, 3346, 1434, 1324 cm
-1 assigned to stretching and in plane deformation vibration of OH groups, at 2901, 1371 and 1276 cm
-1 assigned to stretching and deformation vibration of CH groups, at 1643 cm
-1 assigned to stretching vibration of absorbed OH and conjugated CO groups, at 1243, 1163, 1113, 1061, and 1026 cm
-1 assigned to stretching vibration of CO groups, and at 901 cm
-1 assigned to the β-glucosidic linkage between the sugar units [
28].
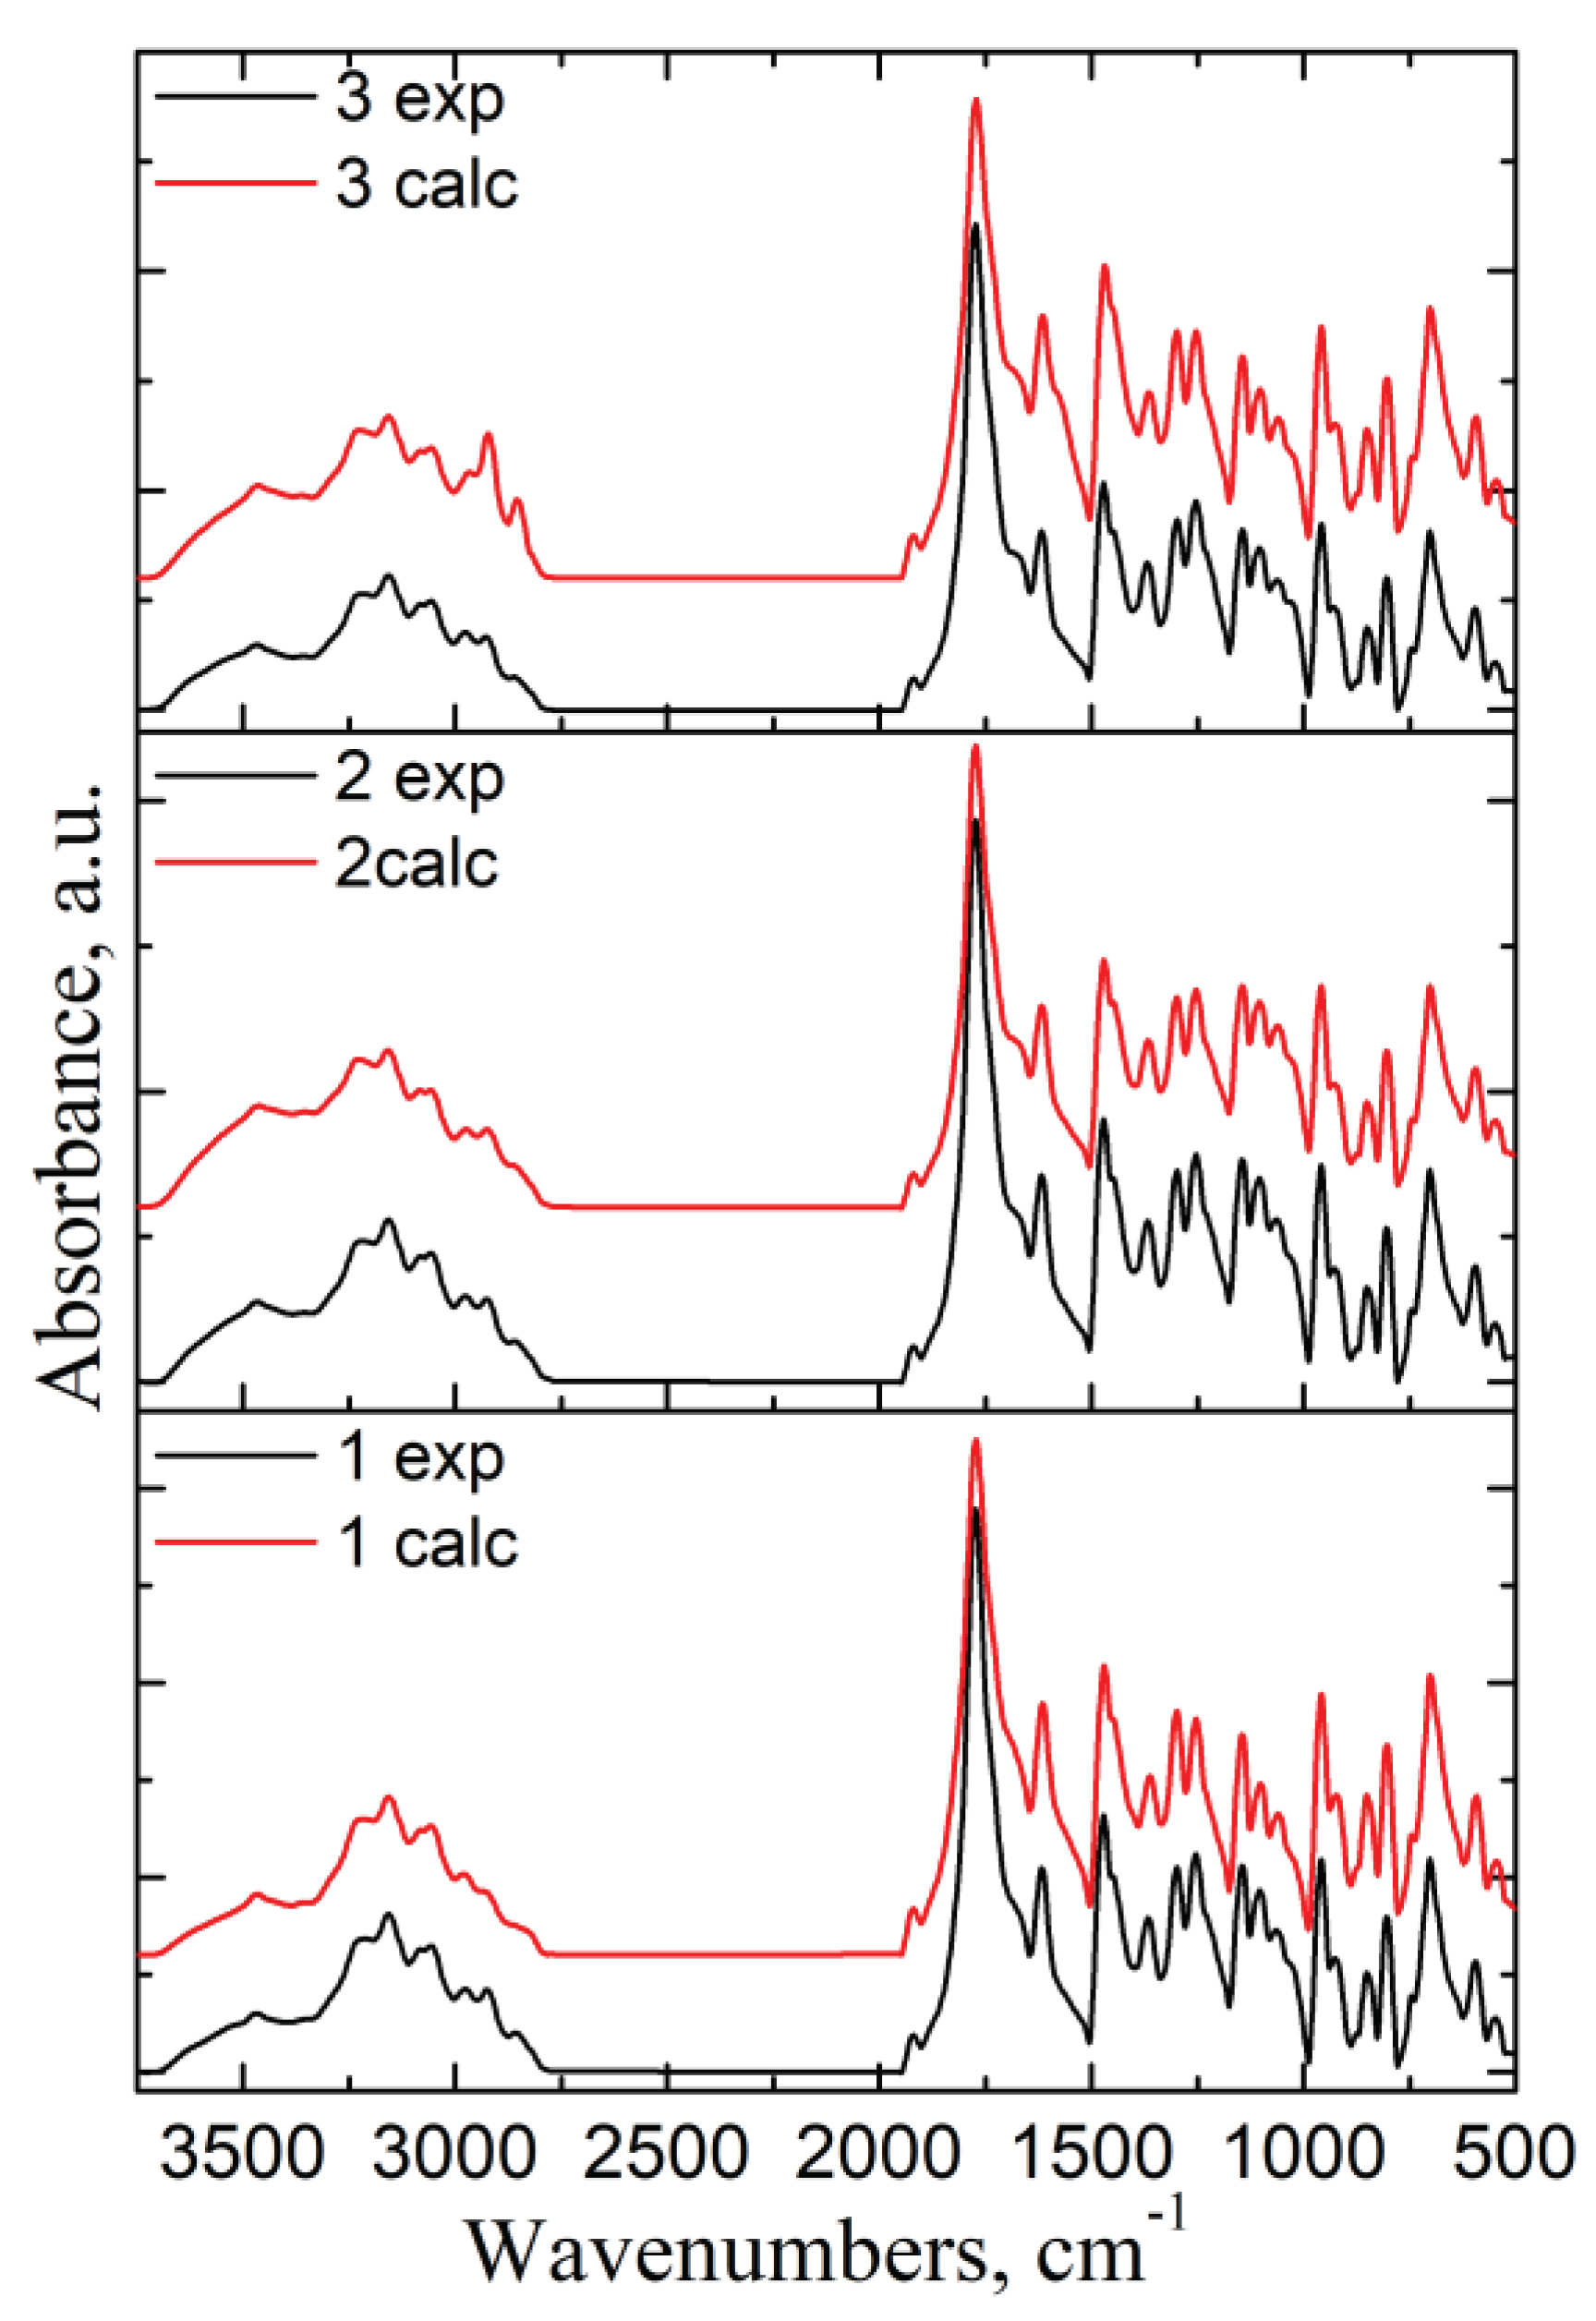
To identify if there are interactions between the components of the mixtures, the experimental FT- IR spectra of formulations were compared with their calculated ones (using the additivity low [
29] (
Figure 7).
In the case of a physical mixture, there should be little or no interaction between the components. The intensity of the spectral bands should show a linear dependence with the sample concentration in the blend. All the characteristic bands of CLZ were present in the formulations' spectra, and their intensity varies according to their content. The similarity between experimental and calculated spectra indicates that there was no interference of the functional groups, no sign of any polymorphic changes, and the chemical integrity of the drug was not affected.
2.1.2. X-Ray Diffraction Analysis
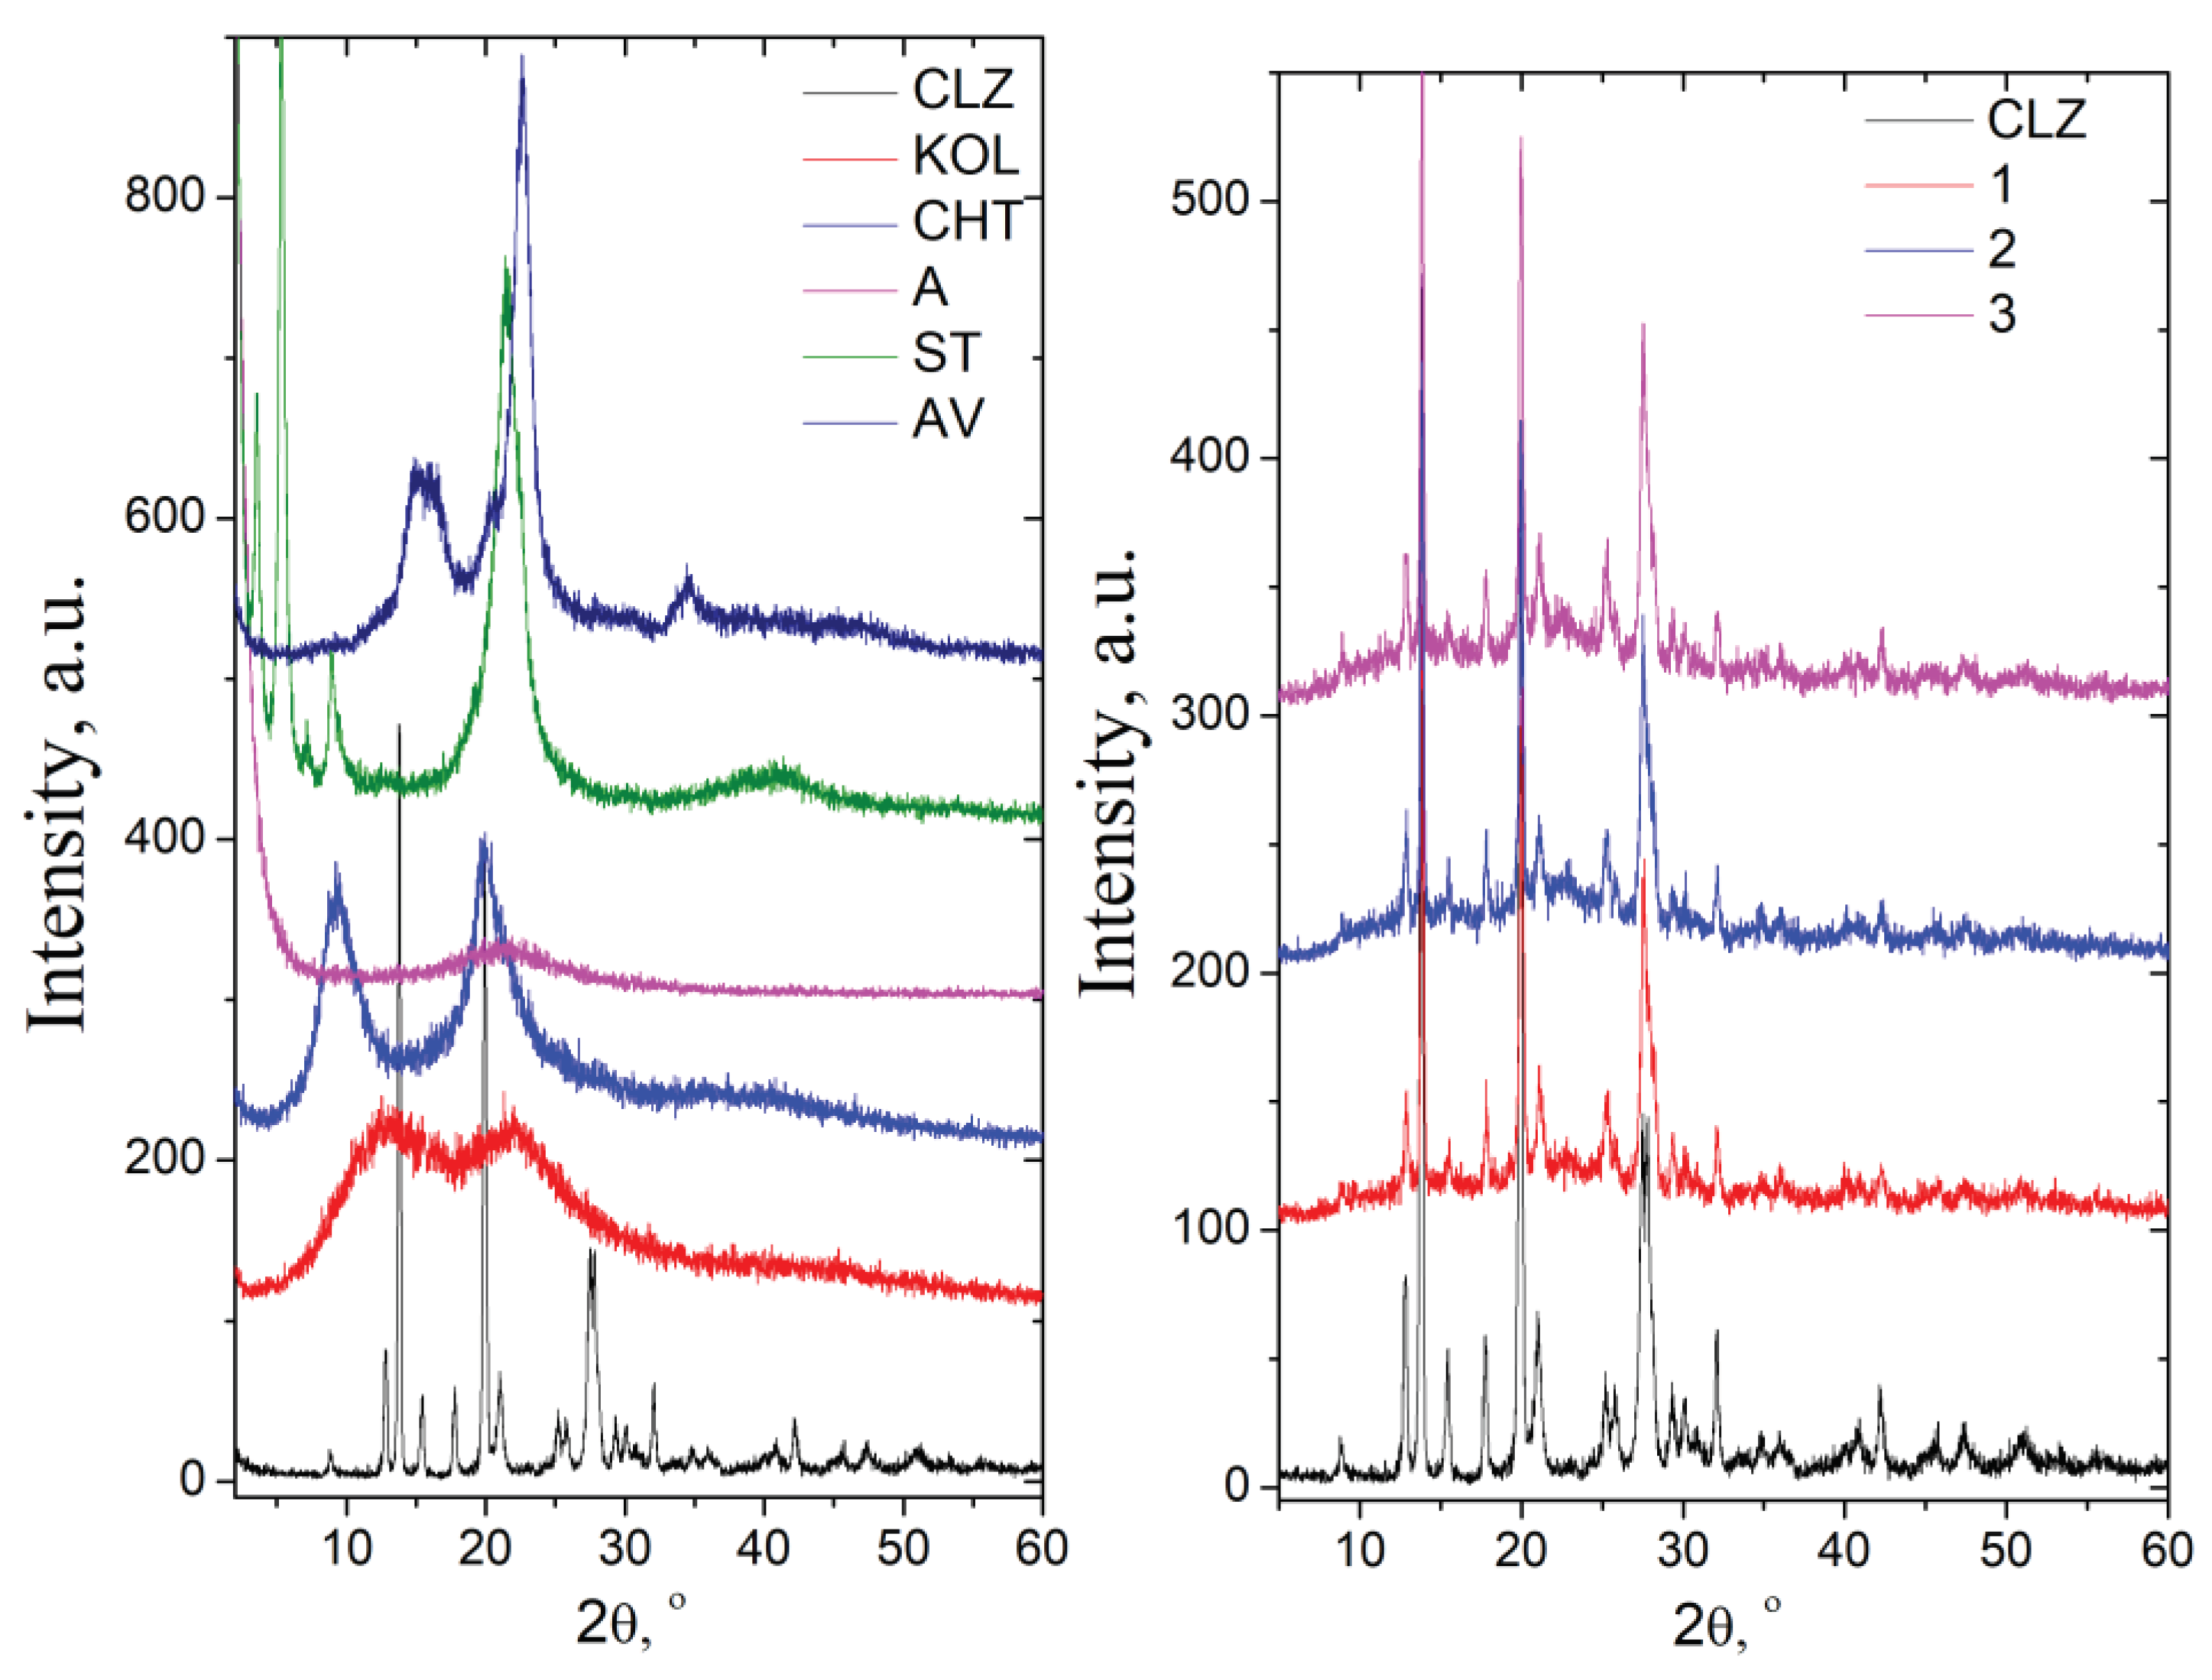
The diffractogram of chlorzoxazone displayed intense signals at 12.98
o, 13.86
o, 15.57
o, 17.83
o, 19.93
o, 21.05
o, 25.22
o, 25.79
o, 27.51
o and 32.07
o (2θ) and a degree of crystallinity of about 80%. KOL and CHT have a background pattern with two extensive signals at 13.04 and 21.95 (2θ) and 9.32 and 20.01 (2θ), respectively. The degree of crycrystallinity is.3 for KOL and about 37.2 % for CHT. In the case of ST ve, very intense signals appear at 1.79, 3.58, 5.36, and 21.46 o, and the degree of crystallinity abois ut 49.5%. The AV diffractogram prepresents the specific signals assigned to cellulose, namely: 15.1° assigned to the (101) plane, 16.4° assigned to the (101) plane,d the 22.7° assigned to the (200) plane of cellulose I [
30,
31].
The physical mixtures showed characteristic signals of pure components at identical angles, proving that no interactions occurred during mixing (
Figure 8). The signals of CLZ are slightly low in intensity in the physical mixture due to a lower drug concentration. This observation supported the absence of any chemical interaction between the drug and the other components of the mix.
Conclusions
FT-IR spectroscopy and XRD analysis revealed no interactions between active principle and excipients. KOL, CHT, A, ST, and AV used in this study do not interact with the CLZ and may be valuable excipients in pharmaceutical formulations.
2.1.3. Thermal characterization
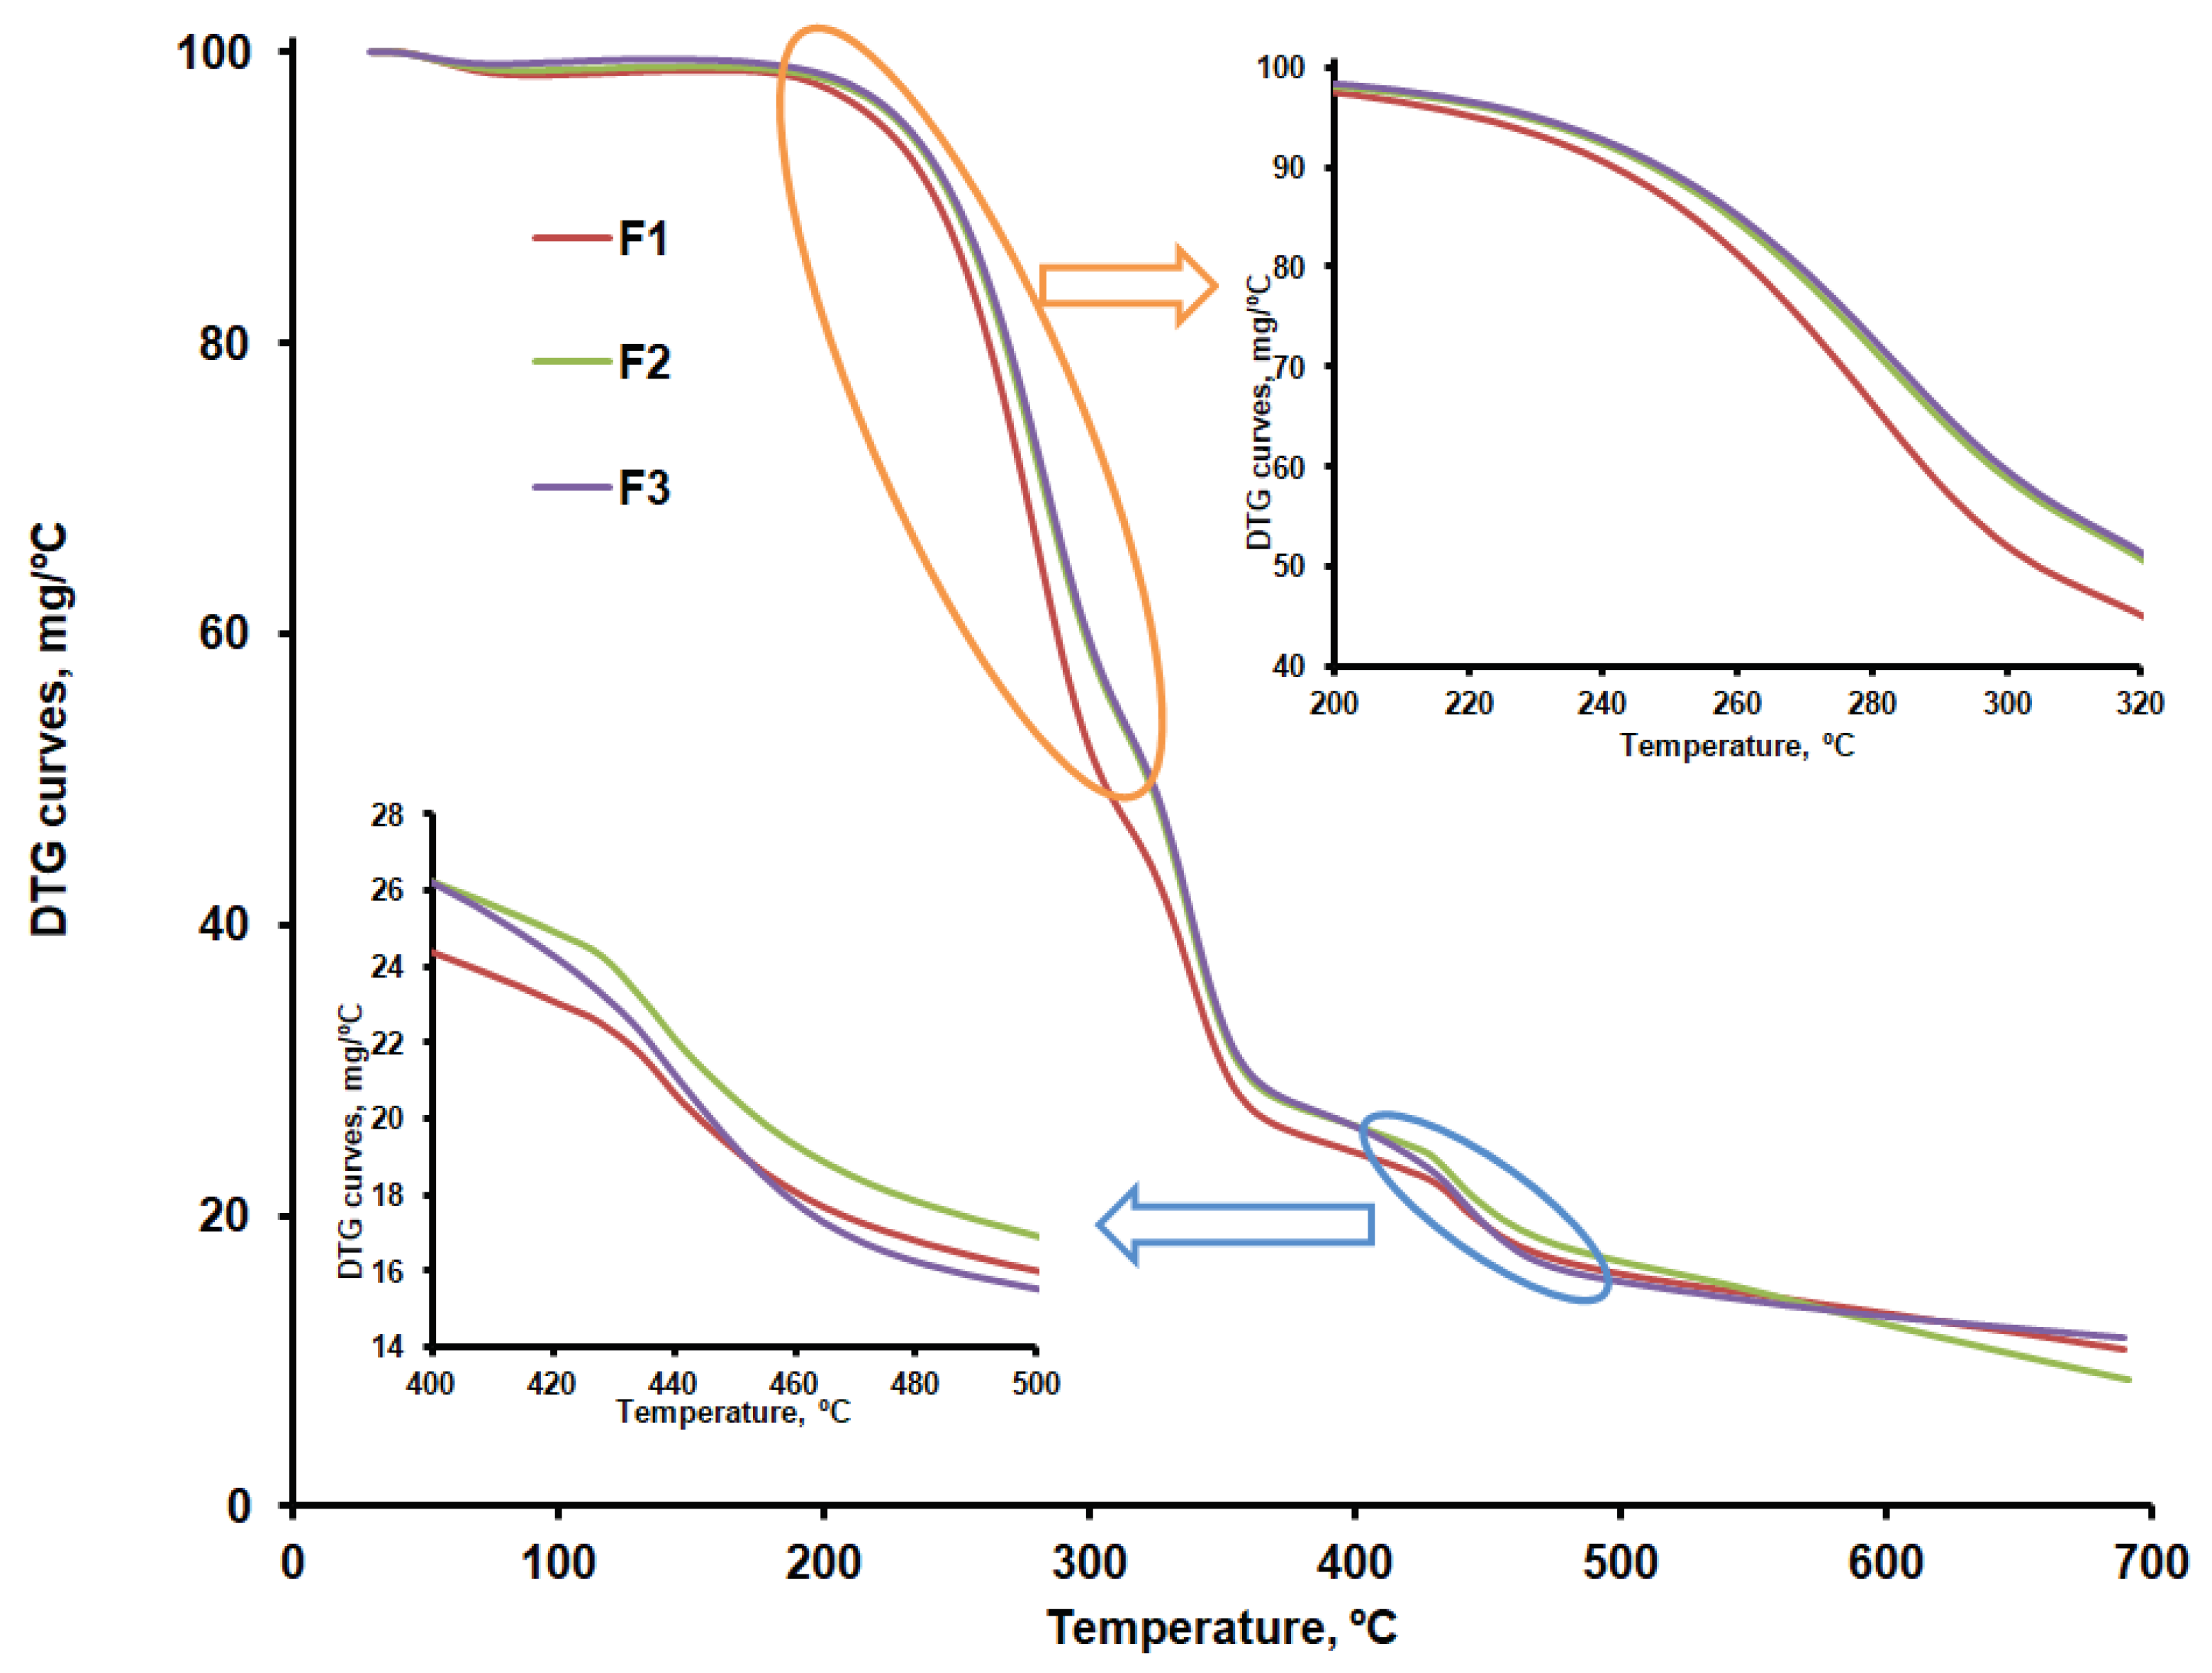
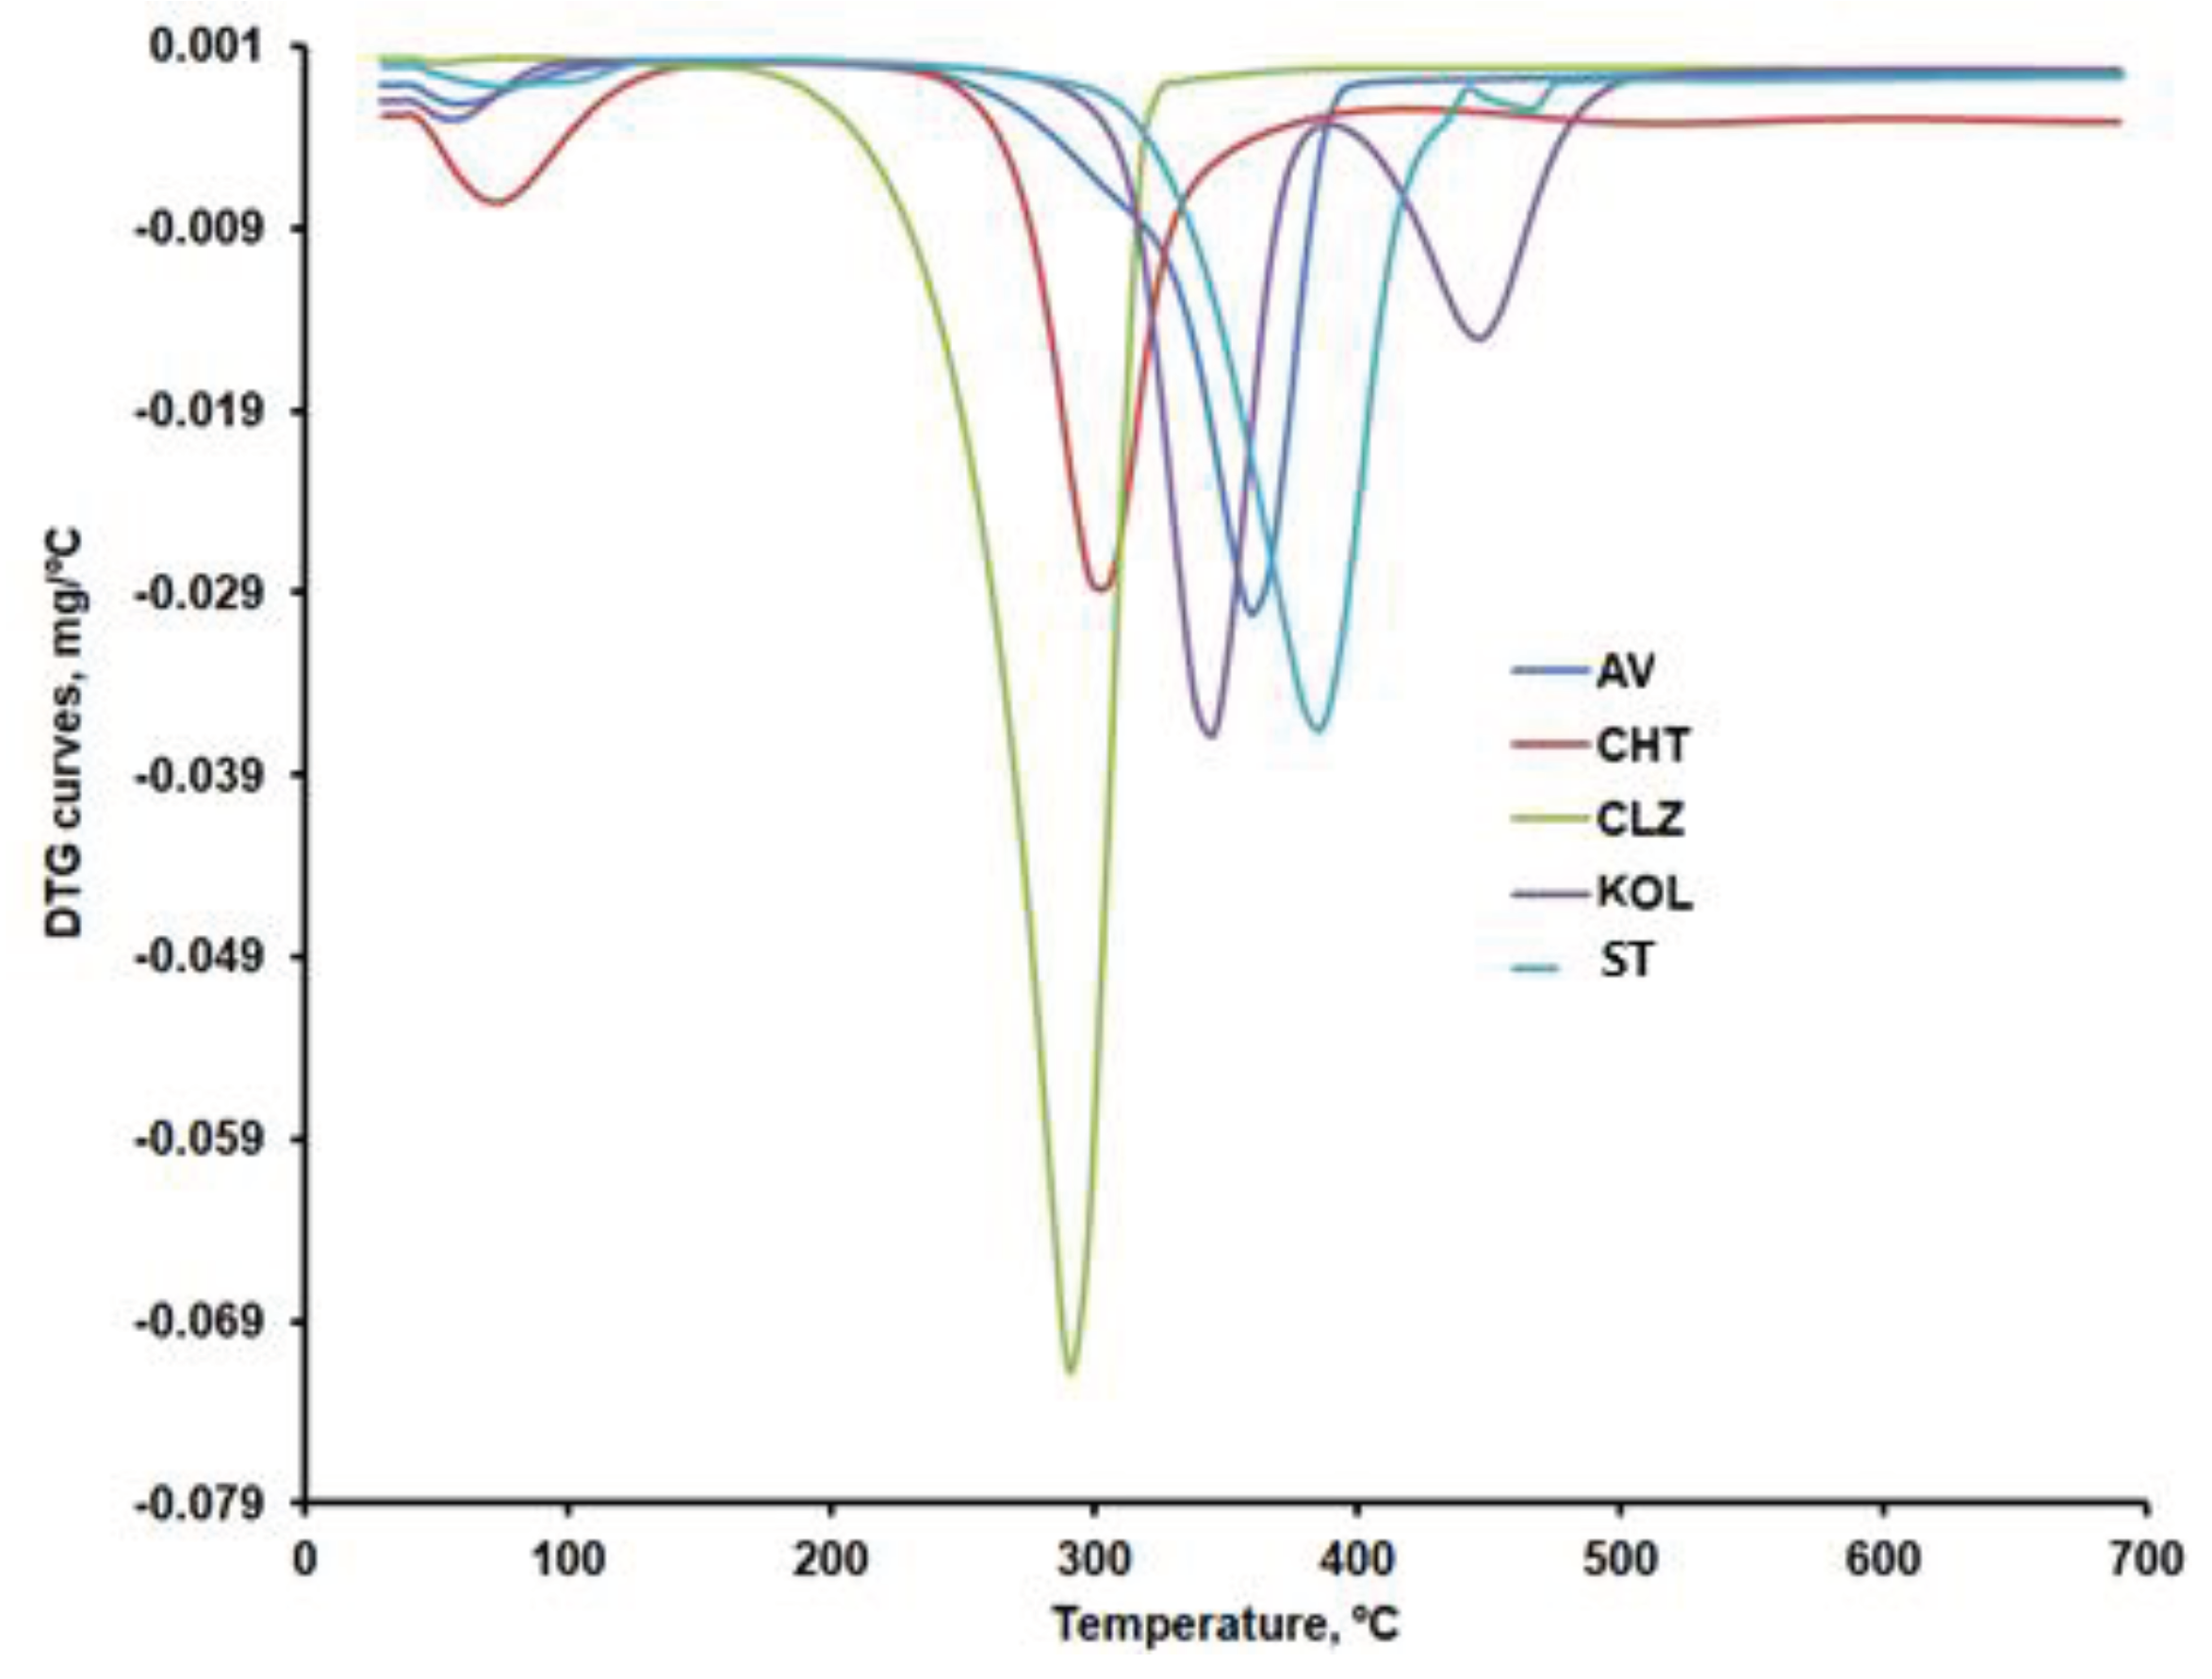
Figure 9a,b compare the DTG curves for CLZ, CHT, AV, KOL, ST, and the formulations (F1b, F2b, and F3b). The recorded TG, DTG, and DTA curves and their interpretation with Mettler Toledo's STAR software revealed the main thermogravimetric characteristics in
Table 3 and
Table 4.
According to the data in
Table 4, except CLZ, all samples went through a first stage of moisture removal ranging from 2.5 to 12.3%.
The AV sample shows a mass loss of approximately 80% within the 292 – 378 ºC temperature range, specific to cellulose decomposition in an inert atmosphere. The thermogravimetric curves recorded in our research are similar to those reported by other researchers for AV samples recorded under the same conditions [
32,
33].
Once the 12.21% moisture content was removed, the thermal decomposition of CHT occurred in two stages, with the most significant mass percentage loss occurring within the 277 - 302ºC temperature range. A mass loss of about 43% in the second stage of decomposition, due to the decomposition of chitosan polymer chains by deacetylation and cleavage of glycosidic bonds, was also reported by Rahman et al. for chitosan samples that were analyzed under similar conditions [
34]. The last-stage mass loss for CHT may be linked to the thermal destruction of the pyranose ring and the decomposition of residual carbon [
35].
CLZ decomposes in a nitrogen atmosphere in a single stage, resulting in a residue amount of 4.40%. Roy and Ghosh [
50] also analyzed the decomposition of CLZ in a nitrogen atmosphere at the rate of 10°C/min within the 30-700ºC temperature range. They identified a single degradation stage occurring within the 210-290ºC range.
The KOL sample contains 3.75% moisture, which is removed up to 80ºC. This sample's most significant mass loss occurs within the 320 - 361°C temperature range and is due to the deacetylation of polyvinyl acetate present in KOL [
36]. The mass loss recorded within the 416 - 473°C temperature range amounts to 32.49%, which may be linked to the production of aromatic hydrocarbons [
37], but also to the depolymerization of polyvinylpyrrolidone present in a smaller amount in KOL [
38].
The thermal decomposition of ST occurs within the 330-410ºC temperature range, also identified by other researchers by thermogravimetric analysis under similar conditions [
39]. This stage may be linked to the denitrification process, which consists of removing NO2 and O2 and forming MgO [
40].
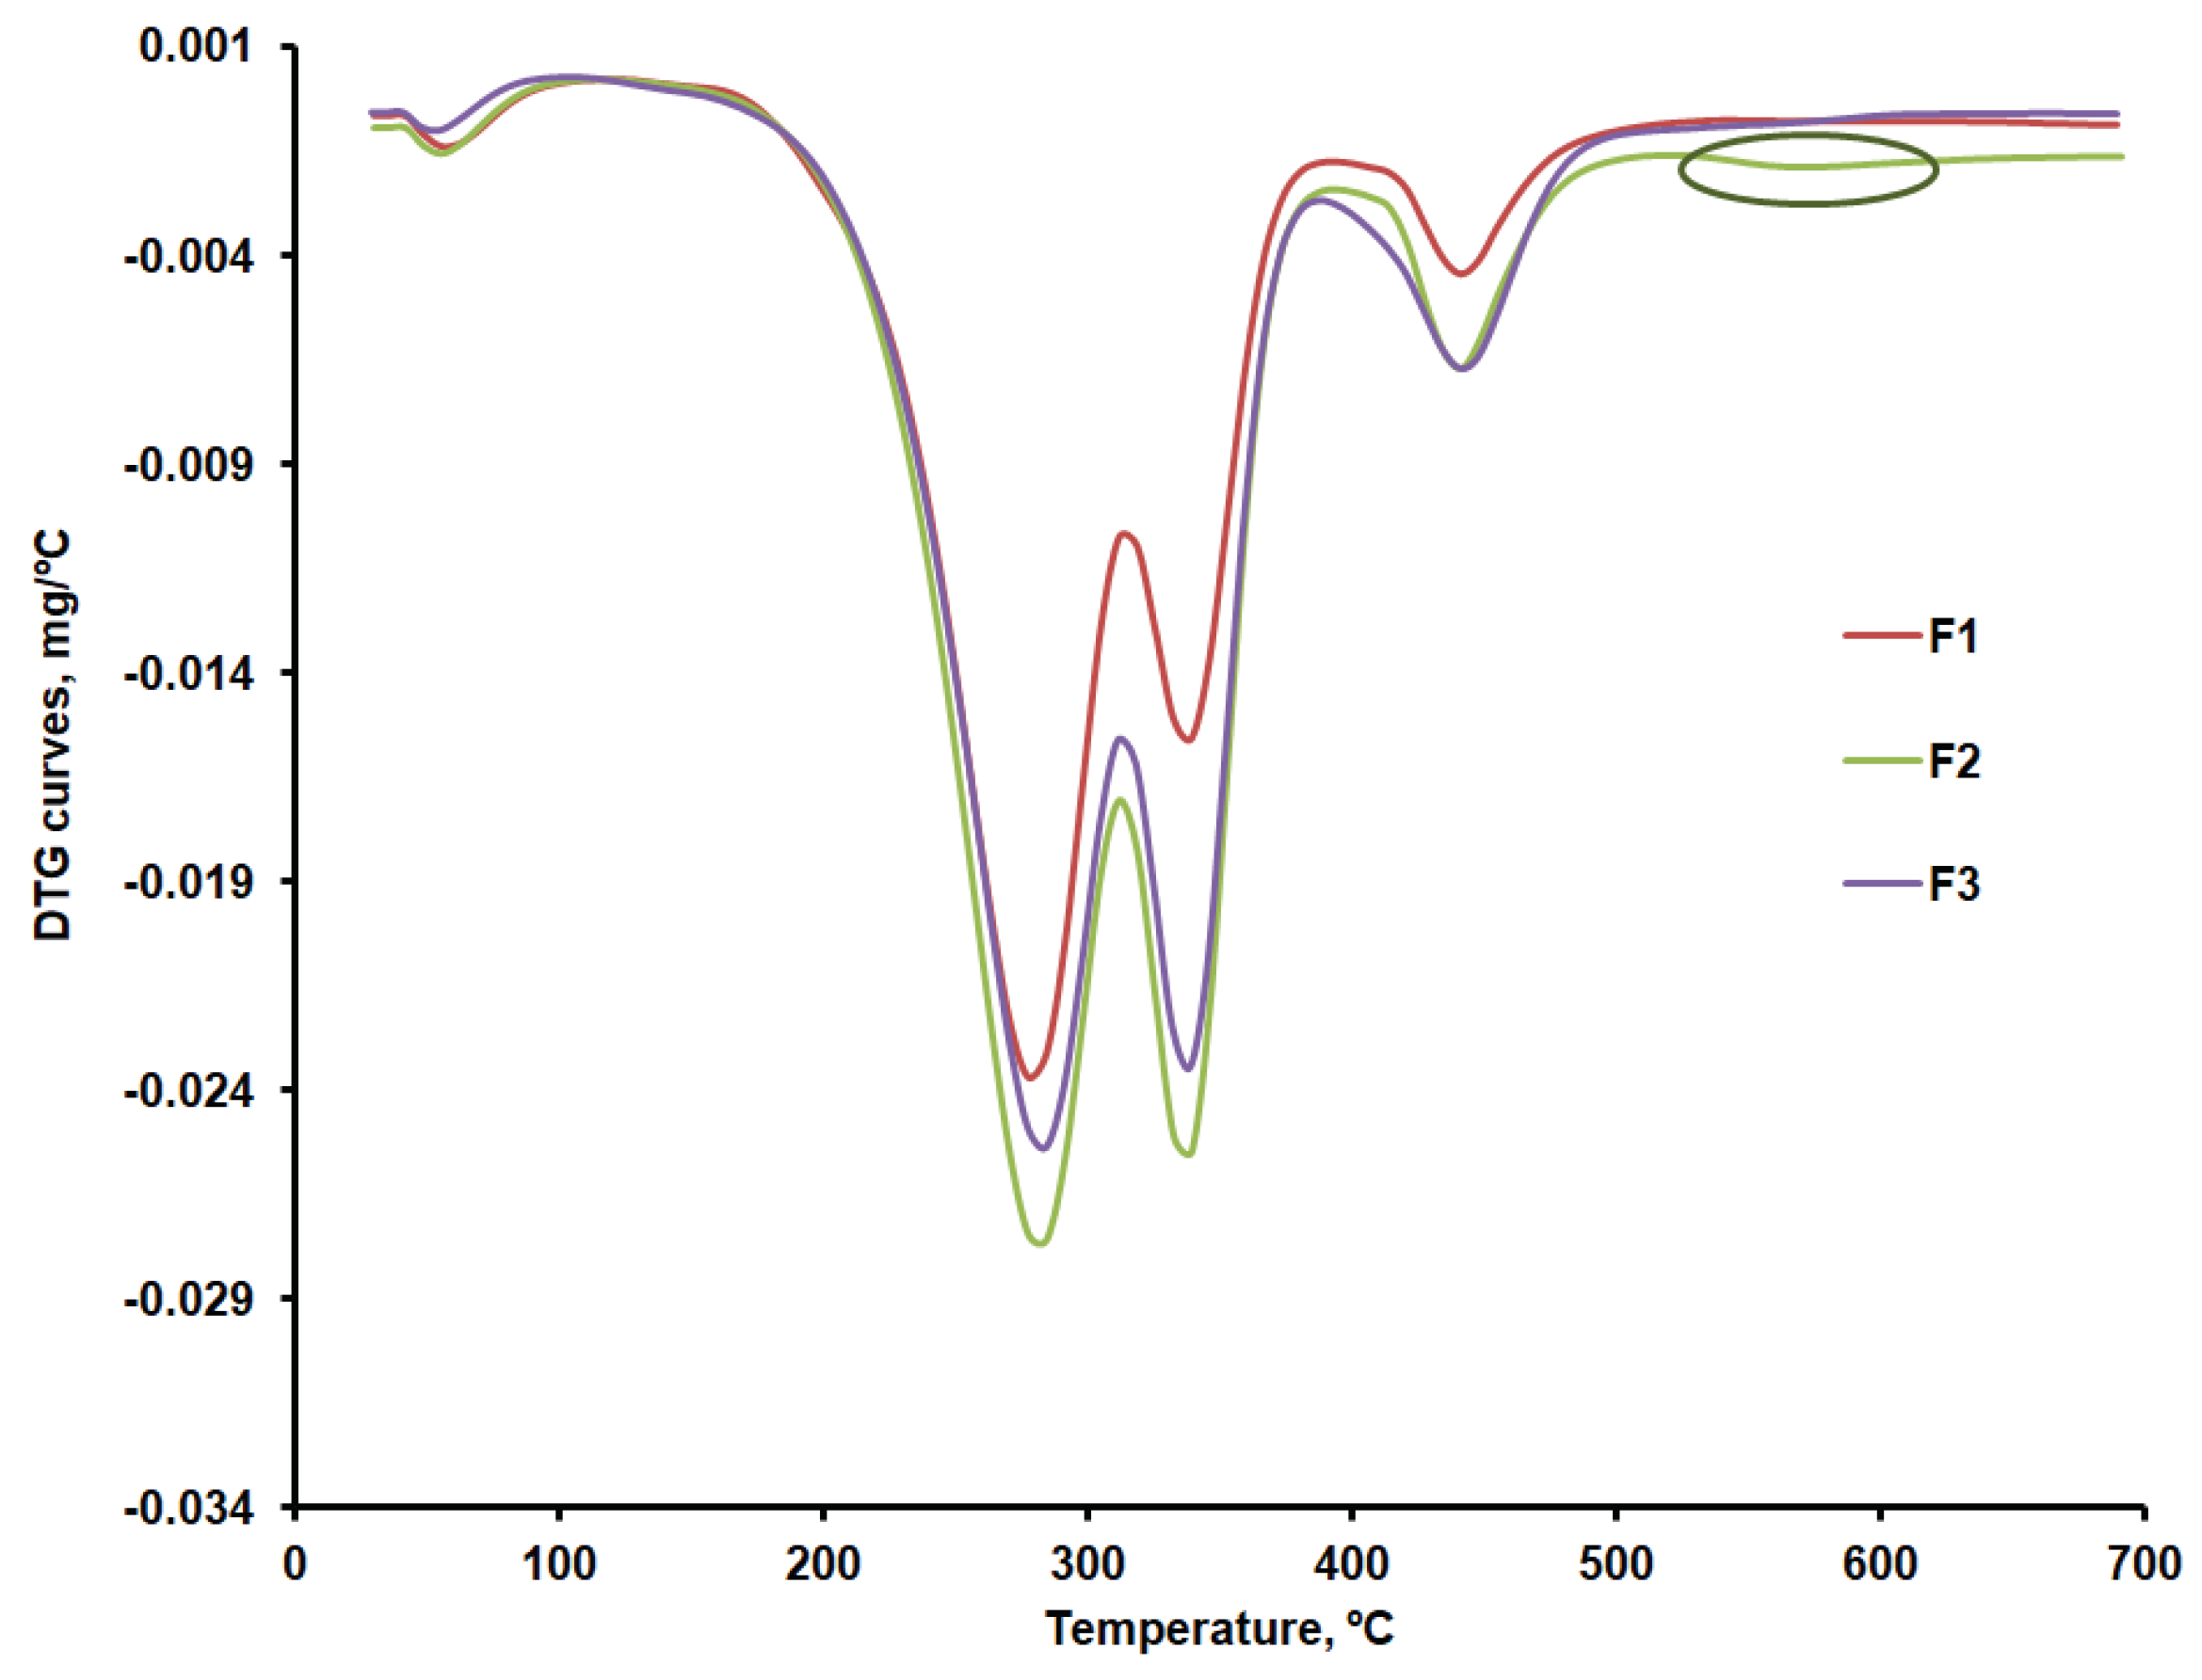
Thermal decomposition occurs in four stages in the case of the F1, F2 and F3 formulations. The first stage consists of removing moisture, which ranges between 0.8 and 1.5 %. The second stage may be linked to the decomposition of CLZ within the 232 - 303ºC temperature range and with the temperature at which the decomposition rate reached its peak (T
peak) of about 281ºC. According to the results obtained, the most significant amount of active substance CLZ is found in the F1 formulation (
Figure 6b and
Table 5). A slight difference regarding the amount of CLZ is found in the F2 and F3 formulations, and the TG curves are slightly different within the 232 - 303ºC temperature range, according to their representation in
Figure 7. According to the data referred to above, the thermal decomposition of the excipients present in the formulations occurs in a single stage within the 300 – 400ºC temperature range, with T
peak = 361ºC for AV, 302ºC for CHT, 343ºC for KOL, and 386ºC for ST.
The F1b, F2b, and F3b formulations have a single peak at 338ºC in the third stage, within the 326 – 359ºC temperature range, which proves an excellent compatibility of the excipients used[
41]. According to the TG curves shown comparatively in
Figure 7 and to the main thermogravimetric characteristics shown in
Table 5, the last stage of decomposition sees more significant differences between the three formulations, which may be linked to various amounts of KOL. This is accounted for by the fact that, according to the data in
Table 4, the last stage of thermal decomposition of the KOL excipient occurs within the 416 - 473°C temperature range. According to
Figure 6b, at temperatures above 500ºC, a small peak can be distinguished for the F2b formulation that could be linked to the last stage mass loss in the case of CHT. This would indicate more of this excipient in the F2b formulation.
DSC characterization
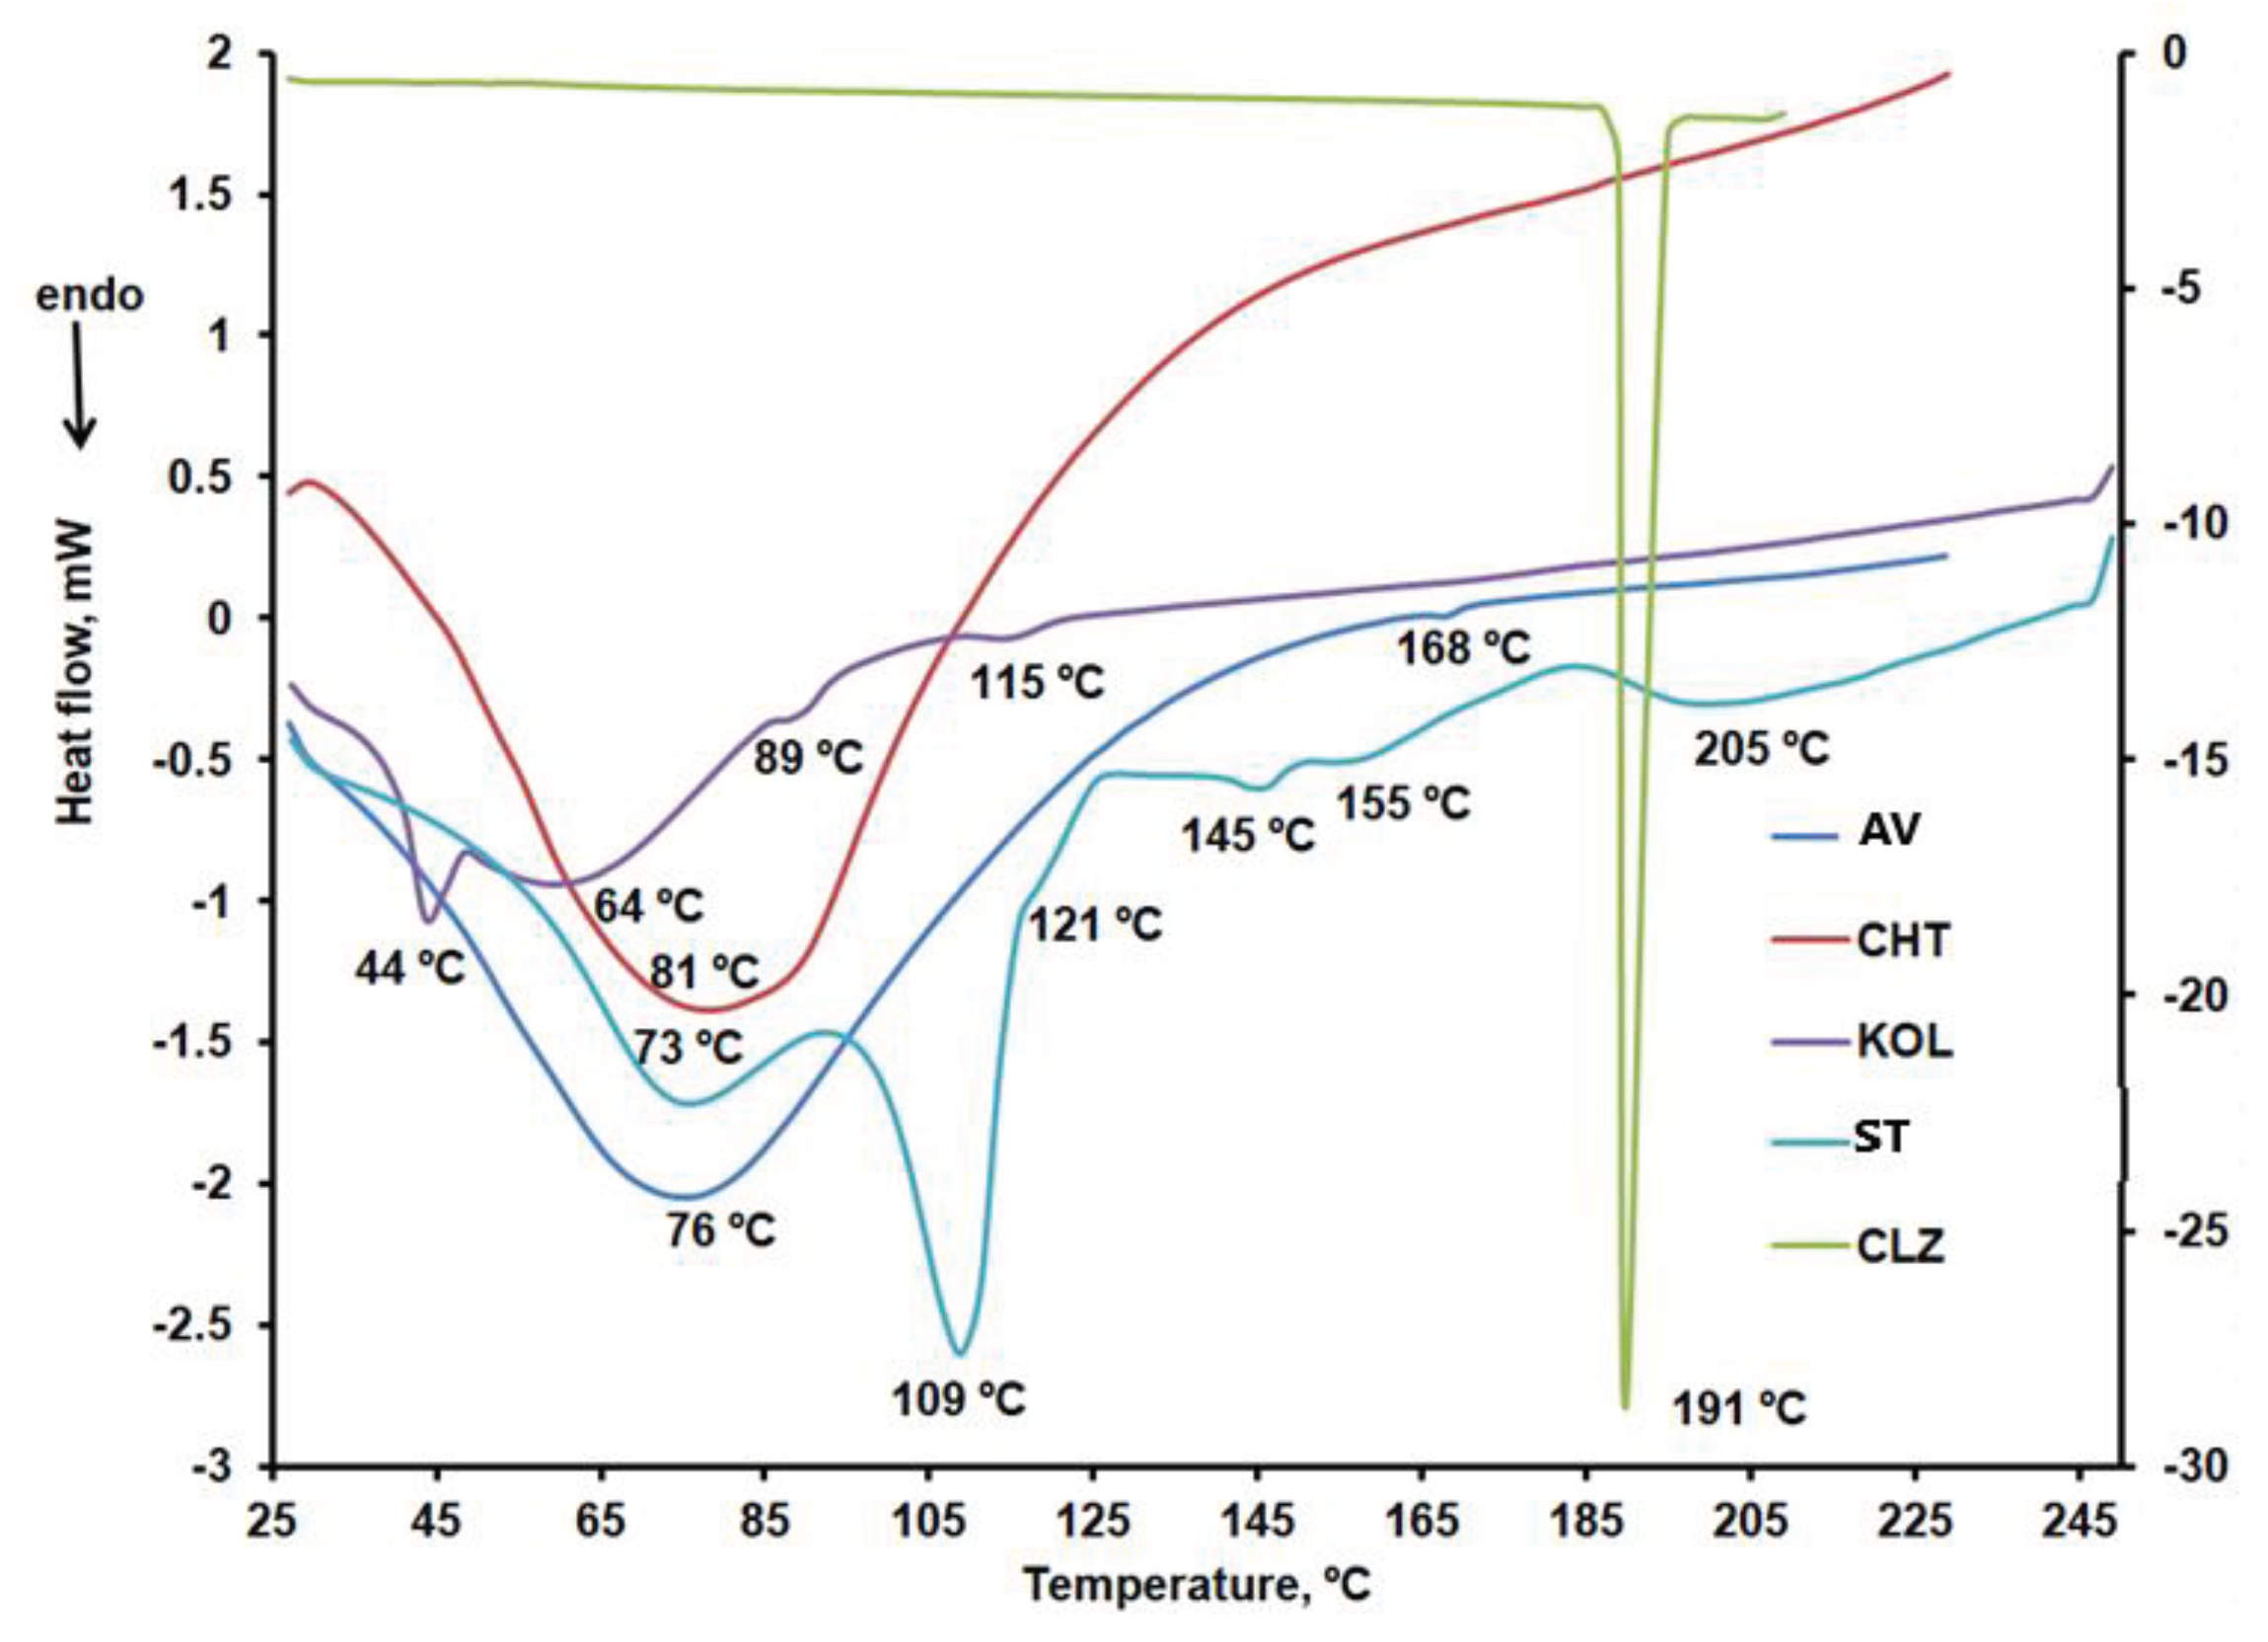
DSC curves were recorded under nitrogen at a 10ºC/min heating rate, two heating stages, and one cooling stage. The results obtained for the excipients are compared in
Figure 11a–c.
Figure 10.
TG curves for the F1b, F2b and F3b formulations.
Figure 10.
TG curves for the F1b, F2b and F3b formulations.
Figure 11.
a. DSC curves: CLZ within the 25 – 210ºC temperature range, AV and CHT within the 25 – 230ºC temperature range, and KOL and ST within the 25 – 250ºC temperature range (first heating stage). b. DSC curves: CLZ within the 25 – 210ºC temperature range, AV and CHT within the 25 – 230ºC temperature range, and KOL and ST within the 25 – 250ºC temperature range (cooling stage). c. DSC curves: CLZ within the 25 – 210ºC temperature range, AV and CHT within the 25 – 230ºC temperature range, and KOL and ST within the 25 – 250ºC temperature range (second heating stage).
According to the DSC curves shown in
Figure 8a for AV, an endothermic peak at 76ºC linked to the desorption of moisture from microcrystalline cellulose and an endothermic mannitol melting peak at 168ºC were noted[
42].
CHT peaks at 81ºC were noted in the DSC curve during the first heating stage (
Figure 8a), which may be linked to the evaporation of residual water involving an enthalpy variation of 275.69 J/g. These findings are close to those reported by other researchers in the literature [
57].
KOL showed three endothermic peaks at 44ºC, 89ºC, and 115ºC, respectively, according to the DSC cube for the first heating stage within the 25 – 250ºC temperature range, as shown in
Figure 3a. According to the DSC curve obtained in the second heating stage (figure 8c), this excipient underwent two glass transition temperatures at 43ºC and 172ºC, as it is a copolymer of polyvinyl acetate (PVA) and polyvinylpyrrolidone [
43,
44].
Similar to other data reported in the literature, CLZ showed a melting peak at 191ºC during the first and second heating stages and a crystallization peak at 181ºC during the cooling stage [
45,
46].
ST, the most widely used excipient in solid oral pharmaceutical formulations, showed six endothermic peaks on the first heating curve [
47]. The first two, at 73ºC and 109ºC, respectively, are specific to dehydration processes [
48]. They no longer occur in the second sample heating stage within the 25-250ºC temperature range. Only one exothermic peak occurred on the cooling curve of ST at 126ºC.
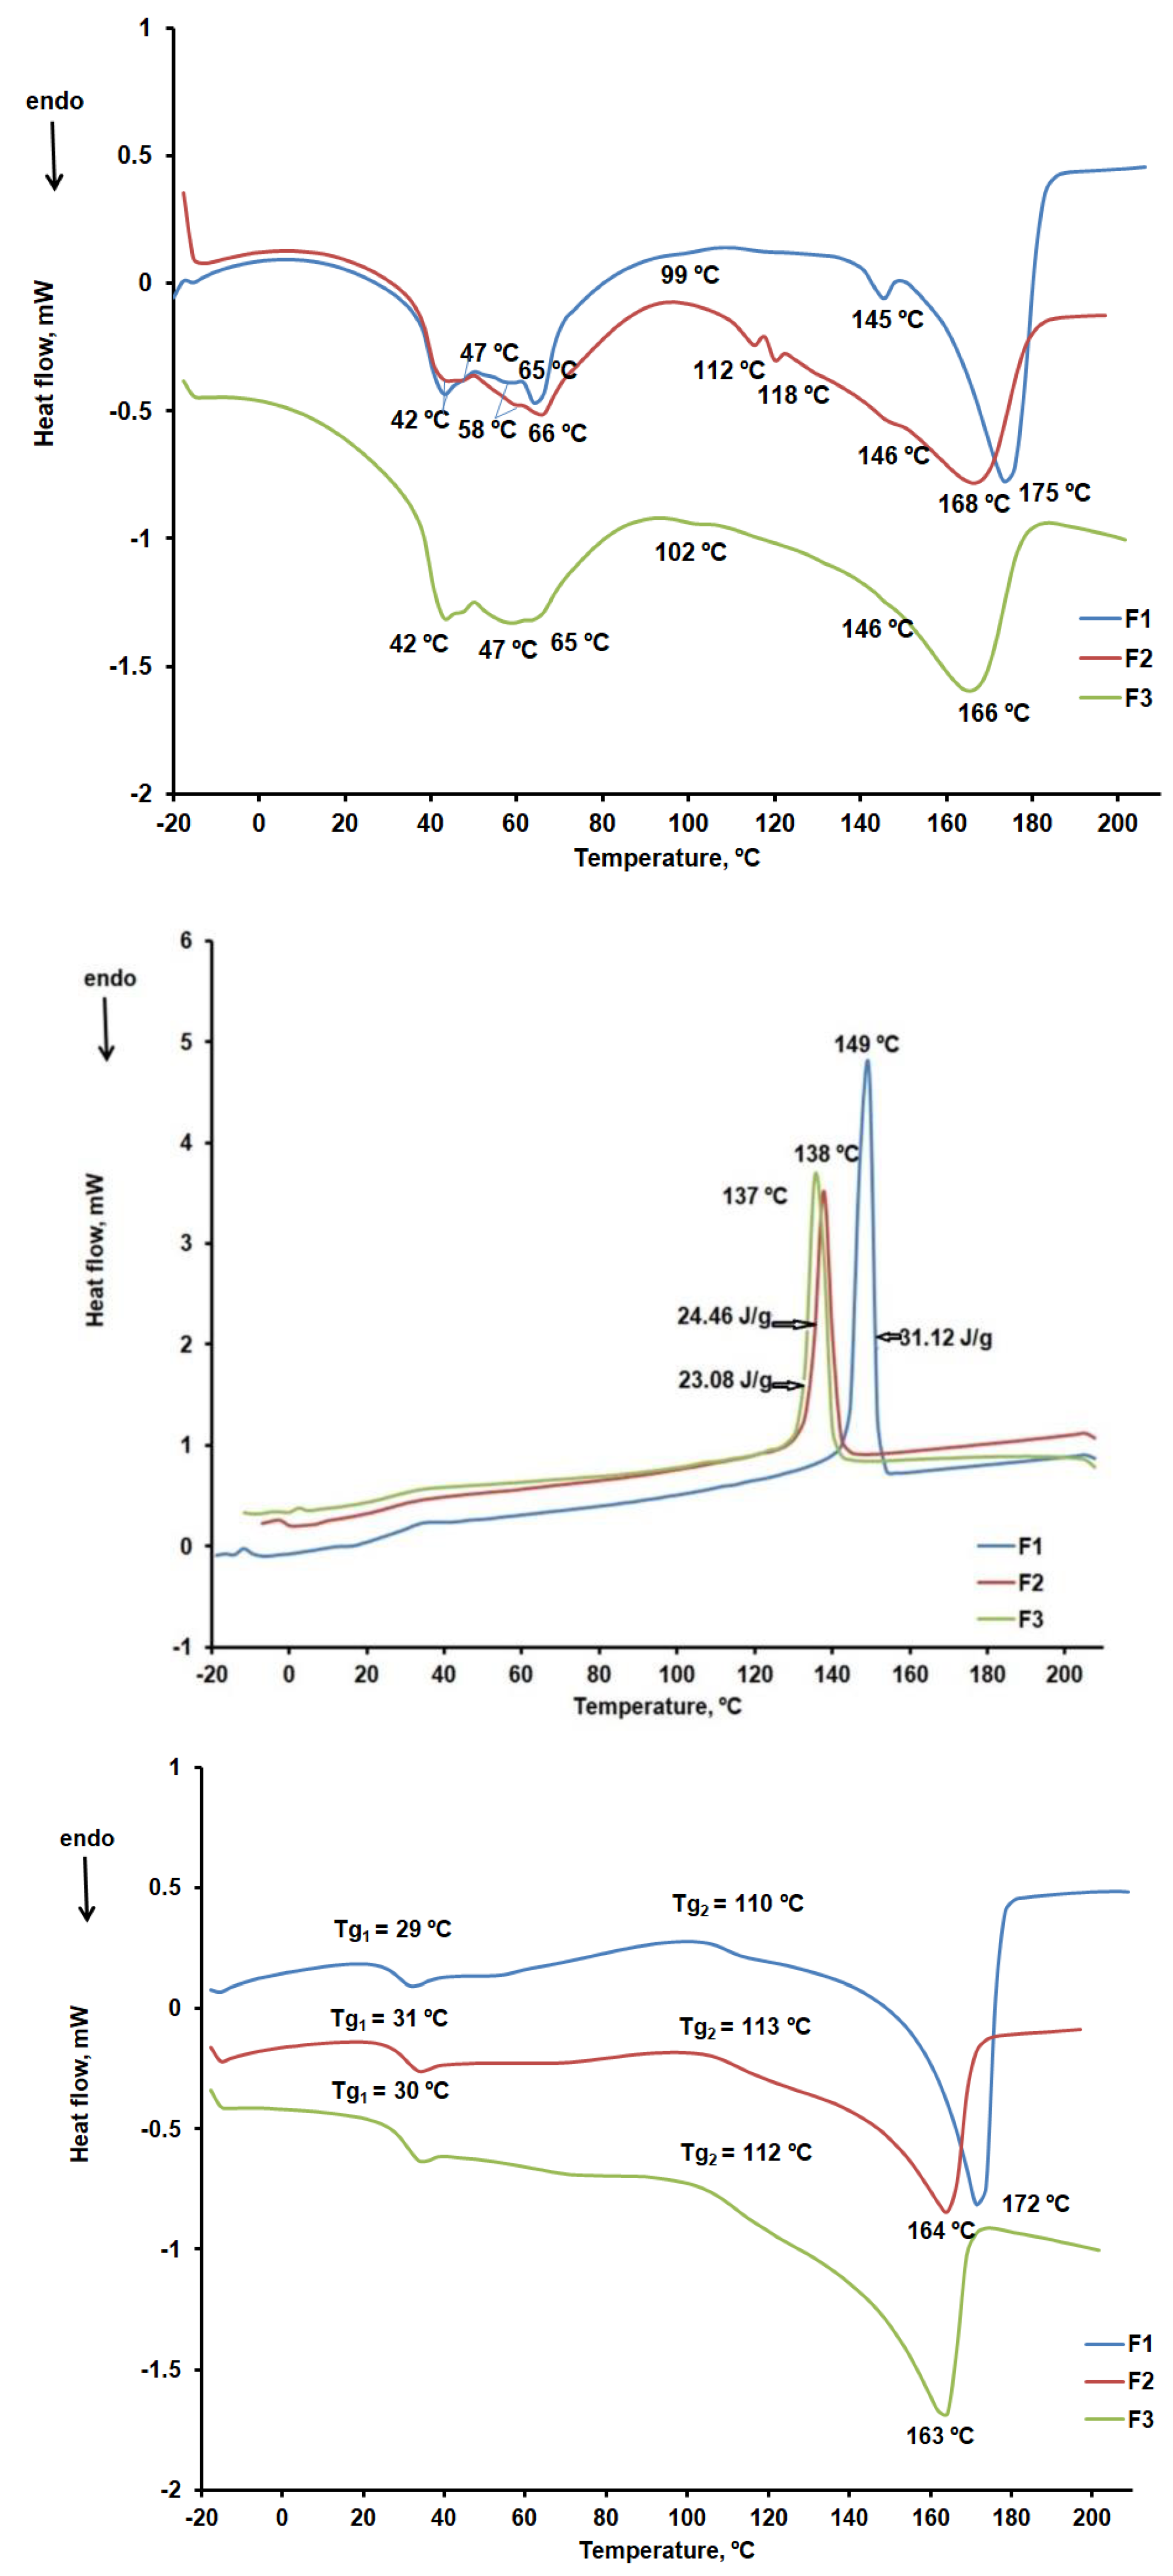
Figure 12a–c compare the DSC curves read for the F1b, F2b, and F3b formulations.
The DSC curves for the first heating stage confirm the presence of the active substance CLZ and its compatibility with the excipients used. Thus, we found that CLZ preserved its crystalline form in the presence of excipients and that the melting peak temperature decreased from 191ºC to 163ºC, 164ºC, and 172ºC, respectively. The DSC curves recorded in the cooling stage and shown in
Figure 9b indicate the presence of CLZ crystallization peaks, but at lower temperatures than in the case of CLZ in the absence of excipients (figure 9b). Enthalpy also varies more in the crystallization process for F1b (31.12 J/g) than for F2b (24.46 J/g) and F3b (23.08 J/g). These readings confirm prior data from thermogravimetric curve analysis, according to which the F1b formulation has the highest amount of active substance CLZ. In contrast, the F2b and F3b formulations have little difference in the same amount of CLZ. The characteristic curves of the second heating stage (figure 9c) have melting peaks and glass transition temperatures of approximately 30ºC and 112ºC that may be linked to the presence of KOL [
49].
2.2. In Vitro Dissolution Studies
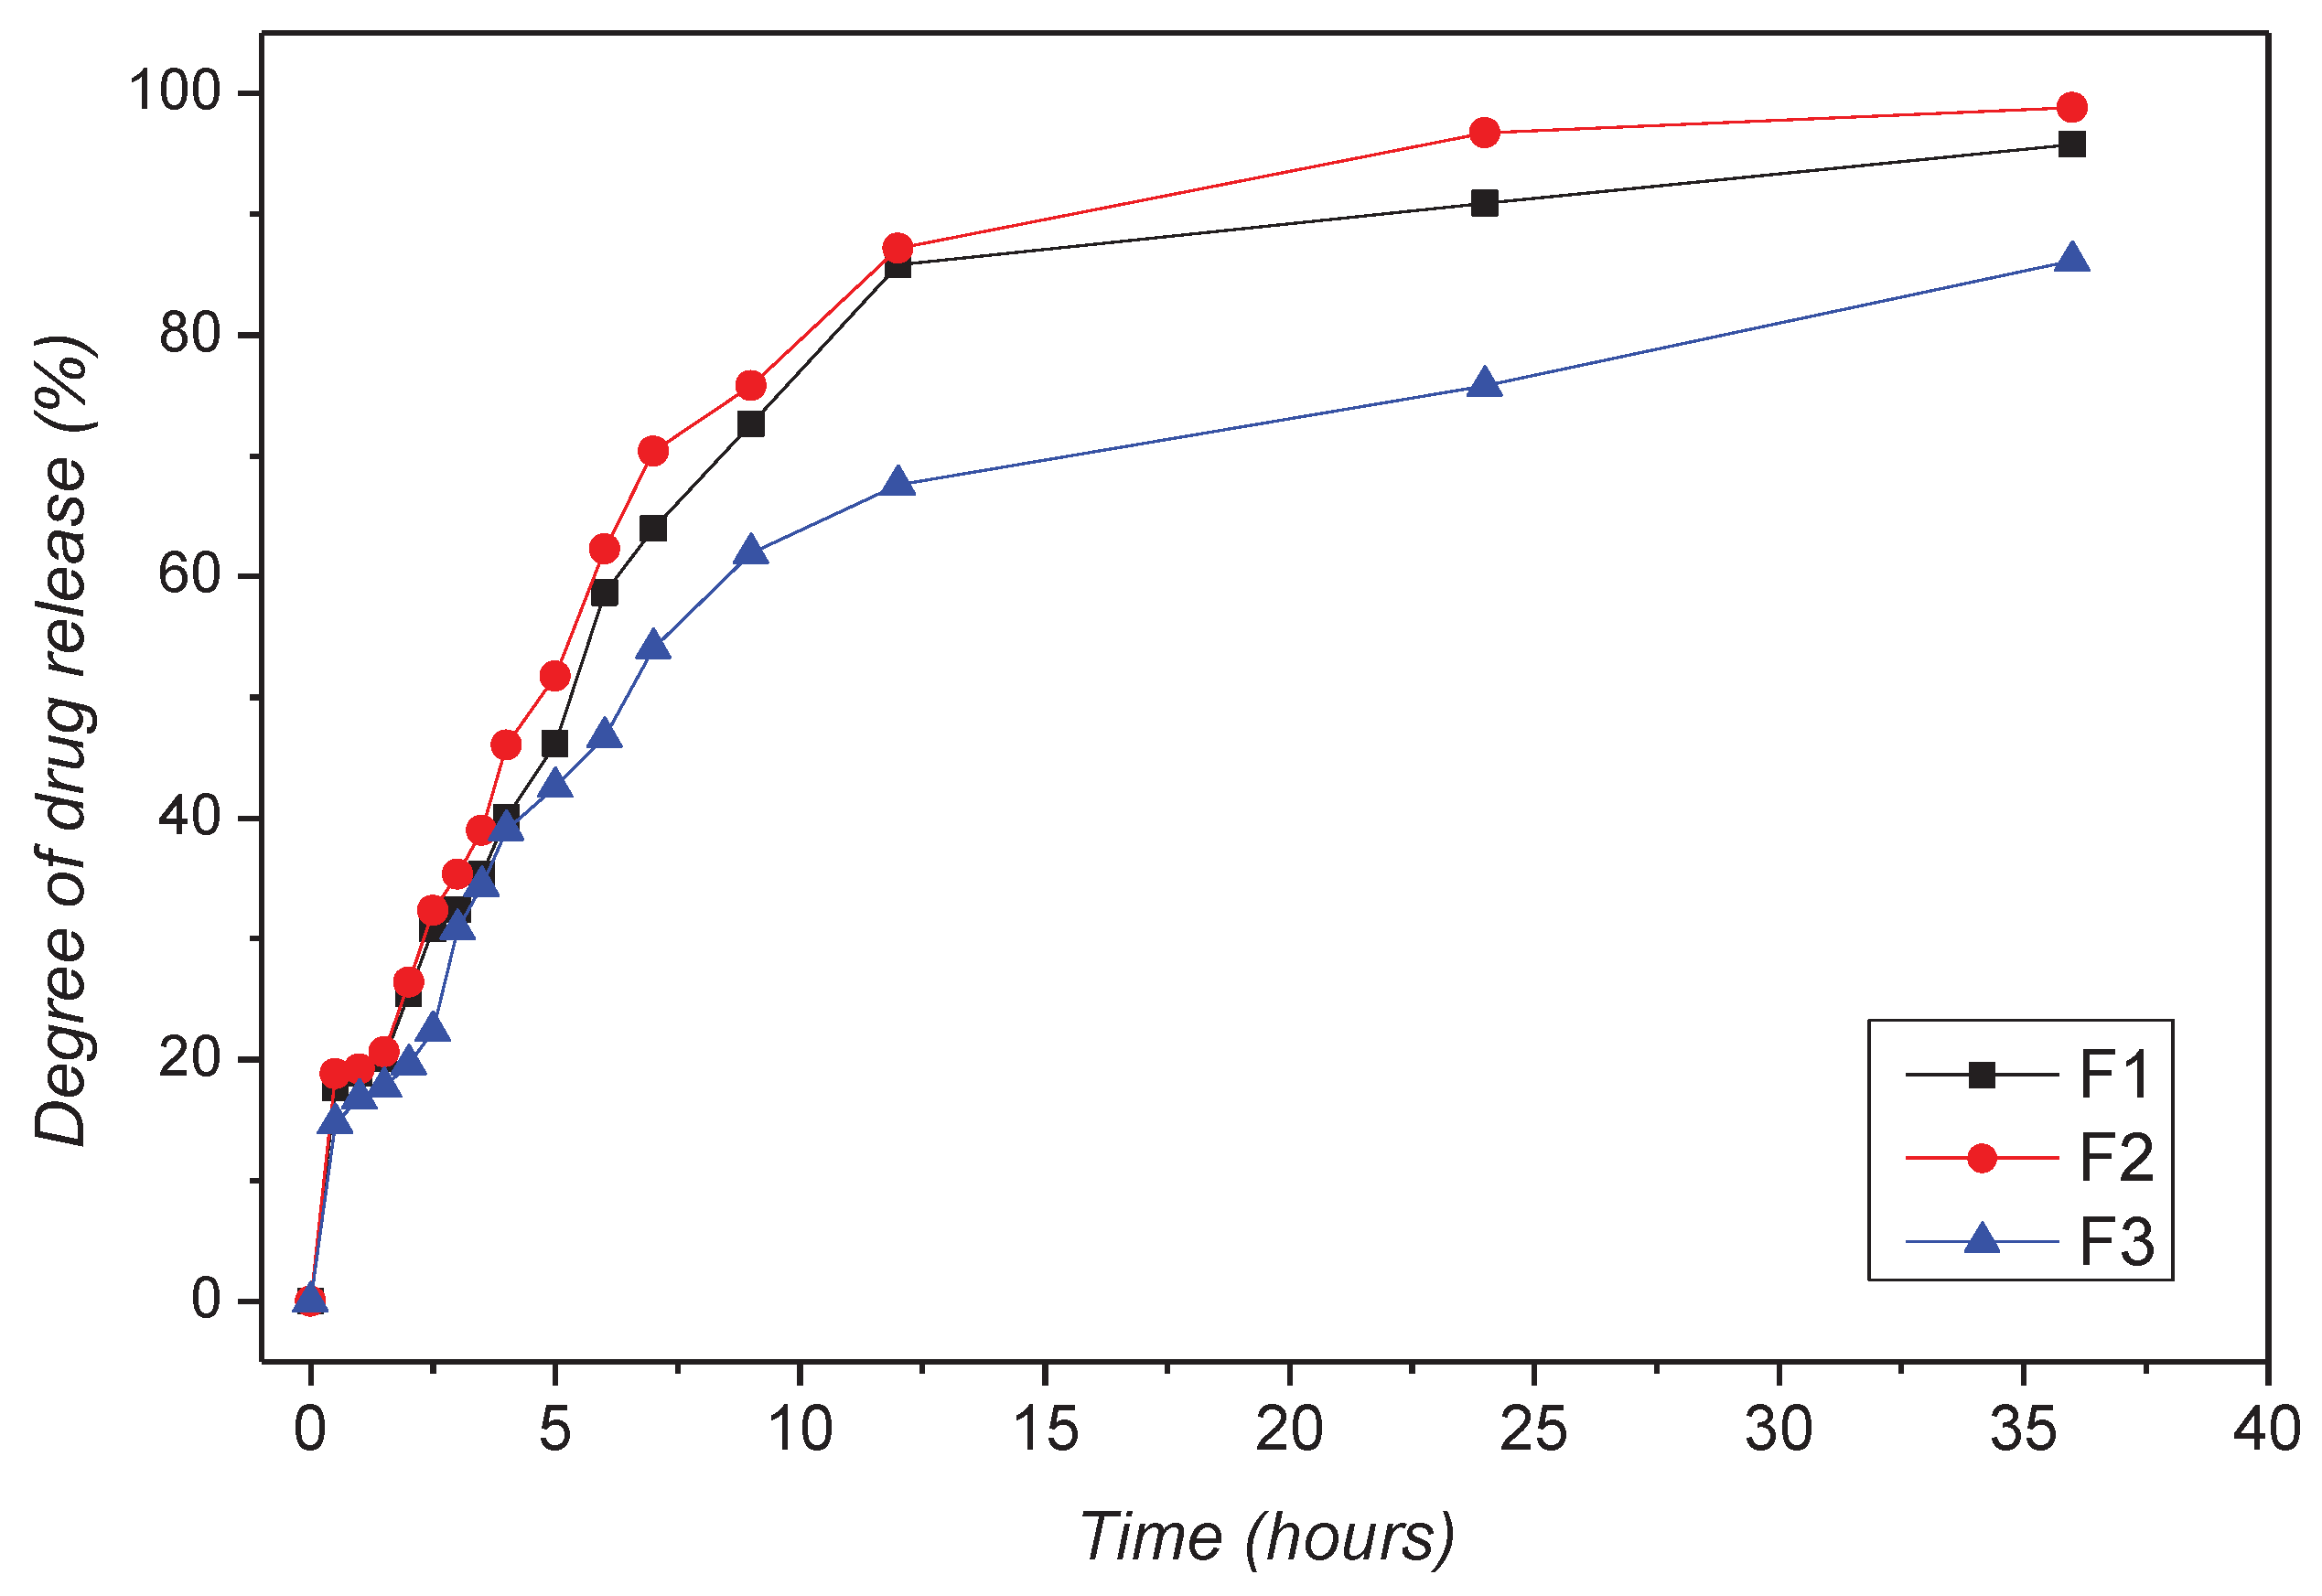
The results obtained during the in vitro dissolution test reveal the prolonged release of CLZ from the formulations. On the other hand, the central role KOL exerted on matrix tablet release characteristics was also highlighted by those results. The released amount of CLZ varied to the percentage of KOL in the formulation for all formulations studied (fig. 10). A particular behavior was observed for F2b containing 30% (w/w) KOL, released 26.39 % (w/w) of CLZ during the first two h of the dissolution test in simulated gastric fluid. Moreover, that formulation released CLZ 87.05% (w/w) of the 12 hours and 98.55% (w/w) at the end of the 36 hours of testing. We also found that increasing the CHT concentration in the formulation decreased the CLZ release rate from the matrix tablets. Thus, in the F1c, F2c, and F3c formulations containing 40% (w/w) KOL and 7% (w/w) CHT, at the end of the dissolution test, the amount of CLZ is the smallest. F1b containing 5% CHT released 95.76% of CLZ, F2b with 5% CHT released 98.55% CLZ, and F3b with 5% CHT generated only 85.15% CLZ.
Based on that observation, we compared the dissolution profile of CLZ from the formulations studied by calculating the similarity factor f2 and the difference factor f1, considering formulations F1a, F1b, and F1c as reference formulations, and formulation F2b-F3b as test formulations. The results obtained (
Table 5) confirmed that both CHT and KOL influenced the release characteristics of the matrix tablets, and virtually each studied formulation had its release kinetics.
Although the similarities between the three release profiles of CLZ were confirmed by the value of the similarity factor (f2 = 57.9562, f2 = 51.5645), the difference factor had a value greater than 15 (f1 = 33.7543, f1 = 35.8516), which corresponded to a difference of more than 10% between the F1a, F1b, F1c analyzed profiles.
2.3. Drug Release Kinetics
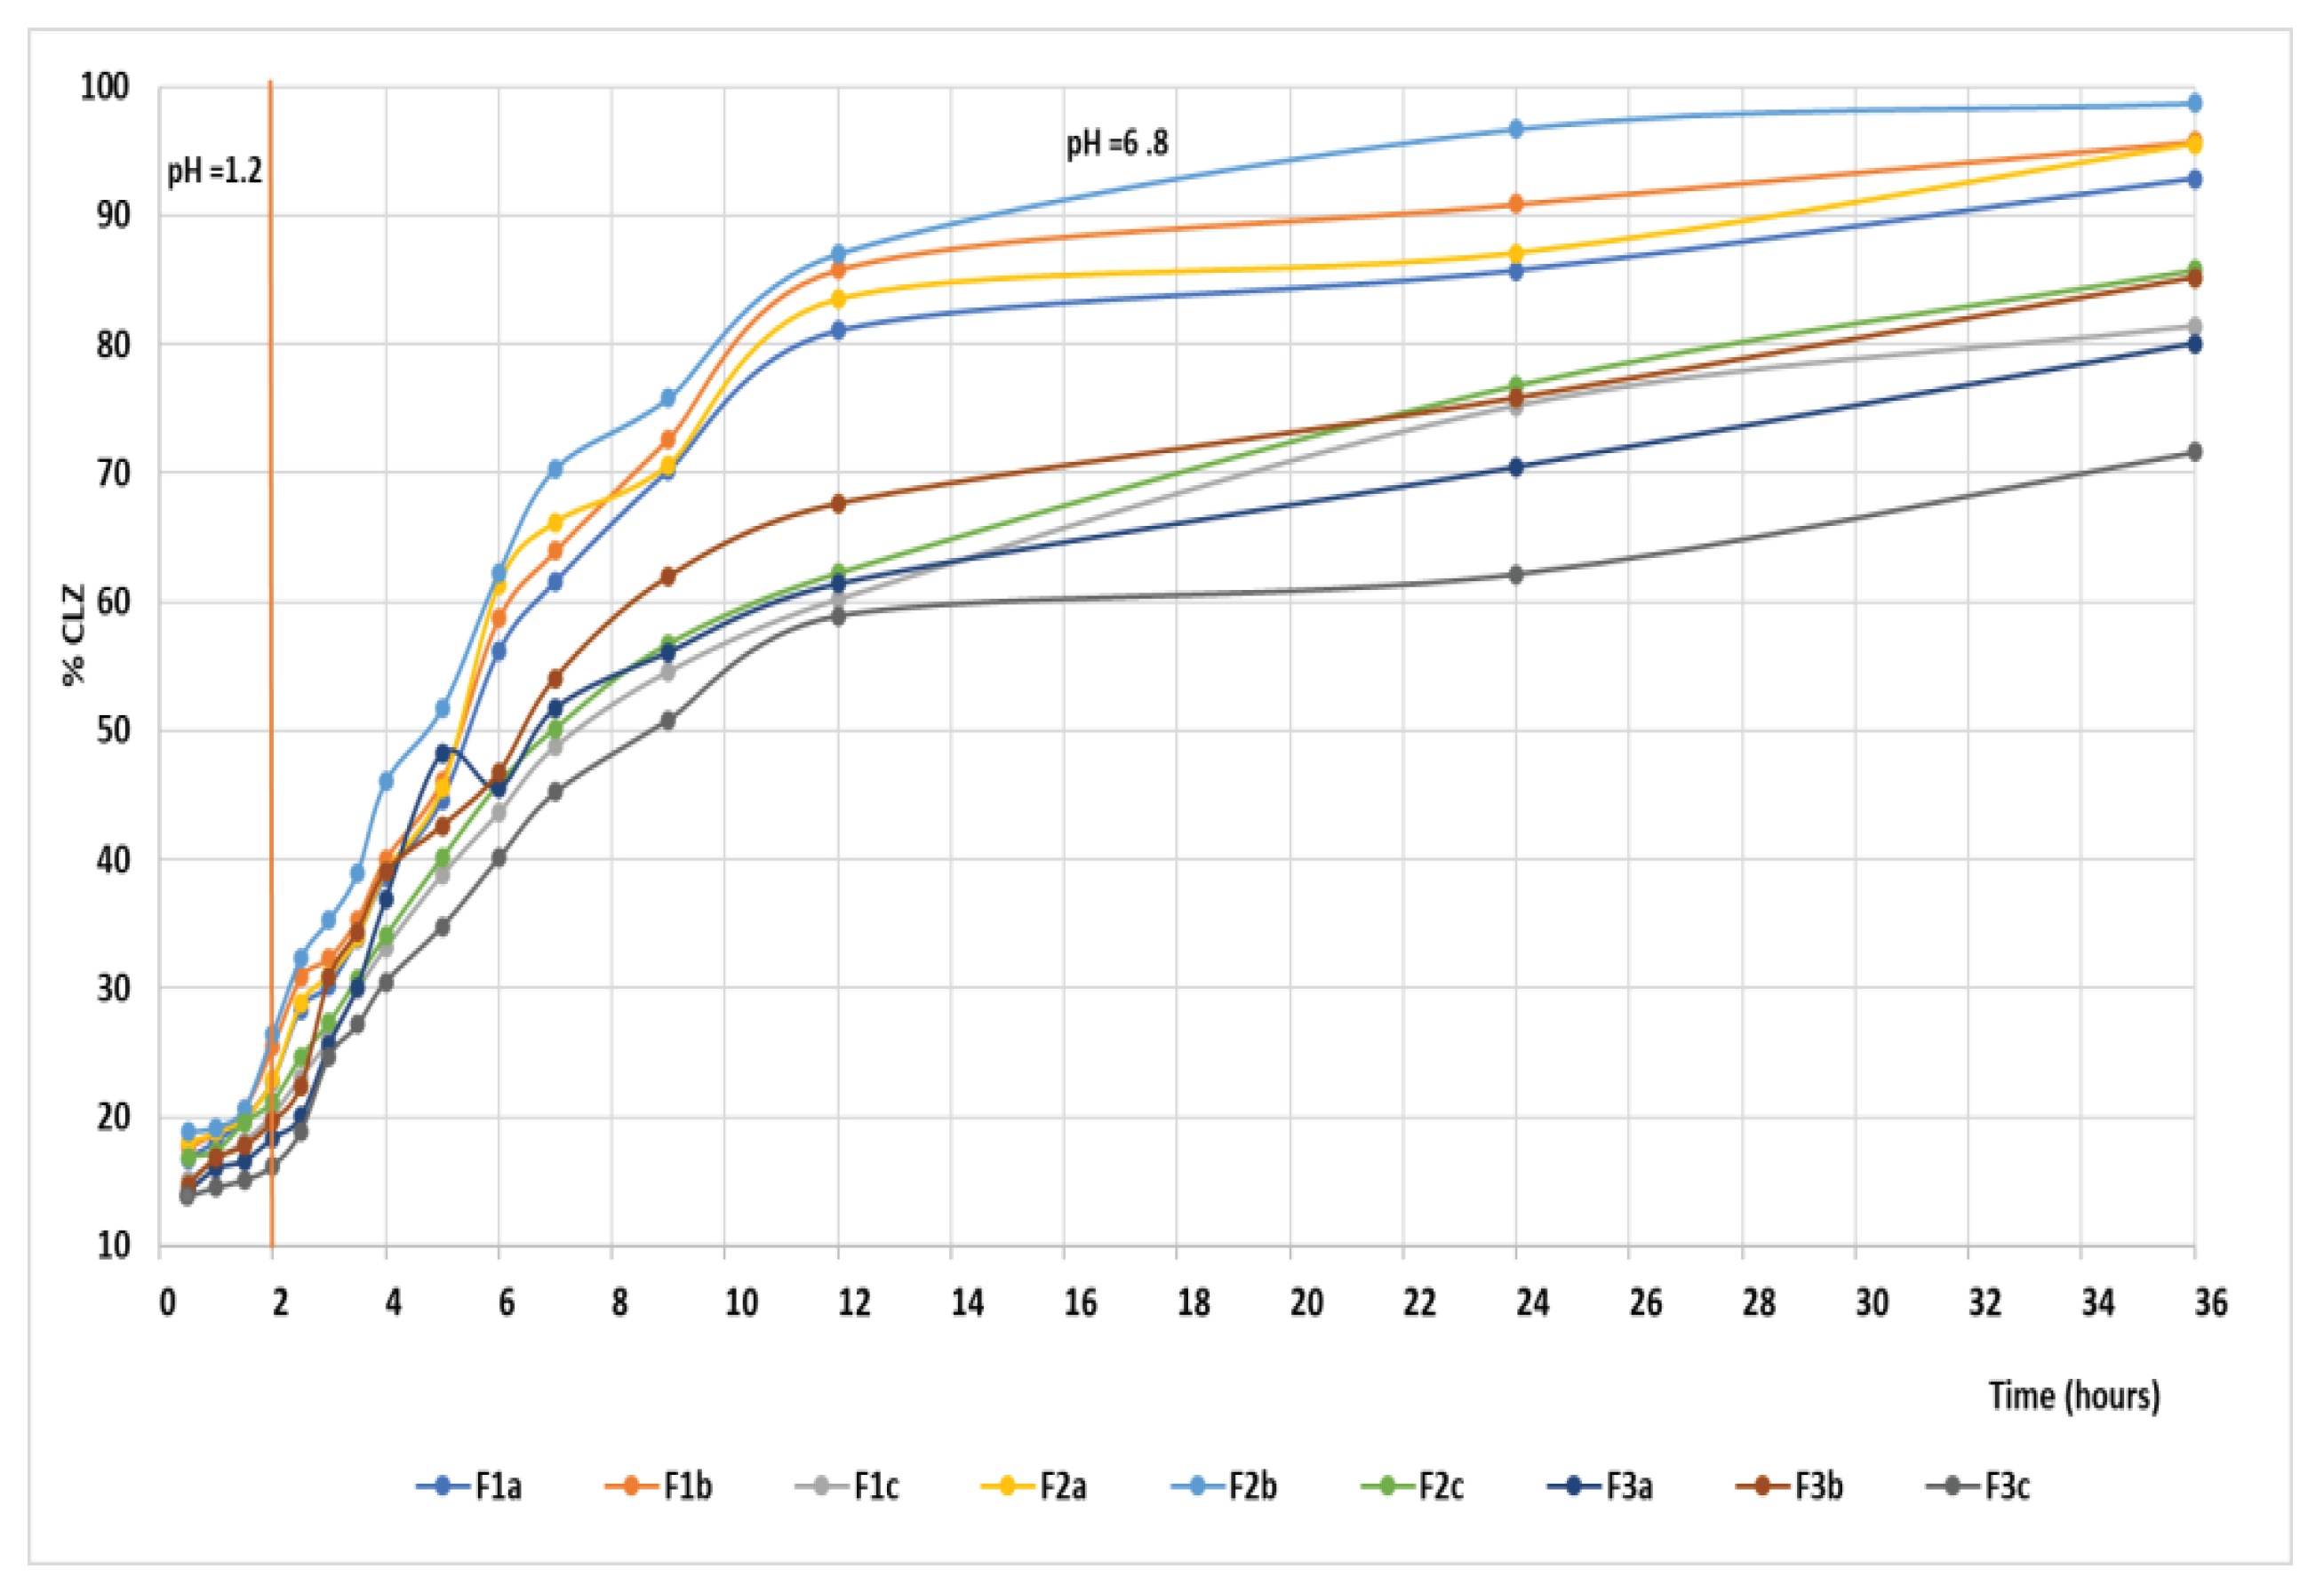
The CLZ release study was performed in two steps, modifying the pH of release media to cover the physiological pH range, from 1.2 pH buffer simulating the gastric fluid to 6.8 pH buffer mimicking the intestinal fluid (
Figure 14). A gradual release process that extends over several hours (up to 36 h) was recorded, which could be attributed to a slow CLZ diffusion through the prepared formulations in both pH buffer solutions. In the 12 – 36 hours interval, the release profile is close to reaching the equilibrium. At the end of the release process, the total released amount (Qmax, %) of CLZ from the formulations ranged between 86.1 % and 98.8 % (
Table 7), where the F2b formulation registered the highest drug released percentage.
The results of the in vitro release tests have been evaluated from the kinetic perspective (fitted with the Korsmeyer – Peppas equation), and the kinetic parameters (
n and
k) were calculated to establish the mechanism and rate of drug release (
Table 7). The equation was applied to the first (0 - 2 hours) and second (2.0 hours – 36 hours) steps of drug release.
Evaluating the first step of the kinetic release profile, the value of release exponent n for all the formulations was under 0.5 (n = 0.077 - 0.196), which is associated with a pseudo-Fickian mechanism. A different mechanism of the drug release, namely an abnormal or non-Fickian diffusion mechanism, was characteristic of the second step of the kinetic release profile, where the n value ranged between 0.5 and 1(n = 0.58 – 0.70).
It can be observed that the values of release rate constant
k are well correlated with the release profiles presented in
Figure 11. The highest values, 0.197 hour—n in the first step and 0.17 hour—n in the second step, were registered for the F2b sample, data that suggest a faster drug release.
For R2, the value should be as close as possible to 1 to demonstrate a yield as good as possible for a formulation. In Table 11, values of R2 are between 0.983 and 0.991.
In a study by Raval and Co. [
50], the solubility of pure CLZ drug was higher in pH 6.8 buffer solutions, whereas it was low in pH 1.2 buffer solutions. However, in our study, the release rate constant, k, is different for both steps of the release profile, remaining dependent on the pH of the buffer solution, meaning that after the incorporation of CLZ in the three formulations, the release by diffusion is influenced by the pH sensibility of drug solubility. It can be concluded that the incorporated formulations with CLZ are suitable for use as oral delivery systems that provide a controlled and prolonged release over 36 hours.
3. Materials and Methods
3.1. Materials
Chlorzaxazone (Orchid Chemicals Ltd, Chennai, India), Kollidon®SR (BASF, Germany), Chitosan (practical grade, BASF, Germania), Avicel®PH (Chemtrec, U.S.A. & Canada), Aerosil®200 (Degussa, Germania), Magnesium stearate (Union Derivan S.A., Spain).
3.2. Formulation of CLZ Matrix Tablets Studies
As per standard procedures, the formulation studies include determining flow time, compressibility parameters of powder mixtures, coefficient of friction, angle of repose, Hausner ratio, and Carr index.
The analysis of the data obtained in this stage is essential in carrying out a proper compression process because the flow properties of a mixture can be affected by shear forces, surface tension, electrostatic forces, van der Wals forces, and mechanical forces resulting from the interaction of particles[
18]. The Hausner ratio and the Carr index are indicators of the compatibility/compressibility characteristics of the powders. Analyzing and improving these parameters in the formulating stages allow us to obtain tablets with optimal mechanical resistance without the tendency to pickle. Both CHT and KOL (as raw materials) are characterized by optimal values of these parameters, recommending them as excipients for direct compression[
51].
Determination of flow and compressibility parameters of powder mixtures was done on mixtures of powder for the nine proposed formulations, using 50, 33, and 25 (w/w %) CLZ, 20-40 (w/w %) KOL 3-7(w/w %) CHT. The auxiliary substances were formulated in constant concentrations according to
Table 8 [
52,
53].
Flow Parameters of the Powder Mixtures
To evaluate the flow and compressibility parameters of the powder mixtures, the following indicators were determined:
Flow time (g/s) was determined by recording the time required for 50 g of powder to flow through a funnel with a 10 mm hole.
Coefficient of friction (tg α) was determined using the dynamic method, using the equation 1:
where: h = height and r = the radius of the powder cone.
Angle of repose (α) was determined using the dynamic method.
The Hausner ratio, which is calculated by relating the bulk density of a powder to the value of the compaction density, is a parameter related to the cohesion and adhesion forces that exist between the particles [
54].
Hausner ratio (R
H) was determined by measuring the density before (ρi) and after compaction (ρc), according to the equation 2 :
The Carr compressibility index is a parameter indicating the ability of some powders to form a homogeneous mixture.
Carr index (Ic) was determined using the density measurements done for the Hausner ratio [
24], according to the equation 3:
3.3. Preparation of CLZ Matrix Tablets
This strategy evaluated the influence of therapeutic system type on the oral disponibility of CLZ. Matrix tablets were prepared using the power mixtures for the nine proposed formulations by direct compression with the Korsh EK0 compression machine (10 mm ponson diameter, 8-10kN compression force)[
55].
Table 2 presents the compositions of the three oral formulations, where besides KOL and CHT, other specific auxiliary excipients were included[
56].
An Erweka AR 403 device (Erweka GmbH, Heusenstamm, Germany) was used for these preparations in the following conditions: rotation speed 400 rpm for 5 min; after that, the mixtures were sieved with an electromagnetic sieve EM-8 (Erweka GmbH, Heusenstamm, Germany). Direct compression of the mixtures was done with a Korsch EK0 single-punch station press (Korsch AG, Berlin, Germany). The matrix tablets with an average diameter of 10 mm and thickness of 3.0 mm have been obtained.
The effect of KOL and CHT were studied individually, and their combination at 1:1,
1:2 and 1:3 CLZ/ excipients ratios were also observed.
3.4. Evaluation of Matrix Tablets
3.4.1. Pharmaco-Technical Parameter of Matrix Tablets
The quality of the matrix tablets was assessed by determining the pharmaco-chemical characteristics of hydrophilic matrix tablets with the modified release [
57]: weight uniformity, drug content uniformity, Friability, mechanical strength, thickness, and
In vitro dissolution studies.
Weight uniformity was determined according to Romanian Pharmacopoeia, Xth Edition[
28], and 8
th European Pharmacopoeia by weighing 20 tablets on the Radwag WPE 60 electronic balance[
58]. Twenty tablets were selected randomly from each formulation and weighed individually. The individual weights were compared with the mean weight, and the standard deviation (SD) was calculated.
Dose uniformity was evaluated by quantitatively determining CLZ in tablets using an HPLC method. Ten were collected and powdered in a mortar for each formulation of prepared tablets.2.0-5.0 mg power was taken in a volumetric flask to add 10 mL of methanol, and the solution was sonicated for 10 min for complete solubilization of CLZ. The solution was filtered, 1 mL filtrate was diluted with 10 mL phosphate buffer pH 7.4, resulting in 0.020-0.025 mg CLZ mL
-1, and analyzed by HPLC method [
59]with slight modification.
HPLC was performed using a chromatograph of Thermo Fisher Surveyor type (Thermo Fisher, San Jose, USA) equipped with a UV-VIS detector with multiple Diode Array Detectors and a Thermo Fisher-Hypersil Betasil C18 150mm×4.6mm column (Thermo Fisher, San Jose, USA), the particle size dimension was of 5 µm. The column temperature was kept constant at 45 ± 0.2°C. As the mobile phase, a mixture of 0.05M dihydrogen phosphate and methanol in the 50:50 v/v ratio was used at a flow rate of 1.5 mL min-1. The injection volume for each determination was 20 μL. CLZ was detected by the UV spectrum at its characteristic wavelength at 280.4 nm.
Thickness, diameter, and mechanical strength.
The evaluation of the pharmaco-technical characteristics (diameter, thickness, and average mass) of the tablets was performed according to the 10
th Romanian Pharmacopoeia and 8
th European Pharmacopoeia [
60]. The weighing was done by means of an electronic balance Redwag WPE 60 on 29 tablets for mass and dose uniformity determination.
Mechanical resistance was performed on ten tablets on a Schleuniger Pharmatron tablet hardness tester 8M (Sotax AG, Aesch, Switzerland).
From thickness variation, ten tablets from each formulation were taken randomly, and their thickness was measured using a micrometer (Micro-Epsilon Messtechnic GMBH & CO.KG, Germany). The mean thickness and SD were calculated.
Friability was determined on 20 tablets on Schleuniger Pharmatron FTII friability tester (Sotax AG, Aesch, Switzerland) at 100 rpm for 4min. The tablets were reweighed, and the percent friability was then calculated according to the following equation 4:
Hydration capacity or swelling degree was determined by using a dissolution test station type II, Hanson SR 8 Plus Series (Hanson Research Co., Chatsworth, USA). Matrix tablets have been introduced in 1000 mL distilled water at 37±2°C at 60 rpm. At the predetermined time intervals (1 h), samples prevailed from the hydration medium, and the excess water on the surface was removed by wiping with filter paper and then weighed. The swelling degree was evaluated using relation 5:
where: SD = swelling degree; Wt = mass of the sample at time t; W
o = dry mass of the tablet.
The three formulations, F1b, F2b, and F3b, showed optimum pharmaco-technical properties, and it had the greatest potential to be used in oral pharmaceutical products for the controlled delivery of CLZ.
3.4.2. Drug-Excipients Compatibility Study
X-ray Diffraction
The diffractograms were recorded on a Diffractometer D8 ADVANCE (Bruker AXS, Germany), using the CuKα radiation. The working conditions were 40 kV, 30 mA, 2 s/step, and 0.02 o/step. All diffractograms were recorded in the 10–40 2θ degrees range at room temperature.
Thermal Characterization
Thermogravimetric (TG), derivative thermogravimetric (DTG), and differential thermal (DTA) curves were recorded with a Mettler Toledo 851e device, under a nitrogen atmosphere at the rate of 10ºC/min within the 25-700ºC temperature range. Samples weighing 2.2 to 3.7 mg were used, and the nitrogen flow rate was 20 mL/min. We checked the reproducibility of the data collected by recording three tests for each sample under the conditions described above. The uncertainty was found to be less than 1%.
Differential scanning calorimetry (DSC) curves were recorded with a Mettler Toledo DSC1 device. The tests were performed at a heating rate of 10°C/min in an inert atmosphere (nitrogen), with two heating stages and one cooling stage. -20-210ºC was the temperature range in which scans were performed for the formulations (F1b, F2b, and F3b), 25-210ºC for CLZ, 25-230ºC for CHT and avicel (AV), and 25-250ºC for magnesium stearate (ST) and KOL, respectively. The scanned samples weighed between 2 and 4.1 mg.
The TG, DTG, DTA, and DSC curves were processed using Mettler Toledo's STAR software to obtain the main thermal characteristics.
3.4.3. In Vitro Dissolution Studies
The CLZ dissolution profiles from the matrix tablets have been studied into two dissolution media with different pH namely: HCl 0.1 N solution with pH = 1.2 (simulating media for gastric fluids) and phosphate buffer solution with pH = 6.8 (simulating media for intestinal fluids). The experiments were carried out by means of a dissolution test station type II, Hanson SR 8 Plus Series (Hanson Research Co., Chatsworth, USA) provided with two blades. The experiments were performed according to the requirements described in Romanian , European and United States Pharmacopoeia (USP, with specifications for liquid and solid pharmaceutical formulations.
Dissolution medium was a pH 1.2 solution for the first 2 hours and then pH 6.8 solution (phosphate buffer) for the next 34 hours. SR 8 Plus Series blades apparatus type II set at 37±0.5°C and 50 rpm; the sampling interval was set every hour during the 36 h test (5 mL of sample were replaced with the same volume of medium). The quantitative determination of CLZ was performed using a HPLC method. The results were interpreted and statistically analyzed using Matlab7.9 .
According to pharmaco-technical specifications for the preparation of modified release tablets, the release profiles of the active substance from such type of tablets must be analyzed by determining the dissolution test for solid pharmaceutical forms, difference factor
f1 and the similarity factor
f2 and the correlation coefficient R
2 between two or more formulations [
61].
The difference factor f1 and the similarity factor f2, calculated according to the following equations:
where: n = the number of points for specimen collection, R
t = the amount of dissolved active substance from the reference formulation at the t moment, T
t = the amount of dissolved active substance of the studied formulation at the t moment, and log
10X = 10 base logarithm of X.
3.4.4. Drug Release Kinetics
The drug release data up to 60 % of the total drug released were fitted using the Korsmeyer - Peppas equation (Eq. 1) to determine the release mechanism:
where
Mt/M∞= fraction of the drug released at time
t,
Mt = absolute cumulative amount of drug released at time
t, M∞ = maximum amount released in the experimental conditions used, at the plateau of the release curves,
k = release constant and
n = release exponent, which is indicative of the release mechanism.
In the above equation, a value of n = 0.5 indicates a Fickian diffusion mechanism of the drug from the samples, while a value of 0.5 < n < 1 indicates anomalous or non-Fickian behavior. When n = 1, a case II transport mechanism is involved with zero order kinetics, while n > 1 indicates a special case II transport mechanism [
62].
To analyze the mechanism of drug release from matrix tablets, the results of in vitro release data were plotted using various kinetic models like zero order, first order, Higuchi, and Krosmeyer-Peppas models.
The evaluation of release profile kinetics of CLZ from matrix tablets based on KOL and CHT was done using analysis by fitting into four representative mathematical models, which are basic elements for understanding the mechanisms underlying the release of active substances from the studied formulations.
The data fitting was carried out by linear or non-linear regression using Matlab 7.1. The correlation coefficient R
2 was the criteria for selecting the model that most faithfully depicted the release profile of each studied formulation. A prediction as good as possible of the model requires R
2 to be as close to 1 [
63].
where: y
i = experimental data, y^i = values approximated by model, and
= average of experimental data.
4. Conclusions
In the present study, nine formulations of matrix tablets with CLZ were obtained and characterized to develop CLZ tablets with the modified release. KOL and CHT were used as matrix-forming agents, and their influence on the flow and the compressibility properties of the powders were analyzed as well as their effect on the pharmaco-chemical characteristics of the matrix tablets. The formulations of matrix tablets F1a,b-F2a,b-F3a,b obtained through direct compression, containing 20-30% (w/w) KOL, exhibited optimal flow properties and compressibility. In comparison, formulations with more than 40% (w/w) KOL had a poor flow or even lacking. The pharmaco-chemical characteristics of the tablets, defined both by the working conditions and the flowing and compressibility characteristics of the powders, were directly influenced by the matrix-forming polymers used to obtain hydrophilic matrix tablets with modified release. The mechanical strength of the tablets varied inversely to the KOL concentration in the formulation. Concentrations of KOL greater than 30% (w/w) lead to improper matrices regarding Friability and mechanical strength. CHT did not significantly influence the pharmaco-chemical properties of the formulations studied (mechanical strength, Friability, diameter, thickness, mass uniformity), but that polymer influenced the matrix release characteristics, as increasing CHT concentration decreased the CLZ release rate.
The three formulations F1b, F2b, and F3b showed optimum pharmaco-technical properties, and they had the most significant potential to be used in oral pharmaceutical products for the controlled delivery of CLZ.
The FT-IR spectroscopy and XRD analysis revealed no interactions between active principle and excipients. KOL, CHT, A, ST, and AV used in this study do not interact with the CLZ and may be valuable excipients in pharmaceutical formulations.
The DSC curves for the first heating stage confirm the presence of the active substance CLZ and its good compatibility with the excipients used. Thus, we found that CLZ preserved its crystalline form in the presence of excipients and that the melting peak temperature decreased from 191ºC to 163ºC, 164ºC, and 172ºC, respectively.
The in vitro dissolution test produced good results for the CLZ tablets, and they proved to be suitable for the prolonged and controlled release of CLZ. After 2 h in simulated gastric fluid with
pH = 1.2, the CLZ release was 20 -26 %; it was approximately 54-70% in the simulated intestinal fluid with pH = 6.8 after 7 h and 85-98 % after 36 h.
The values of the difference factor f1, the similarity factor f2, and the correlation coefficient R2 showed that the three formulations studied differed in terms of the release profile.
The in vitro kinetic study revealed a complex mechanism of release occurring in two steps through a pseudo-Fickian mechanism. The first step of the kinetic release profile and the non-Fickian diffusion mechanism was characteristic for the second step. The incorporated formulations with CLZ are suitable for use as oral delivery systems that provide a controlled and prolonged release over 36 hours. In vitro dissolution tests revealed the F2b sample, which suggests a faster drug release.
In conclusion, the results confirmed that CLZ can be formulated as hydrophilic matrix tablets based on KOL and CHT, with up to 30% (w/w) KOL and 5% (w/w) CHT.
Formulations F1b, F2b, and F3b will be studied in vivo to determine the oral bioavailability of CLZ.
Author Contributions
"Conceptualization, A.C. and G.L.; methodology, A.G. G.L and C.V.; software, M.C.P.; validation, AC., D.P.and C.N.L.; formal analysis, A.C.; investigation, A.D.P.; resources, M.C.P.; data curation, G.T.; writing—original draft preparation, A.C.; writing—review and editing, A.C.; All authors have read and agreed to the published version of the manuscript.
Funding
This research received no external funding.
Institutional Review Board Statement
Not applicable.
Informed Consent Statement
Not applicable.
Data Availability Statement
Avasilable on resonable demant.
Conflicts of Interest
The authors declare no conflict of interests.
References
- Mandal, A.S.; Biswas, N.; Karim, K.M.; Guha, A.; Chatterjee, S.; Behera, M.; Kuotsu, K. Drug delivery system based on chronobiology—A review. Journal of controlled release 2010, 147, 314–325. [Google Scholar] [CrossRef] [PubMed]
- Shanmugam, S.; Chakrahari, R.; Sundaramoorthy, K.; Ayyappan, T.; Vetrichelvan, T. Formulattion and Evaluation of Sustained Release Matrix Tablets of Losartan potassium. Int. J. Pharm Tech Res. 2011, 3, 526–534. [Google Scholar]
- Xavier, A.S. Skeletal Muscle Relaxants. Introduction to Basics of Pharmacology and Toxicology. 2021; pp. 271–280.
- Chou, R.; Peterson, K.; Hefand, M. Comparative efficacy and safety of skeletal muscle relaxants for spasticity and musculoskeletal conditions: A systemic review. J. Pain Syntom Manage. 2004, 28, 140–175. [Google Scholar] [CrossRef] [PubMed]
- Moqbel, H.A.; El Meshad, A. N.; El-Nabarawi, M.A. A pharmaceutical study on chlorzoxazone orodispersible tablets: Formulation, in-vitro and in-vivo evaluation. Drug Delivery 2016, 23, 2990–3007. [Google Scholar] [CrossRef] [PubMed]
- Sweetman, S.C.; Pharm, B.; Pharm, S.F.R. Martindale: The complete drug reference, 36th ed.; The Pharmaceutical Press an imprint of RPS Publishing: London, UK, 2009. [Google Scholar]
- Xu, W.J.; Xie, H.J.; Cao, Q.R.; et al. Enhaced dissolution and oral bioavaibility of valsartan solid dispersions prepared by by freeze drying technique using hydrophilic polymesrs. Drug Deliv. 2016, 23, 41–48. [Google Scholar] [CrossRef] [PubMed]
- Creteanu, A.; Ochiuz, L.; Vasile, C.; Paduraru, O.M.; Popescu, C.; Vieru, M.; Panainte, A.D.; Tantaru, G. Thermal Stability Assesment of Amiodarone Hydrochloride in Polymeric Matrix Tablets. Farmacia 2016, 64, 940–945. [Google Scholar]
- Creteanu, A.; Pamfil, D.; Vasile, C.; Ghilan, A.; Tantaru, G. The Influence of Amiodarone Complexation with 2-Hydroxypropyl-βCyclodextrin in Oral Matrix Tablets Delivery: In vitro and In vivo Evaluationon. Progress in Chemical Science Research 2023, 9, 13–63. [Google Scholar]
- Crețeanu Andreea, Ochiuz Lăcrămioara, Ghiciuc Cristina Mihaela, Ţântaru Gladiola, Vasile Cornelia, Popescu Maria Cristina. Compoziţie şi procedeu pentru obţinerea de noi comprimate matriceale cu eliberare modificată şi acţiune prelungită cu clorhidrat de amiodaronă, Patent no. 131194, 2019.
- Dow. Using Dow Excipients for Controlled Release of drugs in Hydrophilic Matrix Systems. Midland: The Dow Chemical Company USA, 2006.
- Kollidon, S.R. A new excipient for smooth direct compression of sustained release dosage forms. Product brochure on Kollidon, S.R. Ludwigshafen: BASF, 2000.
- Bühler, V. Polyvinylpyrrolidone excipients for the pharmaceutical industry., 9, BASF SE Pharma Ingredients & Services, Ludwigshafen, 2008.
- Kumar, M.N.; Muzzarelli, R.A.; Muzzarelli, C.; et al. Chitozan chemistry and pharmaceutical perspectives. Chem Rev 2004, 104, 6017–6084. [Google Scholar] [CrossRef]
- Cardoneanu, A.; Duceac, L.D.; Rezus, E.; Mihai, C.; Dranga, M.; Gavrilescu, O.; Prelipcean, C.C. Medical-Surgical Journal- Revista Medico-Chirurgicala. 2017, 121, 291.
- Niazi, S. Handbook of Pharmaceutical Manufacturing Formulations: Compressed Solid Products, 2nd ed.; Informa Health Care: New York, 2009. [Google Scholar]
- Dow. Using Dow Excipients for Controlled Release of drugs in Hydrophilic Matrix Systems; The Dow Chemical Company USA: Midland, 2006. [Google Scholar]
- Villanova, J.; Ayres, E.; Oréfice, R. Design of prolonged release tablets using new solid acrylic excipients for direct compression. Eur. J. Pharm. Biopharm. 2011, 79, 664–673. [Google Scholar] [CrossRef]
- Ritger, P.L.; Peppas, N.A. A simple equation for description of solute release II. Fickian and anomalous release from swellable devices. J. Control. Release 1987, 5, 37–42. [Google Scholar] [CrossRef]
- Yurdakul, S.; Yurdaku, M. FT-IR, FT-Raman spectra, and DFT computations of the vibrational spectra and molecular geometry of chlorzoxazone. Spectrochimica Acta Part A: Molecular and Biomolecular Spectroscopy 2014, 126, 339–348. [Google Scholar] [CrossRef]
- Velcheva, E.A.; Nikolova, G.L.; Petrov, O.I. Experimental and DFT studies on IR spectral and structural changes arising from the conversion of 5-chloro-2-(3H)-benzoxazolone into azanion. Bulgarian Chemical Communications 2006, 38, 263–269. [Google Scholar]
- Dong, L.; Mai, Y.; Liu, Q.; Zhang, W.; Yang, J. Mechanism and Improved Dissolution of Glycyrrhetinic Acid Solid Dispersion by Alkalizers. Pharmaceutics 2020, 12, 82. [Google Scholar] [CrossRef] [PubMed]
- Gieroba, B.; Sroka-Bartnicka, A.; Kazimierczak, P.; Kalisz, G.; Lewalska-Graczyk, A.; Vivcharenko, V.; Nowakowski, R.; Pieta, I.S.; Przekora, A. Spectroscopic studies on the temperature-dependent molecular arrangements in hybrid chitosan/1,3-β-D-glucan polymeric matrices. Int. J. Biol. Macromol. 2020, 159, 911–921. [Google Scholar] [CrossRef]
- Popescu, C.-M.; Larsson, P.T.; Olaru, N.; Vasile, C. Spectroscopic study of acetylated kraft pulp fibers. Carbohydr. Polym. 2012, 88, 530–536. [Google Scholar] [CrossRef]
- Popescu, M.-C.; Dogaru, B.-I.; Sun, D.; Stoleru, E.; Simionescu, B.C. Structural and sorption properties of bio-nanocomposite films based on κ-carrageenan and cellulose nanocrystals. Int. J. Biol. Macromol. 2019, 135, 462–471. [Google Scholar] [CrossRef]
- Popescu, M.-C.; Vasile, C.; Filip, D.; Macocinschi, D.; Singurel, G. Characterization by Fourier transform infrared spectroscopy of polyethylene adipate/cholesteryl palmitate blends. J. Appl. Polym. Sci. 2004, 94, 1156–1163. [Google Scholar] [CrossRef]
- Popescu, C.-M.; Larsson, P.T.; Olaru, N.; Vasile, C. Spectroscopic study of acetylated kraft pulp fibers. Carbohydr. Polym. 2012, 88, 530–536. [Google Scholar] [CrossRef]
- Cabrales, L.; Abidi, N. On the thermal degradation of cellulose in cotton fibers. J. Therm. Anal. Calorim. 2010, 102, 485–491. [Google Scholar] [CrossRef]
- Kramer, R.K.; Carvalho, A.J.F. Non-freezing water sorbed on microcrystalline cellulose studied by high-resolution thermogravimetric analysis. Cellulose 2021, 28, 101–117. [Google Scholar] [CrossRef]
- Rahman, L.; Goswami, J.; Choudhury, D. Assessment of physical and thermal behaviour of chitosan-based biocomposites reinforced with leaf and stem extract of Tectona grandis. Polym. Polym. Compos. 2022, 30, 11–12. [Google Scholar] [CrossRef]
- Moussout, H.; Ahlafi, H.; Aazza, M.; Bourakhouadar, M. Kinetics and mechanism of the thermal degradation of biopolymers chitin and chitosan using thermogravimetric analysis. Polym. Degrad. Stab. 2016, 130, 1–9. [Google Scholar] [CrossRef]
- Roy, P.; Ghosh, A.A. Mechanochemical cocrystallization to improve the physicochemical properties of chlorzoxazone. Cryst Eng Comm 2020, 22, 4611–20. [Google Scholar] [CrossRef]
- Holland, B.J.; Hay, J.N. The thermal degradation of poly(vinyl acetate) measured by thermal analysis–Fourier transform infrared spectroscopy. Polymer 2002, 43, 2207–2211. [Google Scholar] [CrossRef]
- Loría-Bastarrachea, M.I.; Herrera-Kao, W.; Cauich-Rodríguez, J.V.; Cervantes-Uc, J.M.; Vázquez-Torres, H.; Ávila-Ortega, A. A TG/FTIR study on the thermal degradation of poly(vinyl pyrrolidone). J. Therm. Anal. Calorim. 2010, 104, 737–742. [Google Scholar] [CrossRef]
- Paweł, R. Thermal compatibility assessment of selected excipients used in the oral anti-cancer formulation containing busulfan. Farmacia. 2022, 70, 417–424. [Google Scholar]
- Zhang, M.H.; Zhao, L.; Xu, H.L.; Wu, W.C.; Dong, H. Study on the thermal decomposition mechanism Mg(NO3)2·6H2O from the perspective of resource utilization of magnesium slag. Environmental Technology 2024, 45, 751–761. [Google Scholar] [CrossRef]
- Veras, K.S.; Fachel, F.N.S.; Pittol, V.; Garcia, K.R.; Bassani, V.L.; dos Santos, V.; Henriques, A.T.; Teixeira, H.F.; Koester, L.S. Compatibility study of rosmarinic acid with excipients used in pharmaceutical solid dosage forms using thermal and non-thermal techniques. Saudi Pharm. J. 2019, 27, 1138–1145. [Google Scholar] [CrossRef]
- Vodáčková, P.; Vraníková, B.; Svačinová, P.; Franc, A.; Elbl, J.; Muselík, J.; Kubalák, R.; Solný, T. Evaluation and Comparison of Three Types of Spray Dried Coprocessed Excipient Avicel® for Direct Compression. BioMed Res. Int. 2018, 2018, 1–15. [Google Scholar] [CrossRef] [PubMed]
- Acosta-Ferreira, S.; Castillo, O.S.; Madera-Santana, J.T.; Mendoza-García, D.A.; Núñez-Colín, C.A.; Grijalva-Verdugo, C.; Villa-Lerma, A.G.; Morales-Vargas, A.T.; Rodríguez-Núñez, J.R. Production and physicochemical characterization of chitosan for the harvesting of wild microalgae consortia. Biotechnol. Rep. 2020, 28, e00554. [Google Scholar] [CrossRef]
- Restrepo-Uribe, L.; Ioannidis, N.; Escobar, M.d.P.N. Influence of screw configuration and processing parameters on the dissolution of ketoprofen in polymer blends. J. Appl. Polym. Sci. 2020, 137. [Google Scholar] [CrossRef]
- Crișan, A.G.; Porfire, A.; Iurian, S.; Rus, L.M.; Ciceo, R.L.; Turza, A.; Tomuță, I. Development of a Bilayer Tablet by Fused Deposition Modeling as a Sustained-Release Drug Delivery System. Pharmaceuticals 2023, 16, 1321. [Google Scholar] [CrossRef] [PubMed]
- Haware, R.V.; Vinjamuri, B.P.; Sarkar, A.; Stefik, M.; Stagner, W.C. Deciphering magnesium stearate thermotropic behavior. Int. J. Pharm. 2018, 548, 314–324. [Google Scholar] [CrossRef] [PubMed]
- Nokhodchi, A.; Okwudarue, O.N.; Valizadeh, H.; Momin, M.N. Cogrinding as a Tool to Produce Sustained Release Behavior for Theophylline Particles Containing Magnesium Stearate. Aaps Pharmscitech 2009, 10, 1243–1251. [Google Scholar] [CrossRef] [PubMed]
- Restrepo-Uribe, L.; Ioannidis, N.; Noriega Escobar, M.D.P. Influence of screw configuration and processing parameters on the dissolution of ketoprofen in polymer blends. J Appl Polym Sci. 2020, 137, e49407. [Google Scholar] [CrossRef]
- Raval, M.K.; Patel, J.M.; Parikh, R.K.; Sheth, N.R. Dissolution enhancement of chlorzoxazone using cogrinding technique. Int. J. Pharm. Investig. 2015, 5, 247–258. [Google Scholar] [CrossRef] [PubMed]
- Thapa, P.; Ghimire, M.; Mullen, A.B.; Stevens, H. Controlled Release Oral Drug Delivery Systems containing Water Insoluble drugs. J Sci Engin Techn. 2005, 1, 28–35. [Google Scholar]
- Denkbas, E.B.; Ottenbrite, R.M. Perspectives on: Chitozan drug delivery systems based on their geometries. J Bioact Compat Polym 2006, 21, 351–368. [Google Scholar] [CrossRef]
- Ganesan, V.; Rosentrater, K.; Muthukumarappan, K. Flowability and handling characteristics of bulk solids and powders—a review with implications for DDGS. Biosyst. Eng. 2008, 101, 425–435. [Google Scholar] [CrossRef]
- Niazi, S. Handbook of Pharmaceutical Manufacturing Formulations: Compressed Solid Products, 2nd ed.; Informa Health Care: New York, 2009; Volume 1. [Google Scholar]
- Kuentz, M.; Holm, R.; Kronseder, C.; Saal, C. Rational selection of bio-enabling oral drug formulations–a PEARRL commentary. Journal of Pharmaceutical. 2021, 110, 1921–1930. [Google Scholar] [CrossRef]
- Gibson, M. Pharmaceutical Preformulation and Formulation: A Practical Guide from Candidate Drug Selection to Commercial Dosage Form; CRC Press: Boca Raton, 2001. [Google Scholar]
- Popovici, I.; Lupuleasa, D. Tehnologie Farmaceutica; Editura Polirom: Iasi, 2009. [Google Scholar]
- Rowe, R.C.; Sheskey, P.J.; Quinn, M.E. Handbook of Pharmaceutical Excipients; American Pharmacists Association: Washington, DC, 2009. [Google Scholar]
- Siepmann, J.; Siepmann, F. Modeling of diffusion controlled drug delivery. J. Control. Release 2012, 161, 351–362. [Google Scholar] [CrossRef] [PubMed]
- Farmacopeea Română, ed. a X a, Ed Medicală, Bucureşti, supl. 2004: 59-74.
- European Pharmacopoeia, 8th ed, Directorate for the Quality of Medicines and Healthcare, Strasbourg, Council of Europe, 2014, 288.
- United States Pharmacopoeia and the National Formulary, US Pharmacopoeia Convenction, Inc, 26th edition, 2003, 724.
- Siepmann, F.; Hoffmann, A.; Leclercq, B.; Carlin, B.; Siepmann, J. How to adjust desired drug release patterns from ethylcellulose-coated dosage forms. J. Control. Release 2007, 119, 182–189. [Google Scholar] [CrossRef] [PubMed]
- Zhang, S.-J.; Xu Wei, R. Study on bioequivalence of chlorzoxazone tablets in Chinese volunteers. Asi J.Drug Metab. 2003, 4, 53–56. [Google Scholar]
- Maderuelo, C.; Zarzuelo, A.; Lanao, J.M. Critical factors in the release of drugs from sustained release hydrophilic matrices. J. Control. Release 2011, 154, 2–19. [Google Scholar] [CrossRef] [PubMed]
- Ahuja, N.; Katare, O.P.; Singh, B. Studies on dissolution enhancement and mathematical modeling of drug release of a poorly water-soluble drug using water-soluble carriers. Eur. J. Pharm. Biopharm. 2007, 65, 26–38. [Google Scholar] [CrossRef] [PubMed]
- Gohel, M.C.; Sarvaiya, K.G.; Shah, A.R.; Brahmbhatt, B.K. Mathematical approach for the assessment of similarity factor using a new scheme for calculating weight. Indian J. Pharm. Sci. 2009, 71, 142–144. [Google Scholar] [CrossRef]
- Korsmeyer, R.W.; Lustig, S.R.; Peppas, N.A. Solute and penetrant diffusion in swellable polymers. I. Mathematical modeling. J. Polym. Sci. Part B: Polym. Phys. 1986, 24, 395–408. [Google Scholar] [CrossRef]
Figure 1.
General molecular formula of KOL.
Figure 1.
General molecular formula of KOL.
Figure 2.
The size of the particles of KOL-image SEM( Polyvinyl pyrrolidone radical x = 450; Polyvinyl acetate radical y = 5200).
Figure 2.
The size of the particles of KOL-image SEM( Polyvinyl pyrrolidone radical x = 450; Polyvinyl acetate radical y = 5200).
Figure 3.
Chemical structure of CHT.
Figure 3.
Chemical structure of CHT.
Figure 4.
HPLC chromatograms of the three formulations (F1, F2, F3) and CLZ.
Figure 4.
HPLC chromatograms of the three formulations (F1, F2, F3) and CLZ.
Figure 5.
Variation of hydration degree of the matrix tablets.
Figure 5.
Variation of hydration degree of the matrix tablets.
Figure 6.
IR spectra of the formulation components.
Figure 6.
IR spectra of the formulation components.
Figure 7.
Comparison between experimental and calculated IR spectra of the studied formulations.
Figure 7.
Comparison between experimental and calculated IR spectra of the studied formulations.
Figure 8.
XRD diffractograms of pure components (a) and the mixtures (b).
Figure 8.
XRD diffractograms of pure components (a) and the mixtures (b).
Figure 9.
DTG curves for formulations F1b, F2b and F3b.
Figure 9.
DTG curves for formulations F1b, F2b and F3b.
Figure 12.
a. DSC curves of the formulations within the -25 – 210ºC temperature range (first heating stage).
Figure 12 b. DSC curves of the formulations within the -25 – 210ºC temperature range(cooling stage).
Figure 12c. DSC curves of the formulations within the -25 – 210ºC temperature range. (second heating stage).
Figure 13.
In vitro dissolution profile of CLZ in F1, F2, F3.
Figure 13.
In vitro dissolution profile of CLZ in F1, F2, F3.
Figure 14.
Profile of Chlorzoxazone release mimicking the physiological pathway.
Figure 14.
Profile of Chlorzoxazone release mimicking the physiological pathway.
Table 1.
Flow parameters of the powder mixtures.
Table 1.
Flow parameters of the powder mixtures.
| |
Formulations |
F1a |
F1b |
F1c |
F2a |
F2b |
F2c |
F3a |
F3b |
F3c |
| Parameter |
|
Flow time T
(g/s) |
0.1254
(0.122) |
0.1368
(0.064) |
0.1525
(0.091) |
0.1133
(0.063) |
0.1233
(0.111) |
0.1167
(0.625) |
0.1211
(0.054) |
0.1147
(0.074) |
0.1471
(0.68) |
| Friction coefficienttg α |
0.4312 |
0.4602 |
0.5511 |
0.4101 |
0.4368 |
0.5266 |
0.4255 |
0.4073 |
0.5032 |
Angle of repose
α (°) |
24.5
(0.135) |
23
(0.112) |
25
(0.567) |
33
(0.105) |
34.5
(0.857) |
35
(0.156) |
35.5
(0.525) |
40.5
(0.452) |
40.6
(0.65) |
| Hausner ratio |
1.1653
(0.052) |
1.2511
(0.150) |
1.3155
(0.165) |
1.2613 (0.198) |
1.2501
(0.105) |
1.3160
(0.0751) |
1.3475
(0.086) |
1.2595
(0.072) |
1.3955
(0.094) |
Carr index
(%) |
23.113
(0.061) |
24.035
(0.155) |
25.815
(0.162) |
25.011
(0.087) |
25.5166
(0.098) |
26.8751
(0.o53) |
25.470
(0.075) |
24.254
(0.069) |
35
(0.093) |
Table 2.
Pharmaco-technical parameter values of matrix tablet formulations.
Table 2.
Pharmaco-technical parameter values of matrix tablet formulations.
| |
Formulations |
F1a |
F1b |
F1c |
F2a |
F2b |
F2c |
F3a |
F3b |
F3c |
| Parameter |
|
Diameter
(mm) |
10.075
(0.015) |
10.061
(0.005) |
10.101
(0.005) |
10.076
(0.015) |
10.075
(0.015) |
10.083
(0.014) |
10.064
(0.011) |
10.062
(0.006) |
10.058
(0.014) |
Trickness
(mm) |
4.6544
(0.015) |
4.8355
(0.025) |
4.8432
(0.024) |
4.9433
(0.191) |
5.095
(0.083) |
4.7433
(0.045) |
4.5724
(0.056) |
4.5583
(0.144) |
4.5225
(0.043) |
Average mass
(g) |
0.483
(1.131) |
0.489
(0.623) |
0.469
(1.245) |
0.486
(1.102) |
0.497
(0.875) |
0.475
(0.788) |
0.469
(0.835) |
0.487
(0.872) |
0.472
(0.851) |
Dose uniformity
(mg) |
251
(1.285) |
249
(0.988) |
247
(1.018) |
164
(0.932) |
166
(0892) |
167
(0.854) |
123
(0.689) |
125
(1.323) |
126
(1.126) |
| Mechanical strength (N) |
99.75
(3.324) |
98.95
(2.755) |
92.55
(3.653) |
95.35
(3.352) |
93.55
(2.983) |
92.11
(2.652) |
88.95
(2.347) |
85.75
(2.583) |
82.45
(2.741) |
Friability
(%) |
1.0112
(0.012) |
0.8661
(0.025) |
1.7745
(0.053) |
1.1583
(0.025) |
1.3125
(0.026) |
1.8955
(0.035) |
1.2305
(0.028) |
1.3255
(0.035) |
1.954
(0.325) |
Table 3.
The main thermal characteristics of the components of the formulations.
Table 3.
The main thermal characteristics of the components of the formulations.
| Sample |
Stage/
DTA Characteristics |
Tonset,ºC |
Tpeak,ºC |
Tendset,ºC |
W, % |
Residue, % |
| AV |
I/ endo |
47 |
80 |
91 |
4.36 |
15.74 |
| II/ endo exo |
292 |
361 |
378 |
79.90 |
| CHT |
I/ endo |
53 |
73 |
105 |
12.21 |
17.81 |
| II/ exo |
277 |
302 |
325 |
42.72 |
| III/ exo |
467 |
509 |
700 |
26.56 |
| CLZ |
I/ endo |
234 |
292 |
305 |
95.60 |
4.40 |
| KOL |
I/ endo |
45 |
55 |
77 |
3.75 |
9.49 |
| II/ endo exo |
320 |
343 |
361 |
54.27 |
| III/ exo |
416 |
447 |
473 |
32.49 |
| ST |
I/ endo |
50 |
63 |
113 |
2.59 |
7.05 |
| II/ endo |
330 |
386 |
410 |
90.36 |
Table 4.
The main thermal characteristics of the formulations.
Table 4.
The main thermal characteristics of the formulations.
| Sample |
Stage/
DTA Characteristics |
Tonset,ºC |
Tpeak,ºC |
Tendset,ºC |
W, % |
Residue, % |
| F1 |
I/ endo |
45 |
58 |
85 |
1.50 |
9.90 |
| II/ endo |
242 |
279 |
300 |
53.08 |
| III/ exo |
327 |
338 |
359 |
21.51 |
| IV/ exo |
428 |
442 |
479 |
14.01 |
| F2 |
I/ endo |
47 |
55 |
79 |
1.16 |
8.04 |
| II/ endo |
232 |
282 |
300 |
47.09 |
| III/ exo |
326 |
336 |
357 |
25.52 |
| IV/ exo |
430 |
440 |
481 |
18.19 |
| F3 |
I/ endo |
45 |
51 |
74 |
0.80 |
11.04 |
| II/ endo |
235 |
283 |
303 |
47.52 |
| III/ exo |
326 |
338 |
359 |
24.58 |
| IV/ exo |
414 |
444 |
473 |
16.06 |
Table 5.
Values of f1 and f2 factors for the matrix tablet formulations.
Table 5.
Values of f1 and f2 factors for the matrix tablet formulations.
Reference
formulations |
Test formulations |
Difference factor f1 |
Similarity factor f2 |
| F1a |
F2a |
41.8503 |
38.3546 |
| F3a |
48.0360 |
30.0462 |
| F1b |
F2b |
33.7543 |
57.9562 |
| F3b |
35.8516 |
51.5645 |
| F1c |
F2c |
52.1065 |
19.2135 |
| F3c |
55.5045 |
19.8517 |
Table 6.
Release parameters.
Table 6.
Release parameters.
| Sample name |
Qmax [%] |
T1/2 [hours] |
| F1b |
95.76 |
5.14 |
| F2b |
98.75 |
4.60 |
| F3b |
86.15 |
5.10 |
Table 7.
Kinetic parameters of Chlorzoxazone release from investigated samples.
Table 7.
Kinetic parameters of Chlorzoxazone release from investigated samples.
| Sample name |
n |
R2n
|
k [hour –n] |
R2k
|
| First step of kinetic release profile (0 - 2 hours) – pH 1.2 |
| F1b |
0.114 |
0.966 |
0.190 |
0.999 |
| F2b |
0.077 |
0.604 |
0.197 |
0.998 |
| F3b |
0.196 |
0.965 |
0.168 |
0.998 |
| Second step of kinetic release profile (2 – 36 hours) - pH 6.8 |
| F1b |
0.708 |
0.982 |
0.151 |
0.990 |
| F2b |
0.673 |
0.977 |
0.170 |
0.983 |
| F3b |
0.577 |
0.983 |
0.167 |
0.991 |
Table 8.
Formulation of CLZ matrix tablets.
Table 8.
Formulation of CLZ matrix tablets.
| Substance (w/w %) |
Formulation |
| F1a |
F1b |
F1c |
F2a |
F2b |
F2c |
F3a |
F3b |
F3c |
| 1 : 1 |
1 : 2 |
1 : 3 |
| CLZ |
50 |
50 |
50 |
33 |
33 |
33 |
25 |
25 |
25 |
| KOL |
20 |
30 |
40 |
20 |
30 |
40 |
20 |
30 |
40 |
| CHT |
3 |
5 |
7 |
3 |
5 |
7 |
3 |
5 |
7 |
| Aerosil |
1 |
1 |
1 |
1 |
1 |
1 |
1 |
1 |
1 |
| Mg Stearat |
0.5 |
0.5 |
0.5 |
0.5 |
0.5 |
0.5 |
0.5 |
0.5 |
0.5 |
| Avicel |
up to 100 |
|
Disclaimer/Publisher’s Note: The statements, opinions and data contained in all publications are solely those of the individual author(s) and contributor(s) and not of MDPI and/or the editor(s). MDPI and/or the editor(s) disclaim responsibility for any injury to people or property resulting from any ideas, methods, instructions or products referred to in the content. |
© 2024 by the authors. Licensee MDPI, Basel, Switzerland. This article is an open access article distributed under the terms and conditions of the Creative Commons Attribution (CC BY) license (http://creativecommons.org/licenses/by/4.0/).
