Submitted:
08 April 2024
Posted:
09 April 2024
You are already at the latest version
Abstract
Keywords:
1. Introduction
2. Observations and Data Reduction
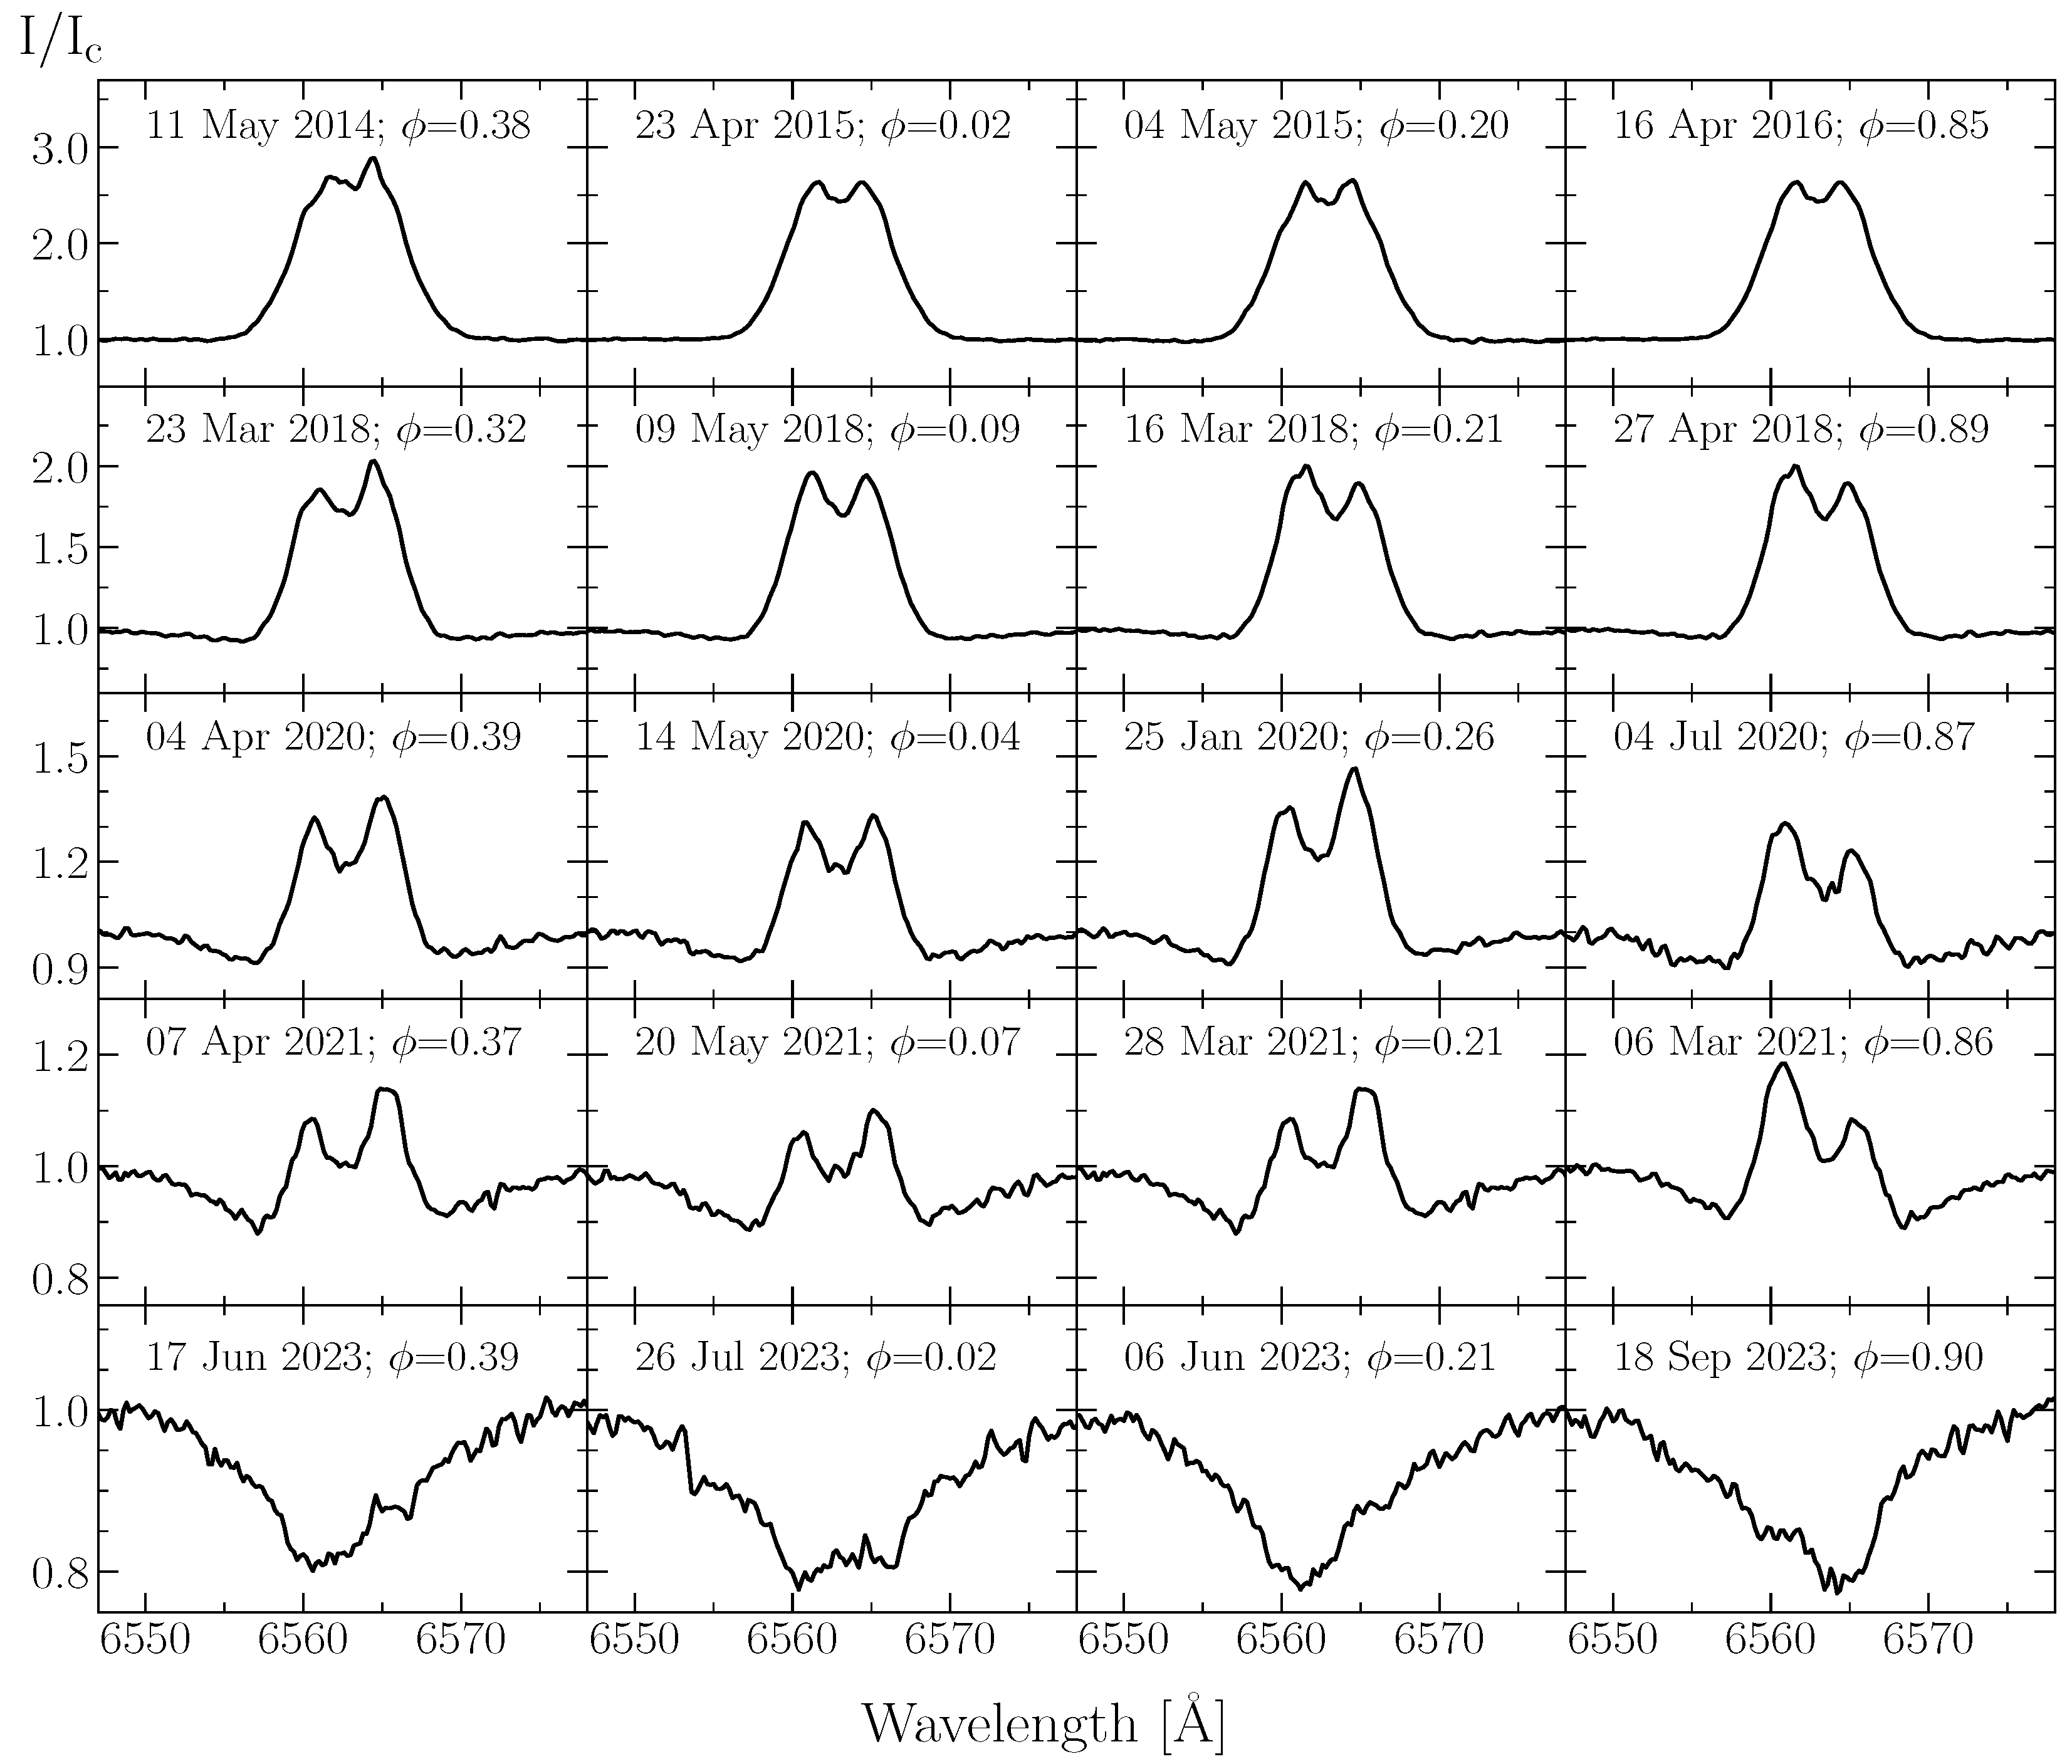
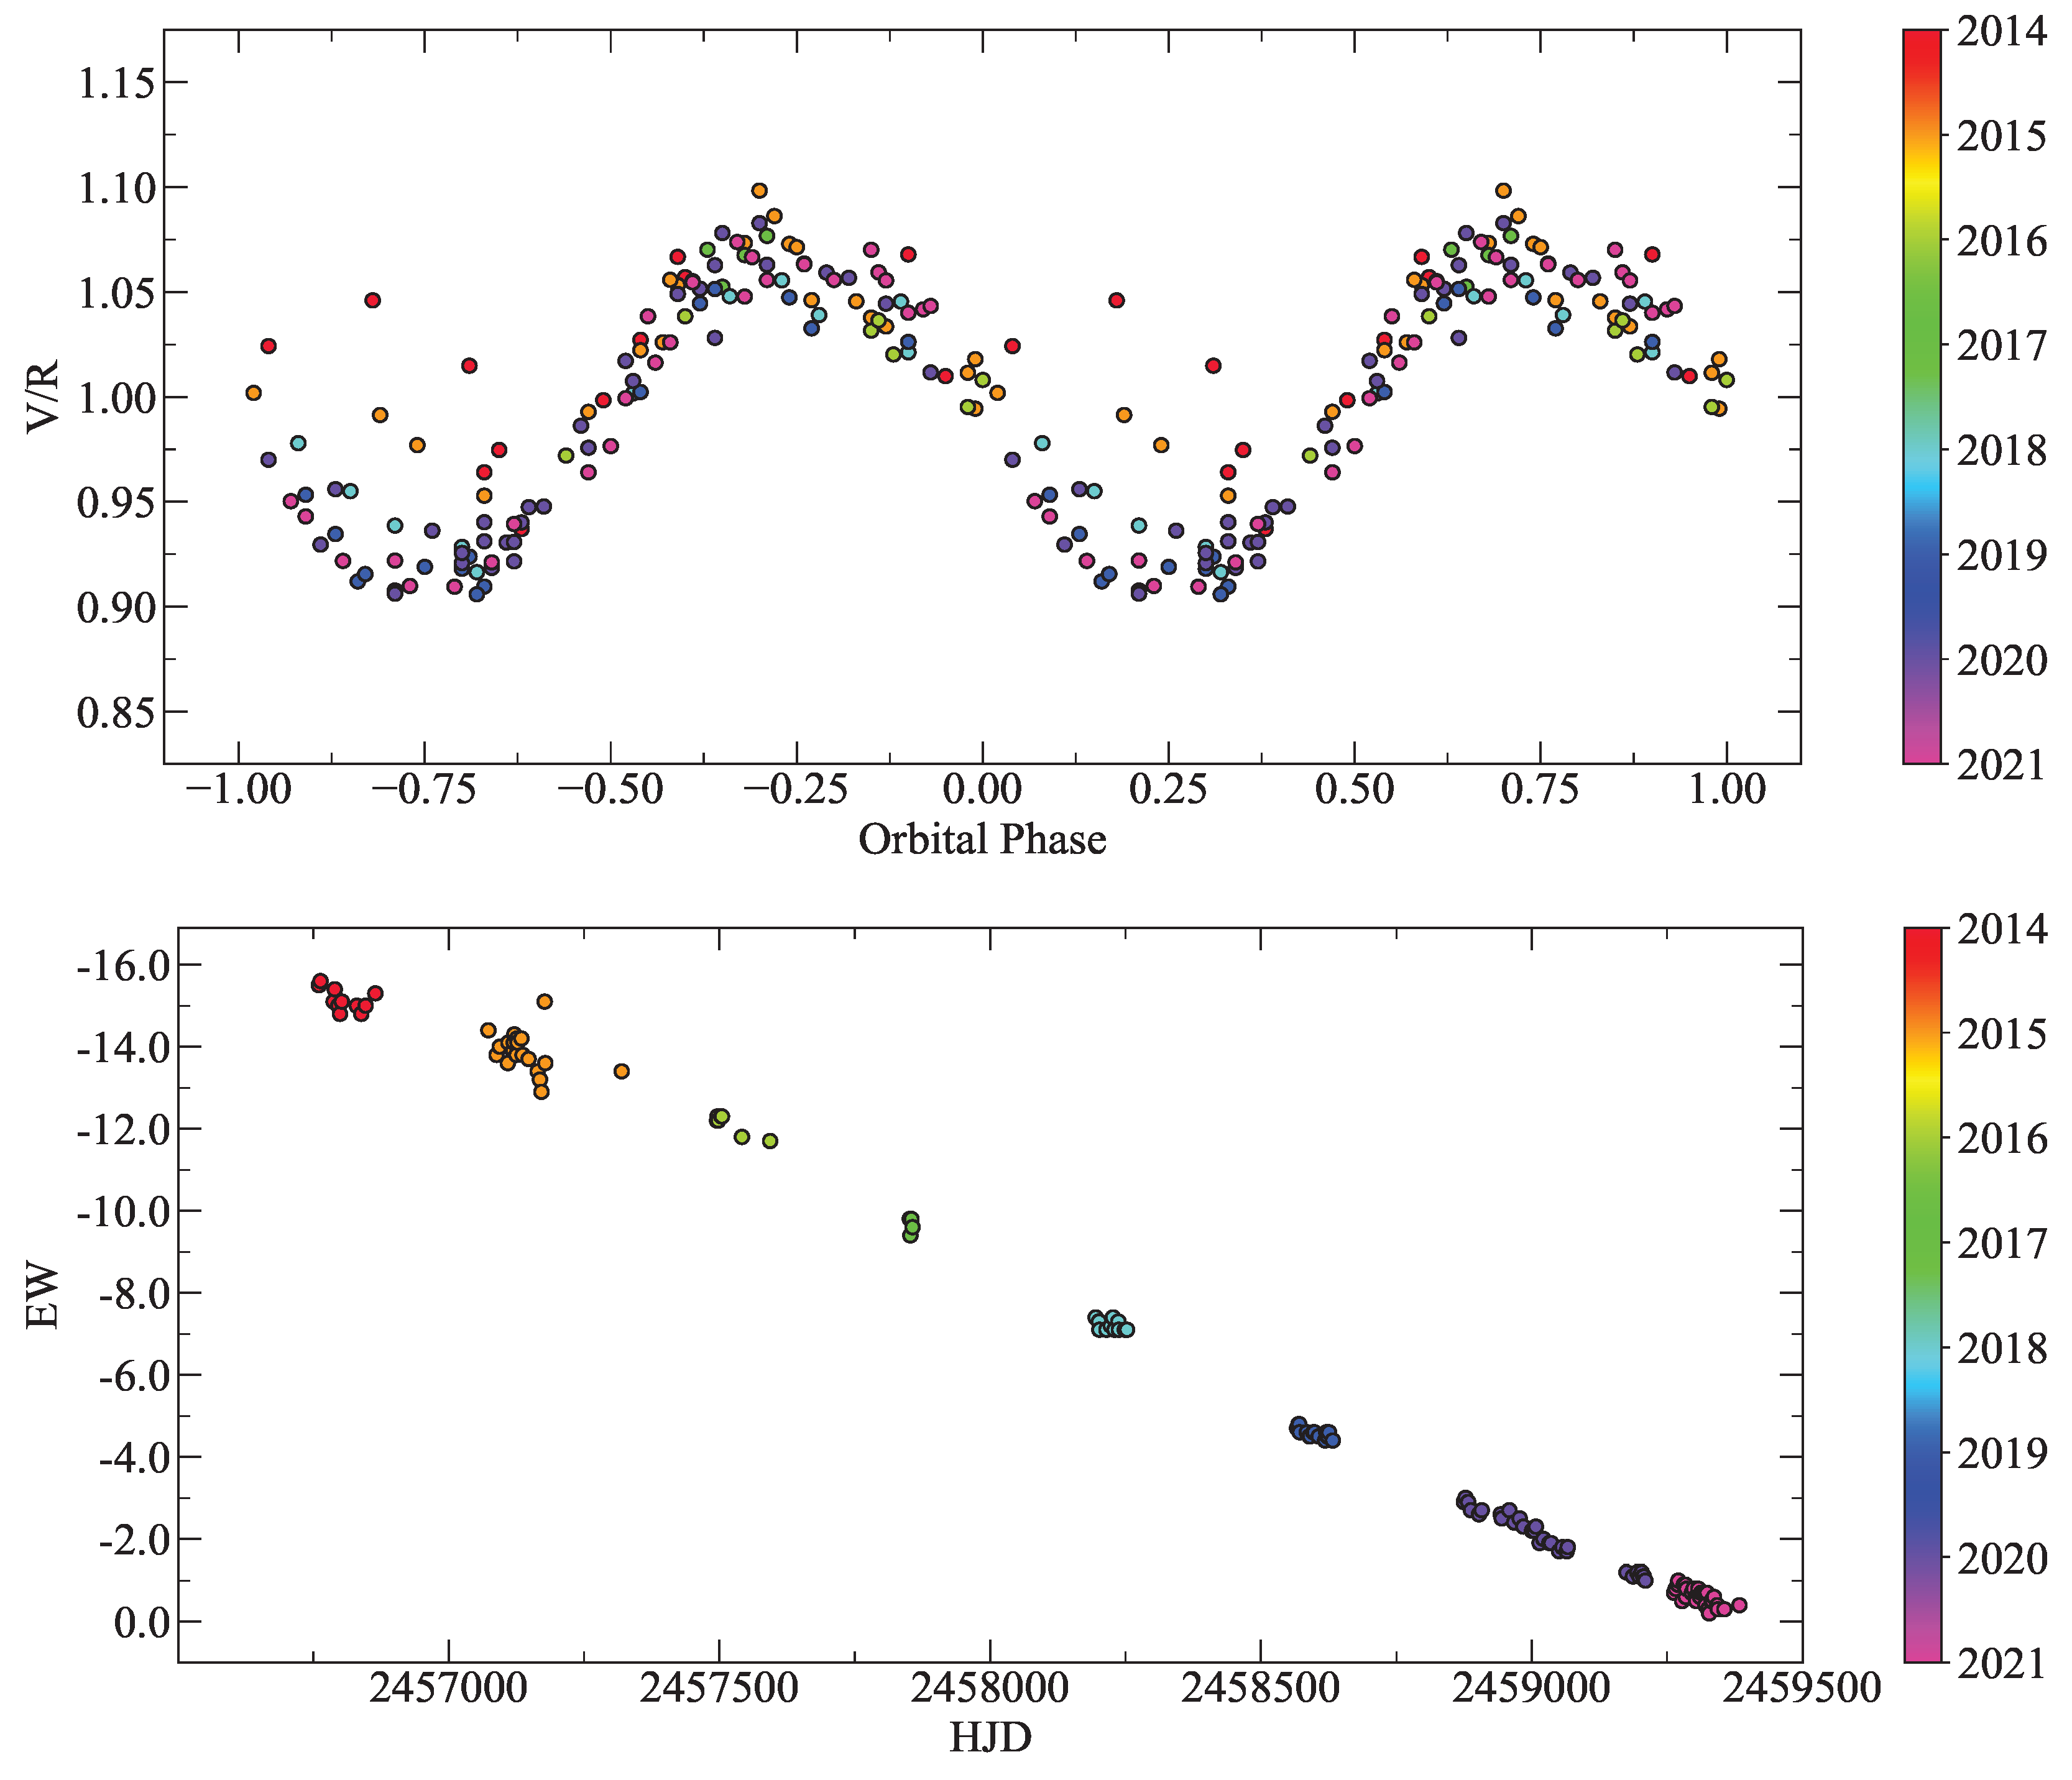
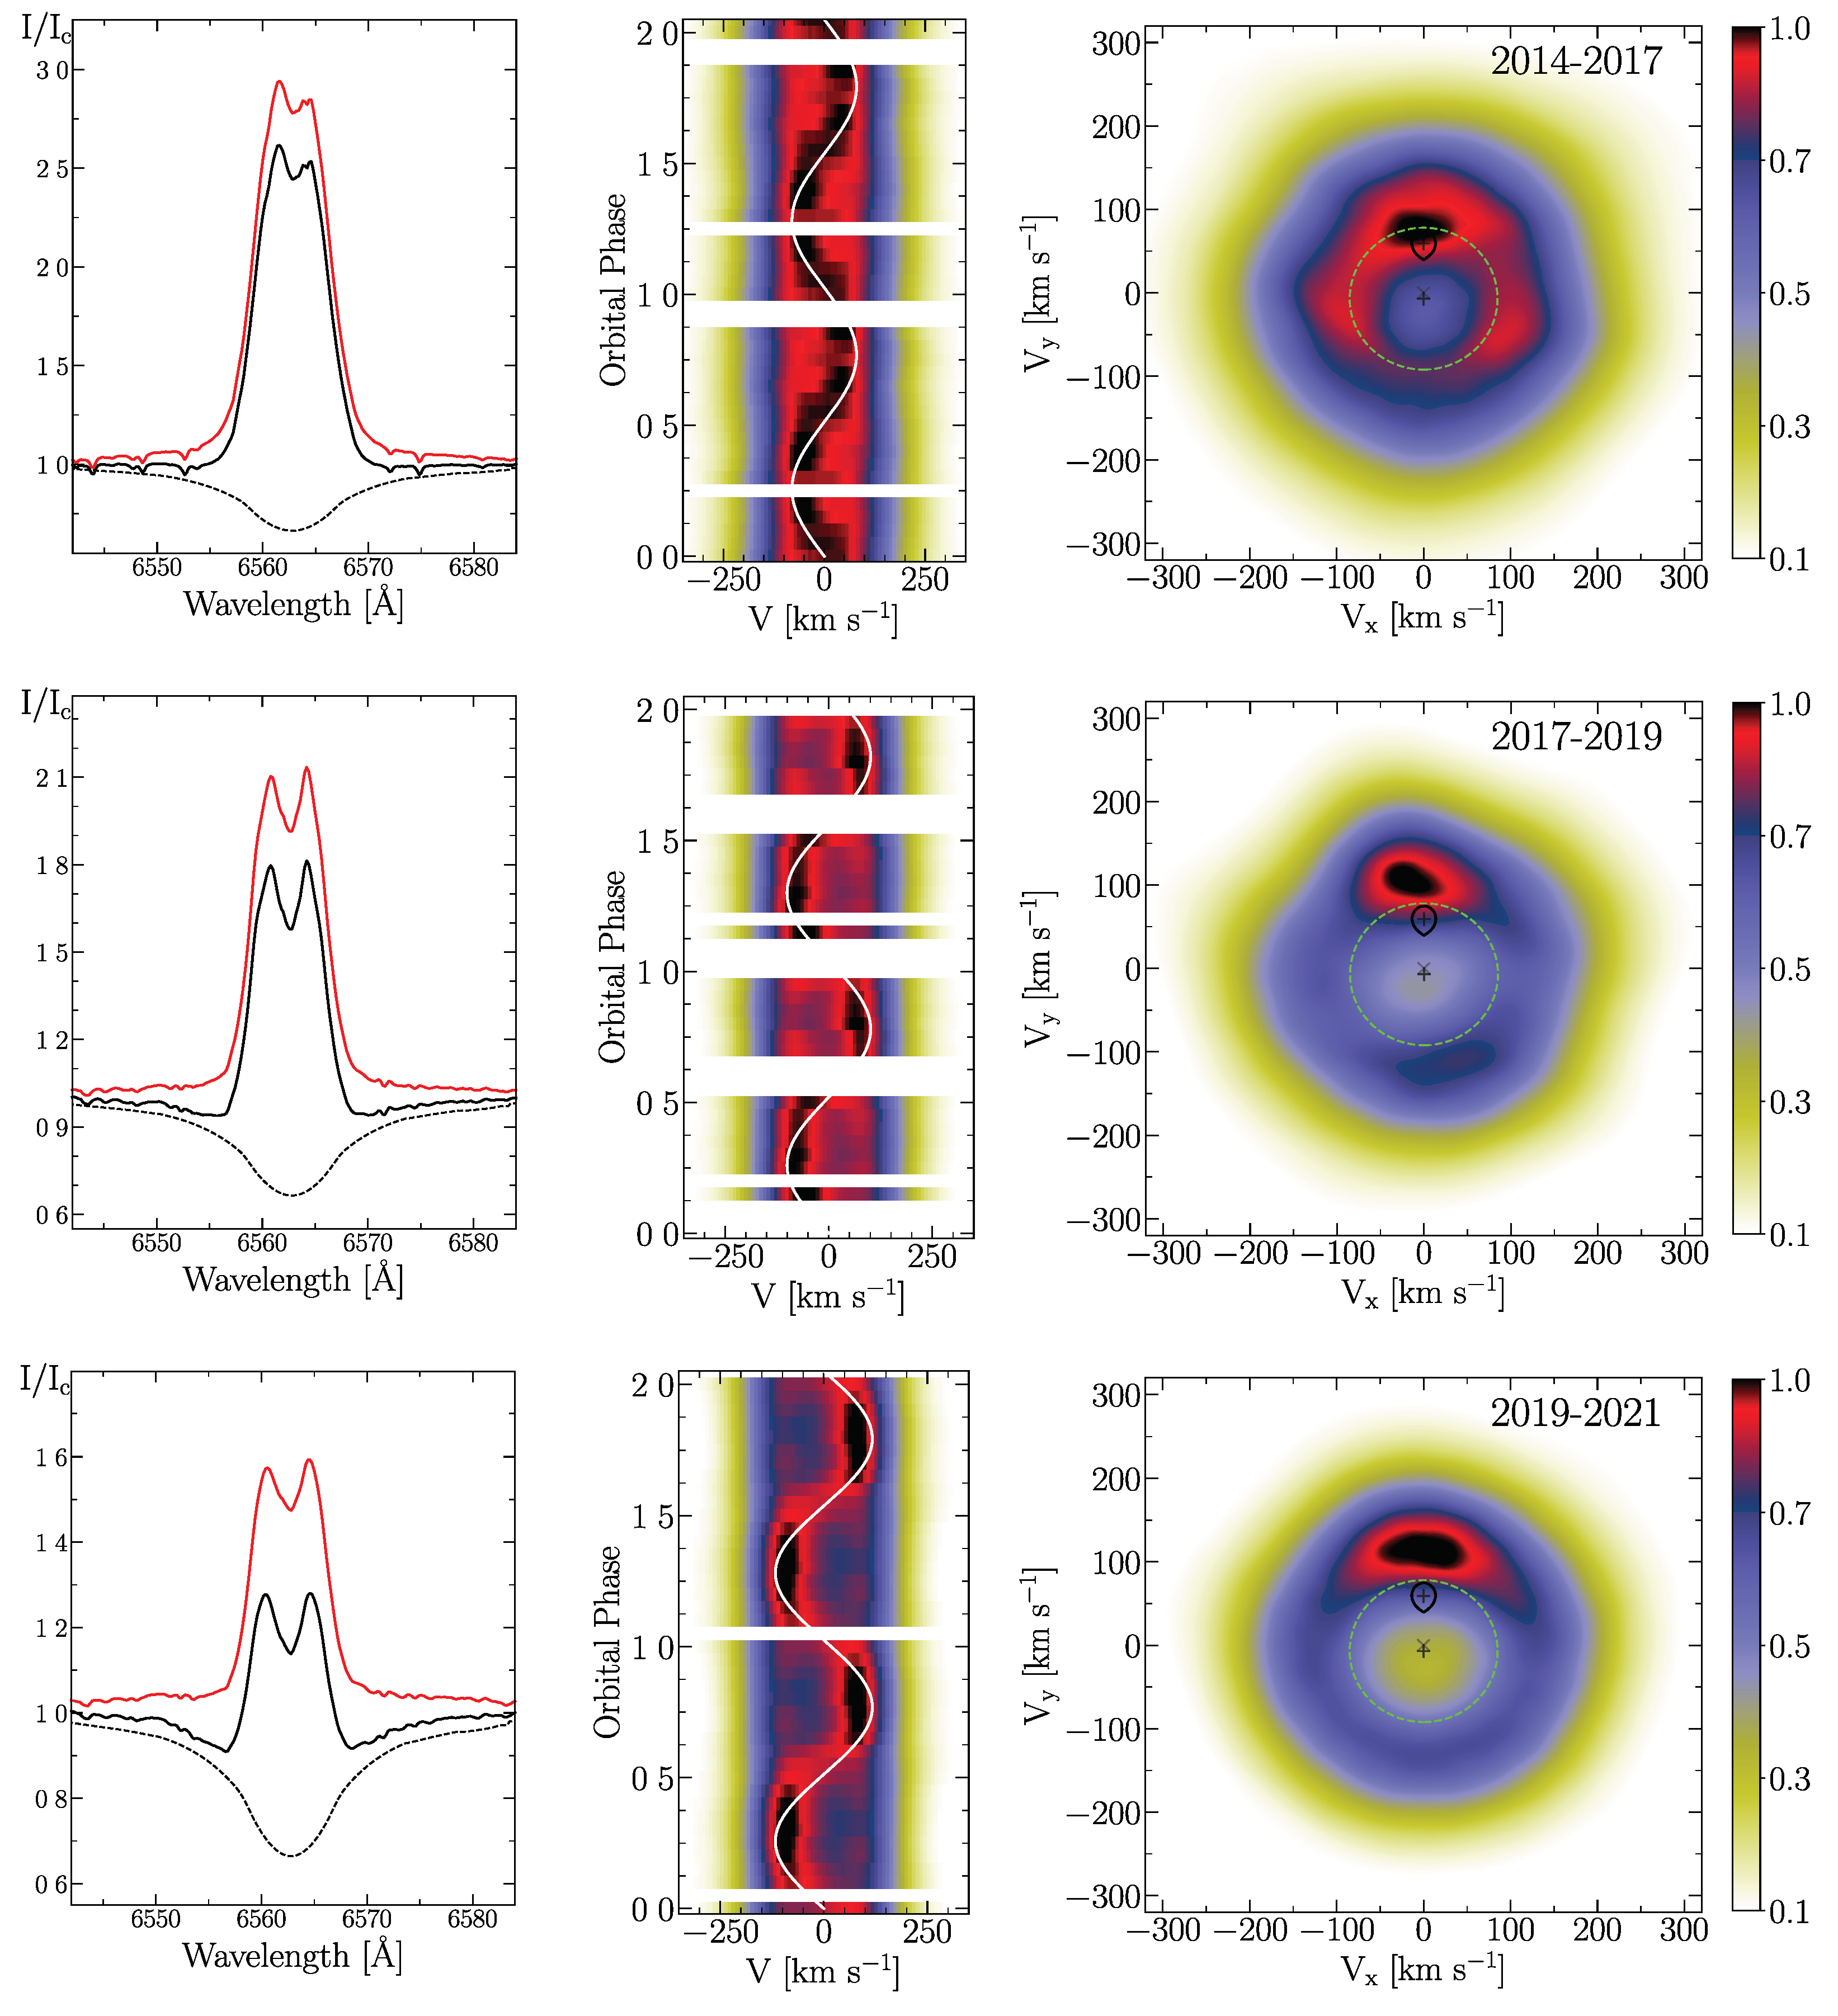
3. Line Evolution and Doppler Tomography
| Parameter | Value |
|---|---|
| P [days] | 61.55 ± 0.04 |
| T0 [HJD] | 2459074.45 ± 0.43 |
| [km ] | -4.86 ± 0.18 |
| [km ] | 6.33 ± 0.25 |
| f() [] | 0.0016 ± 0.0002 |
4. Discussion
5. Conclusions
- Despite the gradual decrease of the H line intensity, its V/R variations remained phase-locked with the orbital period.
- The Doppler maps constructed throughout the disk evolution show the presence of a nearly stable bright emitting region located in the outer part of the disk in the direction of the secondary companion. We suggest that this structure is responsible for the V/R variations observed in the H line profile.
- The origin of the hot spot is most likely related to the forming one-armed spiral structure in the disk, tidal effects, and irradiation from the secondary companion.
Author Contributions
Funding
Data Availability Statement
Acknowledgments
Conflicts of Interest
Abbreviations
References
- Jaschek, M.; Egret, D. Catalog of Be stars. Be Stars; Jaschek, M.; Groth, H.G., Eds., 1982, Vol. 98, p. 261.
- Struve, O. A Study of the Spectra of B Stars. APJ 1931, 74, 225. [Google Scholar] [CrossRef]
- Kriz, S.; Harmanec, P. A Hypothesis of the Binary Origin of Be Stars. Bulletin of the Astronomical Institutes of Czechoslovakia 1975, 26, 65. [Google Scholar]
- Klement, R.; Carciofi, A.C.; Rivinius, T.; Ignace, R.; Matthews, L.D.; Torstensson, K.; Gies, D.; Vieira, R.G.; Richardson, N.D.; Domiciano de Souza, A.; Bjorkman, J.E.; Hallinan, G.; Faes, D.M.; Mota, B.; Gullingsrud, A.D.; de Breuck, C.; Kervella, P.; Curé, M.; Gunawan, D. Prevalence of SED Turndown among Classical Be Stars: Are All Be Stars Close Binaries? APJ 2019, 885, 147. [Google Scholar] [CrossRef]
- Okazaki, A.T. Long-Term V/R Variations of Be Stars Due to Global One-Armed Oscillations of Equatorial Disks. Publ. Astron. Soc. of Japan 1991, 43, 75–94. [Google Scholar]
- Panoglou, D.; Faes, D.M.; Carciofi, A.C.; Okazaki, A.T.; Baade, D.; Rivinius, T.; Borges Fernandes, M. Be discs in coplanar circular binaries: Phase-locked variations of emission lines. Mon. Not. R. Astron. Soc. 2018, 473, 3039–3050. [Google Scholar] [CrossRef]
- Cyr, I.H.; Jones, C.E.; Carciofi, A.C.; Steckel, C.; Tycner, C.; Okazaki, A.T. Spiral density enhancements in Be binary systems. Mon. Not. R. Astron. Soc. 2020, 497, 3525–3536. [Google Scholar] [CrossRef]
- Langer, N.; Baade, D.; Bodensteiner, J.; Greiner, J.; Rivinius, T.; Martayan, C.; Borre, C.C. γ Cas stars: Normal Be stars with discs impacted by the wind of a helium-star companion? A&A 2020, 633, A40. [Google Scholar] [CrossRef]
- Telting, J.H. Long-term Variability in Be-Star disks. IAU Colloq. 175: The Be Phenomenon in Early-Type Stars; Smith, M.A.; Henrichs, H.F.; Fabregat, J., Eds., 2000, Vol. 214, Astronomical Society of the Pacific Conference Series, p. 422.
- Jessup, M.K. Note on the Hydrogen Emission of Kappa Draconis. APJ 1932, 76, 75. [Google Scholar] [CrossRef]
- Juza, K.; Harmanec, P.; Bozic, H.; Pavlovski, K.; Ziznovsky, J.; Tarasov, A.E.; Horn, J.; Koubsky, P. Correlated long-term light, colour and spectral variations of the Be star κ Draconis. A&A Suppl. Ser. 1994, 107, 403–411. [Google Scholar]
- Saad, S.M.; Kubát, J.; Koubský, P.; Harmanec, P.; Škoda, P.; Korčáková, D.; Krtička, J.; Šlechta, M.; Božić, H.; Ak, H.; Hadrava, P.; Votruba, V. Properties and nature of Be stars Dra. XXIII. Long-term variations and physical properties of κ Dra. A&A 2004, 419, 607–621. [Google Scholar] [CrossRef]
- Juza, K.; Harmanec, P.; Hill, G.M.; Tarasov, A.E.; Matthews, J.M.; Tuominen, I.; Yang, S. Properties and Nature of Be Stars. 16. Closer to a Solution of the Puzzle of 5 κ Dra? Bulletin of the Astronomical Institutes of Czechoslovakia 1991, 42, 39. [Google Scholar]
- Saad, S.M.; Kubát, J.; Hadrava, P.; Harmanec, P.; Koubský, P.; Škoda, P.; Šlechta, M.; Korčáková, D.; Yang, S. Spectrum Disentangling and Orbital Solution for κ Dra. Astrophys. Space Sci. 2005, 296, 173–177. [Google Scholar] [CrossRef]
- Miroshnichenko, A.S.; Chari, R.; Danford, S.; Prendergast, P.; Aarnio, A.N.; Andronov, I.L.; Chinarova, L.L.; Lytle, A.; Amantayeva, A.; Gabitova, I.A.; Vaidman, N.L.; Baktybayev, S.S.; Khokhlov, S.A. Searching for Phase-Locked Variations of the Emission-Line Profiles in Binary Be Stars. Galaxies 2023, 11, 83. [Google Scholar] [CrossRef]
- Klement, R.; Baade, D.; Rivinius, T.; Gies, D.R.; Wang, L.; Labadie-Bartz, J.; Ticiani dos Santos, P.; Monnier, J.D.; Carciofi, A.C.; Mérand, A.; Anugu, N.; Schaefer, G.H.; Le Bouquin, J.B.; Davies, C.L.; Ennis, J.; Gardner, T.; Kraus, S.; Setterholm, B.R.; Labdon, A. Dynamical Masses of the Primary Be Star and Secondary sdB Star in the Single-lined Binary κ Dra (B6 IIIe). APJ 2022, 940, 86. [Google Scholar] [CrossRef]
- Marsh, T.R.; Horne, K. Images of accretion discs - II. Doppler tomography. Mon. Not. R. Astron. Soc. 1988, 235, 269–286. [Google Scholar] [CrossRef]
- Miroshnichenko, A.S.; Danford, S.; Andronov, I.L.; Aarnio, A.N.; Lauer, D.; Buroughs, H. Refining Orbits of Bright Binary Systems. Galaxies 2023, 11, 8. [Google Scholar] [CrossRef]
- Saad, S.M.; Nouh, M.I.; Shokry, A.; Zead, I. A Study of the Time Variability and Line Profile Variations of κ Dra. Rev. Mexicana Astron. Astroph. 2021, 57, 91–105. [Google Scholar] [CrossRef]
- Zharikov, S.V.; Miroshnichenko, A.S.; Pollmann, E.; Danford, S.; Bjorkman, K.S.; Morrison, N.D.; Favaro, A.; Guarro Fló, J.; Terry, J.N.; Desnoux, V.; Garrel, T.; Martineau, G.; Buchet, Y.; Ubaud, S.; Mauclaire, B.; Kalbermatten, H.; Buil, C.; Sawicki, C.J.; Blank, T.; Garde, O. Doppler tomography of the circumstellar disk of π Aquarii. A&A 2013, 560, A30. [Google Scholar] [CrossRef]
- Spruit, H.C. Fast maximum entropy Doppler mapping. arXiv e-prints 1998, astro–ph/9806141. [Google Scholar] [CrossRef]
- Gray, R.O. SPECTRUM: A stellar spectral synthesis program. Astrophysics Source Code Library, record ascl:9910.002, 1999.
- Castelli, F.; Kurucz, R.L. New Grids of ATLAS9 Model Atmospheres. Modelling of Stellar Atmospheres; Piskunov, N.; Weiss, W.W.; Gray, D.F., Eds., 2003, Vol. 210, p. A20. arXiv:astro-ph/astro-ph/0405087. [CrossRef]
- Paczynski, B. A model of accretion disks in close binaries. APJ 1977, 216, 822–826. [Google Scholar] [CrossRef]
- Wang, L.; Gies, D.R.; Peters, G.J. Detection of Additional Be+sdO Systems from IUE Spectroscopy. APJ 2018, 853, 156. [Google Scholar] [CrossRef]
- Bjorkman, K.S.; Miroshnichenko, A.S.; McDavid, D.; Pogrosheva, T.M. A Study of π Aquarii during a Quasi-normal Star Phase: Refined Fundamental Parameters and Evidence for Binarity. APJ 2002, 573, 812–824. [Google Scholar] [CrossRef]
- Klement, R.; Rivinius, T.; Gies, D.R.; Baade, D.; Mérand, A.; Monnier, J.D.; Schaefer, G.H.; Lanthermann, C.; Anugu, N.; Kraus, S.; Gardner, T. The CHARA Array Interferometric Program on the Multiplicity of Classical Be Stars: New Detections and Orbits of Stripped Subdwarf Companions. APJ 2024, 962, 70. [Google Scholar] [CrossRef]
- Porter, J.M.; Rivinius, T. Classical Be Stars. Publ. Astron. Soc. of the Pacific 2003, 115, 1153–1170. [Google Scholar] [CrossRef]
- Hummel, W.; Hanuschik, R.W. Line formation in Be star envelopes. II. Disk oscillations. A&A 1997, 320, 852–864. [Google Scholar]
- Mennickent, R.E.; Vogt, N. V/R variations in H-beta emission profiles of Be stars. A&A 1991, 241, 159. [Google Scholar]
| 1 |


| Observation periods | v | ||||
|---|---|---|---|---|---|
| [km ] | [km ] | [km ] | [km ] | [] | |
| 2014-2017 | -4 ± 52 | 80 ± 52 | 80 ± 74 | 104 ± 97 | 64 |
| 2017-2019 | -13 ± 35 | 100 ± 28 | 101 ± 45 | 132 ± 59 | 40 |
| 2019-2021 | 1 ± 36 | 117 ± 28 | 117 ± 46 | 153 ± 60 | 30 |
Disclaimer/Publisher’s Note: The statements, opinions and data contained in all publications are solely those of the individual author(s) and contributor(s) and not of MDPI and/or the editor(s). MDPI and/or the editor(s) disclaim responsibility for any injury to people or property resulting from any ideas, methods, instructions or products referred to in the content. |
© 2024 by the authors. Licensee MDPI, Basel, Switzerland. This article is an open access article distributed under the terms and conditions of the Creative Commons Attribution (CC BY) license (http://creativecommons.org/licenses/by/4.0/).


