1. Introduction
In the deserts, the camels hold irreplaceable significance for rangeland ecology [
1] and food production [
2]. Camels have evolved unique traits and physiological mechanisms to thrive in arid climates, with dromedary and Bactrian camels adapting to these environments [
3,
4]. Camels provide the necessary physiological conditions for microbial growth as they rely on these microbes for the digestion of shrubs and nutrient supply [
5]. However, camels possess a distinct gastrointestinal system consisting of the rumen, reticulum, and abomasum but lacking the omasum, which suggests that their gastrointestinal microbiome is likely distinct [
6].
The gut microbiome and its metabolites have a significant impact on host health, immunity, metabolism, and neurobehavioral traits in mammals [
7,
8]. Conversely, environmental factors such as diet, host genetics, age, gender, and animal health influence the composition of the microbial community both quantitatively and qualitatively [
9,
10]. The gastrointestinal microbial communities of cattle [
11,
12] and sheep [
13,
14] have been well studied. In camels, it investigates the key species or enzymes contributing to lignocellulose degradation using metagenomic analysis [
15], and the sex differences in fecal microbiome are investigated in dromedary camels [
16].
Parity, the number of times a female has given birth, has long-term implications for women’s physical and mental health [
17]. Previous research has examined the negative relationship between parity and pancreatic cancer risk [
18], as well as the positive relationship between maternal parity and the risk of congenital heart defects [
19]. In dairy cattle, the ruminal bacterial communities exhibit similar diversity between the first and second lactation cycles [
20]. However, in first lactation dairy cows, Bacteroidetes contribute to the majority of metabolic functions, while Firmicutes and Proteobacteria increase in abundance during the second and third lactation cycles [
21]. In sows, it identified that parity as an important environmental factor that modulates the gut microbiome, and that potential pathogenic bacteria become increasingly enriched with increasing parity [
22]. Similarly, higher parities are linked with increased risks of individual mortality, the number of piglets born alive, and the number of piglets born weaned compared to lower parities [
23].
In camels, it revealed that parity significantly effects on camel milk components, wherein proteins, free fatty acid, and solid not fat was markedly affected by parity under traditional rangeland management system [
24]. However, the linkages between camel production, or reproduction performance, or gastrointestinal microbial ecology and parity remains largely unexploited. Therefore, this study aims to characterize the differences among fecal microbial community in lactating Bactrian camels. To achieve this, 16S rDNA sequencing was employed to explore the differences in the fecal microbial community and its functions among camels in the 1st parity, 3rd parity, and 5th parity groups.
2. Materials and Methods
This study was carried out in accordance with the recommendations of the Instructive Notions with Respect to Caring for Experimental Animals of the Ministry of Technology of China. The protocol was approved by the Ethics Committee of the Hetao College.
2.1. Experimental Design, Animals, and Sample Collection
The Bactrian lactating camels included in this research were obtained from Yinggesu Biotechnology Co. Ltd., located in Wulatehou Banner, Bayannur City, Inner Mongolia Autonomous Region, China. The camels were randomly selected as three groups: P_1 (10 female lactating camels, 1st parity), P_3 (10 female lactating camels, 3rd parity), and P_5 (10 female lactating camels, 5th parity). The camels grazed on natural pastoral conditions where the main vegetation belongs to Amaranthaceae, Fabaceae, Zygophyllaceae, and Liliaceae. They are capable of ingest shrubs, such as Caragana tibetica, Haloxylon ammodendron, Caragana korshinskii, and Sarcozygium xanthoxylon. Individual fecal samples were obtained from lactating camels by collecting the feces from each camel into sterile frozen tubes (falcon™ 10 mL conical). The collected fecal samples were then stored at a temperature of –80 °C until the whole DNA extraction process was conducted.
2.2. Microbial DNA Extraction and PCR Amplification
The total genomic DNA from the samples was extracted using the hexadecyltrimethylammonium bromide method. The concentration and purity of the DNA were assessed using 1% agarose gels and Nanodrop spectrophotometer (Thermo Fisher Scientific, Madison, Wisconsin, USA). Based on the concentration, the DNA was diluted to a concentration of 1 ng/µL using sterile water. The 16S rRNA genes, specifically the V3-V4 regions, were amplified using the specific primers 341F (5'-CCTAYGGGRBGCASCAG-3’) and 806R (5'-GGACTACNNGGGTATCTAAT-3’) with barcodes. All PCR reactions were performed using 15 µL of Phusion® High-Fidelity PCR Master Mix (New England Biolabs), 2 µM of forward and reverse primers, and approximately 10 ng of template DNA. The thermal cycling protocol included an initial denaturation step at 98 °C for 1 min, followed by 30 cycles of denaturation at 98 °C for 10 s, annealing at 50 °C for 30 s, and elongation at 72 °C for 30 s, with a final extension step at 72 °C for 5 min. The PCR products were then mixed with an equal volume of buffer and subjected to electrophoresis on a 2% agarose gel for detection. The PCR products with equidensity ratios were pooled together, and the mixture was purified using Universal DNA purification kits (TianGen, Tianjin, China). The PCR was performed in three technical replicates for each individual sample.
2.3. Libraries Generated, Illumina NovaSeq Sequencing, Bioinformatics and Statistical Analysis
The NEB Next® Ultra DNA Library Prep Kit (Illumina, San Diego, CA) was utilized to generate sequencing libraries following the manufacturer’s guidelines. Index codes were added to the libraries. The quality of the libraries was evaluated using the Agilent 5400 system (Agilent Technologies Co Ltd., Santa Clara, CA). Finally, the libraries were sequenced on an Illumina NovaSeq platform (Illumina, San Diego, CA), resulting in the generation of 250 bp paired-end reads.
The analysis was performed following the “Atacama soil microbiome tutorial” provided in the Quantitative Insights into Microbial Ecology (QIIME2) documentation, along with customized program scripts (
https://docs.qiime2.org/2019.1/). Normalization was conducted on the read counts before downstream analysis using the Shapiro-Wilk test. In summary, the raw data FASTQ files were imported into a format compatible with the QIIME2 system using the QIIME tools import program. The demultiplexed sequences from each sample underwent quality filtering, trimming, de-noising, and merging. The QIIME2 dada2 plugin was utilized to identify and eliminate chimeric sequences, resulting in the generation of an Amplicon Sequence Variants (ASVs) feature table [
25]. To assign taxonomic classifications, the QIIME2 feature-classifier plugin was employed to align the ASVs to a pre-trained GREENGENES 13_8 99% database (trimmed to the V3-V4 region defined by the 338F/806R primer pair), producing a taxonomy table [
26]. The QIIME2 feature-table plugin was used to remove any mitochondrial and chloroplast sequences that could potentially contaminate the analysis. Unless otherwise specified, default parameters were employed for the analysis. Additionally, the potential functional profiles of the microbial communities, including Kyoto Encyclopedia of Genes and Genomics (KEGG) pathways, and Enzyme Commission (EC) annotations, were predicted using Phylogenetic Investigation of Communities by Reconstruction of Unobserved States (PICRUSt) [
27].
Diversity metrics were calculated using the core-diversity plugin in QIIME2. Alpha diversity indices at the feature level, including observed operational taxonomic units (OTUs), Shannon diversity index, and Faith’s phylogenetic diversity index, were computed to assess the microbial diversity within each sample. The Wilcox_Test was employed to evaluate the significance between the groups. For assessing the structural variation of microbial communities across samples, beta diversity distance measurements, specifically weighted UniFrac, were performed. Principal coordinate analysis (PCoA) of the rumen microbial communities was performed using FactoMineR package and visualized by using the ggplot2 package in R software (version 3.5.2). Permutational multivariate analysis (PERMANOVA) and analysis of similarities (ANOSIM) based on QIIME2’s “qiime diversity beta-group-significance” order conducted. The relative abundances of the microbes, KEGG, and ECs ranked by QIIME, and visualized by ggplot2 package in R.
The statistical analysis accounted for multiple testing correction to avoid false positives. To identify taxa with differing abundances among groups, Linear discriminant analysis (LDA) analysis was employed, and the significant different defined as LDA > 4 and P < 0.05. The results were presented using a bar graph and a cladogram. Significant analyses (P < 0.05) of KEGG pathways at Level 3 and ECs at Level 3 were conducted using analysis of variance (ANOVA) and Duncan’s test to compare the groups. Additionally, principal component analysis (PCA) of all the samples was performed using the FactoMineR package and visualized using the ggplot2 package in R. Finally, Spearman’s rank correlations were calculated to explore the relationships between significantly changed taxa or ECs and significantly changed KEGG pathways, and these correlations were visualized using the pheatmap package in R. Significant correlations (P < 0.05), highly significant correlations (P < 0.01), and extremely significant correlations (P < 0.001).
4. Discussion
The Camelidae family comprises the Bactrian camel (Camelus bactrianus), the dromedary camel (Camelus dromedarius), and four species of South American camelids: llama (Lama glama), alpaca (Lama pacos) guanaco (Lama guanicoe), and vicuña (Vicugna vicugna) [
28]. The main characteristic of Bactrian and dromedary camels is their ability to cope with hard climatic conditions in deserts, with distinctive physiological and adaptive traits [
29]. The camels hold significant cultural significance and has been a vital contributor to the arid-land ecological sustainable development, while there has been an increase in the breeding and management of camels for the purpose of milk production [
30].
In both fecal and rumen microbial communities of adult Bactrian camels, the dominant phyla predominantly comprise Firmicutes, Verrucomicrobia, and Bacteroidetes [
31]. Another study demonstrated that the fecal microbiota of Bactrian camels at 1 and 3 years of age were primarily dominated by the same phyla [
32]. In the current study, these three phyla were also found to be most abundant in Bactrian camel feces. It is suggested that the unique gastrointestinal microbiome of Bactrian camels is due to their distinct digestive systems, and the fecal microbial communities of both domestic and wild Bactrian camels cluster together [
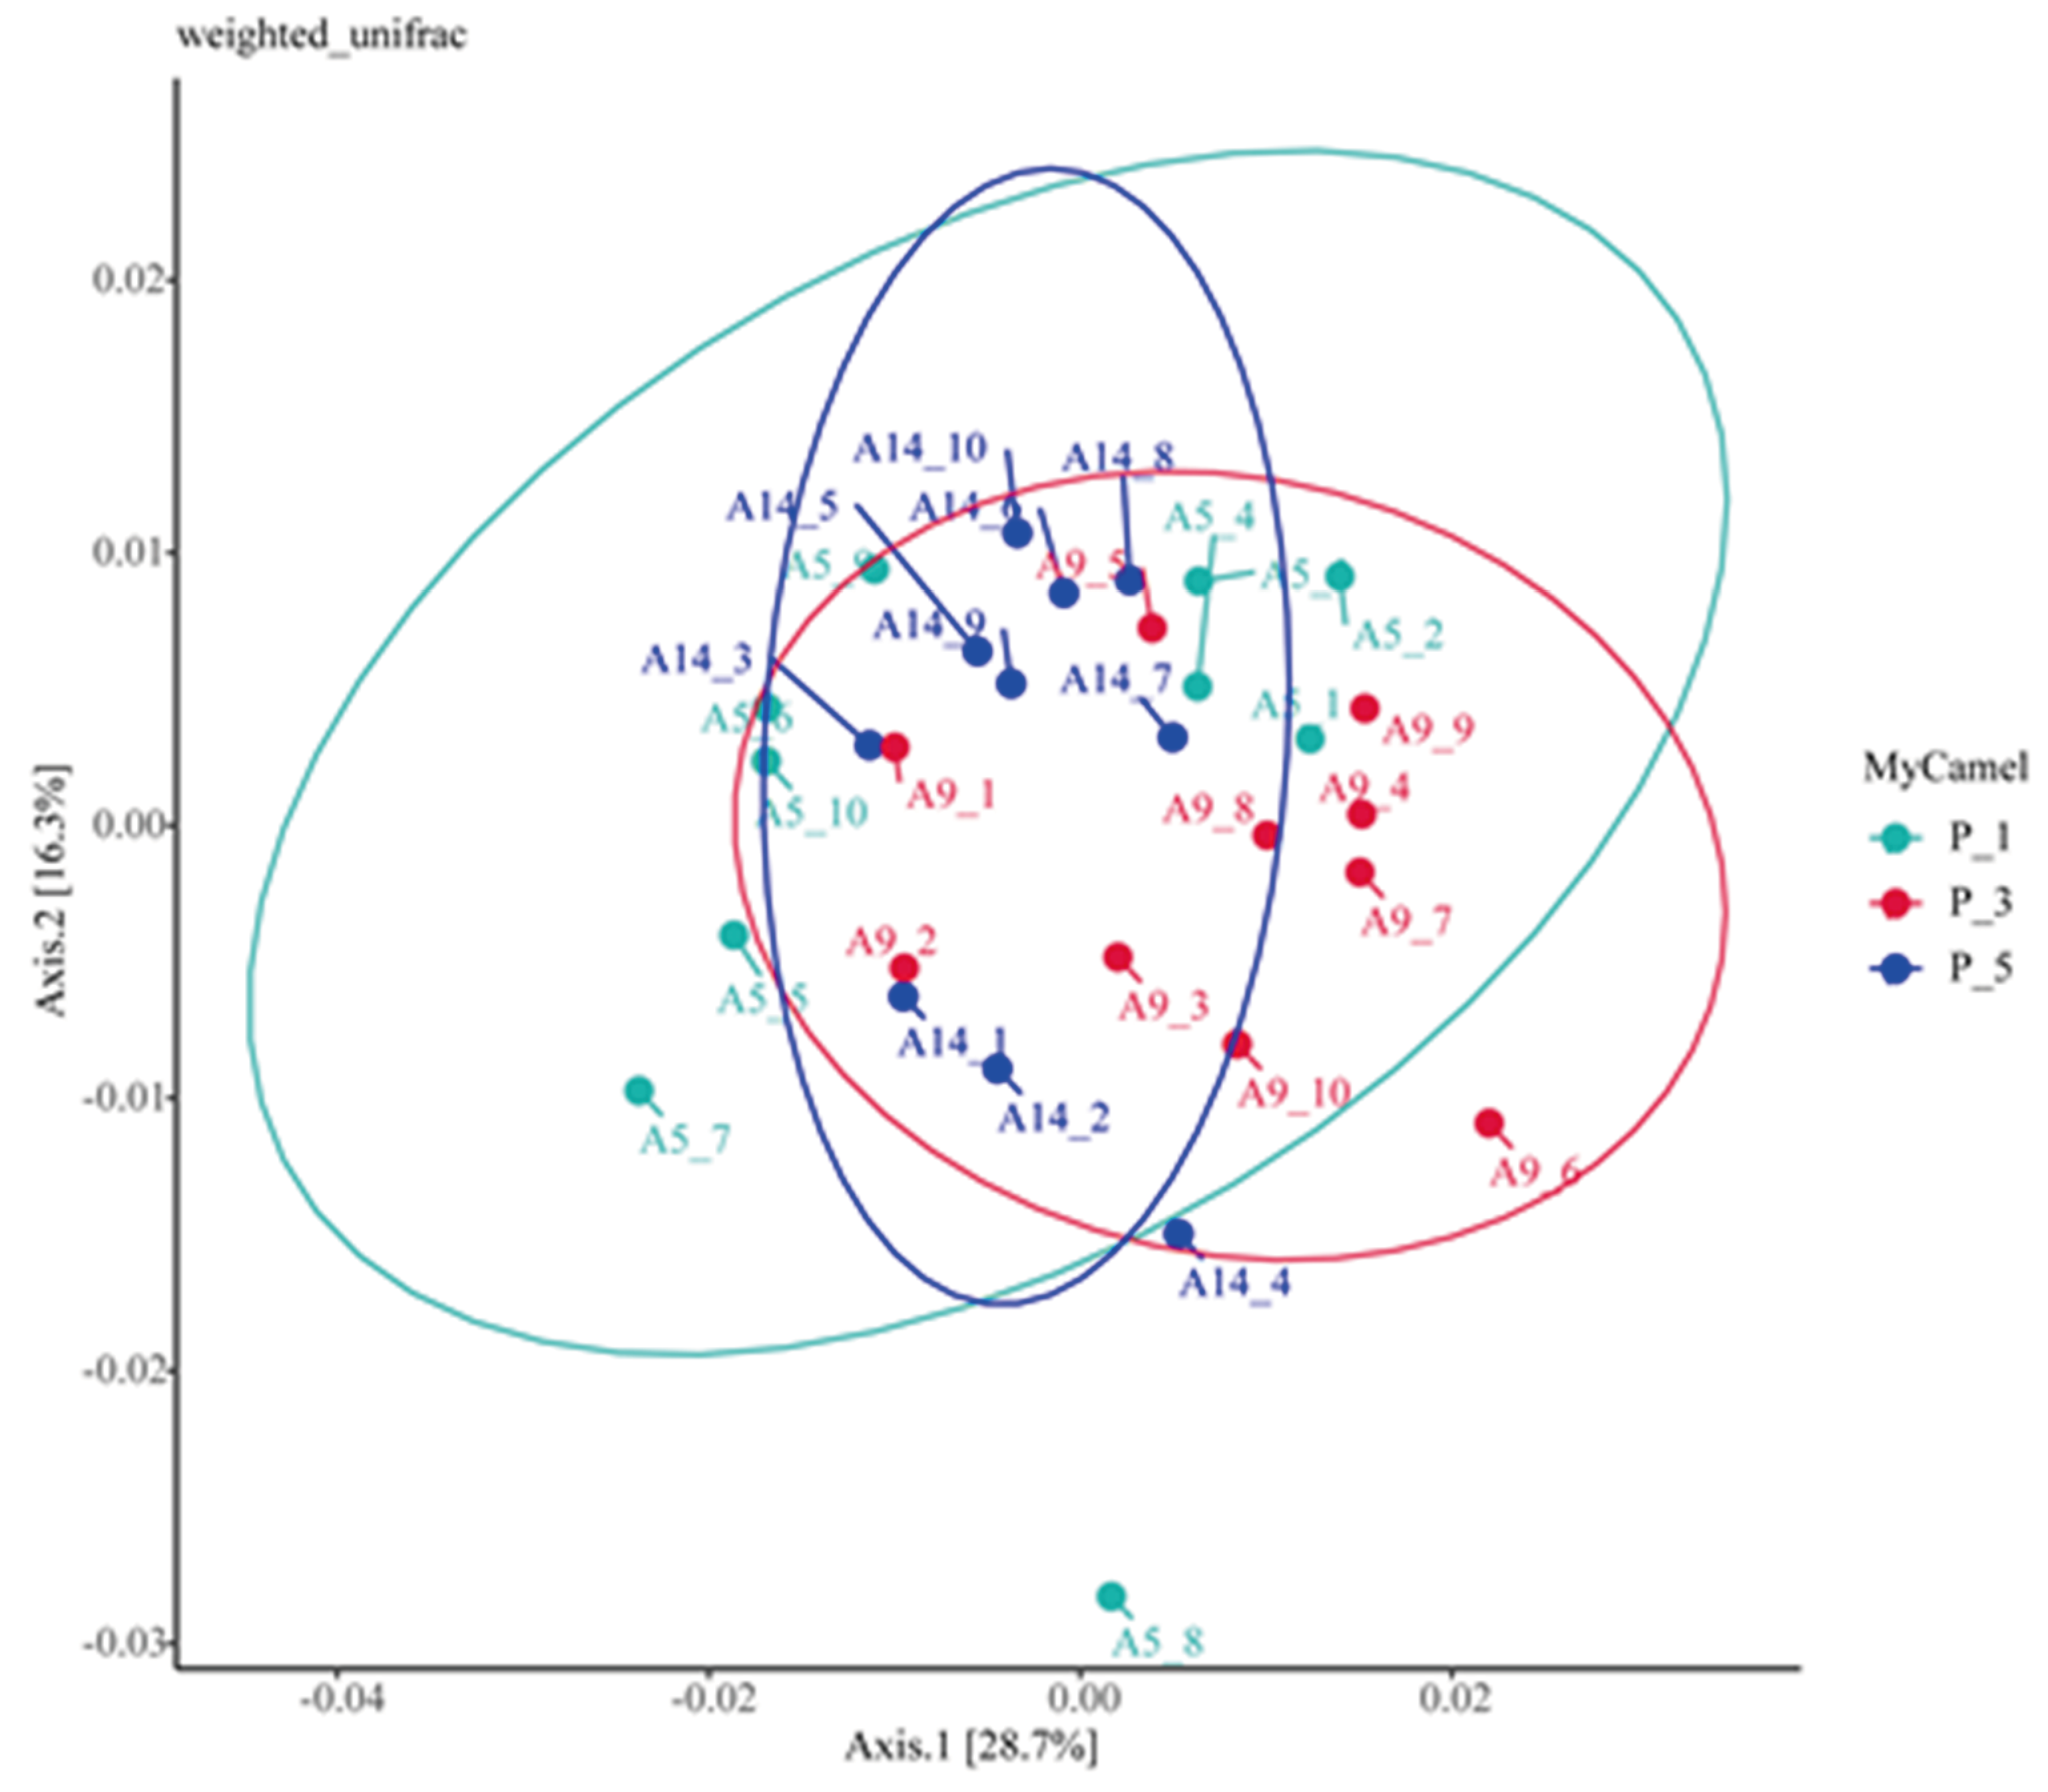
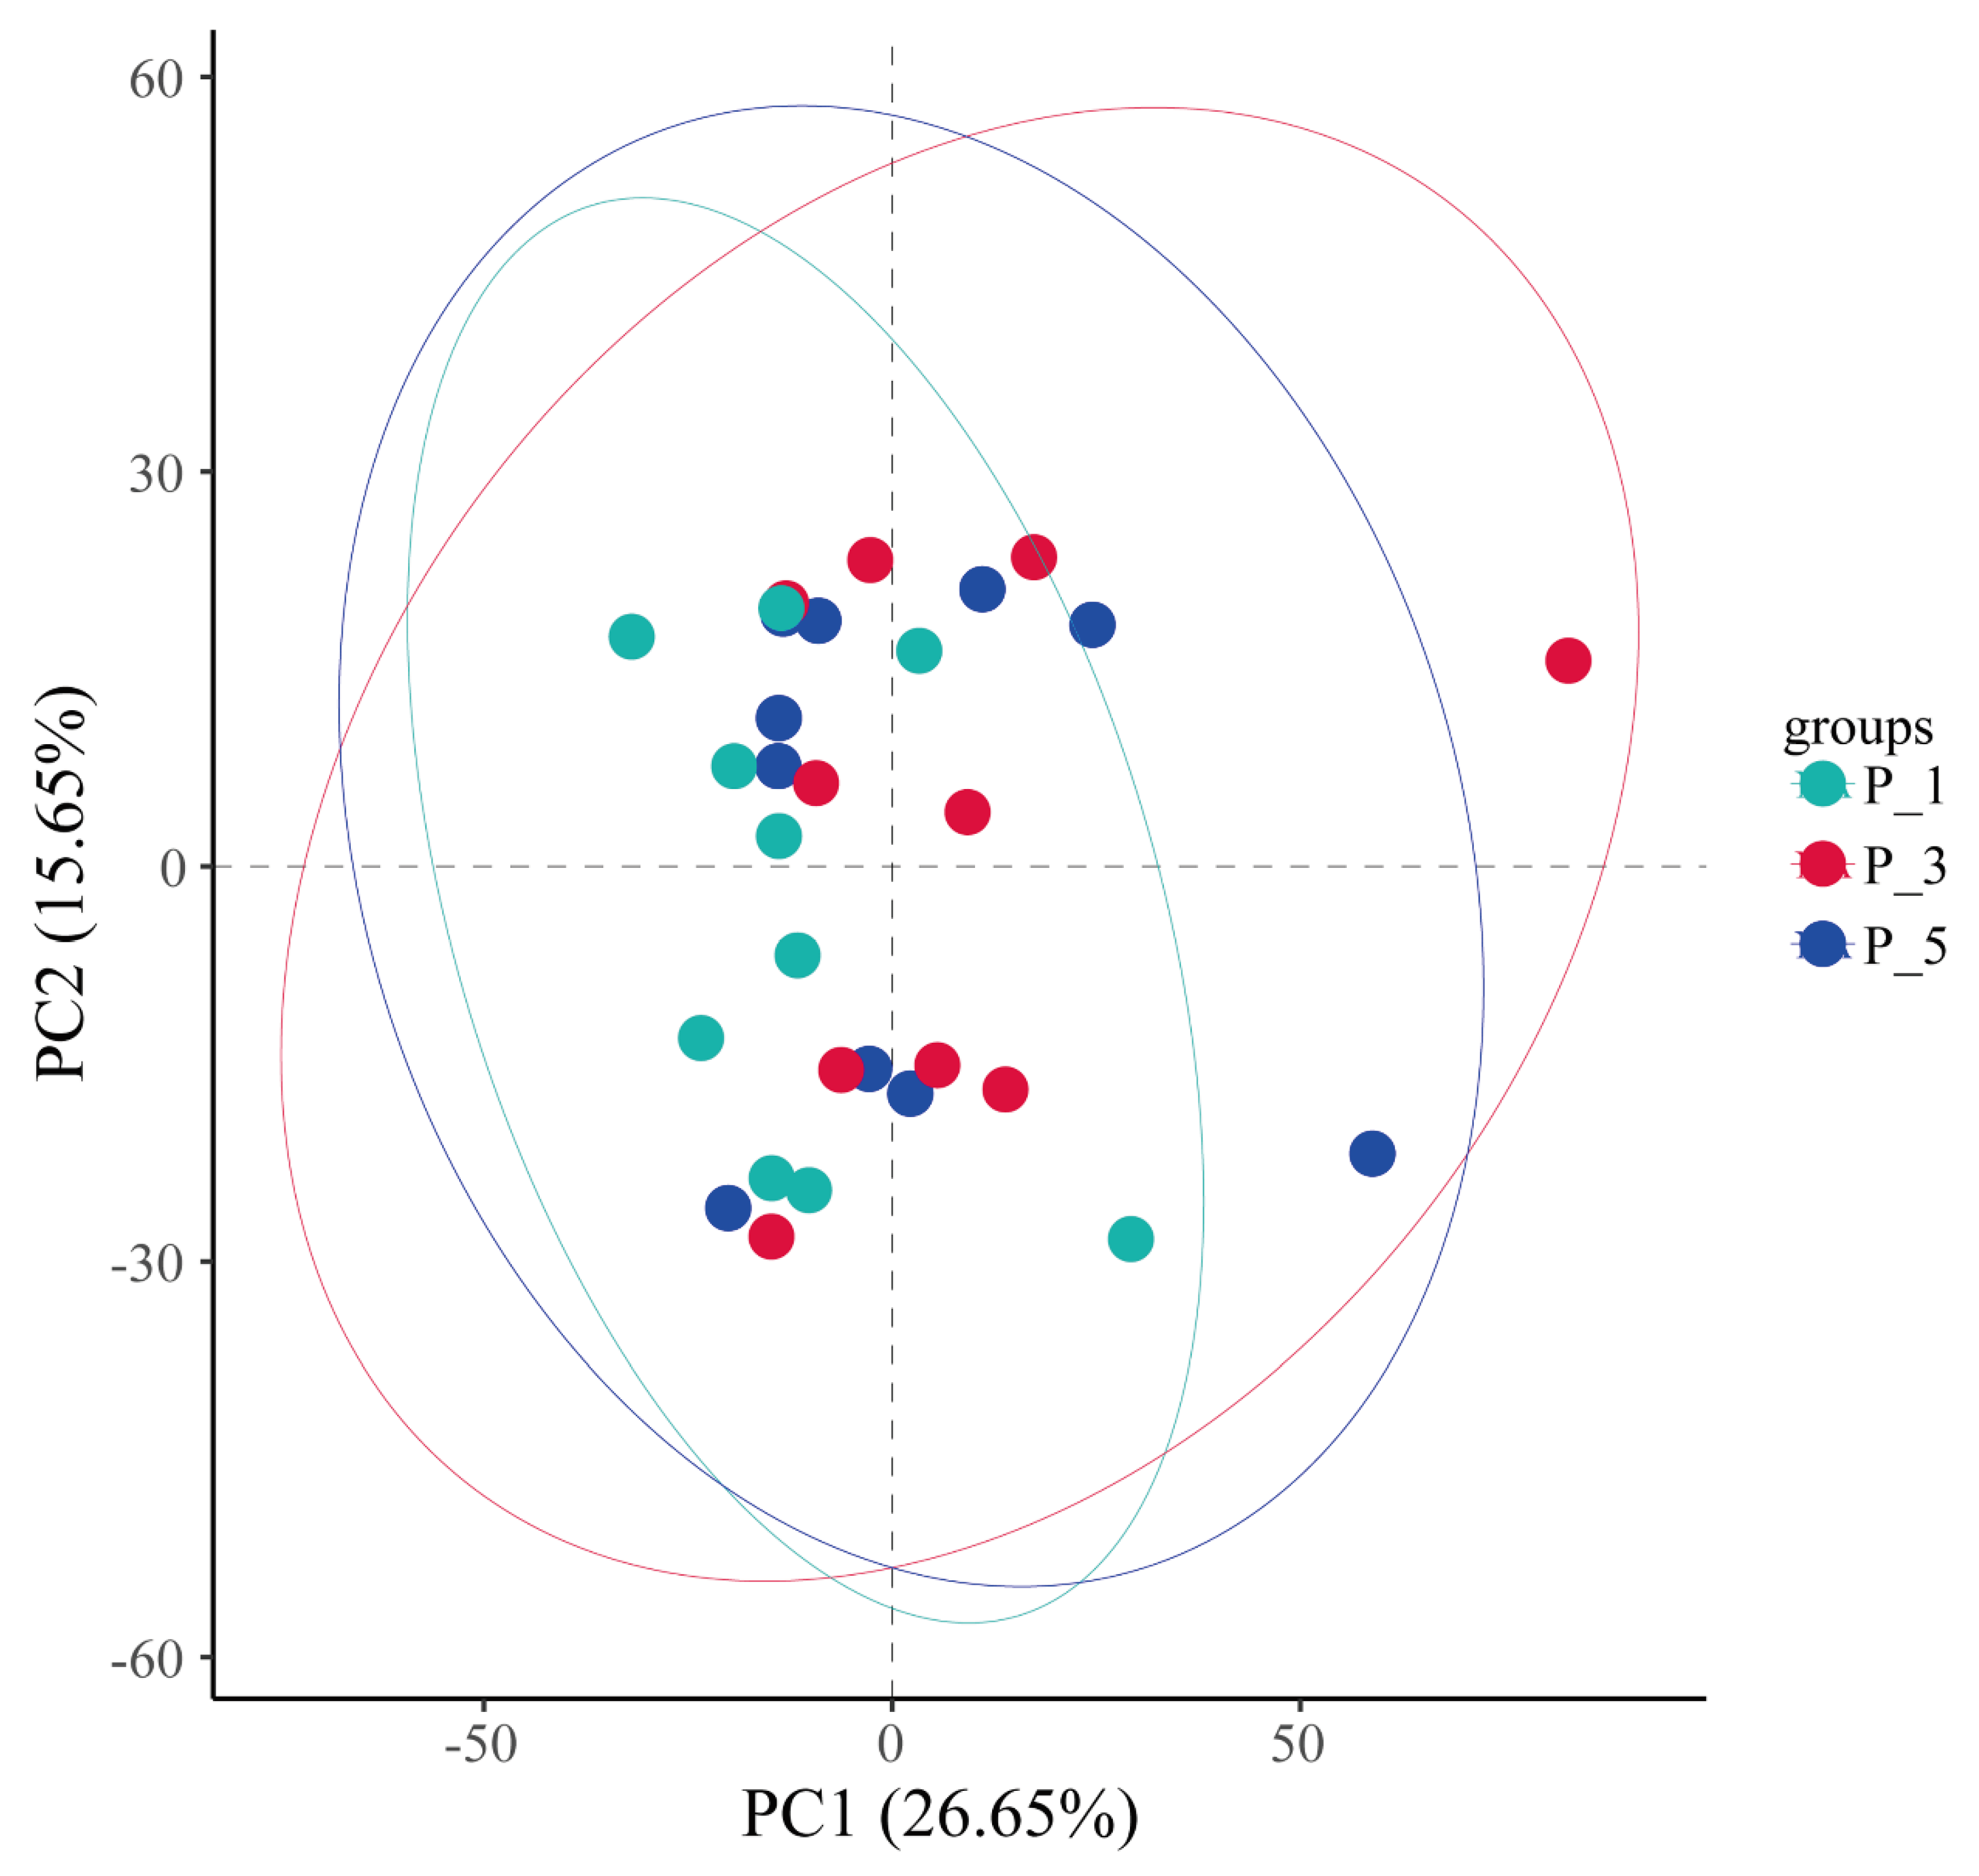
33]. This study also discovered that fecal microbial communities in lactating camels of different parities tend to cluster differently. In the gastrointestinal tract samples of yaks, Firmicutes, Bacteroidetes, and Verrucomicrobia were the most abundant phyla [
34]. Similarly, in beef cattle, the most common phyla in fecal microbiota included Firmicutes, Bacteroidetes, and Verrucomicrobia [
35]. However, the dromedary camel fecal microbes and their enzymes were primarily affiliated with Bacteroidetes, Firmicutes, and Proteobacteria [
36]. Furthermore, the sheep fecal core microbiome under varying feeding systems was dominated by Firmicutes, Bacteroidetes, and Proteobacteria [
37]. In the feces of dairy cattle, the most abundant phyla were Firmicutes, Proteobacteria, and Actinobacteriota [
38].
In human, vaginal microbiota composition associated strongly with advancing gestational age and parity, which should be accounted for reproductive outcomes and clinical applications [
39]. In dairy cattle, increasing parity is inversely associated with survival and reproduction [
40]. The relative abundance of Actinobacteria was higher in primiparous cows compared to multiparous cows, emphasizing the association of uterine microbiota with parity [
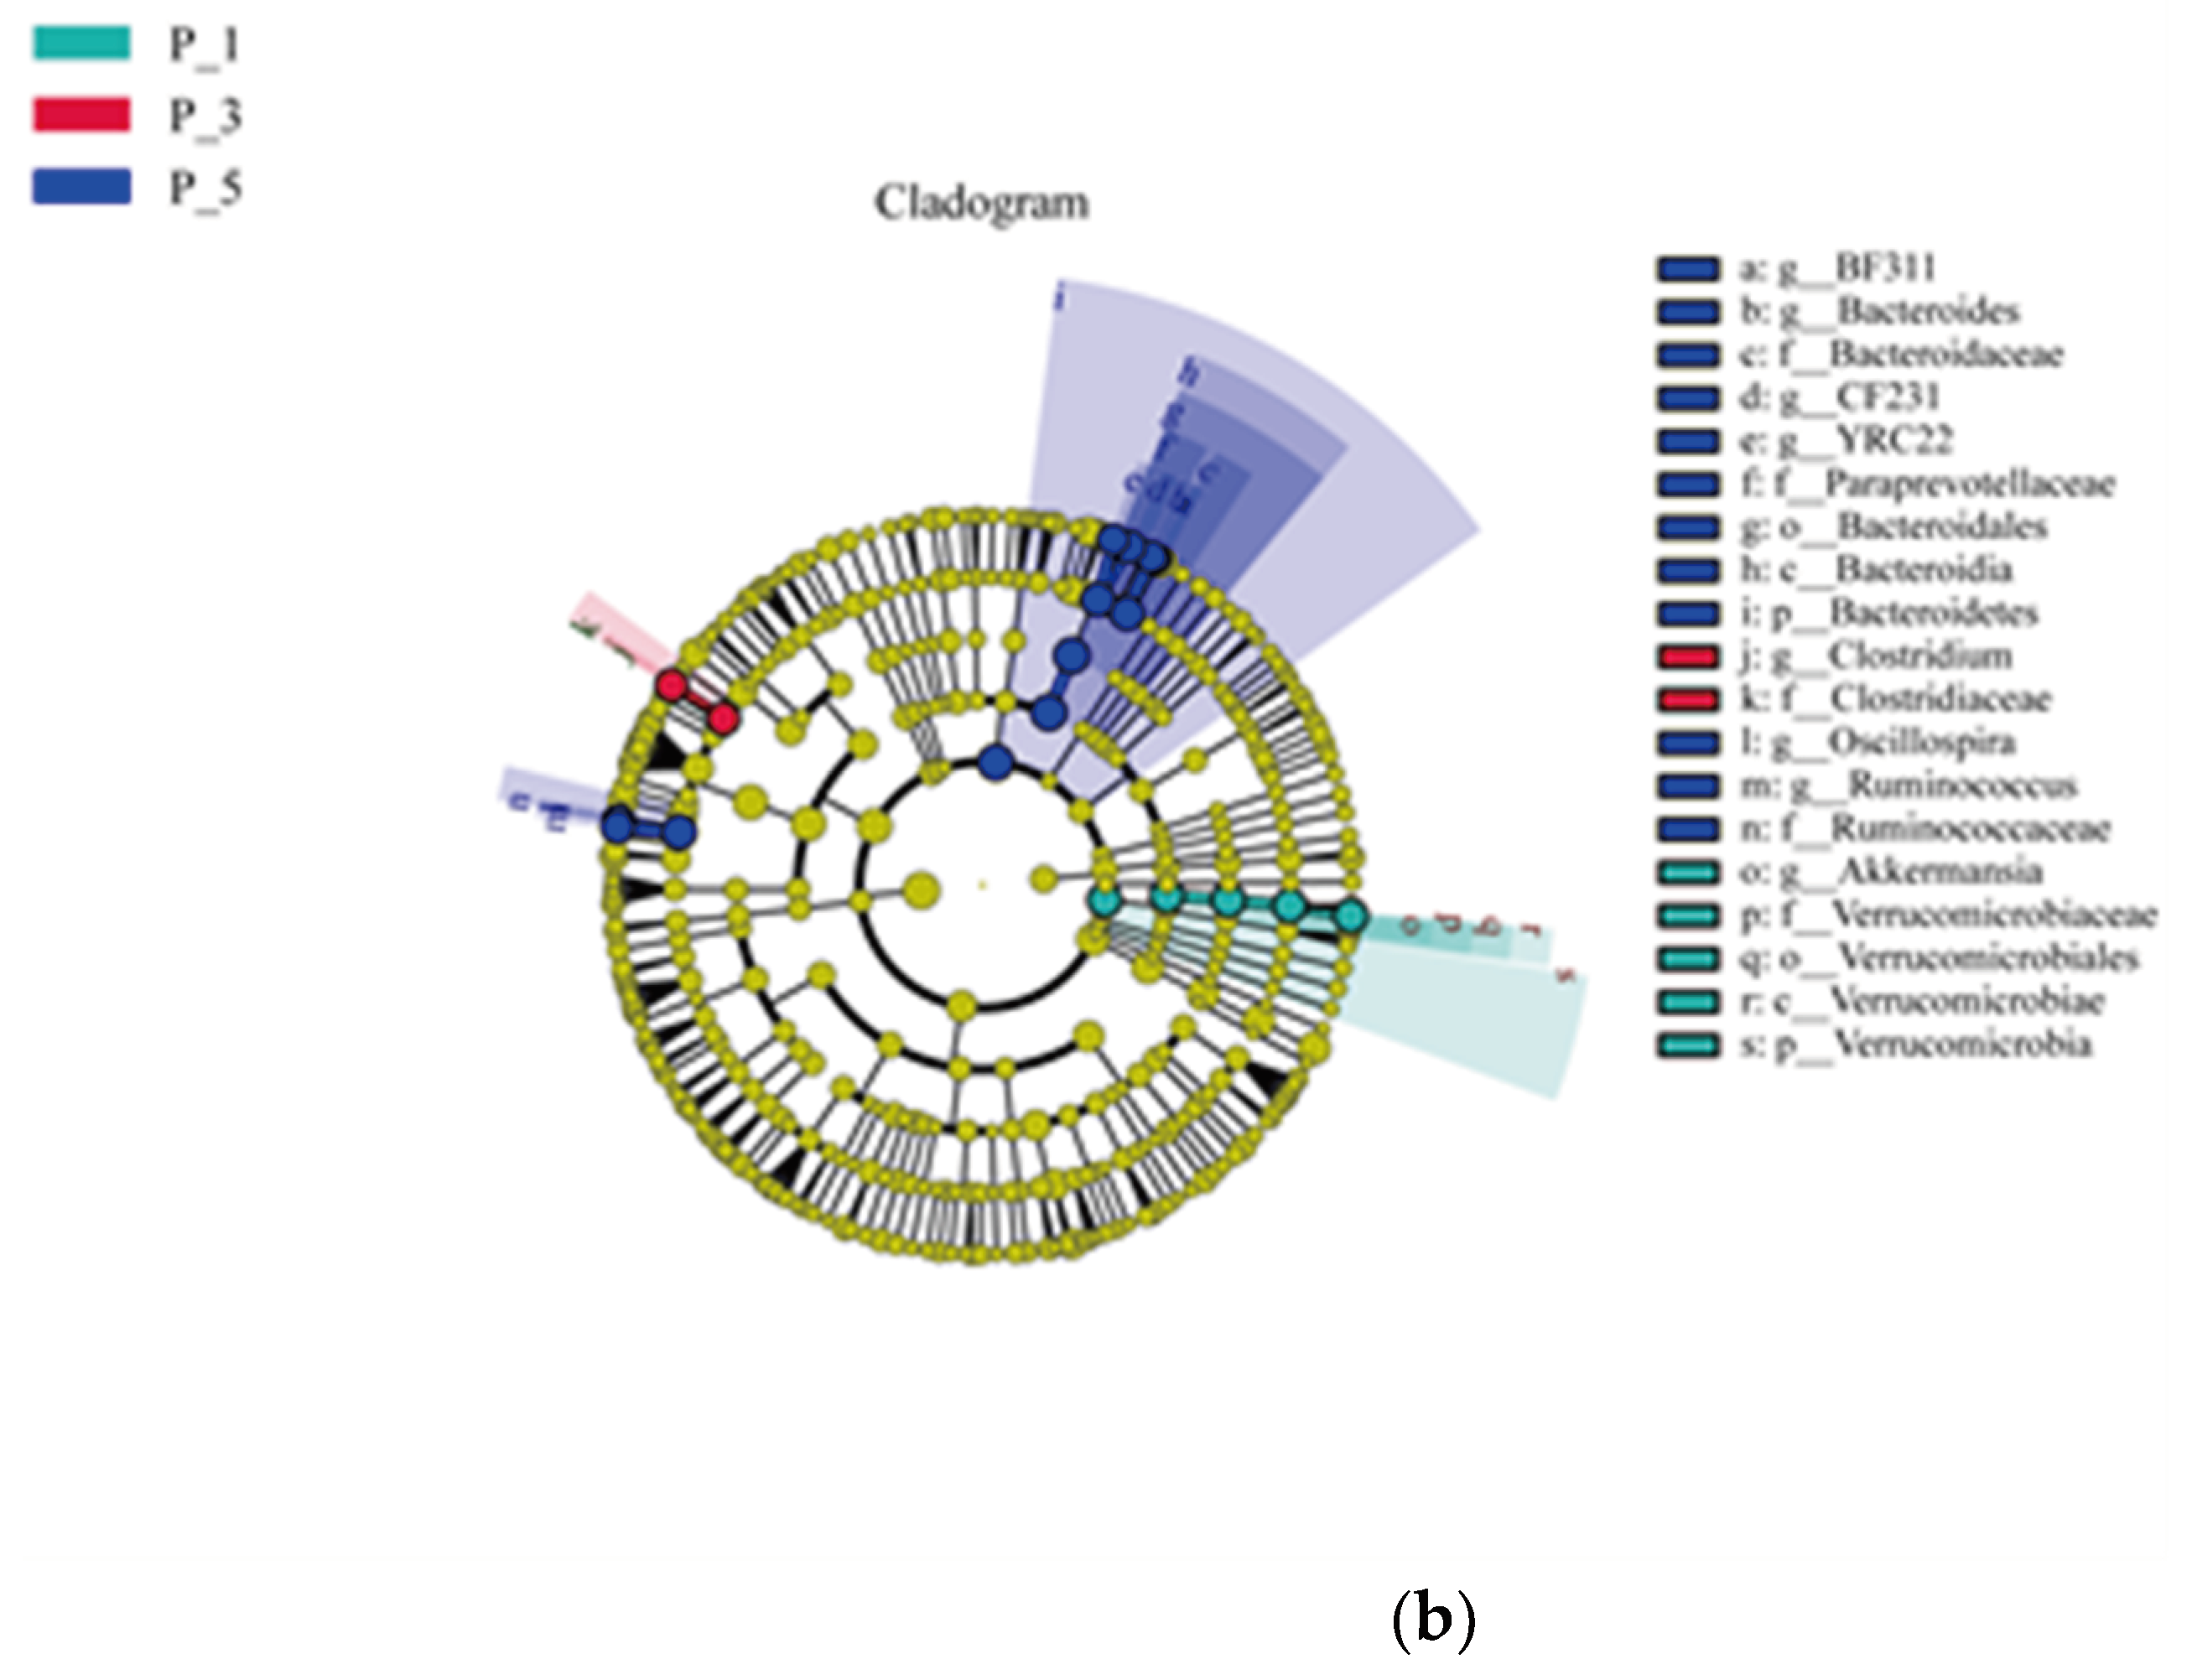
41]. In the current study, a connection was established between parity and both the fecal microbial community and its predicted functions. Verrucomicrobiaceae and Akkermansia were identified as biomarkers for primiparous camels in the current study. However, the fecal levels of Akkermansia muciniphila in the infant gut ten days after birth were associated with both primiparous and maternal parity in pigs [
42]. Further, Ruminococcaceae abundance was higher in fecal samples from first parity sows as compared to maternal parity sows, and a higher abundance of Clostridium was observed in the fecal samples of third parity sows compared to first parity sows [
43]. Interestingly, in the present study, the abundance of Clostridium was highest in third parity lactating camels, while Ruminococcus was significantly higher in fifth parity than in other lower parity lactating camels. Both the genus Clostridium and Ruminococcus belong to Firmicutes, which suggests that camels rich in lignocellulolytic enzymes could be the indicative of a fecal microbial community in multiparous camels that is rich in lignocellulolytic microbes [
44,
45]. Thus, it is essential to study the gastrointestinal microbiome in relation to different parities in camels. These differences could be used as the bio-markers in distinguishing the different parity of the lactating camels, so as to the camel managers should separate the camel herds based on the different level of the parity.
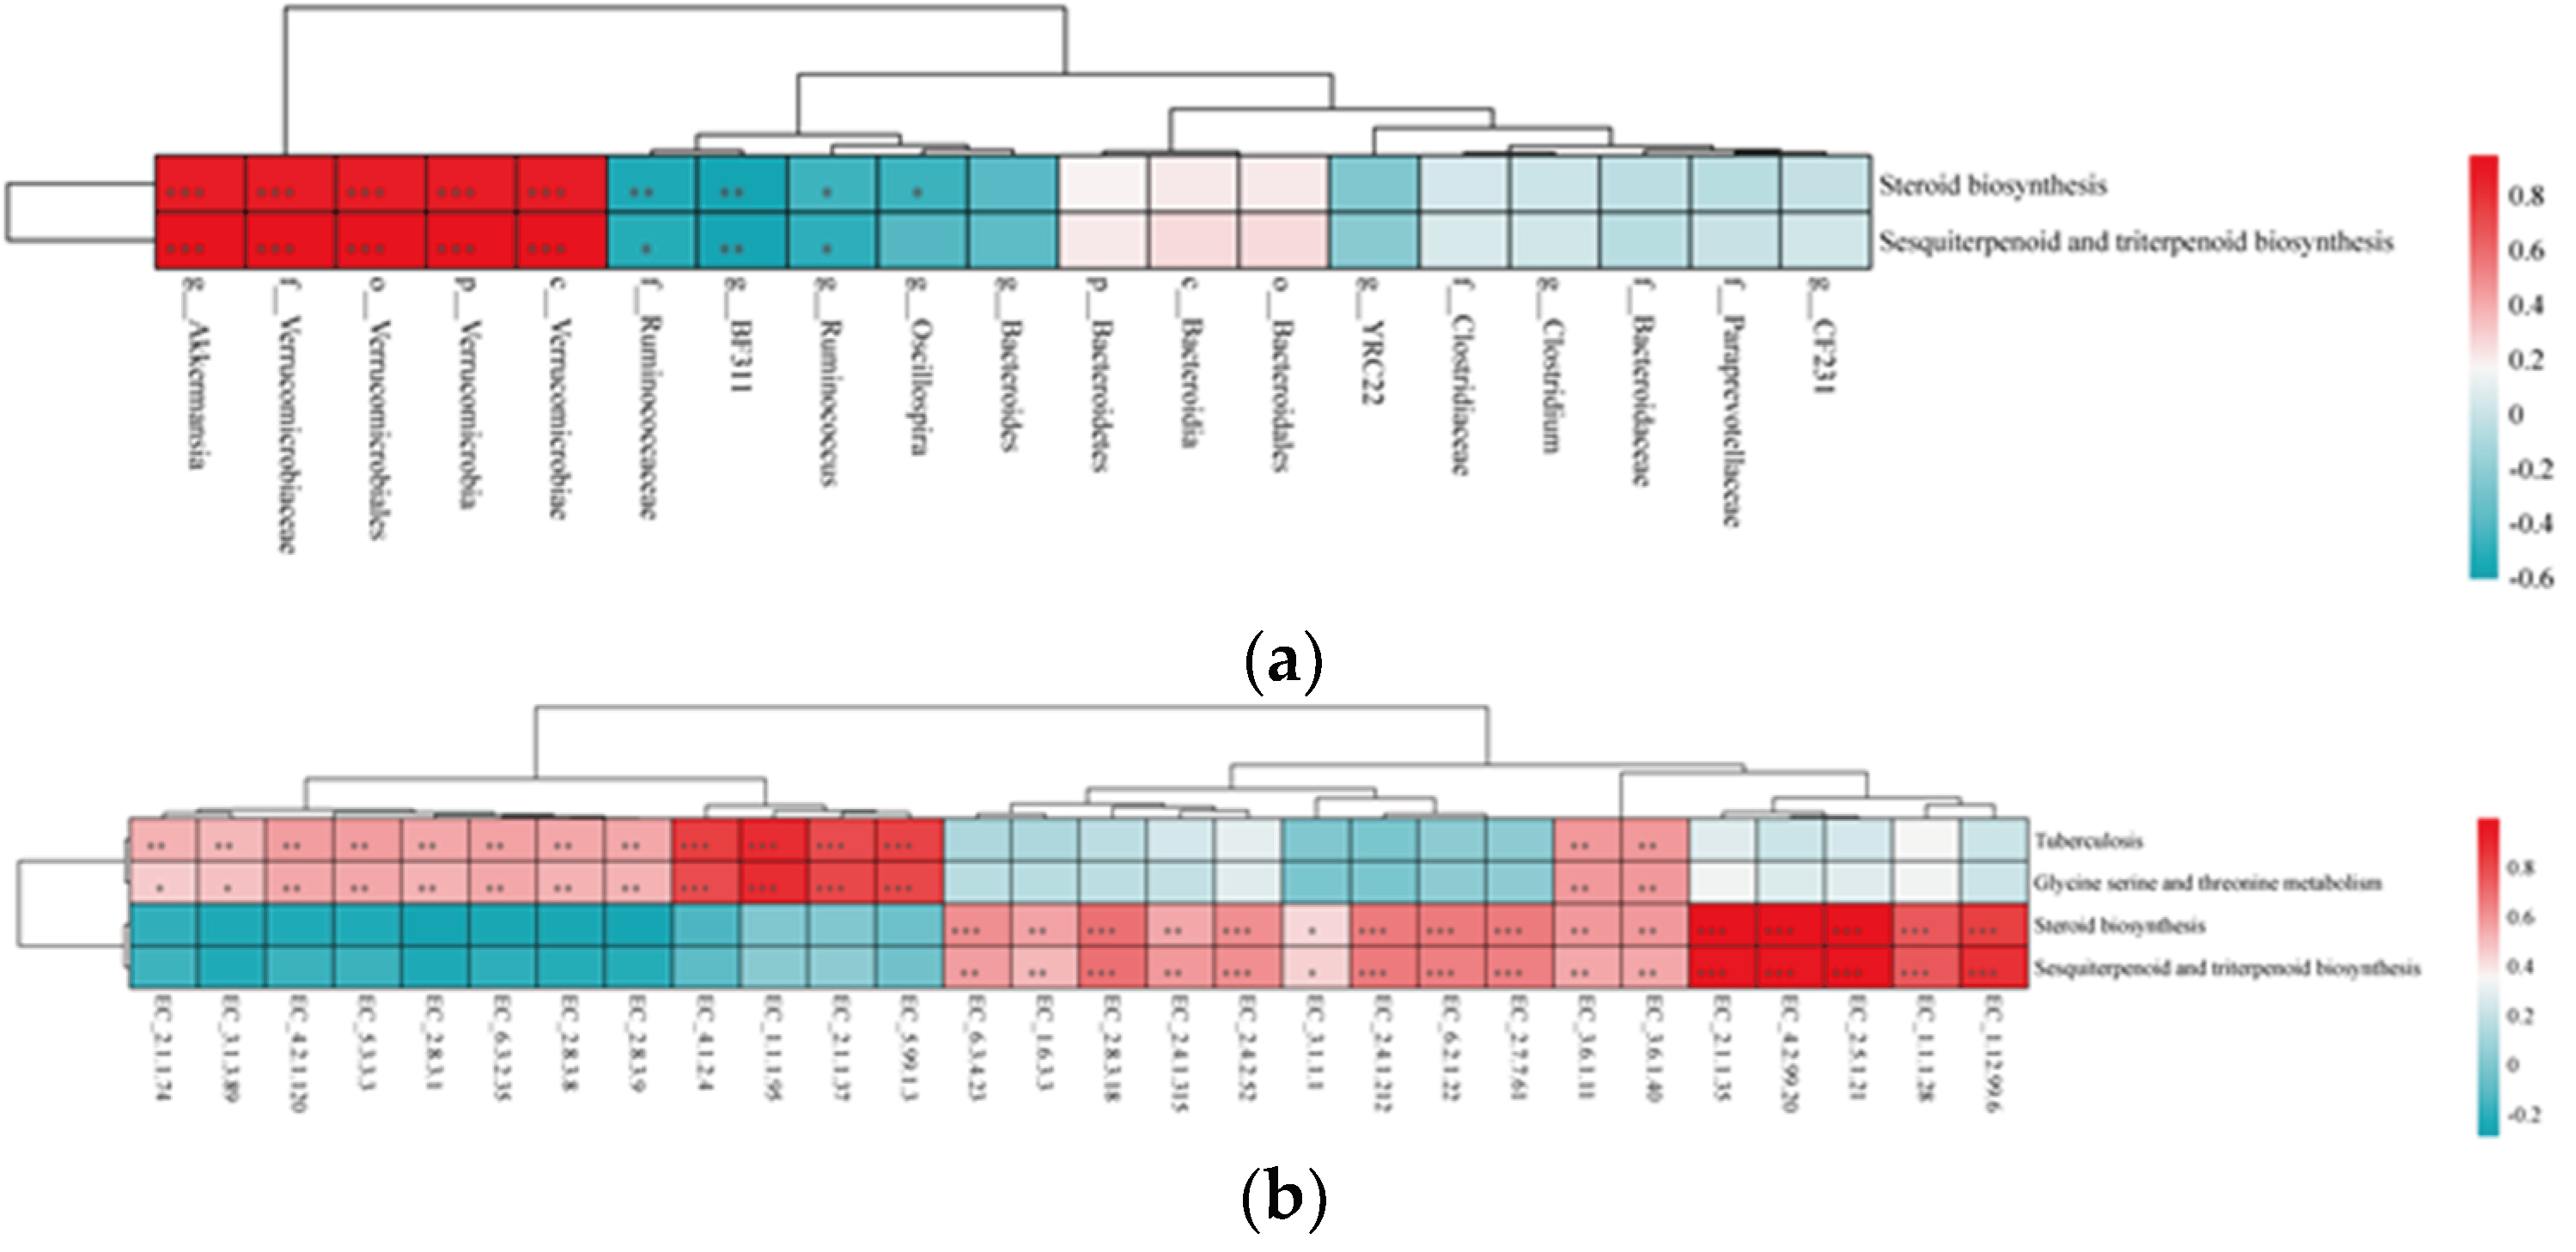
Furthermore, the findings of this study identified Verrucomicrobiaceae and Akkermansia as key biomarkers in the fecal microbial ecology of primiparous lactating camels. Importantly, Verrucomicrobiaceae and its genus Akkermansia showed a significant association with the steroid biosynthesis pathway. Previous reports suggest that bacterial species possessing critical genes for steroid biosynthesis primarily belong to the phyla Actinobacteria, Deltaproteobacteria, Gammaproteobacteria, and Verrucomicrobia [
46]. Another study classified Akkermansia muciniphila as a steroid-producing bacterium colonizes the mucus layer of the gastrointestinal tract, representing 1 to 4% of the fecal microbiota [
47]. This bacterium is known to stimulate mucosal microbial networks and enhances intestinal barrier function, thereby providing essential host immune responses [
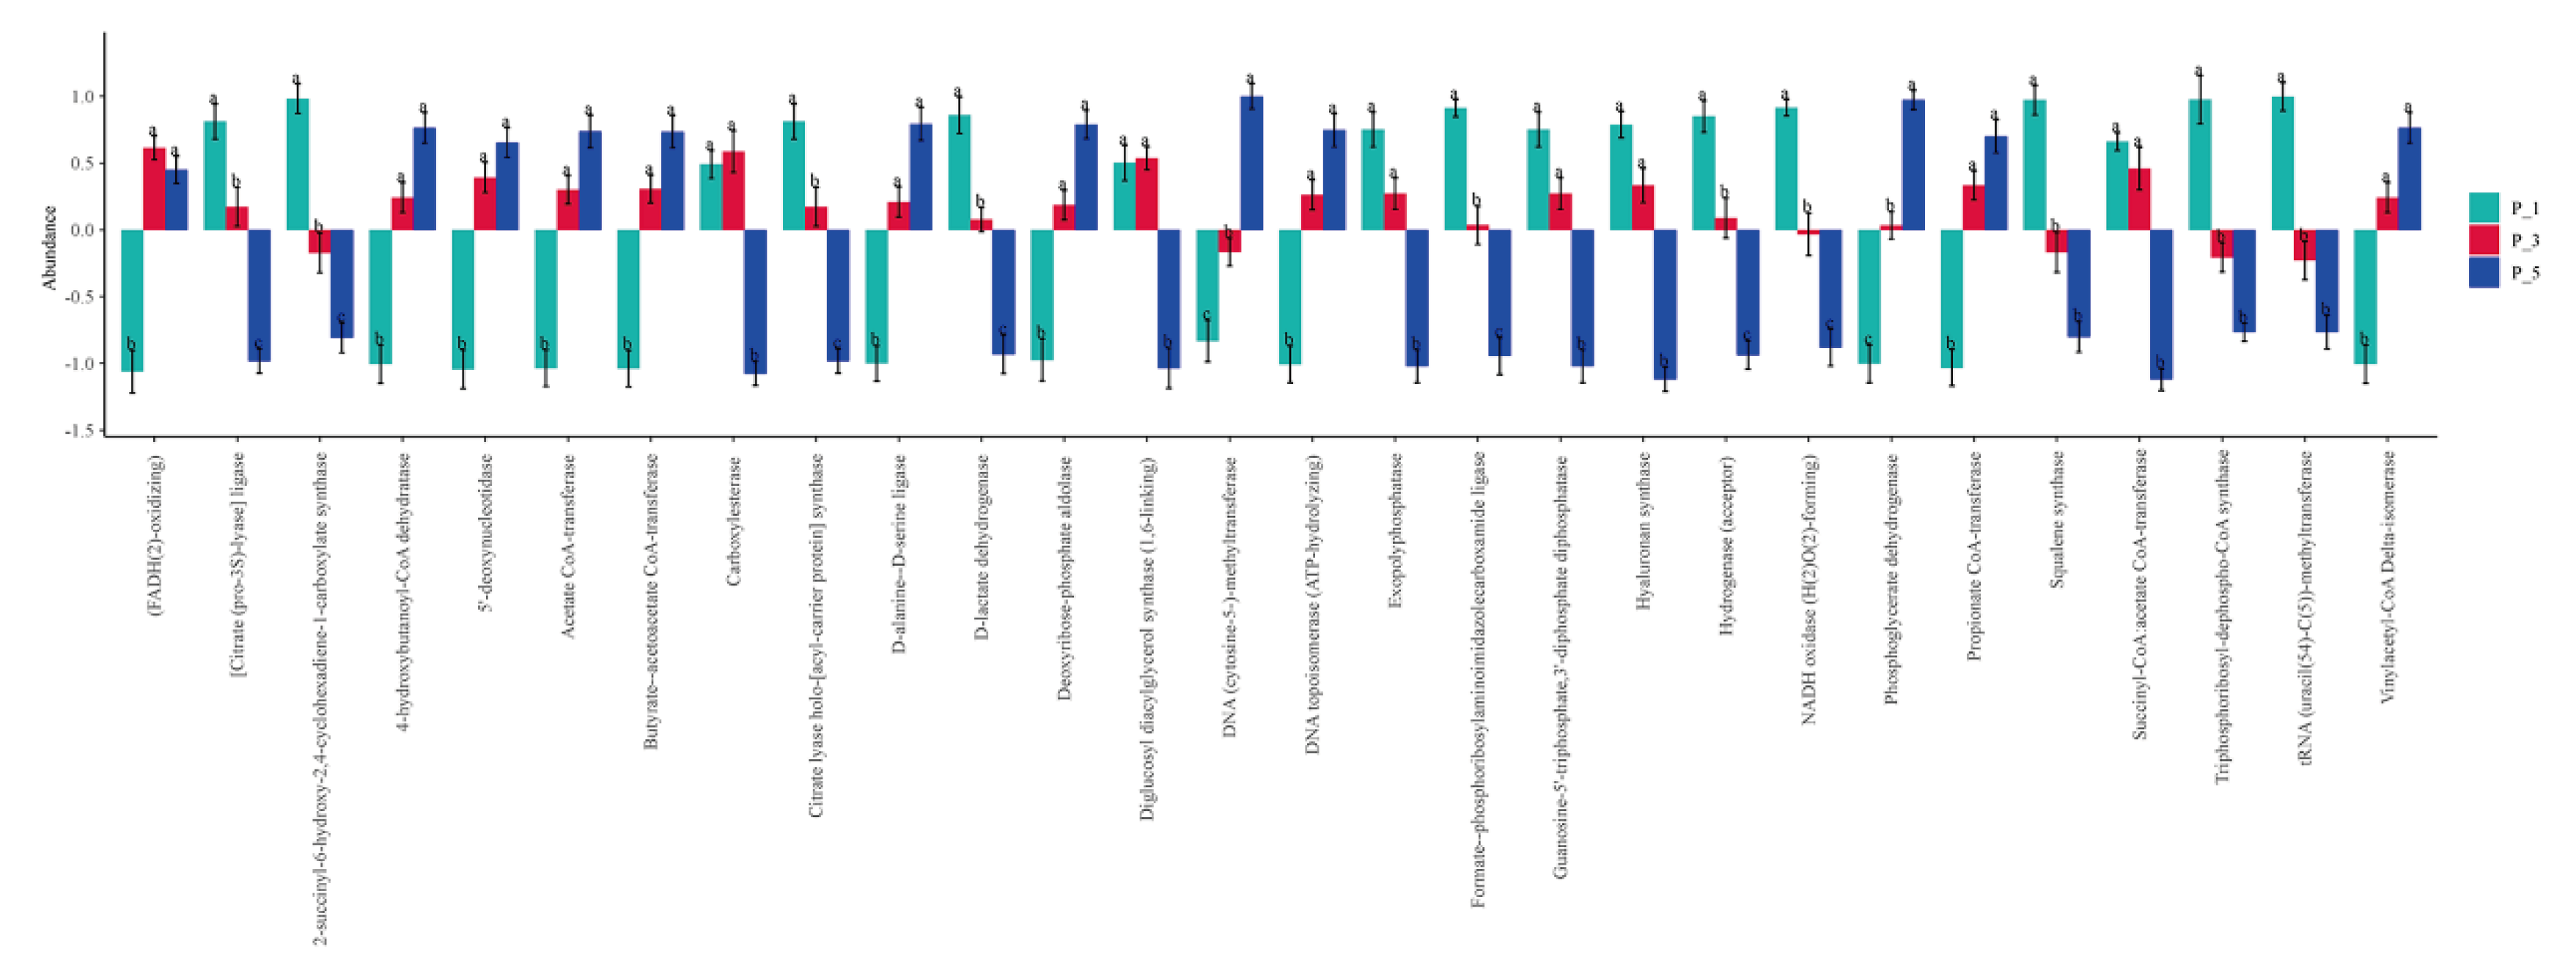
48]. In addition, EC_2.5.1.21 (Squalene synthase) showed a positive correlation with the steroid biosynthesis pathway in the current study. The key genes implicated in steroid biosynthesis include squalene monooxygenase and oxidosqualene cyclase [
49]. The yield of triterpenoids is reported to be associated with 2,3-oxidosqualene, signifying that engineering critical enzymes could be a potential strategy for natural product production [
50].
Lastly, this study found that the Tuberculosis pathway increased with advancing parity, possibly indicating a higher risk of animal tuberculosis in lactating camels of greater parity. Mycobacterium tuberculosis, reported as the etiological agent of tuberculosis, is the leading cause of death from a single infectious agent, accounting for 1.7 million deaths in 2016 [
51]. Animal tuberculosis is globally distributed, with instances of Mycobacterium caprae infection reported in dromedary camel herds [
52].
Understanding the relationships between the resident microbial communities and their host is necessary for studying the host health [
53,
54]. However, the intensification of camel production for milk necessitates a comprehensive assessment by scientists to determine the camel welfare [
55]. To date, the only tool for evaluating the welfare of camels includes a combination of individual, diet, and managemental measures, investigating individual camel health status [
56]. Yet, there is still insufficient protocols for camels developed for assessing the animal health and welfare [
57,
58,
59]. Thus, it is recommended that gastrointestinal microbiome with its parity should be taken into consideration when evaluating the welfare in lactating camels.
In the present study, we investigated the influence of parity dynamics on the fecal microbial communities of lactating Bactrian camels. However, it is important to note that this study establishes associations between microbes and KEGG pathways or EC numbers using a limited sample size of randomly selected lactating camels at different parity. Therefore, future investigations of lactating camel production should be directed on large-scale of camel herds by different parities, particularly contrasting primiparous and multiparous camels.
Author Contributions
Conceptualization, H.D., J.W., H.Z., and J.X.; methodology, H.D., J.W., H.Z., and J.X.; software, H.D. and J.W.; validation, H.D., J.W., H.Z., and J.X.; formal analysis, H.D. and J.W.; investigation, H.D., J.W., H.Z., and J.X.; resources, H.D. and J.W.; data curation, H.D. and J.W.; writing—original draft preparation, H.D. and J.W.; writing—review and editing, H.D. and J.W.; visualization, H.D. and J.W.; supervision, H.D. and J.W.; project administration, H.D. and J.W.; funding acquisition, H.D. and J.W.. All authors have read and agreed to the published version of the manuscript.
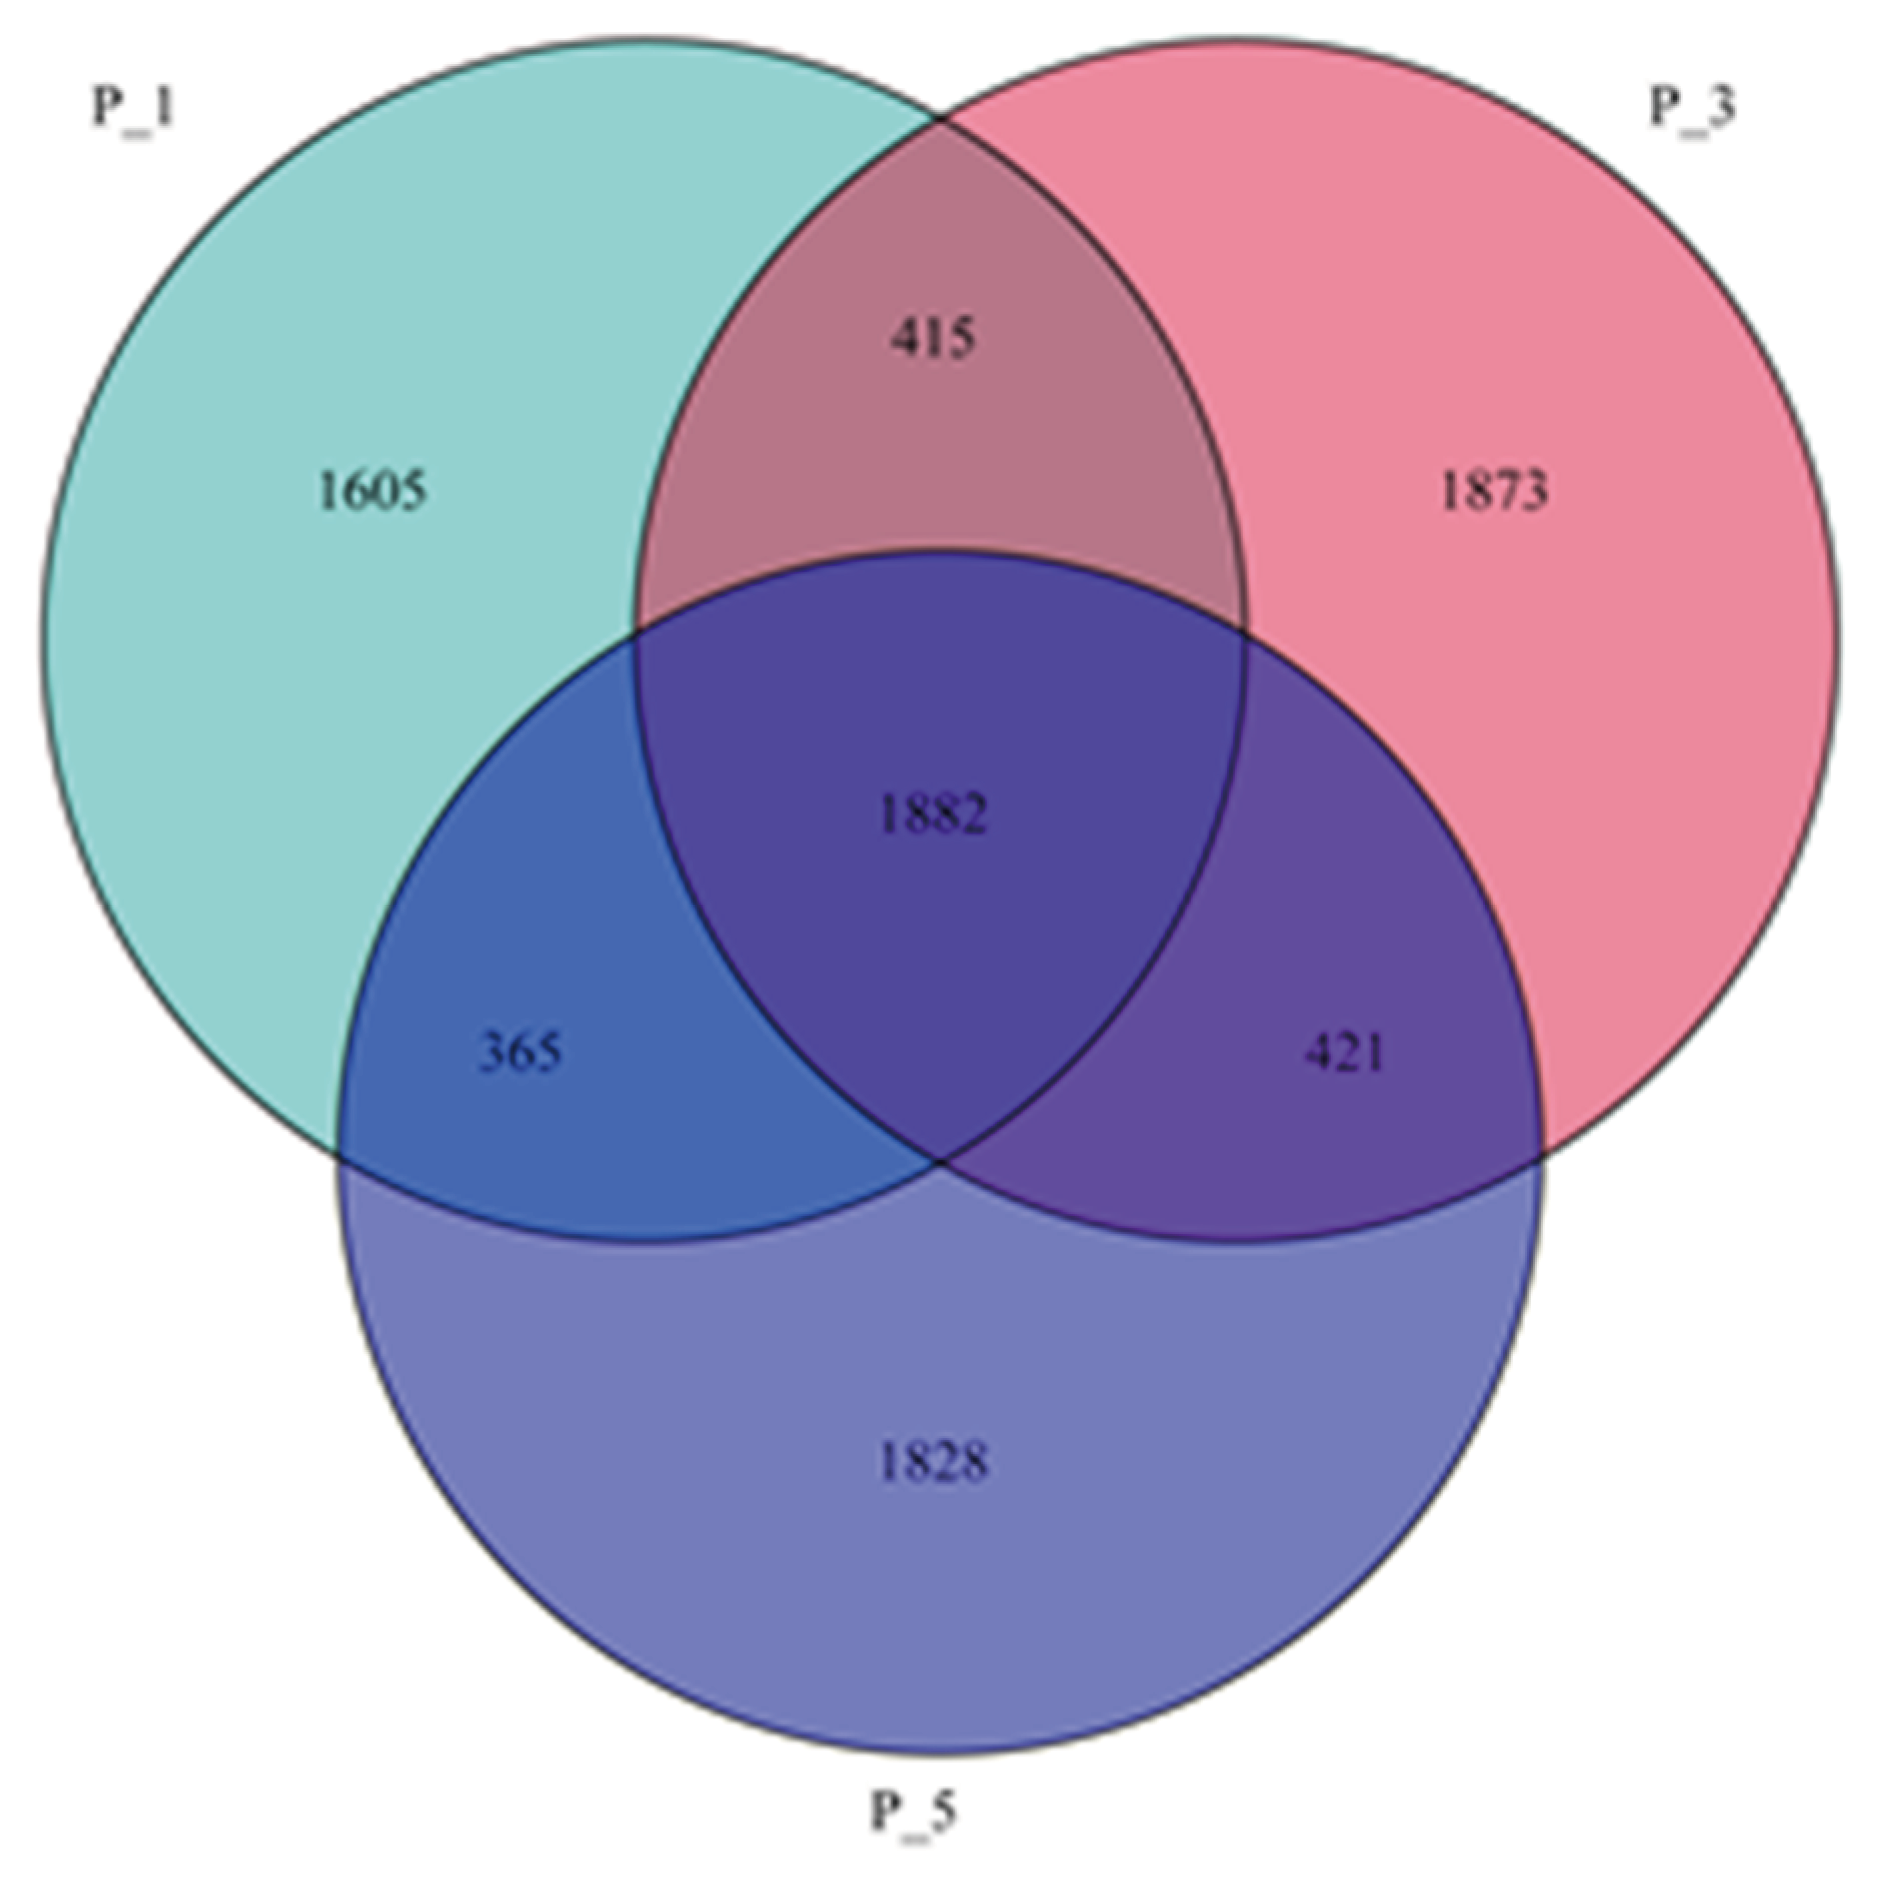
Figure 1.
Venn diagram showing the overlap of OTUs across the groups of the fecal microbial community in lactating Bactrian camel. Brown represents P_1 (10 female lactating camel, 1st parity), Red represents P_3 (10 female lactating camel, 3rd parity), and Green represents P_5 (10 female lactating camel, 5th parity).
Figure 2.
Bar graphs describing the top 20 relatively abundant phyla (a) and genus (b) in lactating Bactrian camel feces. The horizontal axis represents the different parities of lactating camels: Brown signifies P_1 (10 female lactating camels, 1st parity); Red corresponds to P_3 (10 female lactating camels, 3rd parity), and Green denotes P_5 (10 female lactating camels, 5th parity). The vertical axis illustrates the proportion of sequences attributed to the relevant phylum (a) or genus (b). The colors of the bar graphs from top to bottom align with the colors for each taxon on the right, ranging from the least to the greatest relative abundances, with the exception of ‘Other’. At the phylum level, sequences that could not be assigned were categorized as ‘unclassified’, while ‘Other’ denotes the cumulative percentage of all other phyla that did not make the top 20. Similarly, at the genus level, ‘Other’ represents the cumulative percentage of all other genera that fell outside the top 20.
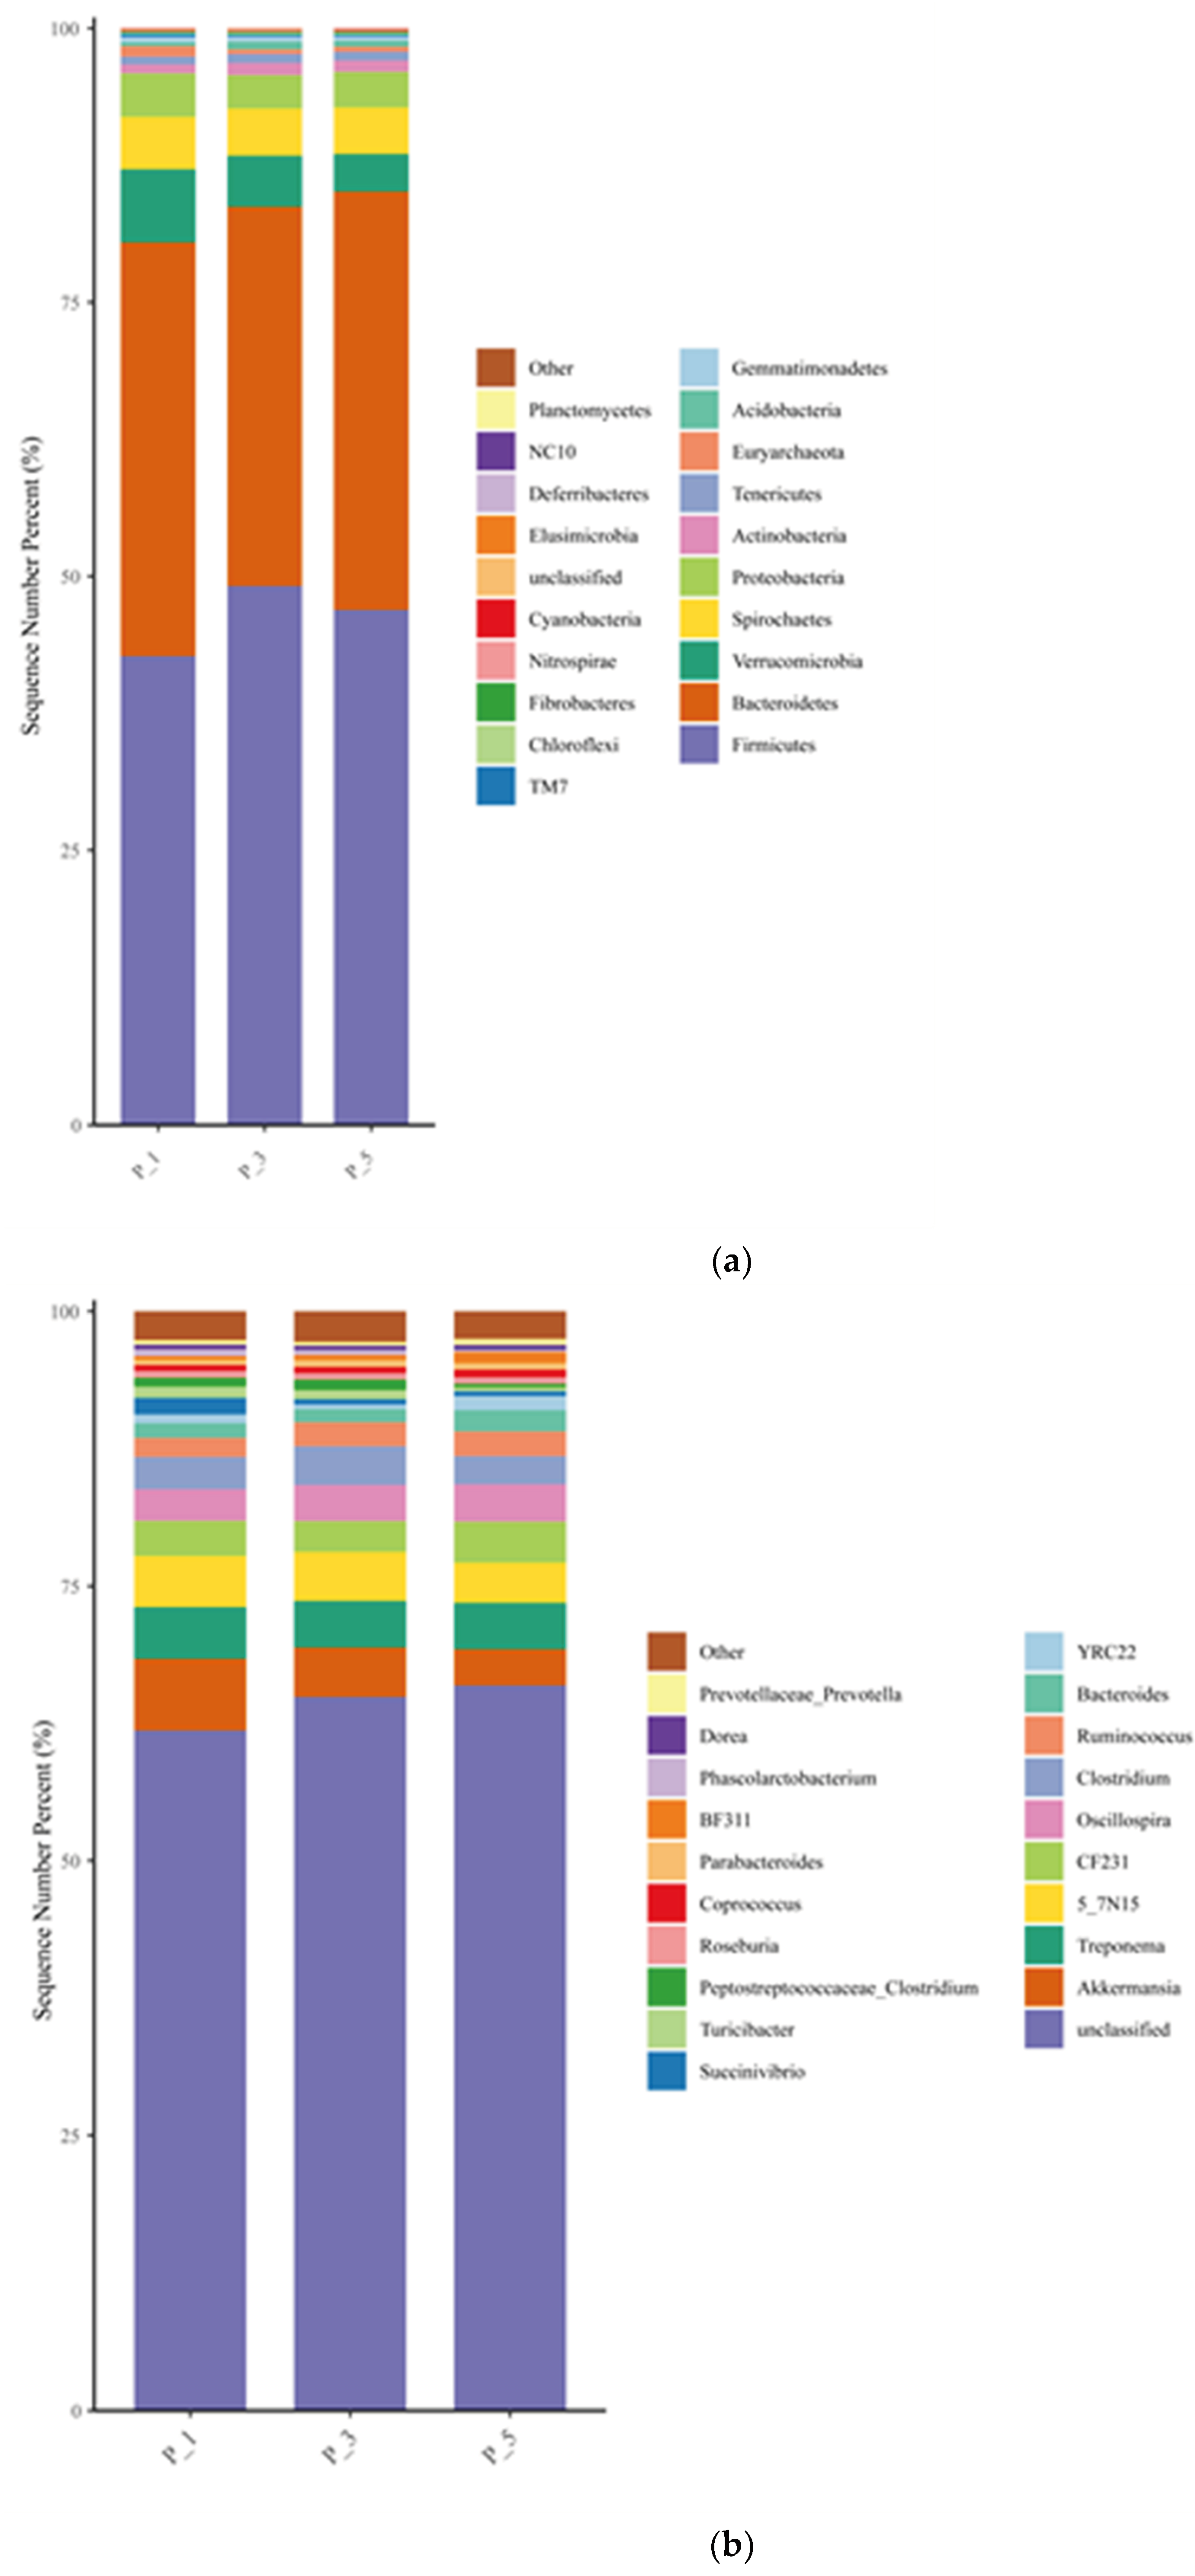
Figure 3.
LEfSe analysis (LDA > 4) among groups (a) and Cladogram showing the phylogenetics of the biomarkers (b) in lactating Bactrian camel feces. The colors Brown, Red, and Green correspond to P_1 (10 female lactating camels, 1st parity), P_3 (10 female lactating camels, 3rd parity), and P_5 (10 female lactating camels, 5th parity), respectively. (a) Each horizontal bar represents a specific taxon, with the length of the bar illustrating the Linear Discriminant Analysis (LDA) score, the significant different defined as LDA > 4 and P < 0.05. (b) The cladogram is structured from the outside to the inside in the following order: kingdom, phylum, class, order, family, and genus. Fan-shaped areas of the same color label the related taxon, with each circle ligature representing a distinct taxon. Yellow signifies no significant difference among the groups, while other colors denote the biomarkers for the respective groups.
Figure 4.
Principle coordinate analysis (PCoA) of the fecal microbial communities of different parity in lactating Bactrian camel. In the color scheme, Brown denotes P_1 (10 female lactating camels, 1st parity); Red signifies P_3 (10 female lactating camels, 3rd parity), and Green indicates P_5 (10 female lactating camels, 5th parity). Each plot corresponds to a single sample, and plots of the same color belong to the same group. The abbreviations used are as follows: p__ represents phylum, c__ denotes class, o__ stands for order, f__ signifies family, and g__ indicates genus.
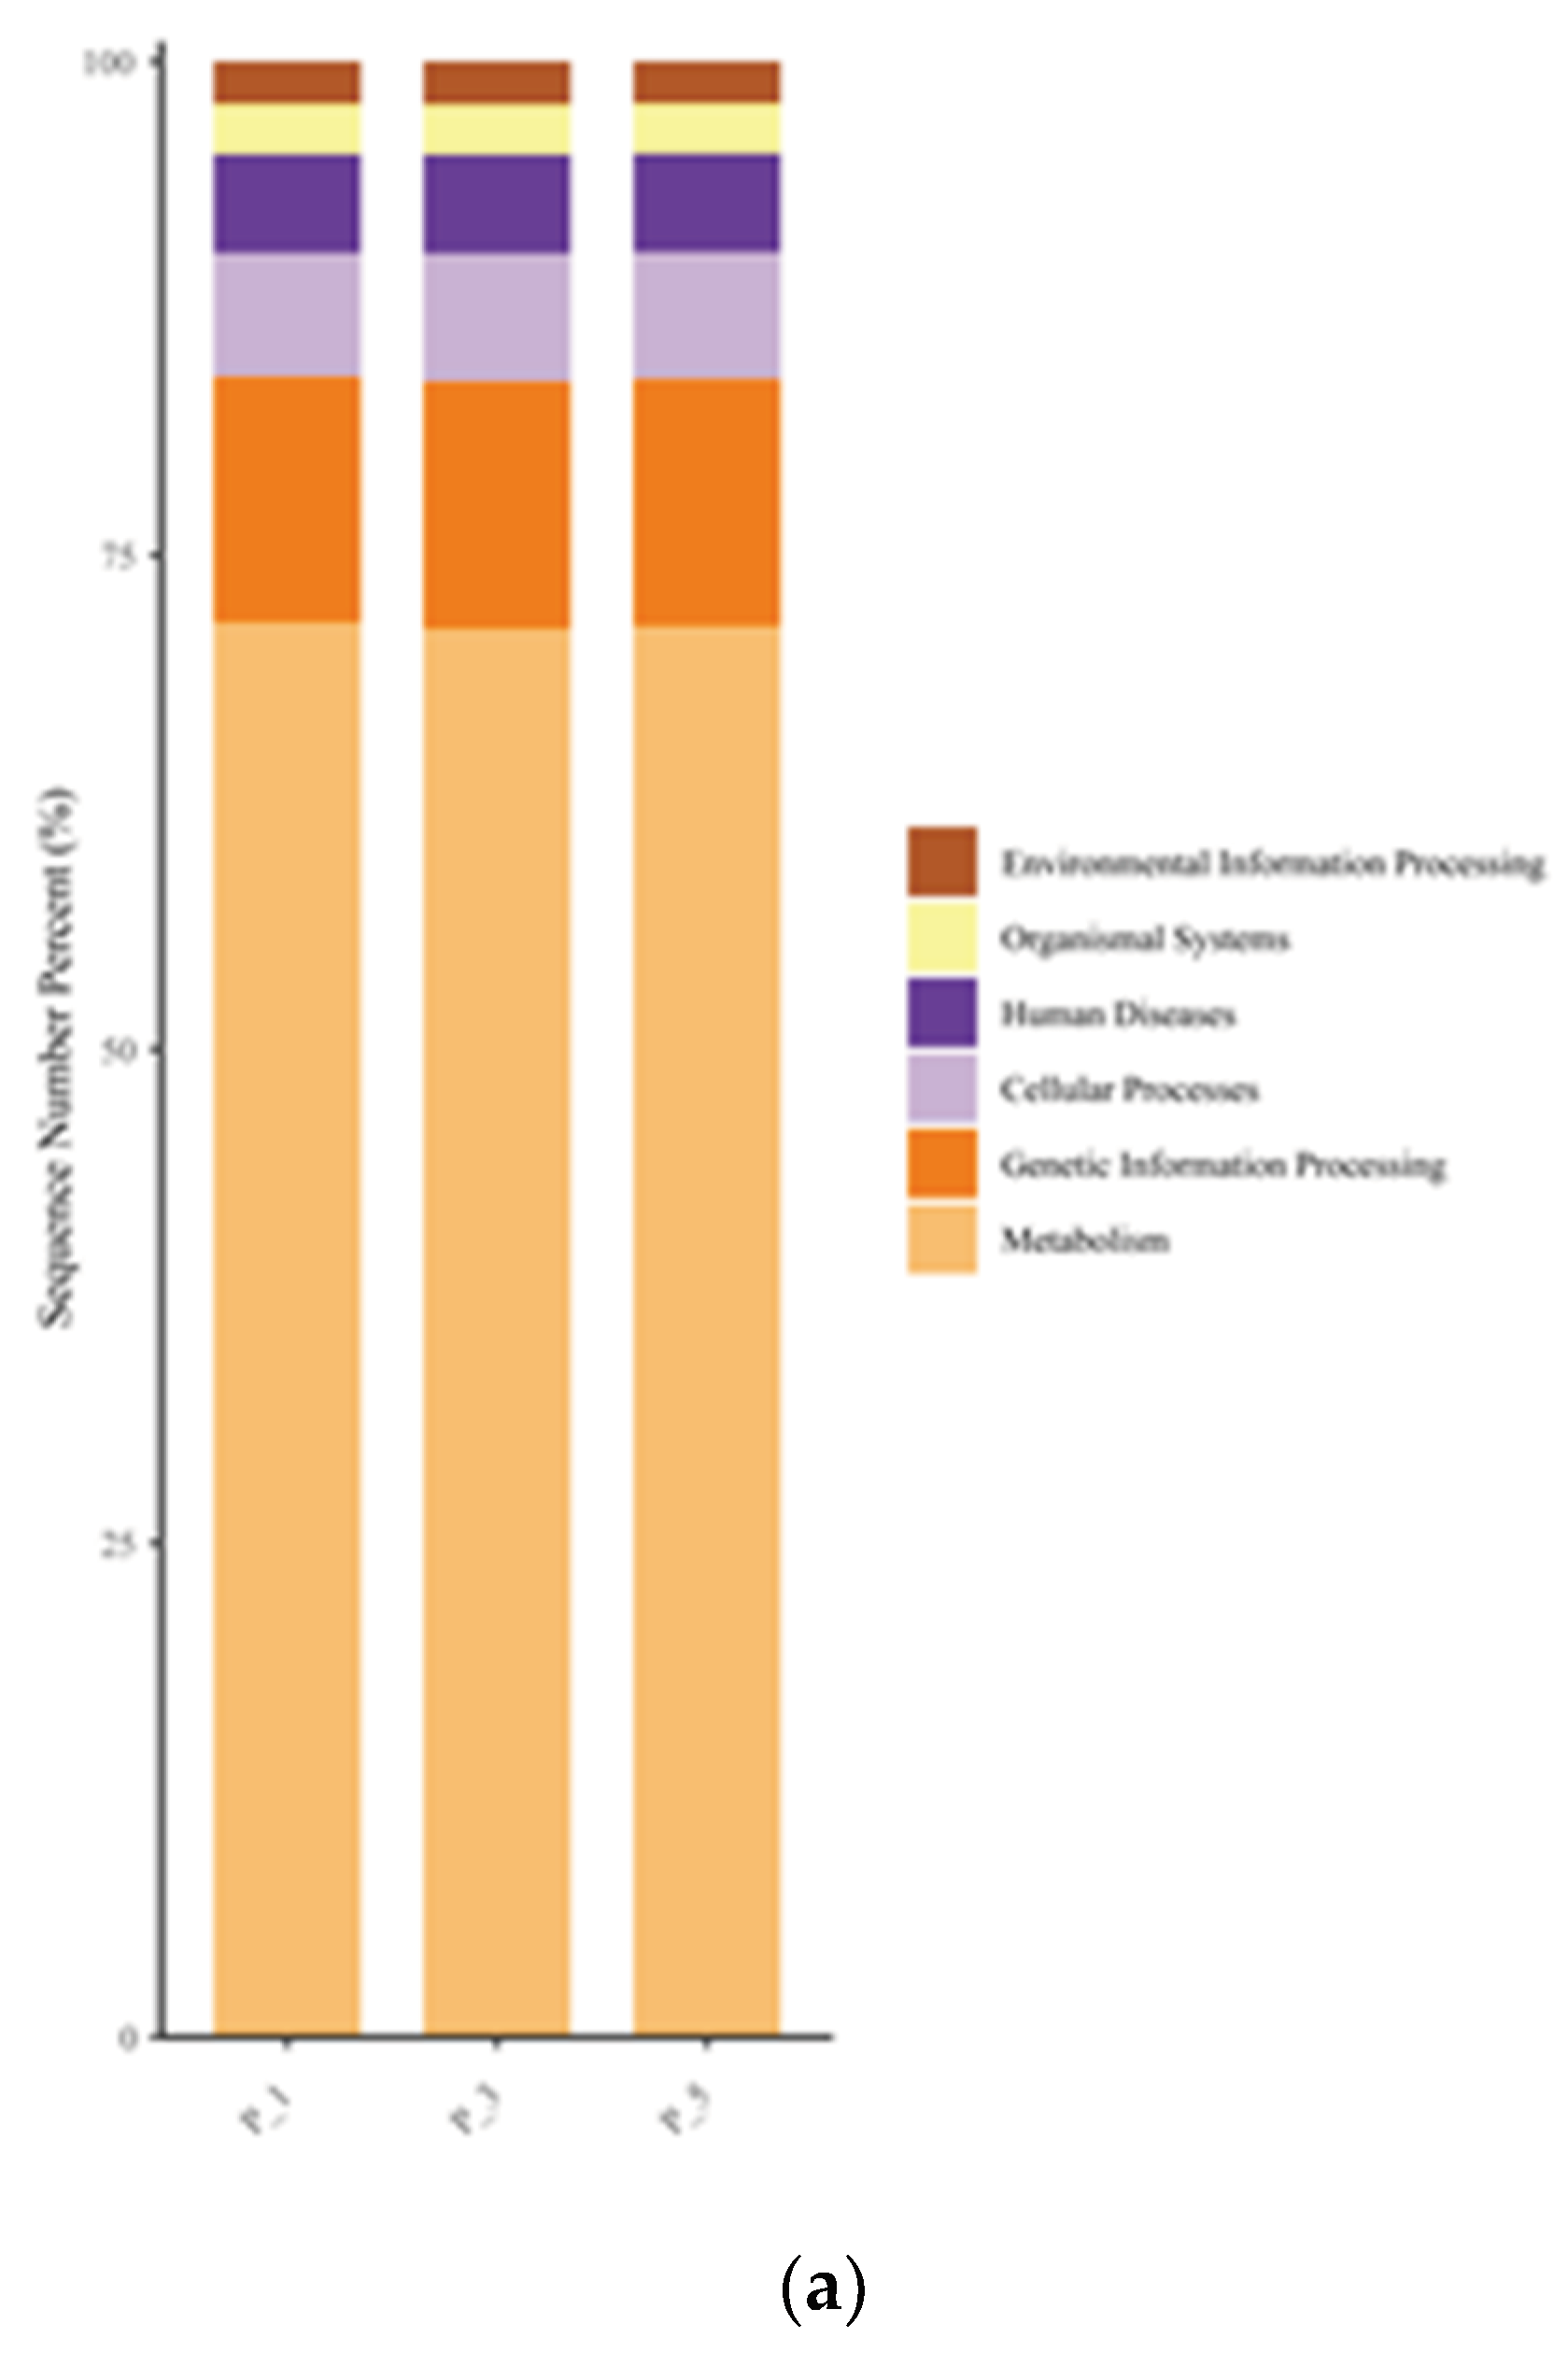
Figure 5.
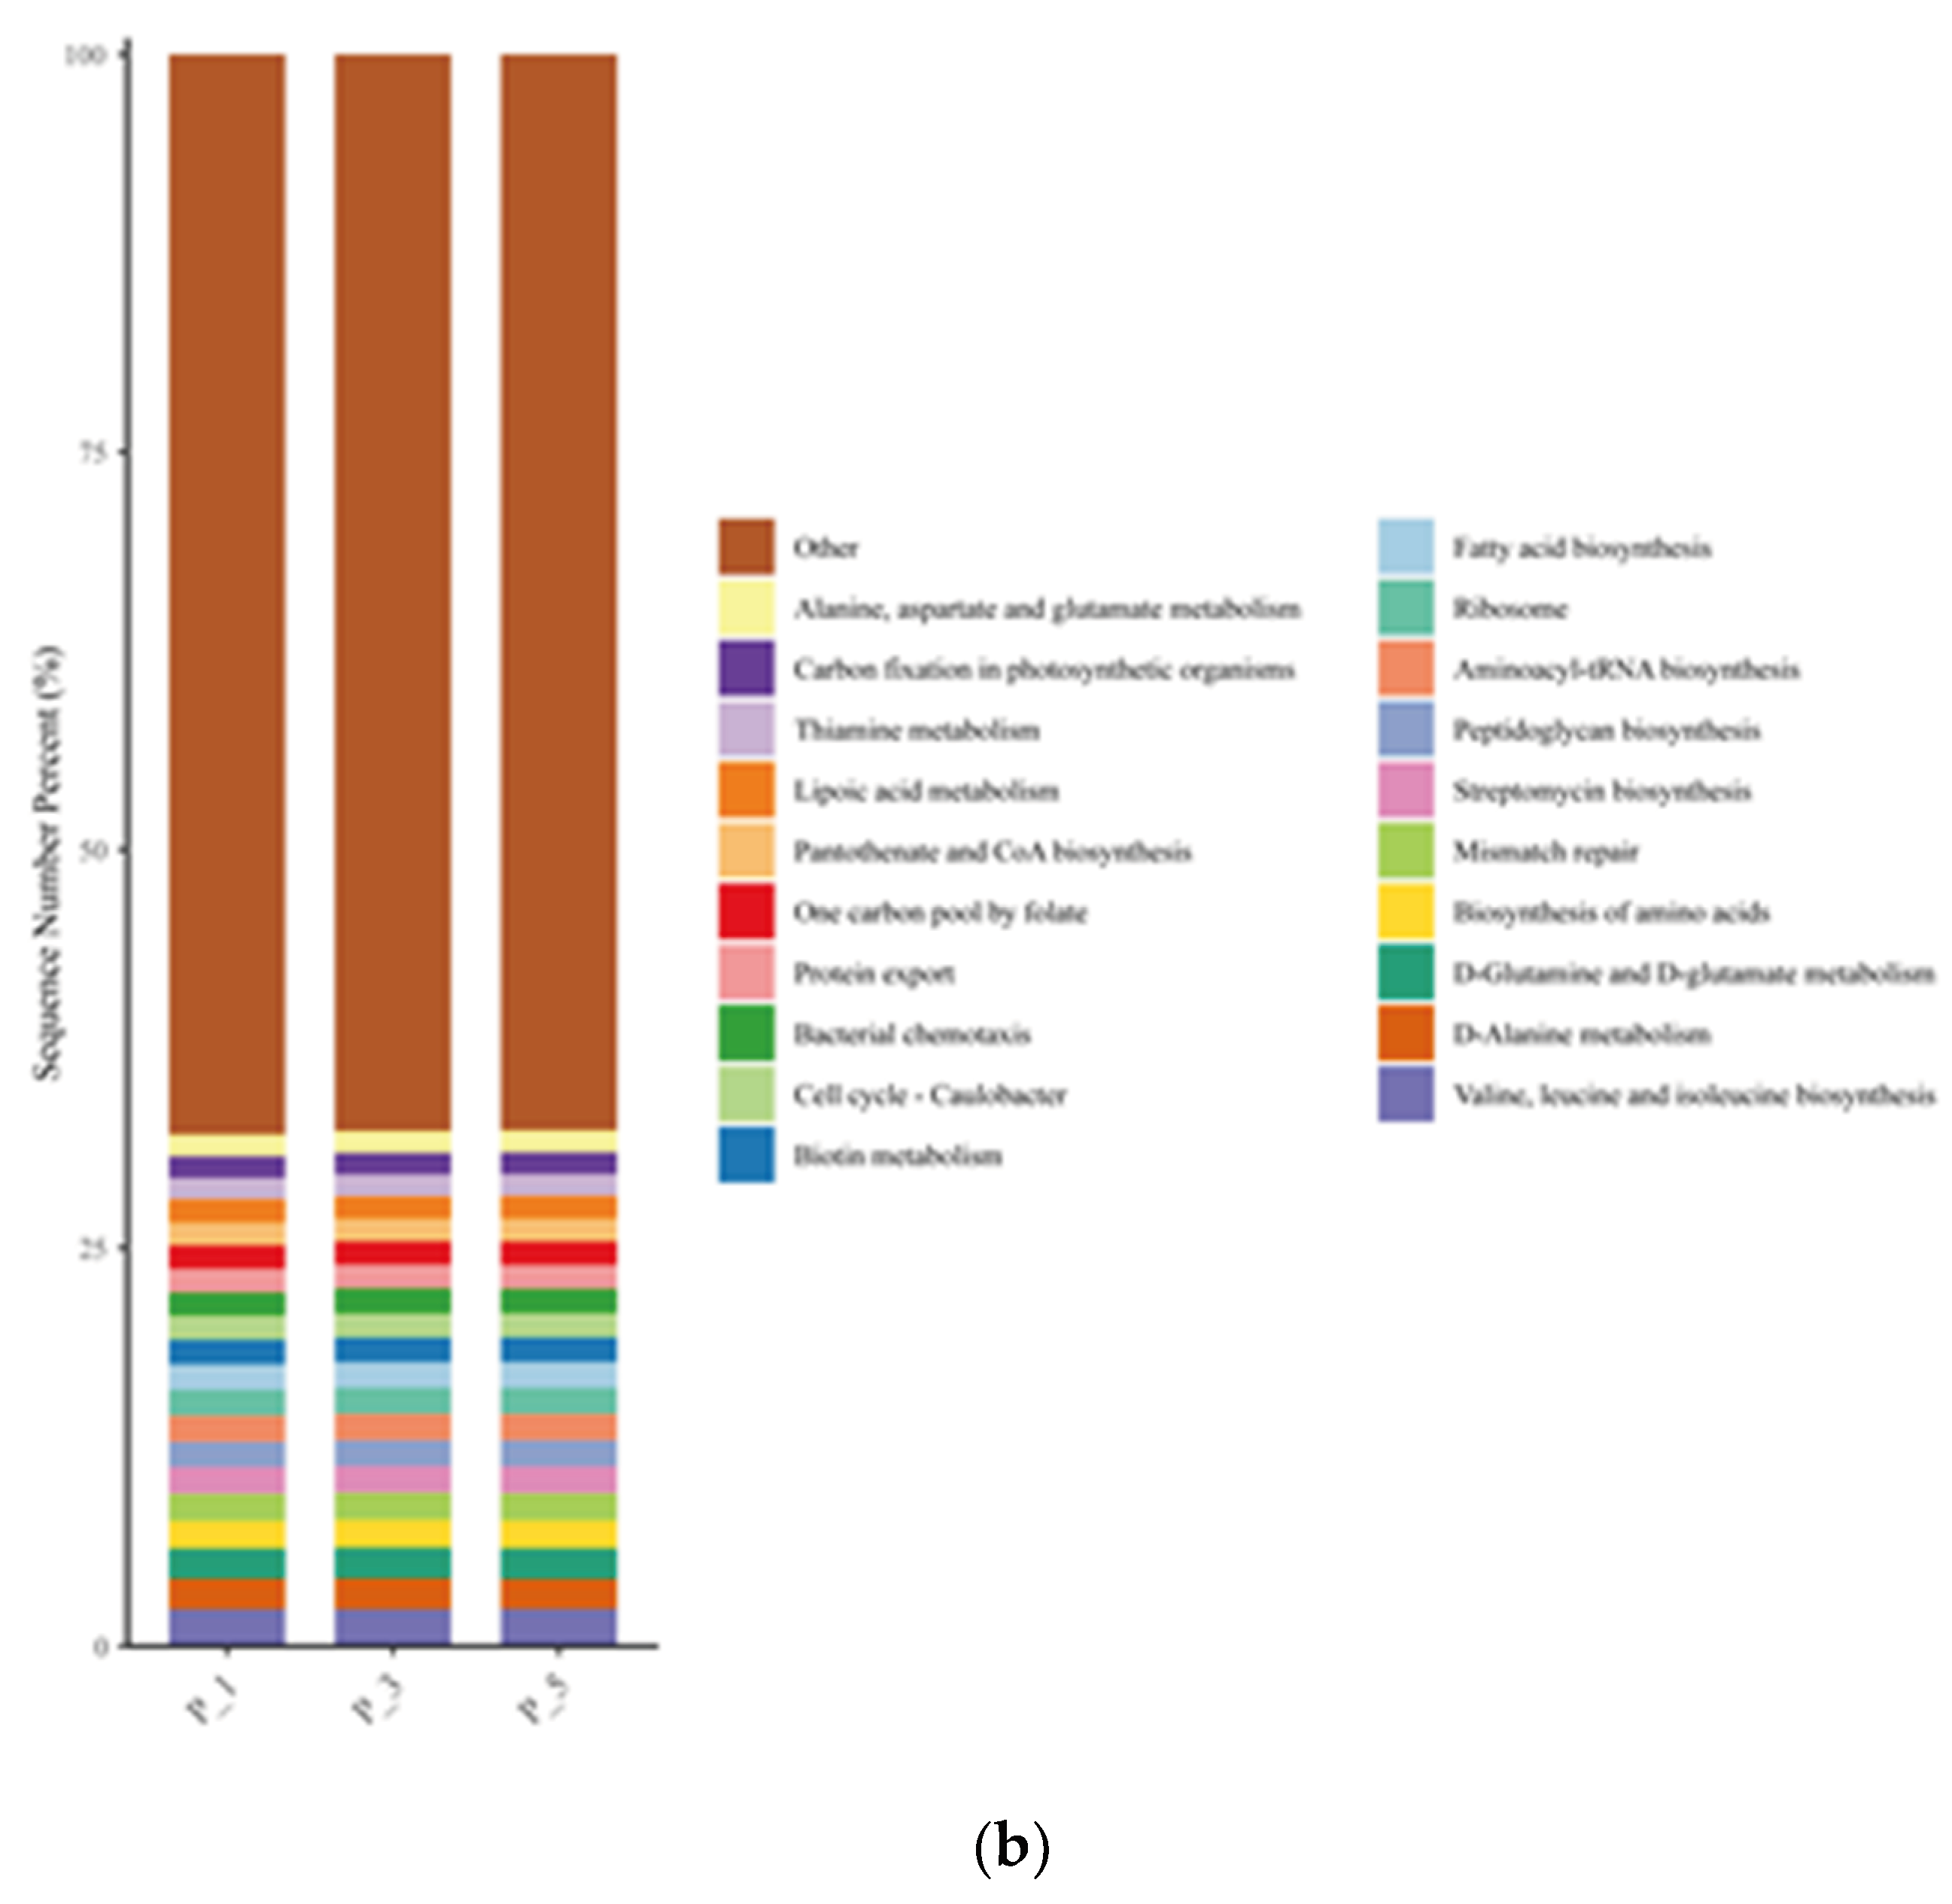
Bar graphs describing KEGG pathways at level 1 (a) and level 3 (b) in lactating Bactrian camel feces. The horizontal axis represents parities P_1 (10 female lactating camels, 1st parity), P_3 (10 female lactating camels, 3rd parity), and P_5 (10 female lactating camels, 5th parity). The vertical axis, or Sequence Number Percent, visualizes the percentage of sequences attributed to the corresponding Kyoto Encyclopedia of Genes and Genomes (KEGG) pathway. The color scheme for the bar graphs, moving from top to bottom, corresponds to the colors for each KEGG pathway displayed on the right, ranging from the least to the most relative abundances, with ‘Other’ being an exception. At level 3, ‘Other’ signifies the cumulative percentage of all other KEGG pathways that did not make the top 20.
Figure 6.
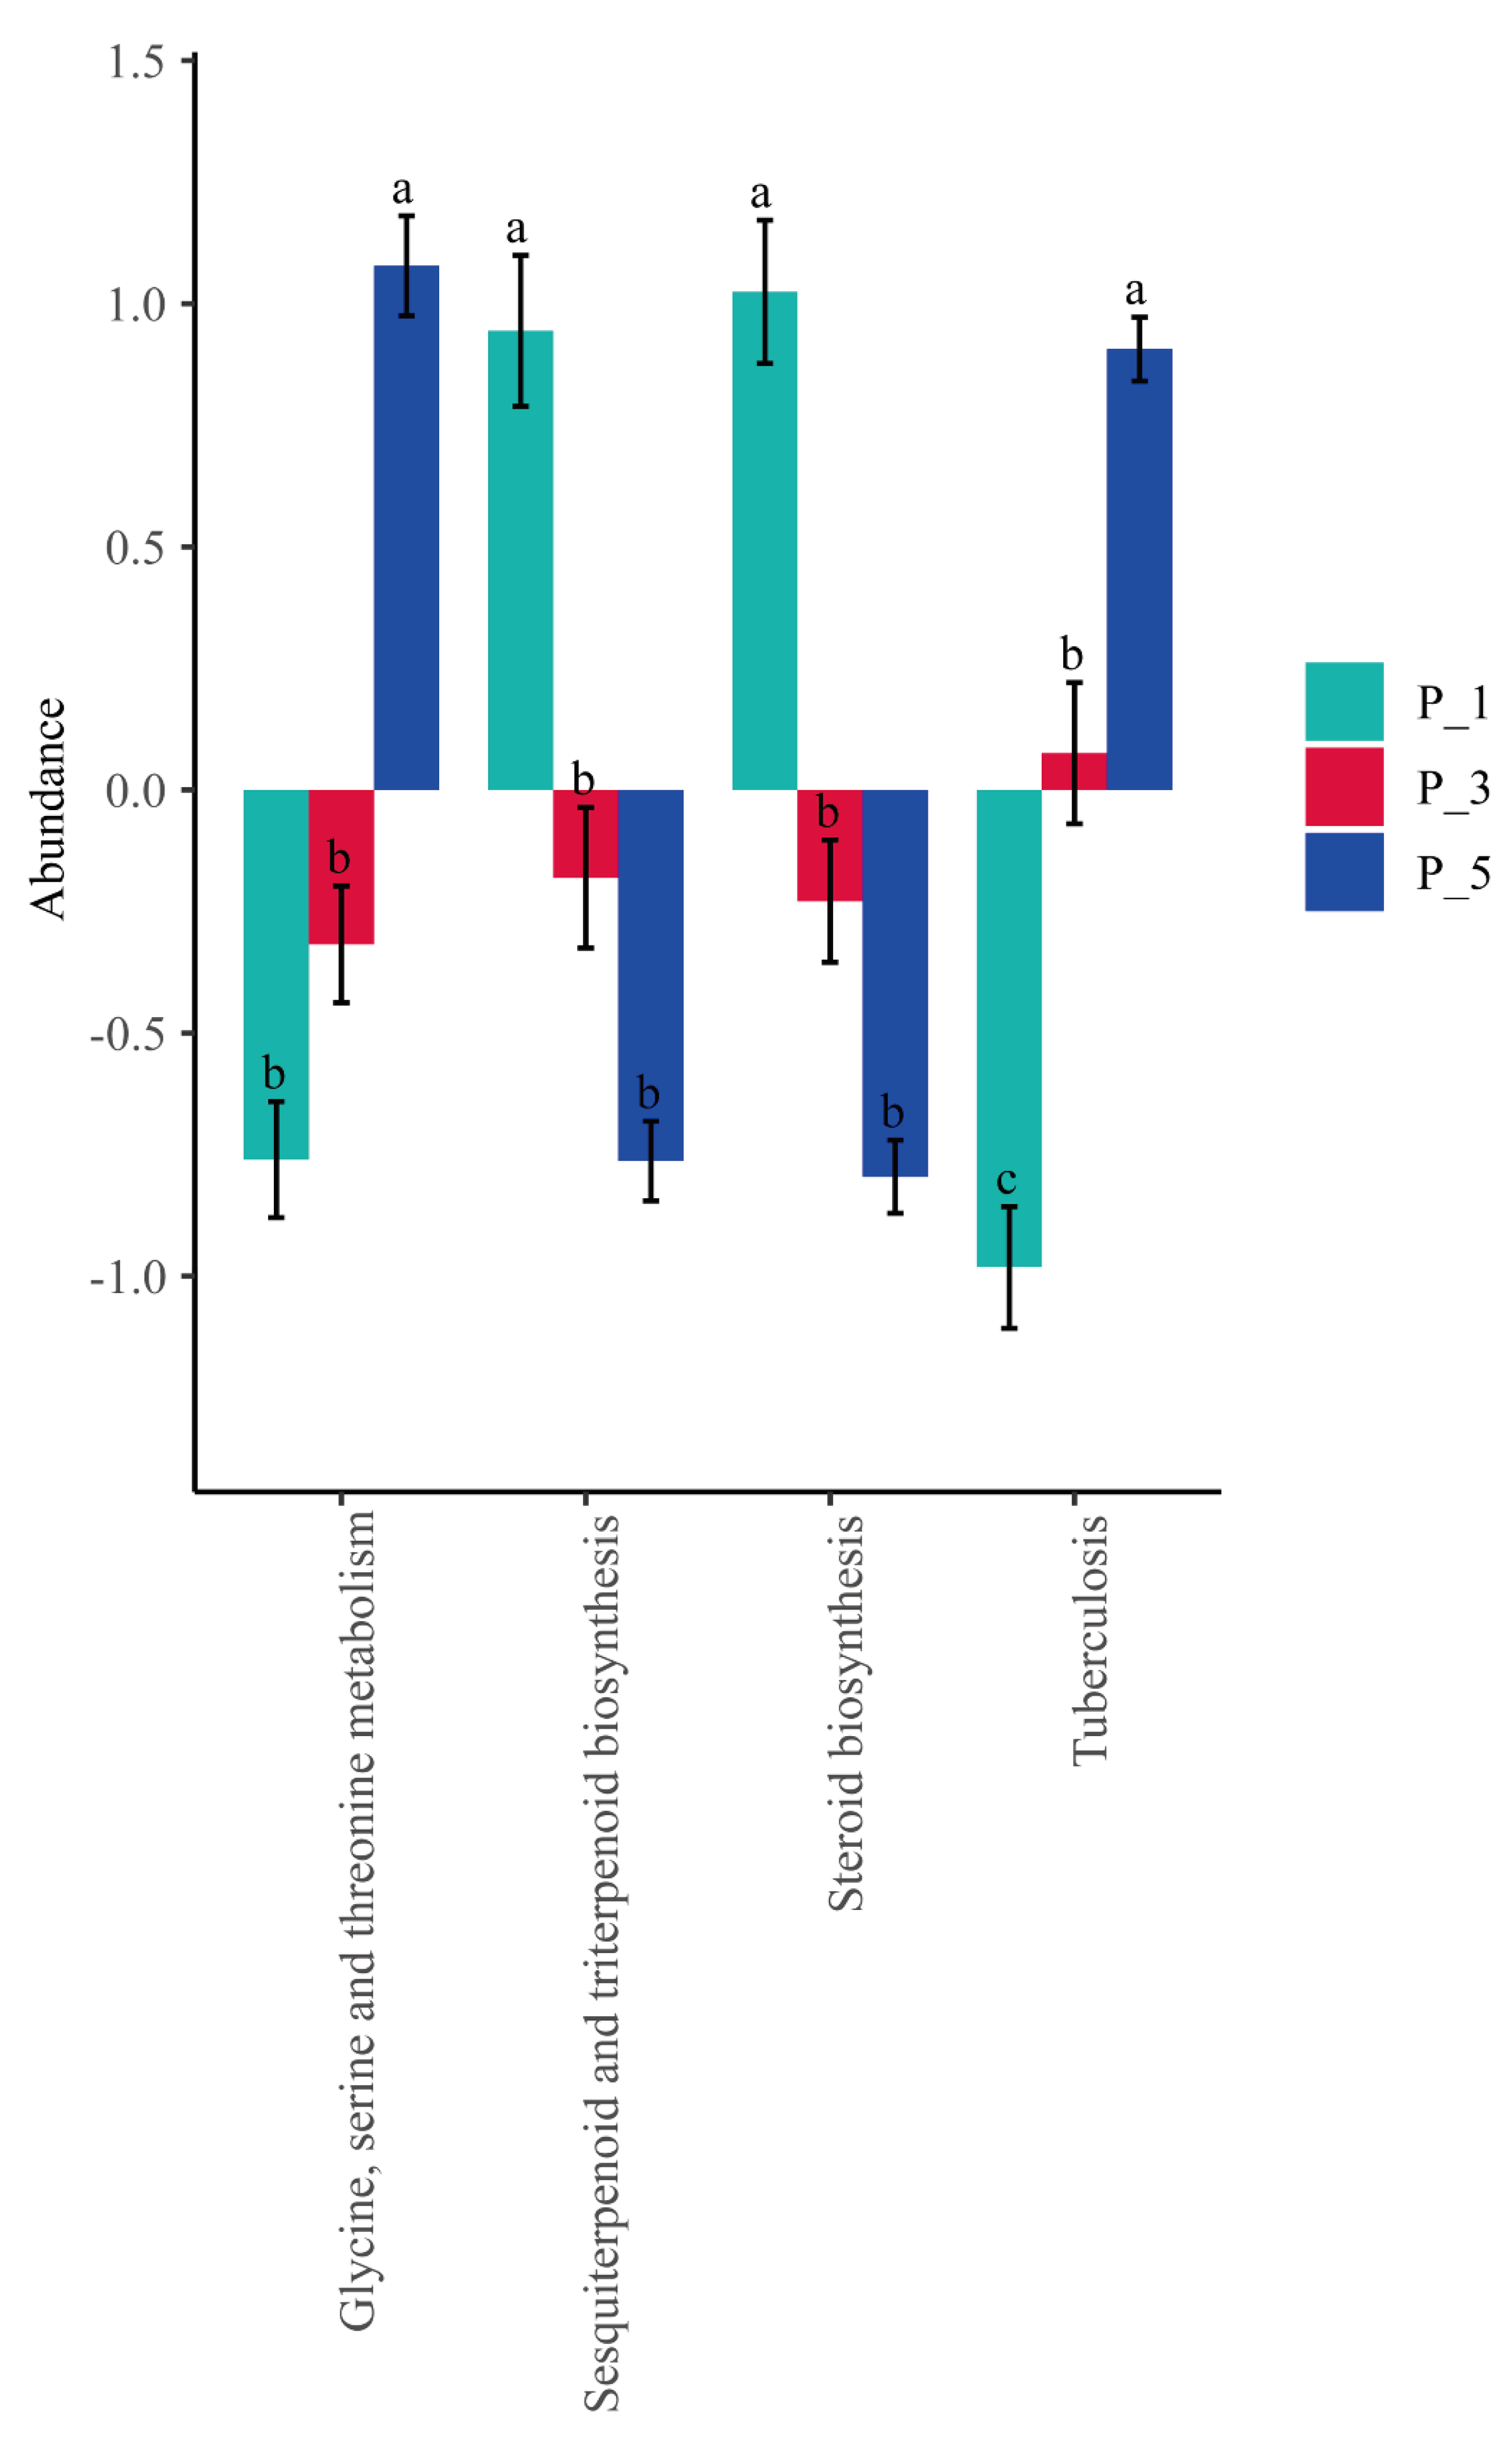
The significantly changed KEGG pathways of fecal microbial community among groups in lactating Bactrian camel. The colors Brown, Red, and Green correspond to P_1 (10 female lactating camels, 1st parity), P_3 (10 female lactating camels, 3rd parity), and P_5 (10 female lactating camels, 5th parity), respectively. The horizontal axis denotes the KEGG pathways that display significant changes, each differentiated by color. The vertical axis represents the relative abundances. If the letters on the bars between two groups differ, they denote significant disparity (P < 0.05); otherwise, the difference is considered insignificant.
Figure 7.
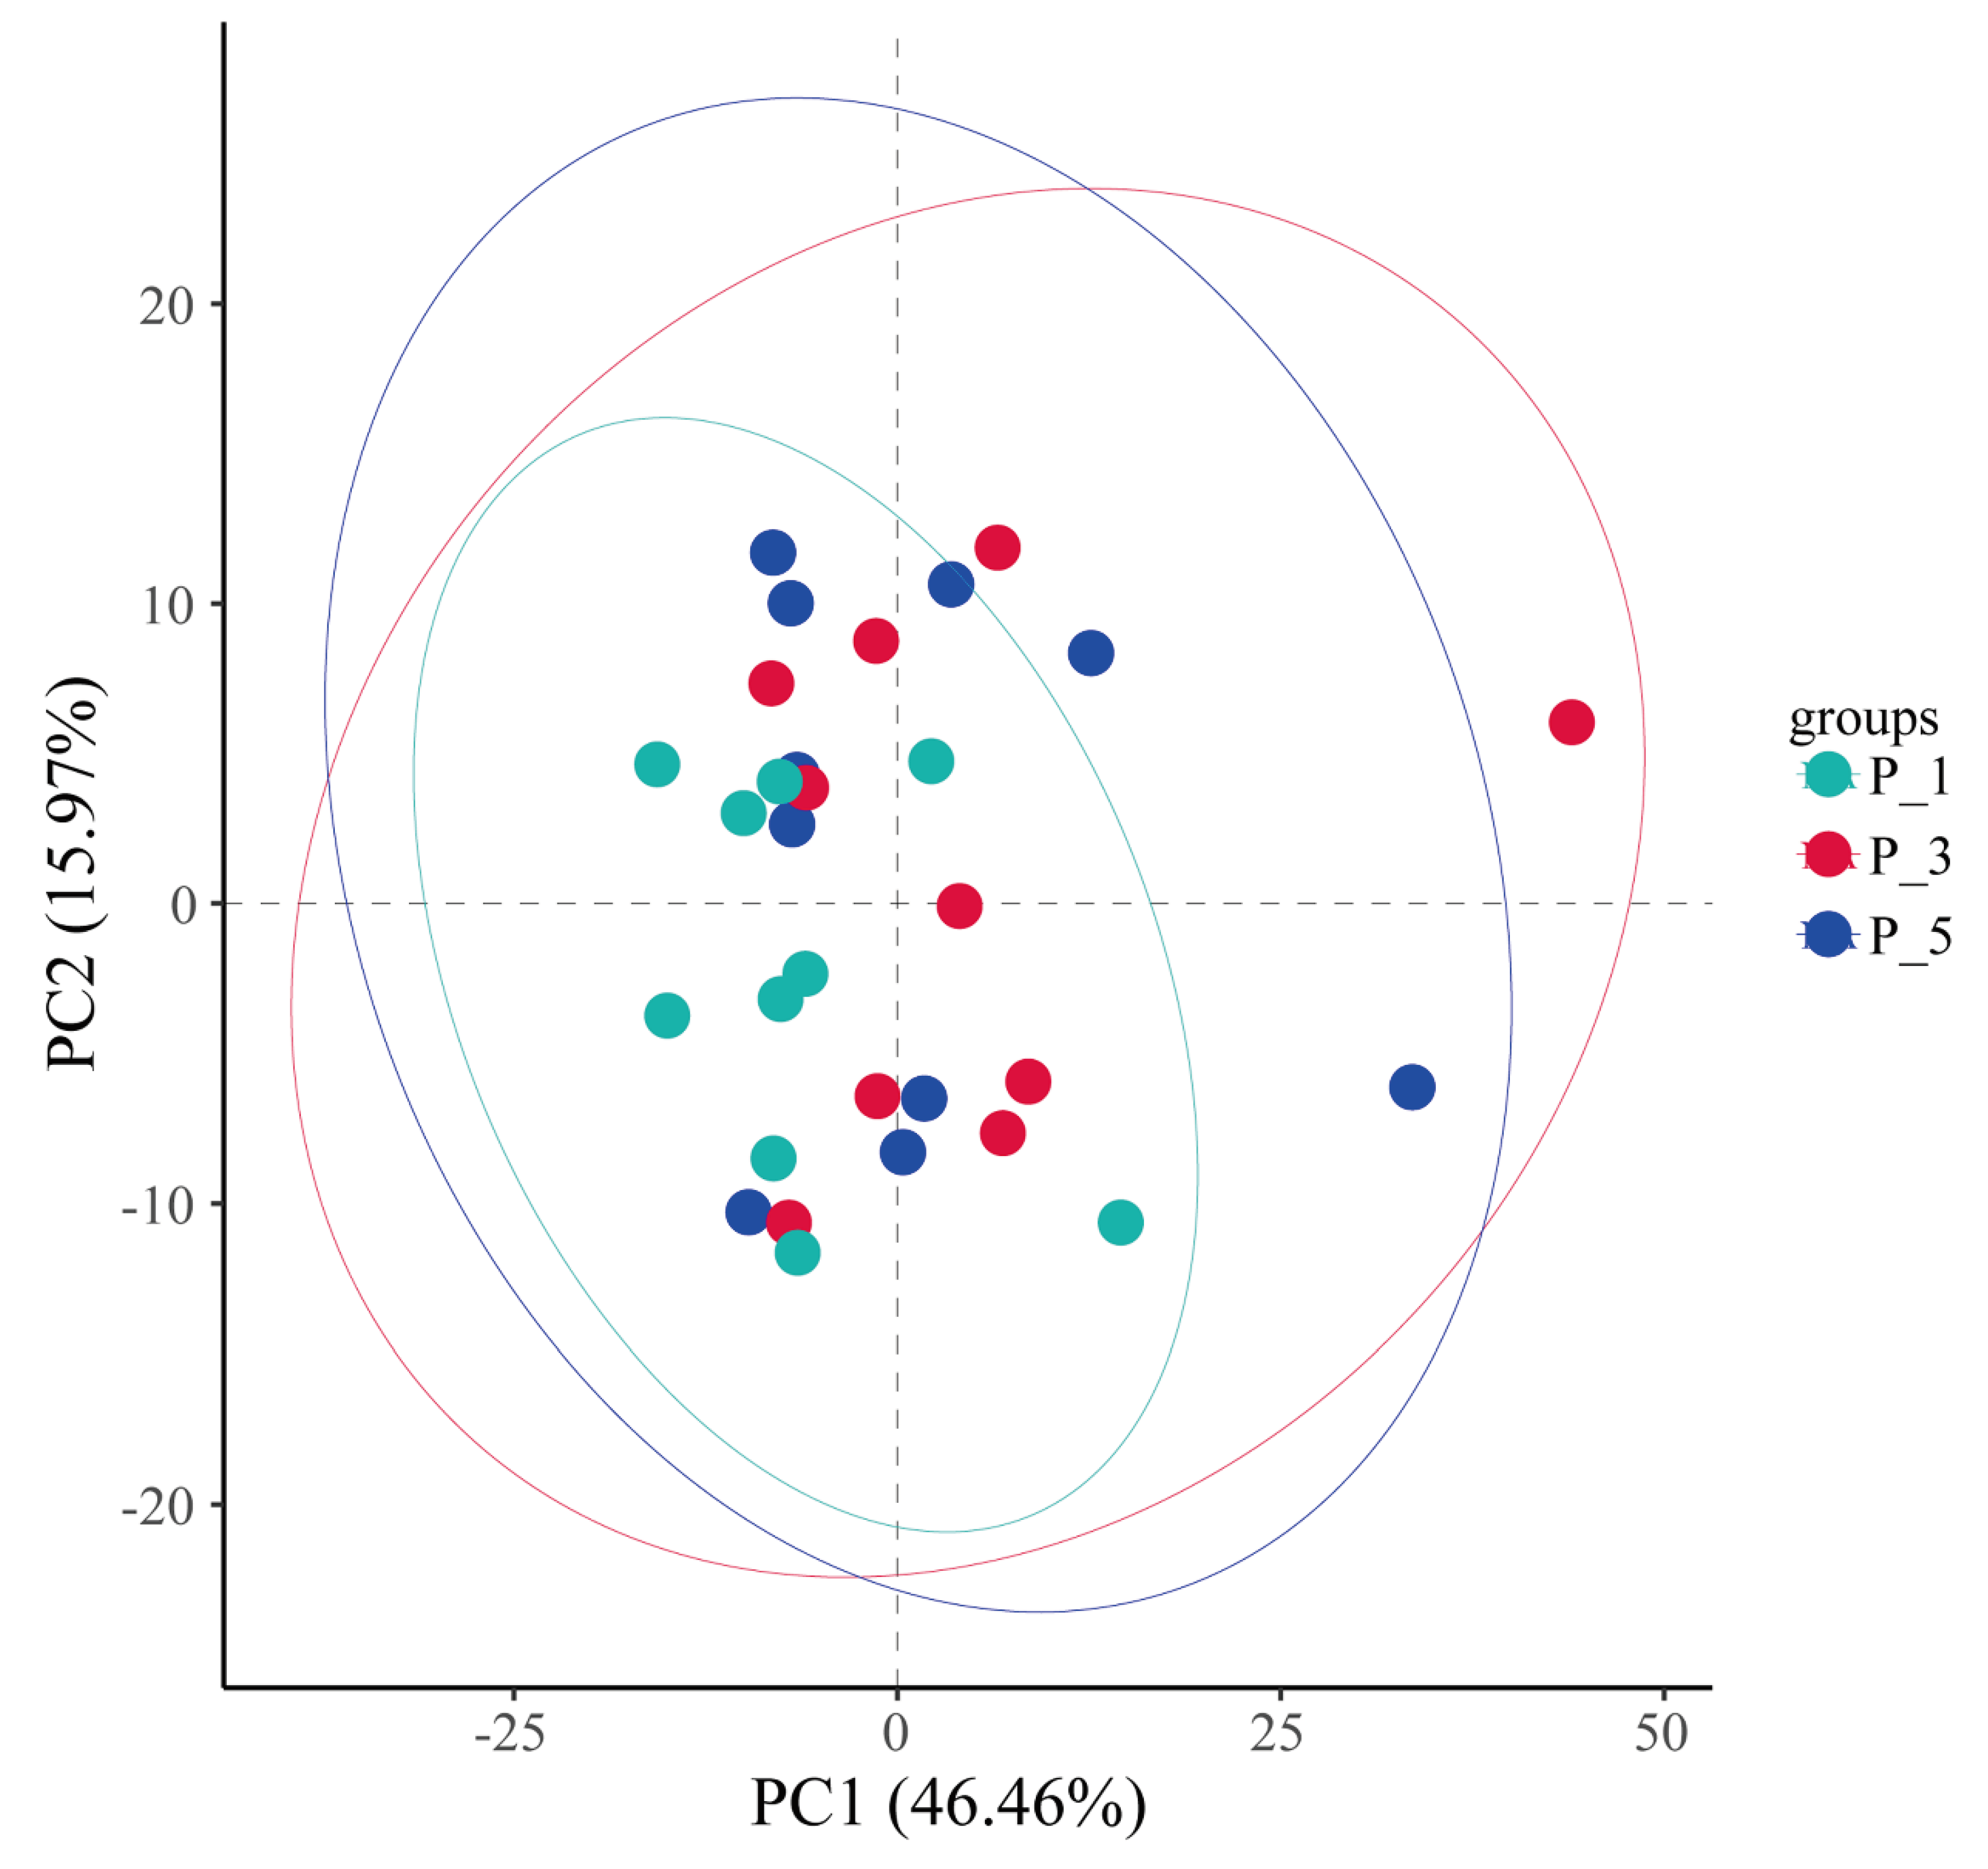
Principle component analysis (PCA) of the fecal microbial communities in lactating Bactrian camel. The colors Brown, Red, and Green are symbolic of P_1 (10 female lactating camels, 1st parity), P_3 (10 female lactating camels, 3rd parity), and P_5 (10 female lactating camels, 5th parity), respectively. Each plot corresponds to a unique sample, and plots bearing the same color are representative of identical groups.
Figure 8.
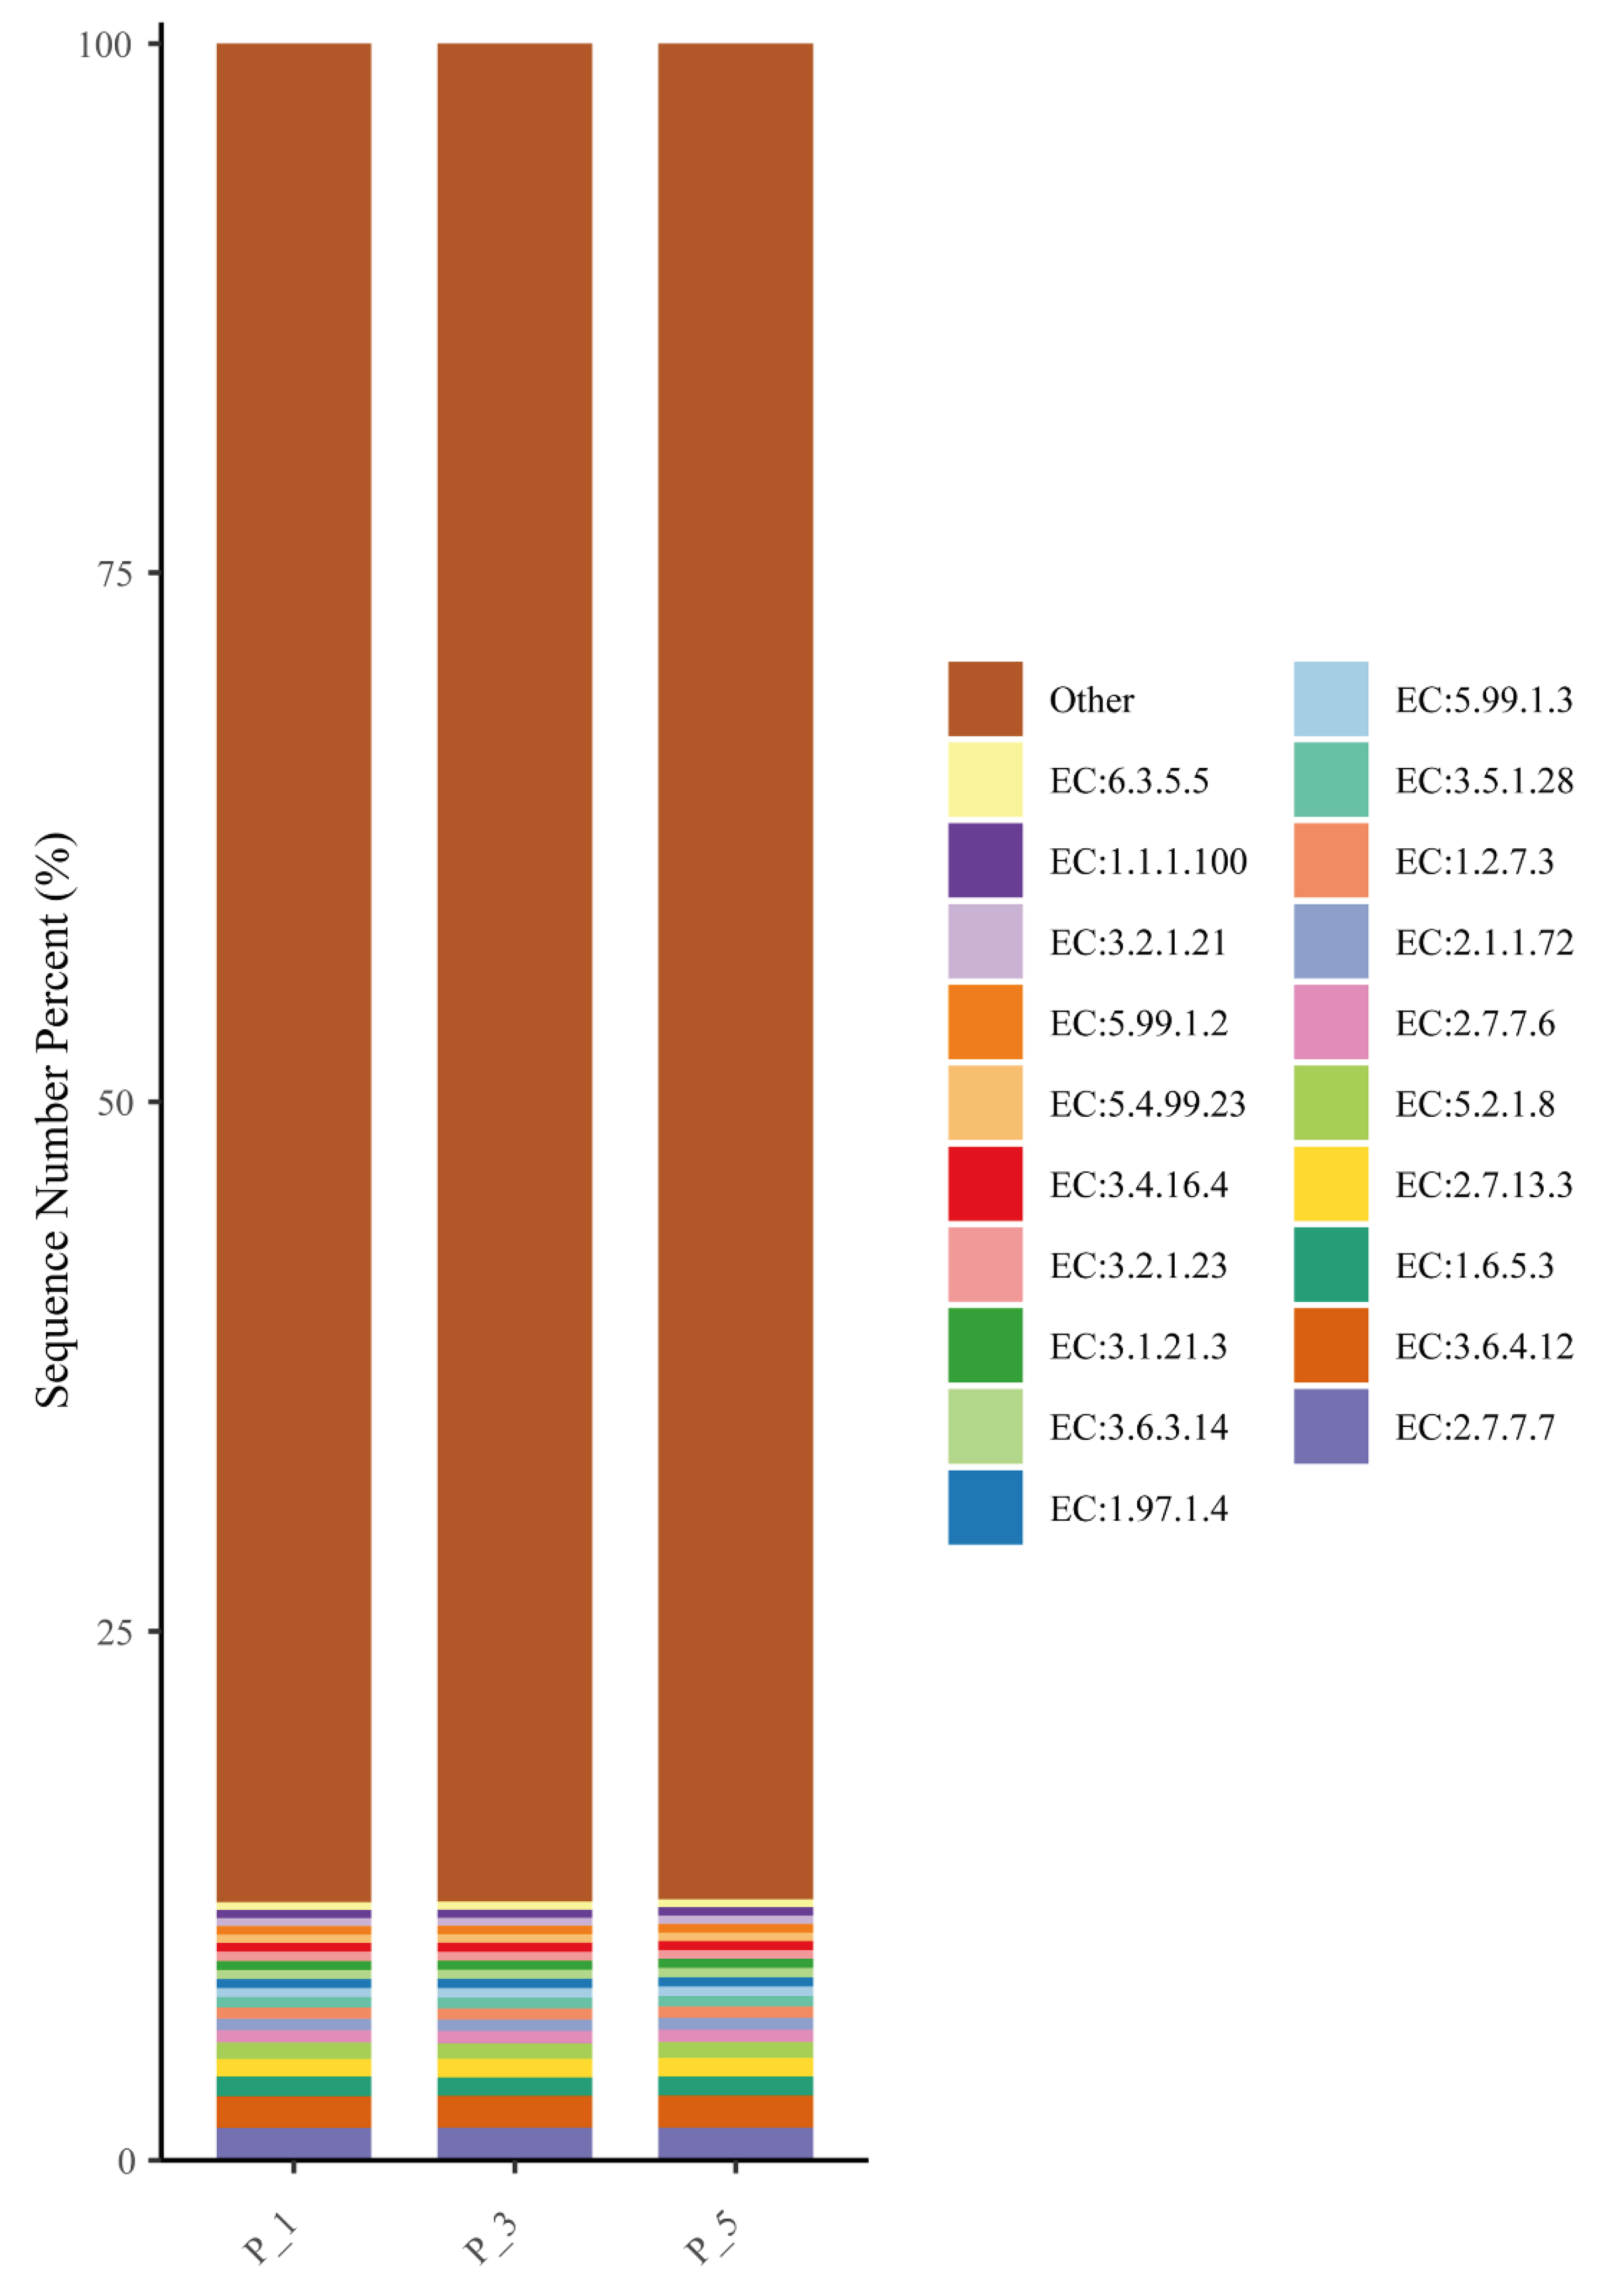
Bar graphs describing the top 20 relatively abundant ECs in lactating Bactrian camel feces. The horizontal axis denotes the parities: P_1 (10 female lactating camels, 1st parity), P_3 (10 female lactating camels, 3rd parity), and P_5 (10 female lactating camels, 5th parity). The vertical axis, referred to as Sequence Number Percent, illustrates the percentage of sequences allocated to the associated Enzyme Commission numbers (ECs). The colors of the bar graphs, arranged from top to bottom, correspond to the colors of each EC on the right, organized from the lowest to the highest relative abundances, with ‘Other’ being an exception. ‘Other’ represents the aggregate percentage of other KEGG pathways that did not make the top 20.
Figure 9.
The significantly changed ECs of fecal microbial community among groups in lactating Bactrian camel. In this depiction, Brown symbolizes P_1 (10 female lactating camels in their 1st parity), Red stands for P_3 (10 female lactating camels in their 3rd parity), and Green signifies P_5 (10 female lactating camels in their 5th parity). The horizontal axis denotes the ECs that exhibit substantial changes, while the vertical axis signifies their relative abundances. If the lettering on the bar between two groups differs, it indicates a significant variation (P < 0.05); if not, the difference is considered statistically insignificant.
Figure 10.
Principle component analysis (PCA) of the fecal microbial communities in lactating Bactrian camel. In this representation, Brown denotes P_1 (10 female lactating camels, first parity), Red corresponds to P_3 (10 female lactating camels, third parity), and Green signifies P_5 (10 female lactating camels, fifth parity). Each plotted point denotes a single sample, and points with identical colors are part of the same group.
Figure 11.
Spearman’ correlation between KEGG and the fecal microbes (a) or ECs (b) in lactating Bactrian camel. In the horizontal direction, the figures represent the values for fecal microbes (a) or ECs (b), while the vertical direction represents the values for the KEGG pathways. Significant correlations (P < 0.05) are denoted by *, highly significant correlations (P < 0.01) by **, and extremely significant correlations (P < 0.001) by ***. Positive correlation coefficients are depicted in red, with darker shades indicating stronger positive correlations. Negative correlation coefficients are represented in blue, with deeper shades indicating stronger negative correlations. The bar on the right displays the correlation coefficient values (R).
Table 1.
Comparison of Alpha-diversity index among groups of the fecal microbial community in lactating Bactrian camel (n = 10).
Table 1.
Comparison of Alpha-diversity index among groups of the fecal microbial community in lactating Bactrian camel (n = 10).
| Variable |
Group 1 |
Group 2 |
P-value |
| faith_pd* |
P_5 |
P_3 |
1.000 |
| P_5 |
P_1 |
0.796 |
| P_3 |
P_1 |
0.853 |
| Observed OTUs |
P_5
P_5
P_3 |
P_3
P_1
P_1 |
0.143
0.089
0.247 |
| shannon_entropy |
P_5
P_5
P_3 |
P_3
P_1
P_1 |
0.393
0.015
0.015 |
| simpson |
P_5
P_5
P_3 |
P_3
P_1
P_1 |
0.481
0.023
0.089 |
Table 2.
Comparison of ANOSIM among groups of the fecal microbial community in lactating Bactrian camel (n = 10).
Table 2.
Comparison of ANOSIM among groups of the fecal microbial community in lactating Bactrian camel (n = 10).
| Group 1 |
Group 2 |
Q-value1
|
| P_1 |
P_3 |
0.035 |
| P_1 |
P_5 |
0.003 |
| P_3 |
P_5 |
0.003 |
Table 3.
Comparison of PERMANOVA among groups of the fecal microbial community in lactating Bactrian camel (n = 10).
Table 3.
Comparison of PERMANOVA among groups of the fecal microbial community in lactating Bactrian camel (n = 10).
| Group 1 |
Group 2 |
Q-value1
|
| P_1 |
P_3 |
0.035 |
| P_1 |
P_5 |
0.003 |
| P_3 |
P_5 |
0.008 |
| |
|
|
