1. Introduction
Lysophosphatidic acid (LPA) is a simple lipid containing a glycerol moiety esterified to a phosphate group at position 3 and a fatty acid at position 2. It is considered a “bioactive lipid”, implying that, in addition to its metabolic roles, it modulates a wide range of cellular, organ, and whole animal responses through a series of six G protein-coupled receptors, i.e., the LPA receptor family [
1,
2,
3]. They have the characteristic seven transmembrane hydrophobic domains connected by three intracellular loops and three extracellular loops, with an extracellular amino-terminal group and an intracellular carboxyl terminus. These receptors are subdivided into those belonging to the lysophospholipid receptors (LPA
1-3) and those related to the purinergic family (LPA
4-6) [
1,
2,
4].
The present work is focused on the LPA
3 receptor (previously named EDG 7 [
5]), which is known to interact mainly with two different G protein types, G
αi/o and G
αq/11, likely involved in adenylyl cyclase inhibition, and calcium mobilization, triggering different signaling processes via their α and βγ subunits (reviewed in [
1,
2,
3,
4,
5,
6]); other G proteins might also be involved in LPA
3 actions [
7,
8]. It is generally accepted that in addition to the immediate membrane signaling, many G protein-coupled receptors exert an endosomal second wave of signaling (reviewed in [
9,
10,
11,
12,
13]; to our knowledge, information on the molecular events in LPA
3 endosomal signaling has not been documented. In contrast, there is essential and abundant information on the participation of LPA
3 receptors in many physiological functions and pathological processes. These include chemotaxis [
14], migration [
15], proliferation [
16], differentiation [
17], embryo implantations [
18], determination of vertebrate left-right patterning during embryogenesis [
19], and cardiac dysfunction [
20,
21], among many others (see also [
6,
22]). The relevant role of LPA and its receptors in cancer has been recently reviewed (see [
23] and references therein). It is worth mentioning that an increase in the LPA
3 receptor action has been observed in some cancer cell lines, such as rat neuroblastoma cells [
24] or rat hepatoma [
25]. In addition, LPA
3 receptor expression seems to be directly related to resistance to chemotherapy, metastases, and, therefore, aggressiveness in some cancers, such as lung cancer [
26], breast cancer [
27], or pancreatic cancer [
28]. In ovarian cancer, LPA
3 expression is considered a therapeutic target and a poor prognosis marker [
16,
29].
Despite its physiological and pathophysiological relevance, many aspects of the signaling and regulation of the function of this receptor remain poorly explored or unknown. Receptor phosphorylation seems to be an early event participating in the desensitization of G protein-mediated signaling, endocytosis, endosomal traffic, and triggering of the second wave of signaling [
9,
10,
11,
12,
13,
30]. Phosphorylation of LPA
3 receptors in response to the agonist, LPA, and to activation of protein kinase C (PKC) by phorbol esters has already been reported [
31]. However, the key elements determining the consequences of receptor phosphorylation seem to be the individual sites or clusters phosphorylated; the process is commonly called the “phosphorylation barcode hypothesis” [
13,
30,
32,
33,
34]. In silico analysis has allowed the suggestion of putative phosphorylation sites [
6,
35], but no experimental evidence is available. In the present work, we provide evidence to fill the mentioned knowledge gaps. We expressed the human LPA
3 receptor employing a cellular model system that allows abundant receptor expression in an inducible fashion [
36]. We characterized various signaling events using these cells, immunopurified the receptors, and used mass spectrometry to detect LPA
3 phosphorylation sites experimentally.
2. Results
The effect of LPA on intracellular calcium was tested in non-transfected HEK 293 TREx cells. As shown in
Figure 1A, a very small (≈ 20 nM) increase in calcium concentration was observed. A similar effect was observed in transfected cells in which receptor expression was not induced (
Figure 1A). In contrast, a robust increase in the intracellular calcium concentration (≈ 200-300 nM) was induced by 1 µM LPA in transfected cells in which LPA
3 receptor expression was induced (
Figure 1A); these data indicate that the LPA
3 receptors were functional.
The role of calcium entry in the action of LPA was tested. When cells were incubated in buffer without calcium, the LPA-induced increase in the calcium response was only marginally decreased (352 ± 61 nM and 328 ± 92 nM in cells incubated in buffer with and without calcium, respectively; n = 4, using cells from different cell cultures). The data indicate a predominant role of intracellular calcium mobilization in the effect of the lysophospholipid (
Figure 1B). Preincubation for 30 min with the phospholipase C inhibitor, U73122 (10 µM) [
37,
38], essentially abolished the action of LPA (the increases in calcium concentration were: 306 ± 46 nM without inhibitor and 23 ± 13 with U73122; n = 3, p < 0.001), but thapsigargin was still able to increase intracellular calcium
Figure 1C). The inactive analog, U73343 [
37,
38], did not alter the LPA action under the same conditions (increase 363 nM).
Afterward, we examined the effect of pertussis toxin, a well-known blocker of G
i/o. Surprisingly, the LPA-induced increase in intracellular calcium concentration was not diminished even using preincubation for 24 h with 300 ng/ml (usually we employ 100 ng/ml) (
Figure 1D). As a control, we examined pertussis toxin action in cells expressing the LPA1 receptor.
Supplementary Figure S1A shows that LPA
1-expressing cells have a robust calcium response to the lysophospholipid and that such effect was completely blocked by preincubation with 300 ng/ml pertussis toxin. These data suggest that these two LPA receptor subtypes exhibit distinct preferences in their coupling to the various types of G proteins. To further characterize the G protein(s) involved, we employed YM-254890, a cyclic depsipeptide Gαq inhibitor [
39,
40]. Surprisingly, cell preincubation for 1 min with 1 µM YM-254890 [
40] essentially eliminated the calcium response to LPA in cells expressing either LPA
1 or LPA
3 receptors; in both cases, thapsigargin was able to increase intracellular calcium (
Supplementary Figure S2). Lower YM-254890 concentrations (100-300 nM) only marginally diminished LPA-induced calcium response in cells expressing LPA
1 or LPA
3 receptors (data not shown).
It is known that either receptor activation by agonists or stimulation of unrelated receptors or signaling proteins, such as some protein kinases, can induce receptor desensitization. They are usually named homologous and heterologous desensitization, respectively. To explore this, cells were incubated with 1 µM LPA for 5 min and washed 3 times with the Krebs-Ringer solution (Section 2.3) to remove the LPA present. The cells were resuspended in the same buffer and stimulated with 1 µM LPA. As shown in
Figure 1E, preincubation with the agonist did not induce any detectable homologous desensitization. On the contrary, pretreatment with the PKC activator, PMA (1 µM) for 5 minutes markedly diminished the effect of 1 µM LPA (≈ 80% reduction) (
Figure 1E,F); i.e., the data evidenced heterologous desensitization. Data in
Supplementary Figure S1B,C showed that cells expressing the LPA
1 receptors are subjected to marked homologous and heterologous desensitization.
We considered the possibility that low expression of G protein-coupled receptor kinases (GRKs) could be responsible for the essentially absent, homologous desensitization of the LPA
3 receptors. However, in experiments in which GRK2 or GRK5 were overexpressed, agonist activation did not induce any significant desensitization of calcium signaling (
Supplementary Figure S3). Similarly, in cells where LPA
3 expression was decreased by induction with only 10 ng/ml doxycycline hyclate, absence of agonist-induced LPA
3 desensitization was observed (data not shown).
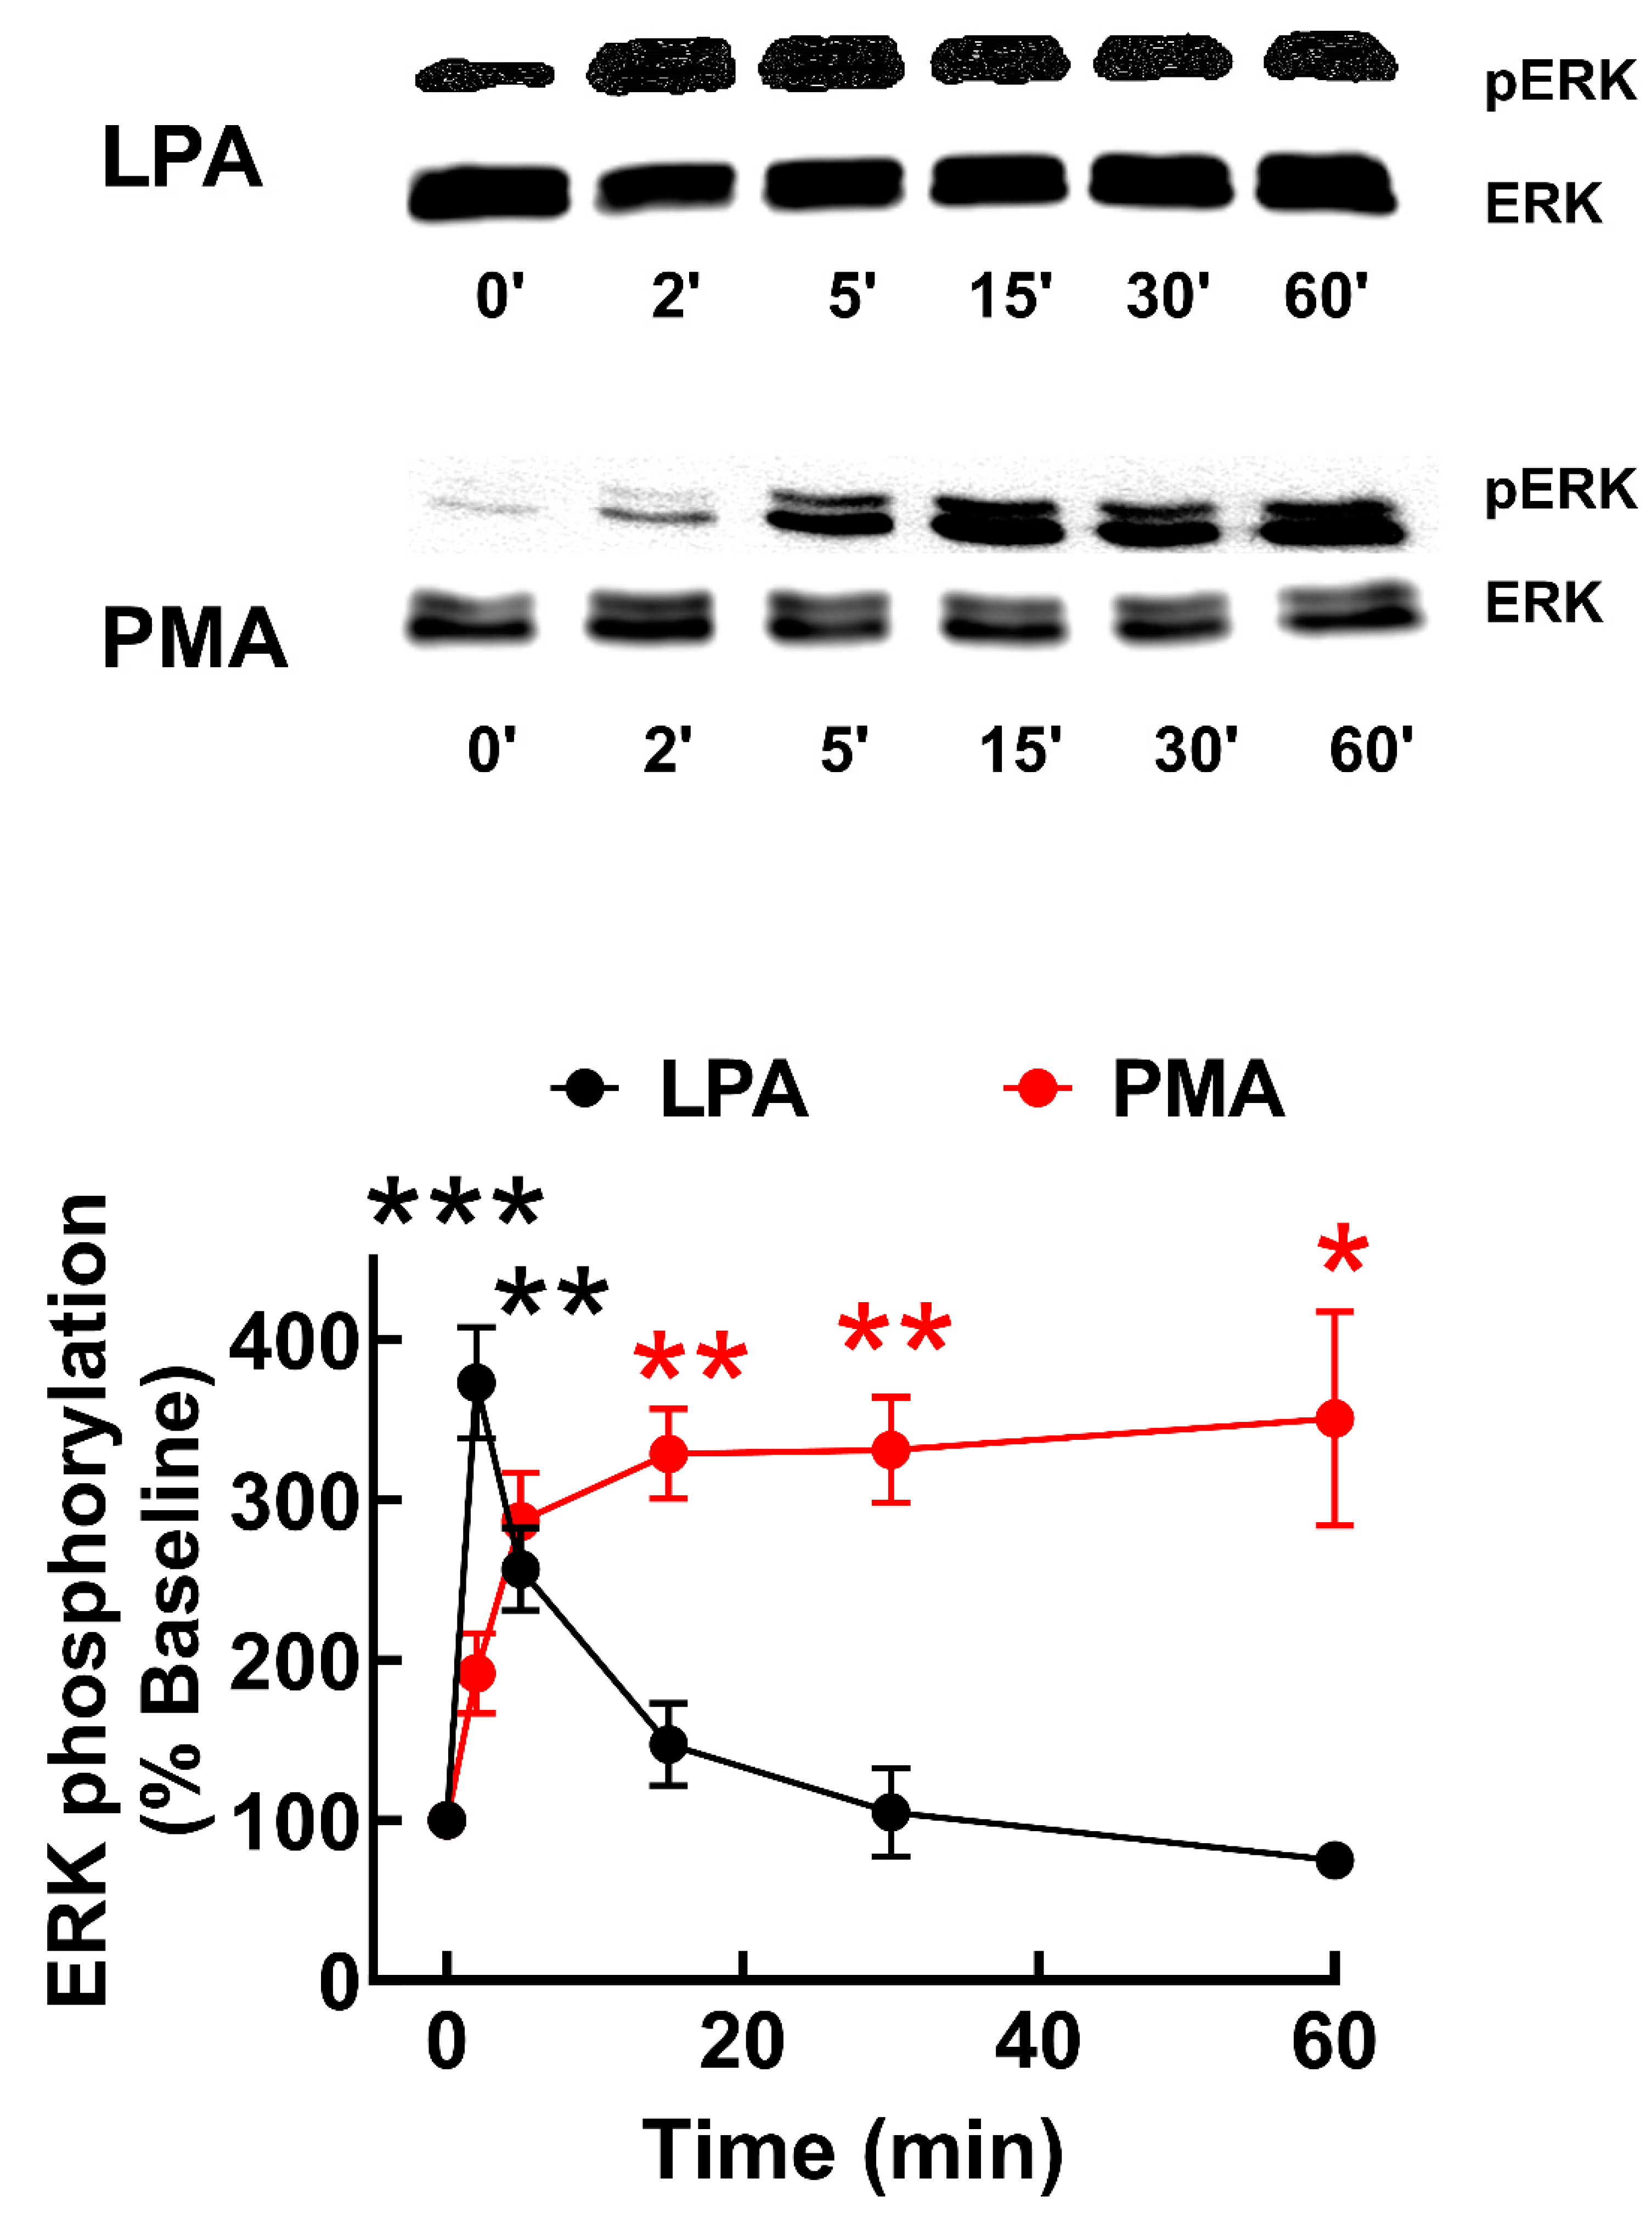
The increase in intracellular calcium is a transient but immediate response to LPA
3 receptor stimulation. ERK 1/2 phosphorylation, a lengthier LPA action, was also studied to explore signaling further. LPA
3 activation with 1µM LPA resulted in a rapid increment in ERK 1/2 phosphorylation, which was maximal at 2 min and progressively decreased to near-baseline values (
Figure 2). In contrast, 1 µM PMA increased ERK phosphorylation more slowly, reaching a near maximum level at 5 min, and remaining at this phosphorylation state during the incubation (60 min) (
Figure 2); PMA is known to activate the mitogen-activated protein kinase pathway through PKC [
41].
Intrigued by the insensitivity to pertussis toxin of the calcium response to LPA, we assessed the effect of this toxin in the ERK phosphorylation response. In parallel experiments, LPA
3-expressing cells were preincubated with or without 300 ng/ml pertussis toxin and then challenged with 1 µM LPA for the times indicated; samples were also run in the same gel and Western blot analysis performed in the same membranes (
Supplementary Figure S4). As observed, treatment with pertussis toxin decreased baseline (time 0 min) ERK 1/2 phosphorylation, but the time courses of LPA action were very similar (i.e., essentially identical if the respective baselines were normalized to 100%). Therefore, the data indicate that G
αi blockade with pertussis toxin barely affects the agonist LPA
3 receptor-mediated ERK phosphorylation response.
The possibility that internalization of the LPA
3 receptor could participate in ERK phosphorylation was explored employing Pitstop 2, an inhibitor of the terminal domain of clathrin heavy chains [
42,
43]. Pretreatment for 15 min with 10 µM Pitstop 2 markedly decreased (almost eliminated) baseline ERK 1/2 phosphorylation and the effect of LPA at times studied (
Supplementary Figure S5). In contrast, the effect of Pitstop 2 on PMA-mediated action showed a different pattern. The marked decrease in baseline ERK phosphorylation was confirmed in these experiments, but PMA markedly and consistently increased ERK phosphorylation in cells pretreated with Pitstop 2, although the effect was noticeably delayed (
Supplementary Figure S6). The effect of EGF was also tested; it was observed in parallel experiments that the action of the peptide growth factor was only marginally affected by Pitstop 2 at the time studied (15 min) (
Supplementary Figure S8).
The effect of the Gαq inhibitor, YM-254890, on LPA-induced ERK phosphorylation was explored in cells expressing LPA
1 or LPA
3 receptors. As shown in
Supplementary Figure S8, this agent decreased the action of LPA on ERK phosphorylation in cells expressing LPA
1 or LPA
3 receptors; however, the inhibition was more noticeable in the LPA
3-expressing cells.
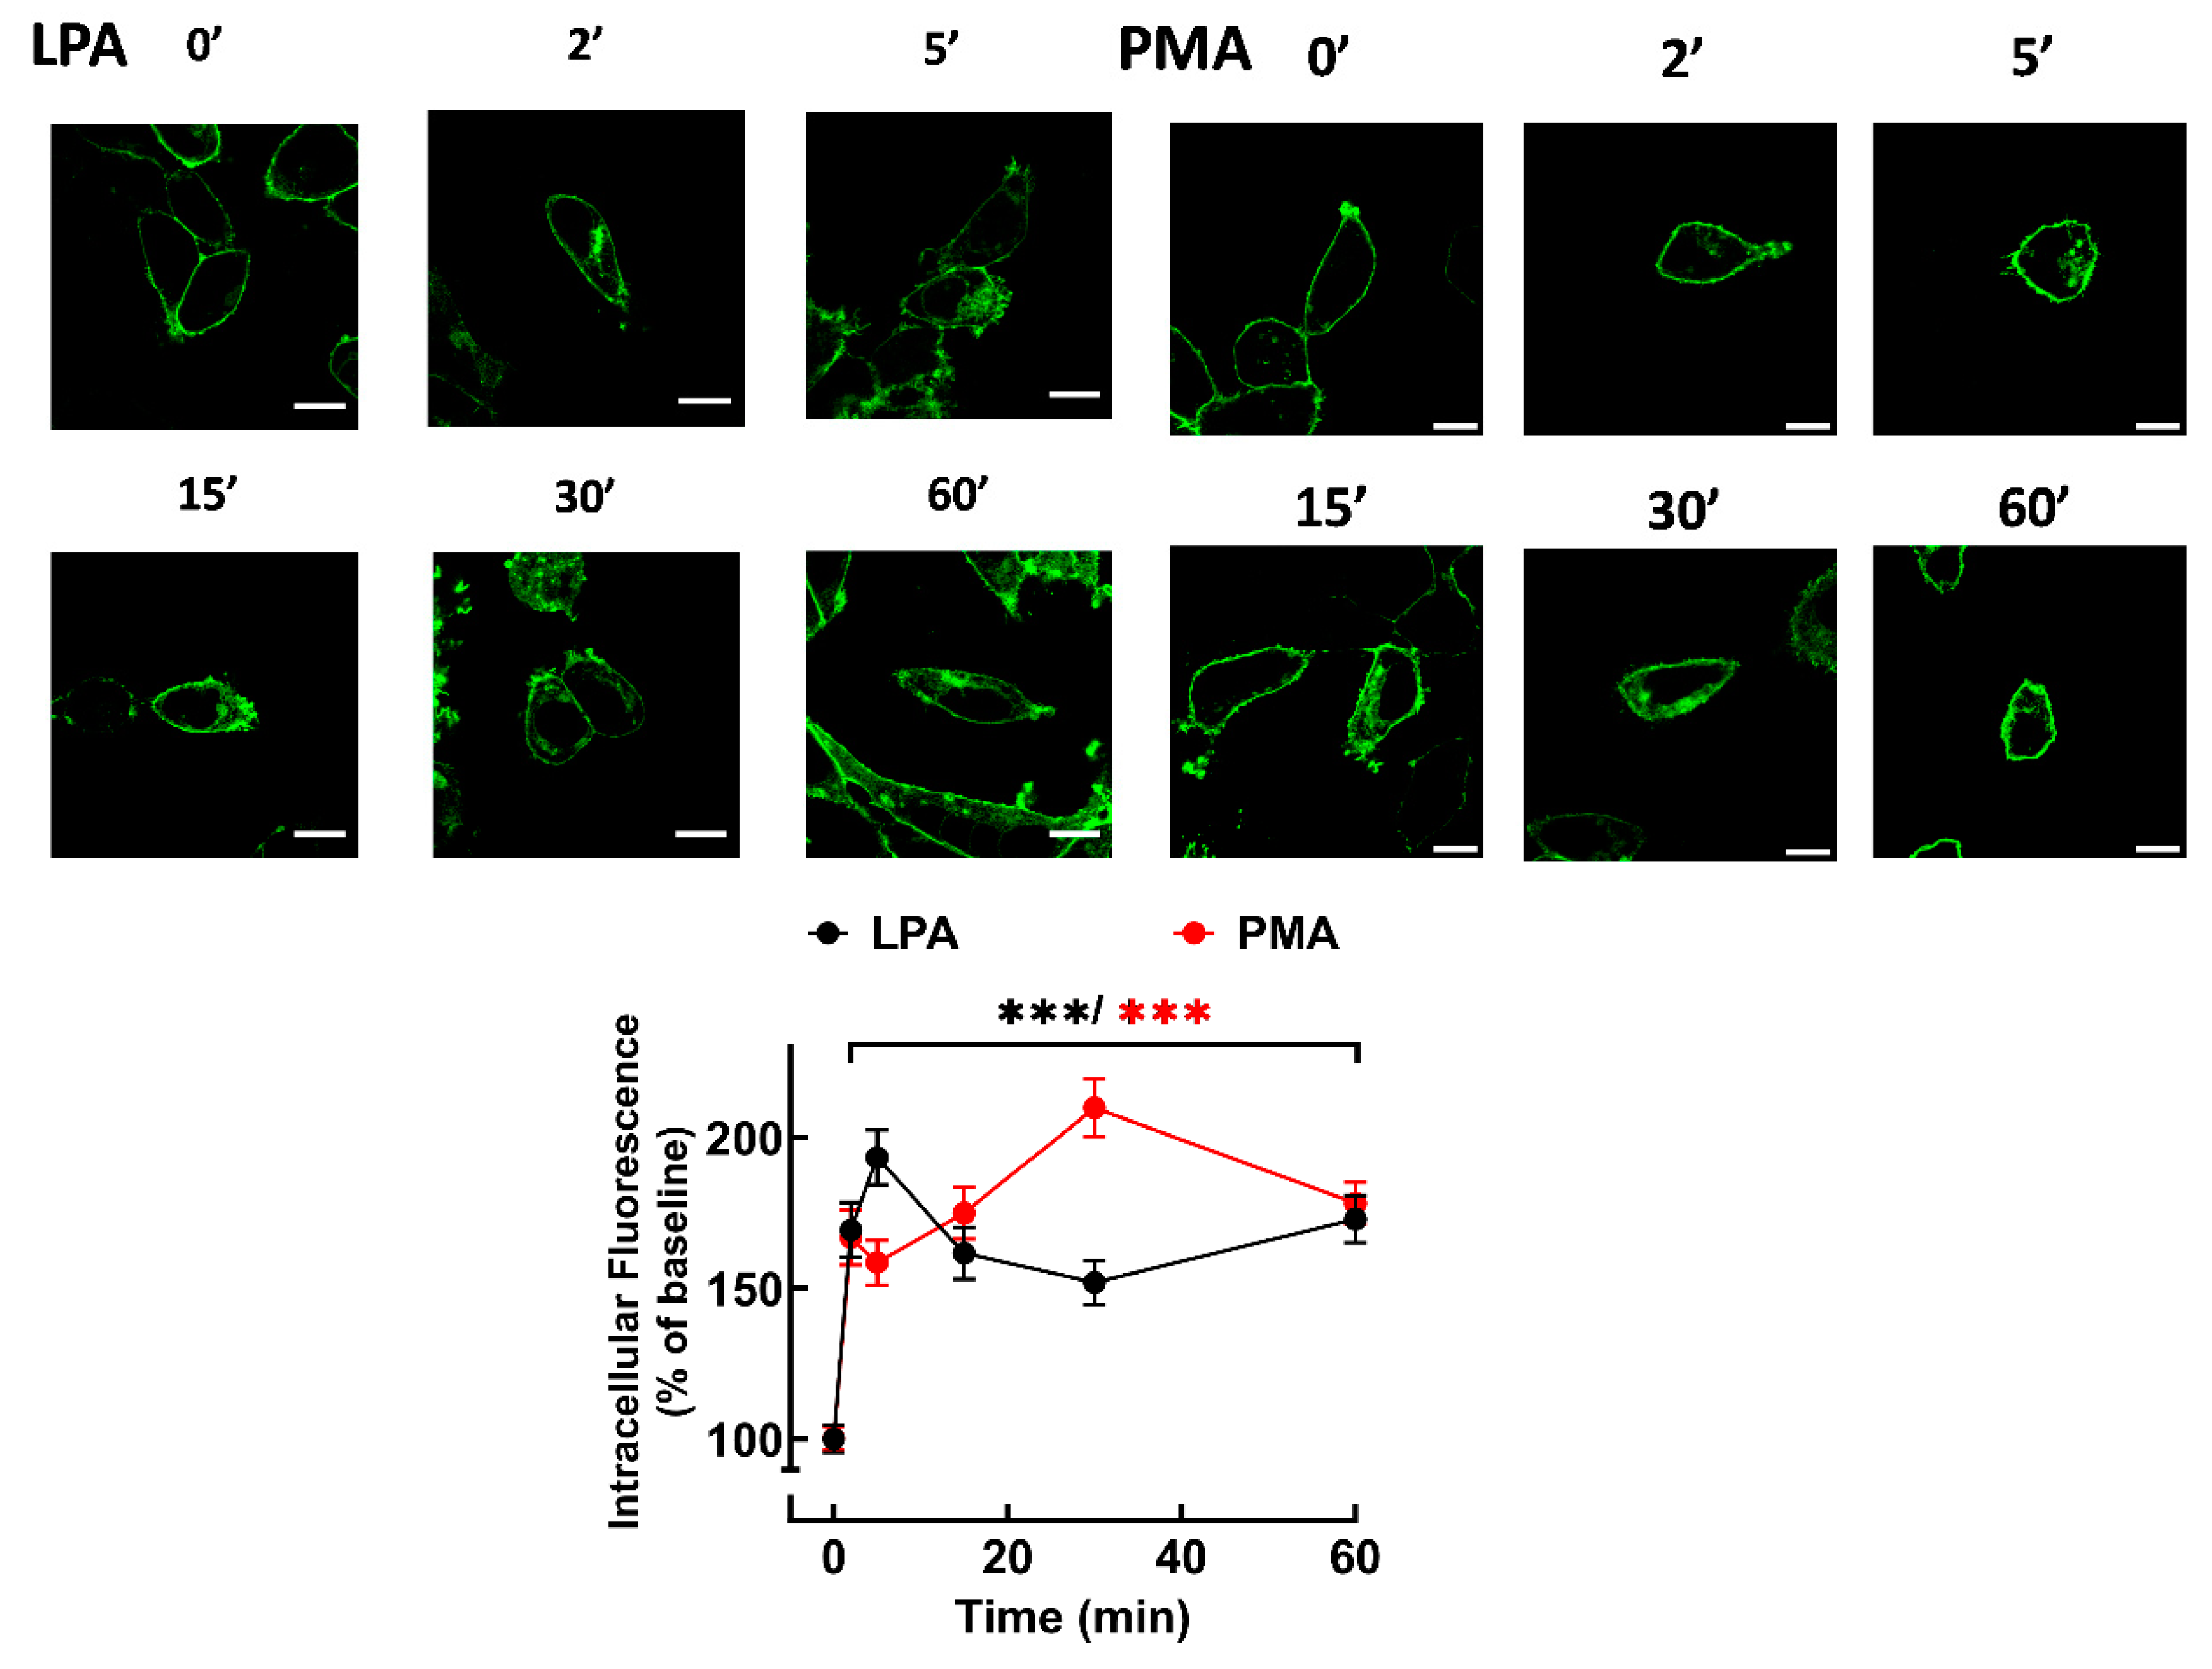
Accumulation of fluorescence in intracellular vesicles in response to the agonist, LPA, or the PKC activator, PMA, was observed, indicating receptor internalization (
Figure 3). These actions took place rapidly (detected as early as 2 min) and were sustained during the 60 min incubations (
Figure 3). Supplementary videos show the effects of LPA (video 1) and PMA (video 2) on receptor internalization. These videos allowed observation of cell displacement (LPA) and marked changes in form, including cell contraction (roundness). They also allow the detection of clusters of fluorescence forming “pearl-necklace”-like structures, formation of lamellipodia, blebs, and other changes in membrane appearance. Experiments were also performed inducing lower LPA
3 expression (1 ng/ml doxycycline), and under these conditions, both LPA and PMA induced also marked receptor internalization. The nucleus was stained with DAPI in these cells, and fluorescent vesicles occupied most of the cytoplasm in LPA- or PMA-stimulated cells (
Supplementary Figure S9).
Cells expressing the LPA
3 receptors preincubated with Pitstop 2 notedly exhibit decreased intracellular fluorescence before stimulation (Supplementary Figs S10 and S11). When cells not preincubated with Pitstop 2 were stimulated with LPA, internalization was observed as early as 2 min and maintained throughout the experiment (
Supplementary Figure S10). As indicated, Pitstop 2 decreased baseline fluorescence; LPA increased such baseline value, but the effect was smaller than that observed in the absence of the inhibitor (
Supplementary Figure S10). PMA-induced LPA
3 receptor internalization was quick and sustained in cells preincubated without any agent. In cells preincubated with Pitstop 2, internalization was similar to that observed without the inhibitor but departing from a different baseline (
Supplementary Figure S11). These data suggest that a clathrin-independent process might also be involved in receptor internalization, pointing to differences between LPA-mediated and PMA-mediated internalization.
It is well-known that β-arrestins play a role in GPCR desensitization, internalization and signaling [
9,
10,
11,
12,
13]. Therefore, LPA
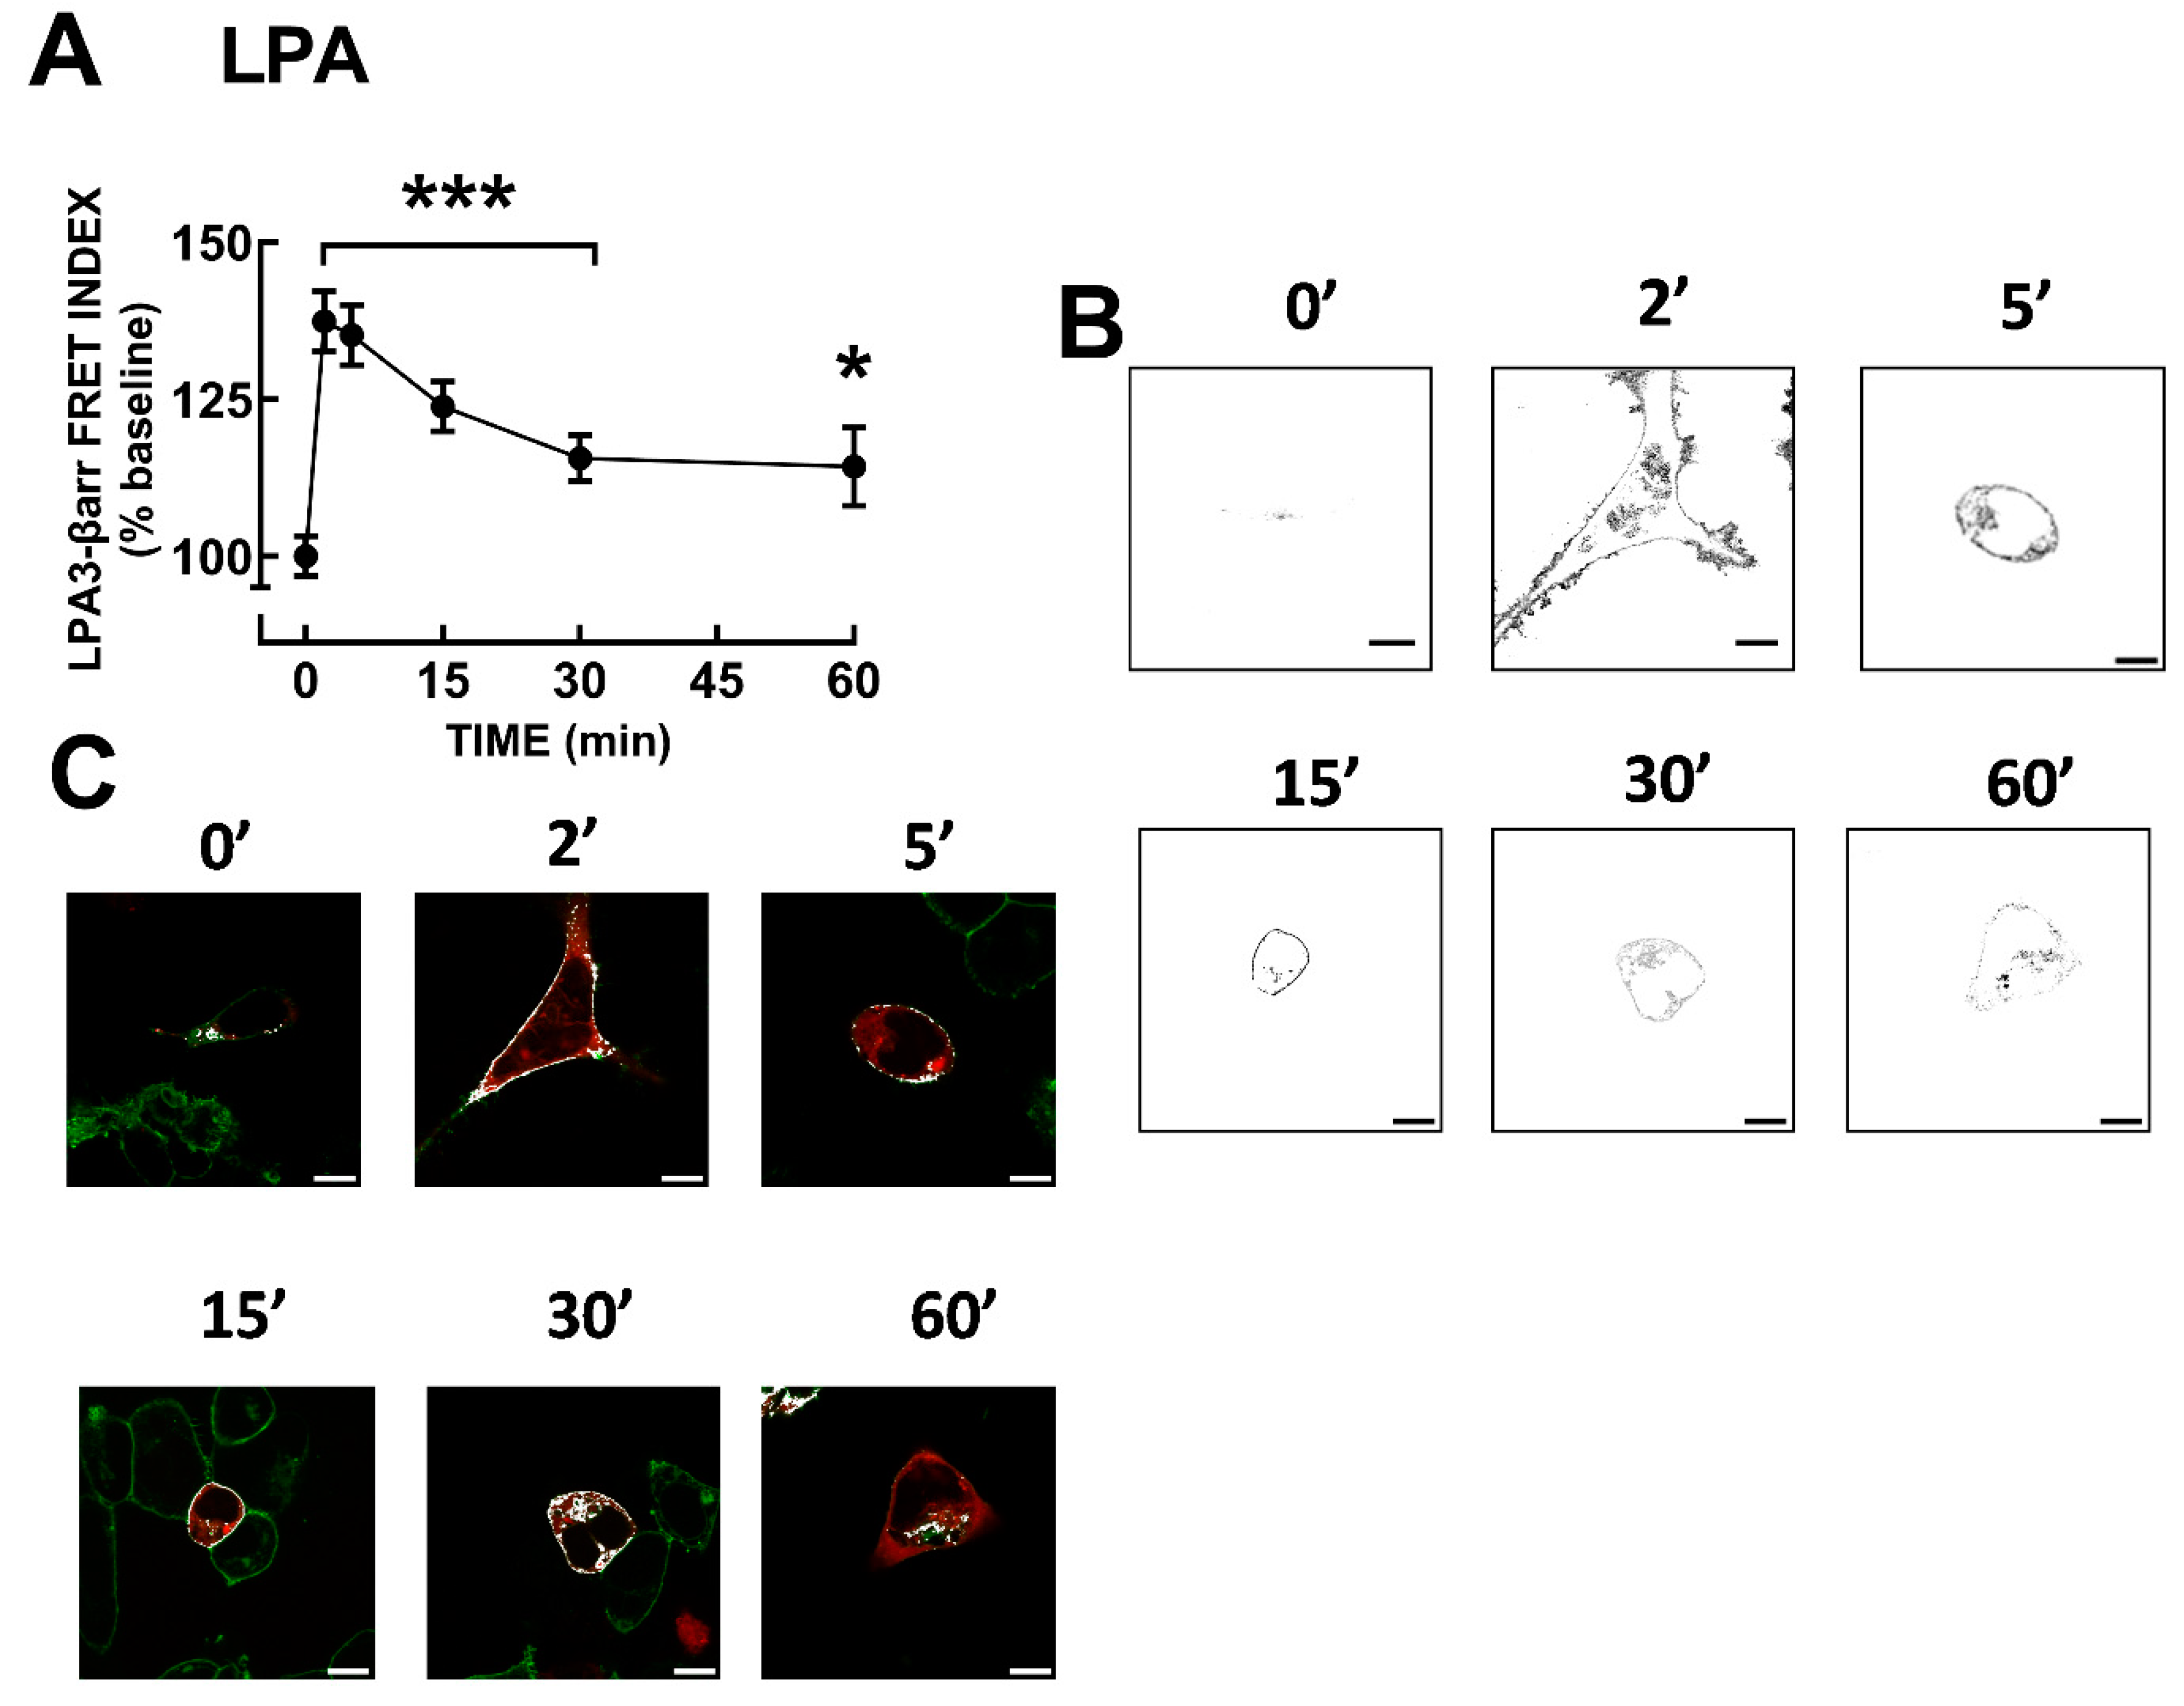
3-β-arrestin 2 interaction was studied utilizing FRET. It was observed (
Figure 4A,B) that LPA induced a rapid receptor-arrestin interaction (maximal at 2 min), which decreased progressively but maintained the signal clearly above the baseline during the experiment (60 min).
Supplementary Figure S12 shows the images obtained exciting the LPA
3-eGFP construct (green channel), the β-arrestin-mCherry construct (red channel), raw FRET, and the FRET channel images (these are images of the same cells presented in Fig 4). Images of LPA
3-β-arrestin colocalization are also presented (
Figure 4C); Pearson coefficient indicates that in the baseline condition, there was no clear colocalization (< 0.5), whereas after stimulation with LPA colocalization was evident (Pearson coefficients > 0.9). Videos showing raw LPA-induced FRET (not FRET channel) (Video 3) and colocalization (Video 4) are presented as Supplementary Material.
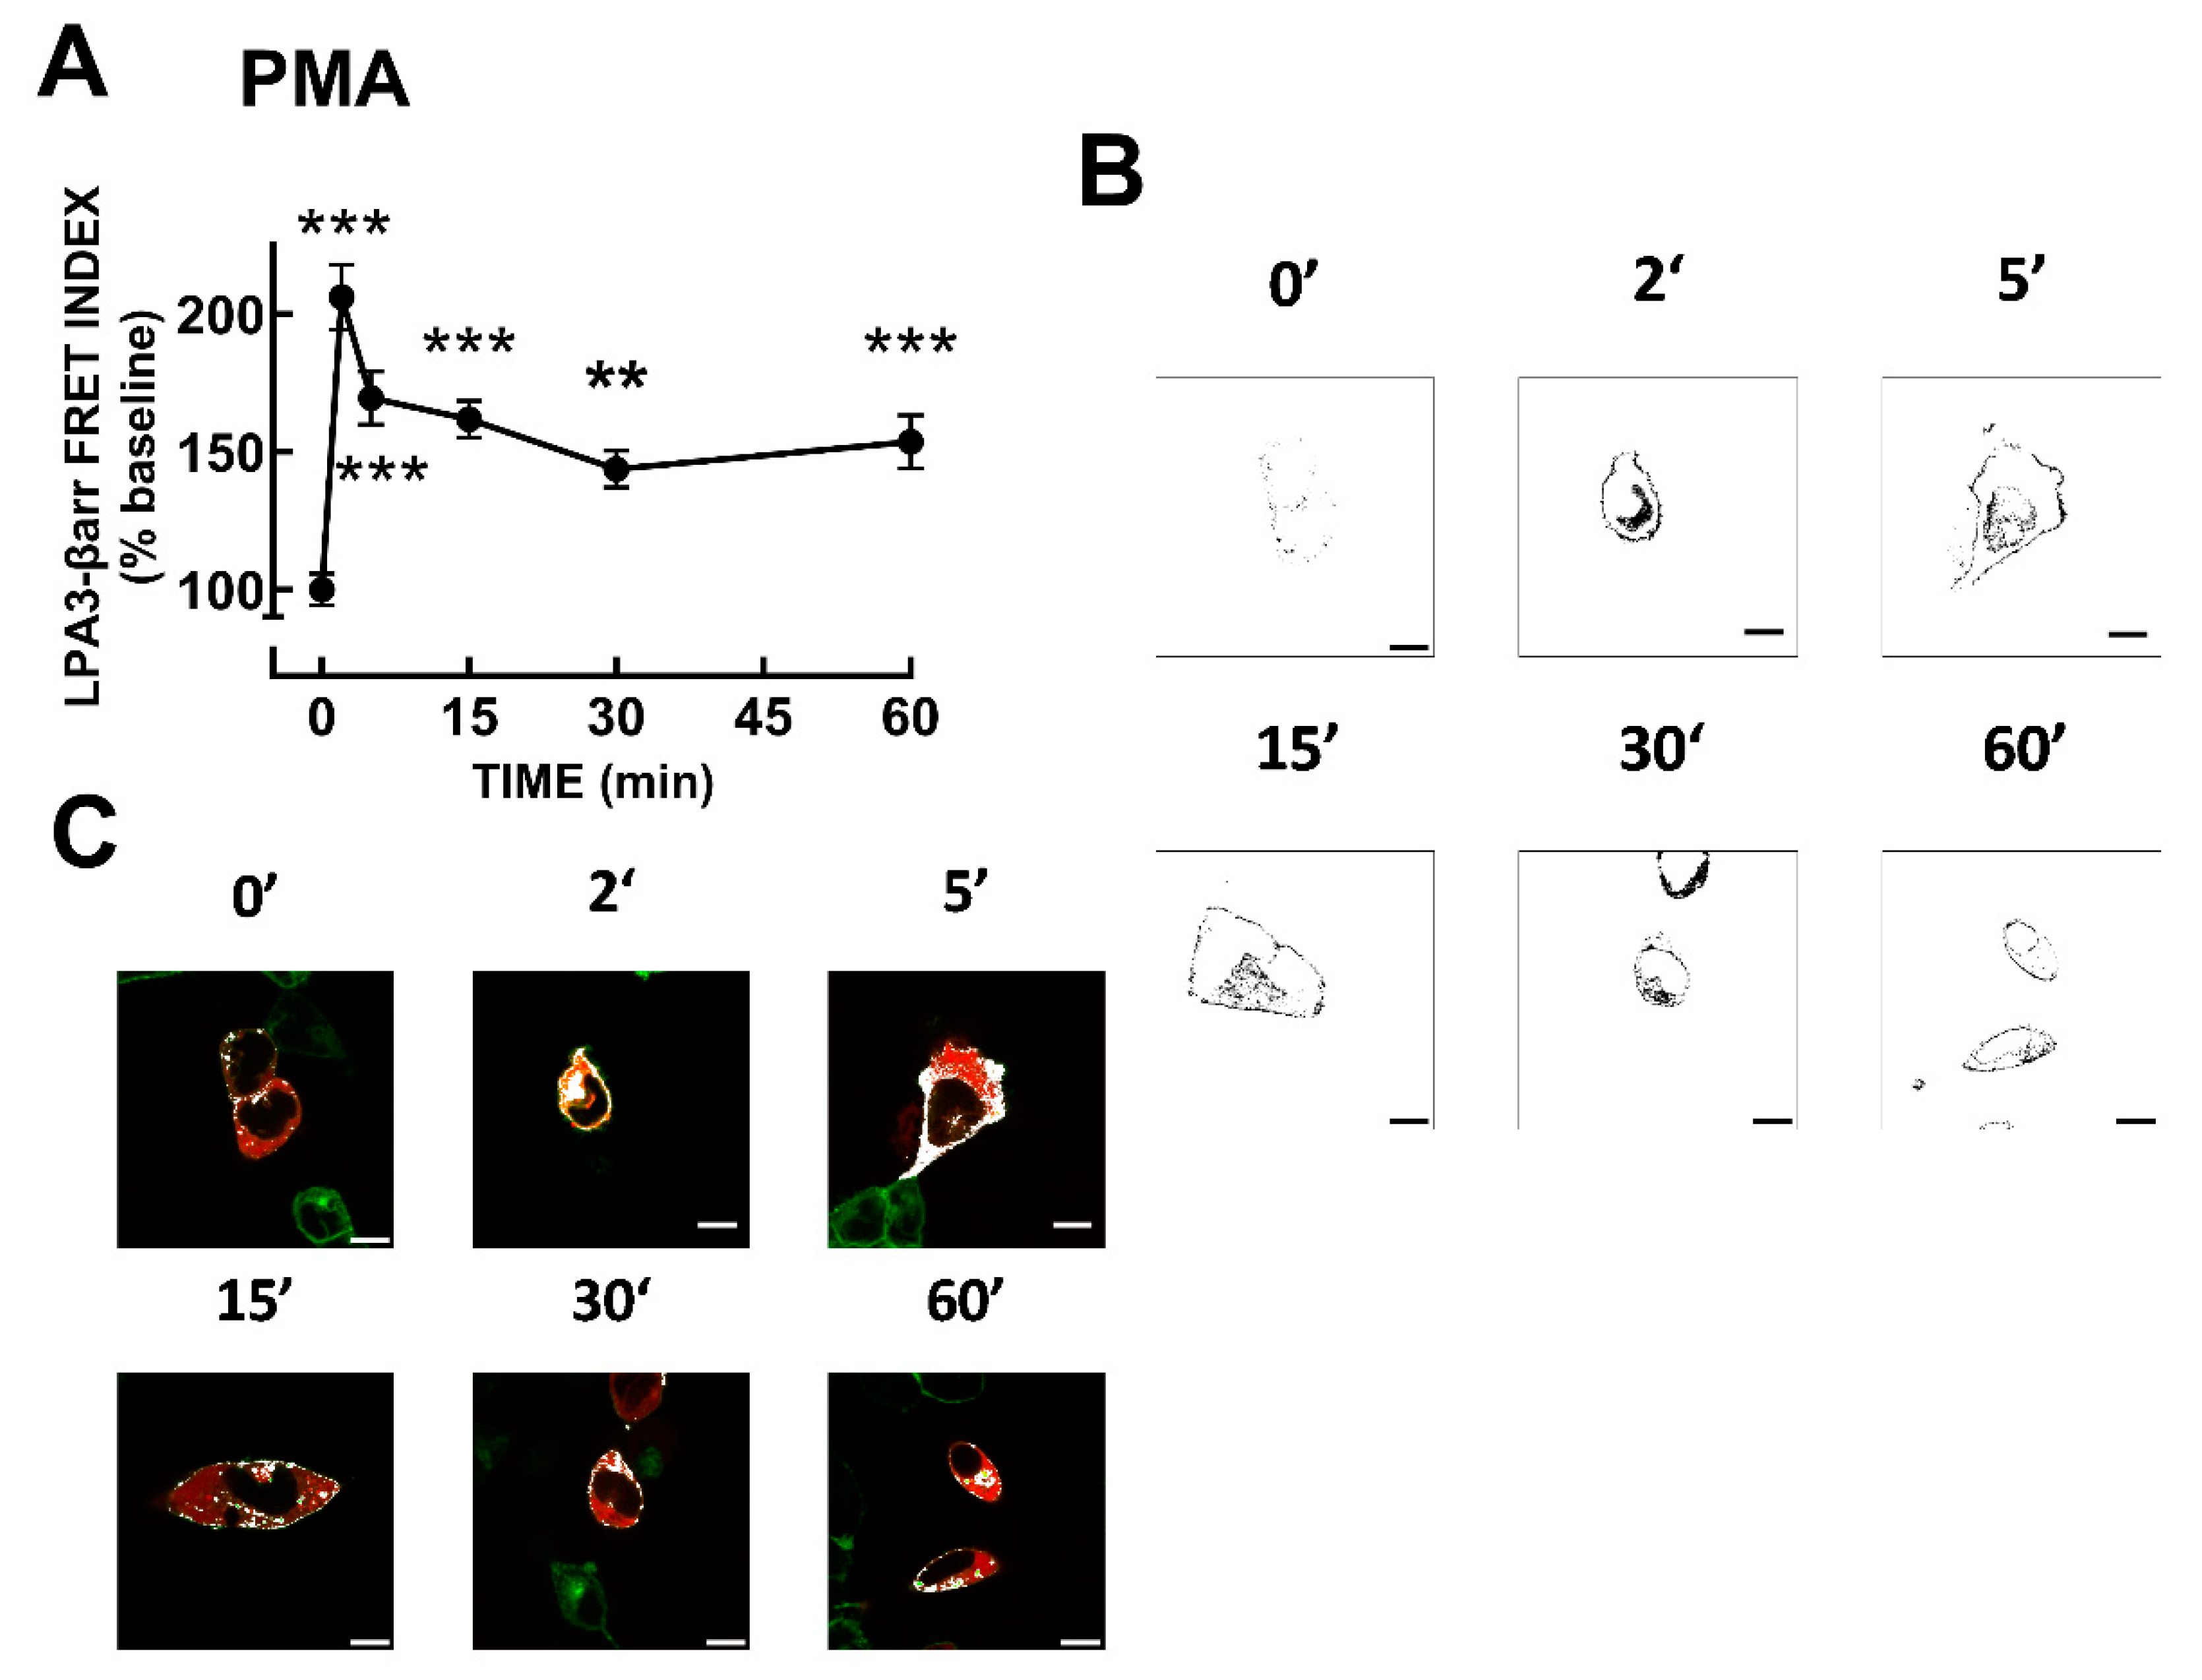
LPA
3-β-arrestin FRET was also studied using 1 µM PMA. The protein kinase C activator also induced a rapid increase in signal followed by a slow decrease (
Figure 5A,B).
Supplementary Figure S13 shows the images obtained exciting the LPA
3-eGFP construct (green channel), the β-arrestin-mCherry construct (red channel), raw FRET, and the FRET channel images (these are images of the same cells presented in
Figure 5). In
Figure 5C, LPA
3-β-arrestin colocalization images are presented; it can be observed that PMA also induced colocalization. We explored, afterward, LPA
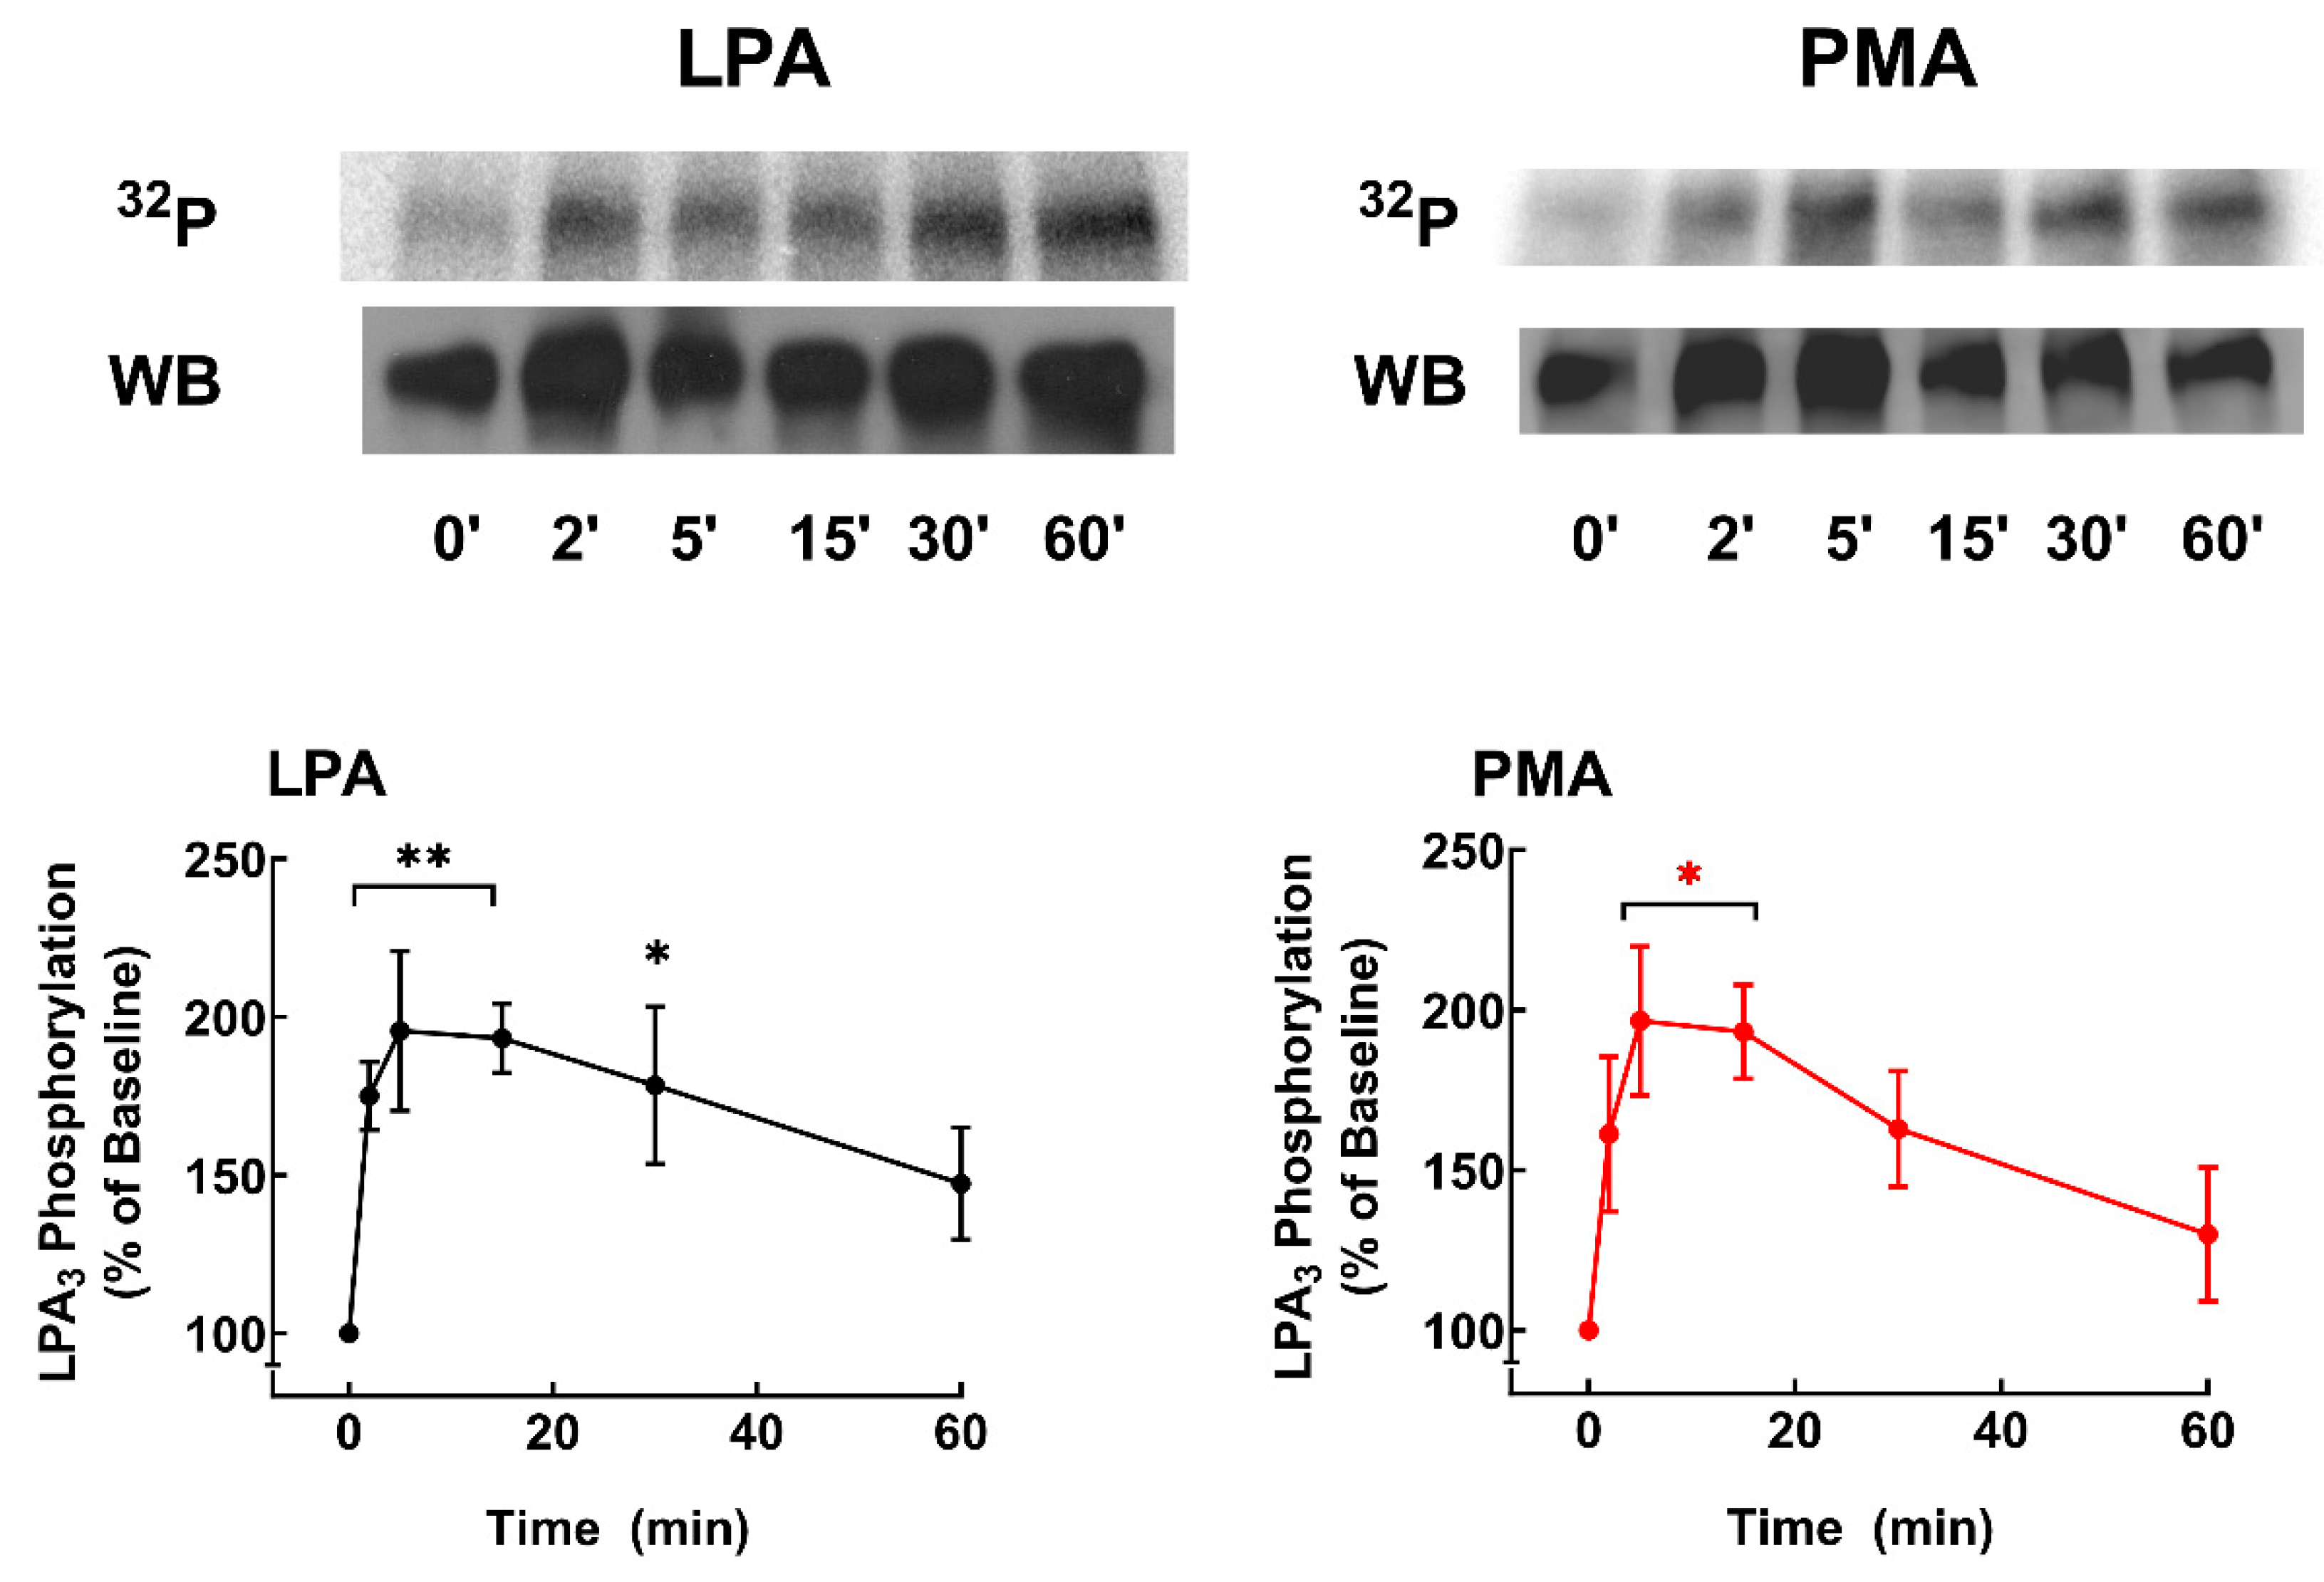
3 receptor phosphorylation in response to 1 µM LPA or 1 µM PMA. A representative whole membrane autoradiograph is presented in
Supplementary Figure S14.
The time courses of the action of these agents are presented in
Figure 6. It can be observed that both LPA and PMA induced a rapid increase in LPA
3 phosphorylation; the effects were of similar magnitude and reached their maximum at 5-10 min of stimulation, after that decreased progressively, maintaining phosphorylation states above baseline up to the end of the incubation (60 min). These data are consistent with previous observations [
31,
44]. In silico analyses of putative phosphorylation sites in LPA receptors have already been reported [
6,
35]. Nevertheless, we repeated such analysis using updated versions of available software systems: GPS, PhosphoSVM, NetPhos, and MusiteDeep (see Section 2.9), and the results are presented in
Table 1. Putative phosphorylation sites with high scores include 1 site in the intracellular loop 2, 5 sites in the intracellular loop 3, and 10 in the carboxyl terminus. The table indicates putative protein kinases potentially participating in the phosphorylation of these residues. Not surprisingly, isoforms of G protein-coupled receptor kinases (GRKs) and PKC, as well as other kinases, might play a role.
LPA
3 receptors from cells not treated with any agent, 1 µM LPA or 1 µM PMA for 15 min, were immunopurified, and samples were sent to the Taplin Mass Spectrometry Facility (Harvard Medical School). A representative gel and blot is presented in
Supplementary Figure S15.
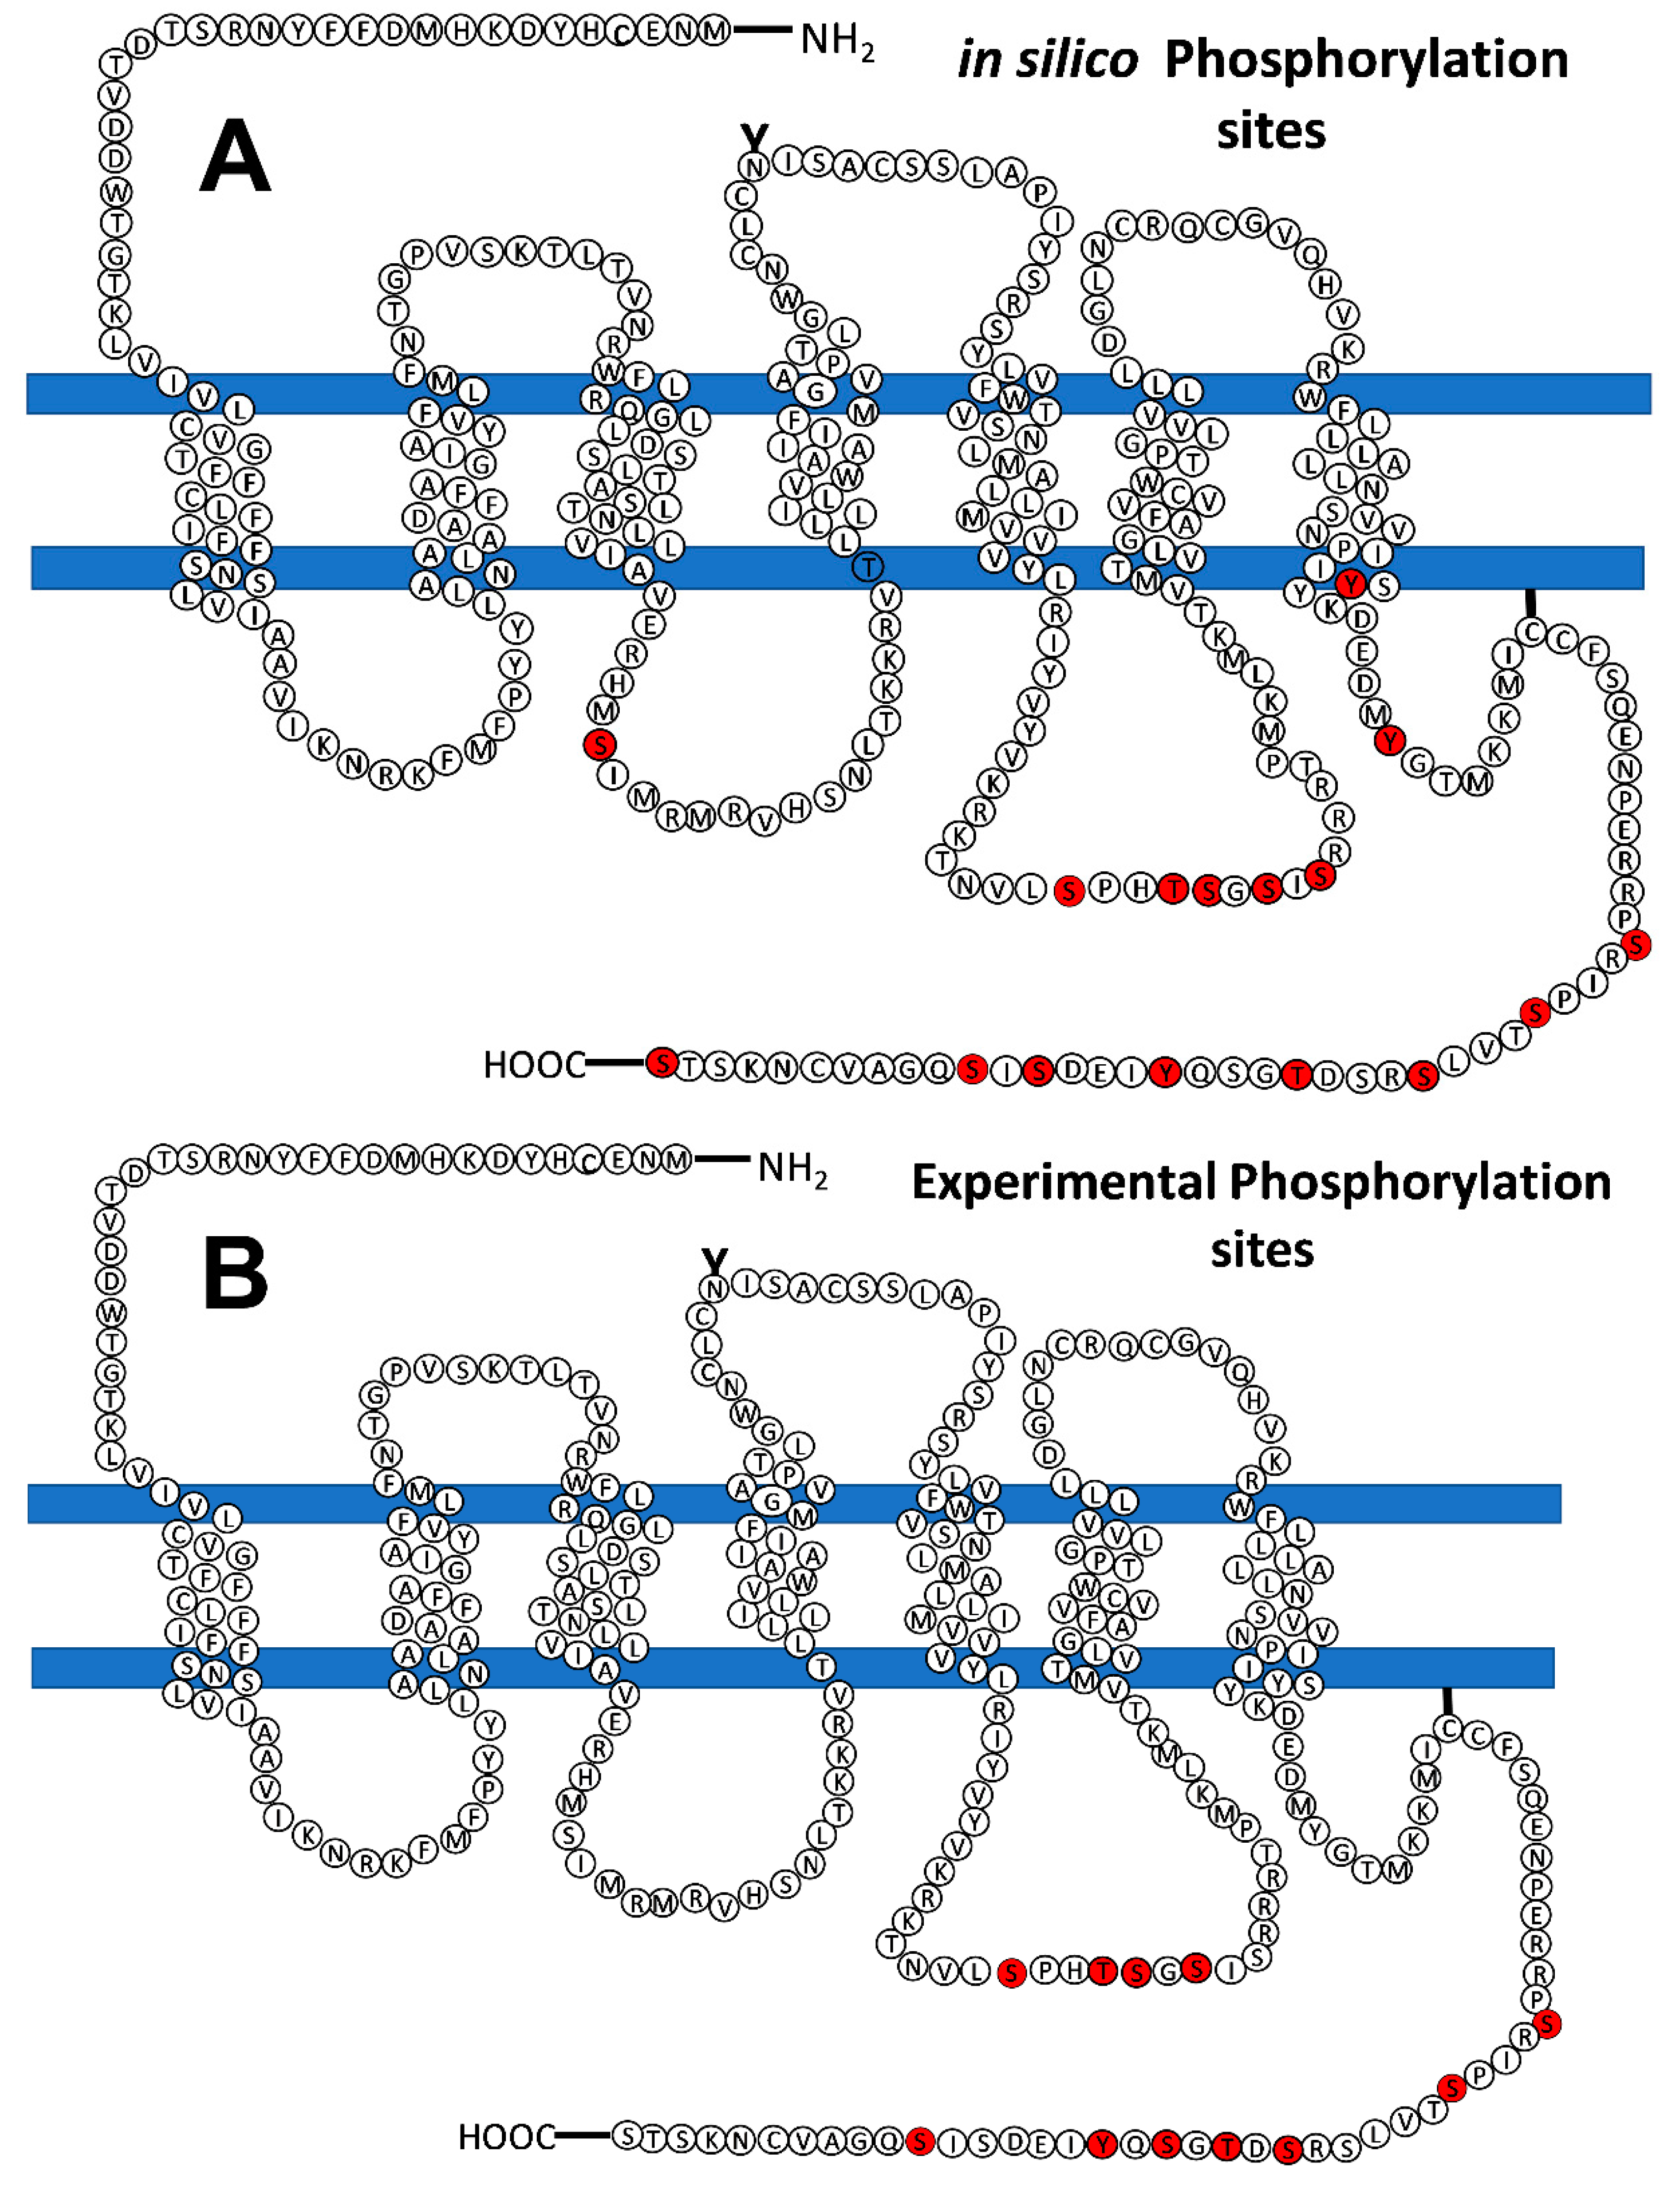
Table 2 shows the summary of data from distinct experiments and conditions. It should be noted that the mass spectrometry analyses were not quantitative and only indicated sites that were detected phosphorylated but not their abundance in the samples. In our studies 4 sites were detected in the intracellular loop 3 (S221, T224, S225, and S229), and 7 in the carboxyl terminus (S321, S325, S331, T333, S335, Y337, and S343). Many, but not all, the experimentally-detected phosphorylation sites were predicted by the in silico analyses (
Table 2), and similarly, not all predicted sites were experimentally detected. The prediction programs identified, with high score, the following number of sites: GPS, 10 of the 11 experimentally detected sites (90 %, S331 not predicted); PhosphoSVM also 10 (90 %, S331 not predicted); NetPhos, 9 sites (81 %, S331 and Y337 not predicted); and MusiteDeep, only 6 of them (S229, S331, T333, S335, and S343 not predicted). A cartoon showing the putative, in silico, and experimentally found sites in the LPA
3 receptor is presented in
Figure 7. It is worth mentioning that the coverage of peptide detection was 100% for the intracellular loop 3 in all the experiments, and that of the carboxyl terminus ≈70-75% in four, and only 40% in one, of the five separate experiments performed. The carboxyl terminus tripeptide (STS) was not detected in any experiment.
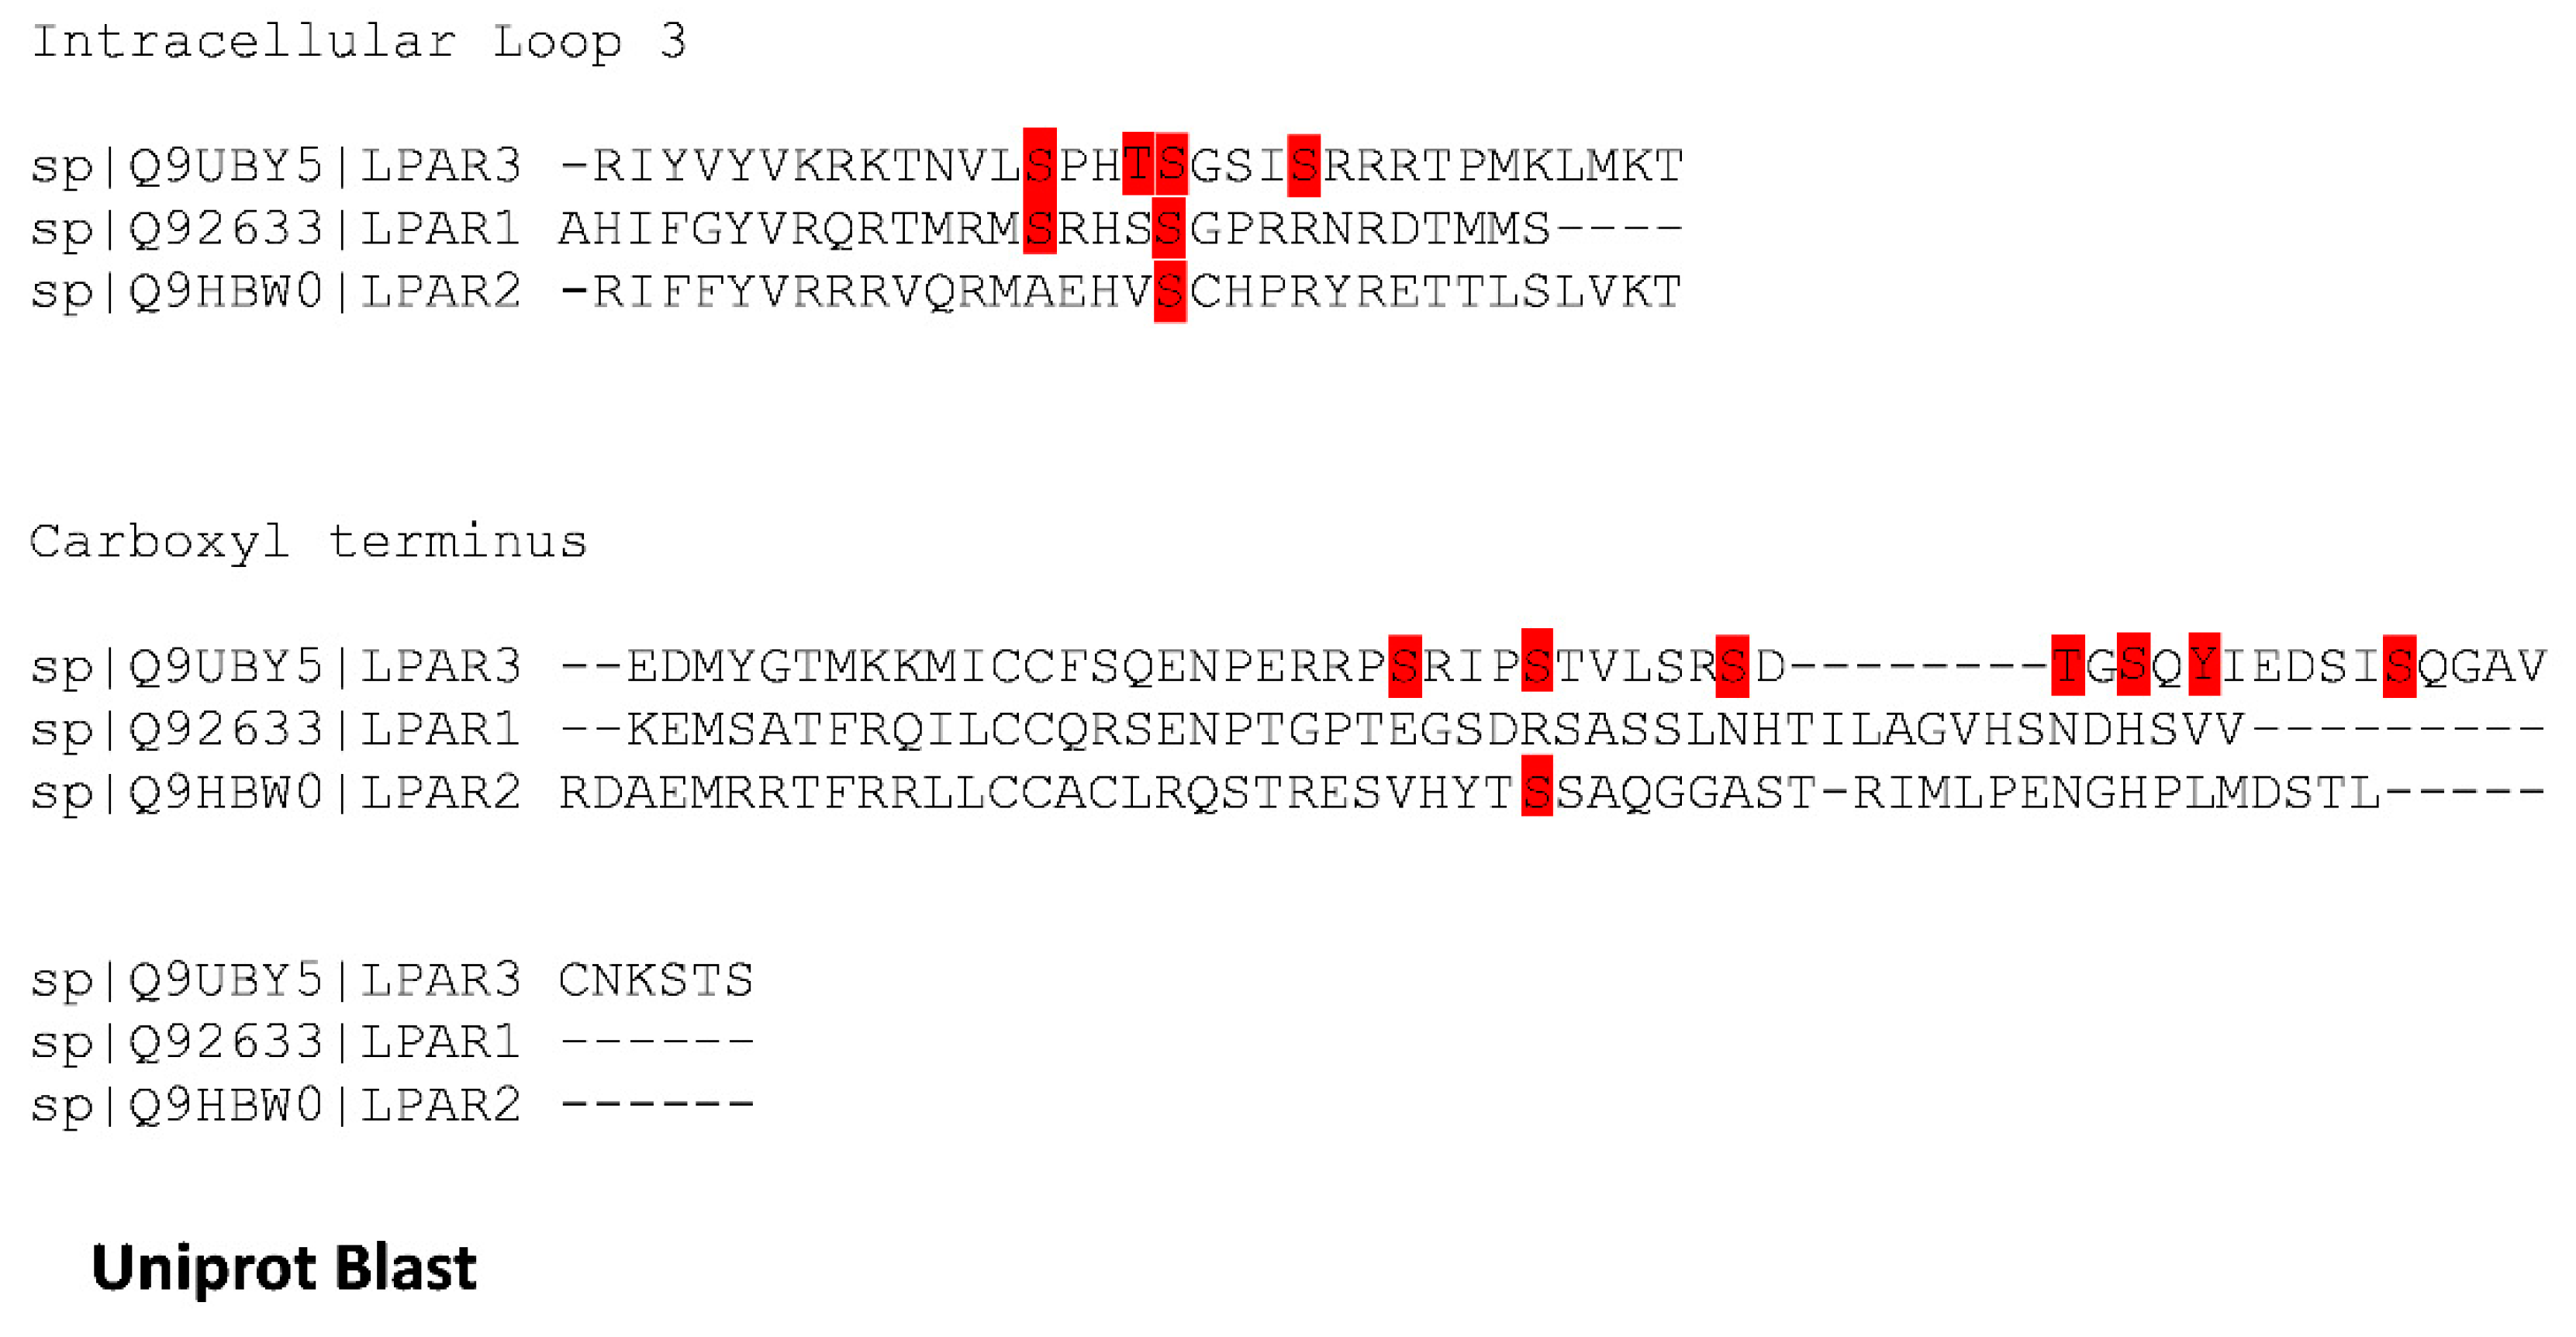
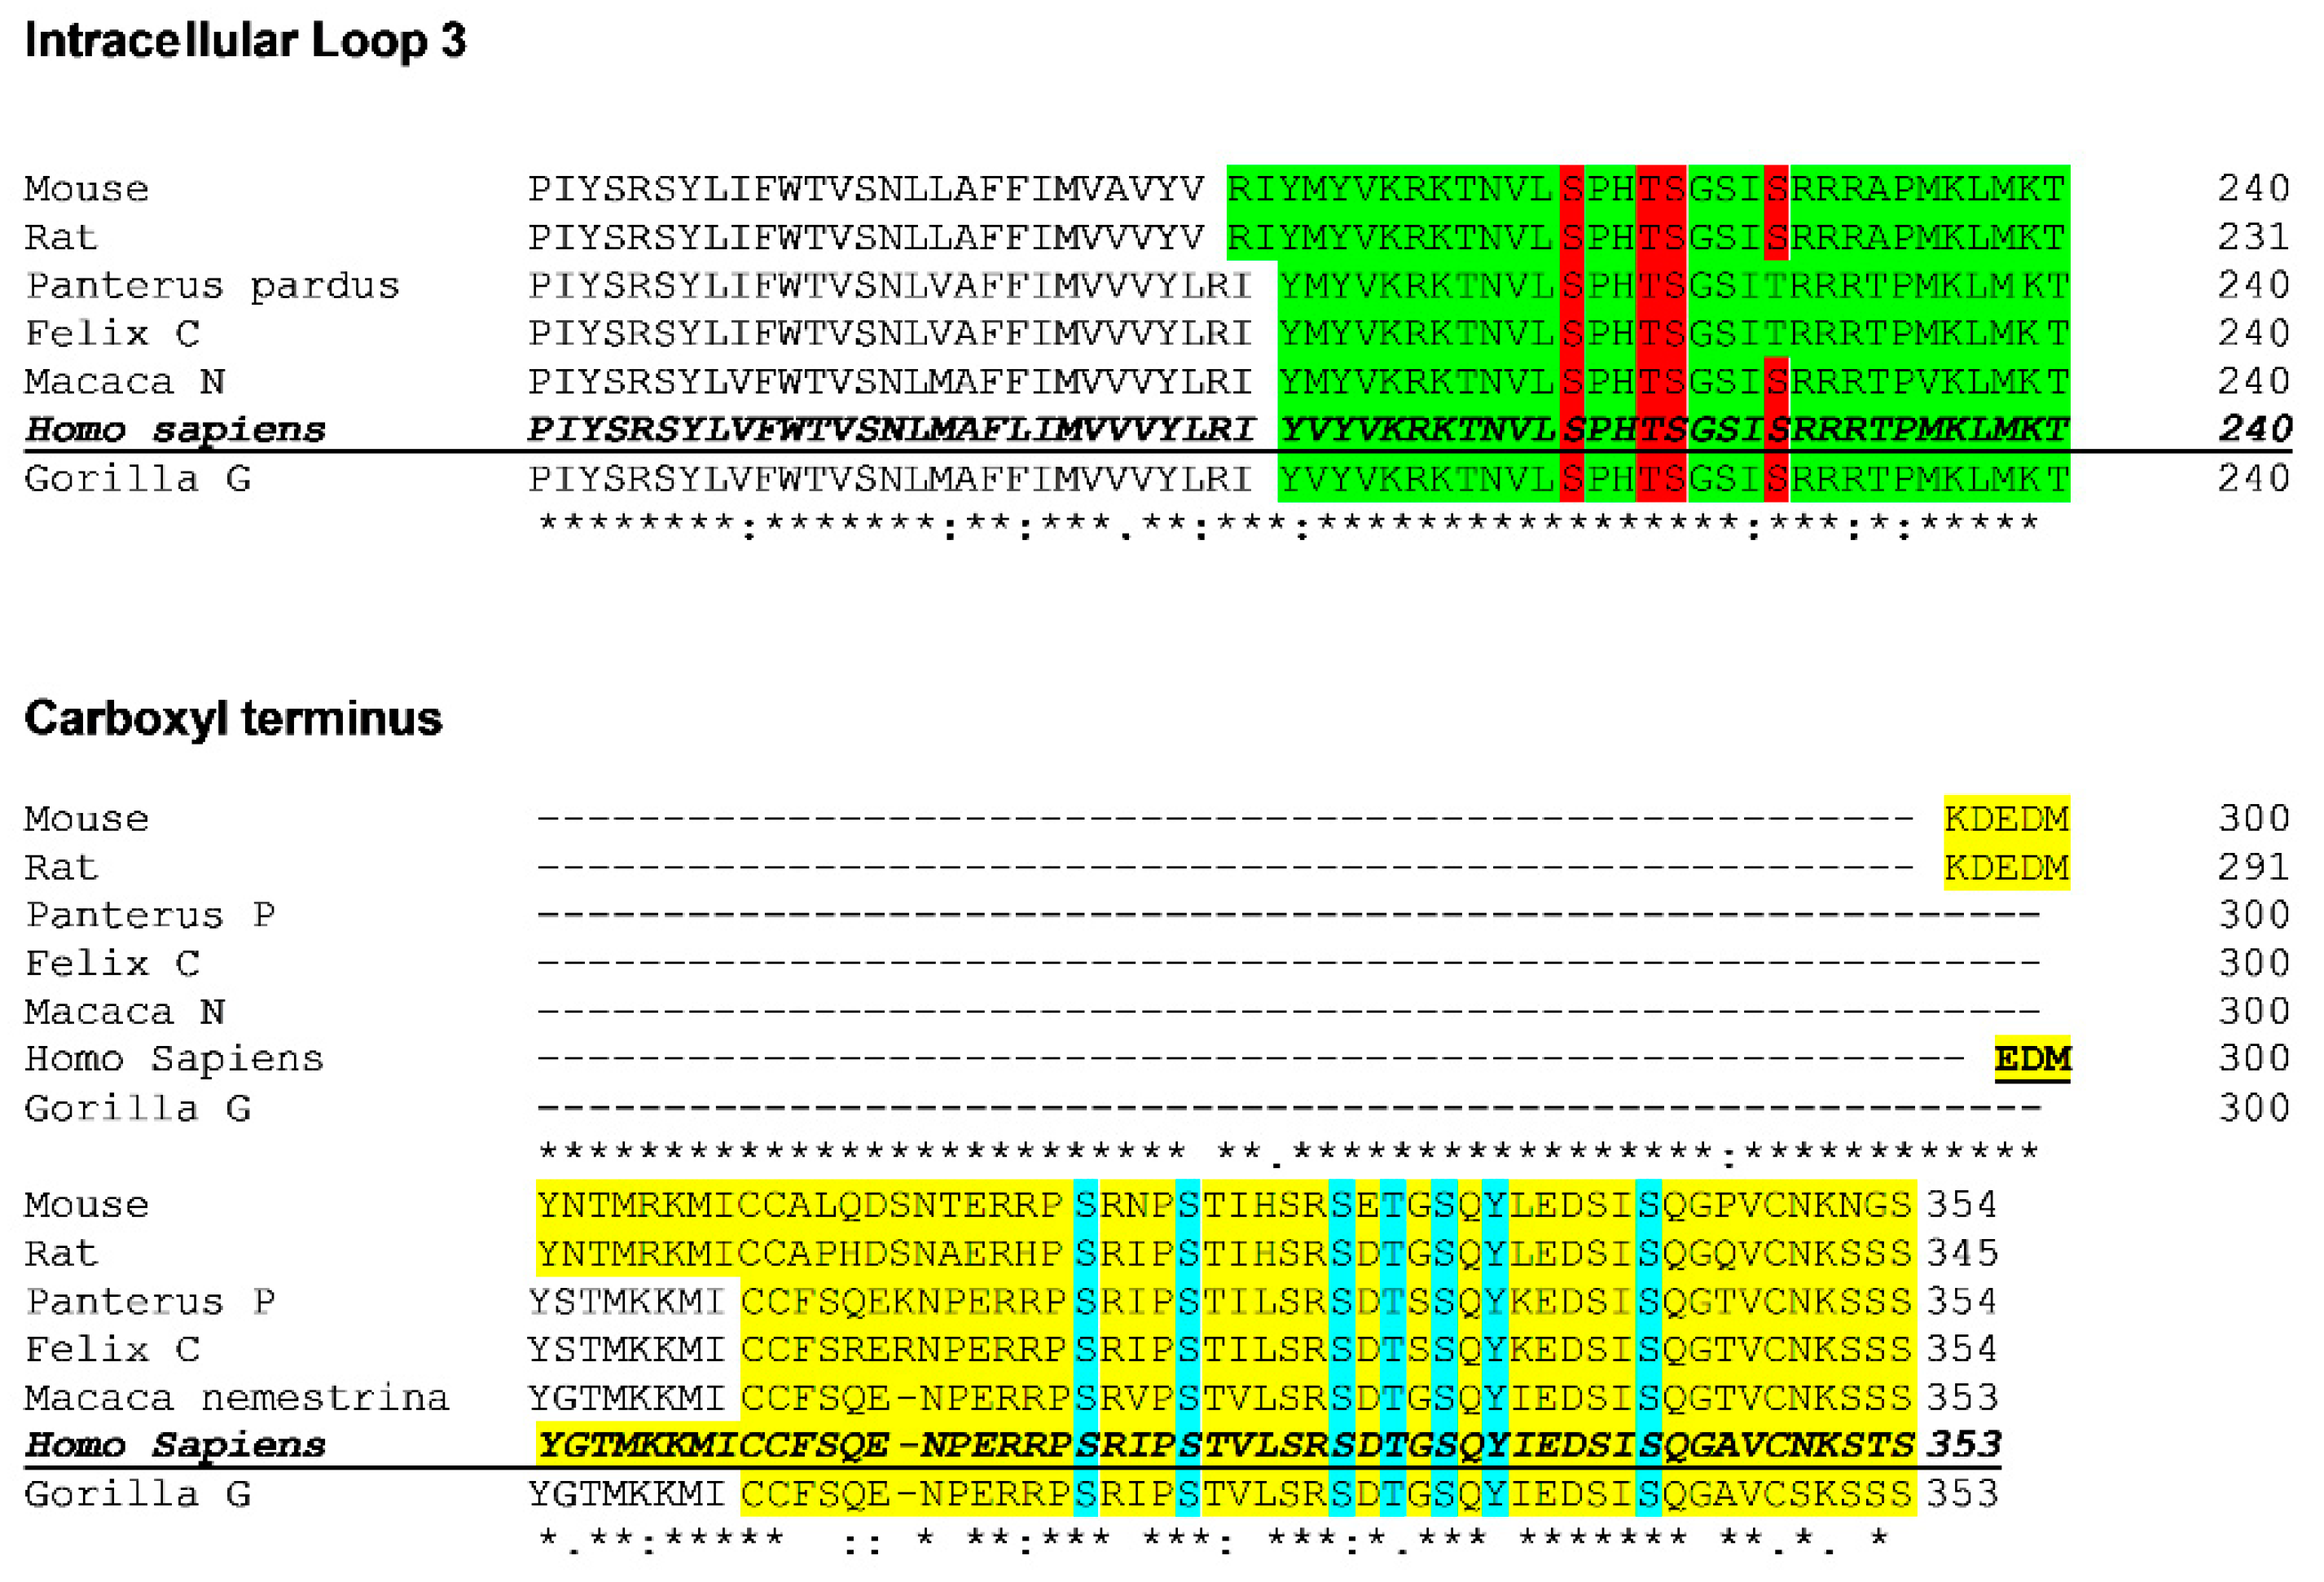
Sequence alignment of the intracellular loop 3 and carboxyl termini of LPA
1-3 receptors is presented in
Figure 8. It can be observed that only S225 (intracellular loop 3) of the human LPA
3 is conserved in all three of the human lysophospholipid LPA receptor subtypes. Two residues are conserved in two of these receptors: a) S221 (intracellular loop 3, LPA
3, and LPA
1) and b) S325 (carboxyl terminus, LPA
3, and LPA
2) (
Figure 8). In contrast, the alignment of the available LPA
3 receptor ortholog sequences revealed that in the intracellular loop 3, (
Figure 9) three phosphorylated residues are conserved in all species studied, and S229, which is not conserved in the feline orthologs, was substituted by T (a phosphorylatable amino acid, conserved substitution). All 7 phosphorylated residues in the carboxyl terminus are conserved among the species studied (
Figure 9).
To validate that the phosphorylation sites detected in the mass spectroscopy studies were those phosphorylated in cellulo, we employed cells expressing a mutant receptor in which the amino acids found phosphorylated were substituted by non-phosphorylatable residues (i.e., serines were substituted with alanines and threonines with valines). The mutant receptor construct was fluorescent and functional, as evidenced by the ability of LPA to increase intracellular calcium (data not shown). As anticipated, baseline receptor phosphorylation was markedly diminished (≈ 70%) in cells expressing the mutant receptor compared to those expressing the wild-type, and no significant effect of LPA or PMA was detected (
Supplementary Figure S16). It should be mentioned that the mutant receptor migrated more in the electrophoresis experiments, which could be due to proteolysis (that we cannot discard) or to the substitutions made to the sequence.
3. Discussion
LPA receptors can be coupled to several G proteins; in particular, LPA
1 and LPA
3 receptors can stimulate the G
αq and G
αi/o proteins [
6,
22]. Activation of LPA receptors, including LPA
3, increase intracellular calcium in cells endogenously expressing these receptors and in transfected cells (see, for example, [
2,
4,
5,
22,
31,
44]). LPA
1 receptor stimulation elevates intracellular calcium concentration mainly through the stimulation of G
i/o proteins, as reflected by the marked sensitivity to pertussis toxin [
44,
45], a control employed in the present work. Interestingly, we observed that the LPA
3 receptor-mediated increase in intracellular calcium was poorly sensitive to pertussis toxin, indicating that G
i/o proteins are not the primary mediators of this response. These data are consistent with the early observation of Bandoh et al. [
5], who reported that the LPA
3-mediated calcium response in insect Sf9 cells was insensitive to pertussis toxin but blocked by the phospholipase C blocker U73122. We attempted to define the role of G
q in this action by using the inhibitor YM-254890 [
40,
46], which prevents G
q protein-coupled receptor signaling by blocking GTP/ GDP exchange [
40,
46]. However, this agent blocked the LPA calcium response in cells expressing either LPA
1 or LPA
3 receptors, which precluded a more precise definition of the G protein involved. Consistent with our previous work using transfected C9 cells [
31], we observed that LPA-activated LPA
3 receptors induced marked but transient ERK phosphorylation, and we show here that this response was also insensitive to pertussis toxin, which indicates that it is not mainly mediated through G
i. The action of YM-254890 was also assessed on ERK phosphorylation using LPA
1- and LPA
3-expressing cells. The inhibitor decreased the LPA-induced ERK response in both cells, but the effect was more robust in cells expressing the LPA
3 receptors. The selectivity of the G
q blocker has been questioned [
47], and we cannot discard the possibility that YM-254890 might have actions at levels other than G proteins. Therefore, our present data suggest a role of G
q in these LPA
3 effects (intracellular calcium and ERK phosphorylation) but did not permit a clear experimental demonstration. Obviously, our data do not exclude roles of G
i in other LPA
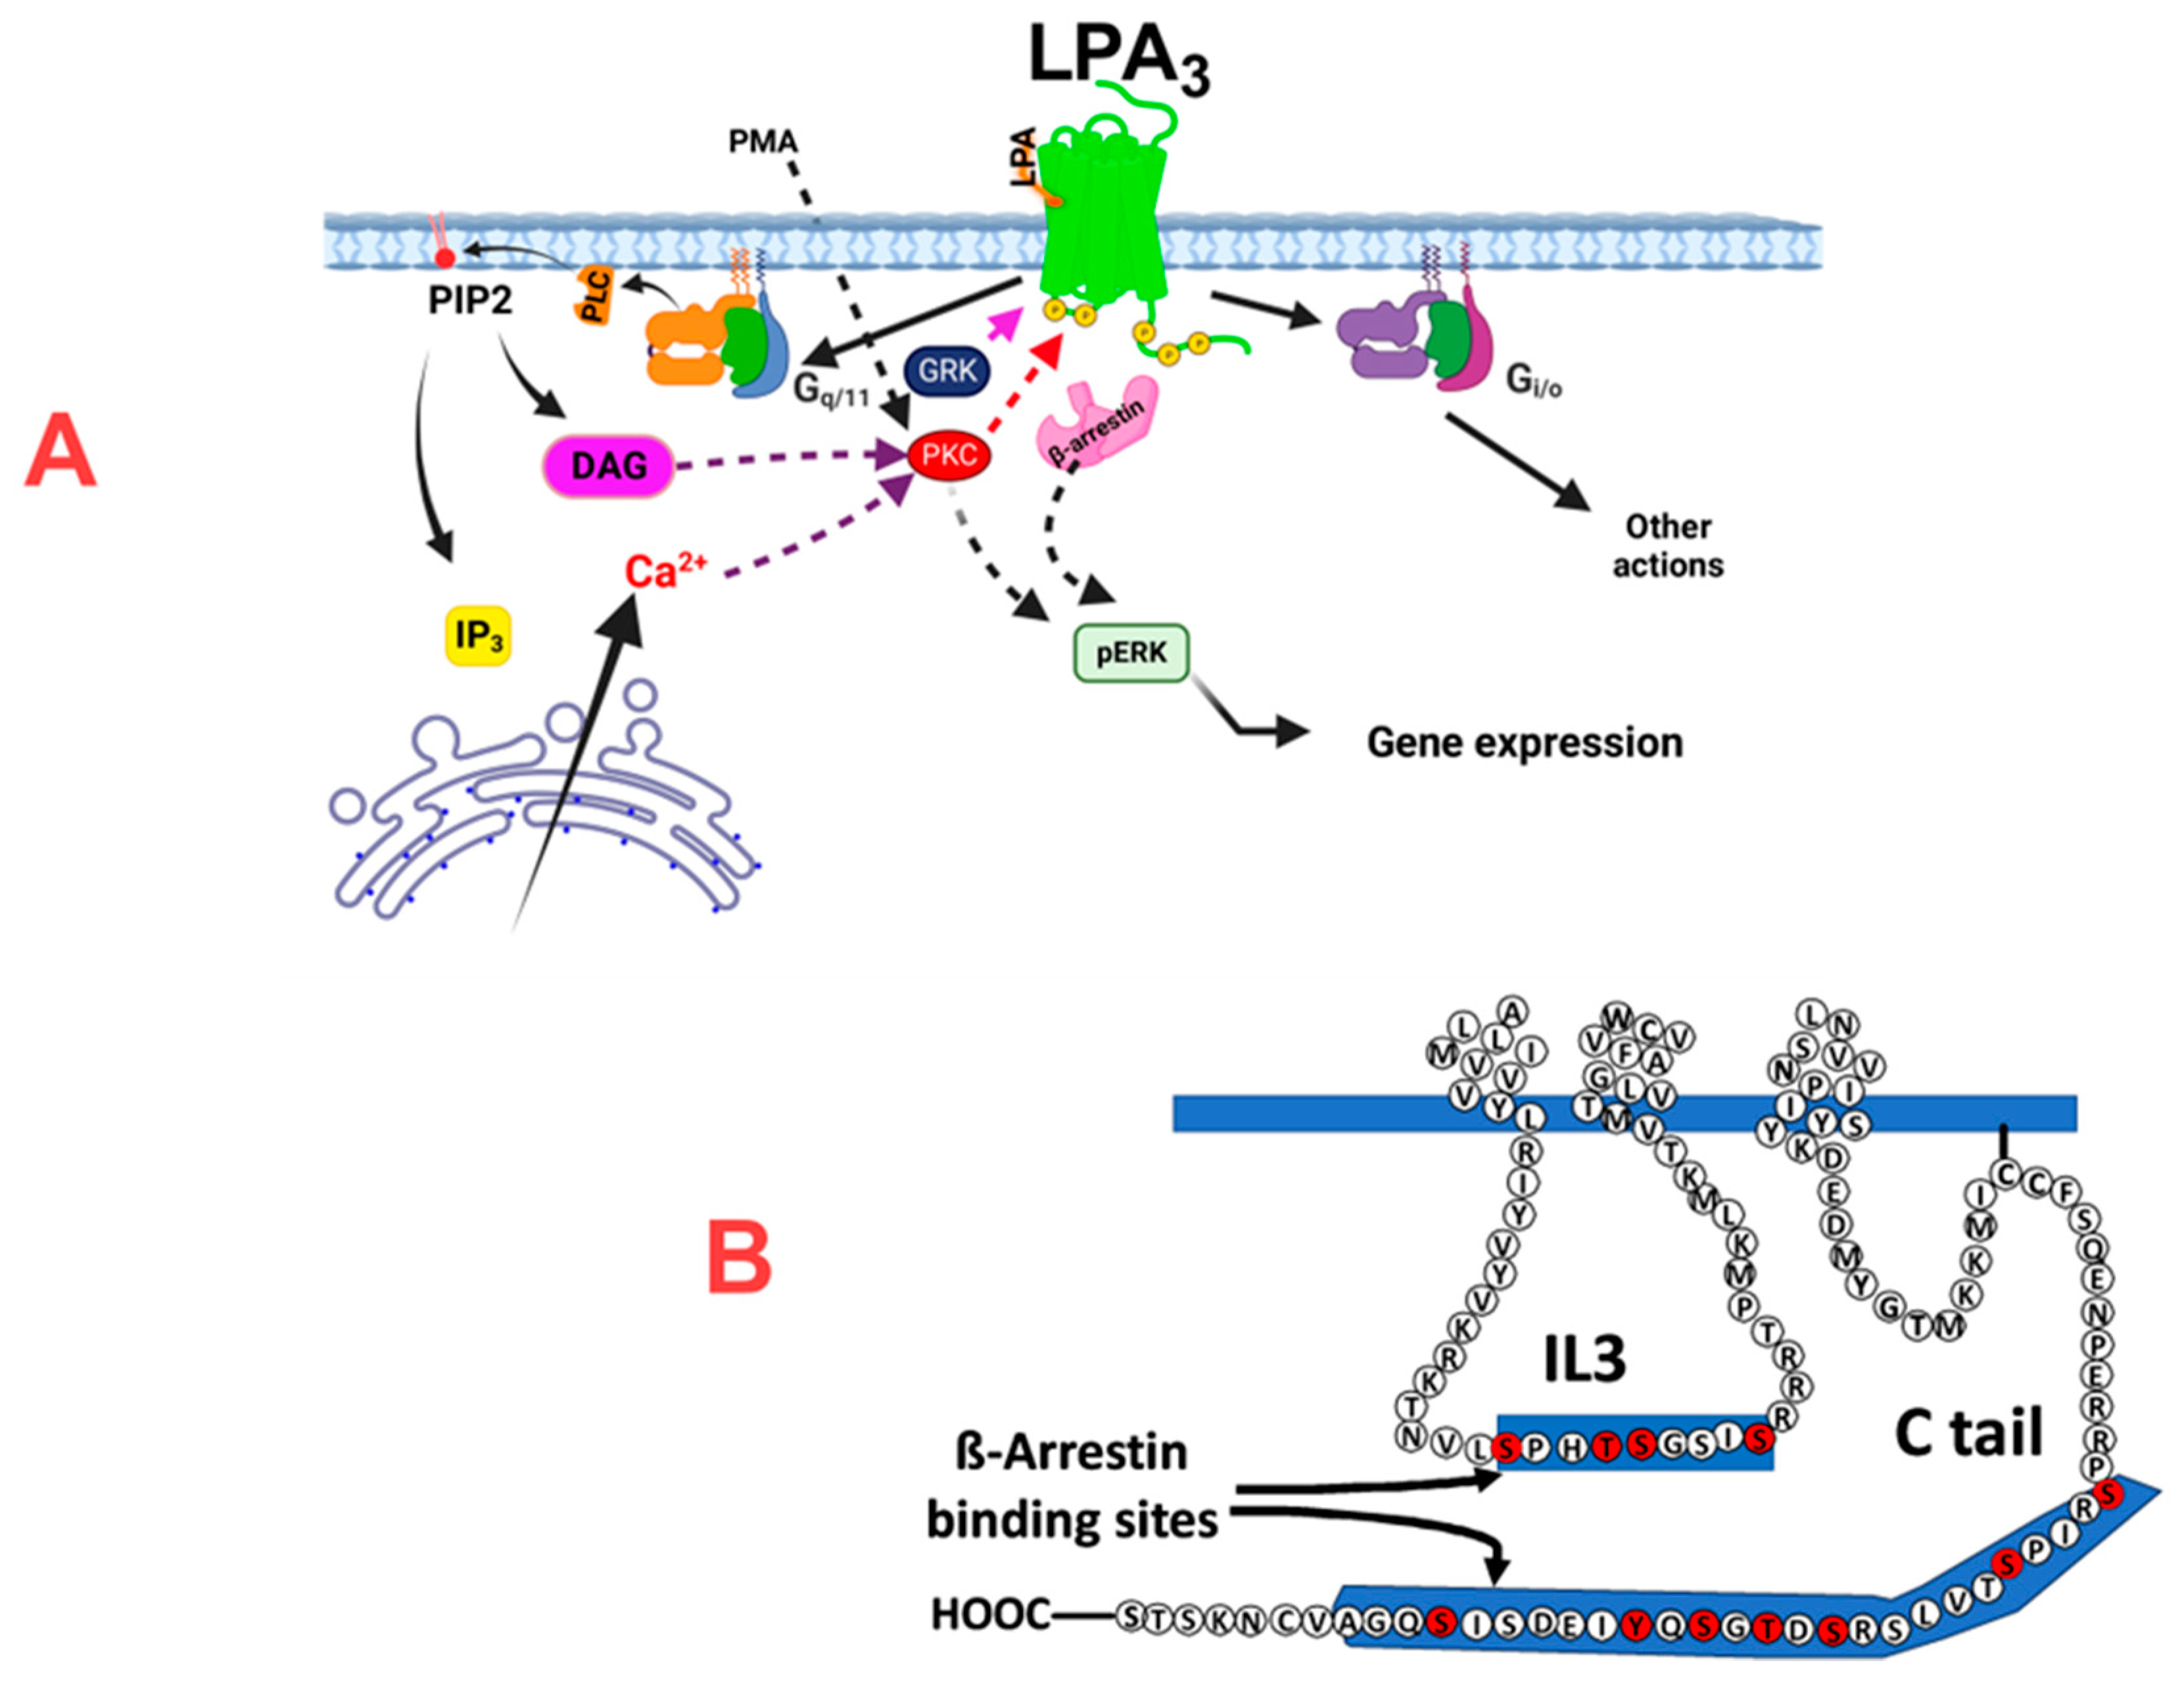
3 receptor-mediated actions. Figure 10 (panel A) depicts some of these data interpretations.
Figure 9.
Cartoon depicting the possible mechanism of action of LPA3 receptors and the possible role of phosphorylation sites in β-arrestin binding. Panel A shows that LPA3 receptors couple to Gq/11 and Gi/o and the finding that it is through Gq/11 that agonist activation of this receptor subtype mainly triggers calcium signaling and ERK phosphorylation. In Panel B, the possible role of the phosphorylation sites detected (marked in red) in the IL3 and Ctail domains in β-arrestin binding is suggested. IL3, intracellular loop 3; Ctail, carboxyl terminus; PLC, phospholipase C; PIP2, phosphatidylinositol 4,5-bisphosphate, DAG, diacylglycerol, GRK, G protein-coupled re-ceptor kinase, PKC, protein kinase C.
As anticipated by previous work [
31], PKC activation with PMA markedly blocked the calcium response observed in cells expressing LPA
1 or LPA
3 receptors. The possibility that protein kinase activation might alter calcium signaling at other steps in the process cannot be completely ruled out. Our data also confirmed that LPA
3 receptors were less sensitive to agonist-induced (homologous) desensitization. In our previous work [
31], we observed reduced desensitization, whereas no homologous desensitization was detected in the present work. This difference is likely due to the cellular models used (C9 cells [
31] and Flp-In TREx HEK 293 cells in this work) that express different repertoires of signaling elements and the fact that the inducible model expresses a high density of receptors (required for the receptor purification studies). This difference in desensitization is probably relevant to the roles of LPA
3 receptors in cancer, particularly in those involving interaction with high concentrations of this lysophospholipid, such as ovarian cancer [
6,
16,
22,
29]. It is worth mentioning that the LPA
3 receptor has been suggested as a therapeutic target and biomarker for ovarian cancer [
29].
Arrestins are a family of proteins that bind to phosphorylated receptors and participate in desensitization, signaling, internalization, and many other functions [
9,
10,
12]. The LPA
3 receptors-β-arrestin 2 interaction observed in the FRET and colocalization experiments suggests that in the baseline state, β-arrestin is distributed in the cytoplasm; upon stimulation with LPA, β-arrestin interacts with plasma membrane-located LPA
3 receptors, after a short time the FRET signal diminished (although remained above baseline during the 60 min of incubation), and the colocalization images suggest that some receptors internalize colocalizing with β-arrestin. G protein-coupled receptors have been divided into two classes based on the stability of the interaction with arrestins [
48,
49]. Class A receptors have a transient interaction with β-arrestin and translocate with this protein to clathrin-coated pits; once internalized, the receptor and β-arrestin dissociate. Class B receptors’ interaction with β-arrestin is more stable, and the receptors internalize accompanied by β-arrestin [
48,
49]. Our data indicate that the LPA
3 receptors have many characteristics of Class A receptors but also have a feature of Class B receptors (i.e., apparently, some receptors maintain interaction with β-arrestin after internalization and FRET and colocalization signals decrease but do not vanish). The possibility that classification might not be binary but that receptors with intermediate characteristics might exist is suggested. It is worth reminding that colocalization and FRET are different parameters reflecting distinct aspects. Colocalization has a resolution of ≈ 200 nm, and objects could be at distinct optical planes, whereas to obtain a FRET signal, a distance of < 10 nm should exist between fluorophores.
We confirmed [
31] the ability of LPA and PMA to induce LPA
3 receptor internalization. Pitstop 2 inhibits the terminal domain of clathrin-heavy chains [
42,
43] and markedly decreases LPA-induced LPA
3 internalization. The action of PMA on receptor internalization was delayed but essentially followed the same pattern of cells incubated without the inhibitor. Similarly, Pitstop 2 markedly decreased LPA-induced ERK phosphorylation but only delayed the action of PMA. The parallelism of these processes is consistent with the idea that complexes involving receptors, β-arrestin, clathrin, the endocytic machinery, and MAP kinases are involved in both events [
50].
LPA
3 receptor phosphorylation was confirmed in the present study. This work’s central objective was to characterize the phosphorylated LPA
3 residues. We detected sites in the intracellular loop 3 and carboxyl terminus with reproducibility and high Ascore [
51]. Determination of these sites opens the possibility to study their functional impact. Nevertheless, further work will be required to define this in the two domains. This final goal will help better understand this receptor’s function and regulation, which is relevant considering its roles in health and disease. It is worth mentioning that phosphorylation codes for β-arrestin recruitment by G protein-coupled receptors have been discovered ( [
52] see also (
http://tools.vai.org/phoscofinder/downloads.php), which allows finding putative β-arrestin binding sites in receptors. Several of these sites were reported for the LPA
3 receptors [
52] located in the carboxyl terminus within the region S321-A346. Other sites were detected, using the “phoscofinder” webpage, in the intracellular loop 3, within the sequence S221-S229. All phosphorylated residues in the mass spectrometry studies were within these regions. These aspects are depicted in
Figure 10 (panel B).
It is worth noticing that the lack of conservation of the phosphorylation sites was far from surprising. Previous work has shown that phosphorylation sites are not conserved among the α -adrenergic subtypes [
53,
54,
55]. In contrast, the phosphorylation sites were conserved among receptor orthologs, which is also similar to what has been observed for α1-adrenoceptor subtypes [
53,
54,
55].
The present experiments provide insight into the actions and regulation of LPA
3 receptors. Limitations of this work include using a single cellular model, i.e., Flp-In TREx HEK293 cells. We previously studied LPA
3 receptor phosphorylation, internalization, and desensitization in C9 cells [
31]; some differences in these studies were observed, which is not unexpected [
33,
34], since receptor action and regulation depend on the proteins expressed which is cell-specific. However, in both cellular systems, the LPA
3 receptor was overexpressed. Unfortunately, to our knowledge, there is no suitable cellular model to study LPA
3 action and regulation since most cells express various receptor subtypes for lysophosphatic acid.
Another limitation is the use of PMA to study heterologous desensitization and internalization. One advantage of PMA is that most of its actions are mediated through activation of PKC isoforms; however, there are other targets for active phorbol esters and diacylglycerol [
56,
57]. Nevertheless, we have previously shown that PKC inhibitors and down-regulation of some isoforms block the ability of PMA to induce LPA
3 phosphorylation and block LPA
3-mediated increases in intracellular calcium [
31]. These data strongly indicate that these actions are mediated through PKC but do not allow us to exclude the roles of other phorbol ester-targets completely; similarly, actions secondary to PKC cascade activation might alter signaling processes (such as ERK phosphorylation studied in this work) [
41]. In addition, sustained activation of PKC is induced by phorbol esters, whereas diacylglycerol action seems to be transient under physiological conditions. Despite these limitations, unavoidable due to pharmacological and molecular biological strategies, the present finding provides new insights into LPA
3–triggered signaling pathways, actions, and regulation.
In our opinion, the phosphorylation experiments with the mutant receptor validate that the sites detected were those mainly phosphorylated in cellulo. However, defining the functional roles of the phosphorylation sites detected in the intracellular loop 3 and carboxyl terminus is an experimental challenge. Understanding the roles of different phosphorylation domains, clusters of phosphorylation sites, and even individual phosphor amino acids seems relevant, considering the importance of this receptor in physiology and pathophysiology. Experiments on this aspect are currently being performed in our laboratory.
Figure 1.
LPA3 receptors expressed are functional and markedly sensitive to heterologous but not to homologous desensitization. Panel A, Representative calcium tracings in response to 1 µM LPA (arrow) in HEK 293 cells (green line), and HEK293 TREx TM transfected to express LPA3 receptors (induced, black continuous line, and not induced, black dotted line). Panel B, calcium response to 1 µM LPA (arrow) of LPA3-expressing cells incubated in buffer with (black line) or without (red dotted line) calcium. Panel C, intracellular calcium tracings of LPA3-expressing cells preincubated for 30 min in the absence of any agent (black line) or presence of 10 µM U73122 (phospholipase C inhibitor, orange line) or 10 µM U73343 (inactive analog, red line) and challenged with 1 µM LPA (arrow). Thapsigargin 1 µM (Thap, second arrow). Panel D, calcium tracings of induced cells preincubated overnight without (black line) and with pertussis toxin (purple line); arrow indicated the addition of 1 µM LPA. Panel E, calcium tracings in response to 1 µM LPA of cells preincubated without any agent (black line) or with 1 µM LPA for 5 min and washed before re-challenging (black dotted line) with 1 µM PMA (PMA, red line). Panel D, calcium tracings in response to LPA of cells preincubated without any agent (None, open bar), with 1 µM LPA for 5 min and washed before re-challenging (LPA, dashed bar) or with 1 µM PMA (PMA, red dashed bar). The means are plotted, and vertical lines indicate the SEM of 4-5 experiments performed on different days and distinct cell cultures. ***p< 0.001 vs. baseline.
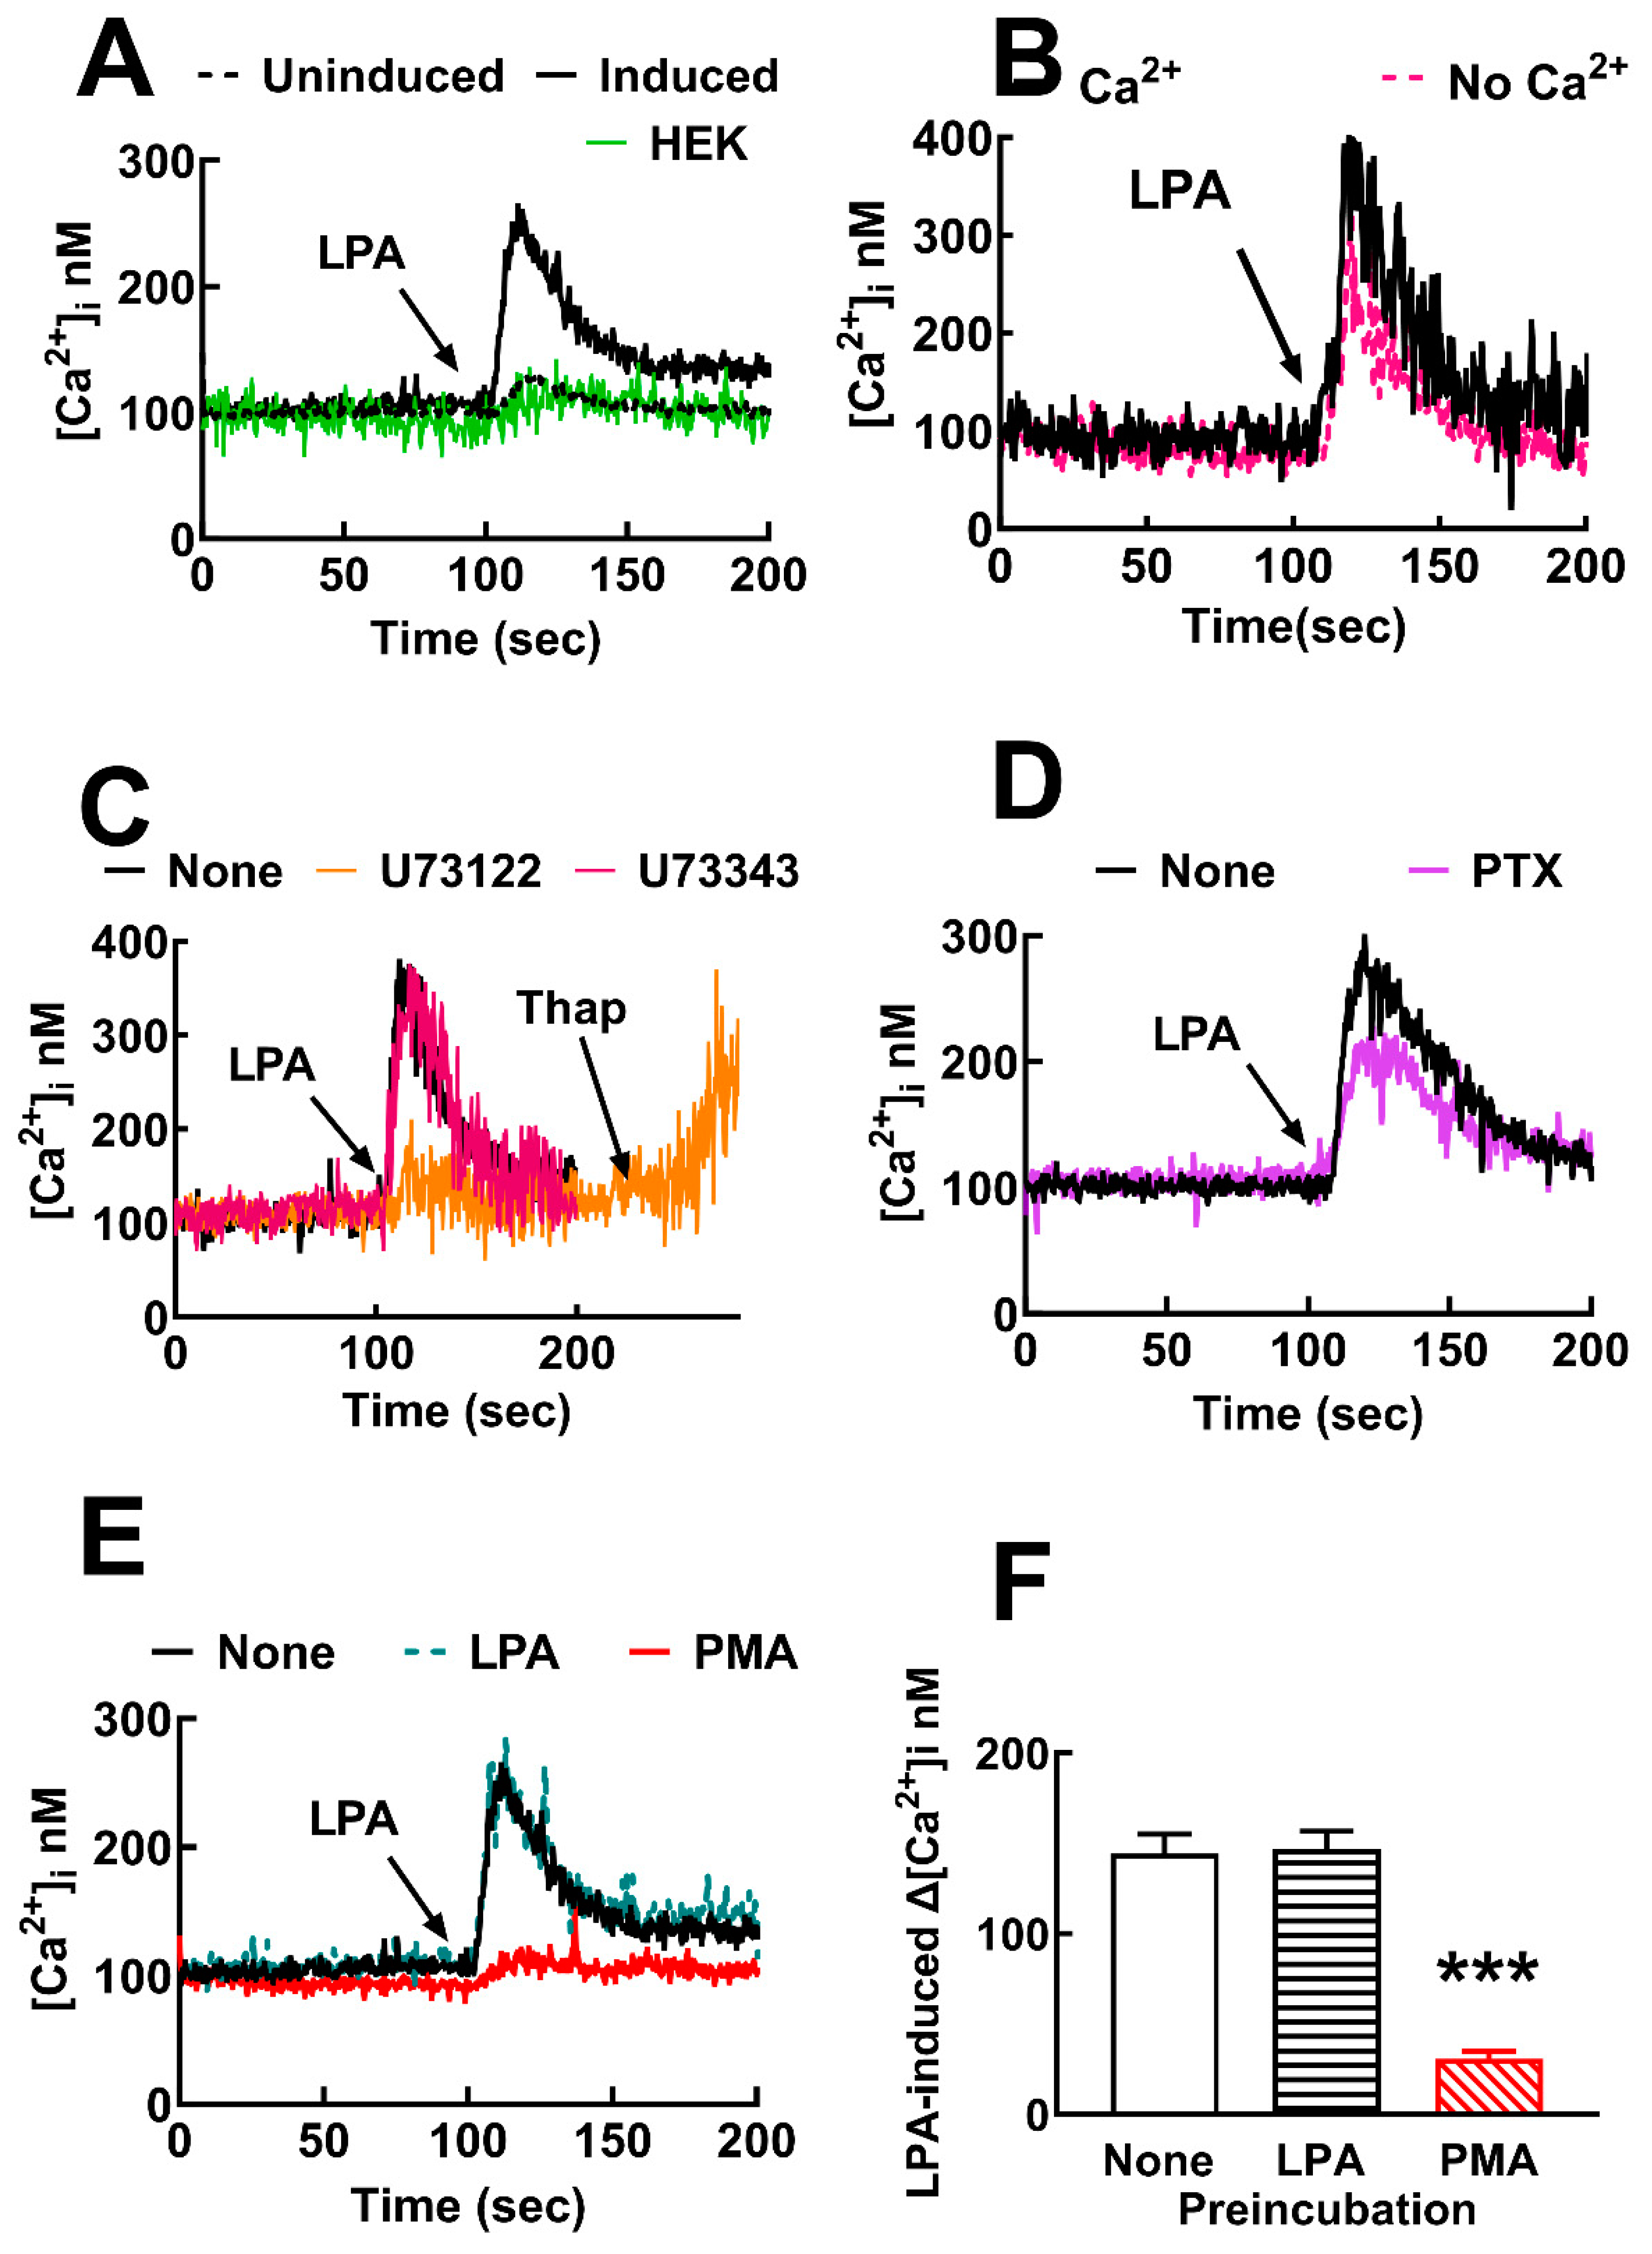
Figure 2.
Time-course of LPA- and PMA-induced ERK 1/2 phosphorylation in LPA3 receptor-expressing cells. Cells were stimulated with 1 µM LPA (black symbols and line) or 1 µM PMA (graphical black). The mean is plotted, and vertical lines indicate the SEM of 7-8 experiments performed on different days and distinct cell cultures. ***p < 0.0001, **p < 0.001, and *p< 0.01 vs. baseline value. Representative Western blots are presented above the Figure.
Figure 3.
Time-course of LPA- and PMA-mediated LPA3 internalization. Cells were incubated for the times indicated with 1µM LPA (black symbols and line) or 1µM PMA (red symbols and line). Internalization is presented as the percentage of baseline intracellular fluorescence. The mean is plotted, and vertical lines indicate the SEM of 14 images obtained from 5 experiments performed on different days and cell cultures. ***p < 0.001 vs. baseline value. Representative images are presented above the graph. Bars 10 µm.
Figure 4.
LPA-induced LPA3 receptor-β-arrestin interaction. Panel A, Time-course of LPA3 receptor-β-arrestin interaction as reflected by FRET. Cells were challenged with 1µM LPA at time 0. The means are plotted, and vertical lines indicate the SEM of 5-6 experiments performed on different days and distinct cell cultures. ***p < 0.0001 and *p < 0.05 vs. baseline value. Panel B, Representative FRET images. Panel C, Representative images showing colocalization (white) of LPA3-eGFP receptors (green) and β-arrestin-mCherry (red). Bars 10 µm. .
Figure 5.
PMA-induced LPA3 receptor-β-arrestin interaction. Panel A, Time-course of LPA3 receptor-β-arrestin interaction as reflected by FRET. Cells were challenged with 1µM PMA at time 0. The means are plotted, and vertical lines indicate the SEM of 5-6 experiments performed on different days and distinct cell cultures. ***p < 0.0001 and *p < 0.05 vs. baseline value. Panel B, Representative FRET images. Panel C, Representative images showing colocalization (white) of LPA3-eGFP receptors (green) and β-arrestin-mCherry (red). Bars 10 µm.
Figure 6.
LPA- and PMA-induced LPA3 receptor phosphorylation. Cells were challenged with 1 µM LPA or 1 µM PMA at time 0. Receptor phosphorylation is expressed as the percentage of the baseline value. The means are plotted, and vertical lines indicate the SEM of 9 experiments performed on different days using different cell cultures. **p < 0.01, *p < 0.05 vs. baseline value. Representative autoradiographs (32P) and Western blots (WB) are presented above the graph.
Figure 7.
Models showing the LPA3 receptor phosphorylation sites predicted in silico (panel A) and obtained experimentally (mass spectrometry, panel B). Phosphorylation sites are indicated in red.
Figure 7.
Models showing the LPA3 receptor phosphorylation sites predicted in silico (panel A) and obtained experimentally (mass spectrometry, panel B). Phosphorylation sites are indicated in red.
Figure 8.
Sequence alignment of the intracellular loop 3 and the carboxyl terminus of the three human LPA receptors belonging to the lysophosphatidic acid family. Amino acids detected phosphorylated in mass spectrometry in the LPA3 receptors or conserved in the other subtypes are marked in red.
Figure 8.
Sequence alignment of the intracellular loop 3 and the carboxyl terminus of the three human LPA receptors belonging to the lysophosphatidic acid family. Amino acids detected phosphorylated in mass spectrometry in the LPA3 receptors or conserved in the other subtypes are marked in red.
Figure 9.
Sequence alignment of the intracellular loop 3 and the carboxyl terminus of the three human LPA receptors belonging to the lysophosphatidic acid family. Conserved amino acids detected phosphorylated (human) among LPA3 receptors orthologs. The intracellular loop 3 of the distinct orthologs is indicated in green, and the conserved (compared to the human ortholog) phosphorylated amino acids are marked in red. The carboxyl terminus is indicated in yellow, and the conserved phosphorylated amino acids are marked in blue.
| Kinases |
Site |
Amino acid |
Sequence |
Domain |
CAMK, CAMKL
CK1/VRK
Pyk 2, JAK
GRK 4
CAMK, MAPK
PKC α, β, γ, δ
TK
TK
PKA, PKC α, ζ, GRK 3
PKA, PKC α, ε, GRK 3, 5
Akt
PKA
GRK 2
AGC/GRK
AGC/GRK
PKC γ, δ, ζ, GRK 1, 2, 4, |
130
221
224
225
227
229
293
301
321
325
329
333
337
341
343
353 |
S
S
T
S
S
S
Y
Y
S
S
S
T
Y
S
S
S |
IAVERHMSIMRMRVH
KRKTNVLSPHTSGS
TNVLSPHTSGSISRR
NVLSPHTSGSISRRR
LSPHTSGSISRRRTP
PHTSGSISRRRTPMK
SVVNPIIYSYKDEDM
SYKDEDMYGTMKKMI
ENPERRPSRIPSTVL
RRPSRIPSTVLSRSD
RIPSTVLSRSDTGSQ
TVLSRSDTGSQYIED
RSDTGSQYIEDSISQ
GSQYIEDSISQGAVC
QYIEDSISQGAVCNK
AVCNKSTS |
IL 2
IL 3
IL 3
IL 3
IL 3
IL 3
Ctail
Ctail
Ctail
Ctail
Ctail
Ctail
Ctail
Ctail
Ctail
Ctail |
Table 2.
Receptor sites detected phosphorylated by mass spectrometry. Conditions: baseline (B, no color background), and stimulations by 1 µM LPA (grey) or 1 µM PMA (red); the numbers inside the boxes indicate the times peptides were detected phosphorylated in the experiments.
Table 2.
Receptor sites detected phosphorylated by mass spectrometry. Conditions: baseline (B, no color background), and stimulations by 1 µM LPA (grey) or 1 µM PMA (red); the numbers inside the boxes indicate the times peptides were detected phosphorylated in the experiments.
| Location |
Amino acid |
B |
LPA |
PMA |
221*
224*
225*
229*
321*
325*
331
333*
335
337*
343*
|
S
T
S
S
S
S
S
T
S
Y
S
|
33
13
59
31
27
23
21
20
|
26
18
12
18
40
11
15
19
|
49
18
14
90
31
22
20
13
20
|
