Preprint
Article

Endometrial Proliferative Phase-Centered View on the Transcriptome Dynamics Across the Menstrual Cycle

Altmetrics

Downloads

121

Views

58

Comments

0

A peer-reviewed article of this preprint also exists.

Submitted:

08 April 2024

Posted:

09 April 2024

You are already at the latest version

Alerts
Abstract
The endometrium, the inner mucosal lining of the uterus, undergoes complex molecular and cellular changes across the menstrual cycle in preparation for embryo implantation. Transcrip-tome-wide analyses have mainly been utilized to study the endometrial receptivity, the prerequisite for successful implantation, with most of the studies, so far, comparing the endometrial transcriptomes between (i) secretory versus proliferative endometrium or (ii) mid-secretory versus early-secretory endometrium. In the current study, we provide the complete transcriptome description of the endometrium across the entire menstrual cycle and, for the first time, comprehensively characterize the proliferative phase of the endometrium. Our temporal transcriptome analysis includes five time points: mid-proliferative, late-proliferative (peri-ovulatory phase), early-secretory, mid-secretory, and late-secretory phases. Thus, we exhaustively unveil the transitions between the consecutive proliferative and secretory phases, highlighting their unique gene expression profiles and possible distinct biological functions. Transcriptome analysis reveals many differentially expressed genes (DEGs) across the menstrual cycle, most of which are phase-specific. As an example of the coordinated gene activity, the expression profile of his-tone-encoding genes within the HIST cluster on chromosome 6 showed an increase in cluster activity during the late-proliferative and a decline during the mid-secretory phase. Moreover, numerous DEGs are shared among all phases. In conclusion, in the current study, we delineate the endometrial proliferative phase-centered view of transcriptome dynamics across the menstrual cycle. Data analysis highlights significant transcriptomic and functional changes occurring during the late-proliferative phase – an essential transition point from the proliferative to the secretory phase. Future studies should explore how the biology of the late-proliferative phase endometrium impacts the achievement of mid-secretory endometrial receptivity or contributes to molecular aberrations leading to embryo implantation failure.
Keywords: 
Subject: Biology and Life Sciences  -   Biochemistry and Molecular Biology

1. Introduction

The endometrium, characterized by its self-renewing nature, undergoes cyclical histological and functional transformations in growth and differentiation to prepare for embryo implantation. The endometrial cycle aligns with the follicular maturation and oocyte ovulation, with the uterine and ovarian phases mirroring each other. These phases include the menstrual phase, the proliferative phase (both combined as follicular phase), and the secretory phase (luteal phase), further divided into early-, mid-, and late-secretory phases based on histological and molecular assessment [1].
Endometrial receptivity (ER) occurs within a brief window, influenced by estradiol and progesterone, during which the endometrial tissue becomes favorable to embryo implantation [2]. For decades, efforts in genome-wide expression studies have focused on deciphering the endometrial transcriptomic signature associated with receptivity. Despite thorough consideration of various clinical and laboratory factors, so far, unidentified genomic factors may hinder achieving a natural or medically assisted pregnancy, uncovering how the chance for conception can be enhanced.
Due to the accumulated knowledge over the past two decades, it has become increasingly evident that the cellular features of the endometrial cycle correlate with the distinct transcriptional profiles of the entire tissue, which is essential for optimal endometrial function. While several research groups have conducted detailed studies of endometrial molecular dynamics in the natural cycle, the consensus on the gene expression profile indicative of ER remains still elusive [3]. The absence of consensus could stem from experimental discrepancies, such as variations in biopsy collection and timing, tissue cellular heterogeneity, methods employed for measuring gene expression, and statistical approaches used in data analysis and interpretation, among other factors [3,4,5]. For a long time, transcriptomic studies aimed at characterizing the healthy endometrium at the genomic level used microarray-based technologies [6,7,8,9,10]. Nowadays, these studies rely on massively parallel shotgun RNA sequencing, which allows for more comprehensive analysis with increased depth and specificity [11,12]. Recent advancements in single-cell-resolution transcriptomics have also allowed for the identification of distinct cell populations within the endometrium based on their distinct transcriptomes [13,14]
A substantial proportion of past genomic research focuses on WOI by comparing the endometrial genome expression profiles during the two critical phases: (i) mid-secretory versus early secretory endometrium or (ii) secretory versus proliferative phase endometria [3,5,15]. Still, the proliferative phase, which lasts for two weeks, is much less studied and is traditionally simplified as a continuous tissue growth in response to estradiol stimulation rather than a complex tissue transformation into the secretory phase endometrium. In contrast to the secretory phase, fewer studies are available on the time-critical genomic factors determining the transformation of the proliferative phase endometrial tissue [16]. Moreover, the proliferative endometrium also includes the peri-ovulatory time period, when sperm cells transiting the uterus aim to approach the ampulla region of the fallopian tube where the oocyte fertilization is believed to take place. The supportive role of the endometrium in sperm passage before fertilization has not been studied much but deserves future attention.
Moreover, it has been suggested that the transcriptomic signature of the proliferative phase endometrium in the controlled ovarian hyperstimulation cycles in IVF may predict the pregnancy outcome following fresh embryo transfer [17]. Additionally, the aberrations found in transcriptomic profiles at WOI in the patients with recurrent implantation failure in IVF indicate decreased cellular proliferation, a phenomenon typically observed in the proliferative phase endometrium [18]. This emphasizes the crucial need to elucidate the dynamics of endometrial gene expression throughout the menstrual cycle, with a particular focus on studies involving proliferative phase endometrial tissue. Such efforts would substantially enhance our comprehension of achieving endometrial receptivity during the subsequent secretory phase of the uterine cycle.
Data on transcriptional profiles across various time points of the proliferative and secretory phases within a single study utilizing the same analytical method are scarce in the literature. In this study, we performed a comprehensive transcriptome analysis of whole-tissue endometrium across the menstrual cycle using RNA exome sequencing and put specific effort into involving more than a single biopsy from the proliferative phase of the uterine cycle. Therefore, the analysis covered five time points of the endometrial cycle, covering the mid-proliferative (MP), late-proliferative (LP) or peri-ovulatory time-period, early-secretory (ES), mid-secretory (MS), and late-secretory (LS) phases. The analysis involved identifying Differentially Expressed Genes (DEGs) at each time point by comparing them pairwise with the mid-proliferative (MP) phase. DEGs were either specific to a particular phase or shared across all time points. Furthermore, the chromosomal locations of these DEGs were examined to detect co-expressed clusters of genes. Understanding these transcriptomic patterns is fundamental within the tissue, Gene Ontology and hallmark gene enrichment analysis were conducted on DEGs to uncover the functional alterations occurring throughout the endometrial cycle.

2. Materials and Methods

2.1. Study Design and Participants

The study protocol received approval from the Ethics Committee of the Faculty of Biology, Plovdiv University “Paisij Hilendarski”, Plovdiv, Bulgaria, under Certificate of Approval №3/02.09.2019 and the Research Ethics Committee of the University of Tartu, Estonia (No. 330M-8). All participants provided written informed consent.
The women meeting the selection criteria were healthy, fertile individuals aged 20 to 40 years, with regular menstrual cycles lasting 21 to 28 days and a body mass index (BMI) falling within the range of 19 to 29 kg/m2. They were all highly motivated volunteers without any accompanying diseases such as metabolic, endocrine, autoimmune, sexually transmitted diseases, or gynecological infertility-associated diseases (e.g., hydrosalpinx, endometriosis, polycystic ovary syndrome, myomas, polyps, or uterine anomalies). Each participant affirmed their non-smoking status, abstention from alcohol consumption, lack of medication use, and absence of a history of febrile illness. They all had a history of normal pregnancy and at least one healthy child.
Sonographic folliculometry and endometrial thickness assessments were conducted utilizing the Fukuda Denshi Full Digital Ultrasound System UF-870AG (Tokyo, Japan), commencing on day 7 of the menstrual cycle and sequentially performed on successive days to monitor menstrual cycle progression.

2.2. Endometrial Biopsies and RNA Extraction

Twenty-eight endometrial specimens were obtained from a cohort of women as follows: five biopsies from individuals in the MP phase (cd 8-10), four biopsies from individuals at the LH surge time-point confirmed through urinary LH level measurements (LP phase), six biopsies from participants at LH+2/3 (ES phase, 2-3 days post-LH-peak), seven biopsies from subjects at LH+7/8 (MS phase, WOI), and six biopsies from women at LH+11/13 (LS phase) of the natural cycle. Endometrial biopsy samples were obtained using a Pipelle catheter (Laboratoire CCD, Paris, France) and stored in RNAlater Solutions for RNA stabilization (ThermoFisher Sci, Waltham, USA). RNA from the endometrial biopsies was extracted with miRNeasy micro kit (Qiagen, Germany), separating larger RNA and miRNA fractions. RNA quality and quantity were analyzed on Bioanalyzer TapeStation 2100 with RNA ScreenTape (Agilent, USA). Samples with an RNA integrity number (RIN) ≥7 were considered suitable for further analysis.

2.3. RNA Sequencing and Bioinformatics Analysis

The whole-exome RNA library was synthesized using the TruSeq exome RNA library preparation kit from Illumina, which facilitates the enrichment of coding sequences by utilizing sequence-specific probes. For the library preparation, 100 ng of RNA was used. Once prepared, the library was pooled, and its quality was determined using Agilent’s High Sensitivity DNA ScreenTape D1000 system (Agilent, USA). Following quality assessment, we adjusted the library to a concentration of 2nM. For the sequencing phase, 1.1 nM from the pooled library was used on the NextSeq 1000 platform, utilizing a single-end sequencing method with a read length of 80 base pairs.
Quality control of RNA sequencing data and adapter trimming for FASTQ files were performed using FastQC and Trim Galore [19]. The resulting clean reads were mapped to the GRCh38/hg38 human reference genome via HISAT2 [20]. Count matrices were generated based on genome annotation using the featureCounts tool [21] and fed into the DESeq2 package for DEG analysis. Genes showing differential expression with an adjusted p-value (p-adj) < 0.05 were selected for downstream analysis. Positional chromosome and Hallmark gene set enrichment analysis was done using the eVITTA tool – easyGSEA (https://tau.cmmt.ubc.ca/eVITTA/easyGSEA/) [22]. Hallmark gene set represents specific and well-defined biological processes from the Molecular Signatures Database (MSigDB) [23]. Heatmap and UpSet plots of DEGs were generated using iDEP (http://bioinformatics.sdstate.edu/idep/) [24]. GO enrichment analysis was performed using g:Profiler (https://biit.cs.ut.ee/gprofiler/gost) with g:SCS multiple testing correction method applying a significance threshold of 0.05 [25].

3. Results

3.1. The Transcriptional Landscape of the Endometrial Cycle Unveiled Distinct Changes during the LP and MS Phases

We employed RNA-exome sequencing to examine how gene expression levels vary across different menstrual cycle phases in healthy human endometrium. We identified 5,082 genes that were significantly differentially expressed (DEGs) between the control group (MP phase) and the LP, ES, MS, and LS phases (Supplemental Table S1). To visualize these expression changes in each phase, we created heat maps focusing on the statistically significant DEGs (padj<0.05) (Figure 1A).
Phase-specific and shared DEGs were identified and visualized using an Upset Diagram (Figure 1B). Notably, many significant DEGs were uniquely associated with two time points – the LP and MS phases. The highest number of phase-specific DEGs was observed in the MS phase, with down-regulated genes (945) outnumbering upregulated genes (594). Another notable time point with many specific DEGs was the LP phase, where upregulated genes (804) exceeded down-regulated genes (391), unlike the MS phase. The most shared DEGs (1178) were found between the MS and LS phases. Additionally, a set of 81 genes exhibited consistent differential expression throughout the entire endometrial cycle.
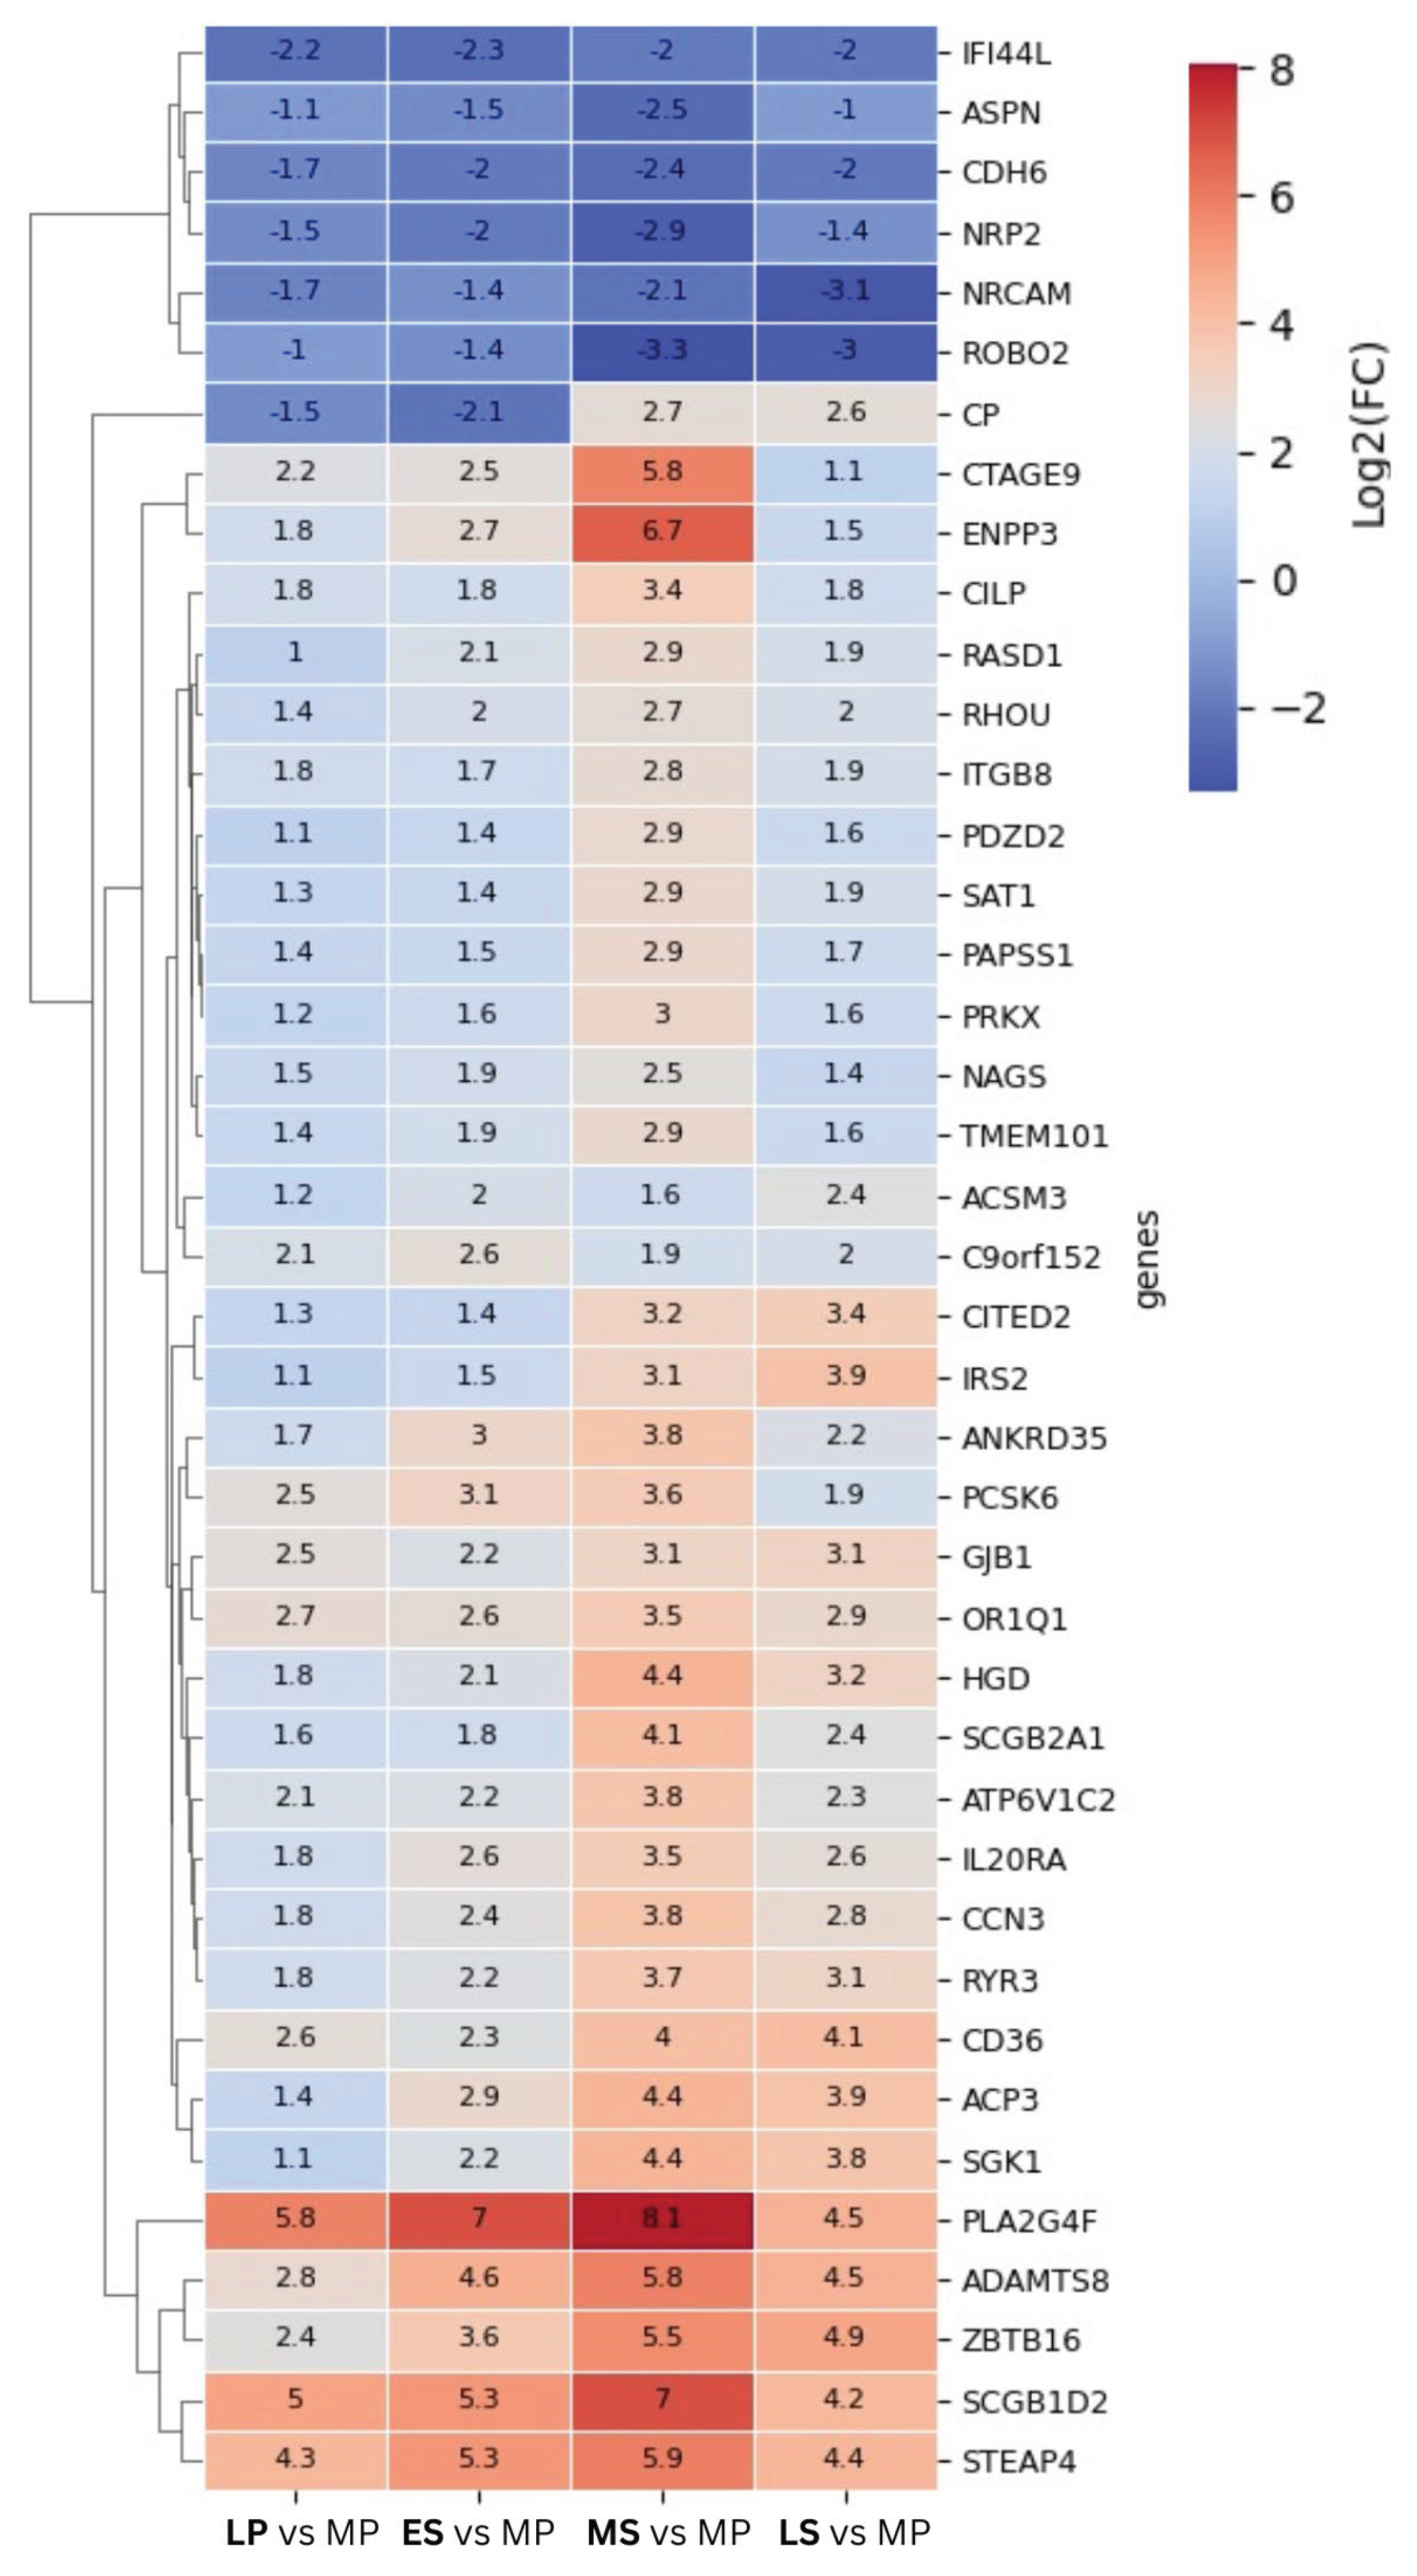
To illustrate the fluctuating response of the DEG throughout the endometrial cycle, a log2FC heat map of DEGs shared across all time points was created (Figure 2). Before clustering, we refined the selection of genes of interest, ensuring inclusion criteria that required a log2FC≥ |2| in at least one time point across the dataset of four time points, resulting in 42 DEGs.
Most of the shared DEGs demonstrate elevated expression levels throughout the menstrual cycle compared to the proliferative phase, indicating a prevailing trend of positive gene regulation. These genes exhibit increased expression during the LH surge, gradually rising until peaking at WOI. Three clustering genes - STEAP4, SCGB1D2, and PLA2G4F - stand out among the upregulated genes. Their expression levels show a significant increase at the LH peak (with log2FC of 4.3, 5, and 5.8, resp.), reaching a maximum at the MS phase (with log2FC of 5.9 and 8.1). Transcriptional levels of a few genes remain consistently suppressed at time points following the proliferative phase, reaching their lowest expression levels at WOI. One gene, Ceruloplasmin (CP), undergoes contrasting expression levels - its expression was down-regulated in the LP and ES phases, then upregulated in the MS and LS phases.
To examine the expression patterns of the DEGs in more detail, we compiled a list of the top 10 upregulated and top 10 downregulated genes, as presented in Table 1. Our analysis focused on the LP and MS phases, which exhibited the most significant changes compared to the proliferative phase, regarding the magnitude of change (represented as log2) and the total number of genes with changed expression patterns. As indicated in Figure 1, the table reveals a noteworthy finding from our investigation: the top 10 upregulated and downregulated genes during the LP phase are entirely different from those in the MS phase. Remarkably, many of the top 20 genes listed in the MS phase (Table 1) align with prior findings by other researchers as DEGs [6,11,12,26].

3.2. Genomic Distribution of DEGs Identified Dynamic Patterns across the Endometrial Cycle

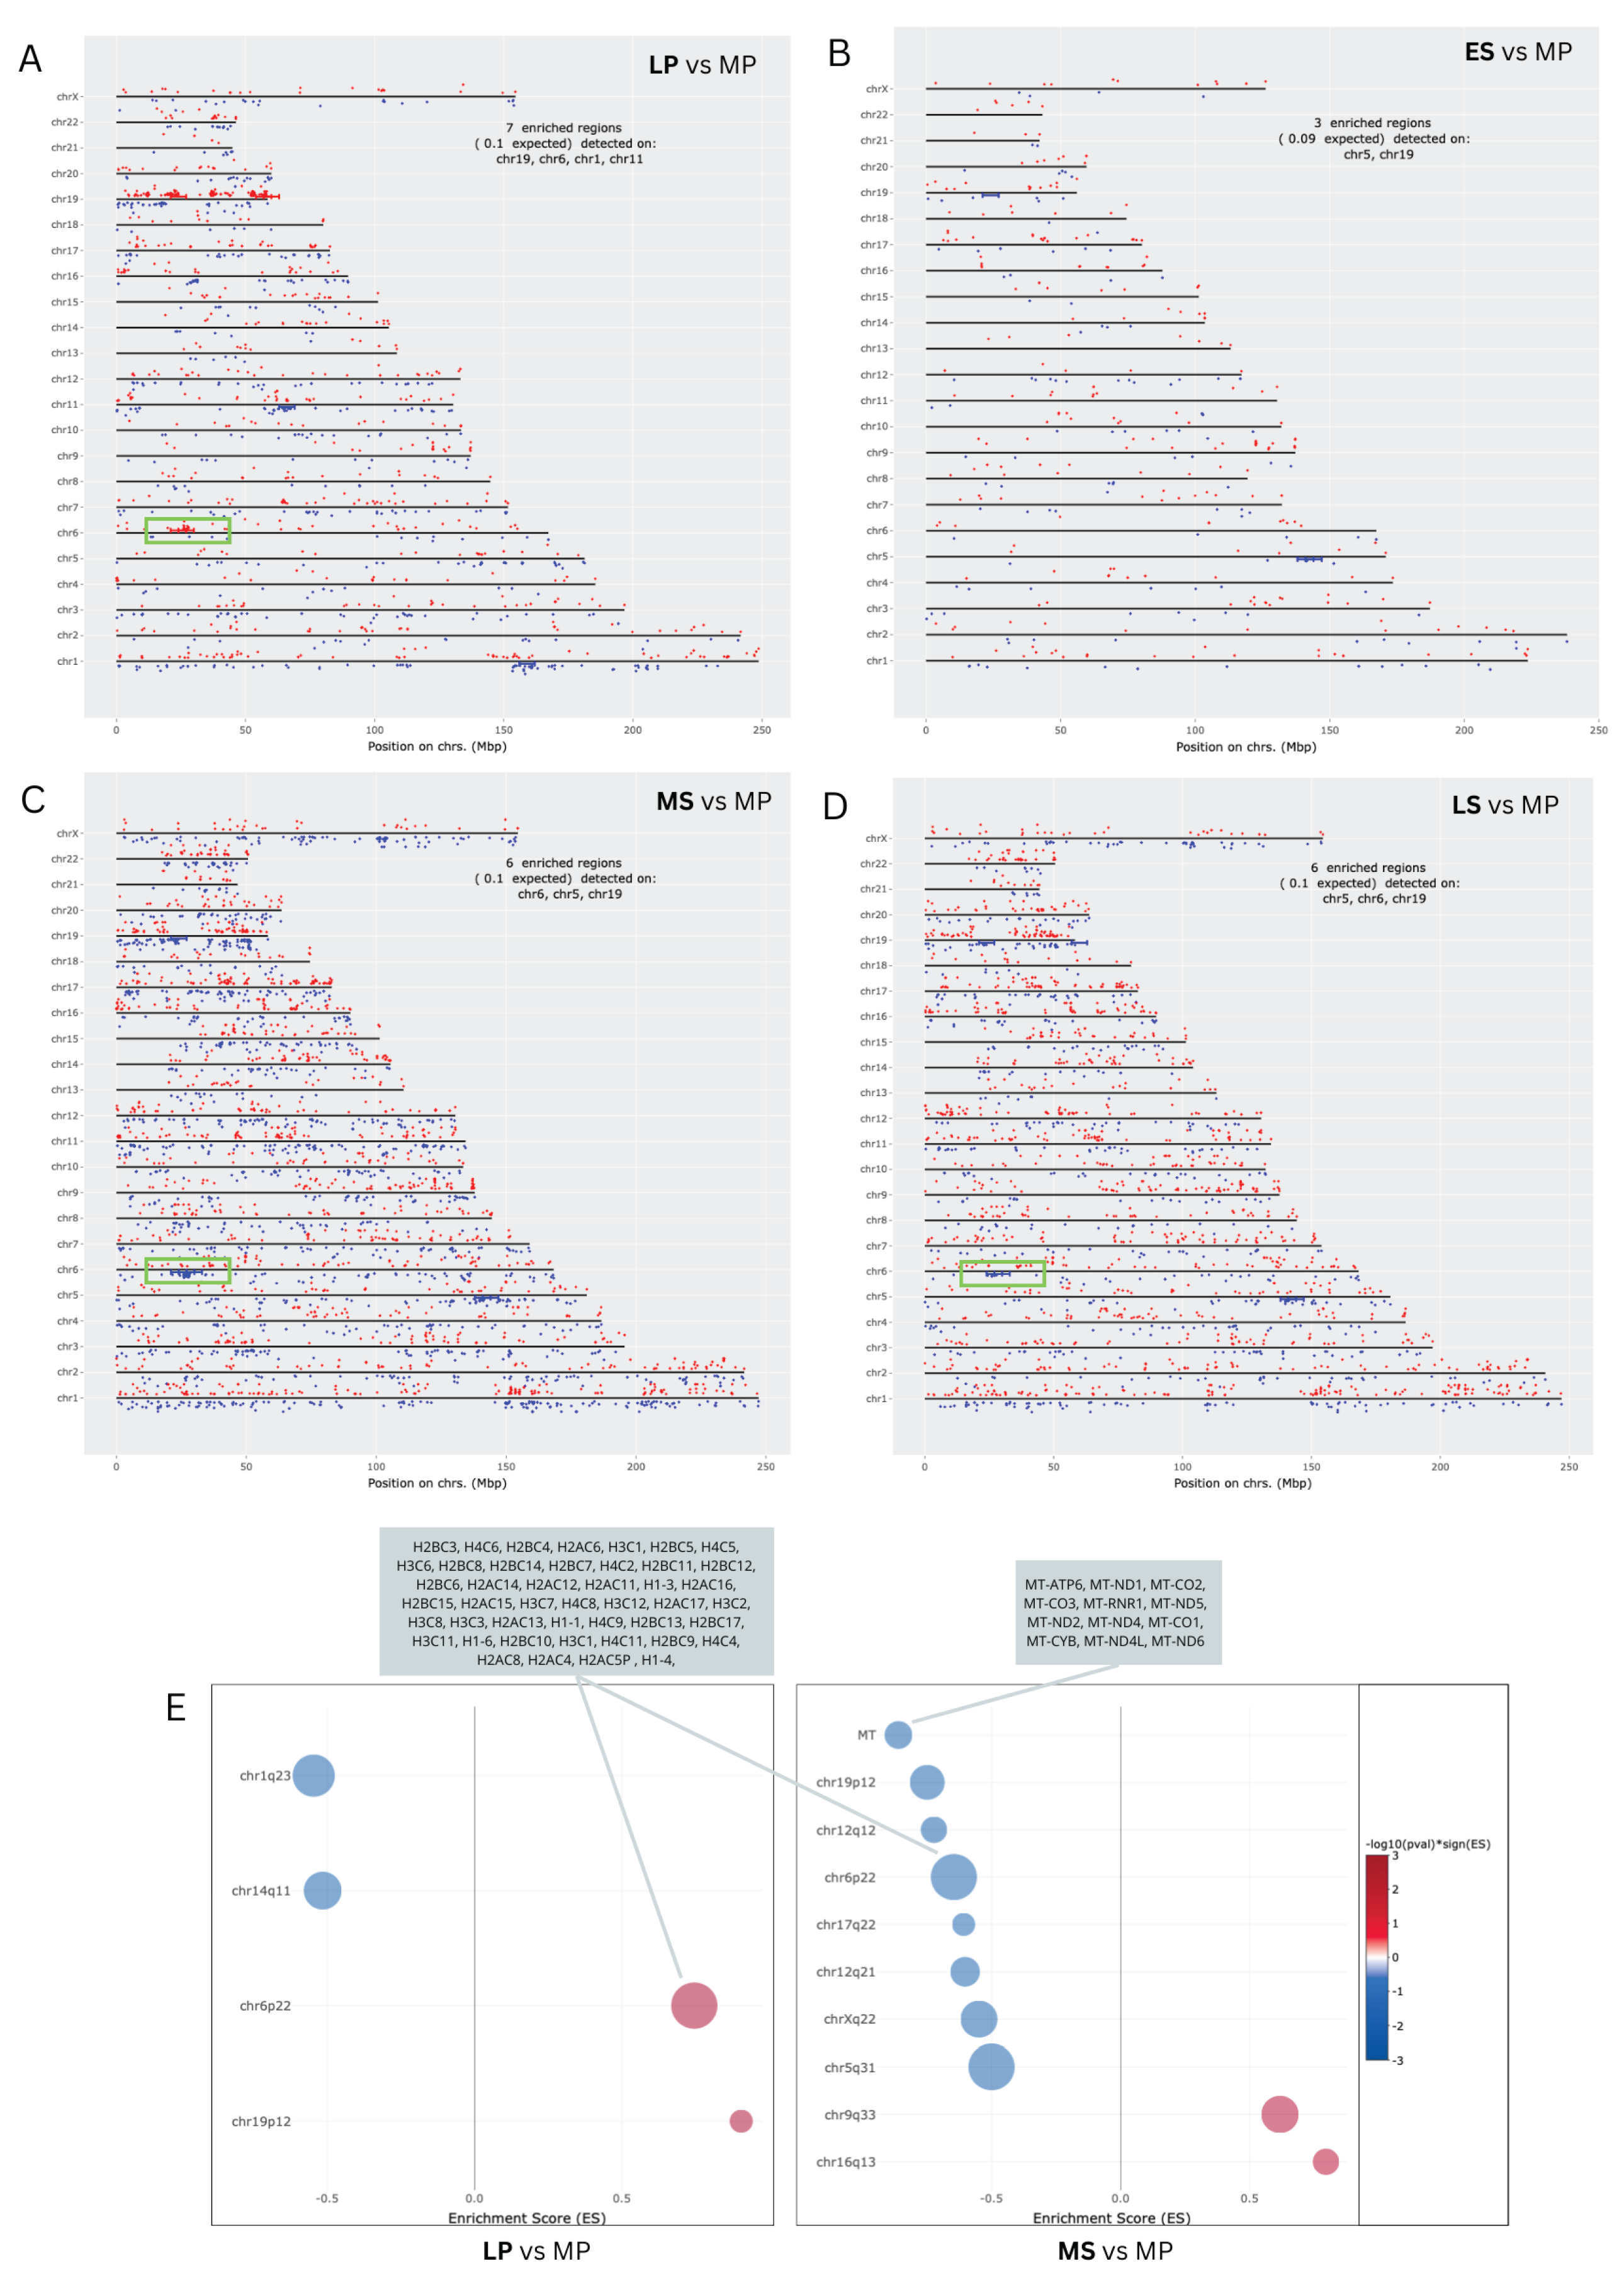
The distribution pattern of DEGs on chromosomes is depicted in Figure 3A–D. A widespread presence of DEGs across the genome was observed at all time points. The most enriched regions (7) were observed at the LP phase on chromosomes 19, 6, 11, and 1. For the MS and LS phases, six enriched regions were found on chromosomes 19, 6, and 5. In the ES phase, where the number of DEGs is the lowest, there are three enriched regions, one on chromosome 5 and two on chromosome 19. The distinctive pattern observed in the enriched region on chromosome 6, highlighted by a green box, during the LP, WOI, and LS phases is of notable interest. Specifically, gene expression is upregulated during the LP phase and downregulated during the WOI and LS phases, offering intriguing insights. The large histone gene cluster, HIST1, on human chromosome 6 (6p21–p22) contains 55 histone genes [27], of which we identified 46 DEGs to be enriched in the cluster (Figure 3E). Furthermore, an enriched region was revealed on the Mitochondrial chromosome in the MS phase, related to 12 mRNAs.

3.3. Functional Enrichment Exhibits Significant Alterations throughout the Endometrial Cycle

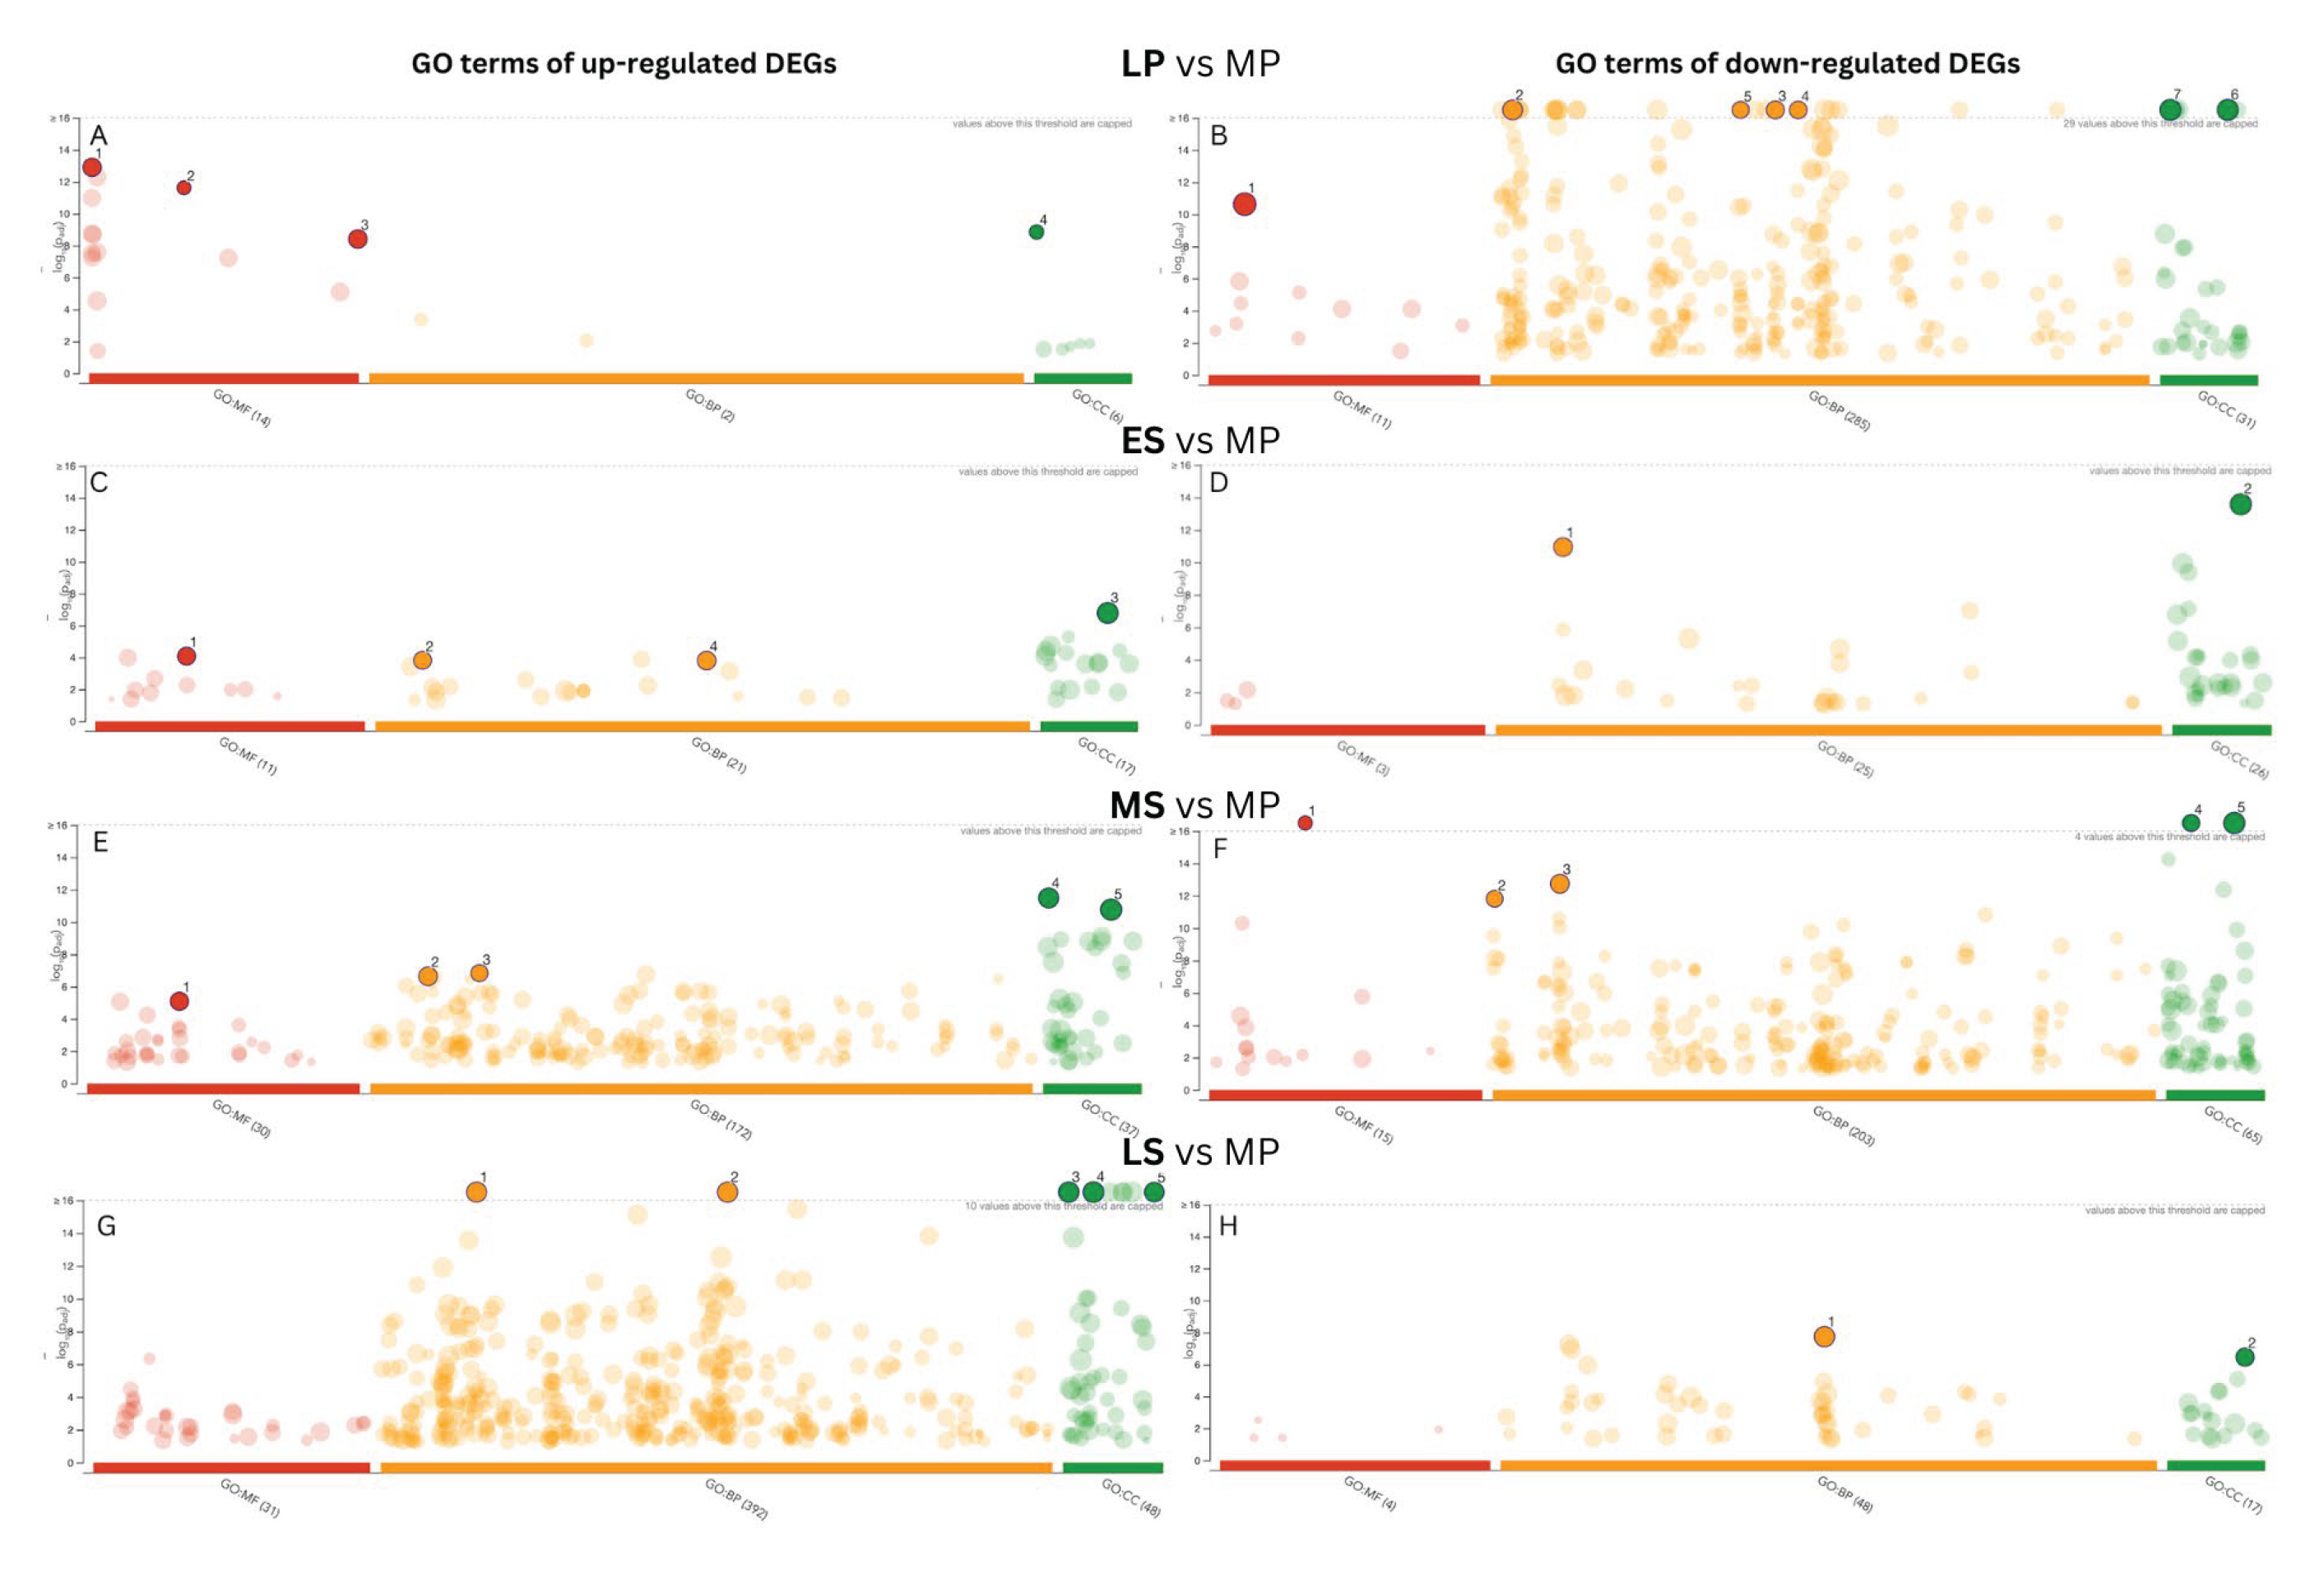
We conducted Gene Ontology (GO) analyses to explore DEGs’ biological relevance and functional implications across the endometrial cycle (Figure 4). Upregulated DEGs exhibited significant enrichment in RNA polymerase II-specific DNA-binding transcription factor activity at the LP phase in the molecular process category. In contrast, downregulated DEGs showed enrichment in protein binding. Downregulated DEGs were notably enriched in immune system processes in the biological function category. Regarding the cellular component category, upregulated DEGs were associated with the nucleosome, whereas down-regulated DEGs were enriched in the cell periphery.
In the ES phase, we observed that upregulated DEGs were more abundant in transmembrane transporter activity in the molecular function (MF) category, while down-regulated DEGs were associated with cell adhesion and cell periphery. During the MS phase, upregulated DEGs were notably involved in transmembrane transporter activity like the ES phase. Additionally, they were associated with lipid metabolic processes, regulation of hormone levels, extracellular space, and cell periphery. Down-regulated DEGs were significantly linked to cell adhesion, extracellular matrix, nuclear division, and structural constituent of chromatin. Moving to the LS phase, the upregulated DEGs displayed more GO term enrichments than the downregulated DEGs. They were mainly enriched in GO terms such as response to organic substances and regulation of multicellular organismal processes, as well as in extracellular space and extracellular vesicles.
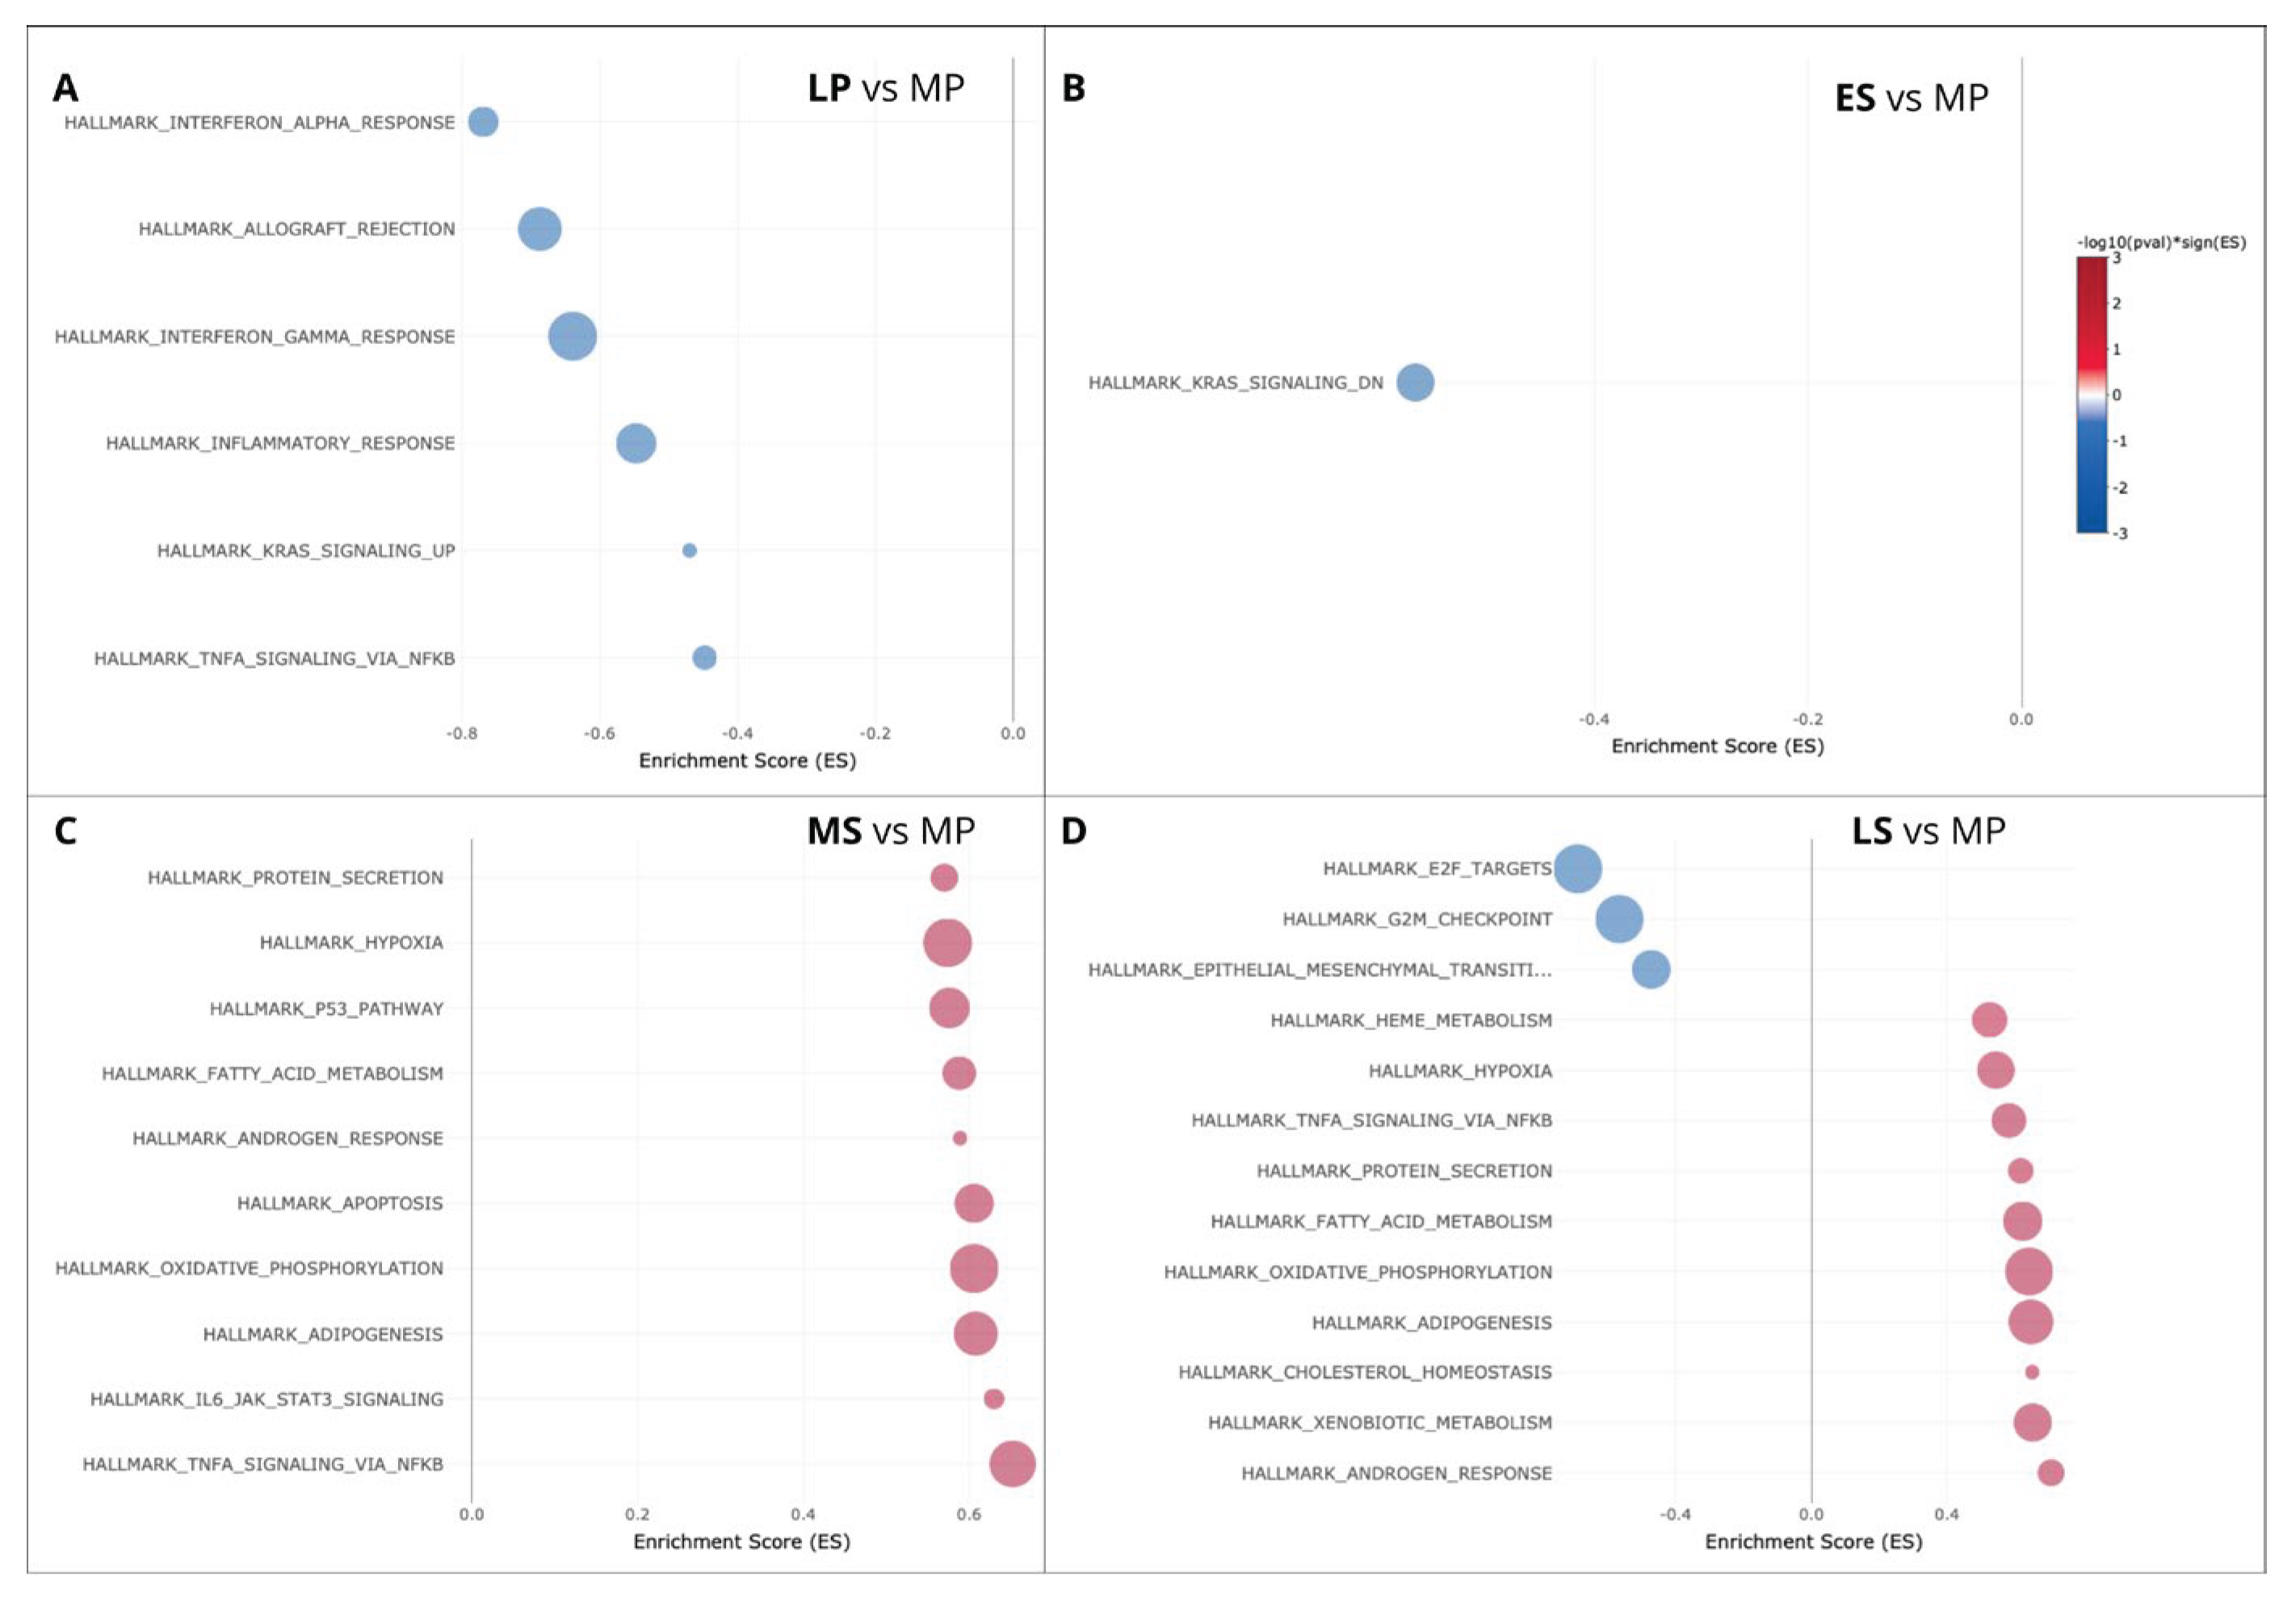
Subsequently, we conducted a DEG set enrichment analysis, specifically targeting the Hallmark gene sets representing clearly defined biological states or processes with consistent expression patterns (Figure 5). The study unveils a predominance of down-regulated DEGs enriched in the LP phase, linked to interferon alpha and gamma response, inflammatory response, and allograft rejection. Conversely, upregulated DEG enrichment prevails in the MS phase and is associated with protein secretion, hypoxia, and oxidative phosphorylation. Notably, the TNFA signaling via NFKB exhibits a contrasting profile, downregulated in the LP phase, and upregulated in the MS phase. Furthermore, a mix of up- and down-regulated gene pathways was observed in the LS phase.

4. Discussion

The fine-scale temporal transcriptomic analysis is a robust method for studying the genetic fluctuations that occur during the monthly cyclic changes of the human endometrium. In research, transcriptome variations are often studied by comparing the endometrial WOI phase with the early-secretory or proliferative phases. The focus on the WOI is well-founded due to its critical role in preparing the endometrium for embryo implantation. Still, the endometrium, a dynamic tissue, begins preparing for WOI and embryo implantation immediately after menstruation. Hence, it is plausible to suggest that the attainment or lack of endometrial receptivity during the mid-secretory phase is influenced by molecular processes set in motion either in the early- or mid-proliferative phases, as also studied in the present study. Given the limited and fragmented data in the literature regarding transcriptomic profiles across the entire endometrial cycle, including the mid-proliferative and late-proliferative (peri-ovulatory) phases, we employed high-throughput sequencing to track these alterations comprehensively across cycle as the whole.
In the LP phase of the endometrial cycle, significant changes occur characterized by increased cellular proliferation and differentiation, influenced by rising estradiol levels and maturing ovarian follicles before ovulation. These processes are influenced by rapidly increased estradiol levels from the fully matured pre-ovulatory follicle. A delicate balance exists in the endometrial tissue between proliferation, increasing the thickness of the endometrium, and tissue differentiation, initiated immediately after ovulation by the progesterone produced by the corpus luteum [28].
Our findings reveal that upregulated DEGs in the LP phase are enriched in RNA polymerase II-specific transcription factor activity and associated with the nucleosome cellular component. Specifically, numbers of DEGs encoding histone proteins, part of the extensive histone gene cluster HIST1 on human chromosome 6, show elevated expression levels. Histones regulate gene expression and chromatin structure during the endometrial cycle. Studies indicate that histone acetylation, a key epigenetic modification, increases during the early proliferative (EP) phase, declines until ovulation, and then rises post-ovulation [29,30]. Here, we note fluctuations in the transcriptional profile of the HIST cluster throughout the cycle. We identified a notable increase in transcripts linked to this cluster during the LP phase, contrasting with significant suppression observed during the WOI. Still, the function of regulating the histone gene cluster along the menstrual cycle is unknown and must be studied.
Moreover, during the LP phase, of the 47 DE small nucleolar RNAs (snoRNAs), 42 were increased (for example, SNORD14B, SNORA63C, SNORA48). These snoRNAs, part of the C/D box snoRNA family, primarily modify rRNA, are involved in tRNA and mRNA modification, and influence alternative splicing [31]. Future research should also focus on elucidating the functional roles of these RNAs in achieving endometrial receptivity.
An in-depth analysis of the MS phase revealed expected changes in gene expression profiles. Through meticulously examining the most significant DEGs and reviewing relevant literature, we identified many genes previously reported by other researchers during the WOI [11,12,32]. A considerable portion of the DEGs from the MS phase displayed expression patterns like that previously established for the WOI [15]. However, some DEGs specific to the MS phase we found were not documented in the existing literature. This can be due to various reasons, such as the control group used in the current study – the MP samples, against which the comparative expression analysis was performed, and the tools and settings used in bioinformatics analysis. We observed 12 mitochondrial DEGs downregulated during the MS phase, which may help modify the endometrial tissue’s energy production before embryo implantation. These changes may support the recently discovered mechanisms of vertical transmission of maternal mitochondrial DNA through extracellular vesicles from the endometrium to the embryo [33]. Moreover, a meaningful observation derived from the Hallmarks enrichment analysis was the upregulation of hypoxia-related genes during the MS and LS phases of the menstrual cycle, likely indicating the preparation for the upcoming tissue shedding and menstruation.
Our study unveils, for the first time, the genes exhibiting different abundancies between all five studied menstrual cycle phases. These genes are visualized through the heatmap, illustrating their log2FC across all cycle phases (Figure 2). Most notably, many of these genes demonstrate elevated expression during the LP phase, followed by a steady increase in expression in the ES phase, culminating in peak levels during the WOI. Among these genes, STEAP4, SCGB1D2, and PLA2G4F exhibit notable characteristics, with their expression markedly elevated in the LP phase, followed by a further increase during the WOI. STEAP4 (Transmembrane Epithelial Antigen of the Prostate 4) is a metalloreductase implicated in metabolism and cancer progression. Dysregulation of STEAP4 has been linked to impaired ER in recurrent implantation failure [34] and implantation failure in cases of thin endometrial tissue [35]. SCGB1D2 belongs to the lipophilin subfamily and is prominently expressed in organs with strong endocrine responsiveness, like the mammary glands [36]. Earlier gene expression profiling studies identified SCGB1D2 in the endometrium, where it was noted as downregulated in the WOI and upregulated in the ES phase of the natural cycle [37]. However, our study revealed a different expression profile, likely influenced by the choice of the control groups. PLA2G4F is a member of the phospholipase A2 group IV family. A recent iTRAQ-based proteomics study identified PLA2G4F as a differentially expressed protein (DEPs) in mid-secretory endometrium. It is categorized as one of the top 5 hub proteins that regulate endometrial receptivity [38]. Ceruloplasmin (CP) is the sole gene with down-regulated expression in the LP phase and upregulated expression in the MS phase. CP is the primary copper-containing iron transport protein, exhibiting ferroxidase activity [39], and is noted among the upregulated genes in the MS phase [7].
The observed differential expression of Hallmark genes and the GO analysis reveal a modulation in immune responses across the phases of the endometrium. Specifically, genes associated with immune processes, such as TNFa, INFa, inflammatory responses, leukocyte, lymphocyte, and T cell activation, are downregulated during the LP phase. Conversely, in the MS phase, genes like IL-6, TNFA, and STAT3 are upregulated.
An intriguing finding from the Hallmarks enrichment analysis involves the interconnection of the NFKB, TNF, and STAT3 pathways. Notably, NFKB, activated by TNFA, interacts with STAT3, activated by IFNA, to enhance NFKB target gene expression [40]. These pathways, associated with interferon signaling, demonstrate downregulation of TNFA in the LP phase and upregulation of STAT3 and TNFα in the MS and LS phases, affirming their interconnection and potential involvement in endometrial tissue cycling. The observed downregulation of IFNs and related genes during the LP phase aligns with prior observations, indicating a transient increase in certain IFNs (e.g., IFNA) within the WOI in human endometrium [41]. Interferons exert significant regulatory effects on cell growth, viability, and immune responses [42], with crucial roles documented in the implantation process within normal endometrium [43].
This dynamic modulation of the immune response throughout the menstrual phases will likely contribute to significant alterations in the immune microenvironment within the endometrium. These observed changes are consistent with patterns identified by previous researchers [44,45,46,47,48]. This modulation may serve as a mechanism to prevent the recognition and rejection of sperm and fetal cells by maternal endometrial immune cells [44]. Such modulation is crucial for successful implantation and pregnancy maintenance [49].

5. Conclusions

In the current study, we provided the complete transcriptome description of endometrium across the entire menstrual cycle and, for the first time, comprehensively covered the proliferative phase by involving both the mid- and late-proliferative (peri-ovulatory) samples. Thus, our study unveiled exhaustively the transitions between the consecutive proliferative and secretory cycle phases, indicating their unique gene expression profiles and possible distinct biological functions. These molecular signatures complement existing knowledge and provide new insights into the genomic determinants of the cycling endometrium. As an example of the coordinated gene activity, the expression profile of histone-encoding genes within the HIST cluster on chromosome 6 showed an increase in cluster activity during the late-proliferative and a decline during the mid-secretory phase. In the current study, we revealed the intricate nature of the gene expression regulation in the proliferative phase. The late-proliferative (peri-ovulatory) endometrium plays a crucial role in facilitating the passage of sperm cells for oocyte fertilization. Furthermore, the progesterone-driven transition commences to establish receptivity in the mid-secretory phase. Therefore, future studies should investigate the extent to which the biology of the late-proliferative phase endometrium influences the attainment of mid-secretory endometrial receptivity or contributes to molecular aberrations resulting in embryo implantation failure.

Supplementary Materials

The following supporting information can be downloaded at the website of this paper posted on Preprints.org. Table S1: List if the differentially expressed gene across the menstrual cycle’phases.

Author Contributions

Conceptualization, G.Y., A.A., and A.S.; sample collection, A.K, M.N (Maria Nikolova), N.M and A.M methodology, A.A., V.B., G.Y. and M.N. (Maria Nikolova); formal analysis, G.Y., A.A. and V.B.; visualization, G.Y., and V.B.; investigation M.N. (Mladen Naydenov), A.A., M.S, E.A. and G.Y.; resources, G.Y. and A.S.; writing - original draft preparation G.Y., A.A., M.N. (Mladen Naydenov) and V.B.; writing - reviewing and editing, G.Y., A.A., M.N. (Mladen Naydenov), and A.S.; funding acquisition, G.Y. and A.S. All authors have read and agreed to the published version of the manuscript.

Funding

This research was funded by the National Science Fund of Bulgaria (КП-06 Н31/2), the Estonian Research Council (PRG1076) and Horizon Europe (NESTOR, grant no. 101120075) of the European Commission.

Institutional Review Board Statement

The study was conducted according to the guidelines of the Declaration of Helsinki, as approved by the Research Ethics Committee of Faculty of Biology, Plovdiv University “Paisij Hilendarski”, Plovdiv, Bulgaria (protocol code №3/02.09.2019) and the Research Ethics Committee of the University of Tartu, Estonia (protocol code No. 330M-8).

Informed Consent Statement

Informed consent was obtained from all subjects involved in the study.

Data Availability Statement

The datasets presented in this article are not readily available because the data are part of an ongoing study.

Acknowledgments

The authors acknowledge all participants enrolled in the study.

Conflicts of Interest

The authors declare no conflicts of interest.

References

  1. Noyes, R.W.; Hertig, A.T.; Rock, J. Dating the Endometrial Biopsy. Am J Obstet Gynecol 1975, 122. [Google Scholar] [CrossRef] [PubMed]
  2. YOSHINAGA, K. Uterine Receptivity for Blastocyst Implantation. Ann N Y Acad Sci 1988, 541. [Google Scholar] [CrossRef] [PubMed]
  3. Ben Rafael, Z. Endometrial Receptivity Analysis (ERA) Test: An Unproven Technology. Hum Reprod Open 2021, 2021. [Google Scholar] [CrossRef] [PubMed]
  4. Suhorutshenko, M.; Kukushkina, V.; Velthut-Meikas, A.; Altmäe, S.; Peters, M.; Mägi, R.; Krjutškov, K.; Koel, M.; Codoñer, F.M.; Martinez-Blanch, J.F.; et al. Endometrial Receptivity Revisited: Endometrial Transcriptome Adjusted for Tissue Cellular Heterogeneity. Human Reproduction 2018, 33. [Google Scholar] [CrossRef] [PubMed]
  5. Walker, E.R.; McGrane, M.; Aplin, J.D.; Brison, D.R.; Ruane, P.T. A Systematic Review of Transcriptomic Studies of the Human Endometrium Reveals Inconsistently Reported Differentially Expressed Genes. Reproduction and Fertility 2023, 4. [Google Scholar] [CrossRef] [PubMed]
  6. Kao, L.C.; Tulac, S.; Lobo, S.; Imani, B.; Yang, J.P.; Germeyer, A.; Osteen, K.; Taylor, R.N.; Lessey, B.A.; Giudice, L.C. Global Gene Profiling in Human Endometrium during the Window of Implantation. Endocrinology 2002, 143. [Google Scholar] [CrossRef]
  7. Talbi, S.; Hamilton, A.E.; Vo, K.C.; Tulac, S.; Overgaard, M.T.; Dosiou, C.; Le Shay, N.; Nezhat, C.N.; Kempson, R.; Lessey, B.A.; et al. Molecular Phenotyping of Human Endometrium Distinguishes Menstrual Cycle Phases and Underlying Biological Processes in Normo-Ovulatory Women. Endocrinology 2006, 147. [Google Scholar] [CrossRef] [PubMed]
  8. Otsuka, A.Y.; Andrade, P.M.; Villanova, F.E.; Borra, R.C.; Silva, I.D.C.G. Human Endometrium MRNA Profile Assessed by Oligonucleotide Three-Dimensional Microarray. Gynecological Endocrinology 2007, 23. [Google Scholar] [CrossRef] [PubMed]
  9. Haouzi, D.; Mahmoud, K.; Fourar, M.; Bendhaou, K.; Dechaud, H.; De Vos, J.; Rème, T.; Dewailly, D.; Hamamah, S. Identification of New Biomarkers of Human Endometrial Receptivity in the Natural Cycle. Human Reproduction 2009, 24. [Google Scholar] [CrossRef] [PubMed]
  10. Mirkin, S.; Arslan, M.; Churikov, D.; Corica, A.; Diaz, J.I.; Williams, S.; Bocca, S.; Oehninger, S. In Search of Candidate Genes Critically Expressed in the Human Endometrium during the Window of Implantation. Human Reproduction 2005, 20. [Google Scholar] [CrossRef]
  11. Hu, S.; Yao, G.; Wang, Y.; Xu, H.; Ji, X.; He, Y.; Zhu, Q.; Chen, Z.; Sun, Y. Transcriptomic Changes during the Pre-Receptive to Receptive Transition in Human Endometrium Detected by RNA-Seq. Journal of Clinical Endocrinology and Metabolism 2014, 99. [Google Scholar] [CrossRef] [PubMed]
  12. Sigurgeirsson, B.; Åmark, H.; Jemt, A.; Ujvari, D.; Westgren, M.; Lundeberg, J.; Gidlöf, S. Comprehensive RNA Sequencing of Healthy Human Endometrium at Two Time Points of the Menstrual Cycle. Biol Reprod 2017, 96. [Google Scholar] [CrossRef]
  13. Wang, W.; Vilella, F.; Alama, P.; Moreno, I.; Mignardi, M.; Isakova, A.; Pan, W.; Simon, C.; Quake, S.R. Single-Cell Transcriptomic Atlas of the Human Endometrium during the Menstrual Cycle. Nat Med 2020, 26. [Google Scholar] [CrossRef] [PubMed]
  14. Garcia-Alonso, L.; Handfield, L.F.; Roberts, K.; Nikolakopoulou, K.; Fernando, R.C.; Gardner, L.; Woodhams, B.; Arutyunyan, A.; Polanski, K.; Hoo, R.; et al. Mapping the Temporal and Spatial Dynamics of the Human Endometrium in Vivo and in Vitro. Nat Genet 2021, 53. [Google Scholar] [CrossRef] [PubMed]
  15. Altmäe, S.; Koel, M.; Võsa, U.; Adler, P.; Suhorutšenko, M.; Laisk-Podar, T.; Kukushkina, V.; Saare, M.; Velthut-Meikas, A.; Krjutškov, K.; et al. Meta-Signature of Human Endometrial Receptivity: A Meta-Analysis and Validation Study of Transcriptomic Biomarkers. Sci Rep 2017, 7. [Google Scholar] [CrossRef] [PubMed]
  16. Petracco, R.G.; Kong, A.; Grechukhina, O.; Krikun, G.; Taylor, H.S. Global Gene Expression Profiling of Proliferative Phase Endometrium Reveals Distinct Functional Subdivisions. Reproductive Sciences 2012, 19. [Google Scholar] [CrossRef] [PubMed]
  17. Zhou, L.; Li, R.; Wang, R.; Huang, H. xiong; Zhong, K. Local Injury to the Endometrium in Controlled Ovarian Hyperstimulation Cycles Improves Implantation Rates. Fertil Steril 2008, 89. [Google Scholar] [CrossRef] [PubMed]
  18. Koot, Y.E.M.; Van Hooff, S.R.; Boomsma, C.M.; Van Leenen, D.; Koerkamp, M.J.A.G.; Goddijn, M.; Eijkemans, M.J.C.; Fauser, B.C.J.M.; Holstege, F.C.P.; Macklon, N.S. An Endometrial Gene Expression Signature Accurately Predicts Recurrent Implantation Failure after IVF. Sci Rep 2016, 6. [Google Scholar] [CrossRef] [PubMed]
  19. Afgan, E.; Baker, D.; Batut, B.; Van Den Beek, M.; Bouvier, D.; Ech, M.; Chilton, J.; Clements, D.; Coraor, N.; Grüning, B.A.; et al. The Galaxy Platform for Accessible, Reproducible and Collaborative Biomedical Analyses: 2018 Update. Nucleic Acids Res 2018, 46, W537–W544. [Google Scholar] [CrossRef] [PubMed]
  20. Kim, D.; Langmead, B.; Salzberg, S.L. Hisat2. Nat Methods 2015, 12. [Google Scholar]
  21. Liao, Y.; Smyth, G.K.; Shi, W. FeatureCounts: An Efficient General Purpose Program for Assigning Sequence Reads to Genomic Features. Bioinformatics 2014, 30. [Google Scholar] [CrossRef] [PubMed]
  22. Cheng, X.; Yan, J.; Liu, Y.; Wang, J.; Taubert, S. EVITTA: A Web-Based Visualization and Inference Toolbox for Transcriptome Analysis. Nucleic Acids Res 2021, 49. [Google Scholar] [CrossRef] [PubMed]
  23. Liberzon, A.; Birger, C.; Thorvaldsdóttir, H.; Ghandi, M.; Mesirov, J.P.; Tamayo, P. The Molecular Signatures Database Hallmark Gene Set Collection. Cell Syst 2015, 1. [Google Scholar] [CrossRef] [PubMed]
  24. Ge, S.X.; Son, E.W.; Yao, R. IDEP: An Integrated Web Application for Differential Expression and Pathway Analysis of RNA-Seq Data. BMC Bioinformatics 2018, 19. [Google Scholar] [CrossRef] [PubMed]
  25. Raudvere, U.; Kolberg, L.; Kuzmin, I.; Arak, T.; Adler, P.; Peterson, H.; Vilo, J. G:Profiler: A Web Server for Functional Enrichment Analysis and Conversions of Gene Lists (2019 Update). Nucleic Acids Res 2019, 47. [Google Scholar] [CrossRef] [PubMed]
  26. Díaz-Gimeno, P.; Horcajadas, J.A.; Martínez-Conejero, J.A.; Esteban, F.J.; Alamá, P.; Pellicer, A.; Simón, C. A Genomic Diagnostic Tool for Human Endometrial Receptivity Based on the Transcriptomic Signature. Fertil Steril 2011, 95. [Google Scholar] [CrossRef] [PubMed]
  27. Marzluff, W.F.; Gongidi, P.; Woods, K.R.; Jin, J.; Maltais, L.J. The Human and Mouse Replication-Dependent Histone Genes. Genomics 2002, 80. [Google Scholar] [CrossRef]
  28. Critchley, H.O.D.; Maybin, J.A.; Armstrong, G.M.; Williams, A.R.W. Physiology of the Endometrium and Regulation of Menstruation. Physiol Rev 2020, 100. [Google Scholar] [CrossRef] [PubMed]
  29. Munro, S.K.; Farquhar, C.M.; Mitchell, M.D.; Ponnampalam, A.P. Epigenetic Regulation of Endometrium during the Menstrual Cycle. Mol Hum Reprod 2010, 16. [Google Scholar] [CrossRef]
  30. Gujral, P.; Mahajan, V.; Lissaman, A.C.; Ponnampalam, A.P. Histone Acetylation and the Role of Histone Deacetylases in Normal Cyclic Endometrium. Reproductive Biology and Endocrinology 2020, 18. [Google Scholar] [CrossRef] [PubMed]
  31. Huang, Z. hao; Du, Y. ping; Wen, J. tao; Lu, B. feng; Zhao, Y. SnoRNAs: Functions and Mechanisms in Biological Processes, and Roles in Tumor Pathophysiology. Cell Death Discov 2022, 8. [Google Scholar] [CrossRef] [PubMed]
  32. Tseng, L.H.; Chen, I.; Chen, M.Y.; Yan, H.; Wang, C.N.; Lee, C.L. Genome-Based Expression Profiling as a Single Standardized Microarray Platform for the Diagnosis of Endometrial Disorder: An Array of 126-Gene Model. Fertil Steril 2010, 94. [Google Scholar] [CrossRef] [PubMed]
  33. Bolumar, D.; Moncayo-Arlandi, J.; Gonzalez-Fernandez, J.; Ochando, A.; Moreno, I.; Marin, C.; Diez, A.; Fabra, P.; Checa, M.Á.; Espinos, J.J.; et al. Vertical Transmission of Maternal Mitochondrial DNA through Extracellular Vesicles Modulates Embryo Bioenergetics. Elife 2023, 12. [Google Scholar] [CrossRef] [PubMed]
  34. Zhai, J.; Li, S.; Hu, J.; Gao, M.; Sun, Y.; Chen, Z.J.; Giudice, L.C.; Du, Y. In Silico, in Vitro, and in Vivo Analysis Identifies Endometrial Circadian Clock Genes in Recurrent Implantation Failure. Journal of Clinical Endocrinology and Metabolism 2021, 106. [Google Scholar] [CrossRef] [PubMed]
  35. Maekawa, R.; Taketani, T.; Mihara, Y.; Sato, S.; Okada, M.; Tamura, I.; Jozaki, K.; Kajimura, T.; Asada, H.; Tamura, H.; et al. Thin Endometrium Transcriptome Analysis Reveals a Potential Mechanism of Implantation Failure. Reprod Med Biol 2017, 16. [Google Scholar] [CrossRef] [PubMed]
  36. Culleton, J.; O’Brien, N.; Ryan, B.M.; Hill, A.D.K.; McDermott, E.; O’Higgins, N.; Duffy, M.J. Lipophilin B: A Gene Preferentially Expressed in Breast Tissue and Upregulated in Breast Cancer. Int J Cancer 2007, 120. [Google Scholar] [CrossRef] [PubMed]
  37. Riesewijk, A.; Martín, J.; van Os, R.; Horcajadas, J.A.; Polman, J.; Pellicer, A.; Mosselman, S.; Simón, C. Gene Expression Profiling of Human Endometrial Receptivity on Days LH+2 versus LH+7 by Microarray Technology. Mol Hum Reprod 2003, 9. [Google Scholar] [CrossRef] [PubMed]
  38. Hu, S.; Sun, Z.; Li, B.; Zhao, H.; Wang, Y.; Yao, G.; Li, X.; Bian, X.; Li, T.C.; Vankelecom, H.; et al. ITRAQ-Based Proteomic Analysis Unveils ACSL4 as a Novel Potential Regulator of Human Endometrial Receptivity. Endocrinology (United States) 2023, 164. [Google Scholar] [CrossRef] [PubMed]
  39. Gaware, V.; Kotade, K.; Dhamak, K.; Somawanshi, S. CERULOPLASMIN ITS ROLE AND SIGNIFICANCE: A REVIEW. Int J Biomed Res 2011, 1. [Google Scholar] [CrossRef]
  40. Grivennikov, S.I.; Karin, M. Dangerous Liaisons: STAT3 and NF-ΚB Collaboration and Crosstalk in Cancer. Cytokine Growth Factor Rev 2010, 21. [Google Scholar] [CrossRef] [PubMed]
  41. Li, Q.; Zhang, M.; Kumar, S.; Zhu, L.J.; Chen, D.; Bagchi, M.K.; Bagchi, I.C. Identification and Implantation Stage-Specific Expression of an Interferon-α-Regulated Gene in Human and Rat Endometrium. Endocrinology 2001, 142. [Google Scholar] [CrossRef] [PubMed]
  42. Pestka, S.; Krause, C.D.; Walter, M.R. Interferons, Interferon-like Cytokines, and Their Receptors. Immunol Rev 2004, 202. [Google Scholar] [CrossRef] [PubMed]
  43. Park, Y.; Han, S.J. Interferon Signaling in the Endometrium and in Endometriosis. Biomolecules 2022, 12. [Google Scholar] [CrossRef]
  44. Wira, C.R.; Rodriguez-Garcia, M.; Patel, M. V. The Role of Sex Hormones in Immune Protection of the Female Reproductive Tract. Nat Rev Immunol 2015, 15. [Google Scholar] [CrossRef]
  45. d’Hauterive, S.P.; Charlet-Renard, C.; Berndt, S.; Dubois, M.; Munaut, C.; Goffin, F.; Hagelstein, M.T.; Noël, A.; Hazout, A.; Foidart, J.M.; et al. Human Chorionic Gonadotropin and Growth Factors at the Embryonic-Endometrial Interface Control Leukemia Inhibitory Factor (LIF) and Interleukin 6 (IL-6) Secretion by Human Endometrial Epithelium. Human Reproduction 2004, 19. [Google Scholar] [CrossRef]
  46. Tabibzadeh, S.; Satyaswaroop, P.G.; Von Wolff, M.; Strowitzki, T. Regulation of TNF-α MRNA Expression in Endometrial Cells by TNF-α and by Oestrogen Withdrawal. Mol Hum Reprod 1999, 5. [Google Scholar] [CrossRef] [PubMed]
  47. Shen, Z.; Rodriguez-Garcia, M.; Patel, M. V.; Wira, C.R. Direct and Indirect Endocrine-Mediated Suppression of Human Endometrial CD8+T Cell Cytotoxicity. Sci Rep 2021, 11. [Google Scholar] [CrossRef]
  48. Kitazawa, J.; Kimura, F.; Nakamura, A.; Morimune, A.; Takahashi, A.; Takashima, A.; Amano, T.; Tsuji, S.; Kaku, S.; Kasahara, K.; et al. Endometrial Immunity for Embryo Implantation and Pregnancy Establishment. Tohoku Journal of Experimental Medicine 2020, 250. [Google Scholar] [CrossRef]
  49. Lobo, S.C.; Huang, S.T.J.; Germeyer, A.; Dosiou, C.; Vo, K.C.; Tulac, S.; Nayak, N.R.; Giudice, L.C. The Immune Environment in Human Endometrium during the Window of Implantation. American Journal of Reproductive Immunology 2004, 52. [Google Scholar] [CrossRef] [PubMed]
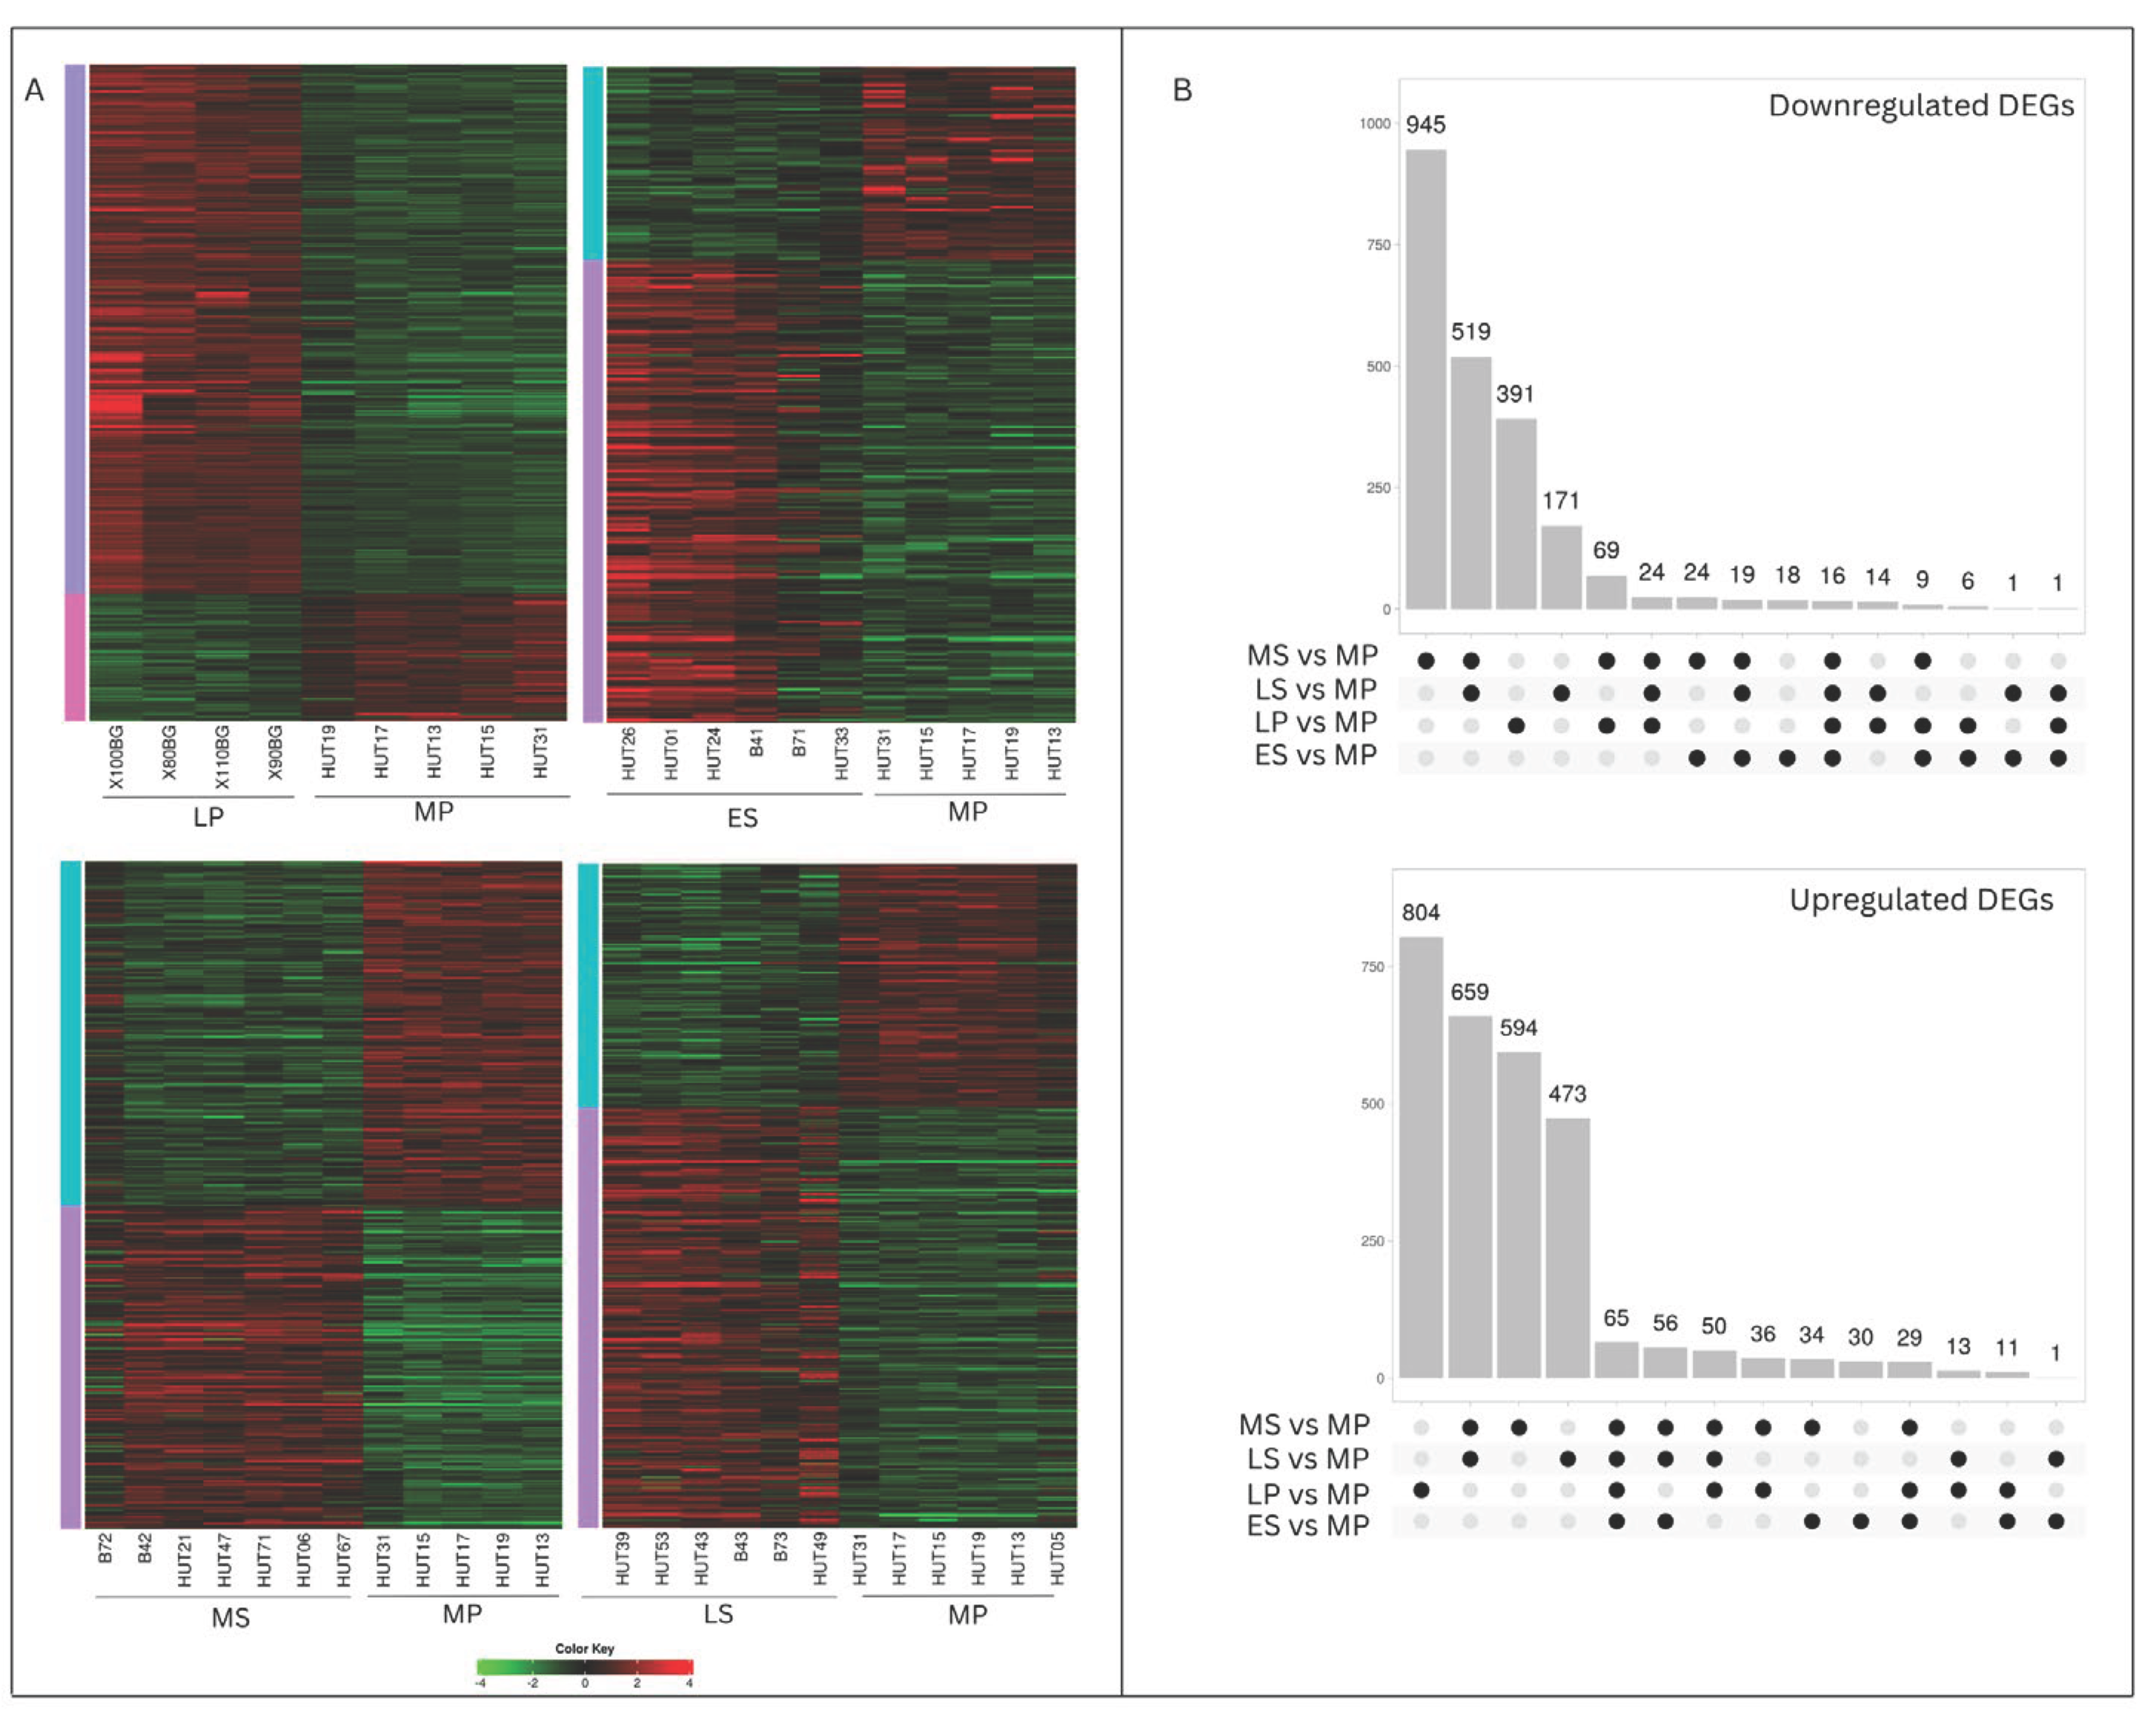
Figure 1. Time-dependent alterations in gene expression within the healthy endometrium across the menstrual cycle. A) Heatmap of log2FC values of differentially expressed genes (DEGs) in the late-proliferative (LP), early-secretory (ES), mid-secretory (MS), and late-secretory (LS) phases compared to the mid-proliferative (PM) phase; B) UpSet plot of DEGs across endometrial cycle phases. Intersection of sets of genes at endometrial cycle phases. Each column corresponds to a time point (one dot) or set of time points containing the same DEGs.
Preprints 103390 g001
Figure 2. Heatmap of log2FC values of top differentially expressed genes (DEGs) shared between the phases of the endometrial cycle. The late-proliferative (LP), early-secretory (ES), mid-secretory (MS) and late-secretory (LS) phases are compared to the mid-proliferative (PM) phase; log2FC≥ 2| in at least one time point across the dataset of four time points; padj<0.05.
Preprints 103390 g002
Figure 3. Chromosomal distribution of the differentially expressed genes (DEGs) in the healthy endometrium across the menstrual cycle. A) Late-Proliferative (LP) vs Mid-Proliferative phase (MP); B) Early-Secretory (MS) vs MP phase, C) Mid-Secretory (MS) vs MP phase; D) Late-Secretory (LS) vs MP phase; the HIST cluster is indicated in a green box; E); Visualization of the chromosomal enriched regions in the LP and MS phases.
Preprints 103390 g003
Figure 4. Gene Ontology (GO) classification of the differentially expressed genes (DEGs) across endometrial cycle phases. GO annotations show significant enrichment of three main categories (biological process (BP), cellular component (CC), and molecular function (MF)) with the adjusted p-value <0.05. The y-axis indicates the number of genes in each category. A) LP phase, upregulated DEGs (1-DNA-binding transcription factor activity, RNA polymerase Il-specific, 2-structural constituent of chromatin, 3-sequence-specific double-stranded DNA binding, 4-nucleosome); B) LP phase, down-regulated DEGs (1-protein binding, 2-immune system process, 3-leukocyte activation, 4-lymphocyte activation, 5-T cell activation, 6-cell periphery, 7-plasma membrane); C) ES phase, upregulated DEGs (1-transmembrane transporter activity, 2-organic acid metabolic process, 3-cell periphery, 4-nervous system process); D) ES phase, down-regulated DEGs (1-cell adhesion, 2-cell periphery); E. MS phase, upregulated DEGs (1-transmembrane transporter activity, 2-lipid metabolic process, 3-regulation of hormone levels, 4-extracellular space, 5-cell periphery); F) MS phase, down-regulated DEGs (1-cell adhesion, 2-cell periphery, 3- extracellular matrix, 4-nuclear division, 5-structural constituent of chromatin); G) LS phase, upregulated DEGs (1-response to organic substance, 2-regulation of multicellular organismal process, 3-extracellular space, 4-vesicle, 5-extracellular vesicle); H) LS phase, down-regulated DEGs (1-system development, 2-plasma membrane region).
Preprints 103390 g004
Figure 5. Hallmark gene enrichment of Differentially Expressed Genes (DEGs) in the late-Proliferative (LP), early-secretory (ES), mid-Secretory (MS) and late-secretory (LS) phases, compared to the mid-proliferative phase (MP).
Preprints 103390 g005
Table 1. Top Differentially expressed genes (DEGs) in the Late-Proliferative (LP) and Mid-Secretory (MS) phases, compared to the Mid-Proliferative phase (MP).
Gene name log2 FC P adj Study
MS vs MP
ATP12A 10,67 8,93E-11 [12]
GLYATL3* 9,02 1,39E-08 [11,12]
SULT1E1 8,93 8,52E-14 [12]
PLA2G2A 8,52 7,36E-06 [6,11,12]
CYP26A1 8,42 2,01E-32 [11,12]
GAST 8,27 6,37E-05 [11,12,26]
LRRC26 8,15 1,46E-10 [11]
MT1H 8,13 9,43E-27 [11,12,26]
PLA2G4F 8,06 5,05E-30 [11,12]
MT1HL1 7,88 4,04E-10 -
IGFN1 -7,35 1,27E-28 [11,12]
CDH4* -6,23 1,14E-07 [11]
CSMD3 -6,2 1,84E-14 [12]
DPP10 -6,07 1,74E-13 [12]
LINC03010* -6,02 1,00E-04 -
GAPDHP71 -5,95 1,02E-06 -
ASIC2 -5,9 2,25E-09 [11,12]
ECEL1P2* -5,85 8,07E-21 -
BPIFB1* -5,83 1,87E-05 -
SERPINB3* -5,83 2,66E-04 -
LP vs MP
RNA5-8SN3* 7,61 2,38E-05 -
SNORD14B* 6,19 1,93E-12 -
FRG1 6,08 3,24E-04 -
NLGN4Y 6,06 2,10E-02 -
SNORA63C* 5,80 5,43E-05 -
PLA2G4F 5,80 9,48E-04 -
GLRXP2 5,74 6,36E-04 -
TRPC6P8* 5,48 1,10E-03 -
BRDTP1* 5,43 2,02E-04 -
HMGCS2 5,36 7,80E-04 -
PPBP* -5,89 5,64E-03 -
LRRC15* -5,02 3,99E-05 -
TRGJP2* -4,98 1,05E-02 -
TCL1A -4,73 3,28E-02 -
CCL22 -4,55 6,42E-07 -
FOSB* -4,46 1,67E-04 -
KRTAP10-12 -4,33 3,92E-02 -
CEACAM5 -4,27 6,35E-03 -
CD70* -4,24 4,01E-02 -
FOS* -4,11 4,45E-07 -
* Phase-specific DEGs.
Disclaimer/Publisher’s Note: The statements, opinions and data contained in all publications are solely those of the individual author(s) and contributor(s) and not of MDPI and/or the editor(s). MDPI and/or the editor(s) disclaim responsibility for any injury to people or property resulting from any ideas, methods, instructions or products referred to in the content.
Copyright: This open access article is published under a Creative Commons CC BY 4.0 license, which permit the free download, distribution, and reuse, provided that the author and preprint are cited in any reuse.
Prerpints.org logo

Preprints.org is a free preprint server supported by MDPI in Basel, Switzerland.

Subscribe

© 2024 MDPI (Basel, Switzerland) unless otherwise stated