Preprint
Article

A Numerical Study on the Penetrability and Directivity of the Difference-Frequency Component Beam in Bubbly Liquids Obtained via Parametric Acoustic Array

Altmetrics

Downloads

120

Views

39

Comments

0

Submitted:

08 April 2024

Posted:

09 April 2024

You are already at the latest version

Alerts
Abstract
The penetrability and directivity of ultrasound in different media is of interest in engineering and medical applications (imaging, nondestructive testing, sonochemistry, among others). The nonlinearity of a liquid can be used in the parametric antenna framework to generate low-frequency components with particular features from several ultrasonic signals at the source. Bubbly liquids are dispersive liquids in which a small amount of tiny gas bubbles leads to the increase of the nonlinear parameter of the media over certain frequency ranges. Parametric antenna applied to this huge nonlinear media gives rise to low-frequency components with relatively small intensity at the source. The evolution of a low-frequency component (difference-frequency component obtained from two primary signals) during its propagation in a bubbly liquid is somehow unknown. It is thus interesting to analyse its characteristics to establish whether this component can benefit from the quality of its own frequency and from the primary frequencies in terms of directivity and penetrability into the medium. It must be noted that no such study in bubbly liquids exists in the litterature, but only for homogeneous media. To this end, several numerical models developed previously are used here to analyse the difference-frequency component obtained from a parametric antenna emitting from two ultrasonic signals at the source in one and two-dimensional domains. These models allow us to observe the behavior of this frequency component. An angle that measures the directivity of a beam is also defined. Our results show a point hardly found in the literature: the high directivity and the huge penetrability of the secondary beam associated to the difference-frequency component into the bubbly liquid, compared to the same frequency signal excited directly from the source in the bubbly liquid and to the parametric acoustic array in homogeneous fluids.
Keywords: 
Subject: Physical Sciences  -   Acoustics

1. Introduction

The application of the nonlinear acoustics theory, its effects and benefits, in medicine and engineering have been the subject of numerous research papers throughout the last century [1,2,3,4,5]. Nonlinear acoustic signals are characterised by the generation of new frequency components during their propagation, like harmonics and subharmonics [4,5]. Each one of them has its particular characterisics, such as amplitude, attenuation, or sound speed, all depending on the kind of medium in which the wave propagates. These features are even more complicated to track when the medium is dispersive. Nonlinear acoustics still require studies to better understand its physical basis and applicability to help solve real-world problems [1,3]. The following examples illustrate the usefulness of this branch of acoustics to a wide range of applications. In the context of underwater acoustics, Prieur et al [6] describe the benefits obtained from using the second harmonic component when applied to imaging in sonar technology, through the enhancement in the detection of some targets. In medicine, the introduction of contrast agents (gas microbubbles) into the bloodstream enhances the quality of diagnosis images through ultrasonography, for which the high nonlinearity of the liquid caused by the bubbles can also be taken into account through the generation of new frequency components [7,8]. In sonochemistry the application of a macrosonic field induces the nonlinear generation of inertial bubbles (cavitation) that cause the enhancement of chemical reaction and liberation of radicals in the fluid [1,2]. High-Intensity Focussed Ultrasound is a noninvasive technique designed to remove solid tumors from the body through the nonlinear effects due to the large amplitudes of the acoustic field, which originate absorption of acoustic energy and generation of cavitating bubbles localized on the focus area, and cause a local rise of temperature [9].
One of the most promising effect of nonlinear acoustics is the nonlinear frequency mixing. This effect can produce low (even in the audible range) and high ultrasonic signals from two (or more) primary waves [10]. It has been thoroughly studied by means of theoretical and experimental works in liquids and gas (water and air) for around 50 years, but poorly aborded in the literature when it comes to bubbly liquids, gas bubbles in a liquid (air bubbles in water) [11,12]. This is the main point of the work presented here.
The existing literature about the behavior of the difference-frequency component (DFC) created from a parametric ultrasonic source in terms of penetrability and directivity is mainly dedicated to homogeneous fluids. Gan et al [11] present a review on parametric acoustic array (known as PAA [10]) in an outstanding work published in 2012. The main advantage drawn by the PAA is the sharp and narrow directivity due to the small size of sidelobes of the resulting field, which is a consequence of nonlinearity and attenuation that affect the different frequency components of the wave differently. Applications of the PAA cited therein include active noise control [13], private sound field [14], detection of concealed objects [15], acoustic performance of materials [16], underwater acoustics (parametric sonar) [17]. Since 2012, unlike their interest in many applications, within the frameworks of audio technology in particular [18], few works have been published. As an example, the use of the PAA combined to a sonic crystal is described in 2013 in Ref. [19] to produce an unidirectional propagating beam. In 2020 Zhou et al. present another review paper on the PAA [12]. They clearly mention the urgent need of improving the conversion efficiency of the PAA, which tipically is nearly 1 %. They present an updated overview of the topic, with a particular section on broadband parametric arrays, for which the nonlinear self-demodulation effect applies to the broadband primary signals. A special interest is drawn on some applications, like sub-bottom profiler and buried targets [20,21], underwater communications and long-range ocean research [22,23]. In 2022, the PAA is used to improve the results obtained in elastographic imaging [24].
The characteristics that make the PAA such a useful technique in many real and potential applications are the very high directivity and huge penetration of the difference-frequency signal beam produced within the beam at the primary frequencies [11]. In an homogeneous fluid, because of the highest attenuation of the higher frequency signals, the DFC tends to travel more distance, creating this way the so-called primary beam, than the other components of the wave (primary frequencies, sum frequency), which decay much faster. Along the primary beam, which is where the DFC is created, a series (or column) of virtual sources are created, leading to the developement of a narrow secondary beam. In Ref. [10] the locations at which the DFC intensity drops by one-half, i.e., has lost 3dB, in the confined beam measures the directivity and penetrability of the secondary beam at DFC. The penetrating beam of the DFC can be narrowed by increasing the DFC or decreasing the primary frequencies. Moreover, it does not directly depend on the aperture of the primary-frequencies source.
It must be noted that no such studies have been carried out for bubbly liquids. The published papers about parametric antenna in bubbly liquids refer to the generation and propagation of both the sum and difference generated signals, but no one describes with the sufficient degree of precision their directive properties [25,26].
This work aims to get rid of this current lack. After describing the mathematical model used and solved here in Section 2, the presentation of illustrative results from numerical simulations in one dimension (1D) and two dimensions (2D) in Section 3 shows that the addition of gas bubbles into the liquid allows the ultrasonic beam to be more penetrating and directive, allowing the very thin beam to reach large distances. Section 4 gives the concluding remarks of this work.

2. Materials and Methods

This section presents the mathematical model used to reach the goal described in Section 1. Since in Section 3 models in 1D and 2D will be used to track in time the evolution of the variables of the problem, when the ultrasonic waves propagate through the medium and mutually interact with the bubbles nonlinearly, we describe here the two models in Section 2.1 and Section 2.2, respectively.
We consider a liquid in which a population of tiny spherical gas bubbles are added. We assume an homogeneous distribution of bubbles of the same size. This mixture is excited by a continuous acoustic pressure source driven by one or two frequencies.
The nonlinear mutual interaction of gas bubbles and acoustic field in the liquid (open domain) is modeled by the coupled differential system [2,4,5,25] formed by the wave equation written in terms of acoustic pressure p, Eqs. (3,8) and a Rayleigh-Plesset equation written in terms of bubble volume variation v, Eqs. (4,9), respectively in 1D and 2D domains.
These models assume that the bubbles in the liquid are monodisperse, oscillate at their first radial mode, and are the only source of attenuation, nonlinearity, and dispersion. Their collapse is not modeled. The surface tension is neglected. The initial bubble radius, R 0 g , must be small compared to the wavelength of the acoustic field. Buoyancy, Bjerknes, viscous drag, and added-mass forces are not considered in this work. [5,27].
In the following, c 0 l and ρ 0 l are the sound speed and the density at the equilibrium state of the liquid, wheras N g is the bubble density in the liquid. δ = 4 ν l / ω 0 g R 0 g 2 is the viscous damping coefficient of the bubbly fluid, in which ν l is the cinematic viscosity of the liquid, ω 0 g = 2 π f 0 g = 3 γ g p 0 g / ρ 0 l R 0 g 2 is the bubble resonance frequency, in which γ g is the specific heats ratio of the gas, p 0 g = ρ 0 g c 0 g 2 / γ g is its atmospheric pressure, ρ 0 g and c 0 g are its density and sound speed at the equilibrium state. The other parameters are η = 4 π R 0 g / ρ 0 l , a = ( γ g + 1 ) ω 0 g 2 / 2 v 0 g , and b = 1 / 6 v 0 g , where v 0 g = 4 π R 0 g 3 / 3 is the initial bubble volume.
We consider a continuous acoustics pressure source of amplitude p s . When a single-frequency source at the frequency f is used, the following expression of this source is
s ( t ) = p s sin ( 2 π f t ) , t [ 0 , T l ] ,
where t is the time, and T l is the last instant of the study. When a dual-frequency source at the frequencies f 1 and f 2 is used, the source is
s ( t ) = p s ( sin ( 2 π f 1 t ) + sin ( 2 π f 2 t ) ) , t [ 0 , T l ] .

2.1. One-Dimensional Model

In this section we consider the problem described above in a one-dimensional domain of length L. The following partial differential equations system is considered [2,4,5,26], in which the acoustic pressure is p ( x , t ) and the bubble volume variation is v ( x , t ) = V ( x , t ) v 0 g , where x is the one-dimensional space coordinate and V ( x , t ) is the instantaneous bubble volume located at position x. Subscripts t and x stand for partial derivatives with respect to t and x:
p x x p t t / c 0 l 2 = ρ 0 l N g v t t , ( x , t ) ( 0 , L ) × ( 0 , T l ) ,
v t t + δ ω 0 g v t + ω 0 g 2 v + η p = a v 2 + b 2 v v t t + v t 2 , ( x , t ) [ 0 , L ] × ( 0 , T l ) .
We assume that the dependent variables, p and v, are at rest at the onset of the study by imposing the following initial conditions:
p ( x , 0 ) = 0 , v ( x , 0 ) = 0 , p t ( x , 0 ) = 0 , v t ( x , 0 ) = 0 , x [ 0 , L ] .
The time-dependent pressure source is placed at x = 0 :
p ( 0 , t ) = s ( t ) , t [ 0 , T l ] ,
and we consider an open-field boundary condition at the other end of the cavity, x = L :
p x ( L , t ) = p t ( L , t ) / c 0 l , t [ 0 , T l ] .

2.2. Two-Dimensional Model

In this section we consider our problem in a two-dimensional domain of dimensions L x × L y . The following partial differential equations system is considered [2,4,5,28], in which the acoustic pressure is p ( x , y , t ) and the bubble volume variation is v ( x , y , t ) = V ( x , y , t ) v 0 g , where ( x , y ) are the two-dimensional space coordinates and V ( x , y , t ) is the instantaneous bubble volume located at position ( x , y ) . Subscripts t, x, and y stand for partial derivatives with respect to t, x, and y:
p x x + p y y p t t / c 0 l 2 = ρ 0 l N g v t t , ( x , y , t ) ( 0 , L x ) × ( 0 , L y ) × ( 0 , T l ) ,
v t t + δ ω 0 g v t + ω 0 g 2 v + η p = a v 2 + b 2 v v t t + v t 2 , ( x , y , t ) [ 0 , L x ] × [ 0 , L y ] × ( 0 , T l ) .
We assume that the dependent variables, p and v, are at rest at the onset of the study by imposing the following initial conditions:
p ( x , y , 0 ) = 0 , v ( x , y , 0 ) = 0 , p t ( x , y , 0 ) = 0 , v t ( x , y , 0 ) = 0 , ( x , y ) [ 0 , L x ] × [ 0 , L y ] .
We impose the following source conditions at y = 0 :
p ( x , 0 , t ) = s ( t ) , ( x , t ) [ 0 , L s ] × ( 0 , T l ) , p ( x , 0 , t ) = α ( x ) s ( t ) , ( x , t ) ( L s , L d ] × ( 0 , T l ) , p y ( x , 0 , t ) = p t / c 0 l ( x , 0 , t ) , ( x , t ) ( L d , L x ) × ( 0 , T l )
where L s is the length of the source and L d is the length where the source decreases continuously with the variable x as the function α ( x ) = ( ( L s + L d x ) / L d ) 8 .
We impose a symmetry condition at x = 0 to enhance the usefulness of the algorithm:
p y ( 0 , y , t ) = 0 , ( y , t ) ( 0 , L y ) × ( 0 , T l ) .
Finally, we consider an open-field boundary condition at the other ends of the cavity, x = L x and y = L y :
p x ( L x , y , t ) = p t ( L x , y , t ) / c 0 l , ( y , t ) ( 0 , L y ) × ( 0 , T l ) ,
p y ( x , L y , t ) = p t ( x , t ) / c 0 l , ( x , t ) ( 0 , L x ) × ( 0 , T l ) .
It must be noted here that, since the nonlinearity of the model is only due to the bubble, we cannot carry out similar nonlinear simulations for the PAA in the sole liquid, with N g = 0 . By the way, these simulations, in case the respective nonlinear terms were included into the wave equation, like in the Westerveld equation for example [5], would require much higher acoustic pressure amplitudes than the ones used here in Section 3.
These mathematical models, Eqs (3)-(7) in 1D and Eqs (8)-(14) in 2D, are solved to track the variables in time by the appropriate numerical models developed in [26,28], based on the finite-volume method in the space dimensions and on the finite-difference method in the time domain.

3. Results

The objective of this section is to study the penetrability of the DFC beam into a bubbly liquid, into a 1D open domain (Section 3.1) and into a 2D open domain (Section 3.2).
To this purpose, we study the behavior of an ultrasonic signal at one frequency by comparing two cases, when this signal is generated nonlinearly through the mixing of two primary frequencies, i.e. the PAA, and when this signal is directly generated from the single-frequency source, i.e., the DM (standing for Direct Method). We focus our analysis on testing the penetrability and directivity of the DFC in bubbly liquids. To simplify the numerous notations, the DFC is denoted by f d , with index d in the equations of this paper. We thus follow the following procedure, in both configurations, 1D and 2D. First, we generate the difference frequency f d = 200 k H z from the primary signals at f 1 = 700 k H z and f 2 = 900 k H z (Eq. 2) with enough amplitude to produce the PAA. We then apply a Fast Fourier Transform (FFT) to obtain the acoustic spectrum, drawing our attention on f 1 , f 2 , and f d . Once the DFC is obtained, we carry out a polynomial fitting of its amplitude on the axis of the beam from the highest point of the curve and beyond as a function of the distance from the source. Then, we use the amplitude obtained from this fitting at the position of the source to carry out a DM simulation with a single-frequency source (Eq. 1) at f = f d = 200 k H z . We finally compare both results, the signal generated by the PAA and by the DM.
The data used in the model are:
  • Liquid (water): c 0 l = 1500 m / s , ρ 0 l = 1000 k g / m 3 , and ν l = 1.43 × 10 6 m 2 / s ;
  • Gas (air): c 0 g = 340 m / s , ρ 0 g = 1.29 k g / m 3 , and γ g = 1.4 ;
  • Bubbles: R 0 g = 1.2023 μ m , f 0 g = 2.8 M H z , and N g = 4.4957 × 10 12 / m 3 .
In the following, T l = 42 T d , where the period at f d is T d = 1 / f d , with f d = 200 k H z . The FFT is applied to the last period of the simulation, which is repeated 100 times, in the vicinity of the source up to 5 λ d × 20 λ d in the 1D case and 5 λ d × 10 λ d in the 2D case, in which the wavelength at f d is λ d = c d / f d , where c d is the sound speed at f d . The dimensions of the domain are large enough to ensure that the waves do not reach the boundaries of the domain L = L x = L y = 150 λ d . In the simulations the discretization we use is defined by 100 space finite volumes per λ d and 400 time points per T d .

3.1. Study in a One-Dimensional Bubbly Liquid

In this section we study the evolution of the secondary beam at DFC in the 1D configuration by applying the procedure described above.
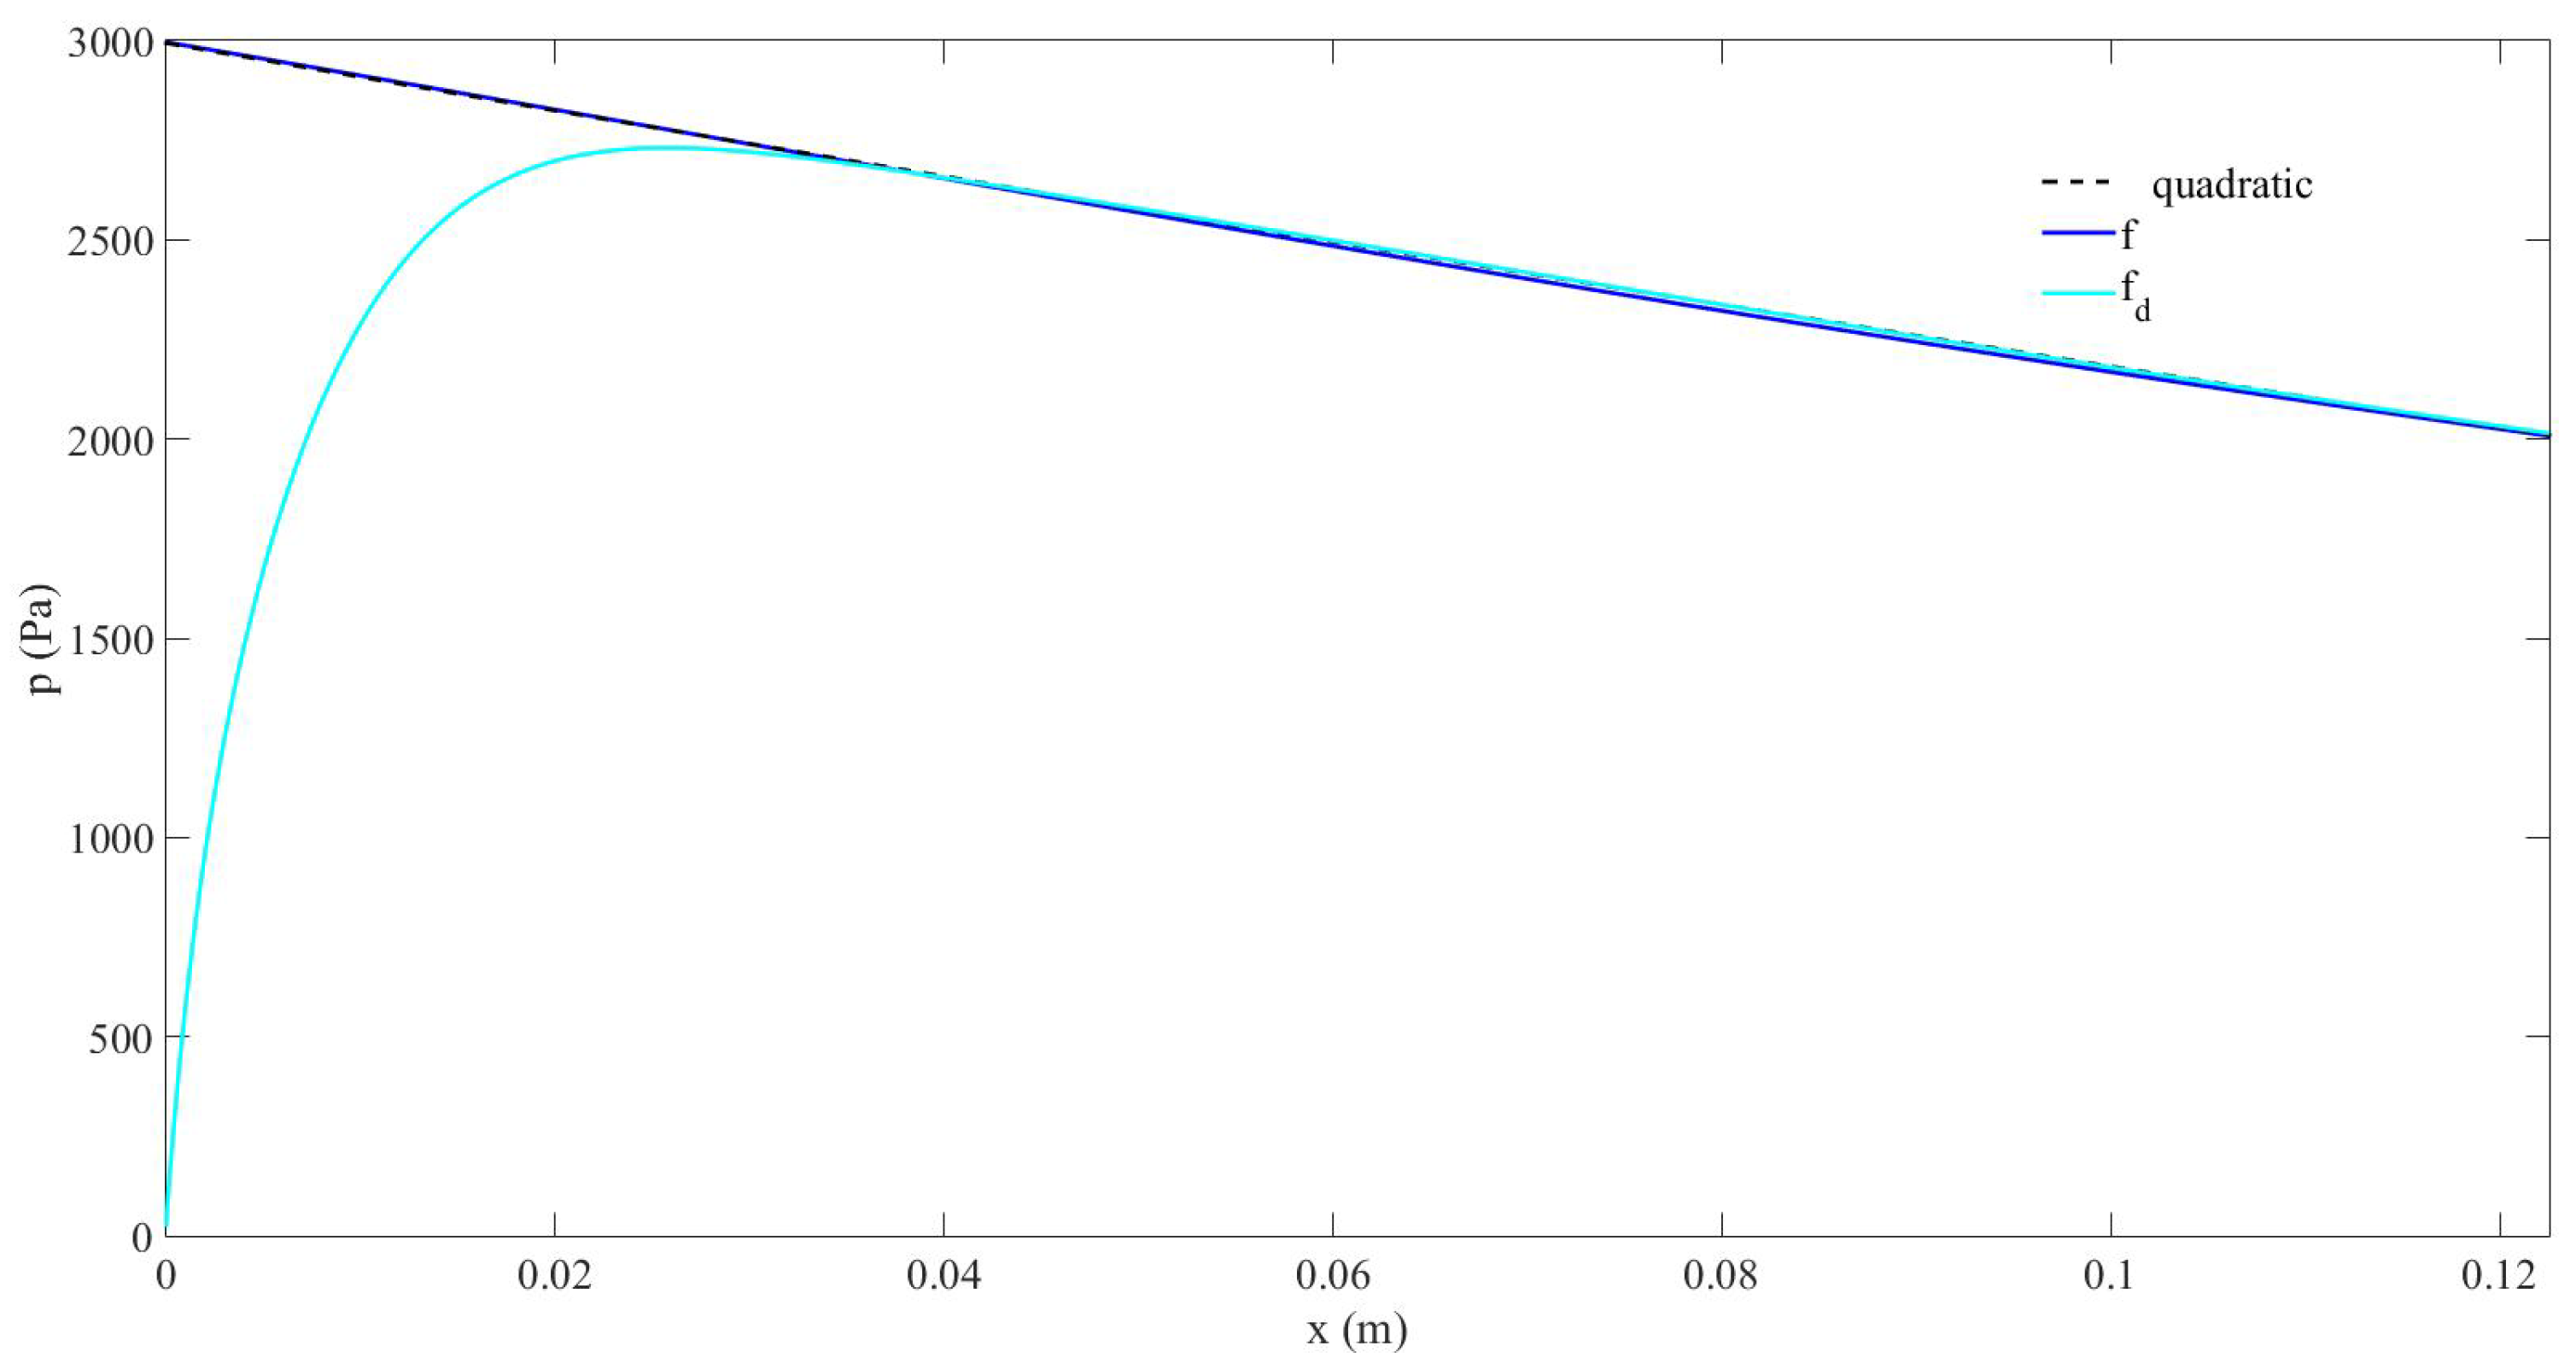
Figure 1 shows the results obtained from the PAA in terms of acoustic pressure amplitude of the components D F C = f d , f 1 , and f 2 in the 1D domain. Figure 2 displays the comparison of the PAA and the DM in the 1D domain.
It can be seen in Figure 1 that the amplitudes of both the primary components, f 1 and f 2 , drop rapidly when propagating from the source, and they reach values close to zero at a distance around 0.1 m from the source. However, the amplitude of the DFC generated from the nonlinear mixing of f 1 and f 2 increases with propagation to reach its maximal value ( 2730.81 P a ) at around 0.026 m and decreases slowly (low negative slope) beyond this point through the space domain. It reaches around ( 2032.31 P a ) at 0.12 m . This means that the conversion of the acoustical energy from the primary waves to the DFC is high ( 11.96 % at 0.12 m ), which is much higher here than the typical conversion efficiency of the PAA of nearly around 1 % mentioned in the Introduction (Section 1, [12]). The penetrability of the secondary beam at DFC is high. Figure 2 demonstrates that the decreasing behavior of the 200 k H z component generated by the PAA is similar vs. x to the one generated by the DM. They both follow p = p 1 × x 2 + p 2 × x + p 3 , where p 1 = 4309.7 , p 2 = 8555.5 , and p 3 = 2995 ( P a ), with a smooth decrease due to the low attenuation at this frequency in the bubbly liquid.

3.2. Study in a Two-Dimensional Bubbly Liquid

In this section we study the evolution of the secondary beam at DFC in the 2D configuration by applying the procedure described above.
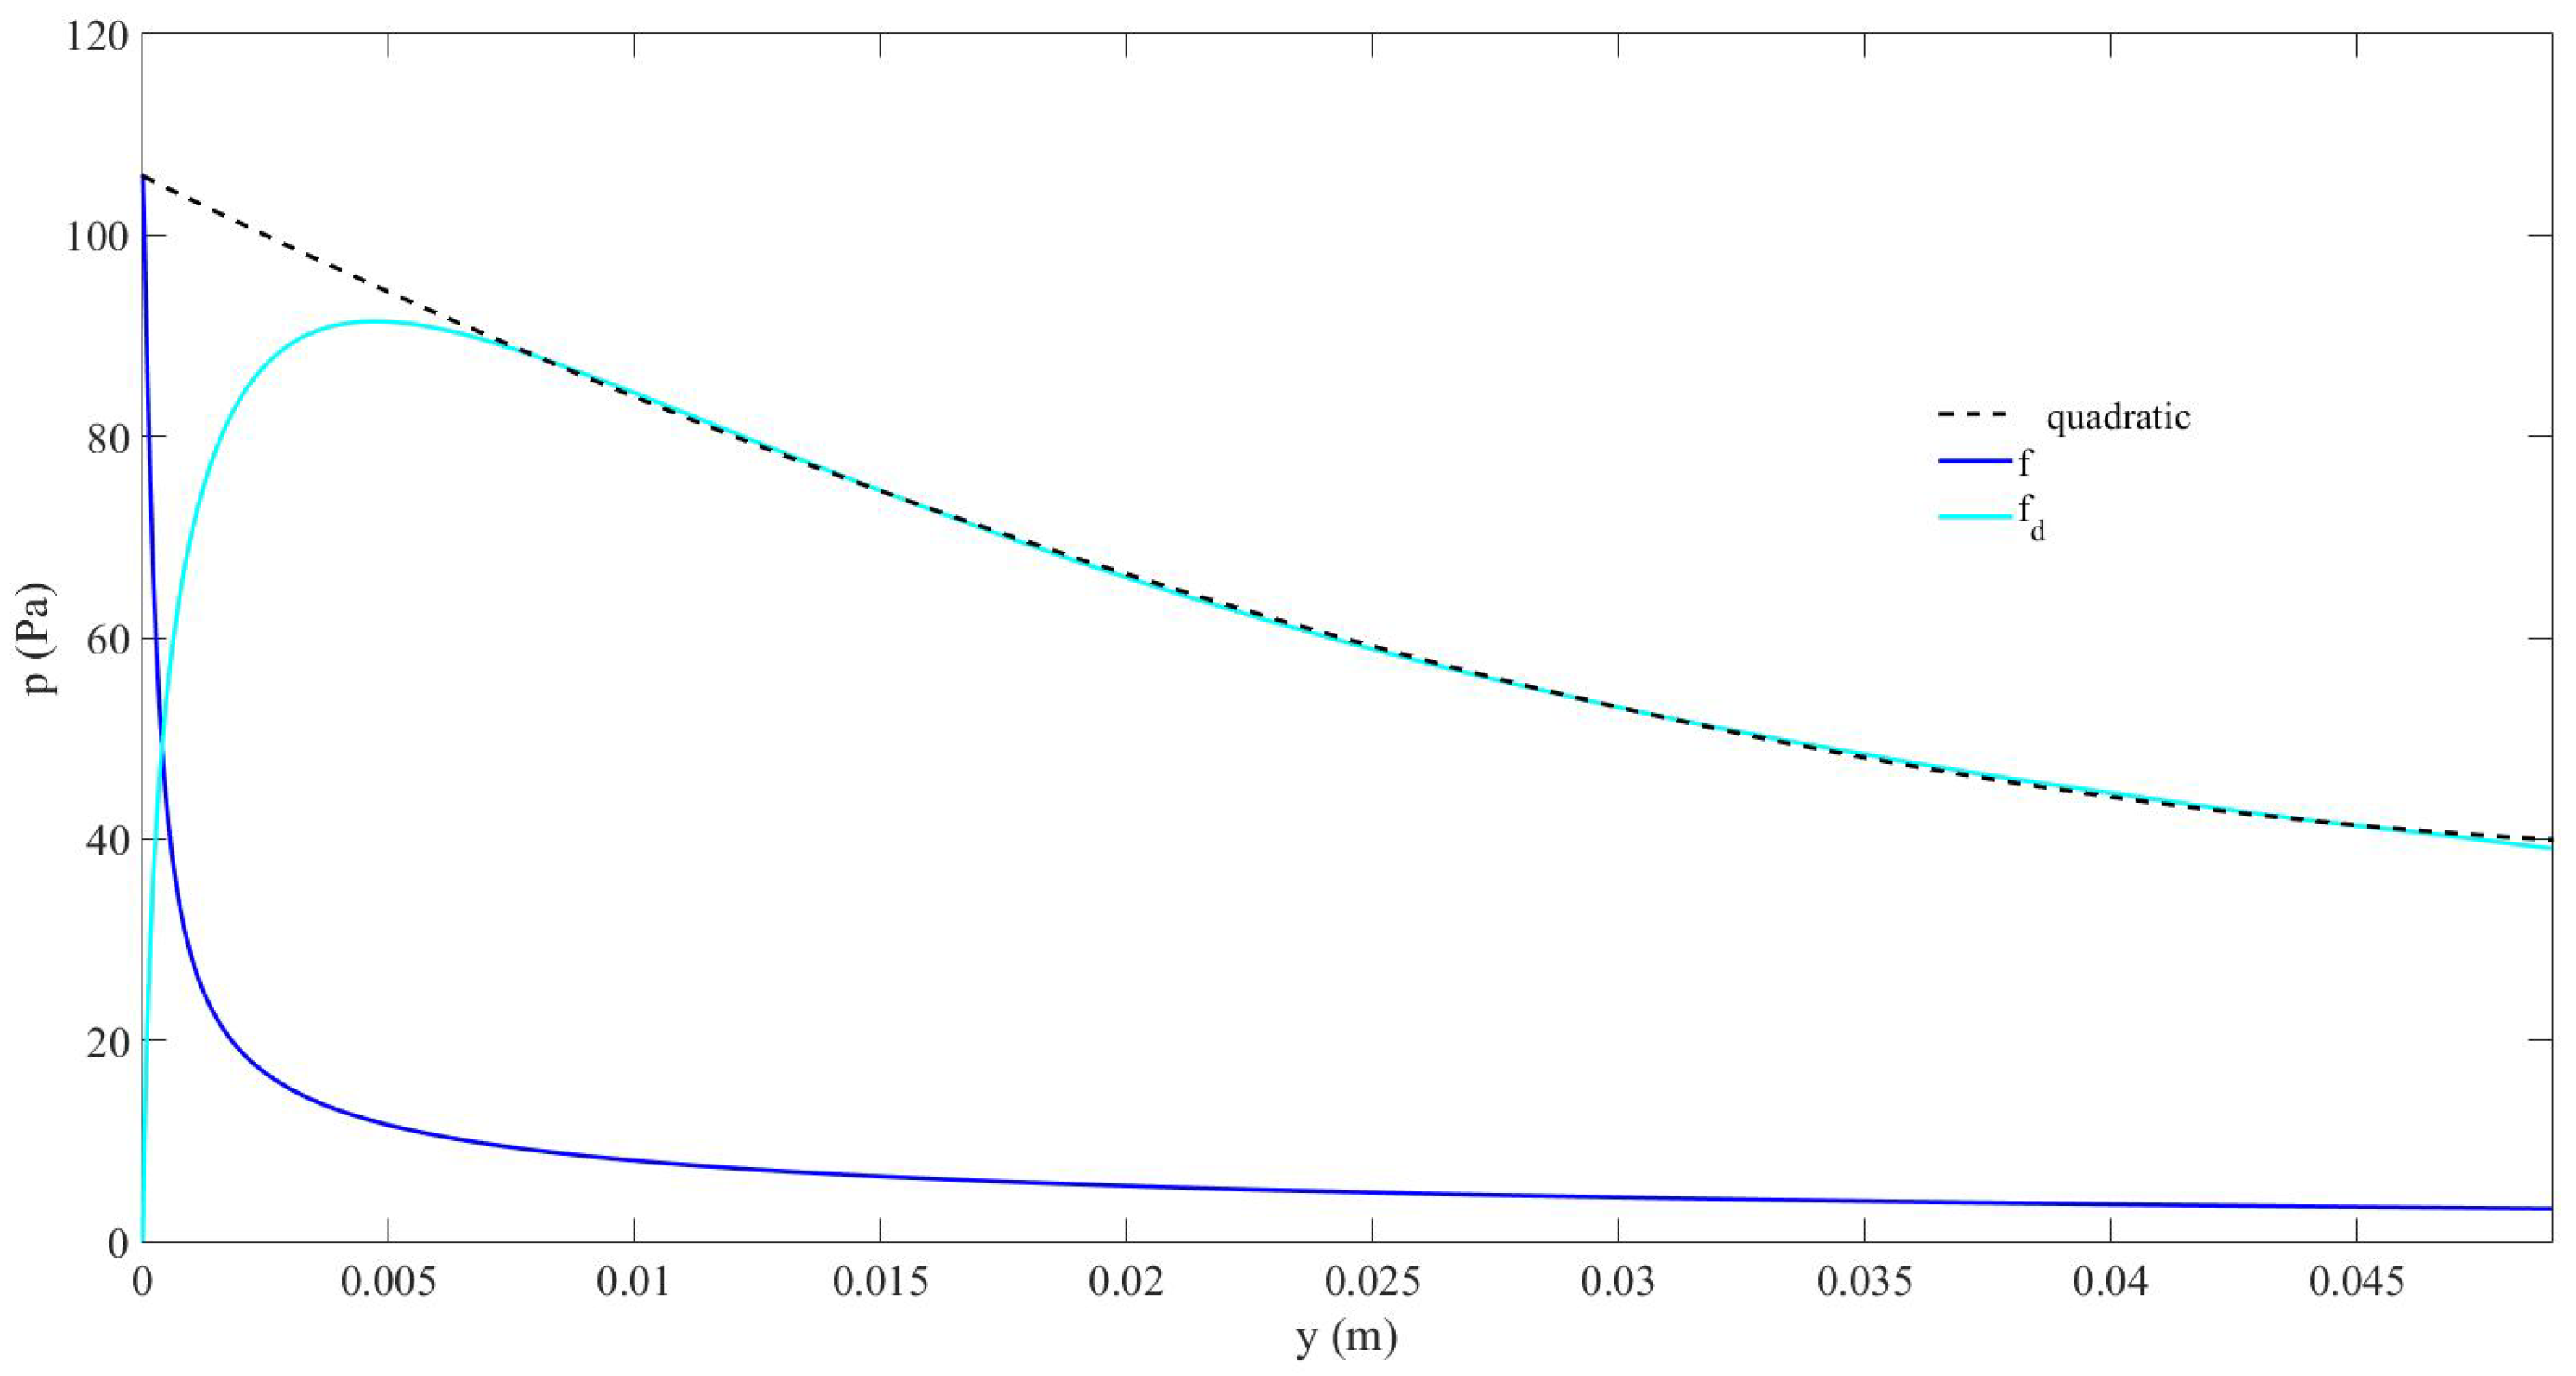
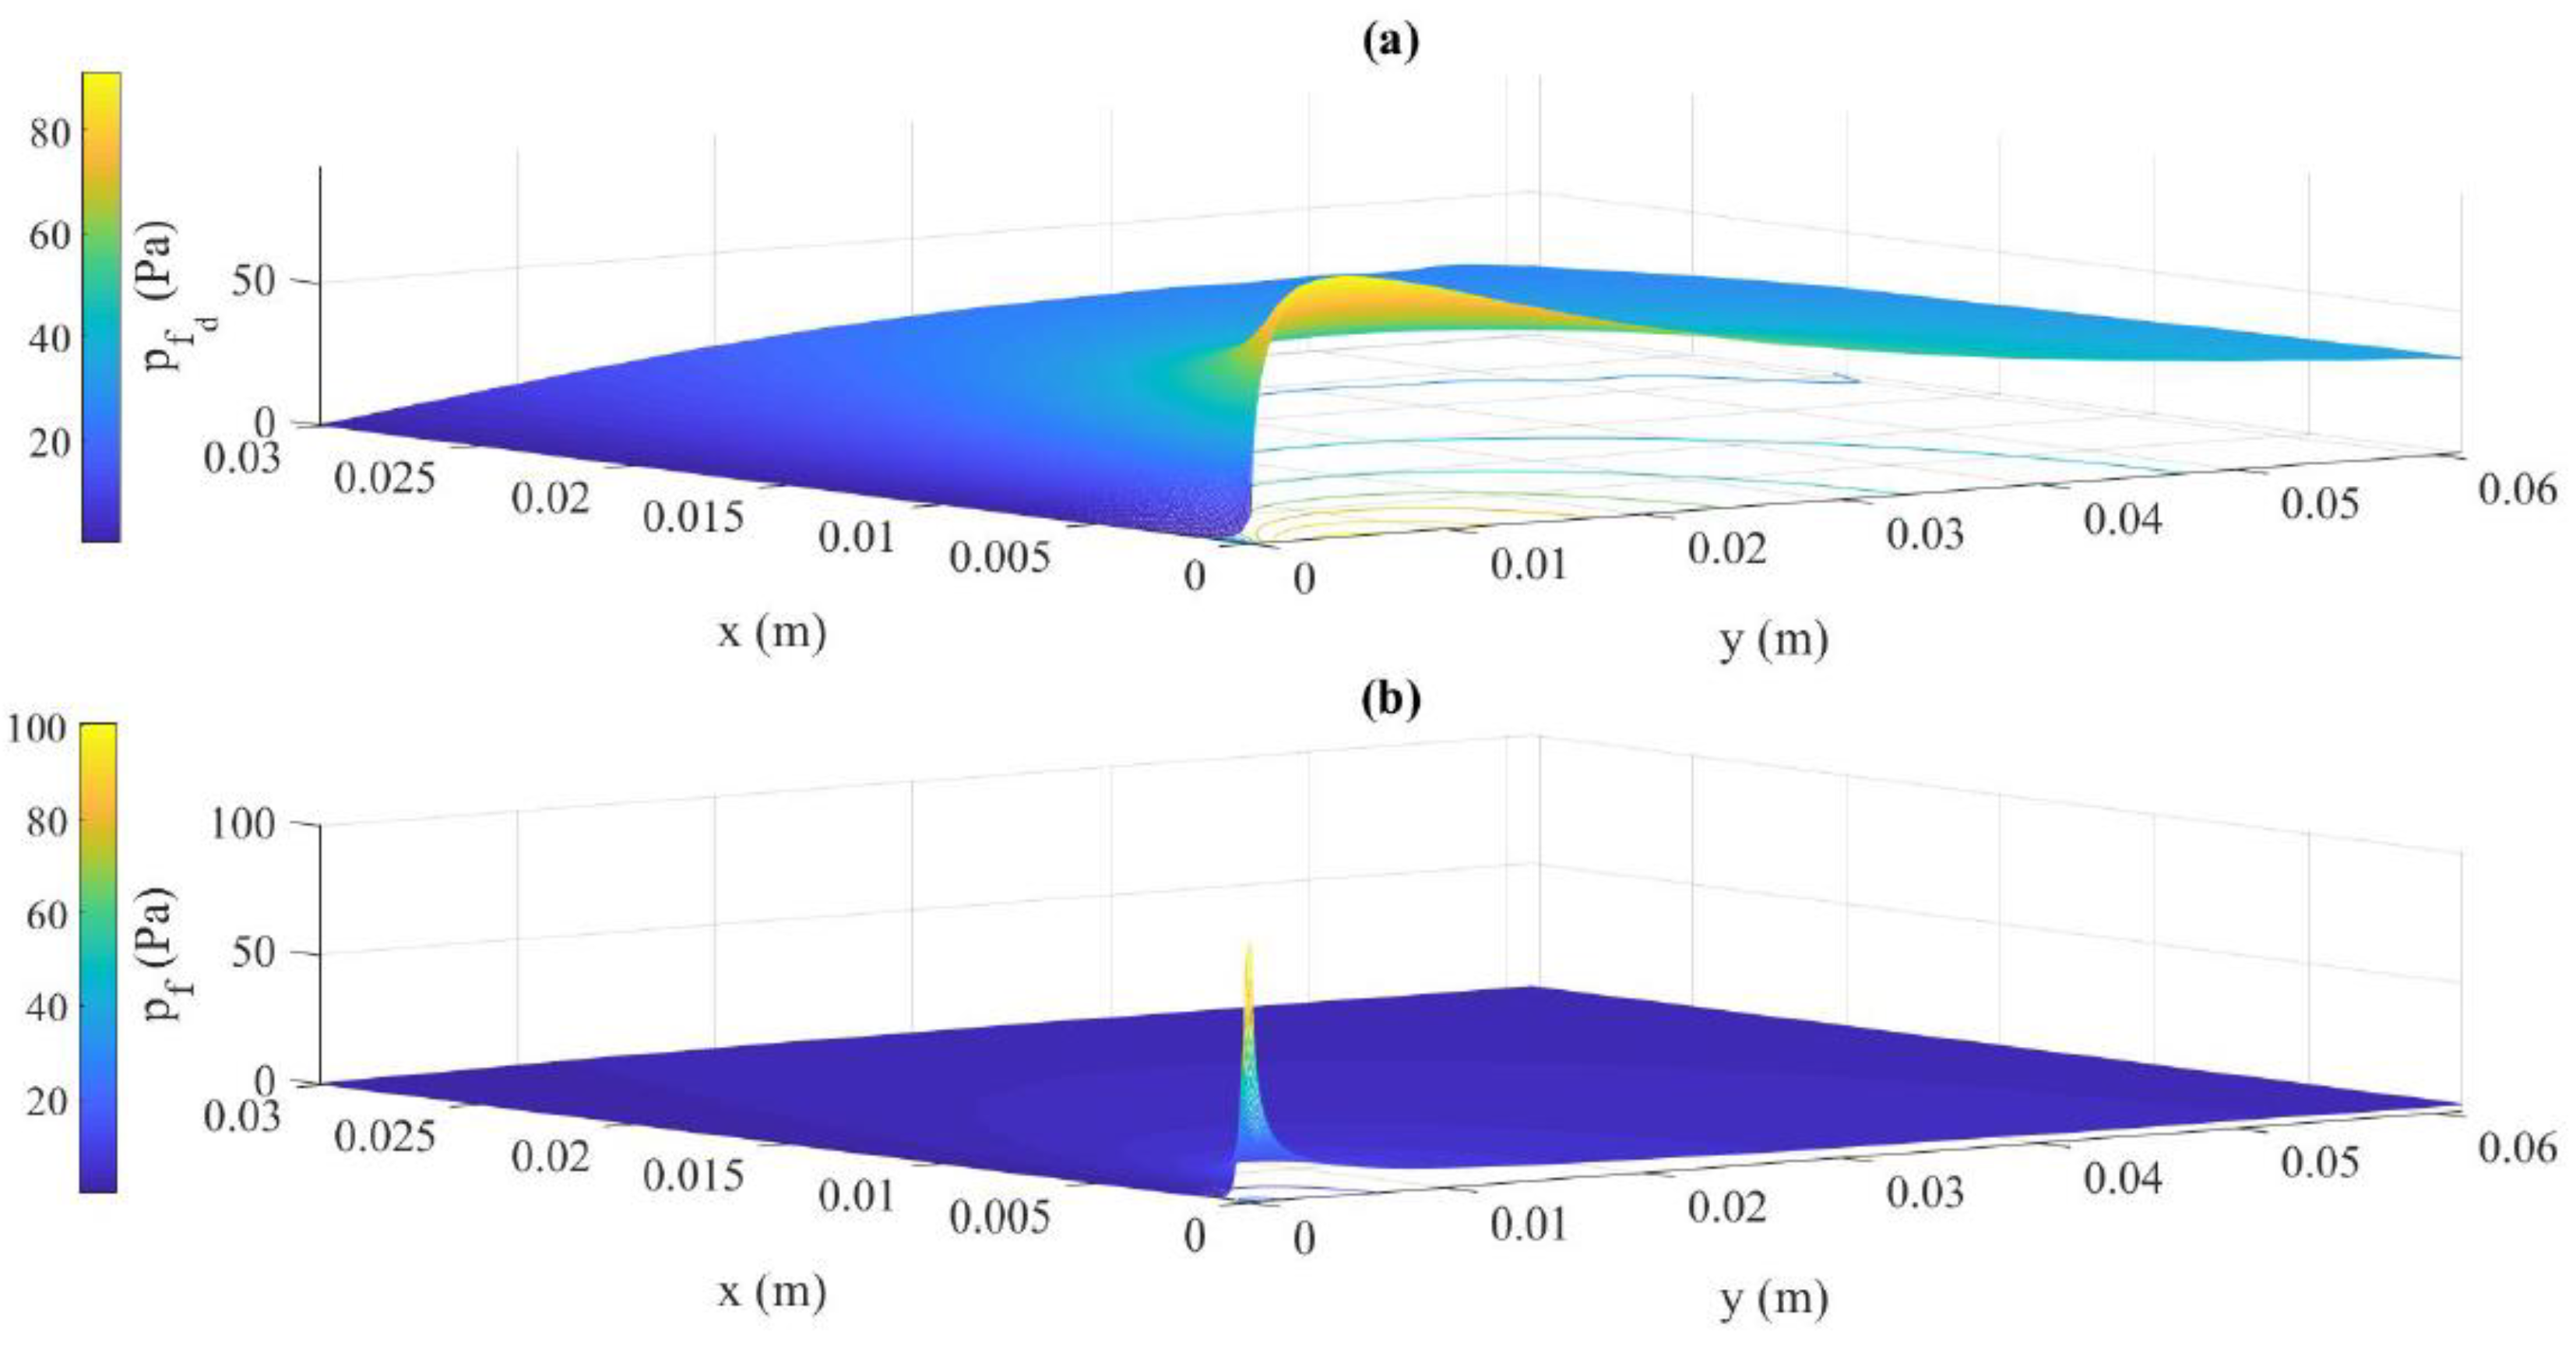
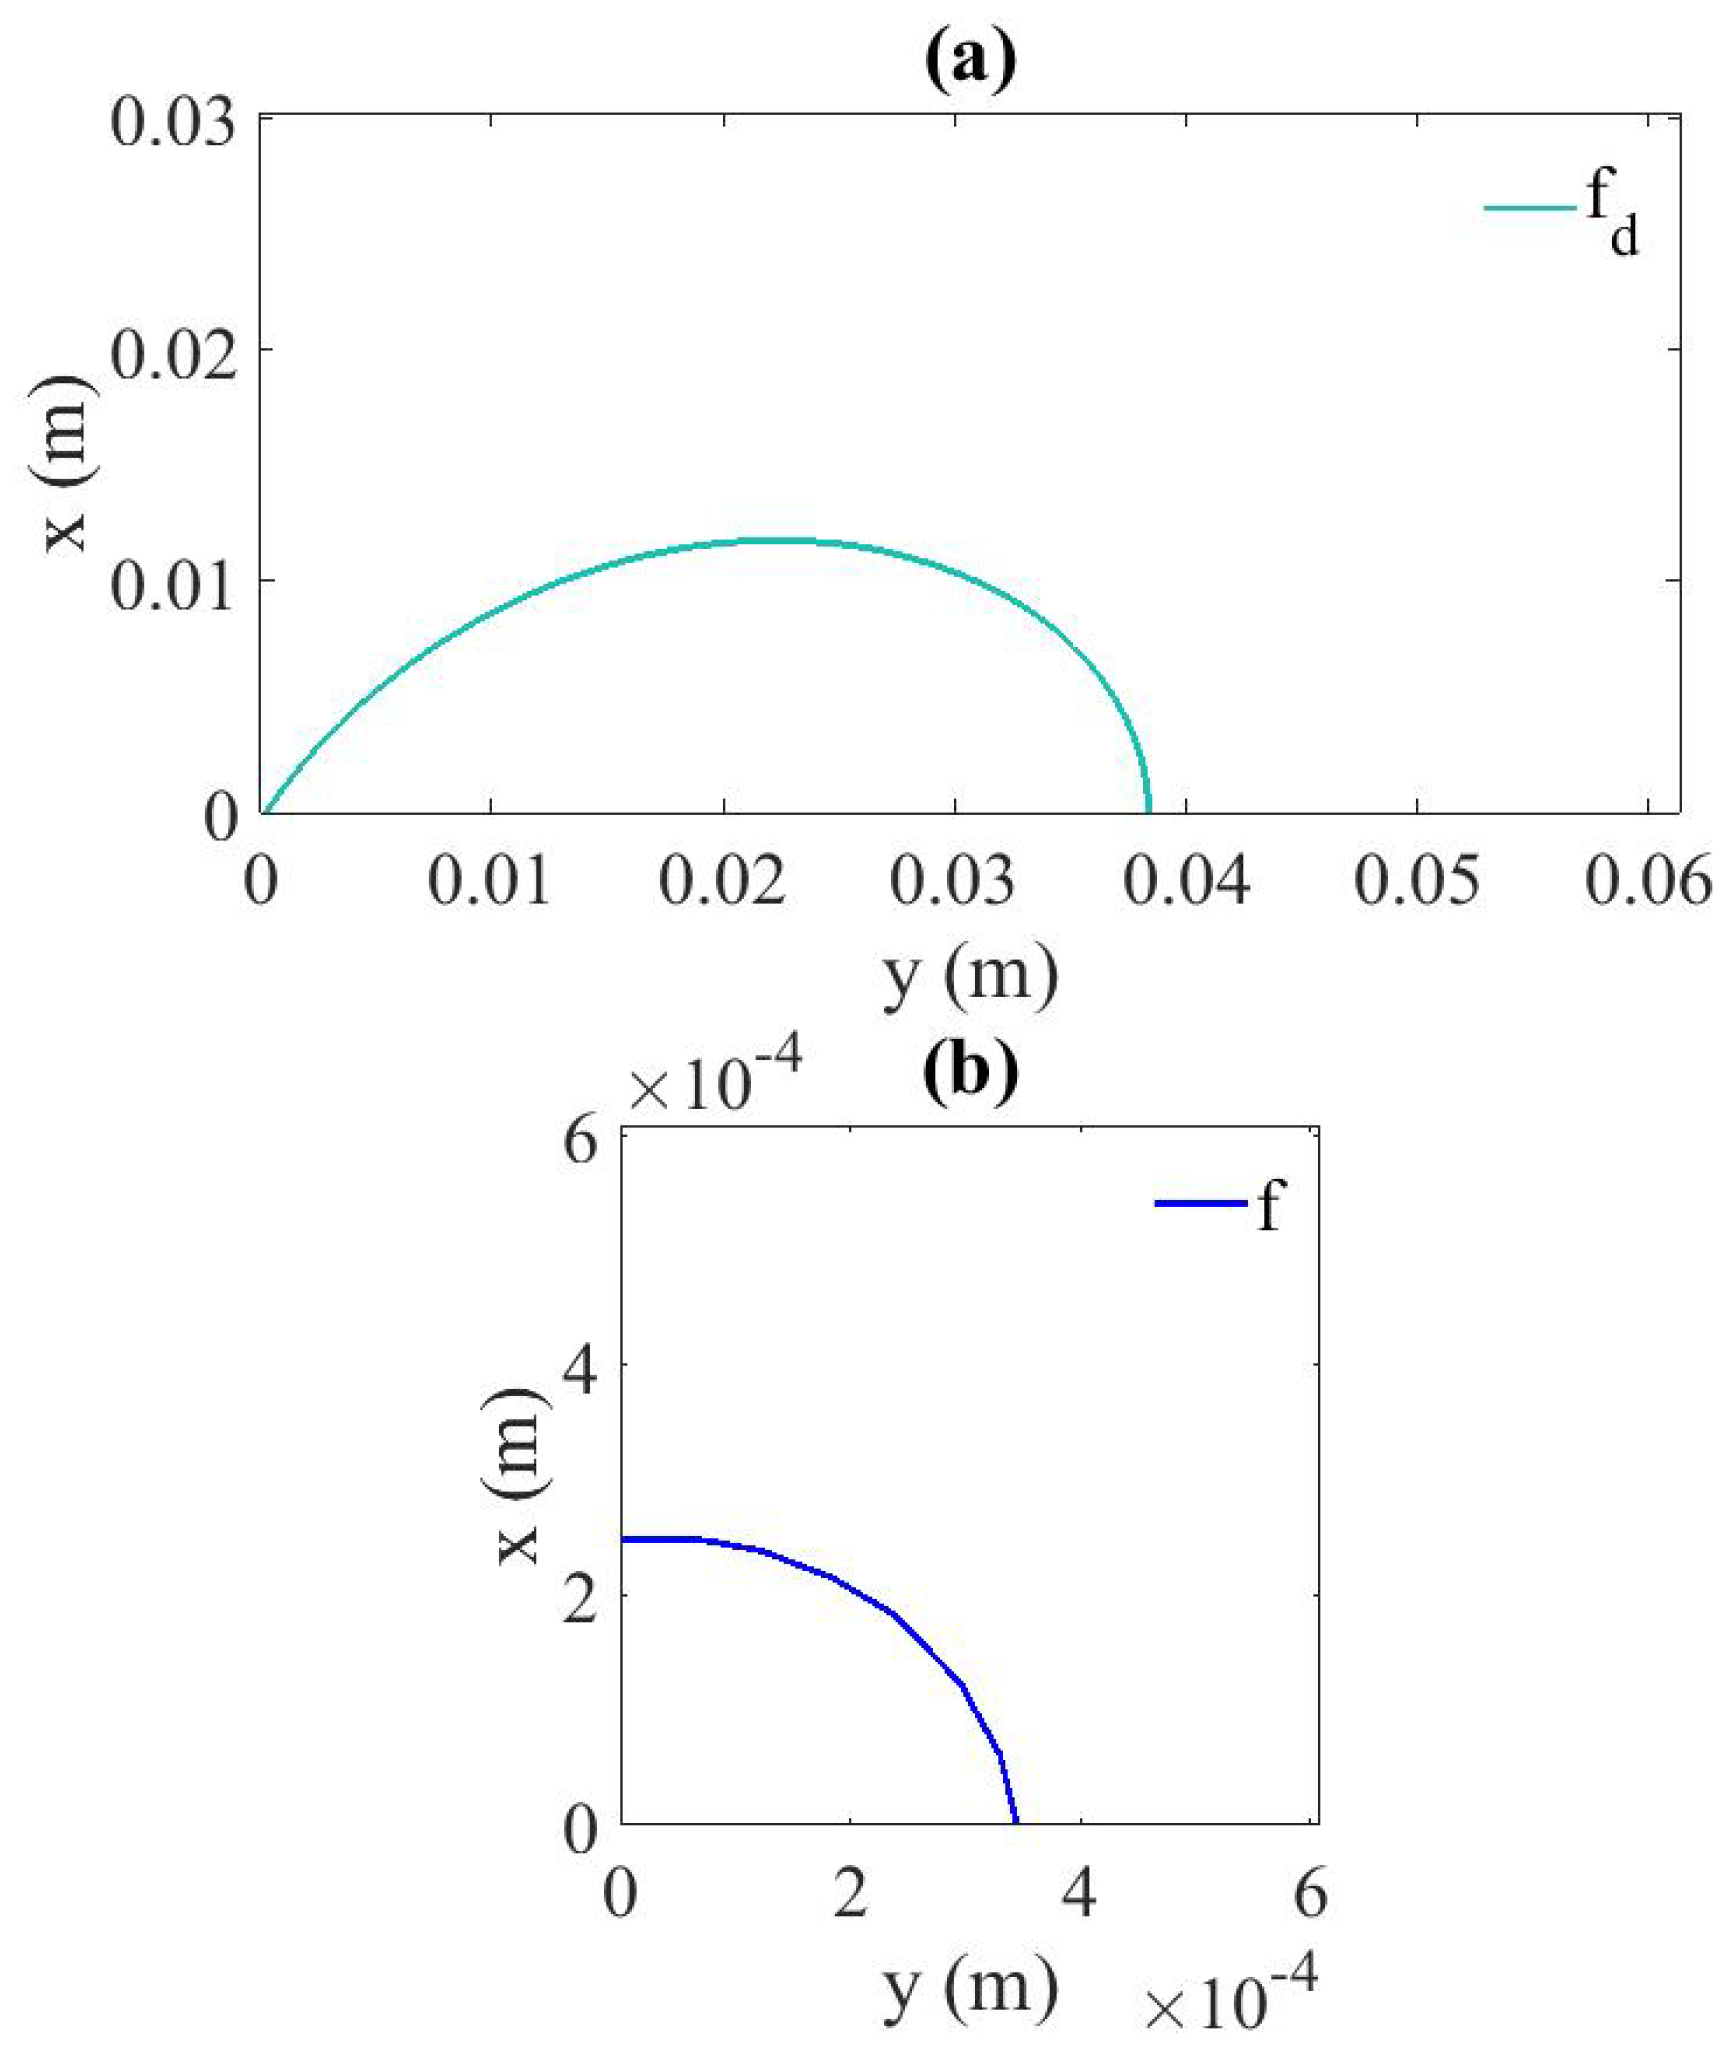
Figure 3 and Figure 4 compare the amplitude of the components obtained from the PAA ( D F C = f d ) and the DM (f), respectively along the symmetry axis and on the 2D domain. Figure 5 displays the contour line that defines the loss of 3dB from the source in the space domain, for both of these components, obtained from the PAA and the DM. The space domain in Diagram (b) for the DM is enlarged to make it possible to observe the contour line.
Figure 3 demonstrates that the amplitude of the DFC component at 200 k H z generated through the PAA from the nonlinear mixing of f 1 and f 2 increases with propagation along the symmetry axis to reach its maximal value (91.42Pa) at around 0.0047 m and decreases slowly, through the space domain, due to the low attenuation at this frequency in the bubbly liquid. This behavior follows p = p 1 × y 2 + p 2 × y + p 3 , with p 1 = 21744 , p 2 = 2408.4 , and p 3 = 108.18 ( P a ). It reaches around 40 P a at 0.047 m . The penetrability of the secondary beam at DFC is very high. The conversion of the acoustical energy from the primary waves to the DFC is quite low ( 0.23 % at 0.047 m ). On the other hand, the behavior of the 200 k H z component when using the DM is completly different. It drops immediately and abruptly from the source and then decrease slowly with very low amplitude values that tend to be insignificant. That is, its capability to penetrate into the medium is very poor. Through the PAA process the generation of the focused secondary beam induces a lower loss of acoustic energy along the symmetry axis, and thus allows the 200 k H z component to penetrate easily into the bubbly medium. If the f d component were not that directive, one would expect that its behavior were the same as via the DM, like in the 1D case (Section 3.1, Figure 2), for which a focusing mechanism cannot exist. The acoustic pressure distributions shown in Figure 4 for the PAA with D F C = f d = 200 k H z (a) and for the DM at f = 200 k H z (b) in the same geometrical conditions reproduce the main differences when compared to Figure (3) in air in Ref. [11]. The fundamental characteristics of the PAA are drawn in the bubbly liquid here: higher directivity and penetrability, but it is seen that these effects are enhanced here in the bubbly liquid, obtaining a beam at DFC that reaches the space domain further along the symmetry axis. The amplitude of the DFC is around 75 P a (between 70 and 80 P a ) in the secondary beam over an important portion of the symmetry axis, with a maximum value set at 91.42 P a , which are respectively 0.44 % and 0.54 % of the amplitude p 0 at the source. In relation to the DM (Figure 3 and Figure 4), the ratio increase considerably, since at x = 0.03 m = 5 λ d on the symmetry axis its value is 1080 % . In Figure 5 it can be seen through the observation of the contour line that the wave remains intense (before its amplitude drops by one-half, i.e., loses 3dB) within a much larger domain from the source along the symmetry axis in the bubbly liquid when using the PAA than with the DM. By defining r y as the maximum y-value reached by the 3 d B -contour, it is clear that the higher r y is, the better is the penetrability. This domain is 110 times with the PAA ( r y = 0.038 m from the source) than the one with the DM ( r y = 0.00035 m from the source). This result shows that the penetrability of the wave is much sharper when using the PAA in the bubbly liquid. Moreover, the difference observed between the PAA and the DM is much higher here in the bubbly liquid (factor 110) than in the results shown in Figure 3 of Ref. [11], for which a factor around 10 was obtained in an homogeneous fluid. This reveals the capability of bubbly liquids to potenciate the PAA effects, which was the goal of this work. From Figure 5 we now define an angle that measures the directivity of a beam, in degrees (º):
Γ d = ( 380 / ( 2 π ) ) arctan ( r x / r y ) ,
where r x is the maximum x-value reached by the 3 d B -contour. The lower this angle is, the better is the directivity. This means that the smaller r x is and the higher r y is, the better it is for the prosecution of directivity. The PAA gives Γ d =17.96 , whereas the DM gives Γ d =37.82 , which shows the very good behavior of the PAA in terms of directivity in a bubbly liquid. The results obtained in this section suggest that bubbly liquids are ideal media to enhance the effects of the PAA.
Further works are now needed to optimize the penetrability of the secondary beam by taking advantage of the dispersive character of the bubbly liquid, as a function of its principal parameters, by varying the values of the bubble size and void fraction, and fitting the primary frequencies according to the dispersive curves of the medium. These will be done further in the next future. The benefits obtained from bubbly liquids on the PAA should most likely be present when pulses are used as primary signals. This will be the topic of further studies. The phenomena described in this paper may be moreover controlled through the use of acoustic metamaterials [19]. These devices could even use the bubbles, like the acoustic switches and diodes described in [29,30,31]. This also may be the subject for further studies.

4. Conclusions

A numerical study on the penetrability and directivity of the difference-frequency component generated through the parametric acoustic array from two ultrasonic signals in bubbly liquids has been carried out. These dispersive media can be extremely nonlinear, so that nonlinear effects can be produced with relatively small amplitudes at the source. Several numerical models developed previously have been used here to analyse the penetrability and directivity of the difference-frequency component obtained from the parametric acoustic array in one and two-dimensional domains. Also, an angle that measures the directivity of a beam has been defined. Our results have shown that the directivity and the penetrability into the bubbly liquid of the secondary beam associated to the difference-frequency component are very high, compared to the same frequency signal excited directly from the source in the bubbly liquid and to the parametric acoustic array in homogeneous fluids, which is a point that had hardly been found in the literature.

Author Contributions

Conceptualization, M.T.T.S. and C.V.; methodology, M.T.T.S. and C.V.; software, M.T.T.S. and C.V.; validation, M.T.T.S. and C.V.; formal analysis, M.T.T.S. and C.V.; investigation, M.T.T.S. and C.V.; resources, M.T.T.S. and C.V.; data curation, M.T.T.S. and C.V.; writing—original draft preparation, M.T.T.S. and C.V.; writing—review and editing, M.T.T.S. and C.V.; visualization, M.T.T.S. and C.V.; supervision, C.V.; project administration, C.V.; funding acquisition, C.V. All authors have read and agreed to the published version of the manuscript.

Funding

This research was funded by the National Agency for Research, Ministry of Science and Innovation of Spain, and the European Regional Development Fund grant number DPI2017-84758-P.

Data Availability Statement

The original contributions presented in the study are included in the article/supplementary material, further inquiries can be directed to the corresponding author/s.

Acknowledgments

This work was supported by the National Agency for Research (Agencia Estatal de Investigación, AEI), Ministry of Science and Innovation of Spain (Ministerio de Ciencia e Innovación), and the European Regional Development Fund (FEDER) [grant number DPI2017-84758-P].

Conflicts of Interest

The authors declare no conflicts of interest.

Abbreviations

The following abbreviations are used in this manuscript:
DFC Difference-Frequency Component
PAA Parametric Acoustic Array
1D One-Dimensional
2D Two-Dimensional
DM Direct Method
FFT Fast Fourier Transform

References

  1. Mason, T.; Lorimer, J. Applied sonochemistry: the uses of power ultrasound in chemistry and processing; 2002.
  2. Greiser, F.; Choi, P.; Enomoto, N.; Harada, H.; Okitsu, K.; Yasui, K. Sonochemistry and the Acoustic Bubble; Elsevier, 2015.
  3. Gallego-Juárez, J.; Graff, K. Power Ultrasonics: Applications of High-Intensity Ultrasound; Elsevier, 2014.
  4. Naugolnykh, K.; Ostrovsky, L. Nonlinear Wave Processes in Acoustics; Cambridge University Press, 1998.
  5. Hamilton, M.; Blackstock, D. Nonlinear Acoustics; Academic Press, 1998.
  6. Prieur, F.; Näsholm, S.; Austeng, A.; Tichy, F.; Holm, S. Feasibility of second harmonic imaging in active sonar: Measurements and simulations. IEEE J. Ocean. Eng. 2012, 37, 467–477. [Google Scholar] [CrossRef]
  7. Berry, J.; Sidhu, P. Microbubble contrast-enhanced ultrasound in liver transplantation. Eur. Radiol. 2004, 14 Suppl 8, 96–103. [Google Scholar]
  8. Desser, T.; Jeffrey, R. Tissue harmonic imaging tecniques: Physical principles and clinical aplications. Semin. Ultrasound CT MRI 2001, 22, 1–10. [Google Scholar] [CrossRef] [PubMed]
  9. Wu, J.; Nyborg, W. Emerging Therapeutic Ultrasound; World Scientific, 2006.
  10. Westerveld, P. Parametric acoustic array. J. Acoust. Soc. Am. 1963, 35, 535–537. [Google Scholar] [CrossRef]
  11. Gan, W.S.; Yang, J.; Kamakura, T. A review of parametric acoustic array in air. Appl. Acoust. 2012, 73, 1211–1219. [Google Scholar] [CrossRef]
  12. Zhou, H.; Huang, S.; Li, W. Parametric acoustic array and its application in underwater acoustic engineering. Sensors 2020, 20, 2148. [Google Scholar] [CrossRef]
  13. Komatsuzaki, T.; Iwata, Y. Active noise control using high-directional parametric loudspeaker. J. Environ. Eng. 2011, 6, 140–149. [Google Scholar] [CrossRef]
  14. Nakashima, Y.; Yoshimura, T.; Naka, N.; Ohya, T. Prototype of mobile super directional loudspeaker. NTT DoCoMo Tech. J. 2006, 8, 25–32. [Google Scholar]
  15. Achanta, A.; McKenna, M.; Guy, S.; Malyarenko, E.; Lynch, T.; Heyman, J.; Rudd, K.; Hinders, M. Nonlinear acoustic concealed weapons detection. Mater. Eval. 2005, 63, 1195–1202. [Google Scholar]
  16. kuang, Z.; Wu, M.; Ye, C.; Yang, J. Method for measuring the absorption coefficient of sound absorbing materials in situ. Acta Acoust. 2010, 35, 162–168. [Google Scholar]
  17. Moffett, M.; Konrad, W. Nonlinear sources and receivers. Encyclopedia Acoust. 1997, pp. 607–617.
  18. Sapozhnikov, O.; Khokhlova, V.; Cleveland, R.; Blanc-Benon, P.; Hamilton, M. Nonlinear Acoustics Today. Acoust. Today 2019, 15, 55–64. [Google Scholar] [CrossRef]
  19. Sinha, D.N.; Pantea, C. Broadband unidirectional ultrasound propagation using sonic crystal and nonlinear medium. Emerging Materials Research 2013, 2, 117–126. [Google Scholar] [CrossRef]
  20. Qu, K.; Zou, B.; Chen, J.; Guo, Y.; Wang, R. Experimental study of a broadband parametric acoustic array for sub-bottom profiling in shallow water. Shock Vib. 2018, 2018, 3619257. [Google Scholar] [CrossRef]
  21. Lee, C.; Lee, J.; Bae, J.; Paeng, D.G.; Lee, S.; Shin, J.; Jung, J. Digital communication system using beamsteering for difference frequency in a parametric array. J. Acoust. Soc. Am. 2012, 131, 3445. [Google Scholar] [CrossRef]
  22. Zhao, A.B.; Cheng, Y.; An, T.S.; Hui, J. Covert underwater acoustic communication system using parametric array. Mar. Tech. Soc. J. 2019, 53, 20–26. [Google Scholar] [CrossRef]
  23. Esipov, I.; Naugolnykh, K.; Timoshenko, V. The parametric array and long-range ocean research. Acoust. Today 2010, 6, 20–26. [Google Scholar] [CrossRef]
  24. Kim, D.; Kwon, Y.; Kang, D.H. ; S., S.; Park, J.; Lee, B. Difference-frequency-based ultrasonic contrast imaging of material elasticities. Proc. 2022 IEEE Int. Ultrason. Symp., 2022, pp. 1–4.
  25. Zabolotskaya, E.; Soluyan, S. Emission of harmonic and combination frequency waves by air bubbles. soviet physics acoustics journal 1973, 18, 396–398. [Google Scholar]
  26. Sastre, M.T.; Vanhille, C. A numerical model for the study of the difference frequency generated from nonlinear mixing of standing ultrasonic waves in bubbly liquids. Ultrason. Sonochem. 2017, 34, 881–888. [Google Scholar] [CrossRef] [PubMed]
  27. Doinikov, A. , Bjerknes forces and translational bubble dynamics; Research Signpost, 2005; Vol. Bubble and Particle Dynamics in Acoustic Fields: Modern Trends and Applications.
  28. Sastre, M.T.; Vanhille, C. Numerical models for the study of the nonlinear frequency mixing in two and three-dimensional resonant cavities filled with a bubbly liquid. Ultrason. Sonochem. 2017, 39, 597–610. [Google Scholar] [CrossRef]
  29. Vanhille, C.; Campos-Pozuelo, C. An acoustic switch. Ultrason. Sonochem. 2014, 21, 50–52. [Google Scholar] [CrossRef]
  30. Vanhille, C.; Campos-Pozuelo, C. Ultrasounds in bubbly liquids: unidirectional propagation and switch. Phys. Proc. 2015, 63, 163–166. [Google Scholar] [CrossRef]
  31. Vanhille, C.; Campos-Pozuelo, C. Nonlinear Interaction of Air Bubbles and Ultrasonic Field: an Analysis of some Physical Aspects. Recent Developments in Nonlinear Acoustics, AIP Conf. Proc. 1685, 2015, pp. 050008–1. [Google Scholar]
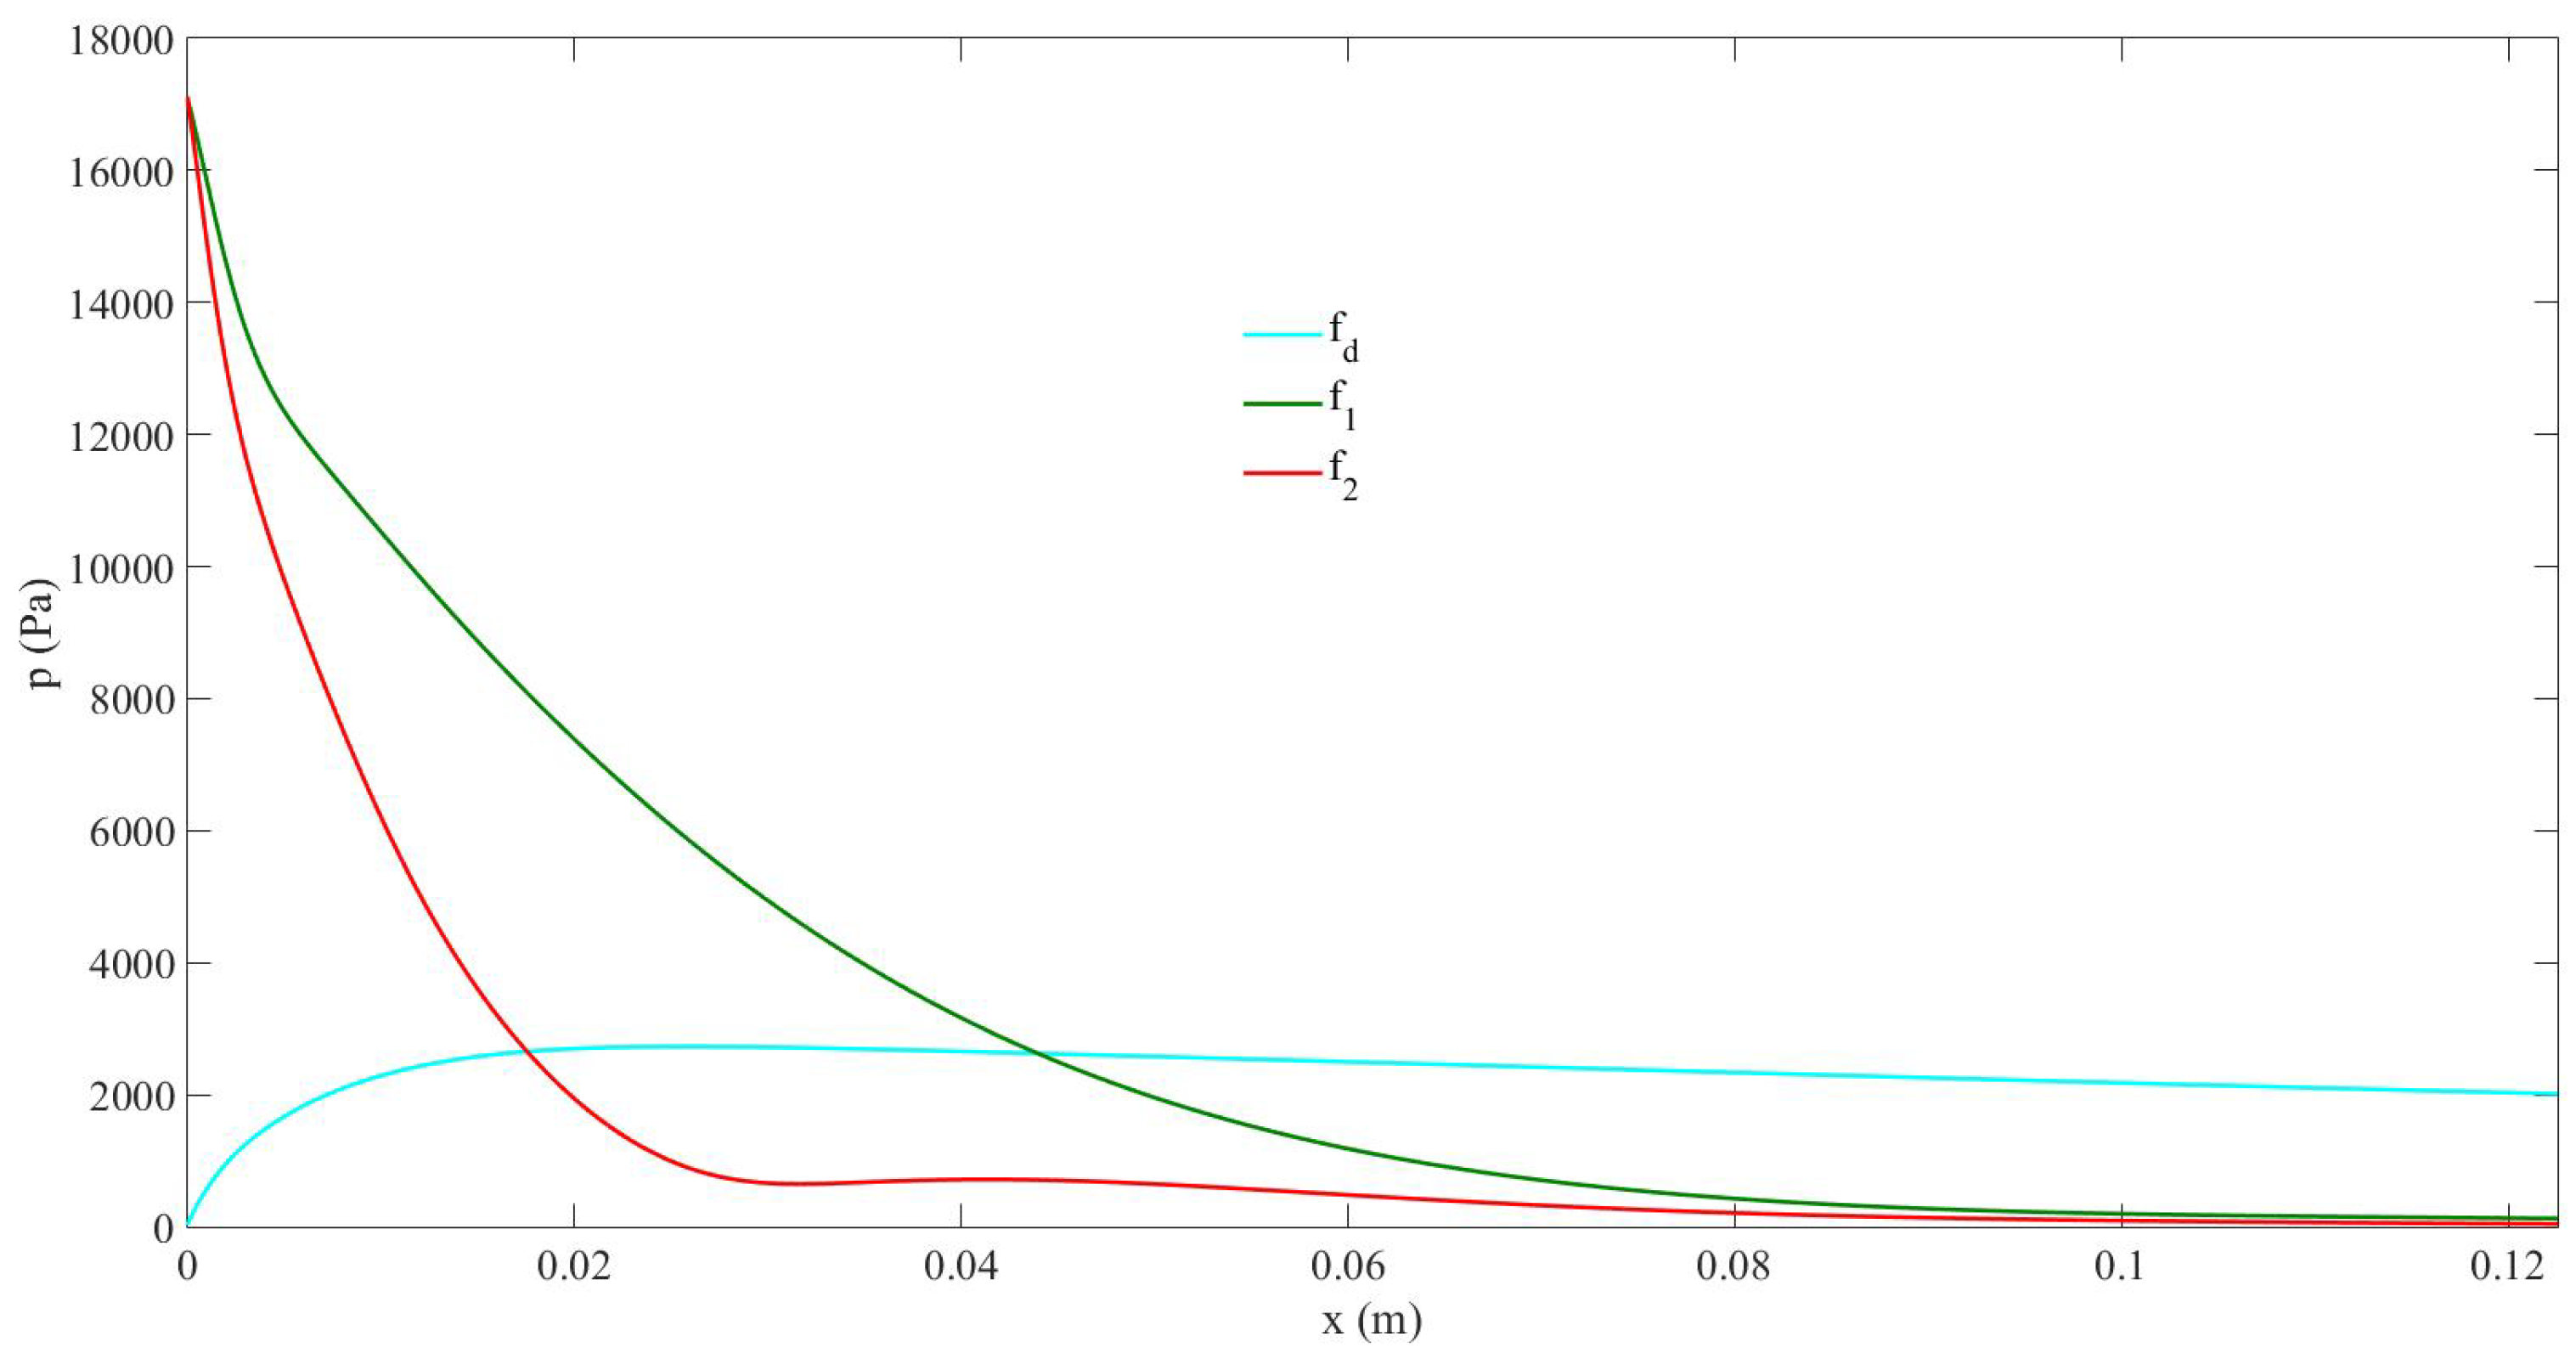
Figure 1. 1D configuration. Pressure amplitude distribution. D F C = f d = 200 k H z component (light blue solid line) obtained from the PAA through a dual-frequency source with f 1 = 700 k H z (green solid line), f 2 = 900 k H z (red solid line), p 0 = 17000 P a . T l = 42 T d .
Preprints 103409 g001
Figure 2. 1D configuration. Pressure amplitude distribution. D F C = f d = 200 k H z component obtained from the PAA through a dual-frequency source with f 1 = 700 k H z , f 2 = 900 k H z , p 0 = 17000 P a (light blue solid line); quadratic approximation of f d = 200 k H z (black dashed line); f = 200 k H z component obtained through the single-frequency source with p 0 = 2995 P a (dark blue solid line). T l = 42 T d .
Preprints 103409 g002
Figure 3. 2D configuration. Pressure amplitude distribution along the symmetry axis. D F C = f d = 200 k H z component obtained from the PAA through a dual-frequency source with f 1 = 700 k H z , f 2 = 900 k H z , p 0 = 17000 P a (light blue solid line); quadratic approximation of f d = 200 k H z (black dashed line); f = 200 k H z component obtained through the single-frequency source with p 0 = 103.3 P a (dark blue solid line). T l = 42 T d .
Preprints 103409 g003
Figure 4. 2D configuration. Pressure amplitude distribution. (a) D F C = f d = 200 k H z component obtained from the PAA through a dual-frequency source with f 1 = 700 k H z , f 2 = 900 k H z , p 0 = 17000 P a ; (b) f = 200 k H z component obtained through the single-frequency source with p 0 = 103.3 P a . T l = 42 T d .
Preprints 103409 g004
Figure 5. 2D configuration. Contour line indicating the loss of 3dB from the source in the space domain. (a) D F C = f d = 200 k H z component obtained from the PAA through a dual-frequency source with f 1 = 700 k H z , f 2 = 900 k H z , p 0 = 17000 P a ; (b) f = 200 k H z component obtained through the single-frequency source with p 0 = 103.3 P a . The space domain in Diagram (b) is enlarged to observe the contour line. T l = 42 T d .
Preprints 103409 g005
Disclaimer/Publisher’s Note: The statements, opinions and data contained in all publications are solely those of the individual author(s) and contributor(s) and not of MDPI and/or the editor(s). MDPI and/or the editor(s) disclaim responsibility for any injury to people or property resulting from any ideas, methods, instructions or products referred to in the content.
Copyright: This open access article is published under a Creative Commons CC BY 4.0 license, which permit the free download, distribution, and reuse, provided that the author and preprint are cited in any reuse.
Prerpints.org logo

Preprints.org is a free preprint server supported by MDPI in Basel, Switzerland.

Subscribe

© 2024 MDPI (Basel, Switzerland) unless otherwise stated