Submitted:
09 April 2024
Posted:
10 April 2024
You are already at the latest version
Abstract
The blood counts of α thalassemia carriers (α-thal) are similar to those of β thalassemia carriers, except for Hgb A2 that is not elevated. The objective of this study was to determine whether mathematical formulas are effective for detecting suspected α-thal.
The data were obtained from the database of the prevention program for detecting couples at risk for having a child with hemoglobinopathy. RBC indices were analyzed using mathematical formulas and the sensitivity and negative predictive value (NPV) calculated.
Among 1334 blood counts suspected α-thal analyzed, only the Shine&Lal and the Support Vector Machine formulas revealed high sensitivity and NPV. Sensitivity was 85.54 and 99.33% and NPV 98.93 and 99.93%, respectively. Molecular defects were found in 291, 81 had normal α genes. Molecular analysis was not performed in 962.
Based on these results, mathematical formulas incorporating one of these reliable formulas for detecting suspected α or β thalassemia carriers in the program of the automatic analyzers can flag these results and increase the awareness of the primary physicians about the carrier risk and send an alert with a recommendation for further testing.
Keywords:
Alpha Thalassemia
; Screening
; Support Vector Machine
; Mathematical Formulas
1. Introduction
Hemoglobinopathies are the most common monogenic genetic diseases worldwide, including β and α thalassemia and Sickle Cell Disease (SCD). Each year more than 300,000 new patients are born with these diseases, principally in developing countries in Africa and Asia [1]. Patients with β thalassemia and SCD experience severe symptoms that are difficult for the patients and their families and present a significant burden on healthcare services [2,3,4]. Therefore, prevention programs that can detect couples at risk of having an affected child have been implemented in many countries. Since both transfusion dependent (TDT) and non-transfusion dependent β thalassemia (NTDT) and SCD are generally more severe than α thalassemia, the screening programs are conducted to detect carriers of those diseases [5,6].
Alpha gene deletions or additional mutations are much more frequent than β gene defects and more widely distributed, even before the extensive population migrations of the last centuries. About 5% of the world population carries an α gene defect [7].
In Asian countries the incidence of α thalassemia carriers is much higher than the mean frequency worldwide. For example, in Vietnam, Myanmar, Laos, Thailand, and Cambodia, the frequency is 12% to 37% [8]. In Mediterranean countries, Africa, the Middle East, and the Indian subcontinent, α thalassemia carriers are frequent, but with a significantly lower prevalence than in southeastern Asia countries [9].
The relatively higher frequency of α thalassemia carriers in tropical and subtropical countries can be attributed to the selective advantage of α thalassemia carriers in areas where malaria was frequent, like the advantage of SCD and β thalassemia carriers [10].
In contrast to the β globin diseases, α thalassemia is characterized by the presence of two α genes on chromosome 16, the α1 and α2 genes (αα/αα). More than 100 α thalassemia genetic defects have been reported. The most common α gene defects are deletions, but other mutations are also known [7]. Clinically, there are four possibilities: four α intact genes (αα/αα), one affected gene that causes the silent α trait (-α/αα), two affected genes that cause the α thalassemia trait (-α/-α or (--/αα), three affected genes that cause the clinical form known as Hgb H disease (--/-α), and four affected genes that cause the severe form of α thalassemia known as hydrops fetalis (--/--), that is usually lethal.
In the two cases of α thalassemia carriers, the silent and the α thalassemia trait, the blood count indices, mean corpuscular volume (MCV) and mean corpuscular hemoglobin (MCH) are low and in similar ranges but less affected than in carriers of β thalassemia. Usually, the Hgb level can be slightly lower than normal, and the red blood cell (RBC) count is elevated compared to the Hgb level. All carriers of α globin defects have normal high performance liquid chromatography (HPLC) analyses, or even low Hgb A2 levels. The threshold for MCV is usually ≤ 78 fl, despite that α and β thalassemia carriers can have MCV in the normal range of 80 fl or higher. For MCH, the usually accepted threshold is ≤ 27 pg. In some studies, the threshold is < 80 fl for MCV [11]. In a study that analyzed the RBC indices in 1301 α thalassemia carriers, the mean MCV was 74.36 ± 6.83 fl with a wide range from 45 fl to even 88.8 fl. The MCH was also under 27 pg, 23.6 ± 2.7 pg but also with a wide range from 13.1 to 30.5 pg. [12]. Since the lower range for RBC and Hgb in that study was 2.69 mm3 and 4.1 g/dl respectively, some of the patients with low MCV and MCH likely had Hgb H disease or α thalassemia carriers combined with iron deficiency anemia (IDA) and not only simple α thalassemia carriers.
The most common defects in the α genes are deletions, with the -α3.7kb and -α4.2kb deletions the most common [7]. Non deletional mutations in the α genes can also cause the same clinical and laboratory pictures.
The genotype of the α carriers differs in eastern Asia countries, where the cis form (--/αα) is more common compared to the western world were the trans form (-α/-α) is more common. Due to this difference, the frequency of hydrops fetalis and even the Hgb H disease is common in Asian countries; therefore, routine screening for detection of α carriers is usually performed in Asian countries. Nonetheless, cases of Hgb H disease and even hydrops fetalis have been described in western countries when only two or three mutations in the α gene were diagnosed (-α/-α) [7]. Non-deletional defects involving the α2 gene, are more severe than deletional defects because the α2 gene encodes more α globin than does the α1 gene [13].
Interaction between α globin abnormal genes and β globin mutations can ameliorate or increase the severity of the clinical picture of α thalassemia carriers. For example, in case of triplication or quadruplication of α thalassemia genes, this combination aggravates the severity of β thalassemia carriers, and in those subjects a clinical picture of NTDT or even TDT can be present [14].
As mentioned, screening for β thalassemia and SCD is common in many countries, but a byproduct of the screening programs is the detection of possible α thalassemia carriers, where only molecular analysis can confirm the presence of an α gene defect. Since the screening for α thalassemia carriers is not the major goal of those screening programs, the true incidence of α thalassemia carries is unknown.
Rarely, β thalassemia carriers may have normal Hgb A2 in HPLC analysis, called silent β carriers, then in cases where both parents have RBC indices in the range to be considered as suspected α or β globin carriers, even if one is a "classical β carrier", and the other is defined as a "suspected carrier", molecular analysis is recommended.
The principal differential diagnosis for low MCV and MCH is of course iron deficiency, but iron status is not routinely analyzed in most screening programs, and iron deficiency does not exclude the possibility of being a carrier of β or α thalassemia.
In the last few decades, investigators around the world tried to use blood cell indices to develop a mathematical formula that would flag cases of suspected thalassemia carriers, mainly β thalassemia. Currently, none of these formulas have been adopted for routine use, mainly because there was not enough information regarding the ranges for α thalassemia carriers and the fear of false negative (FN) diagnoses in those cases.
The prevention program for detecting couples at risk of having a child with hemoglobinopathies was instituted in northern Israel in 1987 [6]. Since 2010, blood samples from women with red blood cell indices suspicious to be α thalassemia carriers, have been sent for molecular analysis when the partner was also suspected of being a carrier.
The purpose of this study was to determine the impact of this screening approach and to propose more significant and cost-effective screening decisions based on the outcomes. We also tried to determine whether the formulas described in the literature are effective for detecting α thalassemia carriers among a homogenous population of women of childbearing age [15,16,17,18,19,20,21,22,23,24,25,26,27,28,29,30,31].
2. Methods
A prevention program for detecting pregnant women who were carriers of β thalassemia was initiated in the northern region of Israel from 1987. In 1999, the program was extended to include sickle cell carriers due to the relatively high frequency of sickle cell carriers in this area [3]. Through the end of 2023, more than 100,000 subjects were screened and 2,346 pregnancies at risk for having an affected child were detected and referred for genetic counseling.
Since 2010, all samples from women with low MCV (≤78) and/or low MCH (≤27), even with normal Hgb A2 levels in HPLC analysis, were requested to provide blood samples from their partners. If the partners were found to carry a hemoglobinopathy, diagnosed by HPLC, or suspected to be carriers of α thalassemia, based on the same MCV and MCH parameters but normal Hgb A2, the blood samples were routinely referred for molecular analysis to detect or exclude α thalassemia carriers. If the partner’s RBC indices and the HPLC analysis were normal, the investigation of the couple was terminated and summarized as no risk of having a child with a severe or clinically significant hemoglobinopathy. Otherwise, the samples were sent for further molecular analysis.
For the data analysis, we included the results of RBC and HPLC analyses of pregnant women or ron women of childbearing age to obtain a more homogeneous population. We excluded 39 blood counts with Hgb level less than 9 gr/dl because the possibility of IDA or even a combination of α thalassemia carrier and IDA, which is more common among pregnant women, was likely.
The complete blood count analysis was performed on an ADVIA i2120 analyzer (SIEMENS, Germany). The Hgb fractionation was analyzed using HPLC Bio-Rad Variant-II set-up (Bio-Rad, Hercules, CA, USA).
2.1. Molecular Analysis
Alpha globin gene deletions were detected using GAP-PCR methodology. For each of the common gene deletions: -α3.7kb, -α4.2kb, --Mediterranean, and -α20.5kb, a set of specific primers is used. Point mutations are detected using Sanger sequencing following PCR amplification of each of the two alpha-globin genes. In rare cases, we used MLPA: Multiplex Ligation-Dependent Probe Amplification technology to detect deletions or multiplications.
According to the results of the molecular analysis, three groups were defined. The first group, α thalassemia trait with proven molecular diagnosis, a second group included samples suspicious to be α thalassemia carriers, but without proven mutations in the α globin gene detected, and a third group of suspected α thalassemia carriers but without molecular analysis. The third group included all the samples from pregnant or childbearing age women suspected to be α thalassemia carriers, whose partner had normal RBC indices and normal HPLC.
Subsequently, the results of the blood counts of the three groups of α thalassemia carriers, were compared to the results of women in the same age range not suspected to be an α or β thalassemia carrier, and with the results of the women diagnosed with β thalassemia trait based on blood indices and HPLC analysis. The results of blood counts from non-carrier women and β thalassemia carriers were obtained from the same database of the prevention program, as described in a previous paper from our group [31].
2.2. Analysis of the Data Using Mathematical Formulas
The results of the three α thalassemia groups were also analyzed using the mathematical formulas described in the literature for detecting β thalassemia trait and the differential diagnosis from normal samples and/or iron deficiency, to demonstrate the reliability of those formulas for detecting α thalassemia trait or carriers. A small number of samples of α globin carriers were included in two of the studies [15,27].
2.3. The Support Vector Machine (SVM) Algorithm
After analyzing the data with the published formulas, we applied another mathematical method based on the SVM algorithm to the same data. The SVM method that was published by our group for detecting blood counts suspected to be from β thalassemia carriers compared to normal counts or suspected of stemming from women with IDA. Details of this algorithm have been published elsewhere [32]. The SVM algorithm initially used all the relevant data from the RBC counts, including Hgb, Hct, RBC, MCV, MCH, MCHC and RDW. After checking the entire database, the algorithm chooses the most relevant values and discards the rest. We applied the previous SVM method for analyzing our data from α thalassemia carriers in the three groups described above and compared the results of the samples in the same database used in our previous study [31].
2.4. Analysis of the Red Blood Count Indices and HPLC Results in the Two Most Common α Gene Defects
Finally, the results of a group of proven α thalassemia trait carriers with the two most common identified deletions found in our study, -3.7kb and IVS I-1 (-5bp) (HBA2:c.95+2_95+6delTGAGG), were analyzed. The heterozygous results were compared to the homozygous results for each deletion and the common combinations between those deletions were analyzed.
Samples with the mutation α CD 39 – HBA:c.118-120delACC, commonly called Hgb Taybe, were excluded from the analysis because they present a different, specific clinical picture and blood count ranges [33].
Since the blood samples and HPLC analyses were part of a very large-scale screening program, iron or ferritin levels were not analyzed.
2.5. Data Analysis
Student t-test or chi square was used for paired comparisons and two-sided analysis of variance tests, assuming equal variances, were used for group comparisons. A p value of ≤0.05 was considered significant. All analysis were performed using the SPSS statistical program.
2.6. Ethics
The study was approved by the Emek Medical Center Ethics Committee, approval number EMC- 52109-06 and registered at the NIH Clinical trials registry - NCT00481221.
3. Results
A total of 22,842 blood counts results were included in the data analysis. including the results published by our group when we compared the results of β thalassemia carriers with results that were defined as non_β thalassemia carriers [31]. In this paper, we analyzed the results of blood counts from 1,334 women who were diagnosed or suspected to be an α thalassemia carrier, as described in the Methods. In summary, 1,334 results were α thalassemia carriers or suspected carriers (5.9%), 2,936 were β thalassemia carriers (12.8%) and 18,572 had blood counts that did not correspond to α or β thalassemia carriers (81.3%; Table 1). The α thalassemia carriers had significantly lower RBC, and higher Hgb, MCV, MCH, MCHC and RDW values (p <0.001 for all) compared to the β thalassemia carriers. As expected, the A2 and the Hgb F levels in α thalassemia carriers were lower than in the β thalassemia group (p <0.001 for both).
The group defined as α thalassemia carriers included 372 samples that were analyzed for molecular diagnosis. The results revealed 291 samples with mutations in the α globin gene; Normal α globin gene was found in 81 samples. Another 962 samples were defined as suspected α thalassemia carriers but did not undergo molecular analysis. Comparison of the blood count results from these three groups did not reveal significant differences except the RBC were higher in the blood counts with proven mutations and lower in the group with normal sequences (p < 0.001). The differences in the RDW levels had a similar trend as the RBC results (p<0.004; Table 2).
Due to the minimal differences between the three groups defined as α thalassemia carriers, normal molecular analysis or suspected carriers, the analysis of the mathematical formula was combined as a one α thalassemia group.
3.1. Comparative Results of the Formulas
Only the Shine &Lal formula [26] and our previously published SVM formula [31] had high sensitivity and NPV for detecting suspected α thalassemia carriers. The Shine & Lal formula had a sensitivity value of 85.54%, 88.22% specificity and a NPV of 98.93%. The SVM formula had a sensitivity of 99.33%, 73.67% specificity and 99.93% NPV. FN results were found in both the Shine & Lal and SVM formulas (n=258,19.3%). Seventeen FN results detected in Shine & Lal 's formula were not detected in the SVM formula, and three results detected in the SVM formula were not detected by Shine & Lal's formula.
Overall, 275 FN results were found when applying the SVM formula (20.6% of the 1334 samples), 42 FN results (18.1%) were found in the samples with a proven mutation (-α3.7 or IVS I-1 (-bp) 22.4 % and 12.4 %, respectively, p > 0.25), 22 FN samples were in the normal molecular analysis samples (27.2%) and 111 in the suspected α thalassemia carriers group (11.5%). When we compared the proportion of FN results in those groups, the p value was < 0.05.
The results of applying all the other formulas published in the literature failed to reveal sufficiently significant levels of sensitivity, all results were below 80%. NPV above 90% was found in several formulas but with a sensitivity <80%. Two formulas had 100% sensitivity but 0 NPV (Table 3).
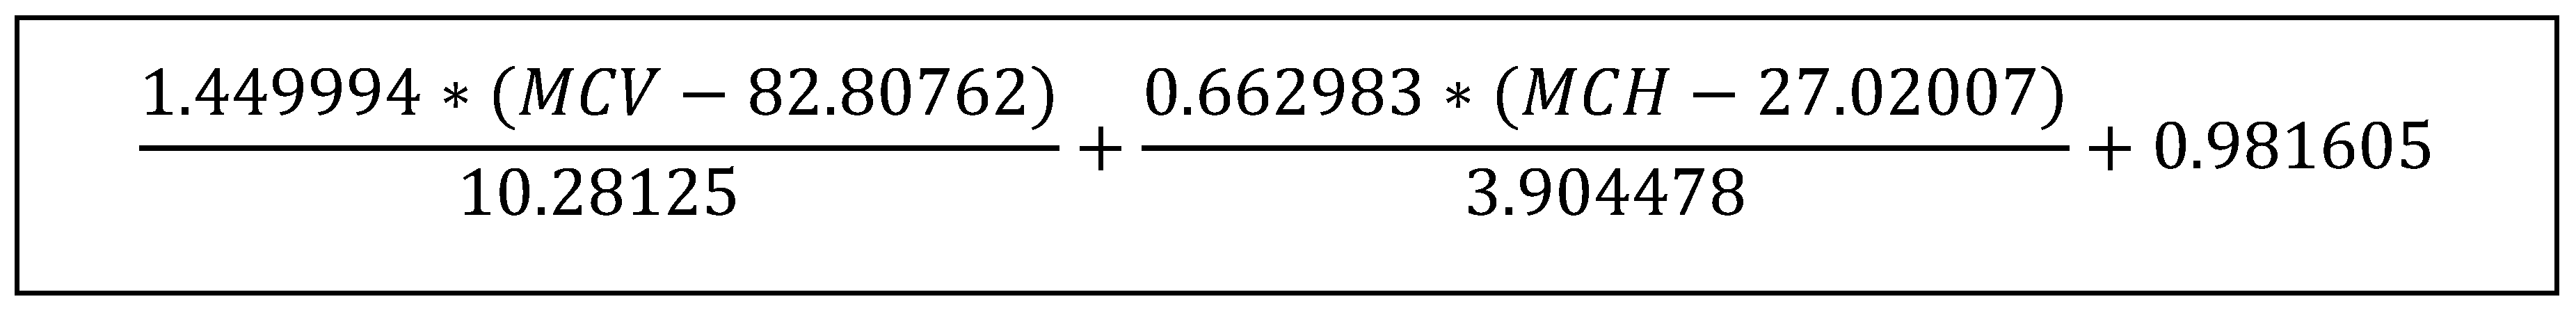
Figure 1.
The Support Vector Machine Algorithm calculated formula [31]. MCV: mean corpuscular volume; MCH: mean corpuscular hemoglobin.
Figure 1.
The Support Vector Machine Algorithm calculated formula [31]. MCV: mean corpuscular volume; MCH: mean corpuscular hemoglobin.
3.2. Analysis of Samples Suspected to Have a Diagnosis of Iron Deficiency Anemia
Of 291 samples, 28 (9.62%) in the group with α genotype mutation or deletion had RBC ≤4.5 x 10⁹/dl and RDW ≥14.5 %. Consequently, those samples can be defined as having IDA concomitant with an α thalassemia trait.
Of the 81 samples in a group with normal α gene sequencing, 20 (24.7%) had RBC ≤4.5 x 10⁹/dl and RDW ≥14.5 % and can be defined as having IDA. In the group defined as suspected α thalassemia (no molecular analysis), 111 962 samples (11.5%) had RBC ≤4.5 x 10⁹/dl and RDW ≥14.5 % and then can be defined as having IDA. The MCV and MCH values in all the α thalassemia groups were in the same range (p = NS).
3.3. Comparison of the Results from the Two Common α Globin Mutations Found
In 291 of 1,337 blood counts, an α globin mutation was found (21.8%). The two most common deletions were -α3.7kb and αIVS I-1 (-5bp) (HBA2:c.95+2_95+6delTGAGG). In 134 samples (46%) -α3.7kb/αα genotype was found and in another 24 (8.2%) the -α3.7kb/-α3.7kb genotype was detected. In 97 samples (33.3%) the αIVS I-1 (-5bp)/αα genotype was found and in another eight (2.7%), the genotype was αIVS I-1 (-5bp)/αIVS I-1 (-5bp). The genotype was αIVS I-1 (-5bp)/-α3.7kb in seven samples (2.4 %). Another 25 genotypes were found, including α Poly A-HBA2:c.*92A>G in seven subjects, -α4.2kb in five, Med in three and others in five. We did not include the data analysis of the α CD 39 – HBA:c.118-120delACC genotype commonly called Hgb Taybe that presents with different clinical characteristics and was described elsewhere (33).
We compared the RBC indices from the two most common genotypes found in this study (Table 4). For the -α3.7kb genotype, the RBC was higher in the -α3.7kb/-α3.7kb genotype (134 samples) than in the-α3.7kb/αα genotype (24 samples). The parameters MCV, MCH and MCHC were lower in the -α3.7kb/-α3.7kb genotype compared to the -α3.7kb/αα genotype (p<0.001 for all). For the αIVS I-1 (-5bp) genotype all RBC indices were lower in the αIVS I-1 (-5bp)/αIVS I-1 (-5bp) genotype (8 samples) compared to the αIVS I-1 (-5bp)/αα genotype (97 samples (p=0.002 for RBC, p<0.001 for MCV, MCH and MCHC, and p=0.001 for RDW and Hgb A2).
When we compared the -α3.7kb/-α3.7kb genotype (24 samples) with the αIVS I-1 (-5bp)/αIVS I-1 (-5bp) genotype (8 samples), the results were only significant for the MCH (p=0.014) and for the MCHC (p=0.027) with lower values in the αIVS I-1 (-5bp)/αIVS I-1 (-5bp) genotype. All other parameters in the RBC count were in the same range.
When we compared the compound genotype -α3.7kb/IVS I-1 (-5bp)α to both other double deletions (-α3.7kb/-α3.7kb or αIVS I-1 (-5bp)/αIVS I-1 (-5bp)) they were significantly lower only for the MCV and MCHC values compared to the -α3.7kb/-α3.7kb genotype (p =0.017 and p=0.049, respectively) and comparable with the αIVS I-1 (-5bp)/αIVS I-1 (-5bp) genotype (p = NS; Table 4). In those genotypes, the Hgb F and Hgb A2 values were in the normal range but lower in the αIVS I-1 (-5bp)/αIVS I-1 (-5bp) group (p=0.002) compared to the αIVS I-1 (-5bp)/αα genotype (Table 4).
4. Discussion
As hemoglobinopathies are the most common monogenic clinical severe disease worldwide, any effort toward detecting carriers and offering genetic counseling for couples at risk is recommended. Carriers of Sickle Cell Disease do not have any specific or characteristic features in RBC indices. Therefore, HPLC analysis is required to detect carriers. On the other hand, the indices of carriers of α or β thalassemia can be clearly identified and lead to suspicion of being a carrier. Multiple efforts have ensued to find a reliable mathematical formula that is specific enough and has a high NPV to minimize further unnecessary laboratory analyses. A reliable formula will need to be tested in as many samples as possible. It can be incorporated in all laboratory blood analyzers and then flag results that need further analysis.
To date, no formula has been incorporated in any routinely used analyzers, despite publications that demonstrate the reliability of some formulas based on large samples. The likely cause is that HPLC analysis is also performed in standard, inexpensive analyzers and most β thalassemia carriers can be detected. But HPLC analysis is routinely done on request or screening programs and not in routine blood samples and not for thalassemia screening. β thalassemia screening programs are routinely implemented in countries with many carriers but not in all of them. In recent years, migration of large numbers of people to countries where β thalassemia was not common, presents a new health problem that needs attention [34].
Detection of α thalassemia carriers is mostly relevant in populations of Asian origin, where the cis carriers are common (αα/--) and the risk of an infant with hydrops fetalis or severe forms of Hgb H disease (α-/--) are frequent. Some trans carriers (α-/α-) with specific mutations in the α gene can also be found and produce an infant with severe α thalassemia disease. Mathematical formulas published in the literature do not usually include α thalassemia carriers in their analyses, except two studies with a relatively small number of carriers, Amendiola et al. [15,27] 81 subjects and Mentzer(15,27), with 50 subjects. The current study is the largest study to detect α thalassemia carriers using mathematical formulas.
Since 1987, a systematic screening program for detecting couples at risk for having a child with β thalassemia was instituted in northern Israel [5,6]. Since 2010, all samples with RBC indices suspicious for β or α thalassemia carriers were sent for molecular analysis providing the partner was also suspected to be a carrier. Therefore, we have many blood count results that can be analyzed with mathematical formulas. The present study includes the analysis of three groups of blood count and molecular analysis results. Since the RBC indices were similar in the three groups, especially MCV, MCH and MCHC, we analyzed the results of the three groups together and compared the results with results previously published by our group, including β thalassemia carriers and normal samples [31].
The results indicate that only three published formulas have relatively high sensitivity, 68.63% in Ricerca et al. [25], 85.54% in Shine &Lal [26] and our previously described SVM formula with a sensitivity of 99.33% [31]. The respective NPVs for these formulas is 96.83%, 98.83% and 99.93%. Two formulas used only the MCV and MCH values for calculation [24,29]. Ricerca et al [23] used the RDW and RBC values. MCV and MCH values only were also used by d'Onofrio et al. [21], the sensitivity was 100% but the NPV was 0. May be if the cutoff value will be changed this formula would also become reliable but we decided to compare the formulas using the same cutoff values that were used to detect β thalassemia as shown in Table 3. Bordbar et al. also used the MCV and MCH indices; however, when we applied this formula to our results, the NPV was high enough 93.72% but the sensitivity was only 21.46%, [18]. Most of the published formulas that used different combinations of indices, also had NPV above 90% but the sensitivity was below 60%.
We also calculated the 75th and 95th percentiles of the formulas’ results and compared them with the published cutoff for each formula (Table 3), our SVM formula passed the cutoff value for the 75th percentile but not the lower limit of the 95th percentile. None of the other formulas passed the cutoff value even for the 75th percentile, probably indicating that the cutoff is too high and some α thalassemia carriers might be missed. Recently Phirom et al described the use of machine learning in a small group of individuals with α thalassemia and show that the Convolutional Neural Networks (CNN) is superior to the SVM formula that we use, but the specificity of the SVM formula, the formula that we apply for our study is superior (81.23 % vs 84.94 %) while the accuracy in their work is similar for both (CNN 80.69 % vs SVM 80.68%) [35].
We decide to include in our analysis only women and results with Hgb > 9.0 gr/dl to obtain a more homogeneous population for more accurate data analysis. Only 38 results (0.17%) were excluded due to Hgb <9.0 gr/dl and all except two samples were in the "suspected α carrier group". The other two samples were in the normal molecular analysis group. In our opinion, excluding those samples did not affect the overall study results. Hgb level < 9 gr/dl may be due to IDA or even a combination of α carrier and IDA. Since the results analyzed in this study are a product of a massive screening program, iron status was not routinely analyzed.
The main differential diagnosis for microcytosis or hypochromia is of course iron deficiency, which could be present when the molecular analysis does not reveal alpha globin mutations. In all three groups of α thalassemia in the present study, 9.6% to 24.7% of the results can be indices suspicious for IDA, defined as RBC lower than 4.5 x 10⁹/dl and RDW above 14.5%. The higher percentage was from the group that did not undergo molecular analysis, which is reasonable. On the other hand, the low percentage of samples suspected to have IDA in the group with negative molecular analysis (11.5%) suggests that a mutation outside the α gene can produce characteristics of α thalassemia trait indices.
Indeed, some studies described that individuals with characteristics of α thalassemia carriers may have intact α globin genes that may be functionally inactive. In these cases, large deletions upstream of the α globin genes, in the locus control region can cause inactivation of both α1 and α2 globin genes [36,37,38].
Also, deletions of the major regulatory element of the α globin genes that is responsible for activating the α globin genes can inactivate the normal α globin genes. In those cases, the MCV values are similar to those of classical α thalassemia carriers. Fifteen such deletions were described [39].
Other defects, not located in the α genes, are Support nucleotide polymorphisms between the α-globin genes and the α gene regulatory element [39,40].
In summary, the fact that we did not find molecular defects in 6% of our molecularly analyzed samples did not preclude that they are not α thalassemia carriers. The similar RBC indices suggest that at least some might be α carriers.
We compared the RBC indices among the two most common genotypes in our study, -α3.7kb and IVS I-1(-5bp) (HBA2:c.95+2_95+6delTGAGG), (Table 4).
The values in the RBC indices were significantly different when we compared the one or two -α3.7kb deletions and in the IVS I-1(-5bp) genotypes, which were lower in the genotype with two deletions.
In a study from Iran that included 722 α thalassemia carriers, the same features were found, as carriers with two deletions in the -α3.7kb gene (334 individuals) had significantly lower MCV and/or MCH values when compared to subjects with one deletion (45 subjects). (MCV 76.8±5.02 fl vs. 72.7±4.55 fl respectively and for MCH 24.7±1.6 pg vs 22.46±1.73 pg, respectively) [41].
The α-3.7kb deletion is most prevalent in Mediterranean countries and in Africans. The Arab Bedouins in northern Israel probably of African origin which can explain the high incidence of this deletion found in the present study [42,43,44,45]. This is also the most common deletion found in Iran, in the heterozygous or homozygous form (41.4% and 11.6%, respectively) [12].
As described, α thalassemia carriers are considered healthy subjects, but they still have significant microcytosis and mild anemia, principally in the pediatric population [46].
In general, prenatal screening for detecting couples at risk of having a child with α thalassemia in one or the two clinical forms is not cost effective in countries outside of Asia, but in countries where screening programs for β thalassemia are implemented, including screening for α thalassemia did not add significant costs and the decision to perform molecular analysis should be chosen, depending on the partner’s blood count indices and on the most frequent α thalassemia gene defects in each country [47].
The cost effectiveness of α thalassemia screening has not been estimated. However, β thalassemia screening was proven to be cost effective [3].
For couples at risk of having an offspring with hydrops fetalis, genetic counseling should be offered, and the possible prenatal diagnosis discussed. Couples at risk of having an infant with Hgb H should be informed, but prenatal diagnosis is not indicated since usually the course of the disease is mild with stable hemolytic anemia, rarely requiring blood transfusions. Also, couples at risk of having an offspring with two mutations in the α gene should be informed since in the neonatal period those newborns may have hemolysis requiring blood transfusions.
In couples at risk of having a child with Hgb Taybe (α CD 39 – HBA:c.118-120delACC ) [33] or other severe α gene defects like Med or Poly A, hydrops fetalis can occur [48]. In those cases, genetic counseling and the option of prenatal diagnosis can be considered.
Based on our results incorporating one of the formulas that we found to be significant for detecting suspected to be α or β thalassemia carriers, in the program of the automatic analyzers, can flag the abnormal results and increase the awareness of primary physicians about the carrier risk, and if relevant, in cases of women of childbearing age, refer them for further analysis: HPLC for β thalassemia carriers and molecular analysis for α thalassemia carriers.
The major limitation of the present study is that iron status was not analyzed since the RBC indices and HPLC results were obtained as part of a very large-scale screening program for detecting carriers of hemoglobinopathies. Obviously, women with low Hgb and/or RBC counts are suspected to have at last IDA or a combination of IDA and thalassemia carrier, which is relatively frequent in pregnant women.
This study was conducted only on women of childbearing age, and we cannot conclude whether those formulas are applicable to males or children. Further studies are needed to validate the results on other populations. At a minimum, even if the first stage the formula is applied to this specific population only, it will be effective for population screening.
5. Conclusions
Using mathematical formulas, especially the new generation of artificial intelligence, represented in this study by the Support Vector Machine (SVM)-developed formula, can detect individuals suspicious for being α thalassemia carriers similar to the results of applying these formulas for detecting suspected β thalassemia carriers, as was demonstrated previously by our group [31].
This formula can and should be incorporated in the program of the automatic blood count analyzers to send an alert to the referring physician with a recommendation for further diagnostic tests, HPLC and molecular analysis in the case of α thalassemia. By doing this, a universal screening program can be implemented without added costs, and the subsequent analysis can avoid the birth of affected children in specific circumstances, in the case of α thalassemia.
After this suggestion is implemented, additional large data studies can be conducted, with subsequent reevaluation and correction of the SVM formula, if necessary.
Author Contributions
Conceptualization: I.L.-R. and A.K., Methodology: I.L.-R. and A.K., Software and Support Vector Machine formula: I.L.-R., Laboratory analysis (blood counts and HPLC): S.P., H.Z. and E.H., Molecular analysis: D.F., Statistics and Validation: I.L.-R. and L.L., Investigation: A.K. and C.L., Writing – Original Draft Preparation, A.K.; Writing – Review & Editing, I.L.-R., C.L. and A.K. All authors have read and agreed to the published version of the manuscript.
Funding
No funding was received for this study.
Acknowledgments
This paper is dedicated to the memory of Boaz Lachover, Idit Lachover Roth's first husband, who was killed in a cycling “hit and run” accident. Boaz developed the SVM formula which is the basis of the first paper “Detection of β thalassemia carriers by red cell parameters obtained from automatic counters using mathematical formulas” [31] and became the basis of this study and to Guy Koren who helped the authors after Boaz passed away.
Conflicts of Interest
All authors declare that they have no conflict of interest regarding this paper.
References
- Higgs, D.R. The Molecular Basis of -Thalassemia. Cold Spring Harb Perspect Med. 2013, 3, a011718–a011718. [Google Scholar] [CrossRef] [PubMed]
- Koren, A. The continuing global challenges of treating patients with beta-thalassemia. Br J Haematol. 2023, 201, 183–4. [Google Scholar] [CrossRef] [PubMed]
- Koren, A.; Profeta, L.; Zalman, L.; Palmor, H.; Levin, C.; Zamir, R.B.; et al. Prevention of β Thalassemia in Northern Israel - A cost-benefit analysis. Mediterr J Hematol Infect Dis. 2014, 6. [Google Scholar] [CrossRef] [PubMed]
- Musallam, K.M.; Lombard, L.; Kistler, K.D.; Arregui, M.; Gilroy, K.S.; Chamberlain, C.; et al. Epidemiology of clinically significant forms of alpha- and <scp>beta-thalassemia</scp> : A global map of evidence and gaps. Am J Hematol. 2023, 98, 1436–51. [Google Scholar] [PubMed]
- Koren, A.; Zalman, L.; Palmor, H.; Zarnir, R.B.; Levin, C.; Openheim, A.; et al. Sickle cell anemia in Northern Israel: Screening and prevention. Israel Medical Association Journal. 2009, 11. [Google Scholar]
- Koren, A.; Zalman, L.; Palmor, H.; Ekstein, E.; Schneour, Y.; Schneour, A.; et al. The prevention programs for beta thalassemia in the Jezreel and Eiron valleys: results of fifteen years experience. Harefuah. 2002, 141. [Google Scholar]
- Piel, F.B.; Weatherall, D.J. The α-Thalassemias. New England Journal of Medicine. 2014, 371, 1908–16. [Google Scholar] [CrossRef] [PubMed]
- Goh, L.P.W.; Chong, E.T.J.; Lee, P.C. Prevalence of Alpha(α)-Thalassemia in Southeast Asia (2010–2020): A Meta-Analysis Involving 83,674 Subjects. Int J Environ Res Public Health. 2020, 17, 7354. [Google Scholar] [CrossRef]
- Galanello, R.; Cao, A. Alpha-thalassemia. Genetics in Medicine. 2011, 13, 83–8. [Google Scholar] [CrossRef] [PubMed]
- Songdej, D.; Fucharoen, S. Alpha-Thalassemia: Diversity of Clinical Phenotypes and Update on the Treatment. Thalassemia Reports. 2022, 12, 157–72. [Google Scholar] [CrossRef]
- Dehbozorgian, J.; Moghadam, M.; Daryanoush, S.; Haghpanah, S.; Imani fard, J.; Aramesh, A.; et al. Distribution of alpha-thalassemia mutations in Iranian population. Hematology. 2015, 20, 359–62. [Google Scholar] [CrossRef] [PubMed]
- Keikhaei, B.; Slehi-fard, P.; Shariati, G.; Khosravi, A. Genetics of Iranian Alpha-Thalassemia Patients: A Comprehensive Original Study. Biochem Genet. 2018, 56, 506–21. [Google Scholar] [CrossRef] [PubMed]
- STEPHEN A. LIEBHABER, YUET WAI KAN. Differentiation of the mRNA Transcripts Originating from the al- and a2-Globin Loci in Normals and a-Thalassemics. J Clin Inwvest. 1981, 68, 439–46. [Google Scholar] [CrossRef] [PubMed]
- Oron, V.; Filon, D.; Oppenheim, A.; Rund, D. Severe thalassaemia intermedia caused by interaction of homozygosity for α-globin gene triplication with heterozygosity for β thalassaemia. Br J Haematol. 1994, 86, 377–9. [Google Scholar] [CrossRef] [PubMed]
- Amendolia, S.R.; Cossu, G.; Ganadu, M.L.; Golosio, B.; Masala, G.L.; Mura, G.M. A comparative study of K-Nearest Neighbour, Support Vector Machine and Multi-Layer Perceptron for Thalassemia screening. Chemometrics and Intelligent Laboratory Systems. 2003, 69, 13–20. [Google Scholar] [CrossRef]
- Getta, H.A.; Yasseen, H.A.; Said, H.M. Hi & Ha, are new indices in differentiation between Iron deficiency anemia and beta-Thalassaemia trait /A Study in Sulaimani City-Kurdistan/Iraq. Journal of Dental and Medical Sciences. 2015, 14, 67–72. [Google Scholar]
- Rahim, F.; Keikhaei, B. Better differential diagnosis of iron deficiency anemia from beta-thalassemia trait. Turk J Hematol. 2009, 26, 138–45. [Google Scholar]
- Bordbar, E.; Taghipour, M.; Zucconi, B.E. RELIABILITY OF DIFFERENT RBC INDICES AND FORMULAS IN DISCRIMINATING BETWEEN Β-THALASSEMIA MINOR AND OTHER CAUSES OF MICROCYTIC HYPOCHROMIC ANEMIA. Mediterr J Hematol Infect Dis. 2015, 7, e2015022. [Google Scholar] [CrossRef] [PubMed]
- Sirachainan, N.; Iamsirirak, P.; Charoenkwan, P.; Kadegasem, P.; Wongwerawattanakoon, P.; Sasanakul, W.; et al. New mathematical formula for differentiating thalassemia trait and iron deficiency anemia in thalassemia prevalent area: a study in healthy school-age children. Southeast Asian J Trop Med Public Health. 2014, 45, 174–82. [Google Scholar] [PubMed]
- Ehsani, M.A.; Shahgholi, E.; Rahimineja, M.S.; Seighali, F.; Rashidi, A. A New Index for Discrimination Between Iron Deficiency Anemia and Beta-Thalassemia Minor: Results in 284 Patients. Pakistan Journal of Biological Sciences. 2009, 12, 473–5. [Google Scholar]
- Sirdah, M.; Tarazi, I.; Al Najjar, E.; Al Haddad, R. Evaluation of the diagnostic reliability of different RBC indices and formulas in the differentiation of the beta-thalassaemia minor from iron deficiency in Palestinian population. Int J Lab Hematol. 2008, 30, 324–30. [Google Scholar] [CrossRef] [PubMed]
- Romero Artaza, J.; Carbia, C.D.; Ceballo, M.F.; Díaz, N.B. Red cell distribution width (RDW): its use in the characterization of microcytic and hypochromic anemias. Medicina (B Aires). 1999, 59, 17–22. [Google Scholar] [PubMed]
- d’Onofrio, G.; Zini, G.; Ricerca, B.M.; Mancini, S.; Mango, G. Automated measurement of red blood cell microcytosis and hypochromia in iron deficiency and beta-thalassemia trait. Arch Pathol Lab Med. 1992, 116, 84–9. [Google Scholar]
- Green, R.; King, R. A new red cell discriminant incorporating volume dispersion for differentiating iron deficiency anemia from thalassemia minor. Blood Cells. discussion 492-5.. 1989, 15, 481–91. [Google Scholar] [PubMed]
- Ricerca, B.M.; Storti, S.; d’Onofrio, G.; Mancini, S.; Vittori, M.; Campisi, S.; et al. Differentiation of iron deficiency from thalassaemia trait: a new approach. Haematologica. 1987, 72, 409–13. [Google Scholar] [PubMed]
- Shine, I.; Lal, S. A STRATEGY TO DETECT β-THALASSÆMIA MINOR. The Lancet. 1977, 309, 692–4. [Google Scholar] [CrossRef] [PubMed]
- Mentzer William, C. DIFFERENTIATION OF IRON DEFICIENCY FROM THALASSÆMIA TRAIT. The Lancet. 1973, 301, 882. [Google Scholar] [CrossRef] [PubMed]
- ENGLAND, J. DISCRIMINATION BETWEEN IRON-DEFICIENCY AND HETEROZYGOUS-THALASSqMIA SYNDROMES IN DIFFERENTIAL DIAGNOSIS OF MICROCYTOSIS. The Lancet. 1979, 313, 145–8. [Google Scholar] [CrossRef] [PubMed]
- England, J.M.; Fraser Patricia, M. DIFFERENTIATION OF IRON DEFICIENCY FROM THALASSÆMIA TRAIT BY ROUTINE BLOOD-COUNT. The Lancet. 1973, 301, 449–52. [Google Scholar] [CrossRef] [PubMed]
- Schriever Henry, G.; Srivastava, P.C. DIFFERENTIATION OF THALASSÆMIA MINOR FROM IRON DEFICIENCY. The Lancet. 1973, 302, 154–5. [Google Scholar] [CrossRef]
- Roth, I.L.; Lachover, B.; Koren, G.; Levin, C.; Zalman, L.; Koren, A. Detection of β-thalassemia carriers by red cell parameters obtained from automatic counters using mathematical formulas. Mediterr J Hematol Infect Dis. 2018, 10. [Google Scholar]
- Burges, C.J. A tutorial on support vector machines for pattern recognition. Data mining and knowledge discovery. 1998, 2, 121–67. [Google Scholar] [CrossRef]
- Koren, A.; Levin, C.; Zalman, L.; Palmor, H.; Filon, D.; Chubar, E.; et al. Hb TAYBE: clinical and morphological findings IN 43 patients. Eur J Haematol. 2016, 97. [Google Scholar] [CrossRef] [PubMed]
- Koren, A. The continuing global challenges of treating patients with beta-thalassemia. Br J Haematol. 2023. [CrossRef] [PubMed]
- Phirom, K.; Charoenkwan, P.; Shoombuatong, W.; Charoenkwan, P.; Sirichotiyakul, S.; Tongsong, T. DeepThal: A Deep Learning-Based Framework for the Large-Scale Prediction of the α+-Thalassemia Trait Using Red Blood Cell Parameters. J Clin Med. 2022, 11, 6305. [Google Scholar] [CrossRef] [PubMed]
- Hatton, C.; Wilkie, A.; Drysdale, H.; Wood, W.; Vickers, M.; Sharpe, J.; et al. Alpha-thalassemia caused by a large (62 kb) deletion upstream of the human alpha globin gene cluster. Blood. 1990, 76, 221–7. [Google Scholar] [CrossRef] [PubMed]
- Liebhaber, S.A.; Griese, E.U.; Weiss, I.; Cash, F.E.; Ayyub, H.; Higgs, D.R.; et al. Inactivation of human alpha-globin gene expression by a de novo deletion located upstream of the alpha-globin gene cluster. Proceedings of the National Academy of Sciences. 1990, 87, 9431–5. [Google Scholar] [CrossRef] [PubMed]
- Wilkie, A.O.M.; Lamb, J.; Harris, P.C.; Finney, R.D.; Higgs, D.R. A truncated human chromosome 16 associated with α thalassaemia is stabilized by addition of telomeric repeat (TTAGGG)n. Nature. 1990, 346, 868–71. [Google Scholar] [CrossRef] [PubMed]
- Ribeiro, D.M.; Sonati, M.F. . Regulation of human alpha-globin gene expression and alpha-thalassemia. Genet Mol Res. 2008, 7, 1045–53. [Google Scholar] [CrossRef] [PubMed]
- De Gobbi, M.; Viprakasit, V.; Hughes, J.R.; Fisher, C.; Buckle, V.J.; Ayyub, H.; et al. A Regulatory SNP Causes a Human Genetic Disease by Creating a New Transcriptional Promoter. Science (1979). 2006, 312, 1215–7. [Google Scholar] [CrossRef] [PubMed]
- Akhavan-Niaki, H.; Youssefi Kamangari, R.; Banihashemi, A.; Kholghi Oskooei, V.; Azizi, M.; Tamaddoni, A.; et al. Hematologic features of alpha thalassemia carriers. Int J Mol Cell Med. 2012, 1, 162–7. [Google Scholar] [PubMed]
- Oron-Karni, V.; Filon, D.; Shifrin, Y.; Fried, E.; Pogrebijsky, G.; Oppenheim, A.; et al. Diversity of ?-globin mutations and clinical presentation of ?-thalassemia in Israel. Am J Hematol. 2000, 65, 196–203. [Google Scholar] [CrossRef] [PubMed]
- Shaulov, A.; Filon, D.; Rund, D. Haplotype analysis of α-thalassemia chromosomes reveals heterogeneity and multiple founders in Ashkenazi Jews. Eur J Med Genet. 2016, 59, 555–8. [Google Scholar] [CrossRef] [PubMed]
- Kattamis, A.C.; Camaschella, C.; Sivera, P.; Surrey, S.; Fortina, P. Human α-Thalassemia syndromes: Detection of molecular defects. Am J Hematol. 1996, 53, 81–91. [Google Scholar] [CrossRef]
- Embury, S.H.; Miller, J.A.; Dozy, A.M.; Kan, Y.W.; Chan, V.; Todd, D. Two different molecular organizations account for the single alpha-globin gene of the alpha-thalassemia-2 genotype. Journal of Clinical Investigation. 1980, 66, 1319–25. [Google Scholar] [CrossRef] [PubMed]
- Gilad, O.; Steinberg-Shemer, O.; Dgany, O.; Krasnov, T.; Noy-Lotan, S.; Tamary, H.; et al. Alpha-Thalassemia Carrier due to –α<sup>3.7</sup> Deletion: Not So Silent. Acta Haematol. 2020, 143, 432–7. [Google Scholar] [CrossRef] [PubMed]
- Singer, S.T. Variable Clinical Phenotypes of α-Thalassemia Syndromes. The Scientific World JOURNAL. 2009, 9, 615–25. [Google Scholar] [CrossRef] [PubMed]
- Arnon, S.; Tamary, H.; Dgany, O.; Litmanovitz, I.; Regev, R.; Bauer, S.; et al. Hydrops fetalis associated with homozygosity for hemoglobin Taybe (α 38/39 THR deletion) in newborn triplets. Am J Hematol. 2004, 76, 263–6. [Google Scholar] [CrossRef] [PubMed]
- England, J.M.; Fraser Patricia, M. DIFFERENTIATION OF IRON DEFICIENCY FROM THALASSÆMIA TRAIT BY ROUTINE BLOOD-COUNT. The Lancet. 1973, 301, 449–52. [Google Scholar] [CrossRef]

Table 1.
Data from Non β thalassemia trait subjects, β thalassemia trait and suspected α thalassemia trait.
Table 1.
Data from Non β thalassemia trait subjects, β thalassemia trait and suspected α thalassemia trait.
| Diagnosis | Non β thalassemia trait Mean ± SD (range) |
β thalassemia trait Mean ± SD (range) |
α thalassemia trait and/or suspected α trait Mean ± SD (range) |
p value between α and β trait |
|---|---|---|---|---|
| Number of individuals (%) | 18572 (81.3) | 2936 (12.8) | 1334 (5.9) | |
| RBC (x 109/dl) | 4.2 ± 0.43 (2.17 – 7.67) | 5.42 ± 0.55 (3.21 – 7.81) |
4.87 ± 0.44 (3.48 – 6.34) |
<0.001 |
| Hgb (g/dl) | 11.75 ± 1.06 (9.00 – 19.2) |
10.65 ± 0.95 (9.00 – 15.4) |
11.51 ± 1.07 (9.0 – 15.6) |
<0.001 |
| MCV (fl) | 85.9 ± 6.84 (34 – 125.9) |
63.14 ± 5.76 (48 – 91.5) |
73.56 ± 4.52 (53.3 – 91.4) |
<0.001 |
| MCH (pg) | 28.16 ± 2.7 (16.2 – 40.7) |
19.71 ± 1.95 (14 – 31.3) |
23.71 ± 1.92 (16.5 – 29.9) |
<0.001 |
| MCHC (g/dl) | 32.75 ± 1.76 (12.6 – 45.7) |
31.23 ± 1.73 (17.5 – 65) |
32.17 ± 1.68 (19.2 – 36.2) |
<0.001 |
| RDW (%) | 14.96 ± 2.02 (10.1 – 36.4) |
16.39 ± 2.71 (12 – 22.8) |
15.16 ± 1.94 (12.1 – 28) |
<0.001 |
| Hgb F (%) | 0.34 ± 0.61 (0. – 14) |
2.12 ± 2.67 (0 – 38) |
0.4 ± 0.29 (0.1 – 1.9) |
<0.001 |
| Hgb A2 (%) | 1.12 ± 1.38 (0 – 3.4) |
5.6 ± 0.8 (3.5 – 8.8) |
2.6 ± 0.26 (2 – 3.3) |
<0.001 |
SD: standard deviation; RBC: red blood cells count; Hgb: hemoglobin; MCV: mean corpuscular volume; MCH: mean corpuscular hemoglobin; MCHC: mean corpuscular hemoglobin concentration; RDW: red density width; Hgb F: fetal hemoglobin; Hgb A2: hemoglobin A2.
Table 2.
Data from α thalassemia trait with proven genetic defect, suspected α thalassemia trait not molecularly analyzed and suspected α thalassemia trait with normal molecular analysis.
Table 2.
Data from α thalassemia trait with proven genetic defect, suspected α thalassemia trait not molecularly analyzed and suspected α thalassemia trait with normal molecular analysis.
| Diagnosis | α thalassemia trait + mutation Mean ± SD (range) |
α thalassemia trait suspected Mean ± SD (range) |
α thalassemia trait normal sequence Mean ± SD (range) |
p value |
|---|---|---|---|---|
| Number of individuals (%) | 291 (21.8 %) | 962 (72.12%) | 81 (6.07 %) | |
| RBC (x 109/dl) | 4.93 ± 0.46 (3.79 – 6.34) |
4.87 ± 0.43 (3.48 – 6.27) |
4.67 ± 0.36 (3.7 – 5.69) |
<0.001 |
| Hgb (g/dl) | 11.58 ± 0.97 (9.0 – 14.8) |
11.51 ± 1.1 (9.0 – 15.6) |
11.39 ± 0.93 (9.1 – 13.5) |
NS |
| MCV (fl) | 72.95 ± 5.17 (53.3 – 83.9) |
73.55 ± 4.25 (57.8 – 91.4) |
75.1 ± 4.07 (62.2 – 85) |
NS |
| MCH (pg) | 23.61 ± 2.1 (16.5 – 27.1) |
23.66 ± 1.84 (16.5 – 29.9) |
24.43 ± 1.81 (18.3 – 28.6) |
NS |
| MCHC (g/dl) | 32.26 ± 1.72 (19.2 – 36.10) |
32.15 ± 1.33 (25.9 – 36.2) |
32.51 ± 1.38 (29.4 – 35.5) |
NS |
| RDW (%) | 14.91 ± 1.8 (12.3 – 23.4) |
15.19 ± 1.87 (12.1 – 28.0) |
15.89 ± 2.35 (12.9 – 26.5) |
0.004 |
| Hgb F (%) | 0.5 ± 0.52 (0.1 – 7.3) |
0.4 ± 0.29 (0.1 – 1.9) |
0.4 ± 0.34 (0 – 5.1) |
NS |
| Hgb A2 (%) | 2.6 ± 0.29 (1.3 – 3.6) |
2.6 ± 0.26 (2 – 3.3) |
2.6 ± 0.27 (0.8 – 3.3) |
NS |
SD: Standard deviation; RBC: red blood cells count; Hgb: hemoglobin; MCV: mean corpuscular volume; MCH: mean corpuscular hemoglobin; MCHC: mean corpuscular hemoglobin concentration; RDW: red density width; Hgb F: fetal hemoglobin; Hgb A2: hemoglobin A2.
Table 3.
Analysis of the results of applying published mathematical formulas to our suspected α thalassemia carriers results. The published cutoff for β thalassemia was used.
Table 3.
Analysis of the results of applying published mathematical formulas to our suspected α thalassemia carriers results. The published cutoff for β thalassemia was used.
| No. | Study (Reference) |
Formula | βThal cut-off | α thal PPV | α thal NPV | α thal specificity | α thal sensitivity | Percentile 75% | Percentile 95% (lower limit) |
|---|---|---|---|---|---|---|---|---|---|
| 1 | Srivastava [30] | MCH/RBC | <3.8 | 39.39 | 93.59 | 99.35 | 5.82 | 5.38 | 6.04 (5.97) |
| 2 | 1) England & Fraser – 1973 [49] 2)England & Fraser - 1979 [28] |
MCV-RBC-(5-Hb)-K* | <0 | 0.87 | 93.10 | 97.53 | 0.3 | 70.29 | 73.37 (72.96) |
| 3 | Mentzer [27] | MCV/RBC | <13 | 45.72 | 93.94 | 99.01 | 11.57 | 16.45 | 18.24 (18.09) |
| 4 | Shine & Lal [26] | MCV2 x MCH/100 | <1530 | 34.42 | 98.83 | 88.22 | 85.54 | 1466.58 | 1626.52 (1607.81) |
| 5 | Ricerca et al. [25] | RDW/RBC | <3.3 | 13.66 | 96.83 | 68.81 | 68.63 | 3.38 | 4.01 (3.95) |
| 6 | Green & King [24] | MCV2 x RDW/(Hb x 100) | <65 | 58.45 | 95.15 | 98.44 | 30.47 | 78.26 | 92.63 (90.12) |
| 7 | D’Onofrio et al. [23] | MCV / MCH | >0.9 | 6.74 | 0 | 0 | 100 | 3.18 | 3.34 (3.33) |
| 8 | Romero Artaza et al. [22] | RDW x MCV / RBC | <220 | 53.65 | 95.86 | 97.4 | 41.64 | 251.18 | 290.99 (285.58) |
| 9 | Sirdah et al. [21] | MCV-RBC-(3XHb) | <27 | 56.63 | 93.69 | 99.55 | 7.15 | 37.19 | 41.73 (41.11) |
| 10 | Ehsani et al. [20] | MCV-(10 x RBC) | <15 | 45.45 | 93.86 | 99.1 | 10.42 | 29.8 | 35.4 (34.8) |
| 11 | Sirachainan et al. [19] | 1.5 x Hb–0.05 x MCV | <14 | 6.08 | 91.95 | 32.69 | 60.39 | 14.58 | 16.01 (15.85) |
| 12 | Bordbar et al. [18] | [80-MCV]*[27-MCH] | >44.76 | 9.17 | 93.72 | 84.63 | 21.46 | 37.8 | 101.32 (93.44) |
| 13 | Rahim & Keikhaei [17] | HbxRDWx100 / RBC2 x MCHC | <21 | 63.44 | 95.2 | 98.72 | 30.89 | 25.14 | 29.3 (28.66) |
| 14 | Hisham index [16] | MCH x RDW / RBC | <67 | 55.85 | 94.99 | 98.4 | 28.13 | 80.87 | 94.52 (92.59) |
| 15 | Hameed index [16] | MCH x Hct x RDW / (RBC x Hb)2 | <220 | 6.73 | 0 | 0 | 100 | 4.99 | 6.52 (6.35) |
| 16 | Amendolia et al. – SVM [15] | SVM - (RBC, Hgb, Hct, MCV) | 98.75 | 13.59 | 98.99 | 57.99 | 1.65 | 1.81 (1.79) | |
| 17 | SVM [31] | SVM (MCV and MCH) (Fig 1) | <0 | 21.52 | 99.93 | 73.67 | 99.33 | -0.23 | 0.29 (0.22) |
RBC: Red Blood Cells count; Hgb: hemoglobin; MCV: mean corpuscular volume; MCH: mean corpuscular hemoglobin; MCHC: mean corpuscular hemoglobin concentration; RDW: red density width; βThal: β thalassemia; α thal: α thalassemia; PPV: positive predictive value; NPV: negative predictive value; SVM: Support Vector Machine.
Table 4.
Comparison of red blood cell count characteristics in the two most common deletions.
| α globin genetics | αα/-α3.7kb | -α3.7kb/-α3.7kb | P* | αIVS I-1 /αα | αIVS I-1 / αIVS I-1 | P** | αIVS I-1 / -α3.7kb |
|---|---|---|---|---|---|---|---|
| Number of individuals (%) | 134 | 24 | 97 | 8 | 7 | ||
| RBC (x 109/dl) | 4.8 ± 0.4 (6.16 – 3.79) |
5.3 ± 0.49 (4.37 – 6.21) |
<0.001 | 4.9 ± 0.36 (4.1 – 6.1) |
5.4 ± 0.57 (4.52 – 5.96) |
0.002 | 5.5 ± 0.56 (4.72 – 6.14) |
| Hgb (g/dl) | 11.6 ± 0.96 (9.1 – 14.2) |
11.2 ± 1.01 (9.0– 13.3) |
NS | 11.8 ± 0.88 (9.4 – 14.8) |
10.5 ± 1.19 (9.0 – 11.7) |
<0.001 | 11.1 ± 0.66 (10.3 – 11.8) |
| MCV (fl) | 74.4 ± 4.35 (59 – 83.9) |
68.7 ±5.6 (58.7–77.1) |
<0.001 | 73.7 ± 4.36 (53.3– 82.2) |
64.9 ± 4.66 (59.1 – 73.6) |
<0.001 | 63.3 ± 1.41 (61.8 – 65.2) |
| MCH (pg) | 24.3 ± 1.75 (18 – 27.1) |
21.8 ± 2.11 (17.1 – 24.6) |
<0.001 | 23.9 ± 1.63 (16.5– 26.5) |
19.5 ± 2.15 (17.9 – 24.7) |
<0.001 | 20.2 ± 0.96 (19.2 – 21.9) |
| MCHC (g/dl) | 32.6 ± 1.18 (29.7 – 36.1) |
31.7 ± 1.52 (29.2 – 34.4) |
<0.001 | 32.4 ± 1.2 (28.9– 35.7) |
30.0 ± 2.2 (25.5 – 33.5) |
<0.001 | 28.7 ± 6.66 (19.2 – 35.4) |
| RDW (%) | 14.8 ± 1.65 (12.5 – 21.7) |
15.5 ± 2.56 (13.3 – 23.4) |
NS | 14.4 ± 1.29 (12.3– 20.1) |
16.3 ± 2.35 (12.6 – 20.5) |
0.001 | 18.8 ± 2.64 (16.5 – 22.6) |
| Hgb F (%) | 0.5 ± 0.67 (0.1 – 7.3) |
0.4 ± 0.38 (0.2 – 1.6) |
NS | 0.5 ± 0.35 (0.1 – 1.8) |
0.6 ± 0.26 (0.3 – 1.1) |
NS | 0.5 ± 0.46 (0.2 – 1.1) |
| Hgb A2 (%) | 2.7 ± 0.26 (1.7 – 3.6) |
2.6 ± 0.19 (2.2 – 2.9) |
0.09 | 2.7 ± 0.3 (1.6 – 3.1) |
2.3 ± 0.3 (1.7 – 2.7) |
0.002 | 2.8 ± 0.15 (2.5 – 2.9) |
SD: standard deviation; RBC: red blood cells count; Hgb: hemoglobin; MCV: mean corpuscular volume; MCH: mean corpuscular hemoglobin; MCHC: mean corpuscular hemoglobin concentration; RDW: red density width; Hgb F: fetal hemoglobin; Hgb A2: hemoglobin A2. -α3.7: -α3.7 deletion in the α gene; αIVS I-1 (-5bp) in α2 gene. P (*) - Comparison between αα/-α3.7kb and -α3.7kb/-α3.7kb. P (**) - Comparison between αIVS I-1 (-5bp) /αα and αIVS I-1(-5bp) / αIVS I-1 (-5bp). -α3.7kb vs IVS I-1 (-5bp) – RBC p=0.002 – all the other parameters NS. -α3.7 kb/-α3.7 kb vs αIVS I-1 (-5bp) /αIVS I-1 (-5bp) p 0.014 for MCH and p0.027 for MCHC. All the other parameters NS. -α3.7 kb/ αIVS I-1 (-5bp) vs. αIVS I-1 (-5bp) / αIVS I-1 (-5bp) – Hgb A2 p=0.005. The other indices NS.
Disclaimer/Publisher’s Note: The statements, opinions and data contained in all publications are solely those of the individual author(s) and contributor(s) and not of MDPI and/or the editor(s). MDPI and/or the editor(s) disclaim responsibility for any injury to people or property resulting from any ideas, methods, instructions or products referred to in the content. |
© 2024 by the authors. Licensee MDPI, Basel, Switzerland. This article is an open access article distributed under the terms and conditions of the Creative Commons Attribution (CC BY) license (http://creativecommons.org/licenses/by/4.0/).
Copyright: This open access article is published under a Creative Commons CC BY 4.0 license, which permit the free download, distribution, and reuse, provided that the author and preprint are cited in any reuse.


