Preprint
Article

Comparative Analysis on the Mechanical Properties, Transportation Cost, and Carbon Footprint Emission of Cement Mortar with PE and SSRS as Partial Replacement for Aggregates

Altmetrics

Downloads

84

Views

40

Comments

0

A peer-reviewed article of this preprint also exists.

Submitted:

09 April 2024

Posted:

10 April 2024

You are already at the latest version

Alerts
Abstract
This study presents an innovative approach for the utilization of industrial by-products and municipal waste in the production of sustainable and environmentally friendly cement mortar. We explored stabilized stainless-steel reduced slag (SSRS) and polyethylene (PE) plastic waste as partial replacements for aggregates. Various engineering properties of the resulting cement mortar specimens, including slump, slump flow, compressive strength, flexural strength, tensile strength, water absorption, and ultrasonic pulse velocity (UPV), were investigated through comprehensive experimental tests. The influence of different water-cement (w/c) ratios and substitution amounts on the engineering properties of the cement mortar samples was thoroughly examined. The findings revealed that an increase in PE substitution adversely affected the overall workability of the cement mortar mixtures, whereas an increase in SSRS amount contributed to enhanced workability. As for the hardened properties, a consistent trend was observed for both cases, with higher w/c ratios and substitution amounts leading to reduced mechanical properties. Water absorption and UPV test results validated the increased formation of porosity with higher w/c ratios and substitution amounts. This study proposes a promising method to effectively repurpose industrial by-products and municipal wastes, transforming them into sustainable construction and building materials. Additionally, a comparative analysis of transportation costs and carbon footprint emissions between SSRS-cement mortar and PE-cement mortar was conducted to assess their environmental impact and sustainability. Generally, higher w/c ratios and replacement levels corresponded to reduced carbon footprint. The geographical location of the source of SSRS and PE remains a challenge and studies to overcome this challenge must be further explored.
Keywords: 
Subject: Engineering  -   Civil Engineering

1. Introduction

According to the United States Geological Survey, global cement production slightly increased from 4.2 billion tons in 2020 to 4.4 billion tons in 2021 due to the expected economic recovery following the COVID-19 pandemic [1]. As a major component of concrete, considered the most widely used construction material, cement production is predicted to rise due to the growth in urban expansion, and by 2050, there will be an additional 45% of cement produced [2]. The manufacturing of cement utilizes a huge amount of energy and raw materials, which has a significant impact on the amount of greenhouse gases and other dangerous pollutants that are released into the environment [3]. According to the World Energy Outlook Report in 2014, the cement industry consumes about 7% of the total industrial energy consumption and ranks second in terms of industrial CO2 emission, which comprises about 7% of the global CO2 emissions [4]. To address these issues, various agricultural, industrial, and municipal waste materials such as plastic wastes, stainless steel slag, fly ash, and wood ash [6], as supplementary cementitious material (SCM) or partial replacement for aggregate in concrete products have been the subject of recent studies [7,8,9]. This approach provides several advantages such as (1) reduction of CO2 emission, (2) lower requirement for mining of natural resources, (3) reintroduction of wastes into the economy, and (4) reduced overall cost of cement production [10,11].
For every three tons of stainless steel produced, approximately one ton of stainless-steel slag is produced, which can be categorized as stainless-steel oxidizing slag (SSOS) or SSRS [12]. In Taiwan, approximately 20 million tons of waste are generated annually, approximately 40% of which is slag from the steelmaking industry [13]. The accumulation of stainless-steel slag in the landfill creates serious environmental concerns since it contains several toxic mineral compositions such as chromium, nickel, lead, and cadmium [12,14]. Stainless steel slag contains similar mineral composition to ordinary Portland cement such as C2S, C3S, C2F, and C4AF [15]. Therefore, it has cementitious properties and can be utilized as a substitute for fine aggregates or partial replacement for cement in various concrete products [15]. One major drawback of incorporating stainless steel slag is the volume instability under extreme conditions due to the phase transformation of the expansible free magnesia (f-MgO) and free lime (f-CaO), which causes expansion and cracks [7,16]. Therefore, it is necessary to stabilize stainless steel slag before using it to avoid undesirable volume expansion [17].
Meanwhile, the buildup of plastic garbage in the environment has become an increasingly serious environmental problem in recent years. Plastic packaging for food and beverages accounts for nearly 60% of global plastic consumption [18] and about 95% of these are considered single-use plastics [19]. In Taiwan, the composition of plastic waste in the annual municipal solid waste generated has been continually increasing from 16.61% in 2016 to 20.20% in 2020 [20]. Having the second highest convenience store density in the world (one convenience store in 2,058 people) [21], the accumulation of single-use plastic waste in the environment has remained a challenge for Taiwan in recent years. Furthermore, the COVID-19 pandemic also played an important role in the increased plastic waste generation due to the need to wrap various articles with plastic [22] and dependence on food delivery services due to mobility restrictions [23,24]. The global recycling rate remains low at around 9% only, while 79% ends up in landfills and 12% in incinerators [25]. Because of this, experts are looking at various strategies to boost recycling rates even further and recover value from these plastic wastes by repurposing them into valuable goods.
Polyethylene (PE), which could be in the form of low-density polyethylene (LDPE) and high-density polyethylene (HDPE), is widely used as food and beverage packaging material due to its excellent gas and moisture barrier [26]. LDPE is used in plates, spoons, and bread bags while HDPE is widely used as an inner layer for cartons of beverages such as soup, juices, and milk [26,27]. Several studies have already examined the use of plastic wastes as a partial substitute for fine and coarse aggregates in concrete and cement mortar products [28,29,30]. However, not many studies have been published on utilizing PE from single-use food container wastes specifically found in Taiwan as a partial substitution for aggregates in cementitious materials.
The main objectives of this study are:
(1) To evaluate the performance of sustainable concrete incorporated with SSRS and PE wastes derived from single-use food containers found in Taiwan in terms of the fresh, hardened, and durability properties,
(2) To examine the cost-effectiveness of cement mortar production using SSRS and PE as sustainable building materials, and
(3) To conduct a comparative analysis of the carbon footprint emission of the SSRS and PE cement mortar.

2. Materials and Experimental Methods

2.1. Fabrication of SSRS Cement Mortar Specimens

2.1.1. Materials

This study used the following materials to fabricate experimental cement mortars with SSRS partially replacing the aggregate: Portland cement, water, fly ash, ground granular blast furnace slag (GGBFS), and fine aggregate. The properties of these materials are described below:
Cement: Portland I Cement from Taiwan Cement Co., Ltd., was utilized. The cement conforms to ASTM C150 specifications and possesses a specific gravity of 3.15 and a fineness of 3450 cm2/g.
Fly ash: Fly ash from Taiwan Electric Power Yishixingda Thermal Power Plant was employed. The fly ash meets the specifications outlined in ASTM C618.
Ground-granulated blast-furnace slag (GGBFS): The GGBFS used in this study was sourced from China's Iron and Steel Corporation. The water-quenched hearthstone powder exhibits a specific gravity of 2.90 and a fineness of 4000 cm2/g.
Stabilized stainless-steel Reduced Slag (SSRS): The SSRS utilized in this research is an industrial byproduct created during the smelting of scrap steel and residual iron in a steel mill with an electric arc furnace and reduction. The stabilized SSRS was milled into a fine powder with a specific gravity of 3.10 and a fineness of 4000 cm2/g.

2.1.2. Test Mix Proportions and Variables for SSRS-Substituted Cement Mortar

From previous studies, the recommended cement replacement amount of waste materials with pozzolanic properties ranges from 30 to 40% [31,32]. A fixed proportion of Portland material (10% fly ash, 20% slag powder) was used, while different amounts of SSRS were used to replace cement (0%, 5%, 10%). The cement mortar was mixed at three different water-cement (w/c) ratios of 0.4, 0.5, and 0.6. The samples were prepared in accordance with ASTM C192 and solidified at room temperature (23.2 °C) in saturated lime water. To determine the effect of different w/c ratios and SSRS substitution amounts, engineering properties were tested at different curing ages (3, 7, 28, 56, and 91 days). The various mix proportions are summarized in Table 1.

2.2. Fabrication of PE Cement Mortar Specimens

2.2.1. Materials

For the PE-substituted cement mortar, the following materials were used in this study: Portland cement, water, fine aggregates, and PE plastic aggregates. The material description is as follows:
Cement: Portland I Cement from Taiwan Cement Co., Ltd., was utilized. The cement adheres to ASTM C150 specifications and possesses a specific gravity of 3.15 and a fineness of 3450 cm2/g.
Fine aggregates: The fine aggregates used in the study were sourced from the Gaoping River's sand. The saturated surface dry density is 2.68, and the water absorption rate is 2.0%.
PE plastic aggregates: The PE plastic aggregates were obtained from single-use food container wastes, which underwent processing at a recycling facility to be utilized as partial replacements for aggregates in the cement mortar.

2.2.2. Test Mix Proportions and Variables for PE-Substituted Cement Mortar

The replacement amounts for PE were 0%, 1%, 2%, 3%, and 4%; the w/c ratios used were 0.4, 0.5, and 0.6, which are made into a 50 mm×50 mm×50 mm test cube and cured in saturated limewater. The cement mortar mix proportions are shown in Table 2.

2.3. Test Methods for the Evaluation of Mechanical Properties of Cement Mortar

The fresh properties, slump, and flow, of the various cement mortar samples were determined using ASTM C143. The mechanical properties, compressive strength, flexural strength, and tensile strength were tested at curing ages of 3, 7, 28, 56, and 91 days by ASTM C109, ASTM C348, and ASTM C190, respectively. The water absorption test was conducted following ASTM C1585. Meanwhile, ultrasonic pulse velocity (UPV) was tested using ASTM C597. Table 3 summarizes the test and the standard method used in this study.

2.4. Direct Cost Comparison and Cost-Benefit Analysis

To evaluate the sustainability of fabricating cement mortar with SSRS and PE as partial replacements for aggregates, a direct cost comparison was conducted to assess transportation expenses. Given the necessity to transport SSRS and PE from various locations in Taiwan to the plastic concrete manufacturer, a comparison was made regarding the incurred transportation costs. This analysis aimed to determine the most cost-effective and sustainable combination of SSRS and PE sources for the production of SSRS and PE-substituted aggregates of cement mortar in the long term.
The study considered the following SSRS and PE providers, along with concrete and plastic concrete:
Table 4. List of stainless-steel slag providers, concrete pavement manufacturers, single-use plastic providers, and plastic pavement manufacturers.
Manufacturer/Provider Address Province/County Remarks
Tang Rong Iron Works Co., Ltd. No. 4, Coastal 2nd Road, Xiaogang District, Kaohsiung City Kaohsiung SSRS provider
Yelian Iron and Steel Co., Ltd. No. 600, Xinglong Street, Gangshan District, Kaohsiung City Kaohsiung SSRS provider
Walsin Lihwa Co., Ltd. No. 3-10, Neighborhood 12, Xizhouliao 12, Xishuili, Yanshui District, Tainan City Tainan SSRS provider
Ronggang Material Technology Co., Ltd. No. 35, Xinzhong Road, Xinying District, Tainan City Tainan SSRS provider
Shin Feng Concrete Co., ltd. No. 779, Dachang Road, Wandan Township, Pingtung County Pingtung Concrete pavement manufacturer
Tianjiu Industrial Co., Ltd. No. 12-39, Shangjiaji, Houbi District, Tainan City Tainan Concrete pavement manufacturer
Tai Fu Cement Products Co., Ltd. Changhua 1 and 2 plants: No. 52-1, Xinggong Road, Shengang Township, Changhua County (Quanxing Industrial Zone) Changhua Concrete pavement manufacturer
Yama Development Co., Ltd. No. 5 Industrial North 1st Road, Nantou City, Nantou County Nantou Concrete pavement manufacturer
Shangmei Industrial Co., Ltd. 80-15, Adjacent to Dadongkeng 80, Dongpingli, Guanxi Town, Hsinchu County Hsinchu Concrete pavement manufacturer
Zhenglong Co., Ltd. 300 Section 2, Changqing Road, Zhubei, Hsinchu County Hsinchu Single-use plastic provider
Aplus Molds & Plastics Co., Ltd. 63 Lane 350 Chong Jeng Road, Yongkang District, Tainan City Tainan Plastic pavement manufacturer

2.5. Carbon Footprint Emission Calculations

In this section, the carbon footprint emission of the SSRS and PE cement mortar was estimated based on the study conducted by Jimenez et al. [33]. Carbon footprint emissions, which include total cement, aggregates, and other emissions from the use of water, diesel, etc. were calculated using the following equation:
C O 2 e = ( Q 1 F 1 + Q 2 F 2 + + Q n F n )
where Q corresponds to the material quantity or input used and F represents the emission factor to produce 1 m3 of concrete. In this study, the emission factors were obtained from field data and data from various inventories in accordance with ISO 14064-1. Table 5, as referenced in the study by Jimenez et al. lists the emission factors of the materials considered in this study.

3. Results and Discussion

3.1. Mechanical Properties (Fresh & Hardened)

3.1.1. Slump

Figure 1a depicts the slump of cement mortar samples with various w/c ratios and PE substitution levels. With w/c ratios of 0.4, 0.5, and 0.6, an increasing trend on the slump was recorded on the control samples (0% PE) with 0.3 cm, 2.5 cm, and 2.6 cm, respectively. Cement mortar samples with various PE replacement amounts (1% to 4%) showed a similar pattern. The measured slump values increased as the w/c ratio increased indicating enhanced workability. The slump values, however, decreased by about 28% to 62.5% when the PE amount was raised from 0% to 4%. Therefore, increasing the PE substitution amount in the cement mortar mixture reduced the overall workability. The sharp edges and angular size of PE aggregates in comparison to natural aggregates were responsible for the declining trend in the slump, which is consistent with previous studies [38,39,40].
The measured slump on the cement mortar is shown in Figure 1b for various w/c ratios and SSRS substitution amounts. With w/c ratios of 0.4, 0.5, and 0.6, the measured slump for the control samples (0% SSRS) were 0.6 cm, 2.3 cm, and 3.2 cm, respectively. Similarly, an increasing trend in the slump values was also observed when the SSRS amount was increased to 5% and 10%. The slump increased by 9% and 22% for the 5% SSRS and 10% SSRS substitution amount, respectively. In contrast with PE plastic waste aggregate, increasing the SRSS resulted in enhanced overall workability. Previous studies have attributed this trend to the smoother surface of SSRS compared to plastic waste aggregates, which are often angular and irregular in shape and size [41].

3.1.2. Flow

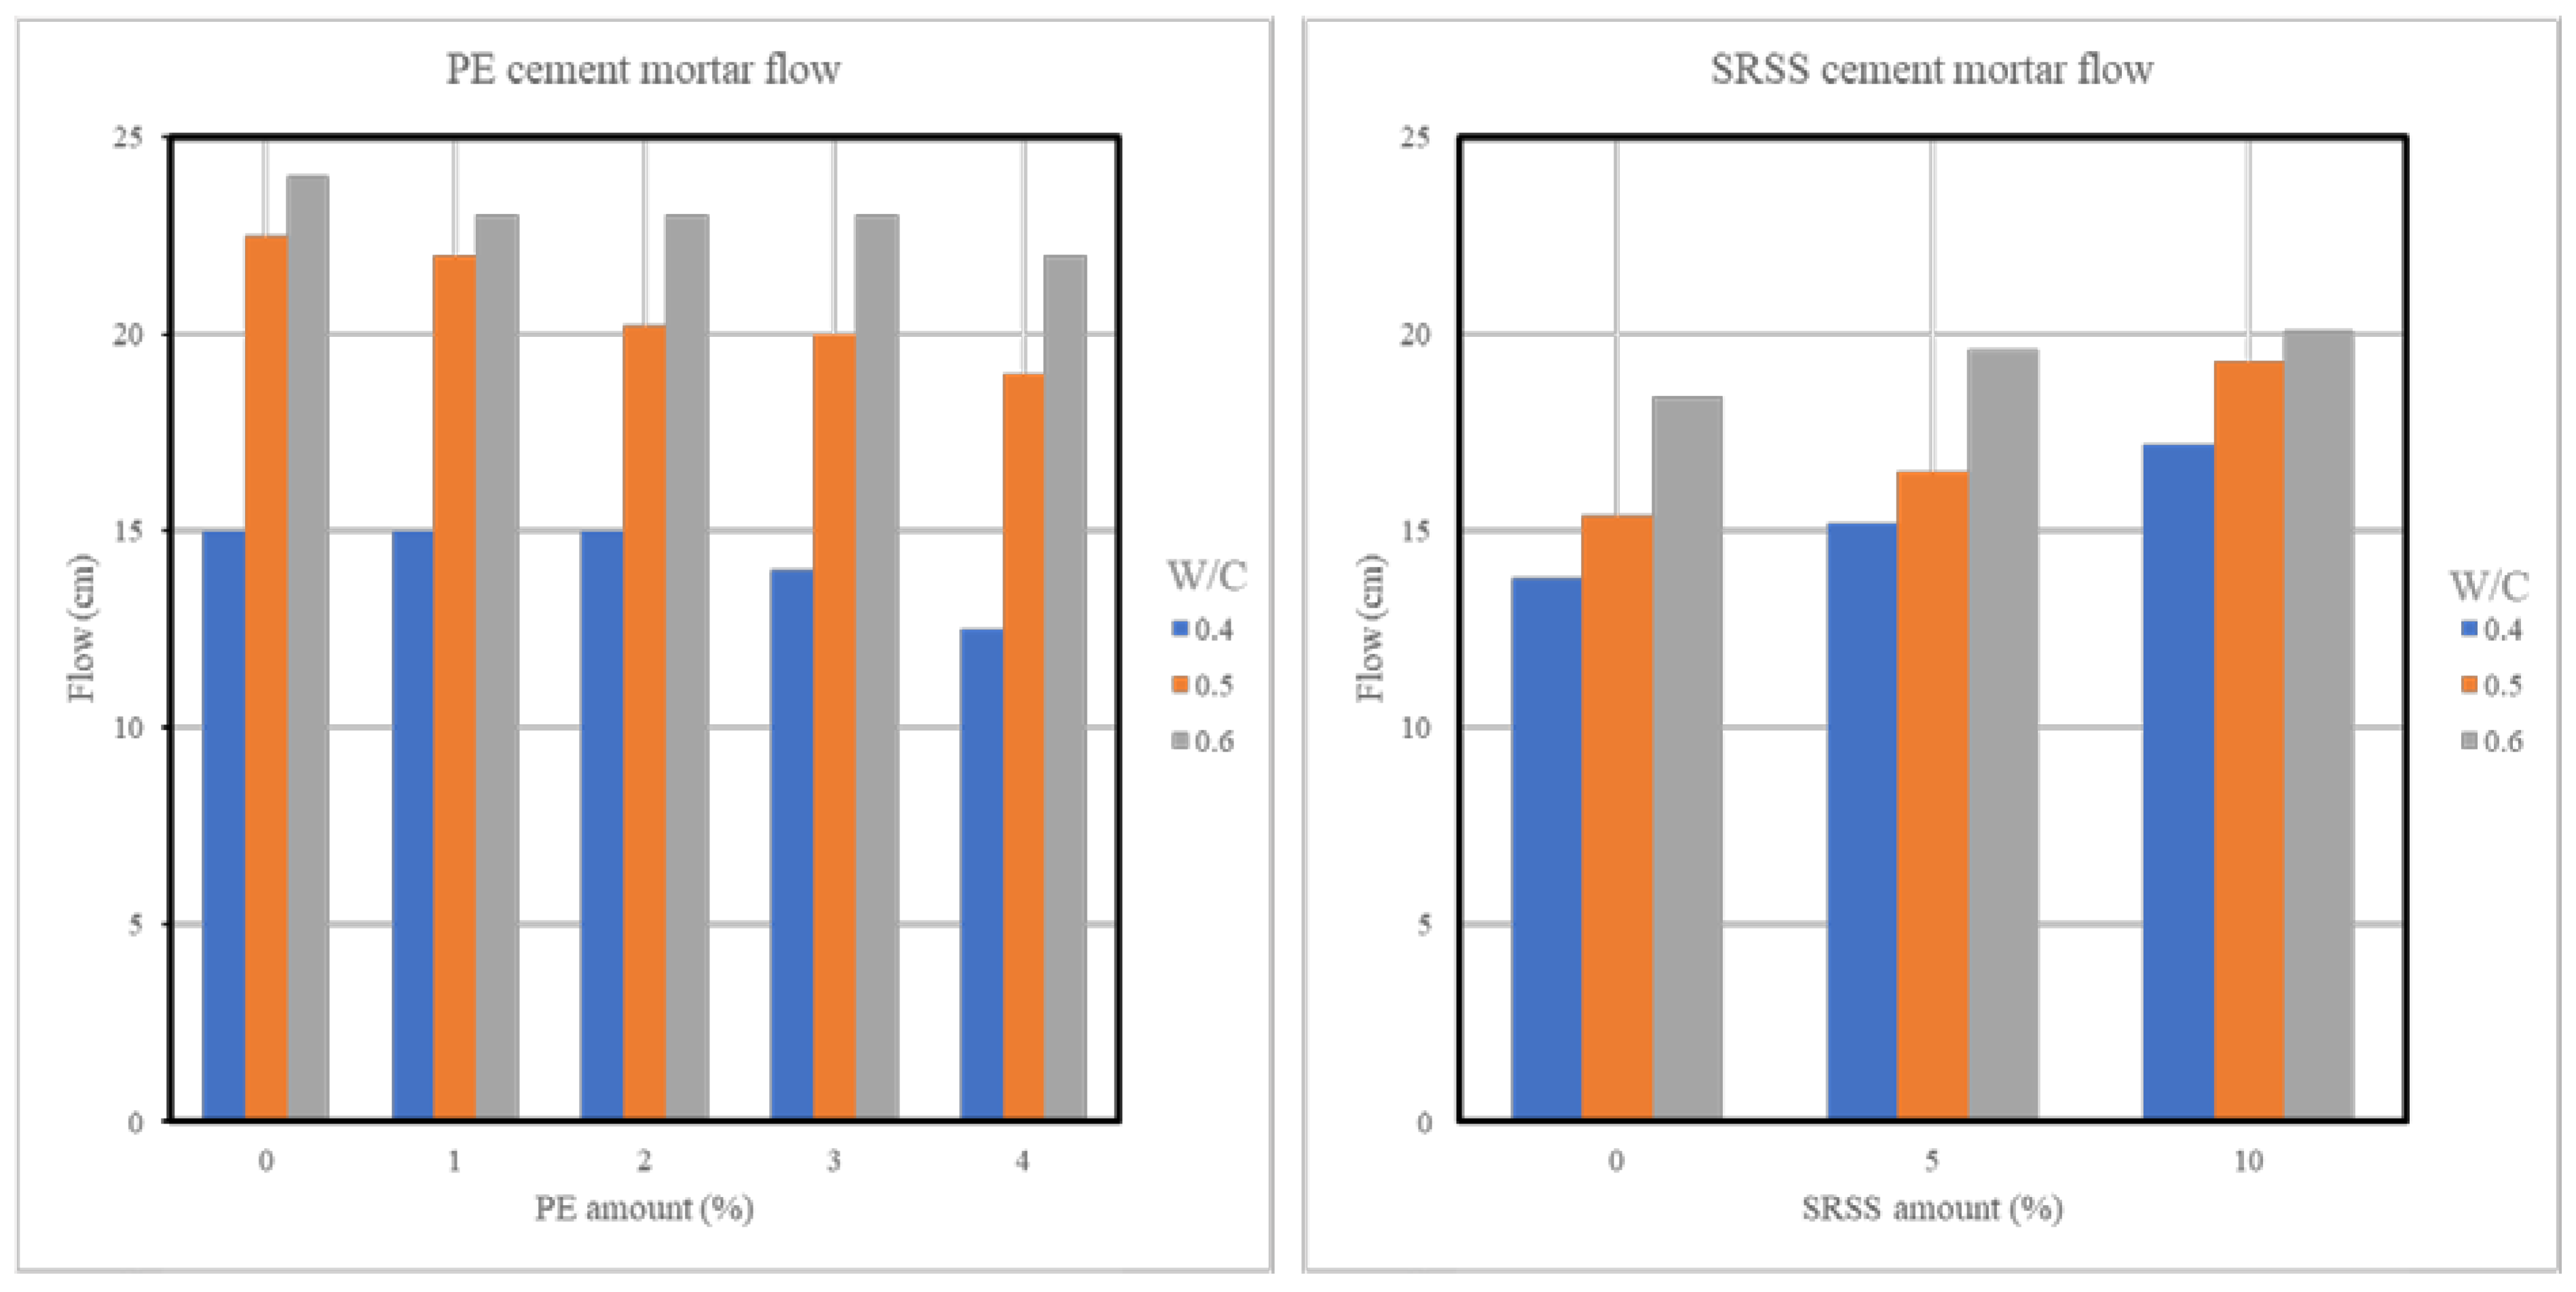
As seen in Figure 2a, the measured flow for the control group was 15 cm, 22.5 cm, and 24 cm when the w/c ratio was 0.4, 0.5, and 0.6, respectively. Since there was enough water for hydration, the flow of the cement mortar mixture increased as the w/c ratio increased, resulting in a more cohesive and stable mixture. The flow was decreased by about 12.5–20% when the PE substitution amount was increased from 0 to 4%. The non-uniform size distribution of the PE plastic aggregates, which hindered the movement of other ingredients in the cement mortar mixture, could be responsible for the reduced flow. This suggests that additional water is required for the mixture to be workable.
The measured flow of the SSRS-substituted cement mortar samples is shown in Figure 2b. The observed flow was 13.8 cm, 15.4 cm, and 18.3 cm for the control group with w/c ratios of 0.4, 0.5, and 0.6, respectively. Similarly, the flow of the cement mortar mixture increased as the w/c ratio increased because there was enough water available to enable the hydration process. The flow of the test specimens similarly increased by approximately 16–33% when the SSRS amount was raised from 0% to 10%. The enhanced flowability properties of the cement mortar samples could be attributed to the following: (1) the smooth surface of SSRS compared to natural aggregates leads to less friction in the cement mortar mixture and (2) in general, stainless-steel slag has lower water absorption, which helps achieve a more cooperative mixture [41].

3.1.3. Compressive Strength

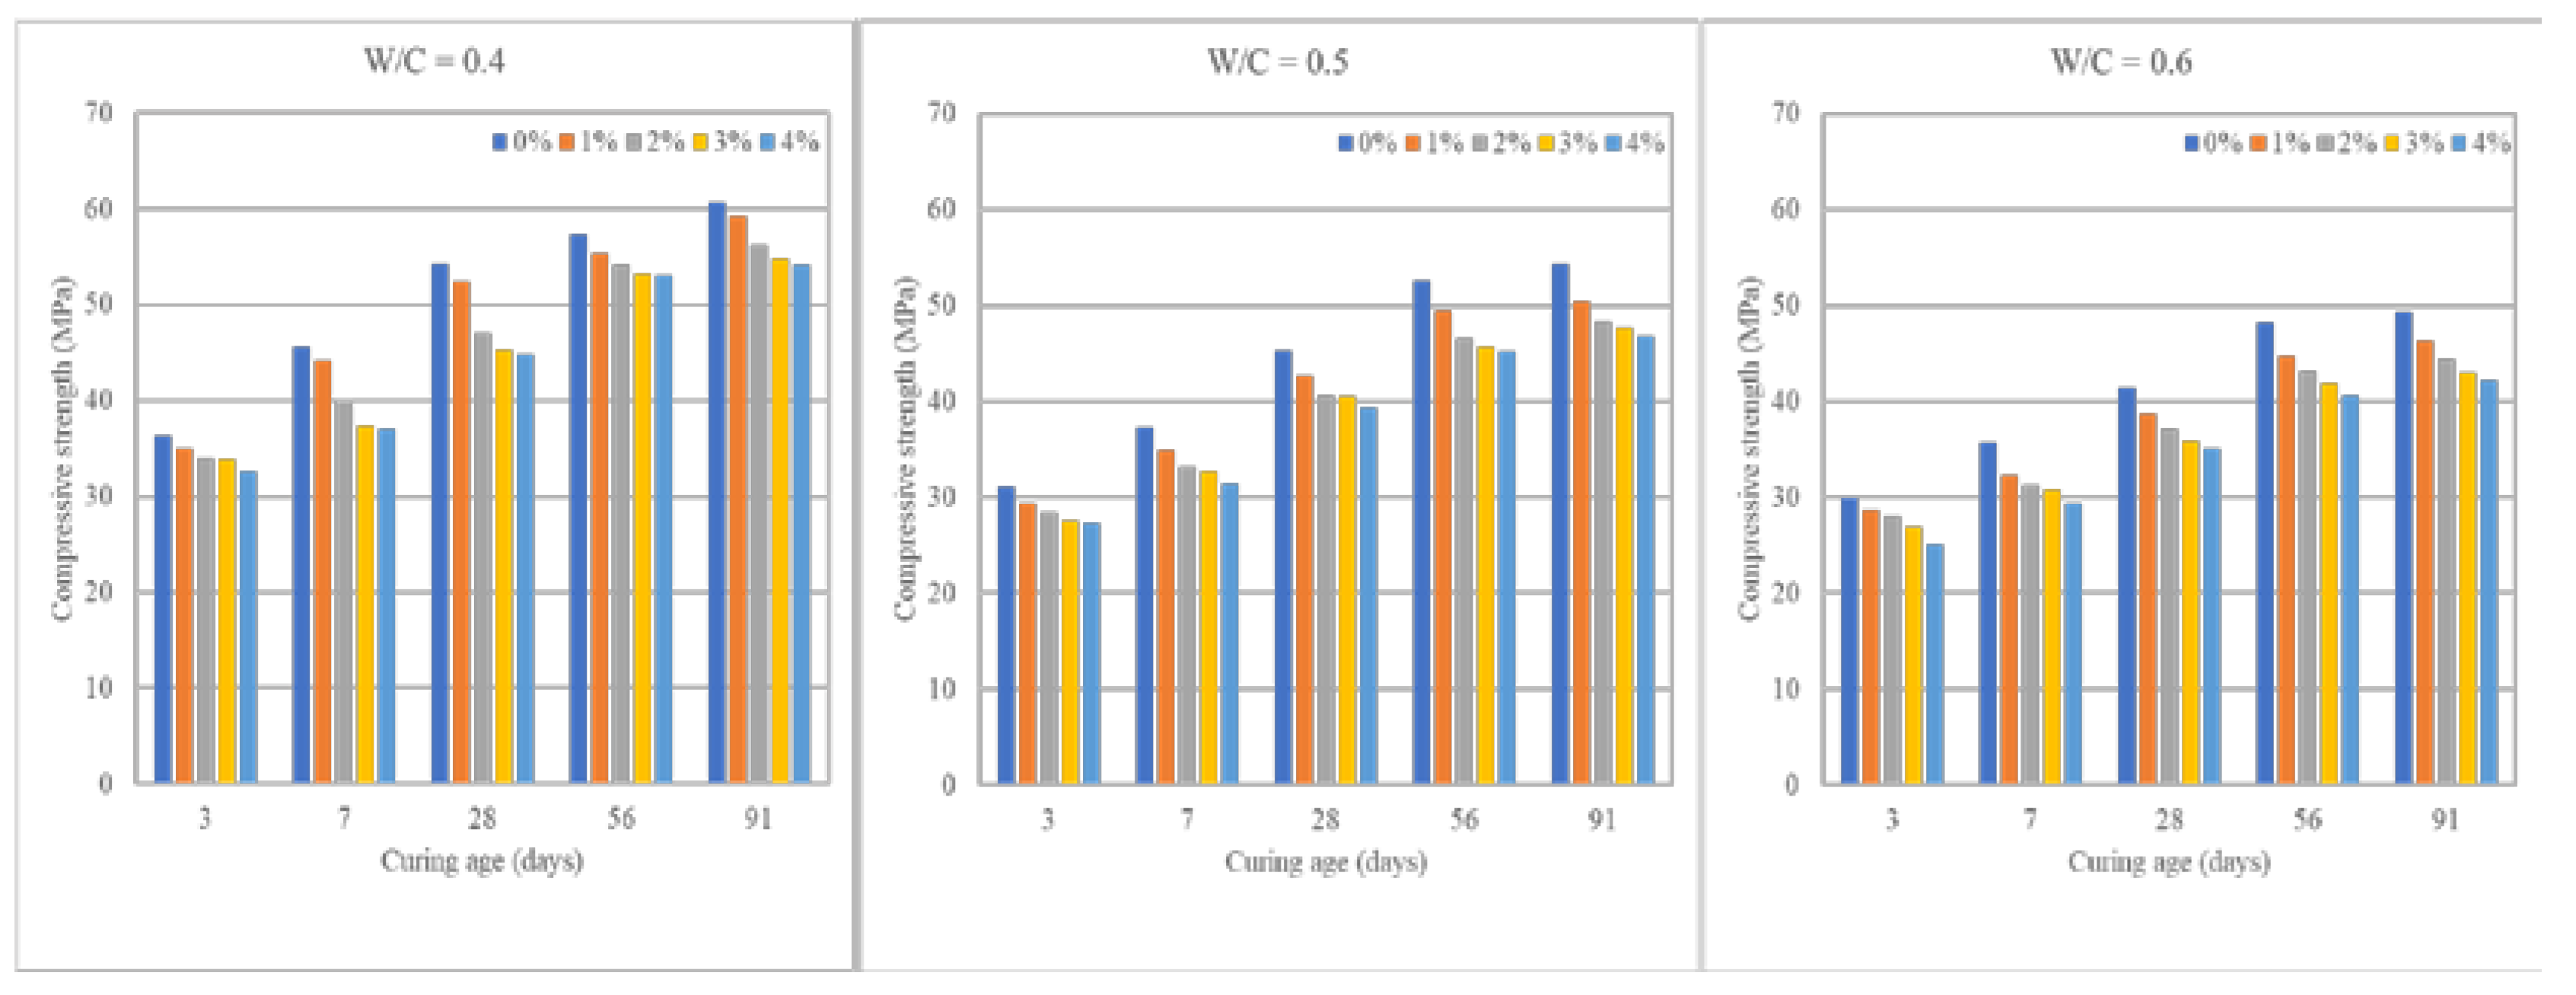
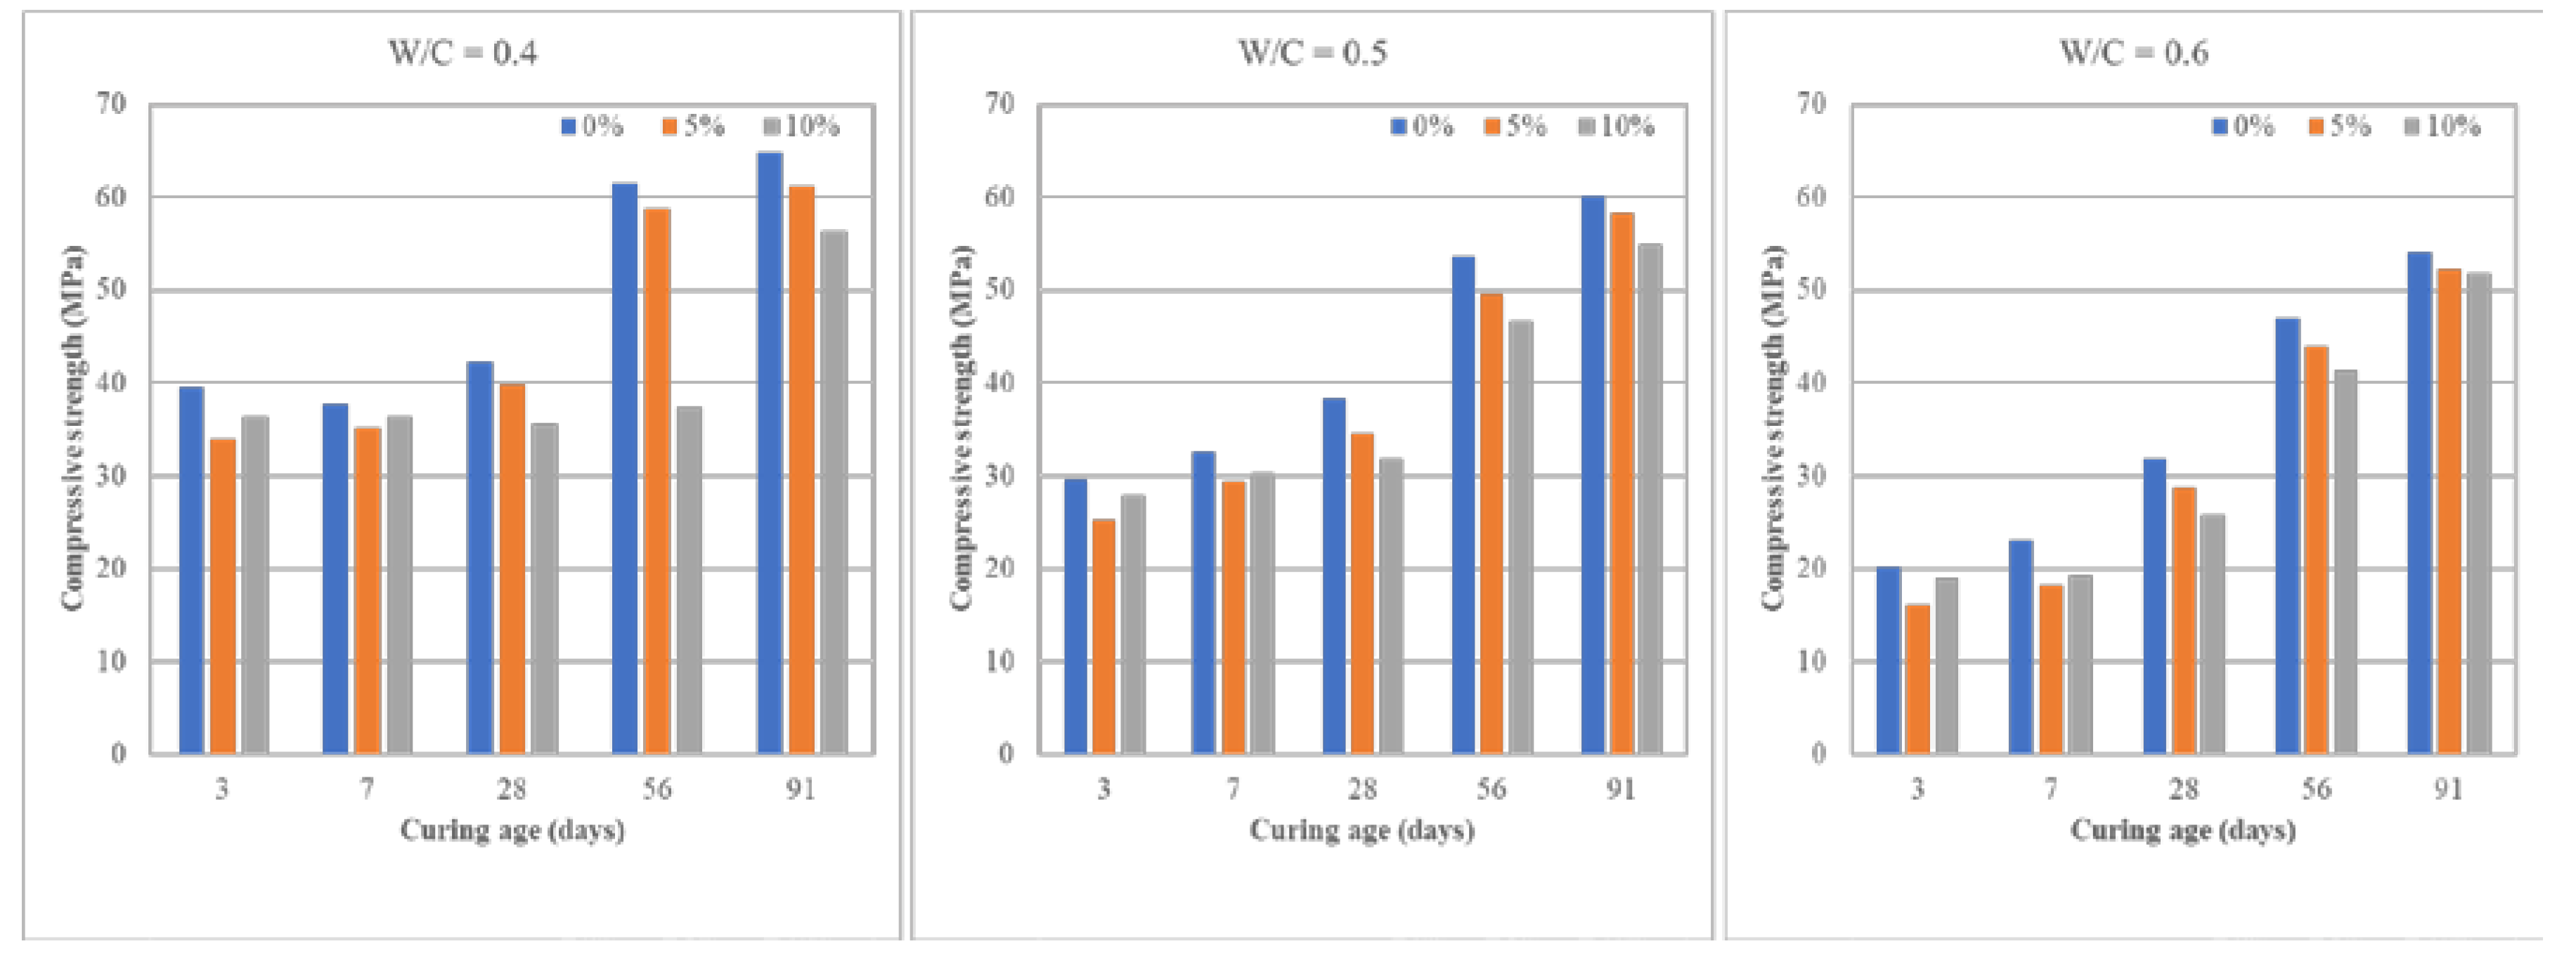
Figure 3 and Figure 4 illustrate the compressive strength of cement mortar samples with PE and SSRS, respectively. Compressive strength for both samples increased during the initial curing phase (0 to 28 days). The compressive strength of the various cement mortar specimens improved with a curing time of 3 to 91 days regardless of the aggregate replacement material (SSRS or PE) and w/c ratio. This is due to the continuing hydration of the cement [42]. Additionally, every sample showed a compressive strength of at least 17 MPa, indicating that their strength is on par with that of lightweight structural concrete according to ASTM C330 [43].
As the w/c ratio was raised, the compressive strength of the cement mortar samples containing PE decreased. The control samples (0% PE) had 28-day compressive strengths of 54.19 MPa, 45.4 MPa, and 41.5 MPa with w/c ratios of 0.4, 0.5, and 0.6, respectively. There was an 8–16% reduction in compressive strength. The compressive strength was similarly decreased by about 13 to 17% when the PE substitution level was increased from 0 to 4%. The low compressive strength of the resulting cement mortar specimens can be due to two factors: 1) the smooth surface of the PE plastic aggregates, which generates a weak interfacial connection with the cement paste, and 2) the hydrophobic characteristic of plastic aggregates, which slows cement hydration by inhibiting water flow [39,44]. The weak bonding at the interfacial transition zone between the cement paste and the PE plastic aggregates adds to the specimen's increased porosity, which leads to lower mechanical strength [45]. Similar findings have been reported in prior investigations, with the weak bonding between plastic aggregates and cement paste being the primary contributor to the decrease in compressive strength. As a result, future research should concentrate on surface modification strategies to increase bonding between cement paste and plastic waste aggregates [40]. Nonetheless, these findings indicate that PE-substituted cement mortar samples could be effective in non-load-bearing or floating buildings where lightweight materials are preferred.
The SSRS-substituted cement mortar samples, similar to the PE-substituted cement mortar samples, showed a decreasing trend in compressive strength as the w/c ratio and SSRS substitution amount were increased. The 28-day compressive strength was 35.6-42.3 MPa when the w/c ratio was 0.4. The compressive strength was measured at 31.8-38.4 MPa and 25.7-31.8 MPa as the w/c ratio was increased to 0.5 and 0.6, respectively. Increasing the w/c from 0.4 to 0.6 reduced compressive strength by about 15-19%. With a higher w/c ratio, the water-filled space in the test specimen increases, resulting in a large number of pores in the test specimen and a lower compressive strength of the cement mortar sample. Meanwhile, increasing the amount of SSRS in the cement mortar mix reduced compressive strength by about 2.3-4.7%. In a typical cement mortar specimen with pure cement, the amount of calcium hydroxide (Ca(OH)2) is expected to increase with curing age and is proportional to the amount of cement. For cement mortar specimens substituted with SSRS, it is expected that the amount of Ca(OH)2 decreases with increasing substitution amount of SRSS due to the following: (1) SSRS consumes the Ca(OH)2 via pozzolanic reaction and (2) dilution of cement by SSRS [46]. Thus, resulting in poor strength as evidenced by the decreased compressive strength values.

3.1.4. Flexural Strength

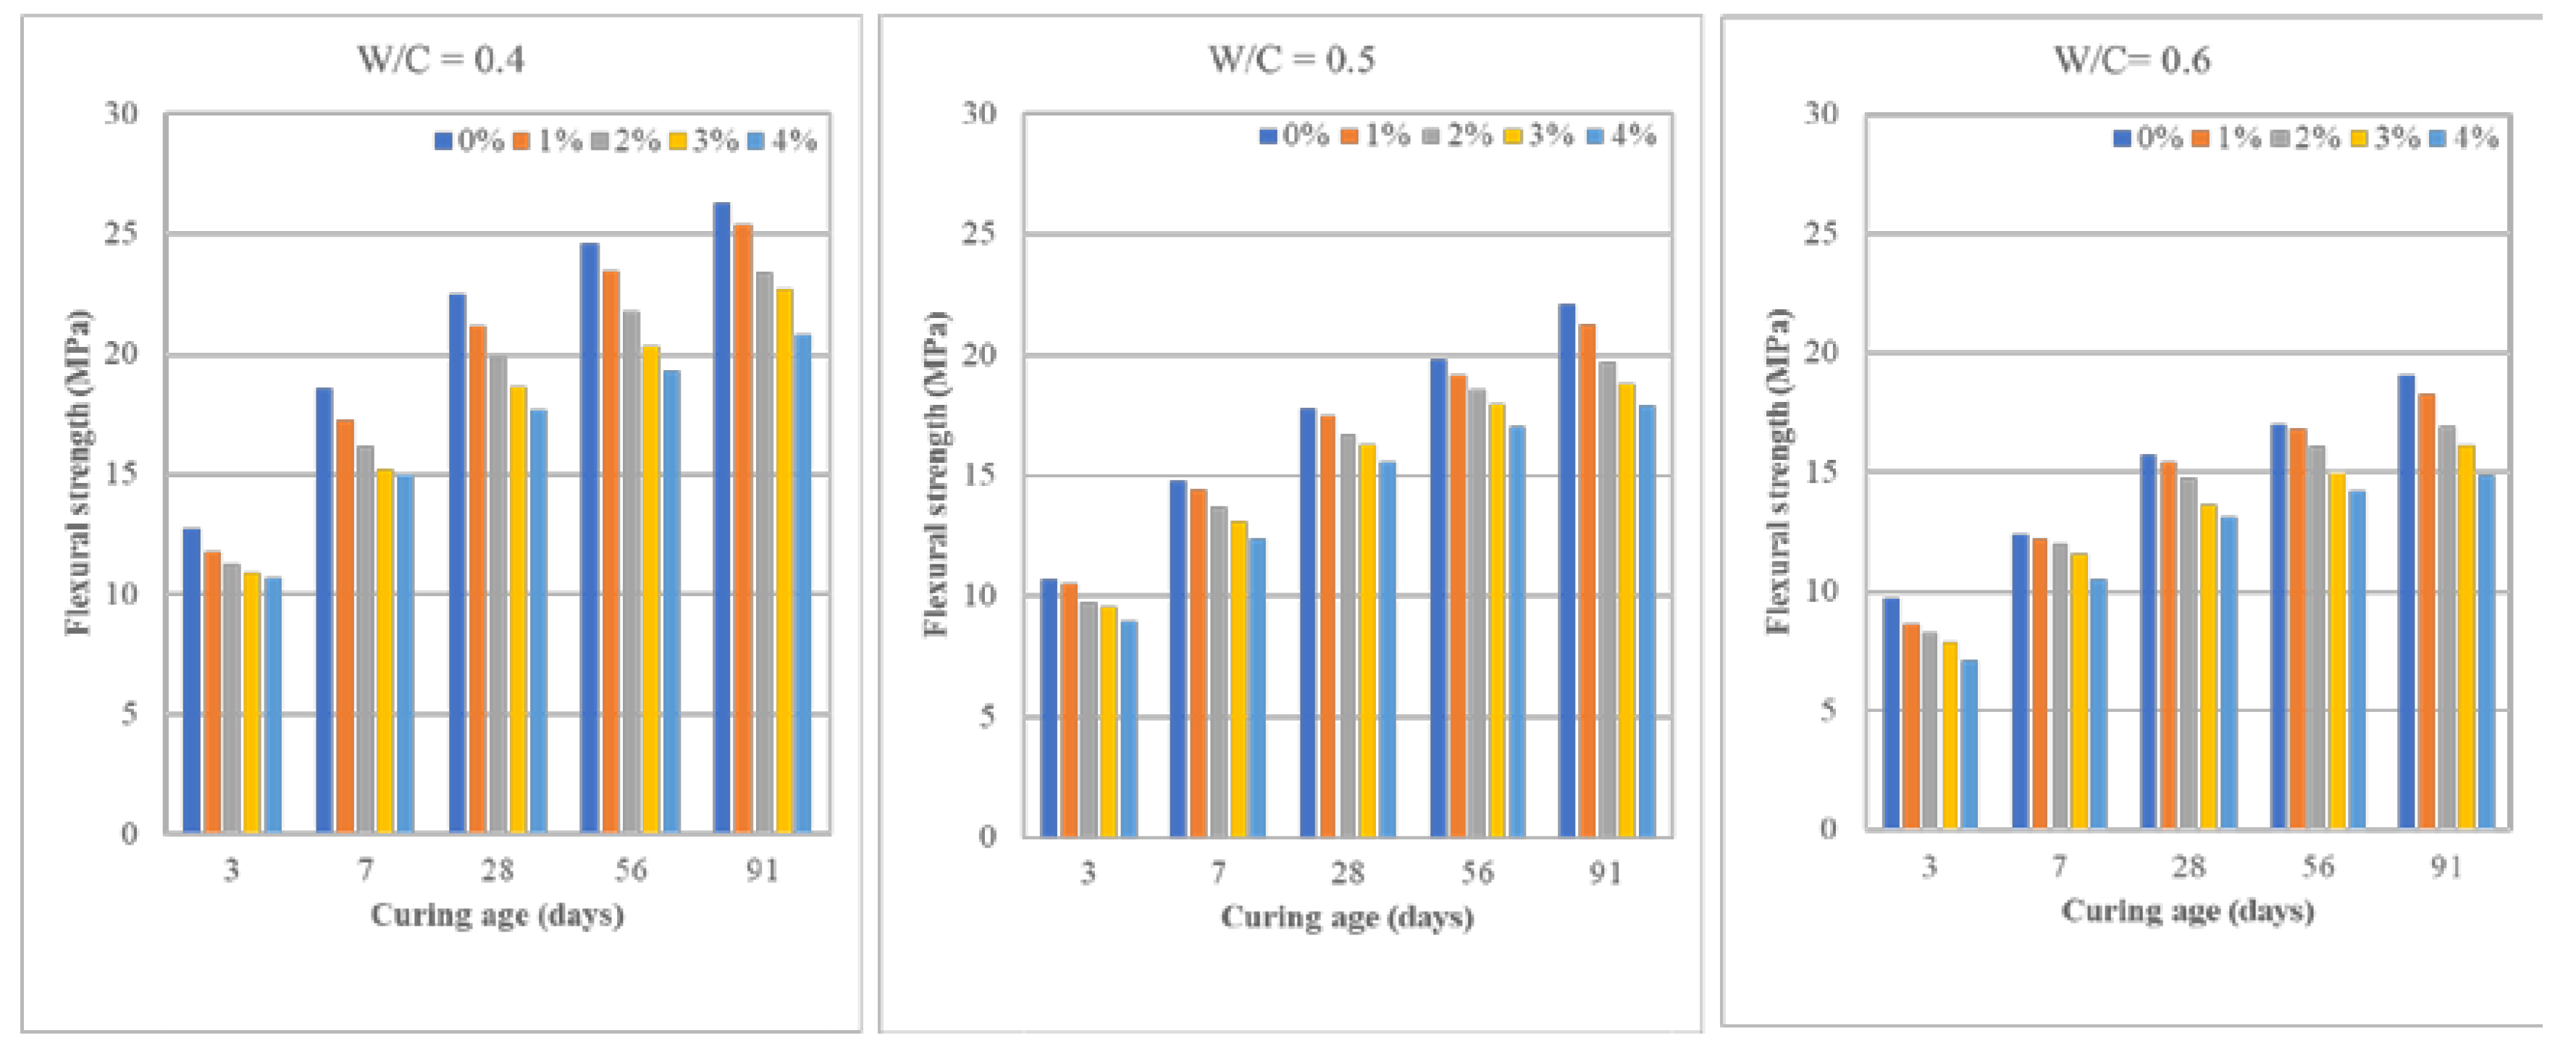
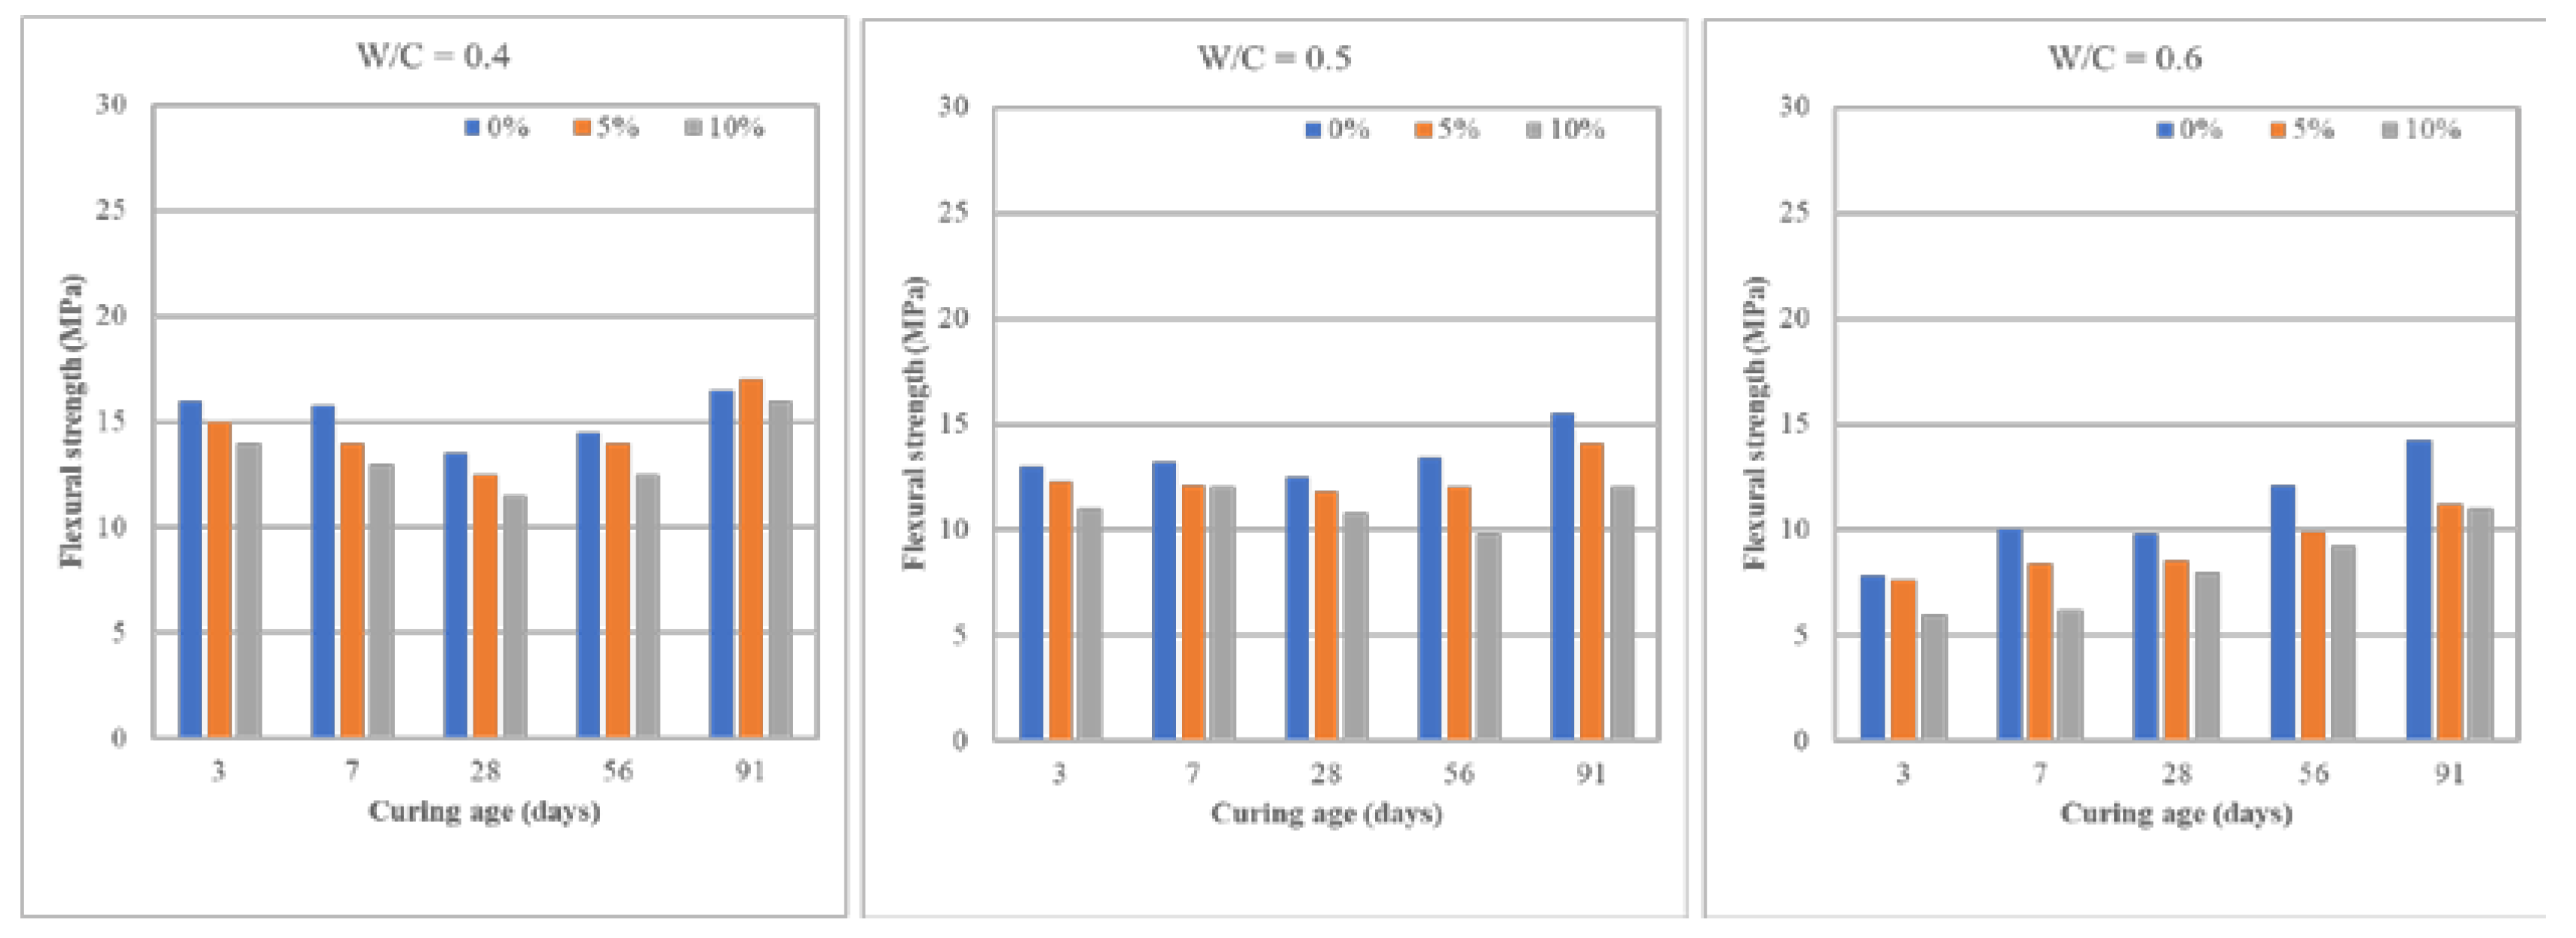
The flexural strengths of the different cement mortar samples are shown in Figure 5 and Figure 6. When the w/c ratio is 0.4 for the PE-substituted cement mortar sample, the 28-day flexural strength varies from 17.66-22.4 MPa. When the w/c ratio is changed from 0.4 to 0.6, the flexural strength decreases by roughly 16-21 percent. As with compressive strength, raising the w/c ratio resulted in an increase in porosity, which operated as weak points in the cement mortar samples. Meanwhile, when the proportion of PE replacement was increased from 0% to 4%, the flexural strength decreased from 12% to as much as 21%. This is also attributed to the weak interfacial bonding between the PE plastic aggregates and the cement paste.
For the SSRS-substituted cement mortar samples, the flexural strength also exhibited a decreasing trend as the w/c ratio and SSRS amount were increased. Figure 9 shows that when the w/c ratio is 0.4, the 28-day flexural strength is 11.5-13.5 MPa. Flexural strength was 10.8-12.5 MPa and 8-9.8 MPa when the w/c ratio was increased to 0.5 and 0.6, respectively. When the w/c ratio was increased from 0.4 to 0.6, the flexural strength was reduced by about 18%. Meanwhile, raising the SSRS substitution amount from 0% to 10% reduced the 28-day flexural strength from 19.87 MPa to 14.74 MPa, a 25.81% reduction.

3.1.5. Tensile strength

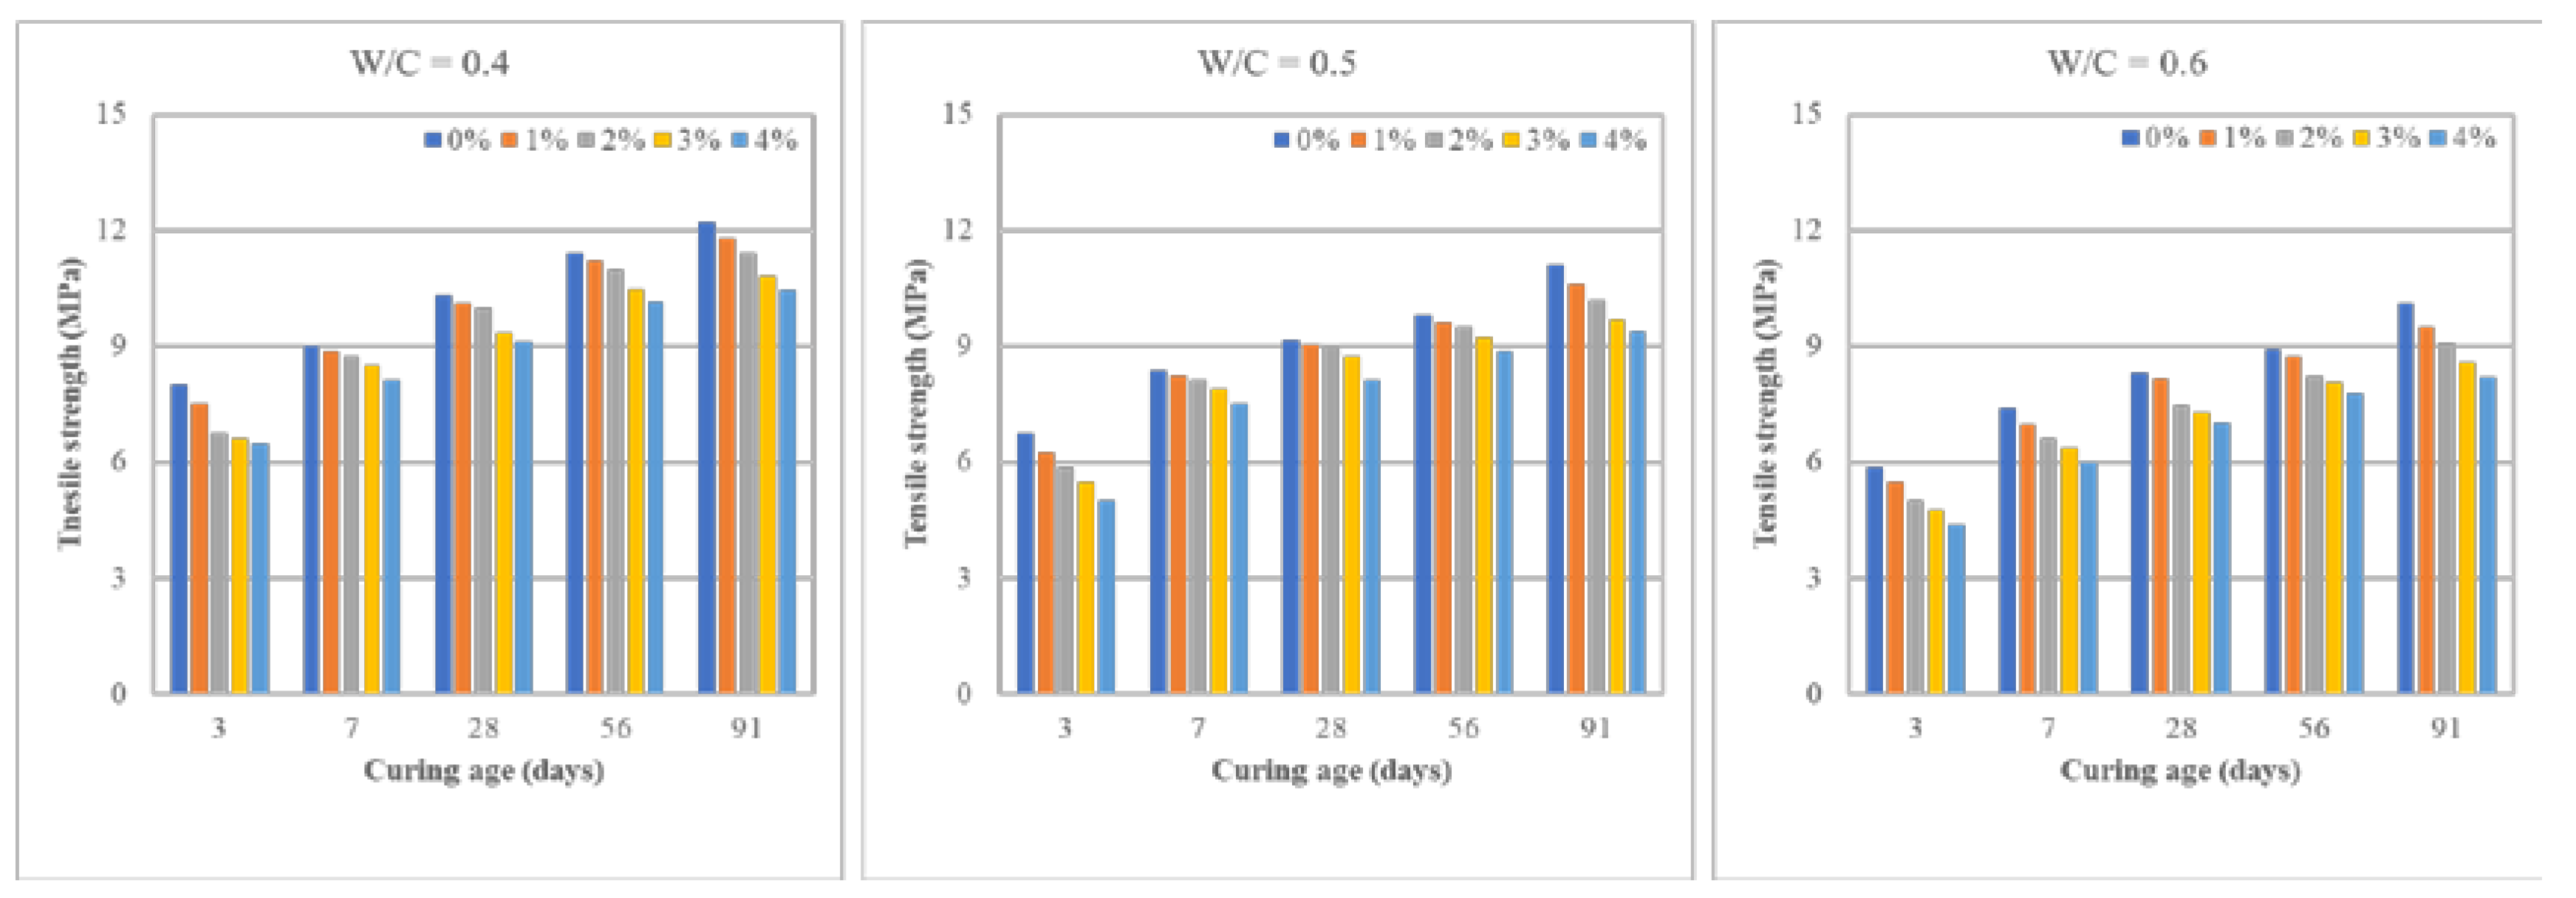
The tensile strength of the PE-substituted cement mortar samples followed the same trend as the compressive strength and flexural strength. The recorded 28-day tensile strengths with w/c ratios of 0.4, 0.5, and 0.6 were 10 MPa, 9 MPa, and 7.49 MPa, respectively. Increasing the w/c ratio from 0.4 to 0.6 resulted in approximately 25% decrease in tensile strength. On the other hand, when the PE substitution amount was increased from 0% to 4%, the tensile strength was reduced by about 10-15%. Similarly, the reduced tensile strength was attributed to the increased porosity by increased w/c ratio and poor interfacial bonding of the PE plastic aggregates with the cement paste.
Figure 7. Tensile strength of cement mortar samples with different w/c ratios and PE substitution amounts.
Preprints 103538 g007
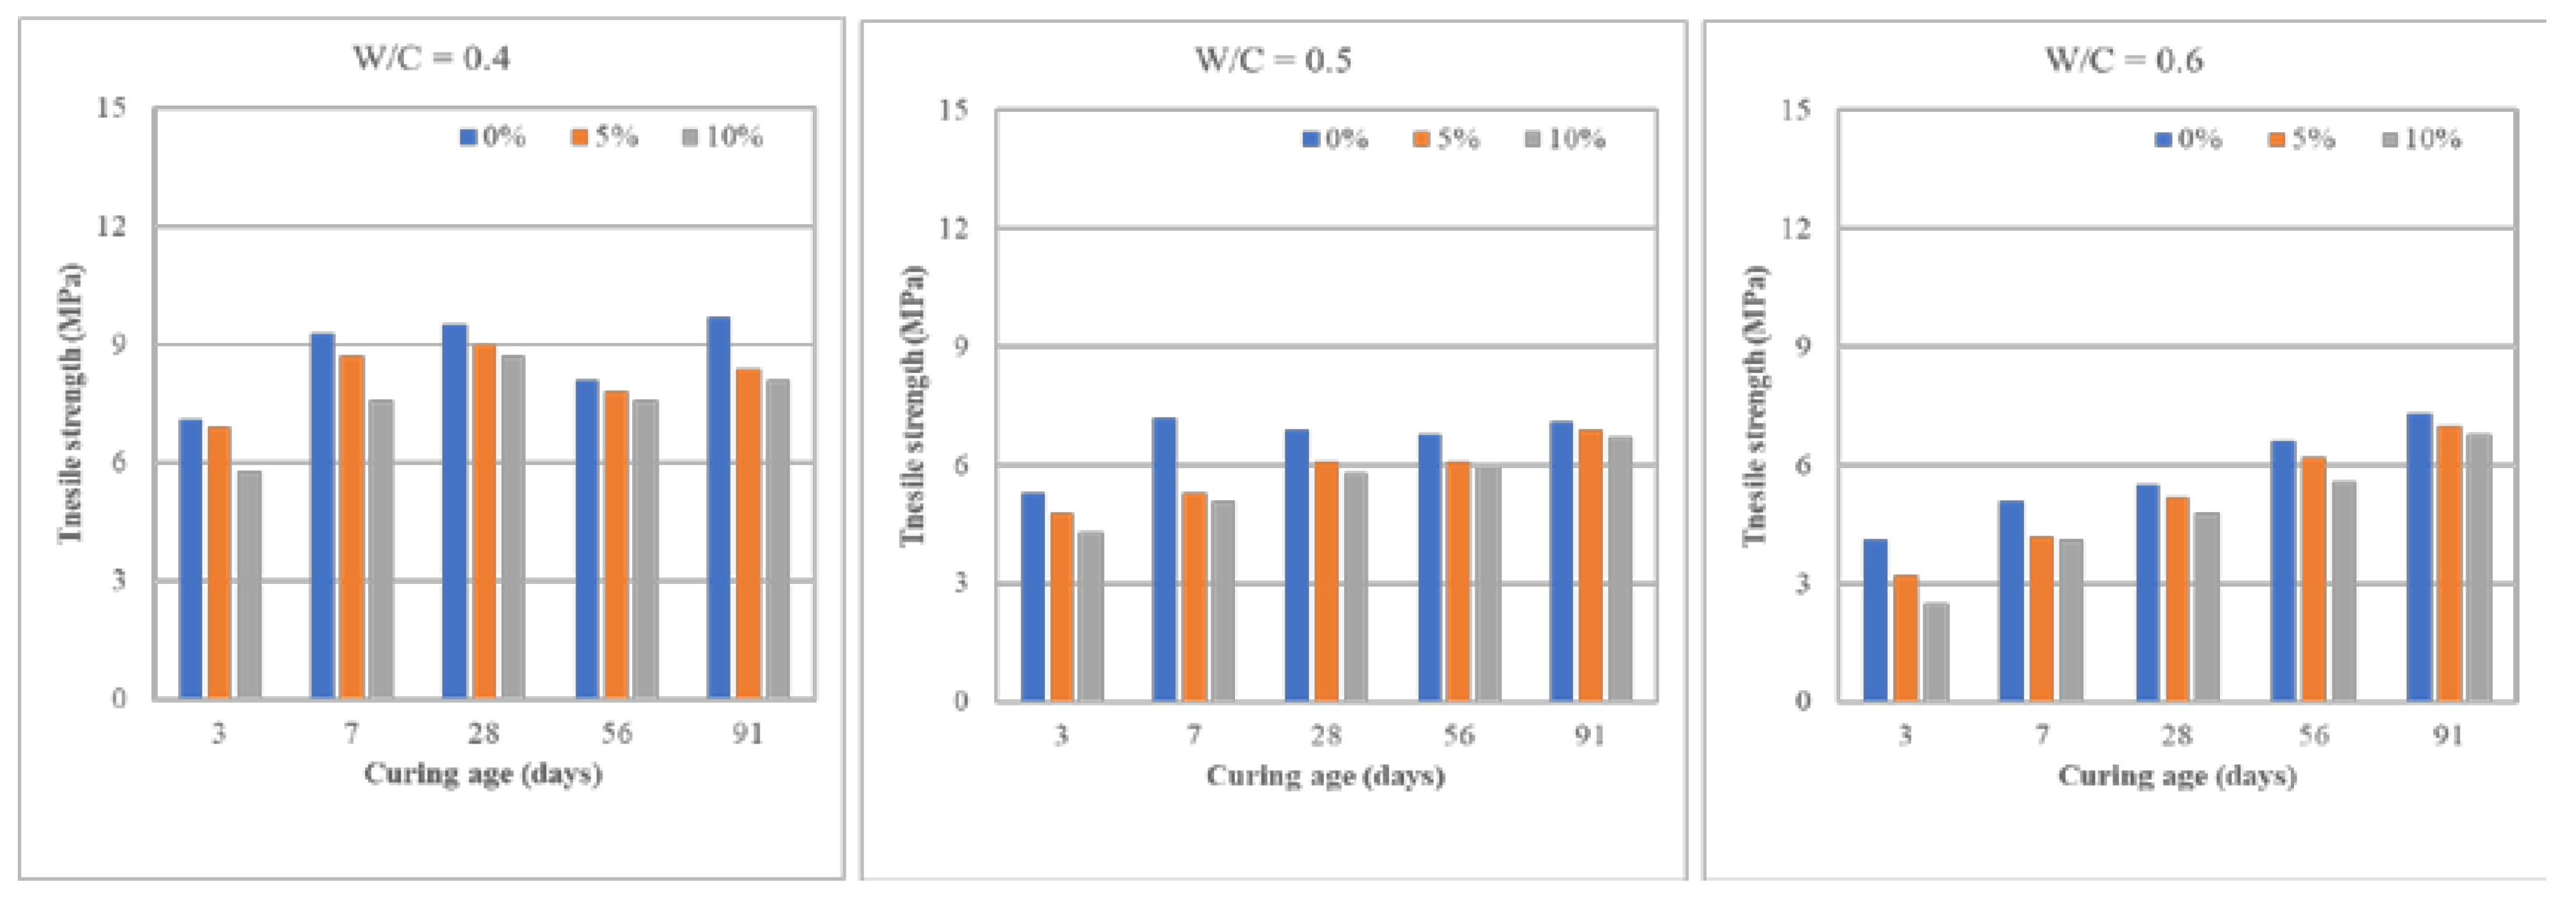
The tensile strength of the SSRS-substituted cement mortar samples decreased as the w/c ratio and SSRS substitution amount increased. The 28-day tensile strength was 8.7-9.5 MPa when the w/c ratio was 0.4. Tensile strength was 5.8-6.9 MPa when the w/c ratio was increased to 0.5. By further increasing the w/c ratio to 0.6, the tensile strength was reduced to 4.8-5.5 MPa. When the w/c ratio was increased from 0.4 to 0.6, the tensile strength was reduced by roughly 8-15%. Meanwhile, increasing the SSRS substitution amount from 0% to 10% lowered the tensile strength by about 8-15%. Similarly, the decrease in tensile strength of SSRS-cement mortar can be attributed to poor SRSS-cement paste bonding. Several prior studies discovered that an angular and rougher surface for stainless-steel slag improved mechanical interlock with cement paste, resulting in greater compressive strength [47,48].
Figure 8. Tensile strength of cement mortar samples with different w/c ratios and SSRS substitution amount.
Preprints 103538 g008

3.1.6. Ultrasonic Pulse Velocity (UPV)
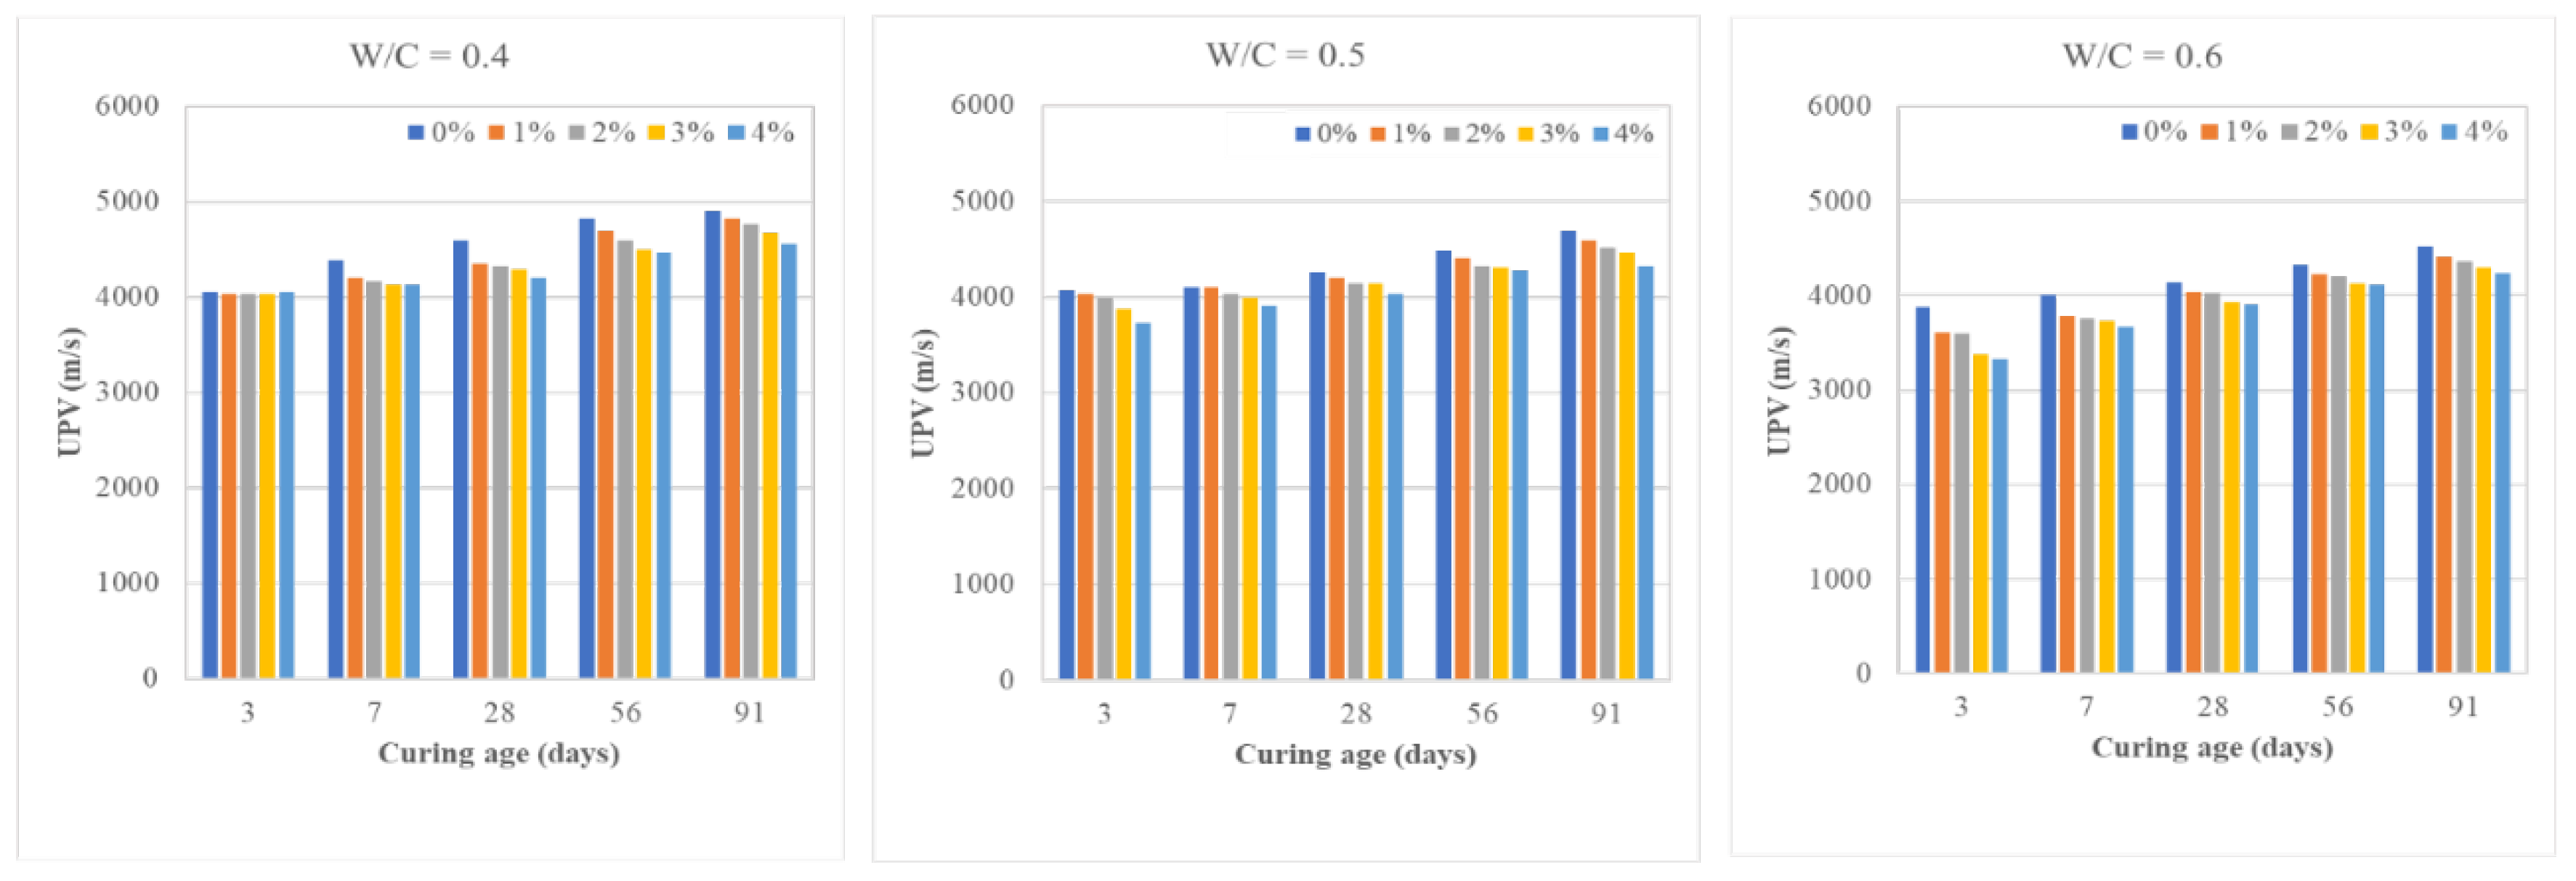
The UPV is a non-destructive method for evaluating the quality of concrete and cement mortar structures. The UPV that travels through the specimen is measured and related to the compactness of the samples in this method. In general, a greater UPV indicates a denser, more compact structure. For both cases, the recorded UPV was within the range of 3000-5000 m/s, which is typically observed for cementitious materials. Based on a typical classification of UPV to assess the quality of concrete and other cementitious products, the PE-cement mortar can be classified as good quality while the SSRS-cement mortar falls within the range of questionable to good quality [49,50].
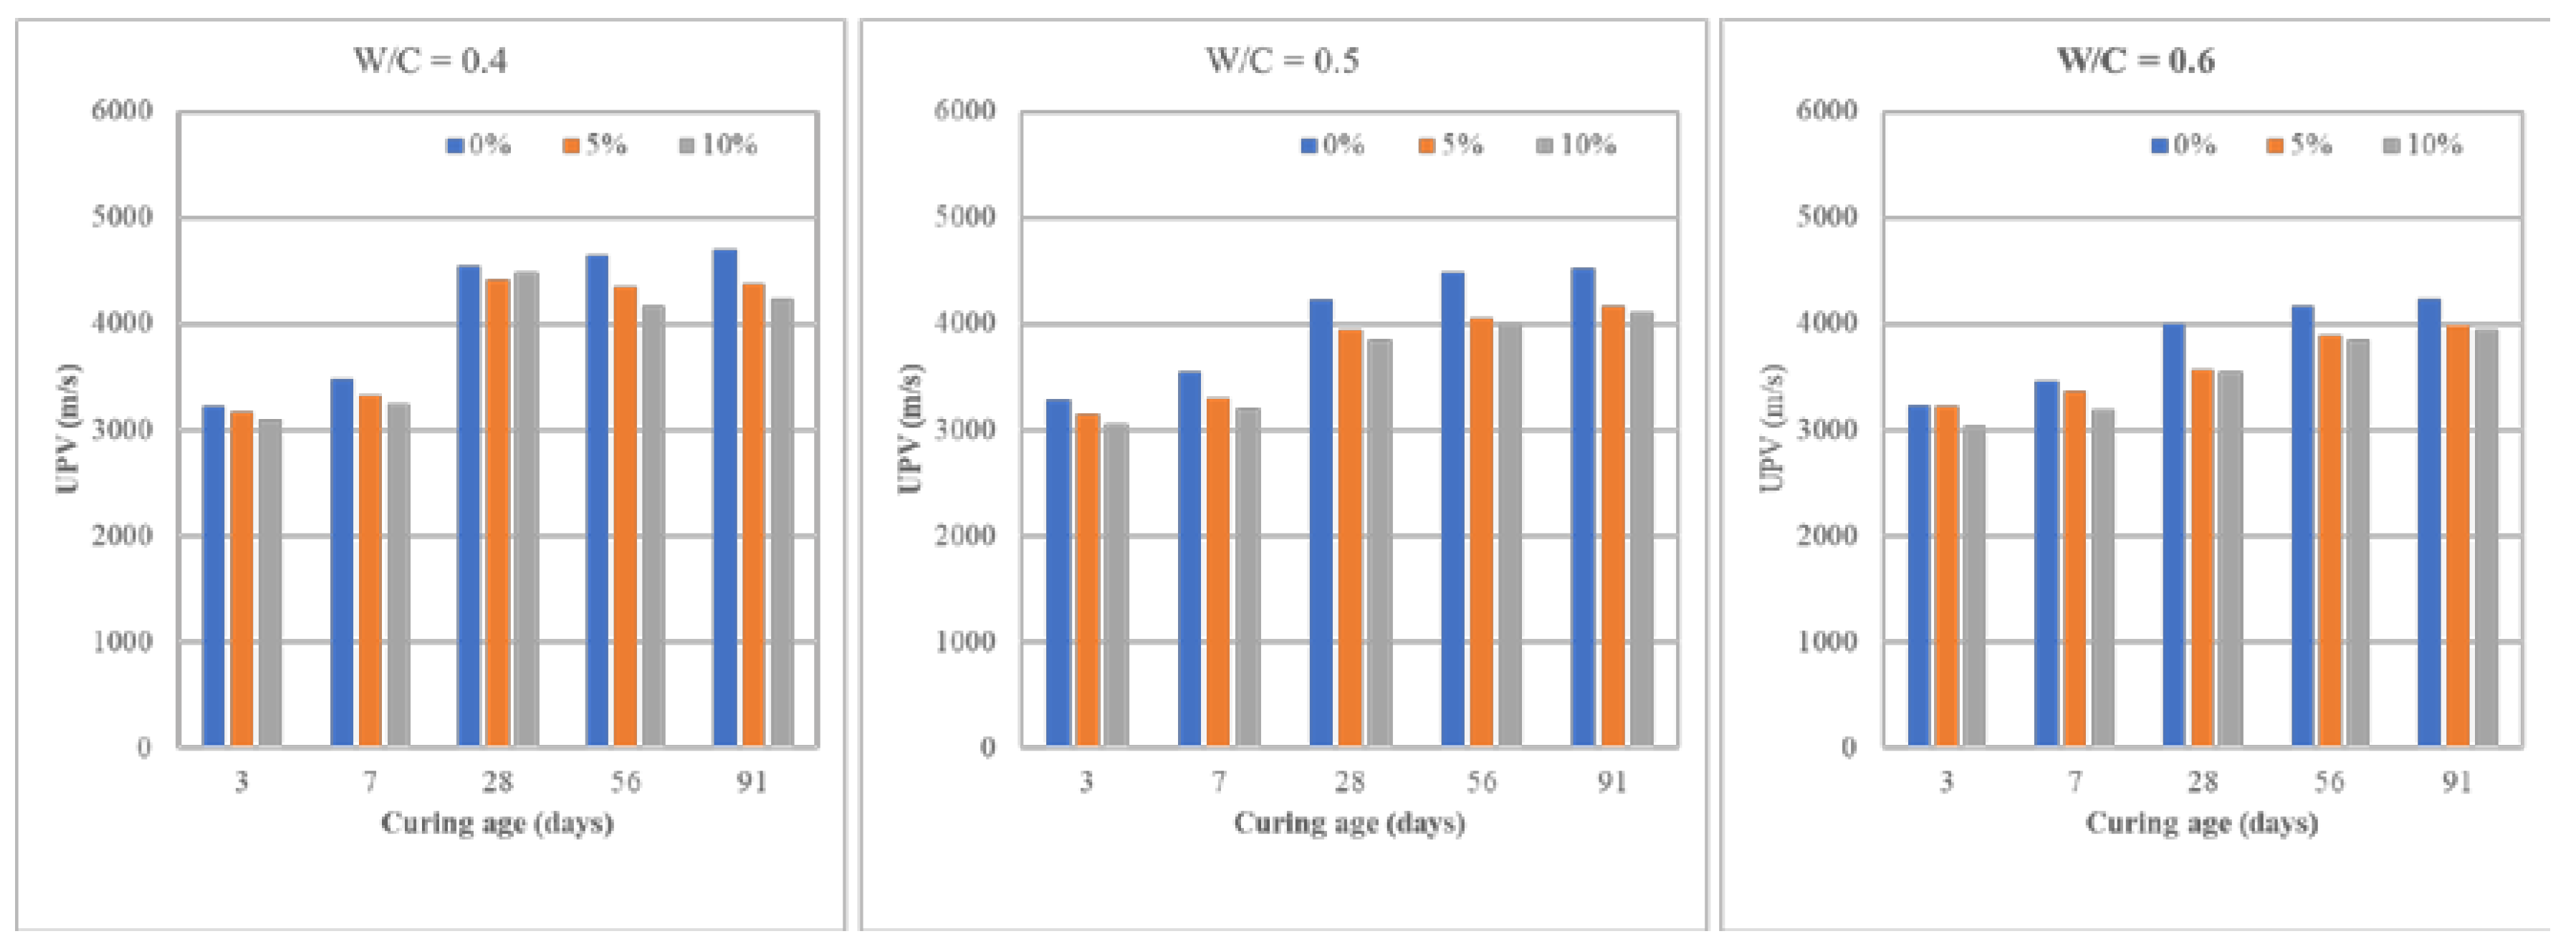
The reported 28-day UPV for the PE-substituted cement mortar samples with w/c ratios of 0.4, 0.5, and 0.6 were 4324 m/s, 4145 m/s, and 4032 m/s, respectively. As a result, increasing the w/c ratio from 0.4 to 0.6 reduced the UPV by about 6%. The decreasing trend in the UPV is attributed to increased porosity formation in the test specimen caused by increased w/c ratio. Increasing the PE substitution amount from 0% to 4%, on the other hand, reduced the UPV by about 5-8%. Similarly, the higher the w/c ratio, the more pores formed in the test specimen, which dampened the ultrasonic waves. Meanwhile, the increased PE substitution amount also reduced the UPV since the overall density of the specimen was reduced and the PE plastic aggregates also served as barriers for the ultrasonic waves. These findings are in good agreement with the results obtained for the different mechanical properties investigated in this study.
Figure 9. UPV of cement mortar samples with different w/c ratios and PE substitution amount.
Preprints 103538 g009
Figure 10. UPV of cement mortar samples with different w/c and SSRS substitution amounts.
Preprints 103538 g010

3.1.7. Water Absorption

The water absorption test evaluates the ratio of external water molecules entering the cement mortar specimen. This amount of water absorbed is related to the presence of pores inside the specimen. In this study, 50 mm x 50 mm x 50 mm cement mortar were tested for their water absorption rate at different curing periods.
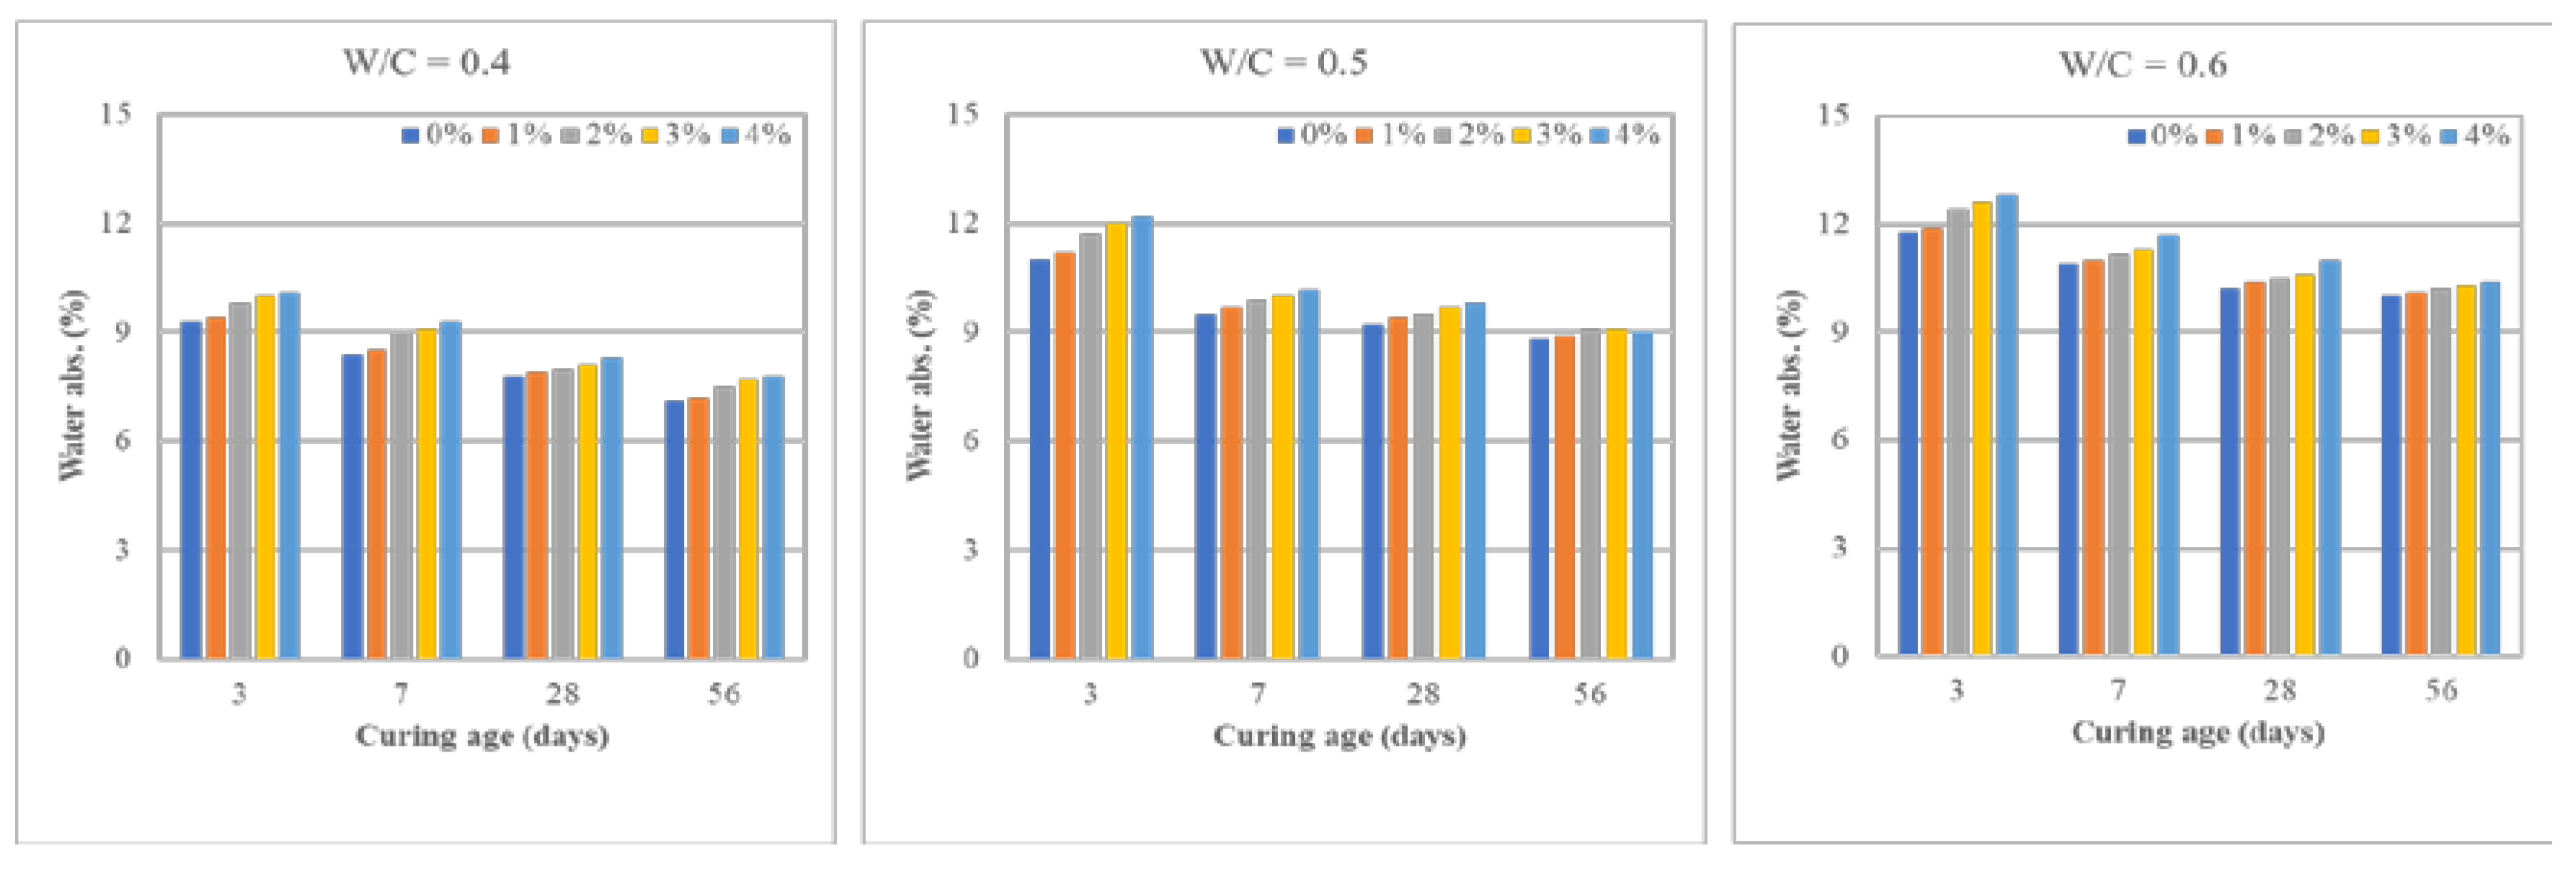
As shown in Figure 11, for the PE-substituted cement mortar, when the w/c ratio is 0.4, the 28-day water absorption rates were 7.8%, 7.9%, 7.9%, 8.1%, and 8.3% for 0%, 1%, 2%, 3%, and 4% PE substitution amount, respectively. When the w/c ratio was 0.5, the water absorption rates were within the range of 9.2% to 9.8%. Further increasing the w/c ratio to 0.6 obtained absorption rate value within the range of 10.2% to 11%. These results showed that keeping the w/c ratio constant while increasing the PE substitution amount obtained higher water absorption rates. Increasing the amount of PE plastic aggregates in the sample resulted in higher water absorption. Plastic aggregates have very minimal water absorption capacity which results in water accumulation in the interfacial transition zone resulting in more porous cement mortar samples [46]. Meanwhile, increasing the w/c ratio from 0.4 to 0.6 also resulted in higher water absorption since a higher w/c ratio enhanced the formation of porosity in the cement mortar sample.
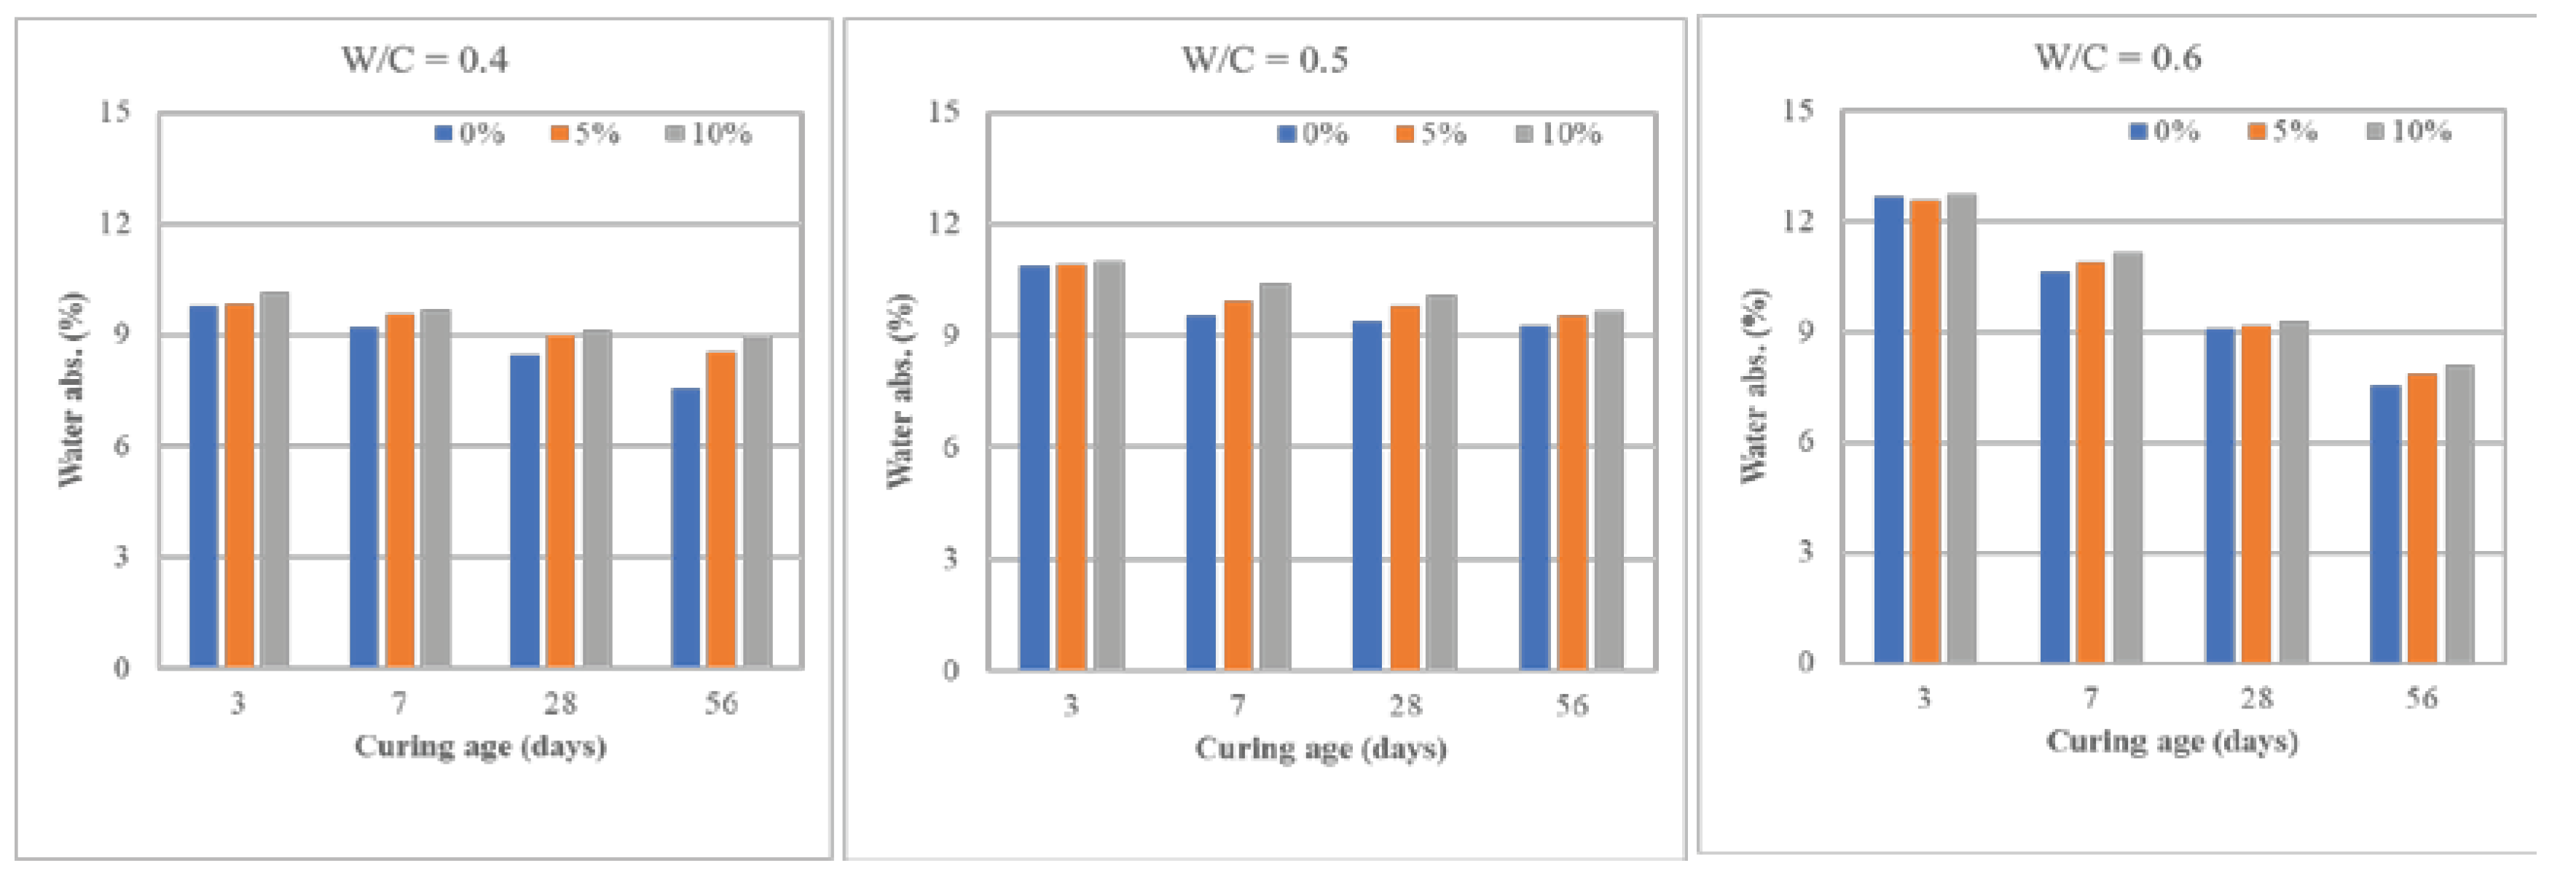
As shown in Figure 12, when the w/c ratio is 0.4, the water absorption rate after 28 days of samples with 0%, 5%, and 10% SSRS was 8.48%, 9%, and 9.13%, respectively. When the w/c ratio is increased to 0.5, the water absorption rates at 28 days were 9.37%, 9.78%, and 10.09%. Further increasing the w/c ratio to 0.6, the water absorption rates at 28 days were 9.07%, 9.18%, and 9.25%. When the w/c ratio is increased from 0.4 to 0.5, many tiny pores were formed in the sample after the evapotranspiration process. The increased number of pores in the samples resulted in greater water absorption. These results show that increasing the w/c ratio and SSRS amount increases the number of pores in the cement mortar samples. Furthermore, it also showed that the early hydration reaction of the samples is relatively slow, resulting in higher water absorption at early curing ages. At later curing ages, the hydration reaction proceeds to completion which fills the pores of the specimens, making the samples more compact with a lower water absorption rate.

3.2. Direct Cost Comparison and Cost-Benefit Analysis

For the fabrication of the SSRS concrete, Table 6 shows the estimated transportation cost based on the SSRS provider and the different concrete pavement manufacturers. As expected, the combination that achieved the least transportation cost was the combination of SSRS provider and concrete pavement manufacturer both located in Tainan. Using Walsin Lihwa Co., Ltd. and Ronggang Material Technology Co., Ltd. as SSRS providers, and Tianjiu Industrial Co., Ltd. as concrete pavement manufacturer shows transportation cost savings of up to 300% (when compared to the farthest SSRS provider and concrete pavement manufacturer). Taiwan’s steel industry is ranked at 15th place globally with 10.8 million tons of steel exported as of 2022 (World Steel in Figures, 2022). In recent years, Taiwan's steel industry has experienced consistent growth, and this trend is anticipated to persist in the coming years, leading to a stable supply of raw materials for SSRS fabrication. Consequently, SSRS has become readily accessible, facilitating increased interest among companies in concrete pavement manufacturing. This concise comparative analysis illustrates that the current prevalence of SSRS providers has simplified the task of aligning them with diverse concrete pavement providers throughout Taiwan.
Single-use plastic wastes consist of multi-layer, multi-component food packaging (MMFP) materials and involve the use of adhesives or heat sealing to bond different layers of materials [52]. Due to the complexity of recycling MMFPs, these usually end up in incinerators for energy recovery. However, this practice is not aligned with the circular economy [53]. To achieve complete separation of the component materials, which are majority paper and plastic, special methods and equipment are required. Some of the emerging techniques in recycling MMFPs such as single-use plastics include pyrolysis or gasification, depolymerization, solvent-based extraction, and compatibility [52].
In Taiwan, one of the few companies that specializes in the separation of plastic and paper components in single-use plastic is Zhenglong Co., Ltd. This company was established way back in 1959 and has since been the frontrunner in papermaking and paper converting [54]. Once the paper component is separated from the single-use plastic wastes, this will be used to produce household and industrial products. On the other hand, plastic components are used for sustainable construction materials, such as PE as a partial replacement for natural aggregates in cement mortar. Since only a few companies have the capability to separate the plastic and paper components, the fabrication of PE concrete entails huge transportation costs. The single-use plastic supplier is situated in Hsinchu, whereas the plastic pavement manufacturer is based in Tainan. This geographical constraint leads to substantial transportation costs, making the fabrication of PE concrete highly inefficient.
Table 7. Estimated transportation cost for the fabrication of PE concrete.
Single-use plastic provider Plastic pavement manufacturer Distance Duration of trip Total transportation cost per day (NTD)
Zhenglong Co., Ltd. Aplus Molds & Plastics Co., Ltd. 235 2 hr 40 mins 12000

3.3. Carbon footprint emission

The calculated carbon footprint for SSRS cement mortar samples is summarized in Table 8. Results showed that by essentially increasing the w/c ratio, the overall carbon footprint is reduced. On the other hand, increasing the SSRS replacement amount resulted in higher carbon footprint emissions while maintaining the w/c ratio constant. This could be attributed to the various fine aggregates used in the cement mortar, which were sourced from different locations in Taiwan. This resulted in additional diesel emissions during the transport of the said fine aggregates.
Similarly, the carbon footprint emission of PE cement mortar is summarized in Table 9. Increasing the w/c ratio also resulted in a relatively lower carbon footprint emission. Further increasing the replacement amount of PE in the cement mortar resulted in a higher carbon footprint because it requires an additional process of transporting the recycled PE from the recycling facility to the cement mortar/concrete manufacturer.

4. Conclusions

The results of this study confirmed that stainless-steel reduced slag (SSRS) and polyethylene (PE) can be used as partial replacement of cement in cement mortar samples. Furthermore, the following conclusions can be drawn:
  • With increasing SSRS substitution amount, the overall workability (slump and slump flow) of the cement mortar mixture was enhanced. This can be attributed to the more uniform size and shape distribution of SSRS. On the other hand, increasing the PE substitution amount resulted in reduced overall workability. This can be attributed to the non-uniform size distribution and angular shape of the PE aggregates.
  • In terms of the mechanical properties (compressive strength, flexural strength, and tensile strength), a similar trend was observed for both cases. Increasing the substitution amount for both SSRS and PE resulted in lower mechanical strength. Similarly, increasing the w/c ratio also resulted in poor mechanical properties due to enhanced formation of porosity in the cement mortar samples.
  • Ultrasonic pulse velocity (UPV) test results showed that increasing the w/c ratio from 0.4 to 0.6 reduced the UPV by up to 6%. Increasing the PE substitution amount from 0% to 4% also reduced the UPV by 5-8%. Similarly, increasing the w/c ratio reduced the UPV of SSRS-cement mortar samples by up to 12%. While increasing the SSRS substitution amount from 0% to 10% reduced the UPV by up to 11%. The decreasing trend in the UPV is attributed to the increased formation of porosity in the test specimen and the increased number of barriers that attenuated the ultrasonic wave.
  • The water absorption results showed that for both PE-cement mortar and SSRS-cement mortar samples, increasing the w/c ratio and substitution amount resulted in increased water absorption due to increased formation of porosity in the test body. These findings are in good agreement with the mechanical tests done in this study.
  • Comparative analysis of the transportation costs and carbon footprint emission showed that geographical location remains a challenge in the fabrication of cement mortar with PE and SSRS as partial replacements for aggregates. More efforts are needed to make PE and SSRS more accessible to cement mortar manufacturers all over Taiwan to further reduce the cost of fabrication.
This study has successfully presented two alternative methods for utilizing industrial waste (SSRS) and plastic waste (PE plastic from food containers) to create sustainable, low-cost, and environmentally friendly construction and building materials. Further studies are recommended to enhance the adhesion between cement paste and recycled aggregates. While demonstrating the value of recycling industrial and plastic wastes and reintroducing them into the economy, it is crucial to investigate alternatives aligned with circular economy principles, minimizing waste and pollution while maximizing product value throughout their lifecycle. These findings highlight that substituting a portion of cement in the cement mortar mixture can reduce overall carbon footprint emissions. However, optimal mechanical properties are only achieved with a certain percentage of recycled material substitution in the cement mortar. Higher substitution amounts, particularly in PE-substituted and SSRS-substituted mortar, result in significantly lower mechanical properties.

Author Contributions

Conceptualization, S.-L.T., H.-Y.W., K.-T.L, C.-C.C; methodology, S.-L.T., H.-Y.W.; formal analysis, S.-L.T., K.-T.L, C.-C.C; resources, S.-L.T., K.-T.L, C.-C.C; data curation, S.-L.T., K.-T.L, C.-C.C; writing—original draft preparation, S.-L.T.; writing—review and editing, S.-L.T., K.-T.L, C.-C.C; supervision, H.-Y.W. All authors have read and agreed to the published version of the manuscript.

Funding

This research received no external funding.

Data Availability Statement

Not applicable.

Conflicts of Interest

The authors declare no conflict of interest.

References

  1. Belaïd, F. (2022). How does concrete and cement industry transformation contribute to mitigating climate change challenges? Resources, Conservation & Recycling Advances, 15, 200084.
  2. Nwankwo, C.O., et al., High volume Portland cement replacement: A review. Construction and Building materials, 2020. 260: p. 120445. [CrossRef]
  3. Dunuweera, S. P., & Rajapakse, R. M. G. (2018). Cement types, composition, uses and advantages of nanocement, environmental impact on cement production, and possible solutions. Advances in Materials Science and Engineering, 2018, 1-11.
  4. World Energy Outlook 2014. 2014: Paris, France.
  5. (CSI), C.S.I., Cement Industry Energy and CO2 Performance: Getting the Numbers Right (GNR). 2016.
  6. Sigvardsen, N.M., et al., Impact of production parameters on physiochemical characteristics of wood ash for possible utilisation in cement-based materials. Resources, Conservation and Recycling, 2019. 145: p. 230-240. [CrossRef]
  7. Wang, Q., D. Wang, and S. Zhuang, The soundness of steel slag with different free CaO and MgO contents. Construction and Building Materials, 2017. 151: p. 138-146. [CrossRef]
  8. Biskri, Y., et al., Mechanical and durability characteristics of High Performance Concrete containing steel slag and crystalized slag as aggregates. Construction and Building Materials, 2017. 150: p. 167-178. [CrossRef]
  9. Rosales, J., et al., Alkali-Activated Stainless Steel Slag as a Cementitious Material in the Manufacture of Self-Compacting Concrete. Materials, 2021. 14(14): p. 3945. [CrossRef]
  10. Miranda, T., et al., Application of alkali-activated industrial wastes for the stabilisation of a full-scale (sub) base layer. Journal of Cleaner Production, 2020. 242: p. 118427. [CrossRef]
  11. Clavier, K.A., et al., Opportunities and challenges associated with using municipal waste incineration ash as a raw ingredient in cement production–a review. Resources, Conservation and Recycling, 2020. 160: p. 104888. [CrossRef]
  12. Le, D.-H., Y.-N. Sheen, and Q.-B. Bui, An assessment on volume stabilization of mortar with stainless steel slag sand. Construction and Building Materials, 2017. 155: p. 200-208. [CrossRef]
  13. Chang, C.-J. Strategies for promoting steelmaking slag resourcezation in Taiwan. in MATEC Web of Conferences. 2018. EDP Sciences. [CrossRef]
  14. Sheen, Y.-N., D.-H. Le, and M.N.-T. Lam, Performance of self-compacting concrete with stainless steel slag versus fly ash as fillers: A comparative study. Periodica Polytechnica Civil Engineering, 2021. 65(4): p. 1050-1060. [CrossRef]
  15. Liu, S. and L. Li, Influence of fineness on the cementitious properties of steel slag. Journal of Thermal Analysis and Calorimetry, 2014. 117(2): p. 629-634. [CrossRef]
  16. Ducman, V. and A. Mladenovič, The potential use of steel slag in refractory concrete. Materials Characterization, 2011. 62(7): p. 716-723. [CrossRef]
  17. Monosi, S., M.L. Ruello, and D. Sani, Electric arc furnace slag as natural aggregate replacement in concrete production. Cement and concrete composites, 2016. 66: p. 66-72. [CrossRef]
  18. Groh, K.J., et al., Overview of known plastic packaging-associated chemicals and their hazards. Science of the total environment, 2019. 651: p. 3253-3268. [CrossRef]
  19. The New Plastics Economy — Rethinking the future of plastics. 2016.
  20. Yearbook of Environmental Protection Statistics. 2021: Taipei, Taiwan.
  21. 2020 sales news for wholesale, retail, and food services. 2020; Available from: https://www.moea.gov.tw/Mns/dos/bulletin/Bulletin.aspx?kind=9&html=1&menu_id=18808&bull_id=7217.
  22. Kulkarni, B.N. and V. Anantharama, Repercussions of COVID-19 pandemic on municipal solid waste management: Challenges and opportunities. Science of the Total Environment, 2020. 743: p. 140693. [CrossRef]
  23. Yousefi, M., et al., Municipal solid waste management during COVID-19 pandemic: effects and repercussions. Environmental Science and Pollution Research, 2021. 28(25): p. 32200-32209. [CrossRef]
  24. Sarkodie, S.A. and P.A. Owusu, Impact of COVID-19 pandemic on waste management. Environment, development and sustainability, 2021. 23(5): p. 7951-7960. [CrossRef]
  25. Geyer, R., J.R. Jambeck, and K.L. Law, Production, use, and fate of all plastics ever made. Science advances, 2017. 3(7): p. e1700782. [CrossRef]
  26. Raheem, D., Application of plastics and paper as food packaging materials-An overview. Emirates Journal of Food and Agriculture, 2013: p. 177-188. [CrossRef]
  27. Ncube, L.K., et al., An overview of plastic waste generation and management in food packaging industries. Recycling, 2021. 6(1): p. 12. [CrossRef]
  28. Rumšys, D., et al., Comparison of material properties of lightweight concrete with recycled polyethylene and expanded clay aggregates. Procedia Engineering, 2017. 172: p. 937-944. [CrossRef]
  29. Al-Osta, M.A., et al., Development of sustainable concrete using recycled high-density polyethylene and crumb tires: Mechanical and thermal properties. Journal of Building Engineering, 2022. 45: p. 103399. [CrossRef]
  30. Yoo, D.-Y. and M.-J. Kim, High energy absorbent ultra-high-performance concrete with hybrid steel and polyethylene fibers. Construction and Building Materials, 2019. 209: p. 354-363. [CrossRef]
  31. Dong, Q., et al., Recycling of steel slag aggregate in portland cement concrete: An overview. Journal of Cleaner Production, 2021. 282: p. 124447. [CrossRef]
  32. Fisher, L.V. and A.R. Barron, The recycling and reuse of steelmaking slags—A review. Resources, Conservation and Recycling, 2019. 146: p. 244-255.
  33. Jiménez, L. F., Dominguez, J. A., & Vega-Azamar, R. E. (2018). Carbon footprint of recycled aggregate concrete. Advances in civil engineering, 2018. [CrossRef]
  34. Instituto Nacional de Ecología. (2004). Inventario Nacional de Emisiones de Gases de Efecto Invernadero 1990-2002. Instituto Nacional de Ecología, México.
  35. Turner, L. K., & Collins, F. G. (2013). Carbon dioxide equivalent (CO2-e) emissions: A comparison between geopolymer and OPC cement concrete. Construction and building materials, 43, 125-130. [CrossRef]
  36. Secretaría del Medio Ambiente y Recursos Naturales. (2015). Registro Nacional de Emisiones. Secretaría del Medio Ambiente y Recursos Naturales, México.
  37. Comisión Nacional para el Uso Eficiente de la Energía. (2011). Estudio Integral de Sistemas de Bombeo de Agua Potable Municipal. Comisión Nacional para el Uso Eficiente de la Energía, México.
  38. Al-Hadithi, A.I., A.T. Noaman, and W.K. Mosleh, Mechanical properties and impact behavior of PET fiber reinforced self-compacting concrete (SCC). Composite Structures, 2019. 224: p. 111021. [CrossRef]
  39. Rahim, N.L., et al. Use of plastic waste (high density polyethylene) in concrete mixture as aggregate replacement. in Advanced Materials Research. 2013. Trans Tech Publ. [CrossRef]
  40. Sharma, R. and P.P. Bansal, Use of different forms of waste plastic in concrete–a review. Journal of Cleaner Production, 2016. 112: p. 473-482. [CrossRef]
  41. Liu, Y., et al., Research Progress on Controlled Low-Strength Materials: Metallurgical Waste Slag as Cementitious Materials. Materials, 2022. 15(3): p. 727. [CrossRef]
  42. Susanto, A., D.A. Koleva, and K. van Breugel, The effect of water-to-cement ratio and curing on material properties of mortar specimens in stray current conditions. Journal of Advanced Concrete Technology, 2017. 15(10): p. 627-643. [CrossRef]
  43. Hedjazi, S., Compressive strength of lightweight concrete. Compressive Strength of Concrete, 2019: p. 1-8.
  44. Kodua, J., et al., Influence of recycled waste high density polyethylene plastic aggregate on the physico-chemical and mechanical properties of concrete. 2018.
  45. Lee, Z.H., et al., Modification of waste aggregate PET for improving the concrete properties. Advances in Civil Engineering, 2019. 2019. [CrossRef]
  46. Fathy, S., et al., Comparison of hydration properties of cement-carbon steel slag and cement-stainless steel slag blended binder. Advances in Materials Science and Engineering, 2018. 2018. [CrossRef]
  47. Brand, A.S. and J.R. Roesler, Steel furnace slag aggregate expansion and hardened concrete properties. Cement and Concrete Composites, 2015. 60: p. 1-9. [CrossRef]
  48. Martins, A.C.P., et al., Steel slags in cement-based composites: An ultimate review on characterization, applications and performance. Construction and Building Materials, 2021. 291: p. 123265. [CrossRef]
  49. Aydın, A.C., et al., Effect of boron active belite cement on the compressive strength of concrete exposed to high temperatures. Journal of Civil, Construction and Environmental Engineering, 2018. 3: p. 47-52. [CrossRef]
  50. Saint-Pierre, F., et al., Concrete quality designation based on ultrasonic pulse velocity. Construction and Building Materials, 2016. 125: p. 1022-1027. [CrossRef]
  51. Babafemi, A.J., et al., Engineering properties of concrete with waste recycled plastic: A review. Sustainability, 2018. 10(11): p. 3875. [CrossRef]
  52. de Mello Soares, C.T., Ek, M., Östmark, E., Gällstedt, M., Karlsson, S., Recycling of multi-material multilayer plastic packaging: Current trends and future scenarios. Resources, Conservation, and Recycling, Vol. 176, 2022, pp. 1-8. [CrossRef]
  53. Kaiser, K., Schmid, M., & Schlummer, M. (2017). Recycling of polymer-based multilayer packaging: A review. Recycling, 3(1), 1. [CrossRef]
  54. CLC Corporation. (n.d.). Retrieved from https://www.clc.com.tw/en/ (Date Accessed: October 29, 2023).
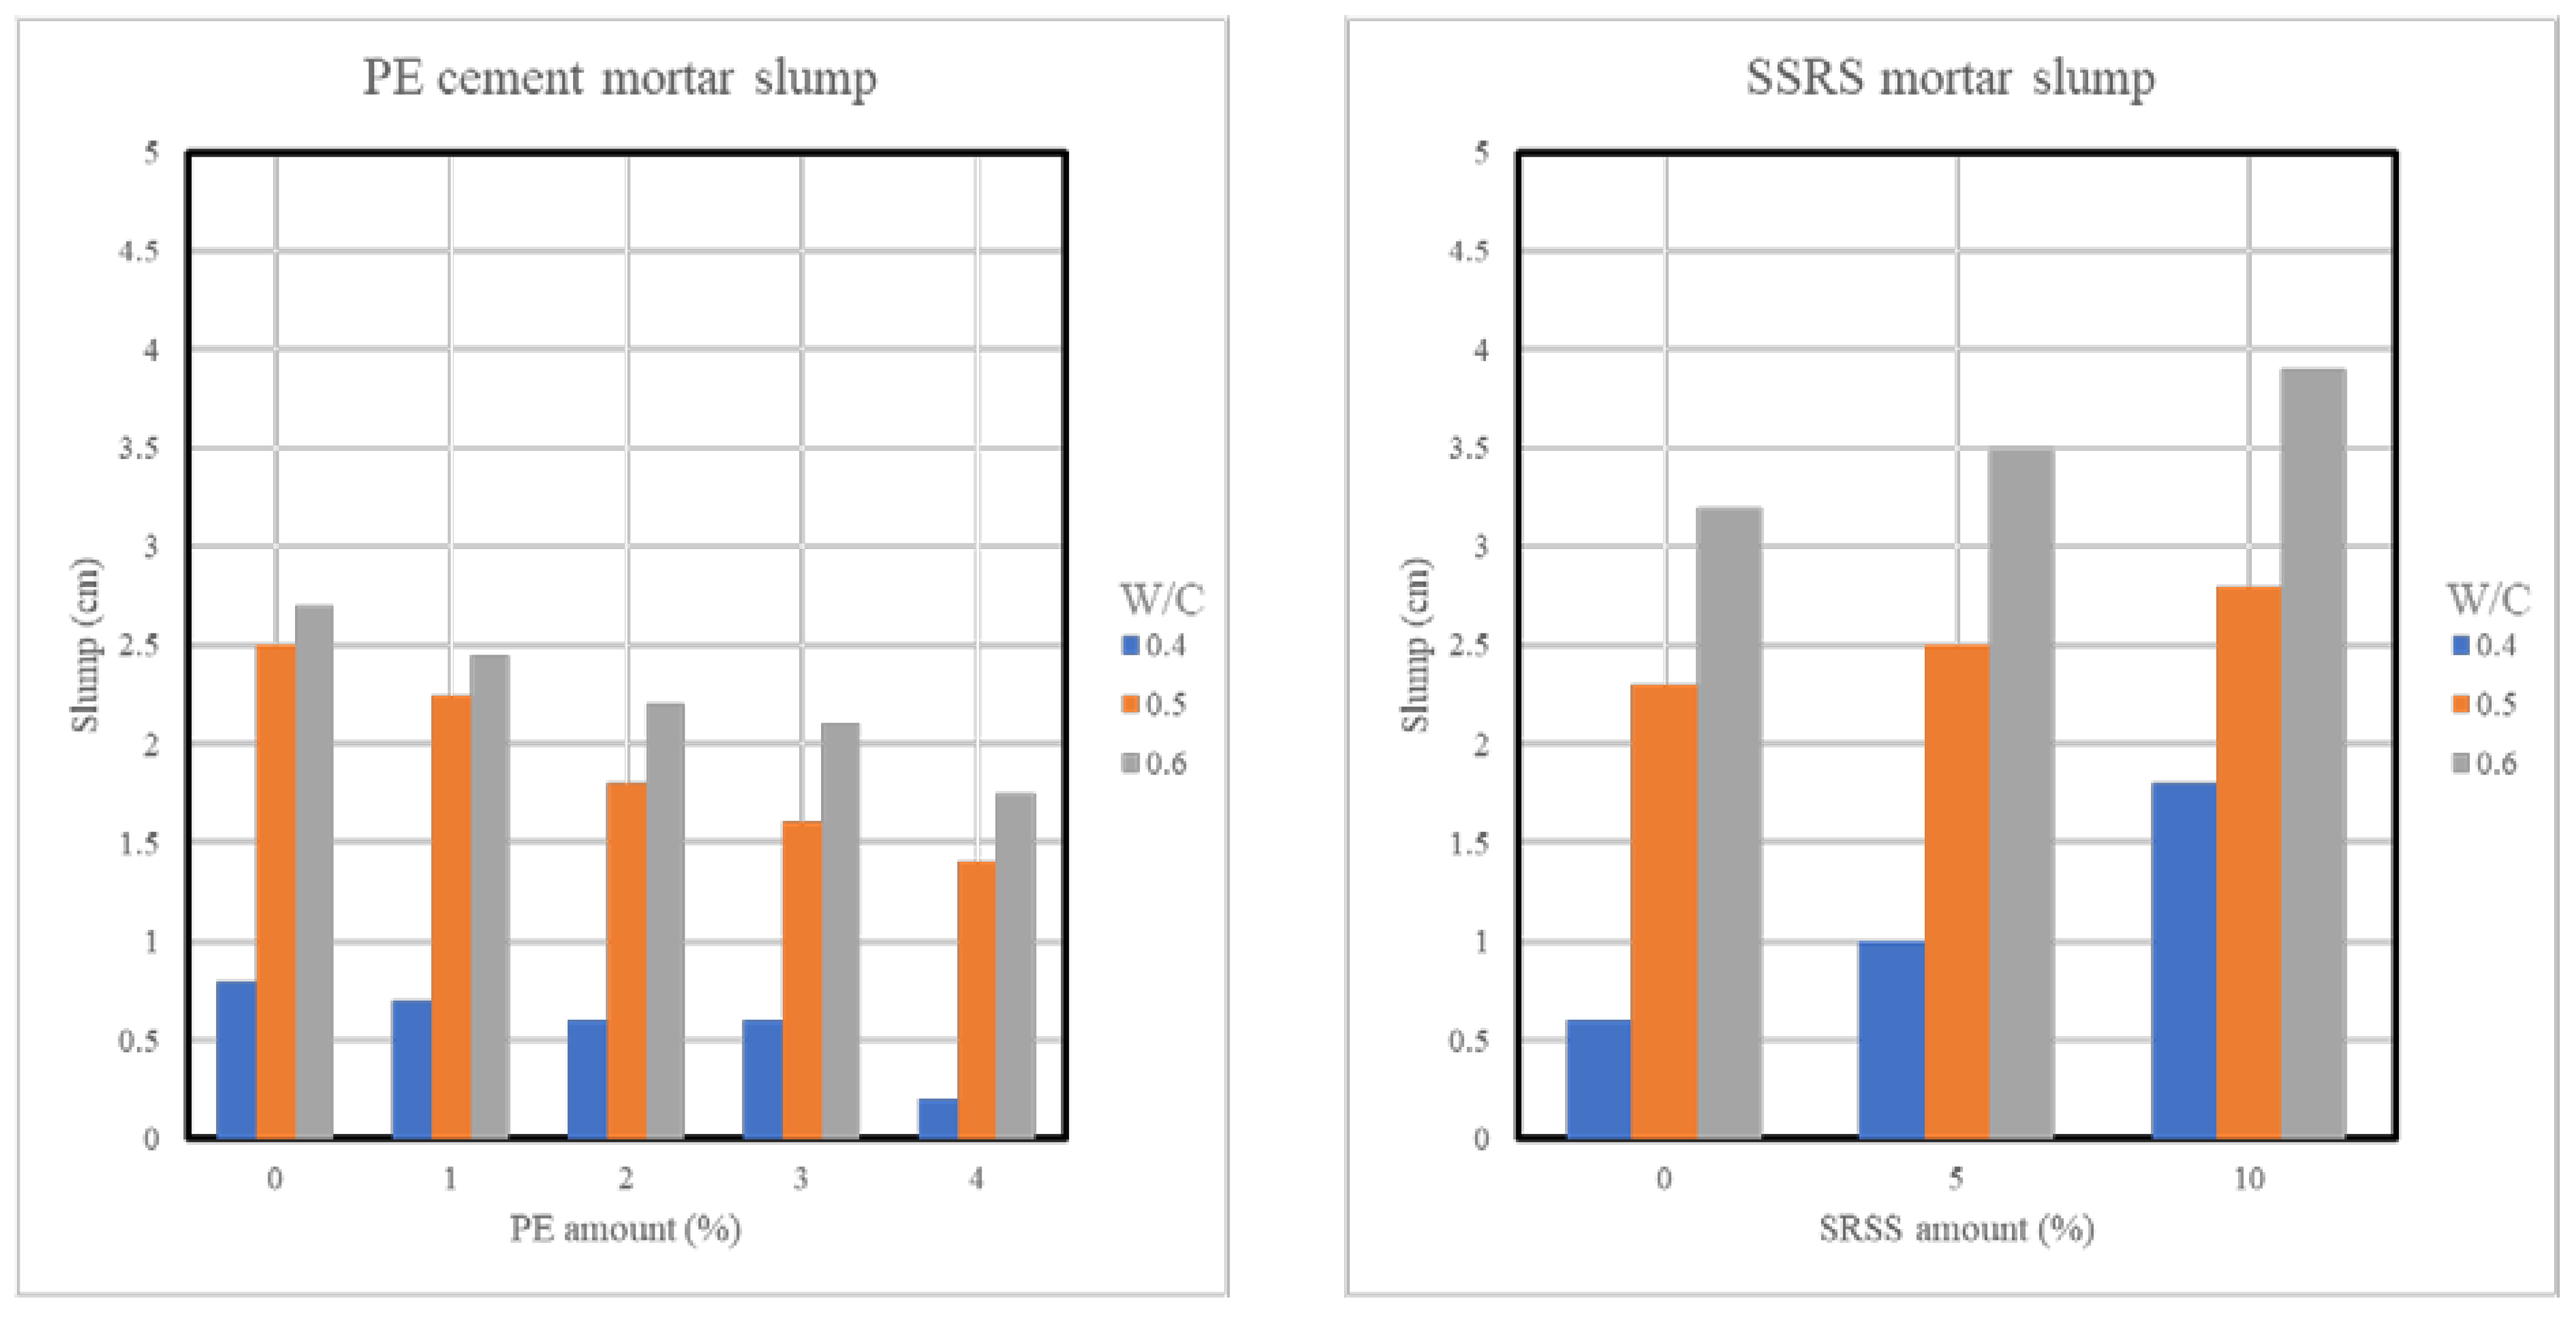
Figure 1. Slump measurement of cement mortar samples with different PE and SRSS substitution amounts.
Preprints 103538 g001
Figure 2. Flow of cement mortar samples with different PE and SRSS substitution amounts.
Preprints 103538 g002
Figure 3. Compressive strength of cement mortar samples with different w/c and PE substitution amounts.
Preprints 103538 g003
Figure 4. Compressive strength of cement mortar samples with different w/c and SSRS substitution amounts.
Preprints 103538 g004
Figure 5. Flexural strength of cement mortar samples with different w/c ratios and PE substitution amounts.
Preprints 103538 g005
Figure 6. Flexural strength of cement mortar samples with different w/c ratios and SSRS substitution amounts.
Preprints 103538 g006
Figure 11. Water absorption of cement mortar samples with different w/c ratios and PE substitution amount.
Preprints 103538 g011
Figure 12. Water absorption of cement mortar samples with different w/c ratios and SSRS substitution amount.
Preprints 103538 g012
Table 1. Test mix proportion for SSRS-substituted cement mortar samples (unit: kg/m3).
w/c GGBFS Fly ash SSRS
Substitution amount (%)
SSRS Cement Sand Water
0.4 87.20 43.60 0 0 437 1534.9 249.7
5 30.70 405.8
10 61.40 374.6
0.5 76.50 38.27 0 0 383.5 1534.9 274
5 27 356.1
10 53.90 328.7
0.6 87.20 34.09 0 0 341.72 1534.9 292.91
5 24.02 317.32
10 48.04 292.91
Table 2. Test mix proportions for PE-substituted cement mortar samples (unit: kg/m3).
w/c PE Substitution amount (%) PE Cement Sand Water
0.4 0 0 936.40 2302.32 374.56
1 13.85
2 27.69
3 41.54
4 55.38
0.5 0 0 821.85 2302.32 410.92
1 13.85
2 27.69
3 41.54
4 55.38
0.6 0 0 732.27 2302.32 439.36
1 13.85
2 27.69
3 41.54
4 55.38
Table 3. List of properties and the corresponding standards/references used.
Property Test Standard/Reference
Workability ASTM C143
Compressive strength ASTM C109
Flexural strength ASTM C348
Tensile strength ASTM C190
Ultrasonic pulse velocity ASTM C597
Water absorption rate ASTM C1585
Table 5. Emission factor of materials used in the production of cement mortar.
Material Emission factor (kg CO2-e/kg) Reference
Cement 0.745 [34]
Explosives 0.440 [35]
Diesel 2.680 [35]
Coarse aggregates 0.041 [35]
Fine aggregates 0.014 [35]
Electricity 0.458 [36]
Water 0.540 [37]
Concrete 0.012 [35]
Table 6. Estimated transportation cost for the fabrication of SSRS concrete.
SSRS Provider Concrete pavement manufacturer Distance (km) Duration of trip Transportation cost per day (NTD)
Tang Rong Iron Works Co., Ltd. (Kaohsiung) Shin Feng Concrete Co., Ltd. (Pingtung) 19.3 30 mins 3000
Tang Rong Iron Works Co., Ltd. (Kaohsiung) Tianjiu Industrial Co., Ltd. (Tainan) 114 1 hr 30 mins 6000
Yelian Iron and Steel Co., Ltd. (Kaohsiung) Shin Feng Concrete Co., Ltd. (Pingtung) 50.4 1 hr 4500
Yelian Iron and Steel Co., Ltd. (Kaohsiung) Tianjiu Industrial Co., Ltd. (Tainan) 81.3 1 hr 4500
Walsin Lihwa Co., Ltd. (Tainan) Tianjiu Industrial Co., Ltd. (Tainan) 14.8 20 mins 3000
Walsin Lihwa Co., Ltd. (Tainan) Tai Fu Cement Products Co., Ltd. (Changhua) 110 1 hr 20 mins 6000
Walsin Lihwa Co., Ltd. (Tainan) Yama Development Co., Ltd. (Nantou) 106 1 hr 15 mins 6000
Walsin Lihwa Co., Ltd. (Tainan) Shangmei Industrial Co., Ltd. (Hsinchu) 226 2 hr 30 mins 12000
Ronggang Material Technology Co., Ltd. (Tainan) Tianjiu Industrial Co., Ltd. (Tainan) 24.3 20 mins 3000
Ronggang Material Technology Co., Ltd. (Tainan) Tai Fu Cement Products Co., Ltd. (Changhua) 108 1 hr 20 mins 6000
Ronggang Material Technology Co., Ltd. (Tainan) Yama Development Co., Ltd. (Nantou) 104 1 hr 10 mins 6000
Ronggang Material Technology Co., Ltd. (Tainan) Shangmei Industrial Co., Ltd. (Hsinchu) 224 2 hr 20 mins 12000
Table 8. Carbon footprint calculation for SSRS cement mortar (unit: kg/m3).
w/c SSRS Substitution amount (%) Cement Aggregates Others Total
0.4 0 325.57 23.32 485.38 834.27
5 302.32 24.58 567.66 894.56
10 279.08 25.84 649.93 954.85
0.5 0 285.71 23.10 455.54 764.35
5 265.29 24.20 527.90 817.40
10 244.88 25.31 600.00 870.18
0.6 0 254.58 23.19 483.23 761.00
5 236.40 24.17 547.60 808.18
10 218.22 25.16 611.98 855.35
Table 9. Carbon footprint calculation for PE cement mortar (unit: kg/m3).
w/c PE Substitution amount (%) Cement Aggregates Others Total
0.4 0 697.62 32.23 0.54 762.62
1 697.62 32.80 0.58 763.80
2 697.62 33.37 0.61 764.97
3 697.62 33.94 0.65 766.14
4 697.62 34.50 0.69 767.31
0.5 0 612.28 32.23 0.54 677.28
1 612.28 32.80 0.58 678.46
2 612.28 33.37 0.61 679.63
3 612.28 33.94 0.65 680.80
4 612.28 34.50 0.69 681.97
0.6 0 545.54 32.23 0.54 610.55
1 545.54 32.80 0.58 611.72
2 545.54 33.37 0.61 612.89
3 545.54 33.94 0.65 614.06
4 545.54 34.50 0.69 615.24
Disclaimer/Publisher’s Note: The statements, opinions and data contained in all publications are solely those of the individual author(s) and contributor(s) and not of MDPI and/or the editor(s). MDPI and/or the editor(s) disclaim responsibility for any injury to people or property resulting from any ideas, methods, instructions or products referred to in the content.
Copyright: This open access article is published under a Creative Commons CC BY 4.0 license, which permit the free download, distribution, and reuse, provided that the author and preprint are cited in any reuse.
Prerpints.org logo

Preprints.org is a free preprint server supported by MDPI in Basel, Switzerland.

Subscribe

© 2024 MDPI (Basel, Switzerland) unless otherwise stated