2. Results
2.1. Identification of Datasets and Analysis of Differentially Expressed Genes
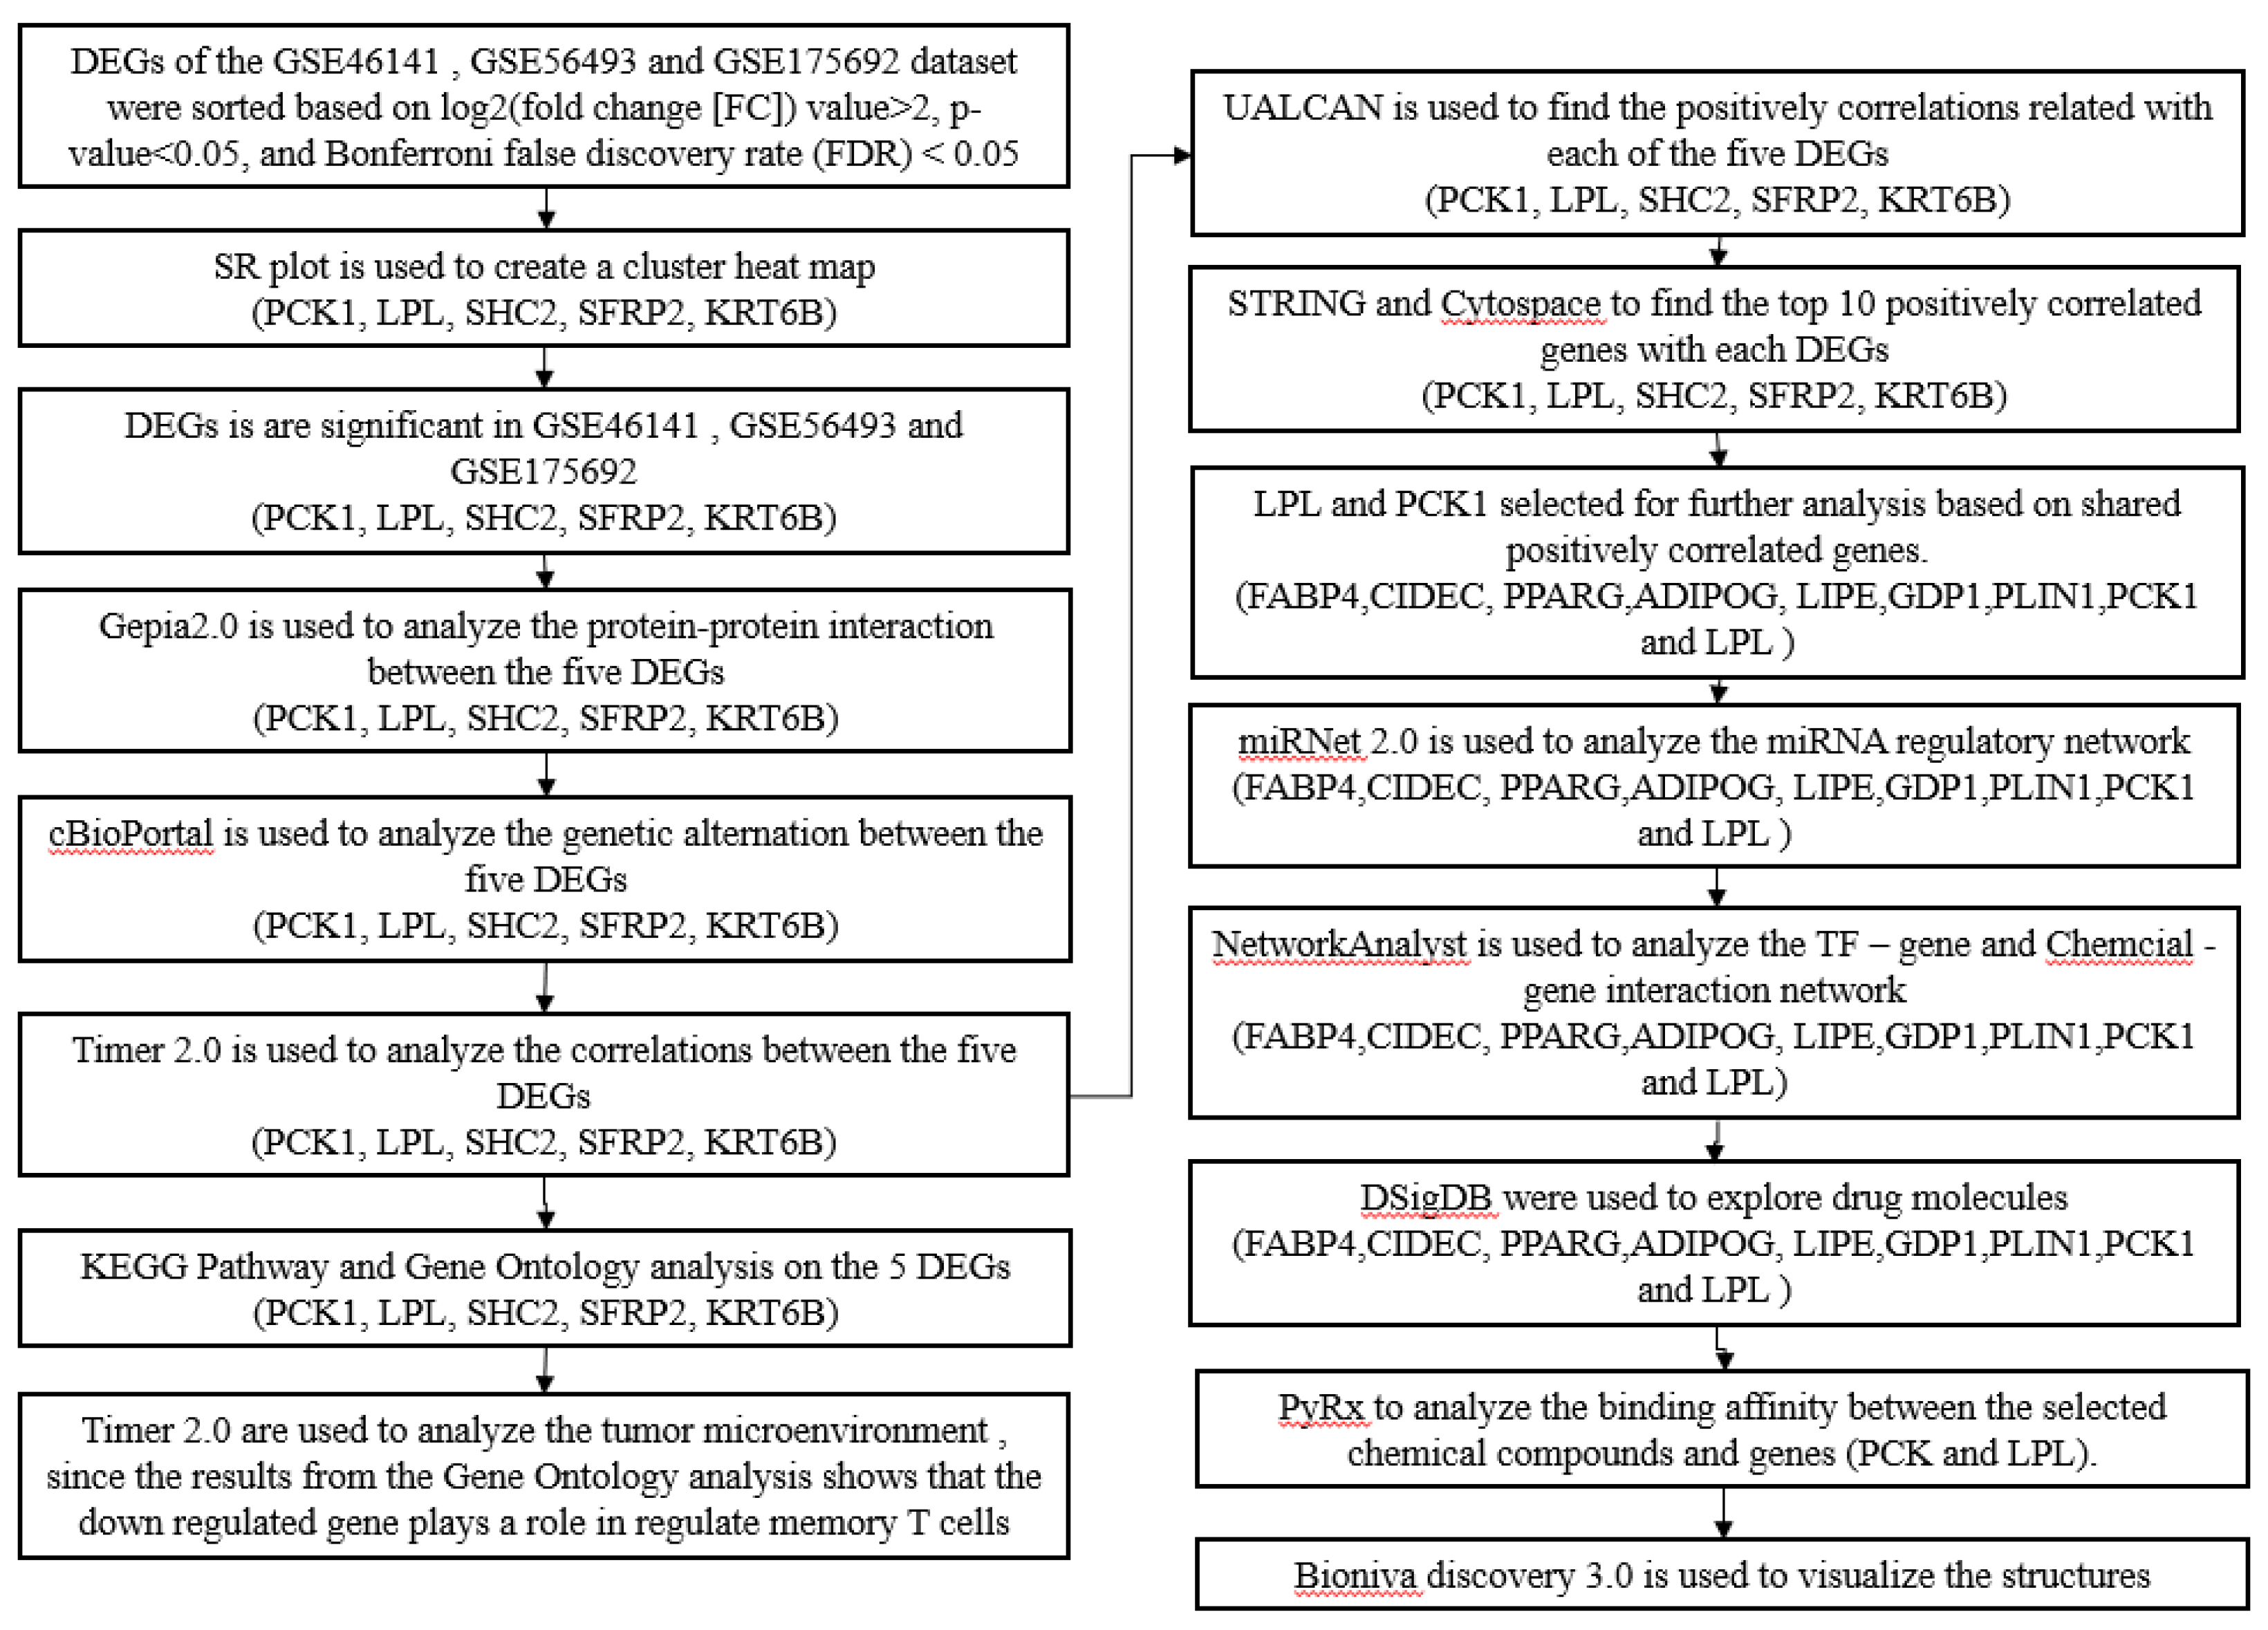
`The overall summary of the data analysis conducted in the study is shown in
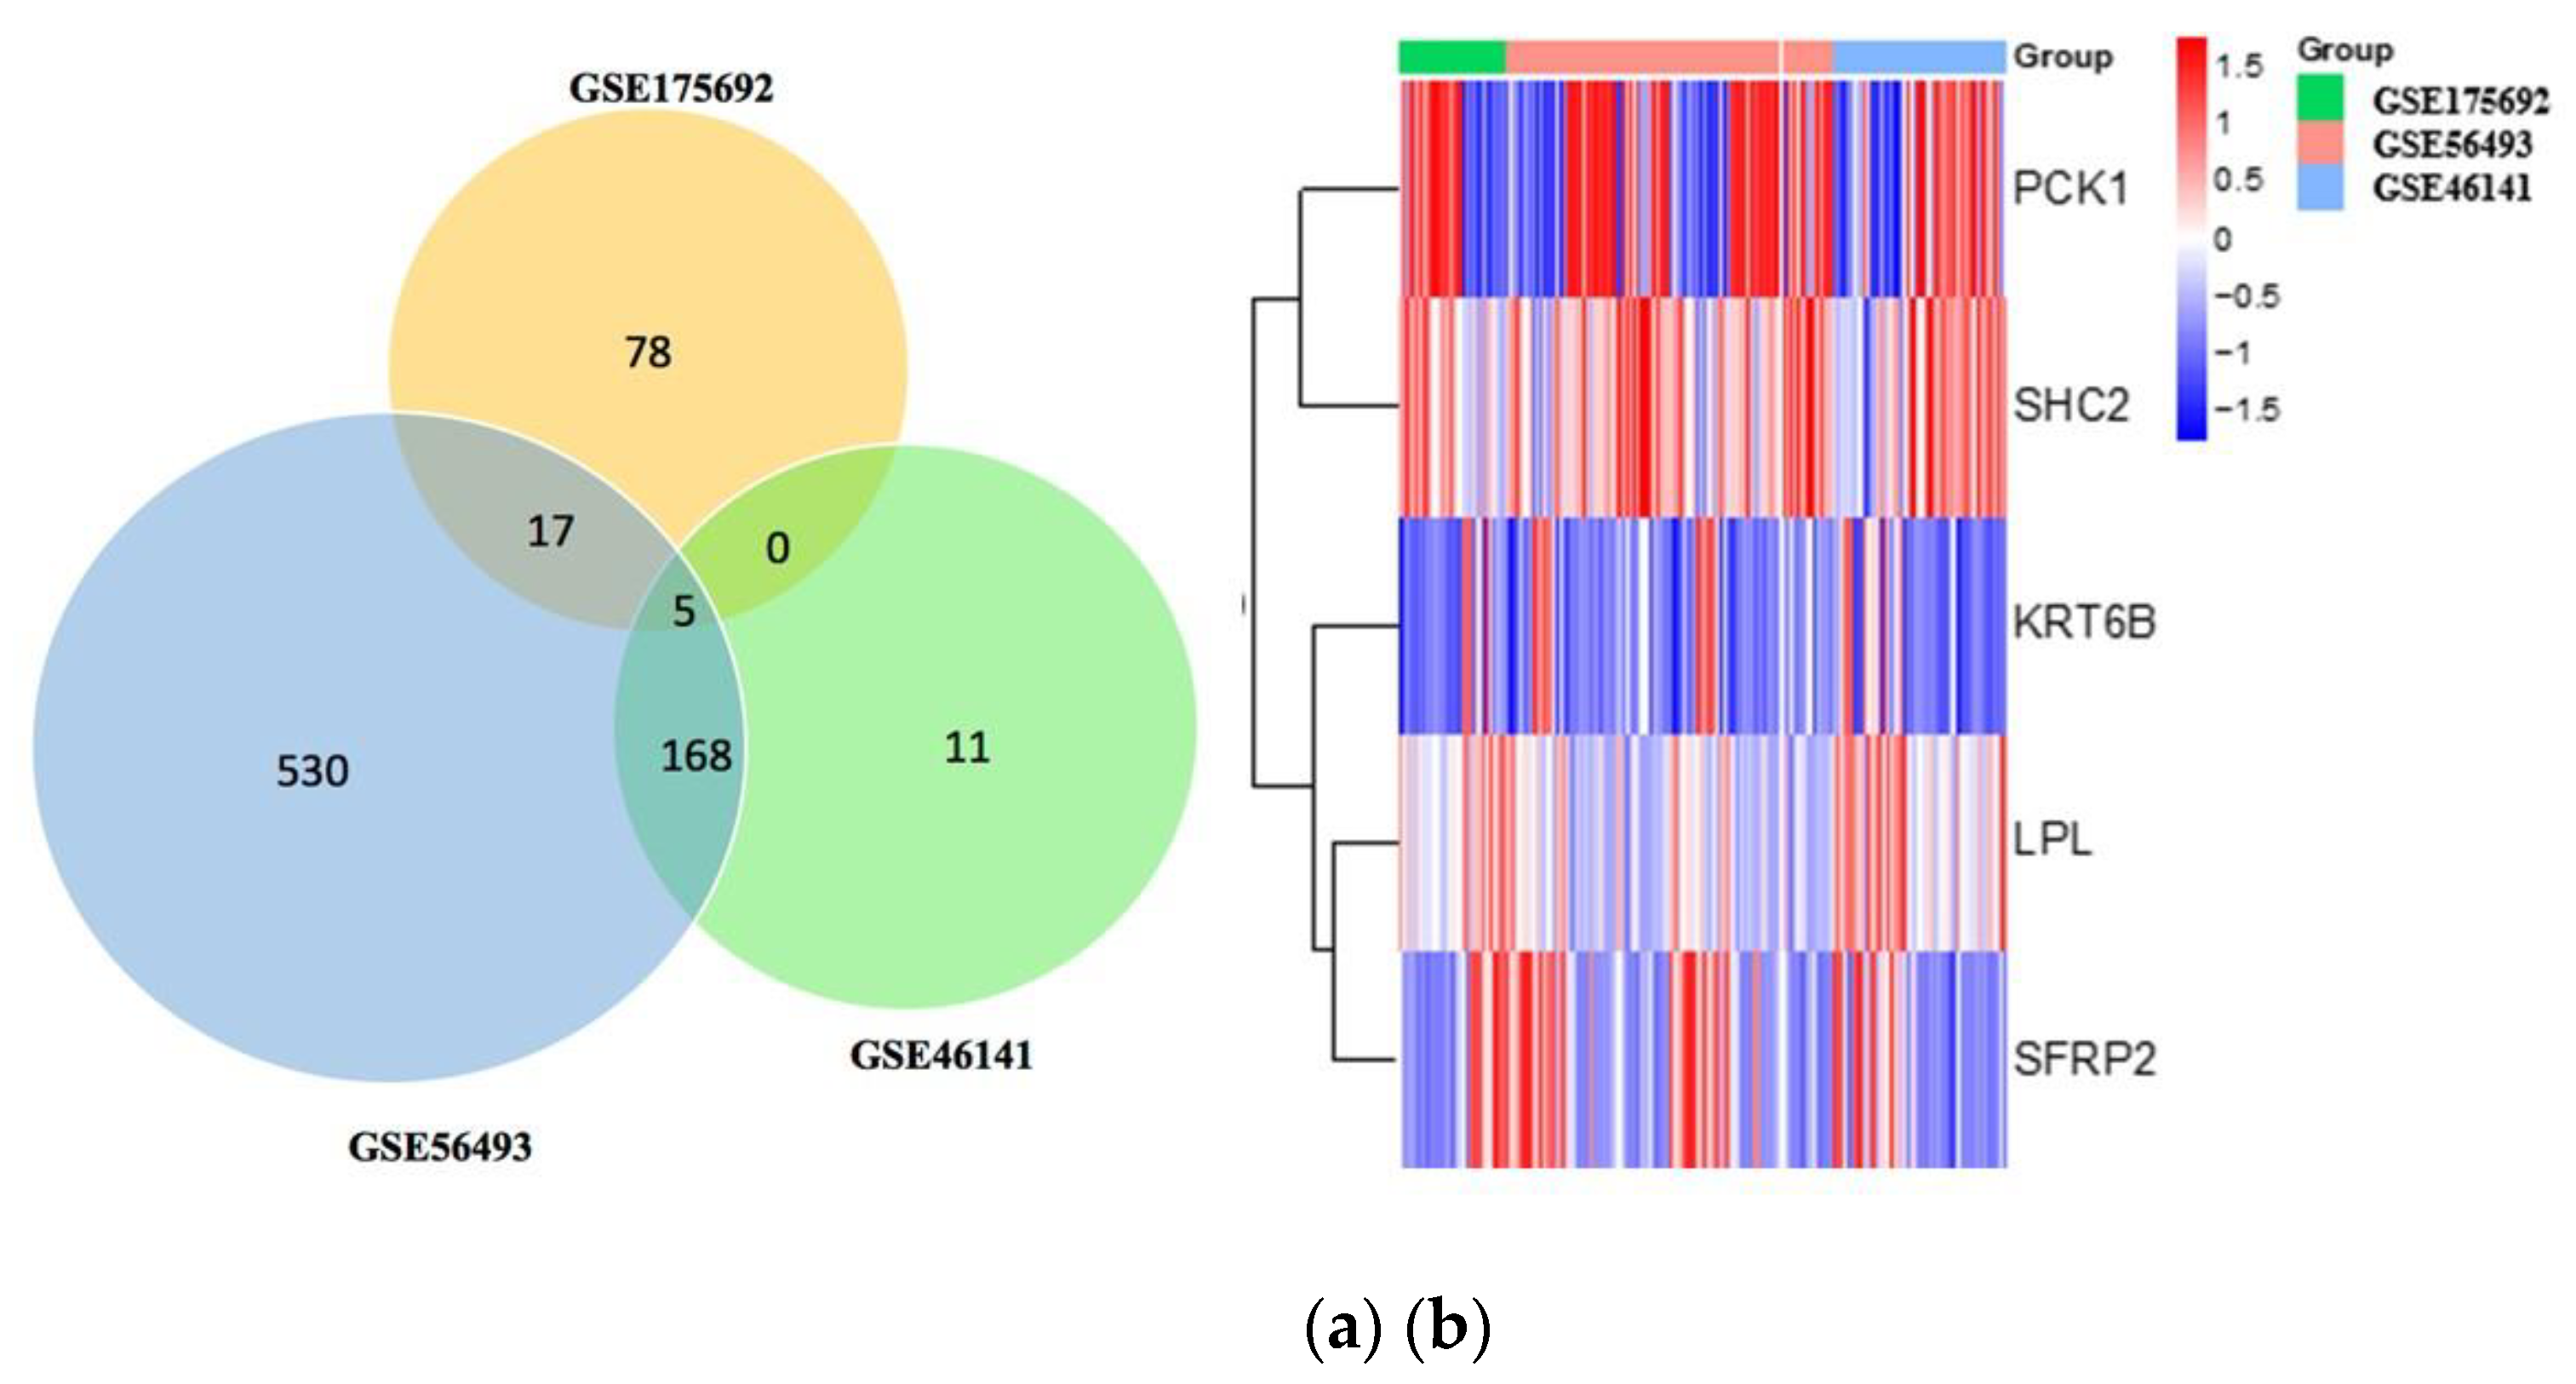
Figure 1. Gene expression profiles from the Gene Expression Omnibus (GEO) datasets GSE46141, GSE56493, and GSE175692 from breast cancer patients (n=125) were selected for our study. Among these samples, pre-treatment ones (n=83) were selected for our study. Results from the differential analysis between breast cancer local metastasis (n=16) versus breast cancer liver metastasis (n=11) in the GSE46141 dataset showed that 184 were significantly expressed with 154 genes being up-regulated and 30 genes being down-regulated. DEG analysis of the breast cancer metastasis samples from the breast (n=19) versus the liver (n=27) in the GSE56493 dataset showed that there were 720 genes significantly expressed with 434 being upregulated and 286 being downregulated. Further, DEG analysis of relapsed metastatic breast cancer in the breast (n=16) versus liver (n=27) showed that there were 100 genes was significantly expressed with 59 genes being up-regulated and 41 genes being down-regulated. Results from Venn analysis demonstrated that there were 5 genes (PCK1, SHC2, LPL, SFRP2, KRT6B) overlapped between the three datasets (
Figure 2a). Among the 5 genes, two genes (PCK1, SHC2) were upregulated and three (LPL, SFRP2, KRT6B) were downregulated. The expression levels of these DEGs were provided in the heatmap below (
Figure 2b).
2.2. Identification of Genetic Alterations in the DEGs
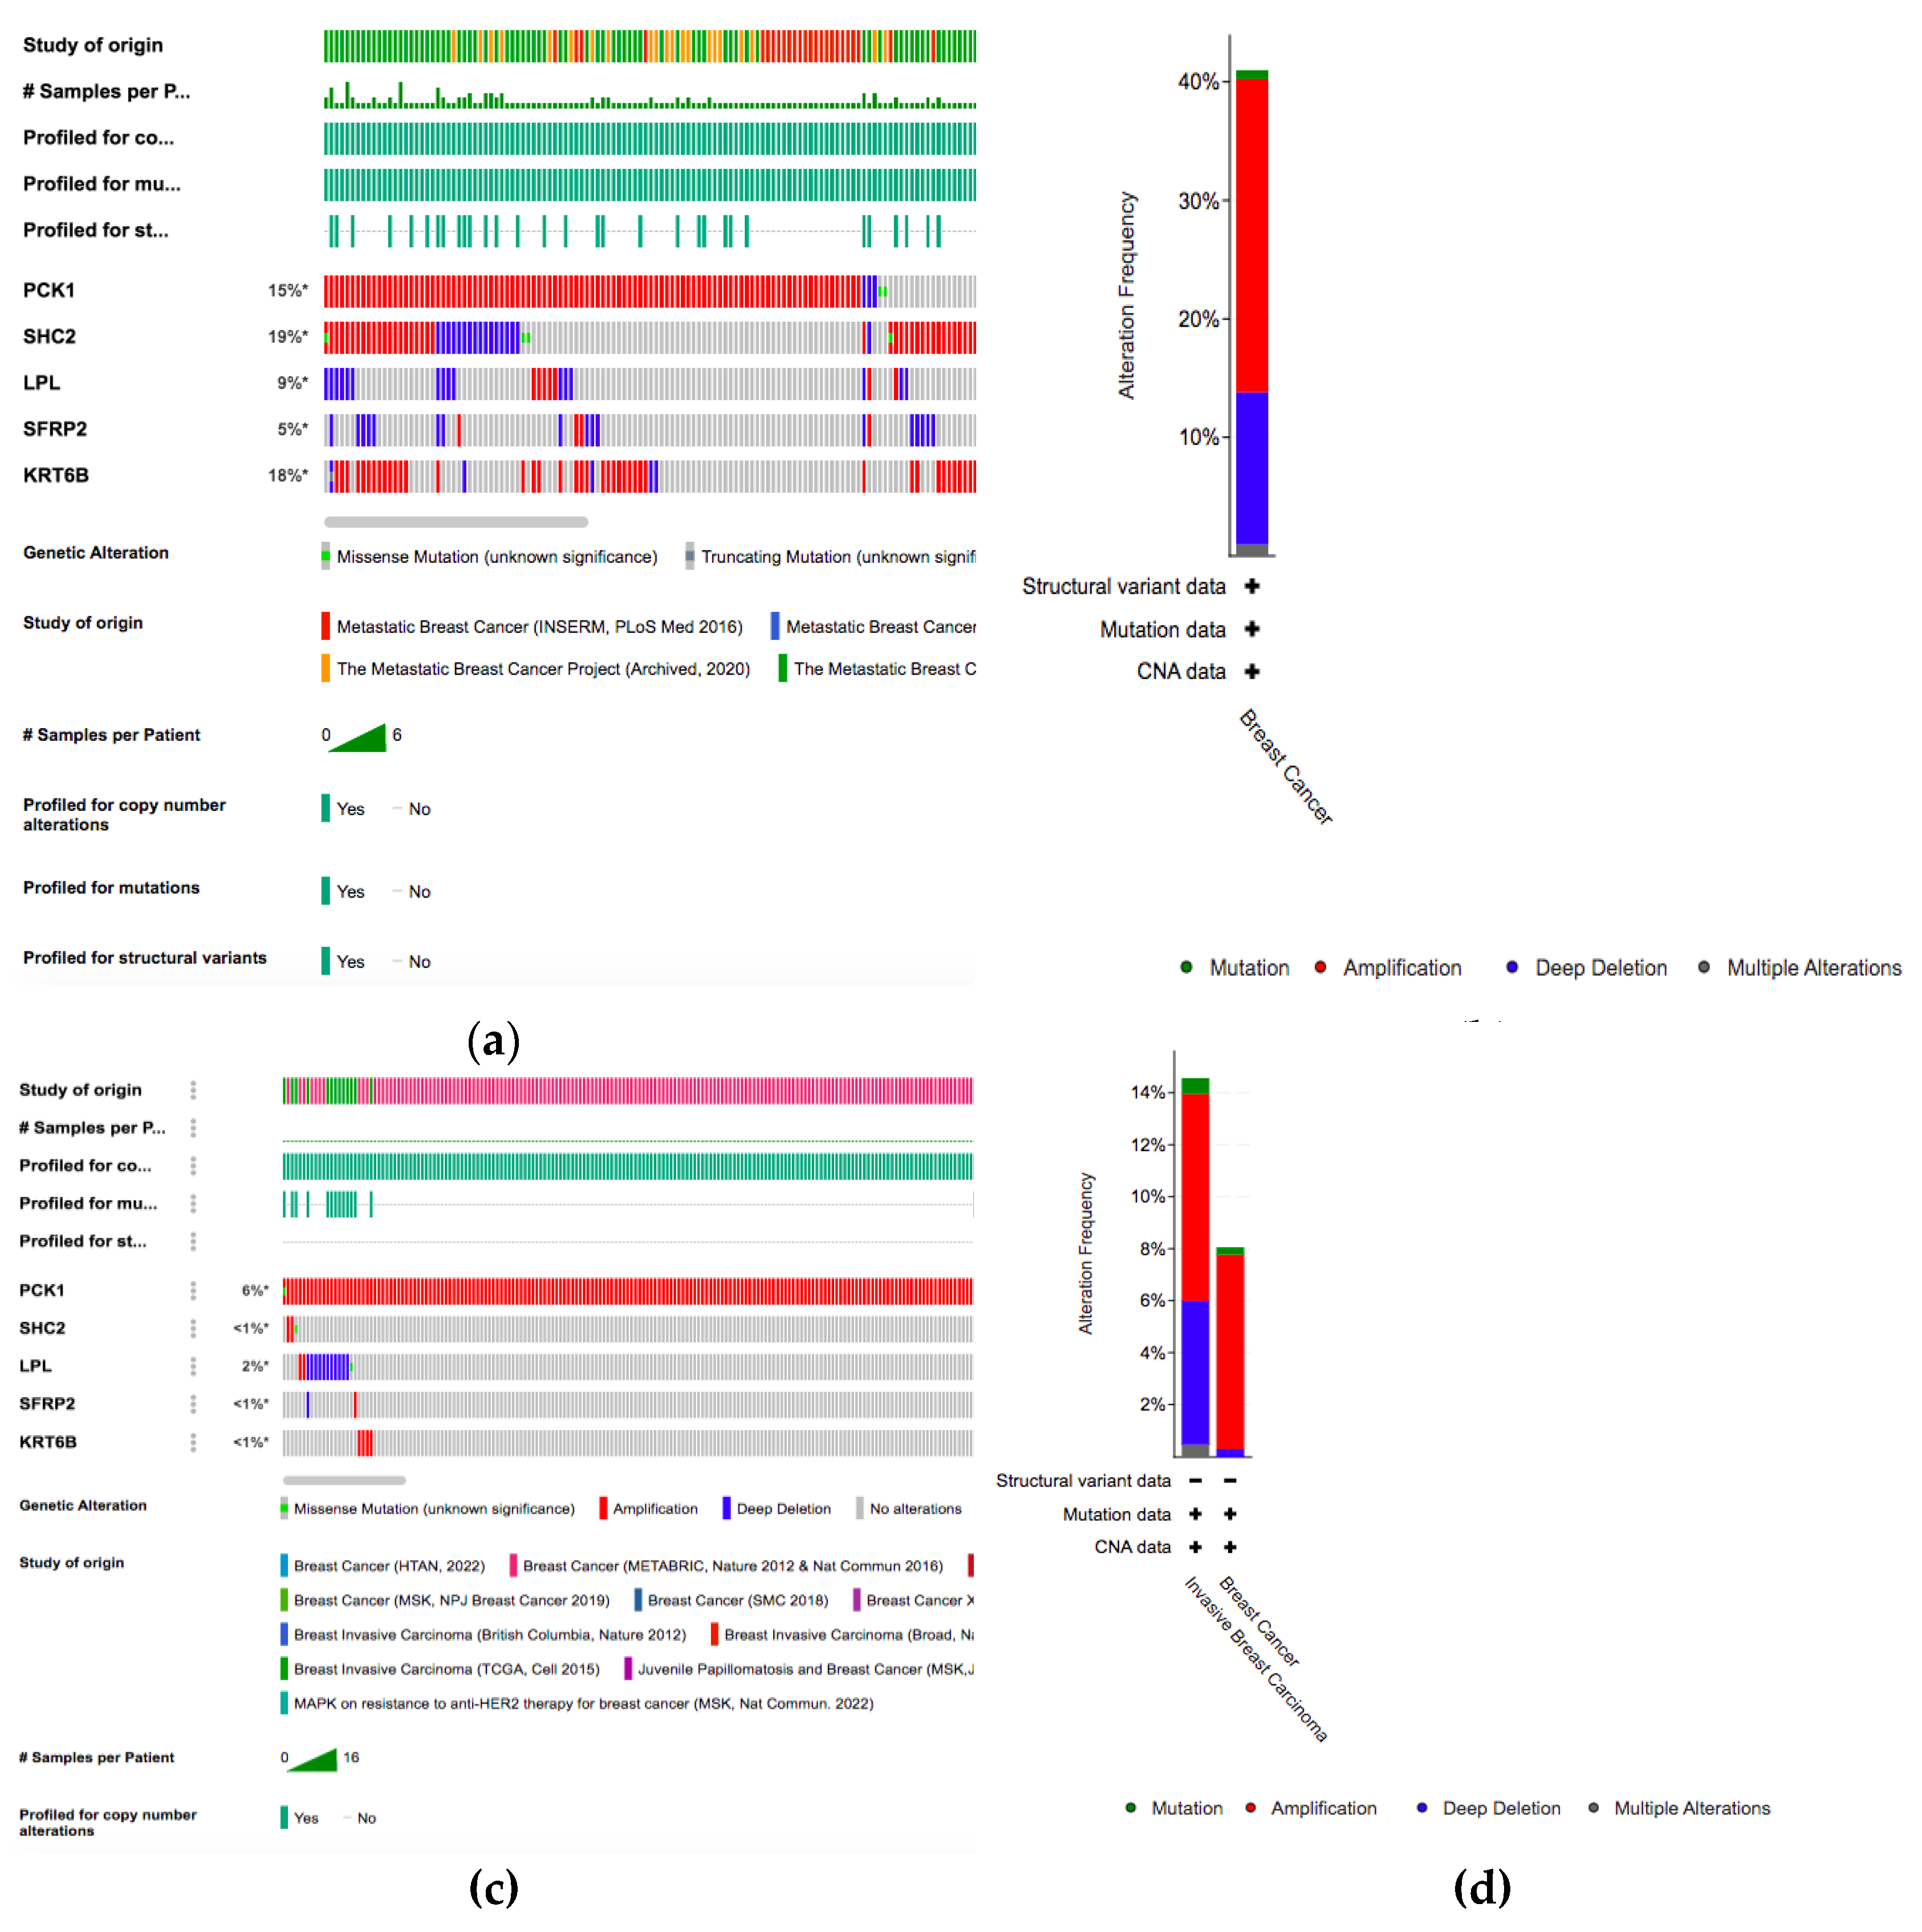
For the five genes (LPL, PCK1, KRT6B, SFRP2, SHC2) that are differentially expressed between the datasets, we analyzed the alterations in Metastatic Breast cancer and Invasive breast cancer genetic profiles (
Figure 3). Results from the metastatic breast samples showed that the SHC2 gene has the highest alterations in the genetic biomarker at 19%, KRT6B has alterations at 18%, and PCK1 has alterations at 15%. LPL(9%) and SFRP2(5%) both have lower genetic alterations compared to the other DEGS. In all the genes, many alterations are mostly composed of amplification and deep deletion. Conversely, there are no significant results shown in Breast Cancer Invasive dataset. PCK1 has a alterations at 6% and all the other genes have a genetic alterations lower than 2%.
2.3. Prognostic Information Hub Gene Expression
The Overall survival and Copy number variants of the DEGs were analyzed using the Breast Cancer integrative platform. The Kaplan-Meier plotter (Supplementary Figure 1) was used to identify the survival of the 5 DEGs. Results showed that the expression level SFRP2[HR = 0.544, P = 3.08e-5], SHC2 [HR = 6.54e-6, P = 0.733]and PCK1[HR = 0.541, P = 0.00175], was positively correlated with the overall survival of patients. The expression level of LPL[HR = 0.843, P = 0.0126] and KRT6B [HR = 0.736, P = 0.00787] doesn’t show a significant correlation to the overall survival of patients. Additionally, we analyzed the expression of the DEGs for copy number variants (CNV) (Supplementary Figure 2) gain (amplifications) and loss (deletions). Results showed that the expression of PCK1 is high when CNV is gained. Conversely, there is a high expression of LPL, SHC2, and SFRP2 when CNVs are lost. There is no significant change in expression in CNV for KRT6B. Then, compared the gene expression in CNV gain and loss to the survival analysis, but there isn’t any significant impact for all of the genes.
The GEPIA2 database was used to verify the expression levels of the DEGs in tumor and normal tissues. As shown in
Figure 4, SHC2, LPL, PCK1, and KRT6B are all under-expressed, and only SFRP2 was highly expressed in the breast tumor. Additionally, the expression levels of the DEGs in different stage BC patients are shown in the Supplementary Figure 3. As detail listed in the Supplementary Table 1, PCK1, LPL, and SFRP2 play a role in breast cancer’s initial and developmental stages, and KRT6B is exclusively related to the developmental stages.
2.4. Gene Network Analysis
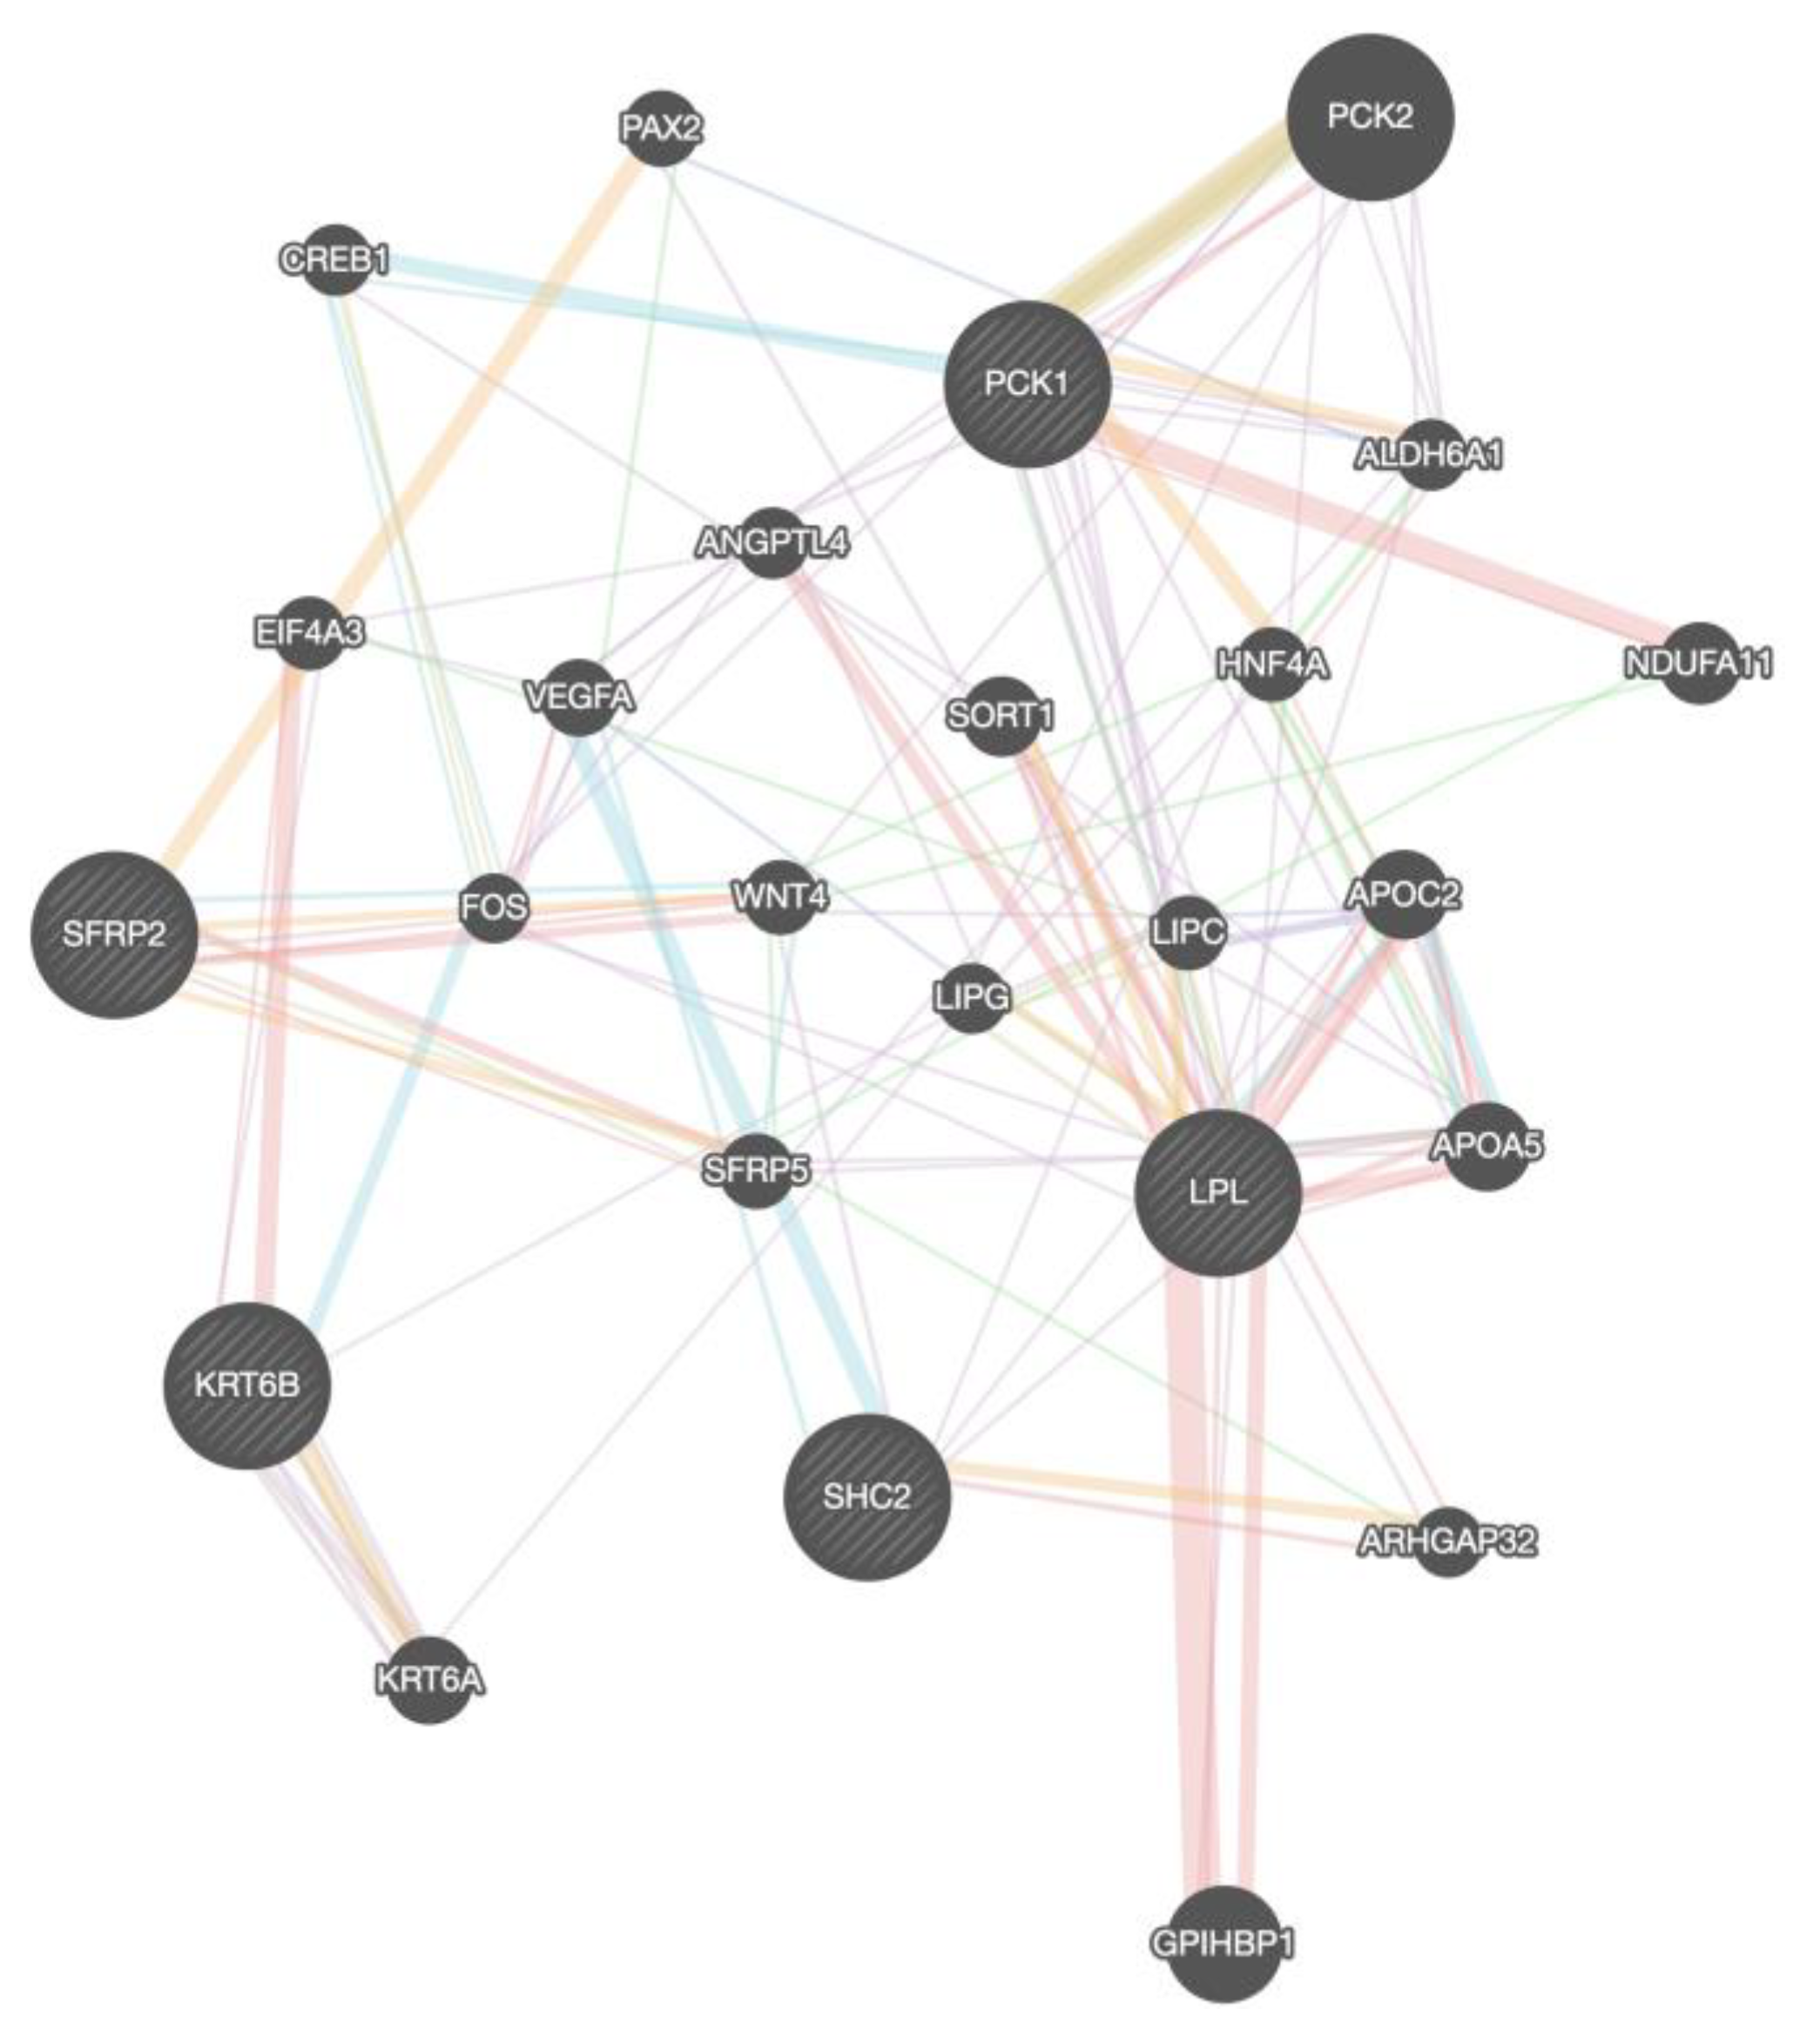
To analyze the Protein-Protein interaction of the DEGs we used Gene mania (
Figure 5).
LPL, PCK1, and
SHC2 are co-expressed, and there is a genetic interaction between
LPL and
PCK1. We use Signor 2.0 to visualize the signaling pathways between the co-expressed genes with a confidence score greater than 0.5 (Supplementary Figure 4). We validate the gene relationship between
LPL and
PCK1 with Timer 2.0 (Supplementary Figure 5A). Both genes have a significant positive correlation in all breast Subtypes. The result also shows that downregulated genes
SFRP2 and
LPL positively correlate in all breast cancer subtype groups (Supplementary Figure 5B). Analysis conducted through Gepia 2.0 futher demonstrate the expression of
SFRP2 and
LPL in different breast cancer subtype groups (Supplementary Figure 6). Results shows that
LPL is still under-expressed in tumor cells and
SFRP2 is overexpressed in all HER2, Luminal A, and Luminal B subtype groups and under-expressed in the Basal_like subtype group.
2.5. Identify Positive Correlated Genes
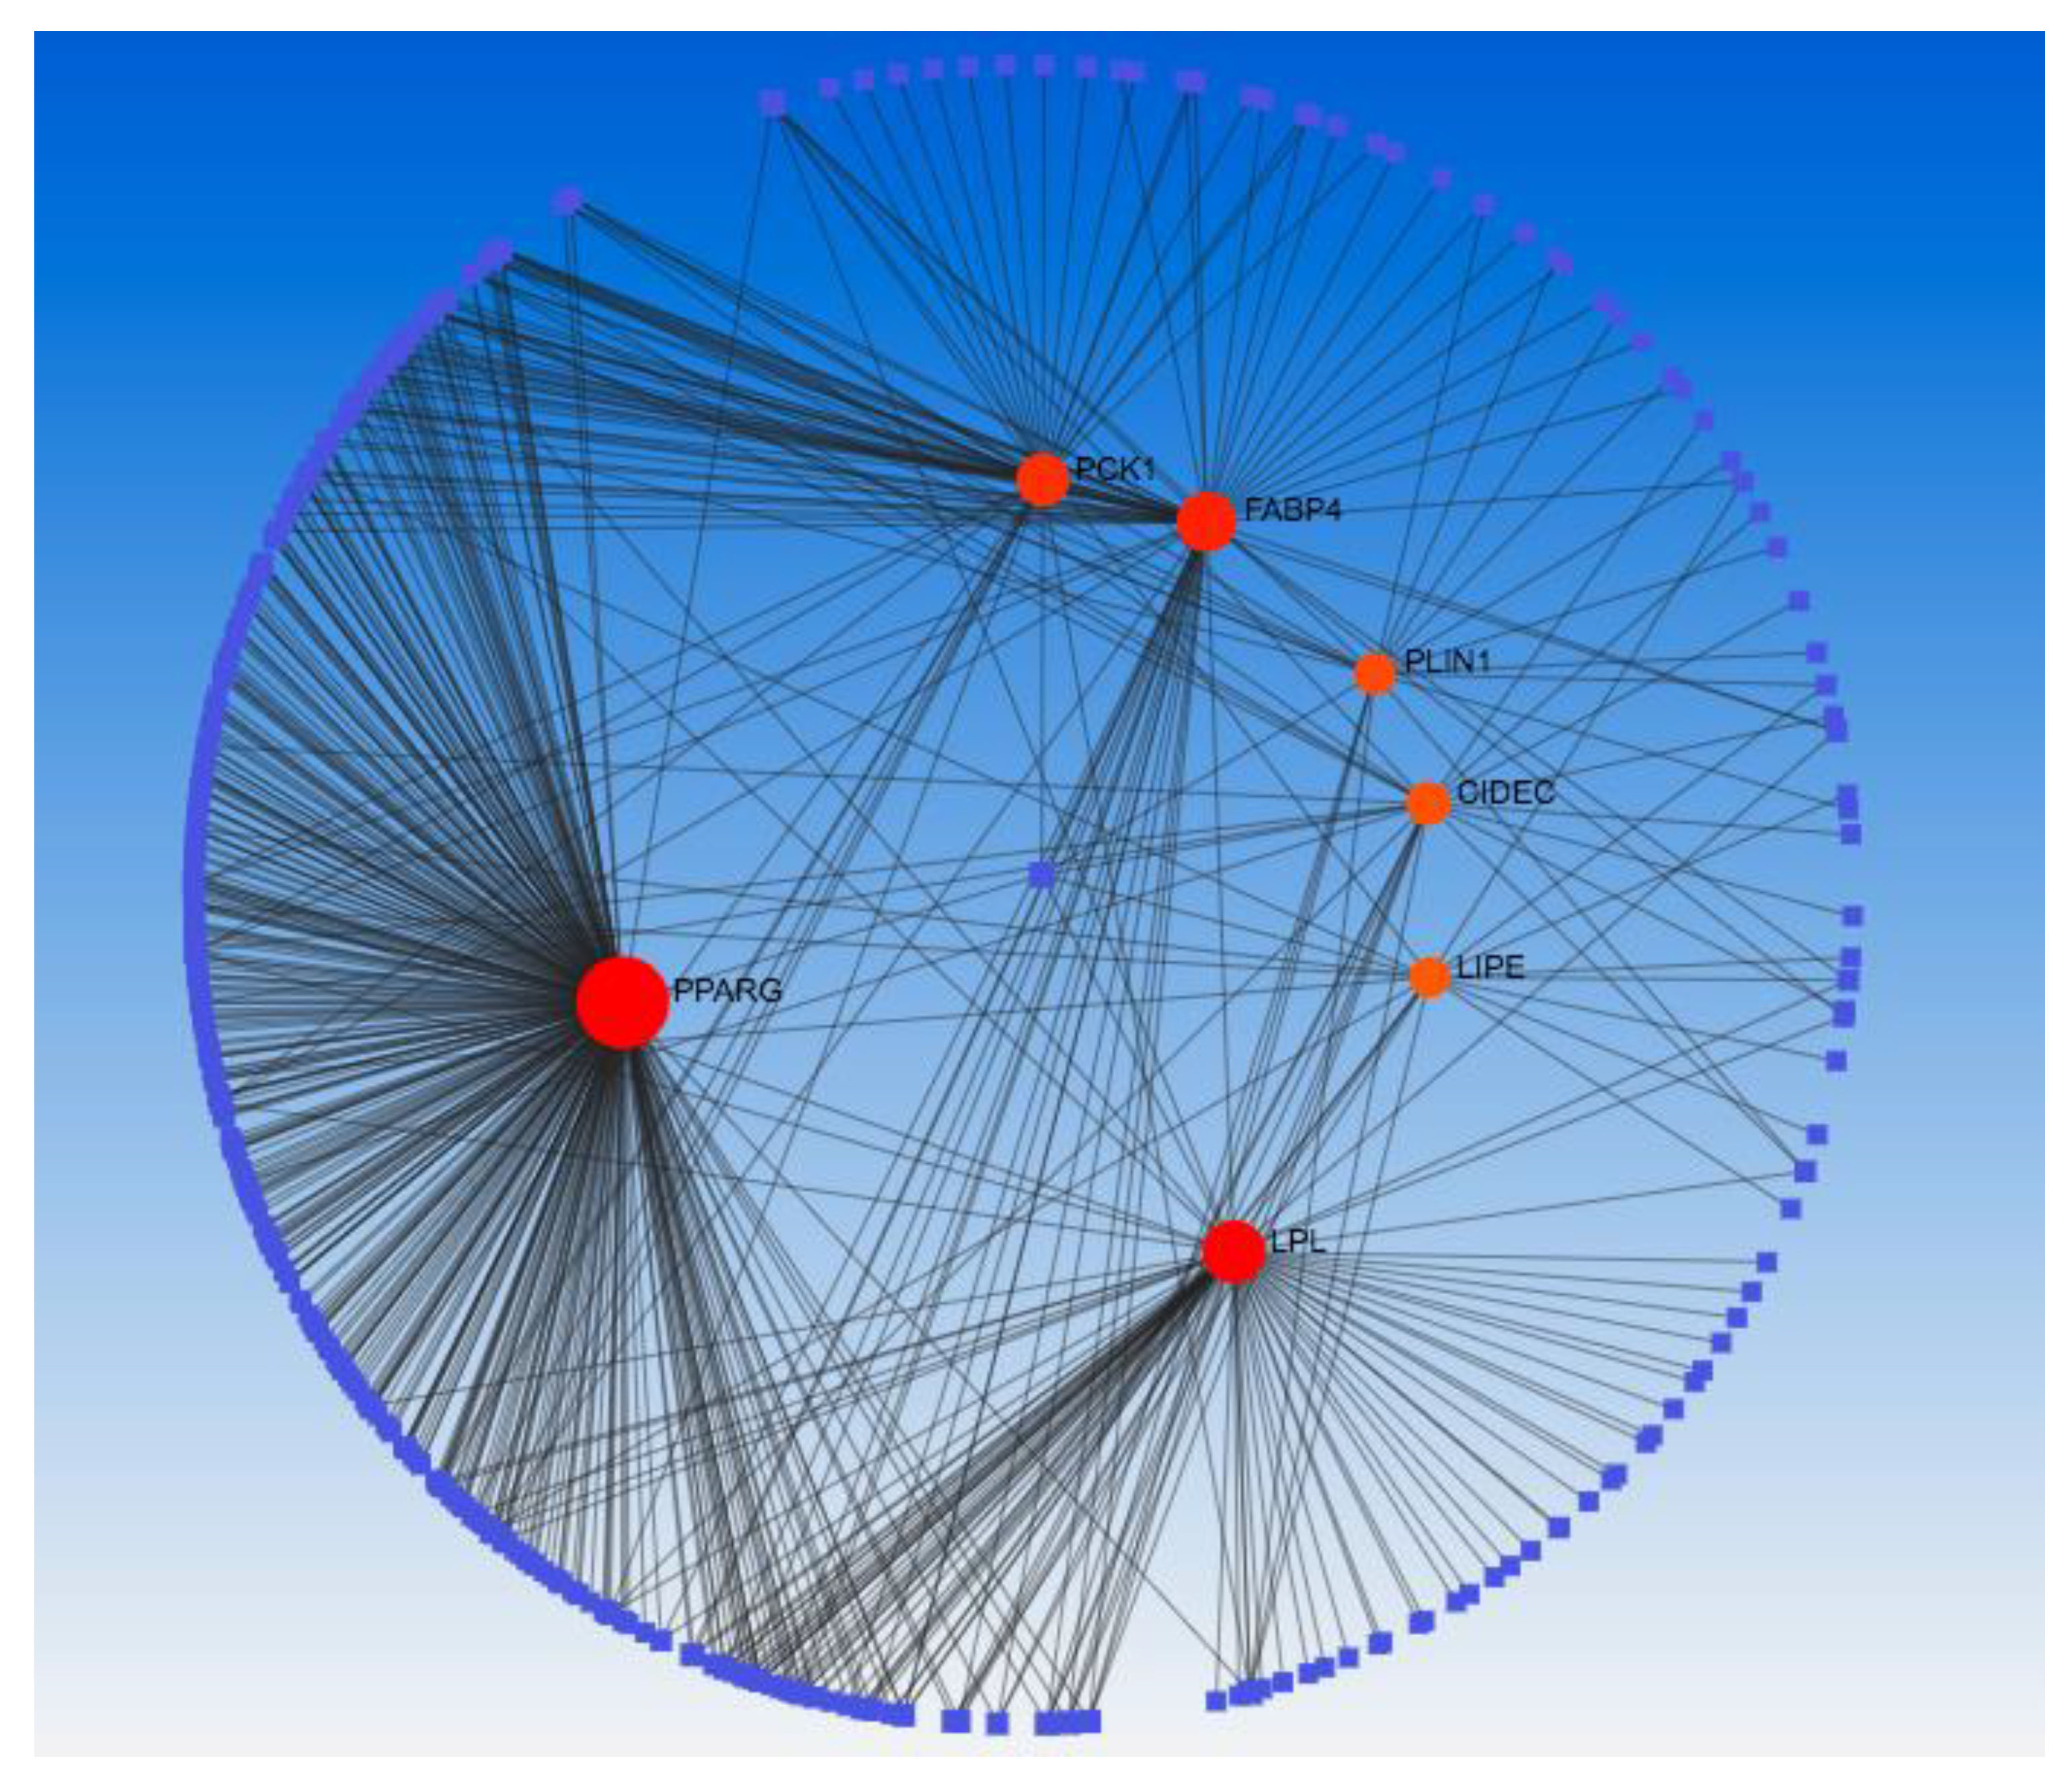
To gain insights into potential interacting partners and biological pathways associated with the DEGs, a series of integrated bioinformatics analyses were performed. First, the UALCAN online tool was used to identify genes exhibiting a positive Pearson correlation (coefficient >0.4) with the expression levels of the 5 DEGs across breast cancer TCGA datasets. Next, the resultant gene list was uploaded to the STRING database to construct a protein-protein interaction (PPI) network (Supplementary Figure 7) incorporating the DEGs and their correlated genes. Cytoscape software with the CytoHubba application was then used to analyze the topology of the STRING generated PPI network and selected the top 10 hub genes for SHC2 (PHPT1, MRPL41, ATP5F1D, RHOT2, NME3, TUBGCP6, SNRNP70, WDR90, THEM259, E4F1), PCK1 (PPARG, ACACB, PLIN1, LIPE, ADIPOQ, GPD1, CIDEC, PCK1, LPL, FABP4), LPL (PPARG, ADIPOQ, CAV1, LIPE, LPL, PLIN1, CIDEC, FABP4, CD36, GDP1), KRT6B (TRIM29, KRT14, KRT15, PKP1, KRT6B, DSG3, KRT16, KRT17, SERPINB5, DSC3), SFRP2 (COL1A1, MMP2, DCN, LUM, TGFB1, BGN, COL1A2, POSTN, FN1, COL3A1) ranked by their degree of interaction (Supplementary Figure 8A). Gene Ontology (GO) term (Supplementary Figure 8B) and KEGG pathway (Supplementary Figure 8C) enrichment analyses of these 10 hub genes were conducted using the DAVID database. This revealed that two selected genes, phosphoenolpyruvate carboxykinase 1 (PCK1) and lipoprotein lipase (LPL), were commonly enriched in pathways involved in fatty acid and energy metabolism regulation, including PPAR signaling, AMPK signaling, regulation of lipolysis in adipocytes, and thermogenesis. Integrating interactome and pathway databases in this manner provided novel biological insights into molecular mechanisms potentially implicated in breast-to-liver metastasis by DEGs and their correlated network hubs (FABP4, CIDEC, PPARG, ADIPOG, LIPE, GDP1, PLIN1, PCK1 and LPL).
2.6. Gene to miRNA and Transcription Factor Interaction
A network were constructed to analyze the relationship between the target miRNA and Transcription factors with the network hub genes (FABP4, CIDEC, PPARG, ADIPOG, LIPE, GDP1, PLIN1, PCK1 and LPL). miRNet 2.0 was applied to screen the targeted miRNAs of the hub genes. As illustrated in Supplementary Figure 9, the interaction network consists of 70 nodes and 88 edges. The interactive hub genes that most miRNAs target are LPL (degree score = 30) and PPARG (degree score = 29) and the highest interactive miRNAs is hsa-mir-27a-3p (degree score = 5). From the results we also identified four miRNAs target both the PCK1 and LPL. miRNA (hsa-mir-27a-3p) targeted LPL, PCK1, CIDEC, PLIN1 and PPARG; miRNA (hsa-mir-124-3p) targeted LPL, PCK1 and CIDEC; and both miRNA (hsa-mir-10b-5p and hsa-mir-200b-3p) targeted LPL and PCK1. Transcription factor (TF) enrichment analysis was performed to identify overrepresented TF binding sites in promoters of the hub genes using network analyst (Supplementary Figure 10). Results showed that the transcription-regulated network of hub genes included 30 nodes and 33 edges. NFKB1 and RELA are the highest interactive transcription factor with a degree of 3. Among the transcription factors, SP1 is the only regulator that was common in both LPL and PCK1 and it mainly plays a role in transcriptional mis-regulation in cancer.
2.7. Identification of Potential Treatment Targets
A network analysis is performed to identify the chemical to hub genes interaction (
Figure 6). Results showed that there are 447 nodes and 634 edges with bis(4-hydroxyphenyl)sulfone, Dexamethasone and rosiglitazone has the highest degree (7) of interaction within the hub genes. To drug targets for the hub genes, we submitted them to DSigDB database (
Table 1) and ranked them based on their Adjusted P-value. Our results showed that Triflumizole and Rosiglitazone CTD are the most significant drugs of the hub gene in the DSigDB database, followed by IBMX BOSS, formic acid BOSS, IBMX CTD 00007018, Bisphenol A diglycidyl ether CTD 00000976, oleic acid BOSS,glycerol BOSS, D-glucose BOSS and insulin BOSS.
2.8. Molecular Docking for Protein-Chemical Interaction
The 4 common chemicals (bis(4-hydroxyphenyl)sulfone, Dexamethasone, Triflumizole and Rosiglitazone) that showed highest interaction between the hub genes were used to analyze their respective interactions with the genes LPL and PCK1. Our results (Supplementary Table 2) showed that Rosiglitazone has the highest binding affinity(-8.4) with 1NHX formed three hydrogen bond at THR A:339, ASN A:292 and VAL A:335, three pi-alkyl interaction are seen at LYS A:290,VAL A:335 and ARG A:87, and one pi-cation and one Carbon Hydrogen bond is formed at ARG A:405 and ASP A:311 (Supplementary Figure 11b). Dexamethasone (-8.1) showed second highest binding affinity towards 1NHX. Dexamethasone formed 2 hydrgon bonds at ARG A:405, and one hydrogen bond at LYS A:290 and CYS A:288. There is also a Halogen (Fluorine) at ARG A:405(Supplementary Figure 11c). Bis(4-hydroxyphenyl)sulfone(-7.5) formed 5 hydrogens bond at HIS A:264, ASP A:311, SER A:286, AIA A:287 and CYS A:288, one pi-Alkyl and Pi sigma interaction was formed at LYS A:290 and VAL A:335 respectively (Supplementary Figure 11d). Triflumizole (-7.0) formed two hydrogen bonds with PHE A:530 and ASN A:533. Pi-pi T-shaped formed bonding with PHE A:525 and pi-pi stacked formed bonding with PHE A:530, one flourine interaction and carbon hydrogen bond was formed with CYS A:288 and TRP A:516 resepctively. Four pi-Alkyl interaction are formed at TRP A:516,PHE A:517,PHE A:525 and PHE A:530 (Supplementary Figure 11a). Rosiglitazone(-7.7) also has the highest binding affinity when it interact with 6e7k, following with Triflumizole (-7.5), Dexamethasone (-7.3), bis(4-hydroxyphenyl)sulfone (-7.3). As seen in supplementary Figure 12b, Rosiglitazone has three pi-alkyl interaction at ILE A:221, LYS A:265 and VAL A:84, one pi-pi stacked, pi-pi t-shaped, pi-cation and cabron hydrogen bond are formed at TYR A:121,TRP A:82, LYS A:265 and HIS A:268 resecpectively. Triflumizole (Supplementary Figure 12a) has two halogen(Flourine) at ILE A:221, HIS A:268 and two hydrogen bond at SER A:159, HIS A:268. Six pi-alkyl are formed with PHE A:212, HIS A:268,LYS A:265 and ILE A:221 and twice at TYR121, five alkyl are seen at, VAL A:264, PRO A:187 and twice at ILE A:221. Three Carbon Hydrogen bond are formed with HIS A:268, SER A:159, PRO A:187. Dexamethasone and bis(4-hydroxyphenyl)sulfone both have the same binding affinity. Dexamethasone formed two hydrogen bonds at at THR A:379 and GLU A:298. One Halogen (Florine) and unfavorable acceptor- acceptor interaction at GLU A:298 and SER A:390 respectively(Supplementary Figure 12c). Bis(4-hydroxyphenyl)sulfone formed two hydrgon bond with HIS A:268 and TYR A:158, two Pi-Pi t-shaped are form with TRP A:82. One Pi-cation and Pi- Sulfur was formed at LYS A:265 and HIS A:268. Two Pi-Alkyl interaction was formed at LYS A:265 and ILE A:221(Supplementary Figure 12d). All the chemical compounds were tested for their drug-likeliness. Results showed that these compounds have druglikeness (supplementary Figure 13).
2.9. Gene Ontology (GO) and Functional Enrichment Analysis
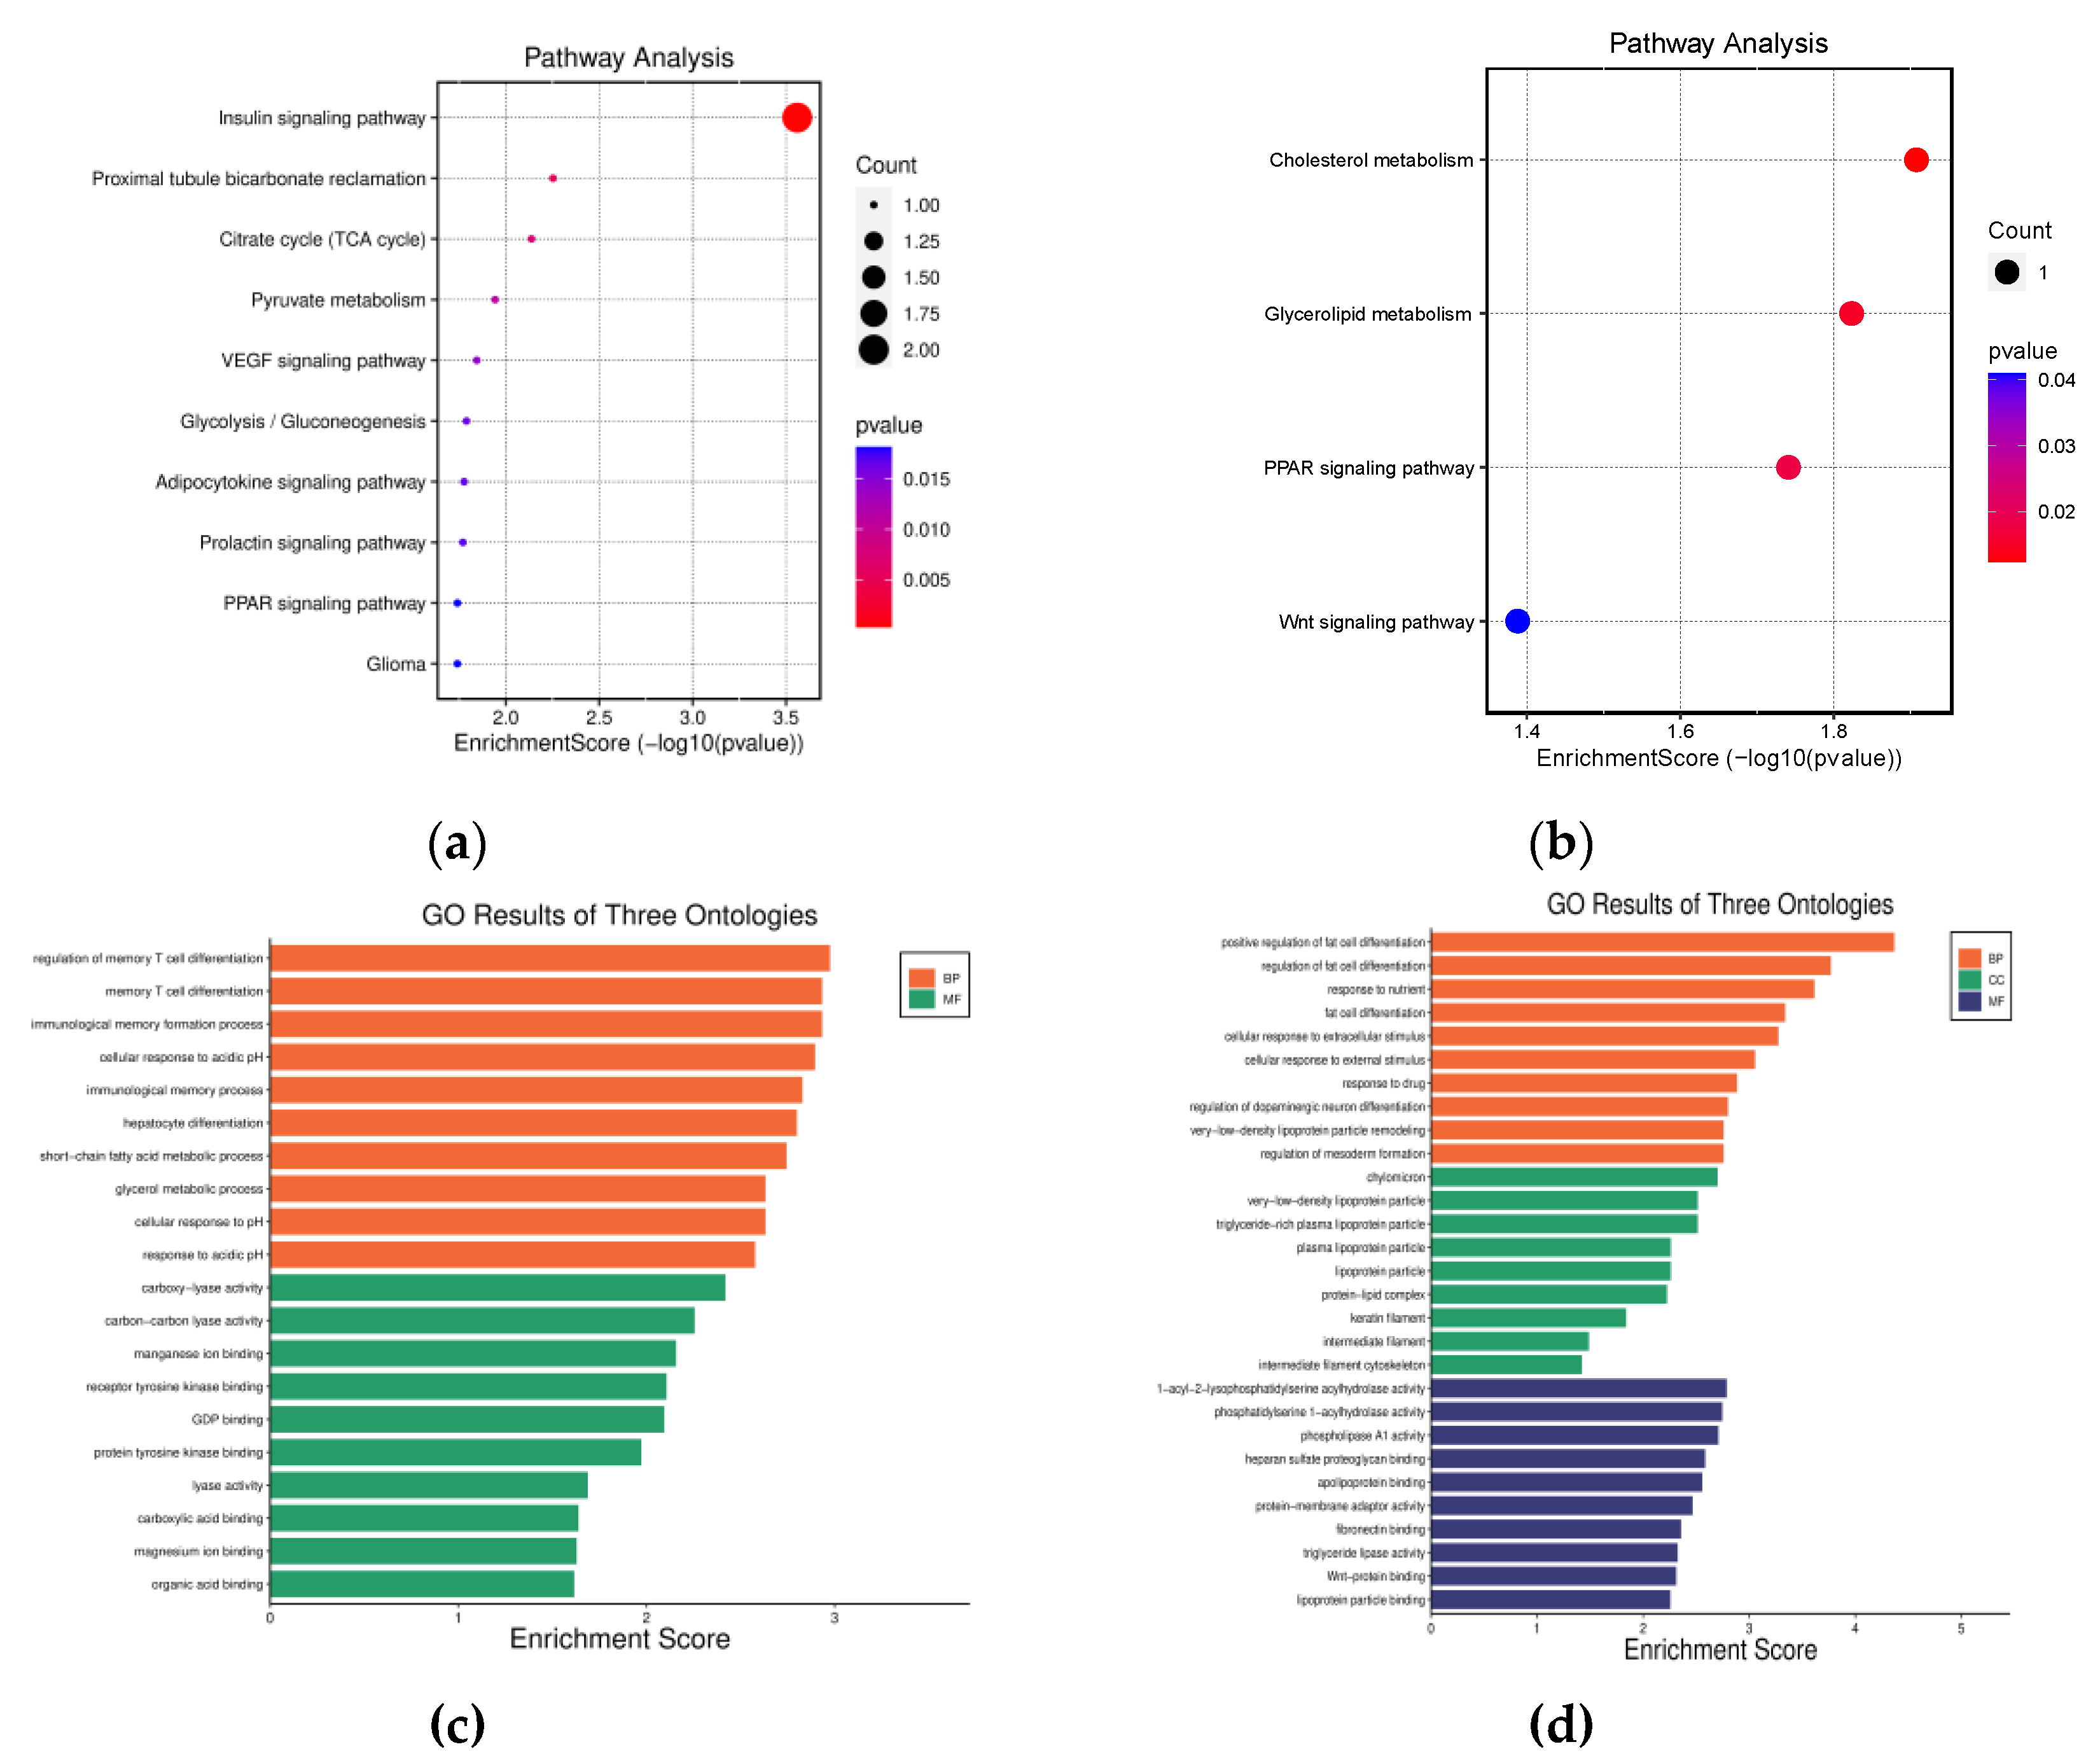
The Database for Annotation, Visualization, and Integrated Discovery (DAVID; version 6.8) was utilized to perform the functional enrichment analysis of the five most prevalent DEGs. Kyoto Encyclopedia of Genes and Genomes (KEGG) pathway analysis identified the molecular pathways enriched among the up-and down-regulated genes. The 2 upregulated DEGs were significantly enriched in the insulin signaling pathway(
Figure 7A). Meanwhile, the 3 downregulated DEGs were expressed in several metabolic pathways(
Figure 7B), including Cholesterol metabolism, Glycerolipid metabolism, and Peroxisome proliferator-activated receptor (PPAR) signaling pathway. Gene Ontology (GO) term enrichment was also conducted across biological processes, cellular components, and molecular functions. The upregulated DEGs (
Figure 7C)were primarily associated with regulating the memory T-cell differentiation for biological processes. Considering that the up-regulated genes (SHC2 and PCK1) have a role in regulation of memory T cell differentiation and immunological memory formation process, we examined the correlations the up regulated genes and infiltrated immune cells. Base on supplementary graph 12 we can see that both SHC2 and PCK1 are positively correlated with the infiltrating levels of NK cell, Mast cell activated and the macrophages M2. In contrast, downregulated DEGs (
Figure 7D) were mainly involved in the positive regulation of adipocyte differentiation from precursor cells, response to nutrients, and cellular response to extracellular stimuli. These results from DAVID highlight the dysregulation of insulin signaling and metabolic pathways that may contribute to the pathobiology of breast cancer liver metastasis according to expression patterns of the consistent DEGs between datasets.
3. Discussion
Recent studies and research indicate that breast cancer is currently the most frequent type of cancer among females, exceeding “lung cancer as the leading cause of cancer incidence” in the US and globally [
1]. Roughly 20% of individuals diagnosed with breast cancer will encounter a recurrence and 50–70% of metastatic breast cancer cases involve the liver [
2]. Moreover studies have shown that there is a poor prognosis for breast cancer metastasis to the liver, with the median survival rate being only 2–3 years [
3]. Although breast cancer liver metastasis (BCLM) is relatively common, there is a scarcity of specialized therapeutic options available for patients. This signifies that there is a dire need for the development of interventions in the area, which could only be made possible by rigorous research and an in-depth understanding of molecular processes underlying breast cancer to allow progress in early diagnosis and treatment of the condition [
4]. Therefore our bioinformatic research will identify potential biomarkers and assist in predicting the accurate behavior of the illness, and aid in the creation of targeted therapeutic approaches. Researching biomarkers can provide insight into the molecular processes that underlie the spread of cancer, its metastasis, and its resistance to treatment. This information can further our understanding of cancer biology and aid in the creation of novel targeted treatments.
In this study, we used proven online bioinformatics tools to investigate possible biomarkers for diagnosis of breast cancer and therapeutic drugs. We identified 5 DEGs common to all three GEO datasets, which included 2 upregulated genes and 3 downregulated genes. The upregulated genes were mainly involved in insulin signaling pathway, which is an important factor for breast cancer prognosis [
5]. The downregulated genes didn’t have significant results in pathways enrichment, but the gene ontology results show that they play a role in regulation of fat cell differentiation. Genetic alteration analysis was performed on the DEGs in metastatic breast samples. We observed major genetic alterations in
PCK1,SHC2 and
KRT6B, emphasizing the role of these genes in tumor behavior modification as well as response to treatment. These changes, such as amplification and deep deletion remain significant for understanding the complex mechanisms of breast cancer evolution. In addition, the CNV analysis shows adaptive cellular response to genetic variations. With the assistance of BCIP platform, we found that the expression of
PCK1 is higher when CNV is gained. This may imply the increase of expression changes the cancer cell metabolism. When tumors are coming from different organs, the combination of genetic alteration and environmental stress would determine the expression level of
PCK1. For instance, a high expression of gene
PCK1 in CNV gain influences the inducing of retrograde carbon flow from gluconeogenesis [
6]. As a result, there would be a decrease in glutathione levels while ROS production would be enhanced, thereby supporting hypoxic breast cancer growth. Since
PCK1 performs an anti-oncogenic role in gluconeogenic organisms, its gains in CNV would thus affect breast cancer metastasis in the liver due to its tumor-promoting roles. Specifically,
PCK1 enhances liver metastatic growth by facilitating pyrimidine nucleotide biosynthesis in hypoxia, a significant feature in the liver microenvironment. Reversely, the
SHC2 expression is higher after CNV loss suggests but previous studies have shown that high expression of
SHC2 in CNV loss does not affect breast cancer metastasis in the liver [
7]. Ideally, high expression of
SHC2 does not lead to significant variations associated with human neurological conditions, therefore the change in gene
SHC2 copy number is not vivid in breast cancer or liver.
To gain further insight on the functions and potential role that the 5 DEGS have in Breast cancer Local metastasis and in Metastasis in liver, we collected genes that were positively related with them (with a score >0.4). We created a PPI among all the positively correlated genes for each DEGs and identify the hub genes that can be used for Gene ontology and KEGG pathway enrichment analysis. When, we analyze each DEGs and their positively correlated hub genes, we found that the Pathway analysis and Gene Ontology results are closely related between
PCK1 and
LPL. Therefore, we took the Top degree shared hub genes between
PCK1 and
LPL to explore and create network analysis. It is controversial whether
PCK1 plays an oncogenic or tumor suppressor function in various human cancers.
PCK1 has antitumorigenic effects in gluconeogenic organ cancers (liver and kidney) but tumor-promoting effects in non-gluconeogenic organ malignancies. Prior studies have shed light on
PCK1′s hijacking function and mechanisms in cancer of the colon, hepatocellular carcinoma, breast, kidney, etc. Higher
PCK1 activity allows metastatic breast cancer cells to engage in gluconeogenesis, thereby generating glucose and glyceroneogenesis [
8]. This allows for the creation of biosynthetic operations. This metabolic adaptation enables the cells to survive in a liver microenvironment.
PCK1 expression allows breast cancer cells that have metastasized to the liver to disadvantage, driving key metabolic fluxes.
LPL plays a major role in influencing Breast cancer liver metastasis because it affects the rates of lipid metabolism. Breast cancer is influenced by metabolic abnormalities that affect its onset and progression, especially increased lipid synthesis and uptake. However, depending on the patient’s hormone status and the stage of the disease, lipid metabolism has different effects on breast cancer. The maintenance of the proliferation and survival of breast cancer cells depends on the dysregulation of fatty acid metabolism [
9]. Liver cancer cells are more likely to take up and use fatty acids when
LPL expression is higher. As a result, there is an increased potential for breast cancer cells to proliferate and spread into liver tumors.
In our miRNA and hub gene analysis, we identified four miRNA of interest, which include hsa-miR-27a-3p, hsa-miR-124-3p, hsa-miR-10b-5p and hsa-miR-200b-3p. These targeted miRNA are important regulators involved in the development and metastasis of breast cancer that are mainly associated with the change in expression of
PCK1 and
LPL. Additionally, has-miR-27a-3p has been found to be a two-sided regulator of transformation of metabolism and metastasis [
10]. Evidence has shown that it can reduce the expression of
PCK1, which is an essential enzyme in gluconeogenesis and shift the metabolism toward favoring cell proliferation and metastasis. The silencing of the
PCK1 gene by hsa-miR-27a-3p may trigger a metabolic reprogramming of cancer cells which would make them to take over and become more resistant and invasive when under nutrient starvation, which is a typical situation in the tumor microenvironment.
On the other hand, it was found that hsa-miR-124-3p functions as a tumor suppressor in various cancers such as breast cancer. It has been demonstrated that
LPL downregulation and targeting by this drug is critical for cancer cells liposuction which is crucial for providing energy and molecules required for their fast growth and reproduction. Hsa-miR-124-3p can block the
LPL function and therefore inhibit the lipid metabolism and the cell energy homeostasis of the breast cancer cells which would be a strategy to control its metastasis [
11]. Hsa-miR-10b-5p, which is famous for pro-metastatic effects, was suggested as a
PCK1 regulation directly. Over-expression of the precursor of hsa-miR-10b-5p is directed towards the downregulation of
PCK1 activating glycolysis over gluconeogenesis, enhancing the Warburg effect, a metabolic hallmark of cancer cells and facilitating metastasis of breast cancer cells.
Moreover, hsa-miR-200b-3p, a member of the miR-200 family, plays a crucial role in controlling Epithelial-Mesenchymal Transition (EMT), a key process in cancer metastasis progression [
12]. While there is not a direct link between
PCK1 and
LPL expressions, they could contribute to EMT, thereby promoting metabolic changes and lipid metabolism. These alterations may enhance the metastatic capability of breast cancer cells.
A TFs network of hub genes was constructed to explore the molecular networks associated with Breast cancer. From the network, Sp1 is the only transcription factor that is shared between
PCK1 and
LPL, it is mainly involved in Transcriptional mis regulation in cancer. Studies have shown that Sp1 can directly bind to the promoter region of the
PCK1 [
13] and controls the proliferation of breast cancer cells by interacting with insulin-like growth factors I receptor [
14], enhancing their transcriptional activity. Therefore, targeting Sp1-mediated transcriptional regulation may be a potential therapeutic strategy, but more investigations are needed to understand TFs and hub gene interactions in regulating Breast Cancer liver metastasis.
We did a chemical-to-gene interaction of the nine hub genes that were identified in the studies. Rosiglitazone, Dexamethasone, and bis(4-hydroxyphenyl)sulfone were shown to interact closely with the hub genes. Rosiglitazone, a pharmacological compound, binds to PPARγ (peroxisome proliferator-activated receptor gamma), a nuclear receptor protein controlling gene expression [
15]. Activation of PPARγ by Rosiglitazone leads to the overexpression of several genes crucial in lipid and glucose metabolism. For instance, it triggers increased activity of
LPL, encoding enzymes to break down triglycerides from lipoproteins, thereby enhancing their breakdown in the blood. Additionally, Rosiglitazone induces the expression of
PCK1, encoding enzyme in the pathway producing glucose from non-carbohydrates, ultimately enhancing hepatic glucose output. Further analysis in drug databases revealed Rosiglitazone CTD 00003139 as a potential treatment, validating the importance of Rosiglitazone in treatment of recurrent breast cancer metastasis in the liver. Further research are needed to be done for Dexamethasone and bis(4-hydroxyphenyl)sulfone in Breast cancer liver metastasis recurrence. The precise effect of bis(4-hydroxyphenyl)sulfone on breast cancer is remain unclear, while dexamethasone is found to be a double-edged sword during breast cancer progression and metastasis [
16]. At lower concentrations, Dexamethasone inhibits the growth and metastasis of breast cancer tumors, while higher concentrations may promotes breast cancer progression.
To explore candidate drugs by molecular docking simulation PCK1 and LPL are utilized as the target receptors to analyze their interactions with the chemicals (bis(4-hydroxyphenyl)sulfone, Dexamethasone, Triflumizole, and Rosiglitazone). The molecular analysis results show that bis(4-hydroxyphenyl)sulfone, Dexamethasone, Triflumizole, and Rosiglitazone have high binding affinity with the target receptors. These chemicals could be essential for discovering potential drug candidates for the treatment of recurrent breast cancer metastasis to the liver and should be further subjected to testing.
Our study has some limitations since it relies solely on bioinformatics analysis and lacks experimental verification; more clinical trials and researches are needed to validate the miRNAs, TFs, chemical compounds, and potential drugs. Despite using algorithm-based scientific methodologies, our research serves to predict the potential biomarkers and therapeutic targets for treating recurrent breast cancer metastasis to the liver.
