1. Introduction
Conducting polymers (CPs) are difficult to process due to their insolubility in most common solvents [
1], which, together with infusibility, limits their potential applications [
2,
3]. Since colloidal dispersions are frequently employed in place of solutions, developing CP dispersions is a typical method of overcoming this issue [
1,
4]. To prepare suitable dispersions of CP composites, a steric stabilizer can be added during the chemical oxidative polymerization of the corresponding monomer in an aqueous medium [
5,
6,
7].
As a matter of fact, the dispersion polymerization has been used as to produce particles with sub-micrometer size [
8], whereby the stabilizer in the reaction medium prevents the CP from precipitating and promotes a steady dispersion of particles [
1,
9]. In this way, colloidal forms of CP, with improved processibility, can be prepared [
10].
Water-soluble polymers, including cellulose derivatives [
6,
8], poly(vinyl alcohol) [
11], poly(ethylene oxide) [
2], and poly(methyl vinyl ether) have been employed as steric stabilizers for CPs [
3]. Among CPs, polyaniline (PANI) is one of the most studied, due to its low production cost, mechanical and chemical stability, and adjustable conductivity. PANI indeed, is the most adaptive conductive polymer, as it occurs in diverse structural forms, and its large range of applications is subsidized by its good redox exchange properties [
12,
13]. However, PANI is not soluble in most common solvents and displays infusibility, as most of the CPs [
2,
3]. The synthesis of new colloidal composites is thus appealing to improve its processability and the range of application [
14,
15,
16].
Previous studies on the preparation of PANI colloids include the use of poly(methyl ethacrylate) [
17], poly(vinyl alcohol) [
18], poly(N-vinylpyrrolidone) [
8,
19]. Many studies also exploited the use of biopolymers, due to their desirable biocompatibility [
20,
21,
22]. Polysaccarides derivatives [
6,
23,
24], in particular, have been applied to the synthesis of colloidal PANI. Among the others, chitosan [
25,
26], cellulose [
27] and nanocellulose [
28], pectin [
29,
30], were used as steric stabilizers, as they are biodegradable and may impart biological activity.
Increasing attention is now placed on the addition of bio-based compound derived from agricultural wastes, such as rice husk and walnut shell particles, to polymeric composites [
31,
32,
33]. The convenience is found in the fact that these biodegradable components may improve the thermal, tribological, and physico-mechanical characteristics of the composites and can be easily and inexpensively acquired from agricultural wastes [
34]. Starch is a polysaccharide produced by higher plants with the role of storing energy in the form of chemical bonds. Chemically, it has branched linear structures (amylopectin) and linear structures (amylose). It demonstrates some suitable physical attributes, being colourless, non-toxic, biodegradable and isotropic [
35,
36,
37]. Although it can be isolated from roots and tuber crops (tapioca and potatoes), and cereals (rice, corn, rye, and wheat), agricultural wastes as potato peels can also be used for its recovery [
38]. Previous reports described the use of PANI/starch composites to prepare functional materials. The ability of starch to dissolve and disperse PANI, indeed, expands the possibilities to design novel materials for diverse applications (electrochemical, water treatment, biomedical. etc…) [
39,
40,
41,
42,
43].
As far as the formation of polymeric colloids is concerned, this is affected both by the reaction medium and by the nature of the stabilizing agent used during their synthesis [
44,
45]. In this study, polymerization of PANI/starch was performed at 20 °C in an acidic medium, starting from aniline as a monomer, ammonium persulfate (APS) as oxidative agent, and starch as stabilizer. The average diameter of the particles was controlled by varying the amount of aniline and starch. Moreover, the conditions were adjusted to promote the formation of conductive emeraldine salt (PANI ES) [
46]. The latter, indeed, displays intrinsically higher processability, improved stability and biocompatibility, better control over the electrical conductivity of the polymer [
47]. The PANI ES/Starch composites were characterized to establish composition, size and stability, and one of them was successfully used as dopants for polyether sulfone (PES) membranes. Characterizations of membrane thickness, pore size, porosity, water contact angle (WCA) and FTIR were conducted on the PES membranes with and without PANI ES/Starch composites to assess the effects of the additive on membrane morphology and physico-chemical properties.
2. Experimental
2.1. Materials
Polyether sulfone (PES) was obtained from Solvay Specialty Polymers (Italy). Polyethylene glycol (PEG), polyvinylpyrrolidone (PVP), N-Methyl-2-pyrrolidone (NMP), dimethyl sulfoxide (DMSO) N, N-dimethylformamide (DMF), hydrochloric acid, ethanol, methanol, acetone, glycerol, ethyl acetate, hexane, chloroform, cyclohexane, toluene, and ammonium persulfate (APS) from Sigma Aldrich.
2.2. Synthesis of Polyaniline-Starch Particles (PANI-ES/Starch)
Aniline was polymerized in aqueous starch dispersions to produce three PANI/starch materials (
Table 1). The procedure [
48] involved the addition of aniline at room temperature (20 °C) to an aqueous mixture comprising different wt. ratios of dispersed starch in a 1 M HCl, followed by stirring the mixture for 4 h. An APS solution was then used to foster the chemical polymerization of aniline, controlling the temperature upon immersion in an ice bath (T~0–4 °C). To allow most of the aniline monomers to react, the mixture was kept under magnetic stirring for 3 h. After that, it was left undisturbed for 48 h. The resulting black greenish powder was then filtered and washed with acetone and water to remove residual reactants and byproducts with low molecular weight, like aniline dimers and oligomers, and finally dried for 2 days under air, at 40
°C.
2.2. Characterizations of the Materials
A series of spectroscopic characterizations was carried out to assess the successful use of starch as a steric stabilizer: (i) a Nicolet 5700 spectrometer Thermo Fisher equipped with sampling accessory for the powdered material (Diamond ATR), was used for FTIR-ATR spectroscopy, (ii) solutions prepared by dissolving 2 mg in 10 mL of DMF were monitored by UV-visible spectroscopy with a Cary 5000 UV-vis-NIR spectrometer (Varian, Palo Alto, CA, USA), and (iii) to finalize the spectral characterization, Raman spectroscopy measurements, with 532 nm excitation, were carried out with DXR2 Raman spectrometer (Thermo Scientific, Madison, WI, USA). Thermal analyses were performed with a TGA Q5000 instrument (TA Instruments, Hüllhorst, Germany) with the following setup: heating ramp of 10 °C/min, till 700 °C, in nitrogen atmosphere, while DSC analyses were performed, with a TA instrument Q20, under a nitrogen atmosphere from room temperature to 300 °C, at 10 °C/min; data processing and calculations of thermodynamic parameters were caried out with the TA Universal Analysis software. The solubility tests were performed in different solvents and at different temperatures, preparing dilute mixtures (0.2% w/v) in 10 mL of each solvent. The solvents used were water, ethanol, methanol, acetone, glycerol, ethyl acetate, hexane, chloroform, cyclohexane, toluene, DMF, DMSO, N-methyl pyrrolidone (NMP) at T = 20, 40, 50, 60, 80 °C. For insoluble combinations, colourless supernatants were observed; for partly soluble mixtures, a lens was used to detect residual particles. The average particle size, obtained by using laser granulometry analyzer CILAS 1190 (CPS Us, Inc, Madison, WI, USA) analysis. CuKα radiation (λ = 1.54 Å) (X'Pert3 Powder equipment) 2θ range (10° to 60°), at a scan rate of 0.02 s-1, was utilized for X-ray diffraction (XRD) examinations. The data was processed utilizing the X'pert HighScore software. Using a Quanta 200 equipment (FEI, Hillsboro, OR, USA), SEM images of the composites were collected on metallized materials with sputter quorum Q 150R E settings. Three electrodes were used in the cyclic voltammetry (CV) testing (using a PGZ 301 potentiometer from Radiometer Analytical SAS, Lyon, France): a reference electrode (Ag/AgCl), an auxiliary platinum electrode, and carbon as the working electrode. A 1 M H2SO4 solution served as the electrolyte, and the voltammograms were collected within a voltage range between -0.8 and +0.8 mV at a scan rate of 100 mV s-1.
2.3. Membrane Preparation
The phase inverse methodology was implemented to prepare the membranes, which consists of the immersion of casting solution in a non-solvent coagulation bath (non-solvent induced phase separation, NIPS). The casting solution was prepared by adding 1 wt.% of Z
11 dopant to NMP solution containing polyethylene glycol (PEG) and polyvinylpyrrolidone (PVP) as pore-formers [
48,
49]. PES was dissolved in NMP (
Table 2) and the suspension was immersed in a ultrasonic bath (for 90 min at room temperature) to ensure homogeneous nanoparticles dispersion. Then, it was kept under stirring until a homogeneous casting suspension was observed overnight. The dope solution was cast on a glass plate using a manual casting knife (gap: 250 µm) at temperature around 25
°C. The prepared membranes were washed consecutively with hot water (60
°C) to remove traces of pore-formers (PEG and PVP) and dried at room temperature for 4 h. Then, the membranes containing PANI ES/starch colloids was placed in 0.01 M HCl for 2h, to fix the oxidation state polyaniline (emeraldine salt form). The membranes were washed with water till neutrality, and then dried in an oven at 40
°C for 24 h.
2.4. Characterization of the Membranes
The membranes were characterized in terms of thickness, pore size, porosity, contact angle, FTIR and SEM to evaluate the influence of dopants on the PES membranes. The thickness was measured by a digital micrometer (Mitutoyo Corp. Japan) and registered in 10 regions of each membrane. Then, the average thickness was calculated. The porosity was measured by gravimetric method by considering the weight of membrane samples before and after the immersion in in kerosene (with the density of around 0.82 g/cm
3) for around 24 h. The porosity was calculated based on the following equation [
49]:
Where is the weight of the wetted membrane, is the weight of the dry membrane, 0.82 g/cm3 is the density of kerosene, and 1.37 g/cm3 is the density of membrane material, which is a calculated statistic number. The pore size of the membranes (Mean flow pore size diameter, MFD) was evaluated by wet-dry curve method by Porometer PoroluxTM 1000, Germany. Before each test, the membrane was immersed into fluorinated liquid (PorefilTM) for ten minutes. The maximum pressure applied to each measurement was 5 bar. The water contact angle (WCA) was measured by the optical contact angle (Meter 200, KSV instruments LTD from Finland) using ultrapure water droplets (5 µL). For each membrane, five measurements were carried out and the average and standard deviation were calculated. The morphology was determined by Scanning Electron Microscopy (SEM; Zeiss EVO, MA100, Assing, Italy). The cross-section samples were fractured in liquid nitrogen and fitted vertically on a sample holder. All samples (top, bottom, cross sections) were coated with gold by a sputter machine (Quorum Q 150R S). The FTIR was measured by the Spectrum One System by Perkin Elmer Instruments.
3. Results and Discussion
3.1. SEM
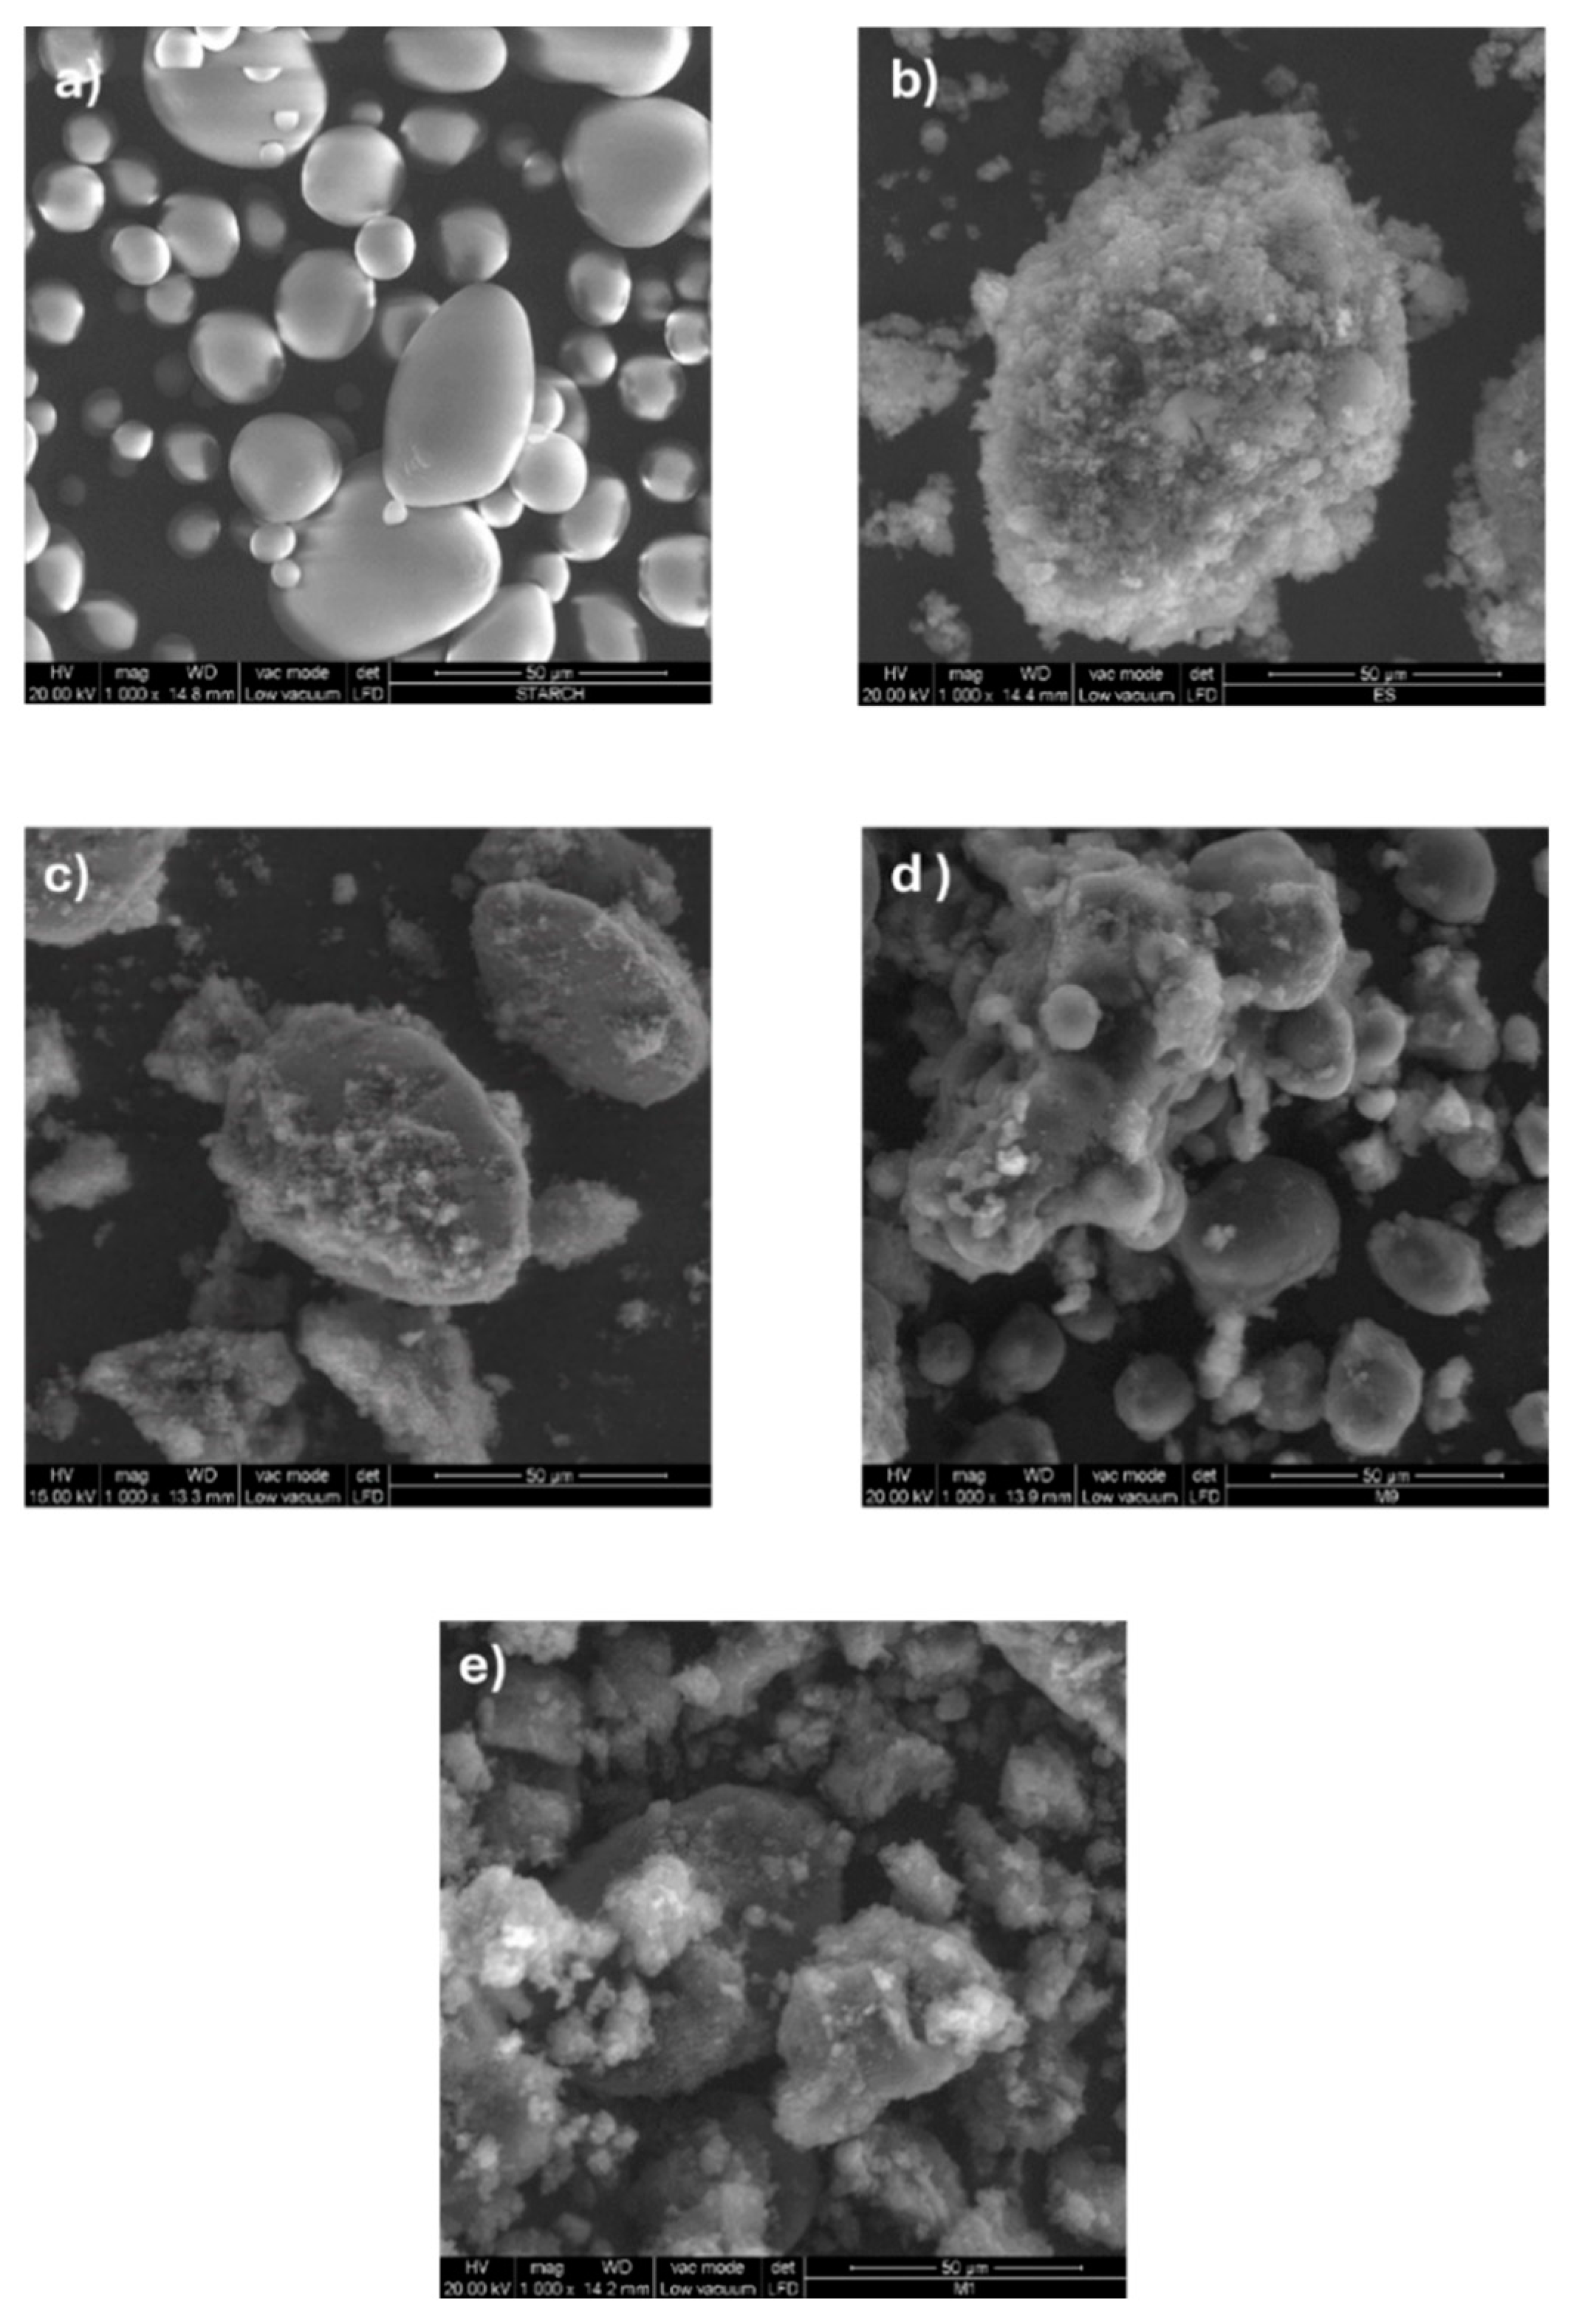
The SEM micrograph of starch, displayed in
Figure 1a shows pseudo-spherical granules with smooth surfaces. SEM images of polyaniline/starch composites with increasing aniline-to-starch ratios, in
Figure 1c–e, demonstrate that the polyaniline chains are grafted or adsorbed on the surface when aniline is polymerized in the presence of starch, which acts as a template [
50]. With respect to PANI alone (
Figure 1b), the size of the PANI/starch granules is smaller, being lower than 50 μm. The surface of the composites is rougher than that of pristine starch even at the lowest concentration ratio of aniline, demonstrating that aniline polymerization occurs on the surface of the starch granules, generating an uneven coating [
39,
48]. Once aniline content increases, the starch surface is more coated, and polyaniline build-up is observed over the starch particles [
42].
3.2. Granulometry
The laser granulometry analysis of particle size reveals that the obtained PANI/starch materials have a broad range of particle sizes, i.e. a high polydispersity (relative mean variance of the particle size distribution), which might potentially be an evidence of particle aggregation [
50,
51,
52,
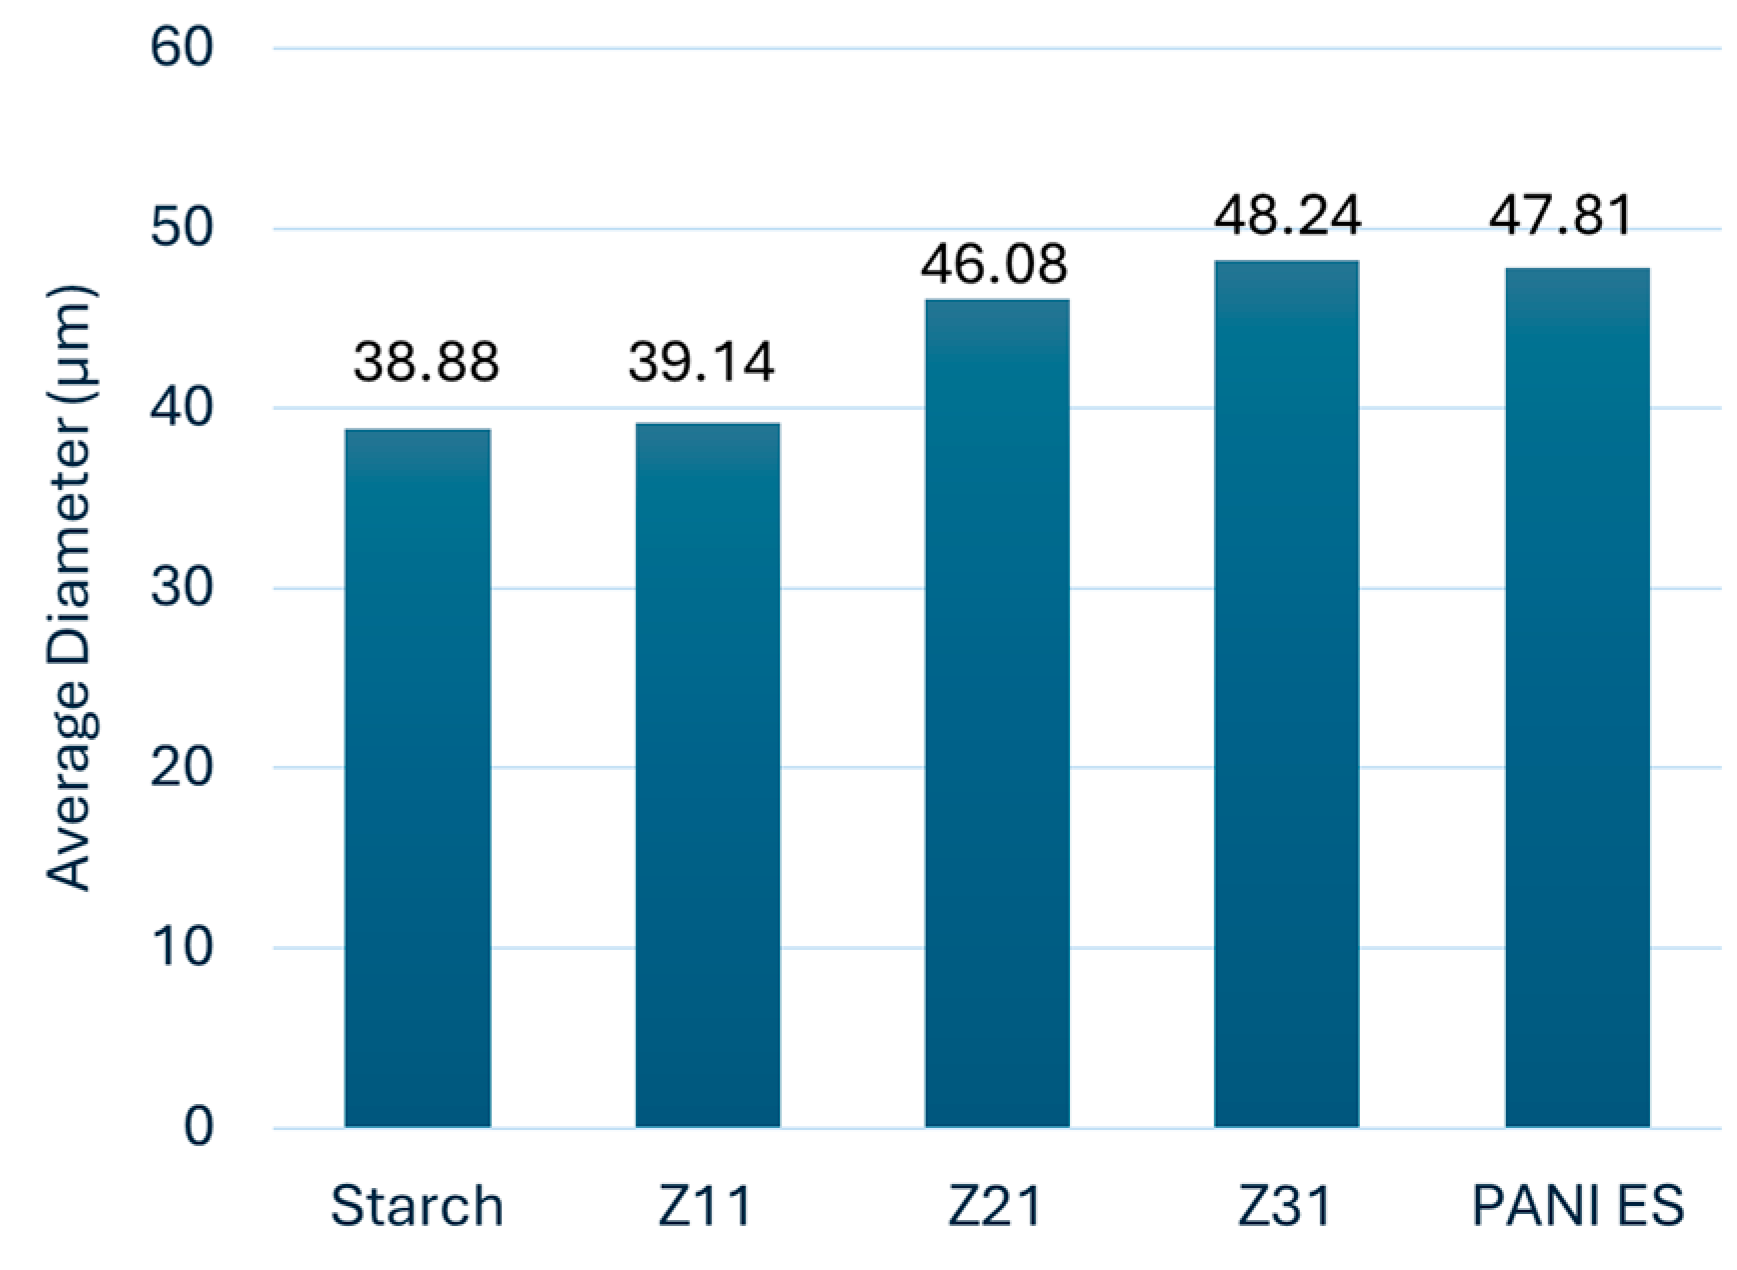
53]. Furthermore, as indicated in
Figure 2, the average diameters of the colloidal particles range from 39.14 μm to 48.24 μm. It is also important to mention that particle sizes are generally bigger compared to starch (38.88 μm). Thus, a higher amount of aniline in the reaction medium fosters the growth of longer polyaniline chains on starch particles surface, leading to bigger particles as it observed in SEM images in
Figure 1.
3.3. Solubility
The solubility of the materials was tested at various temperatures.
Table S1 lists the solvents (water, methanol, ethanol, acetone glycerol, ethyl acetate, chloroform, hexane, cyclohexane, toluene, DMF, DMSO, NMP) ability to dissolve PANI-ES, starch, and PANI-ES/starch composites. PANI-ES is soluble in DMF but insoluble in a wide range of common solvents, while starch is soluble in DMSO but only slightly soluble in water and DMF [
20].
We discovered that the PANI-ES/starch biocomposites had enhanced dispersion in water at 20–40 °C as well as favorable solubility in both DMF, NMP, and DMSO, which deviated from the solubility behavior of homo-polymers, making possible to obtain clearer mixtures at higher temperatures (60-80 °C). Solubility in glycerol and chloroform was also considerably improved, primarily at higher temperatures (> 40 °C), with good dispersions at lower temperatures. The PANI-ES/starch biocomposites could not be dissolved or even dispersed by the remaining solvents. These findings show how the surfaces of the products have distinct affinities for each solvent at different temperatures.
3.4. FTIR-ATR
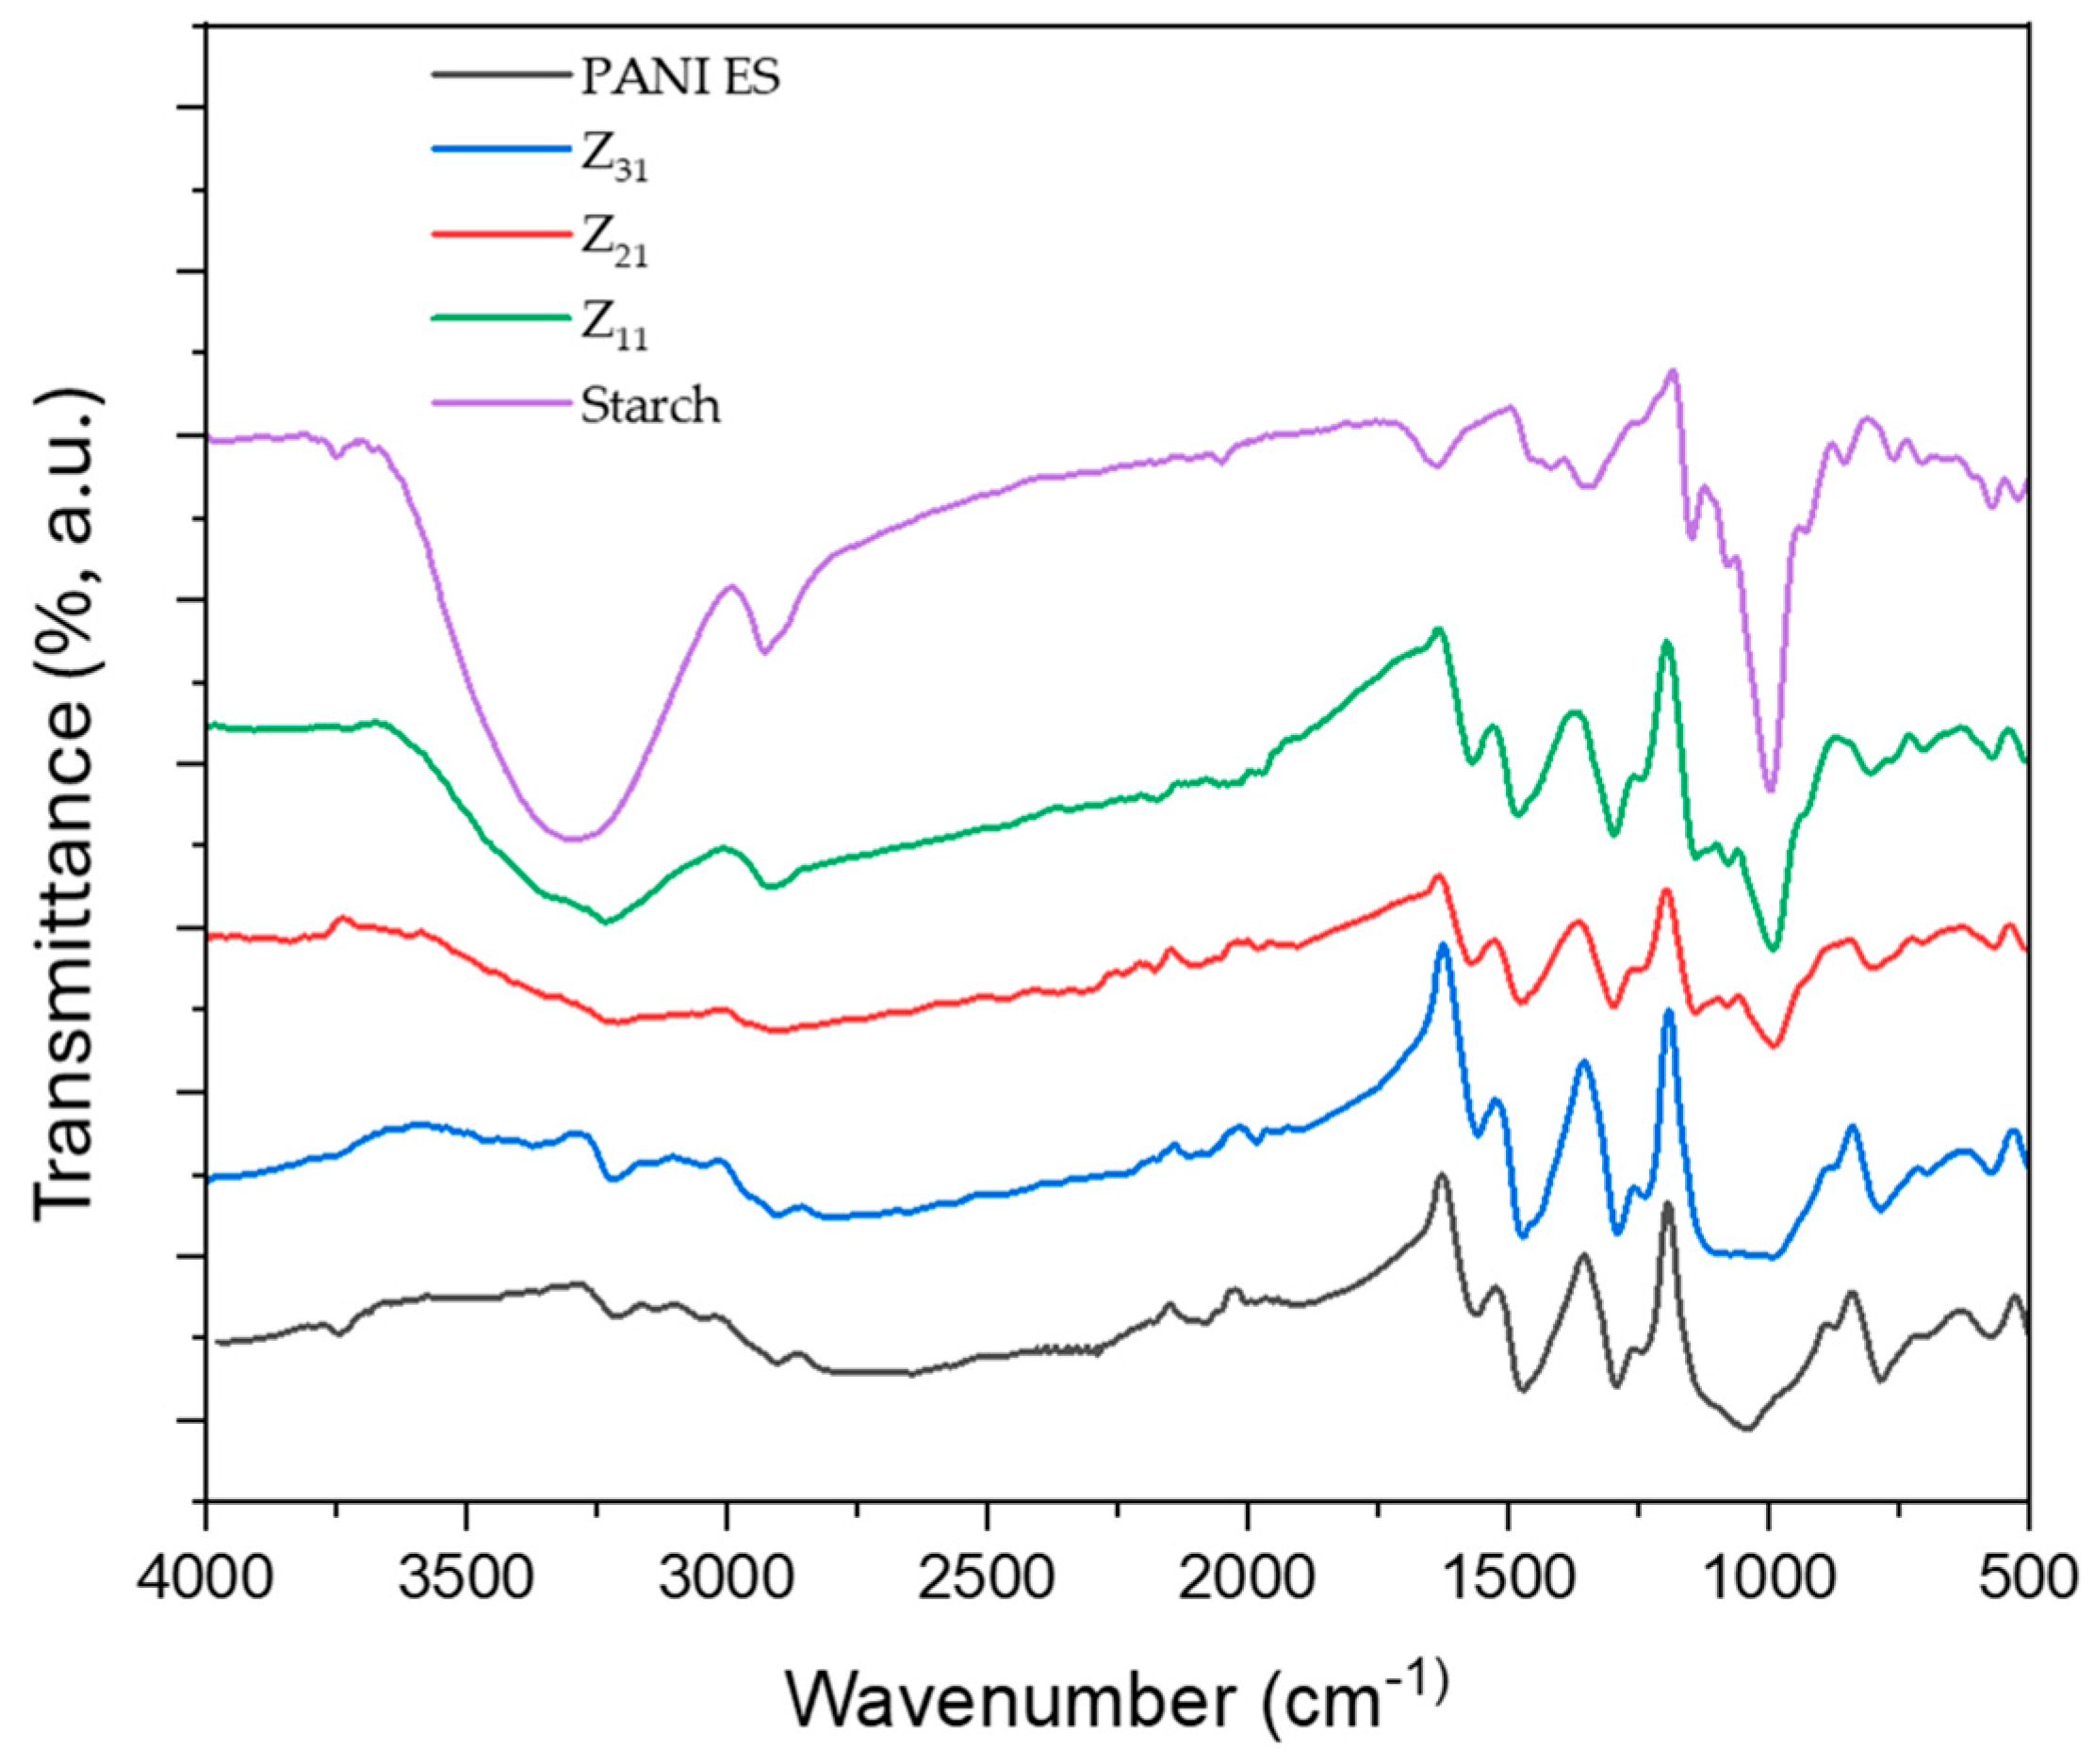
Figure 3 shows the FTIR-ATR spectra of starch, polyaniline, and their biocomposites. The faint peak characteristic of the asymmetric stretching of the carbon-hydrogen (C-H) bond in pyranoid rings is detected at 2924 cm
-1, whereas the broadband characteristic of starch O-H groups is observed around 3252 cm
-1. Adsorption bands between 854 cm
-1 and 1415 cm
-1 are ascribed to C-H bending, and to C-O(H) and C-O-C stretchings [
48,
54]. The bands at 1539 cm
-1 and 1456 cm
-1 correspond to the vibration of quinoid rings (N=Q=N) and benzenoid rings (N-B-N), while the bands at 1282 cm
-1 and 1230 cm
-1 correspond to the aromatic C-H bending vibrations. For the composites, PANI signals, ascribed to PANI-ES [
55], dominate the spectra, in agreement with an efficient surface coverage [
56]. The increasing ratio of PANI, from Z
11 to Z
31, is clearly highlighted by the decreasing intensity of the starch’s signal at 993 cm
-1 (C-O stretching) with respect to PANI’s one at 1456 cm
-1 (C-N stretching).
3.5. UV-Vis
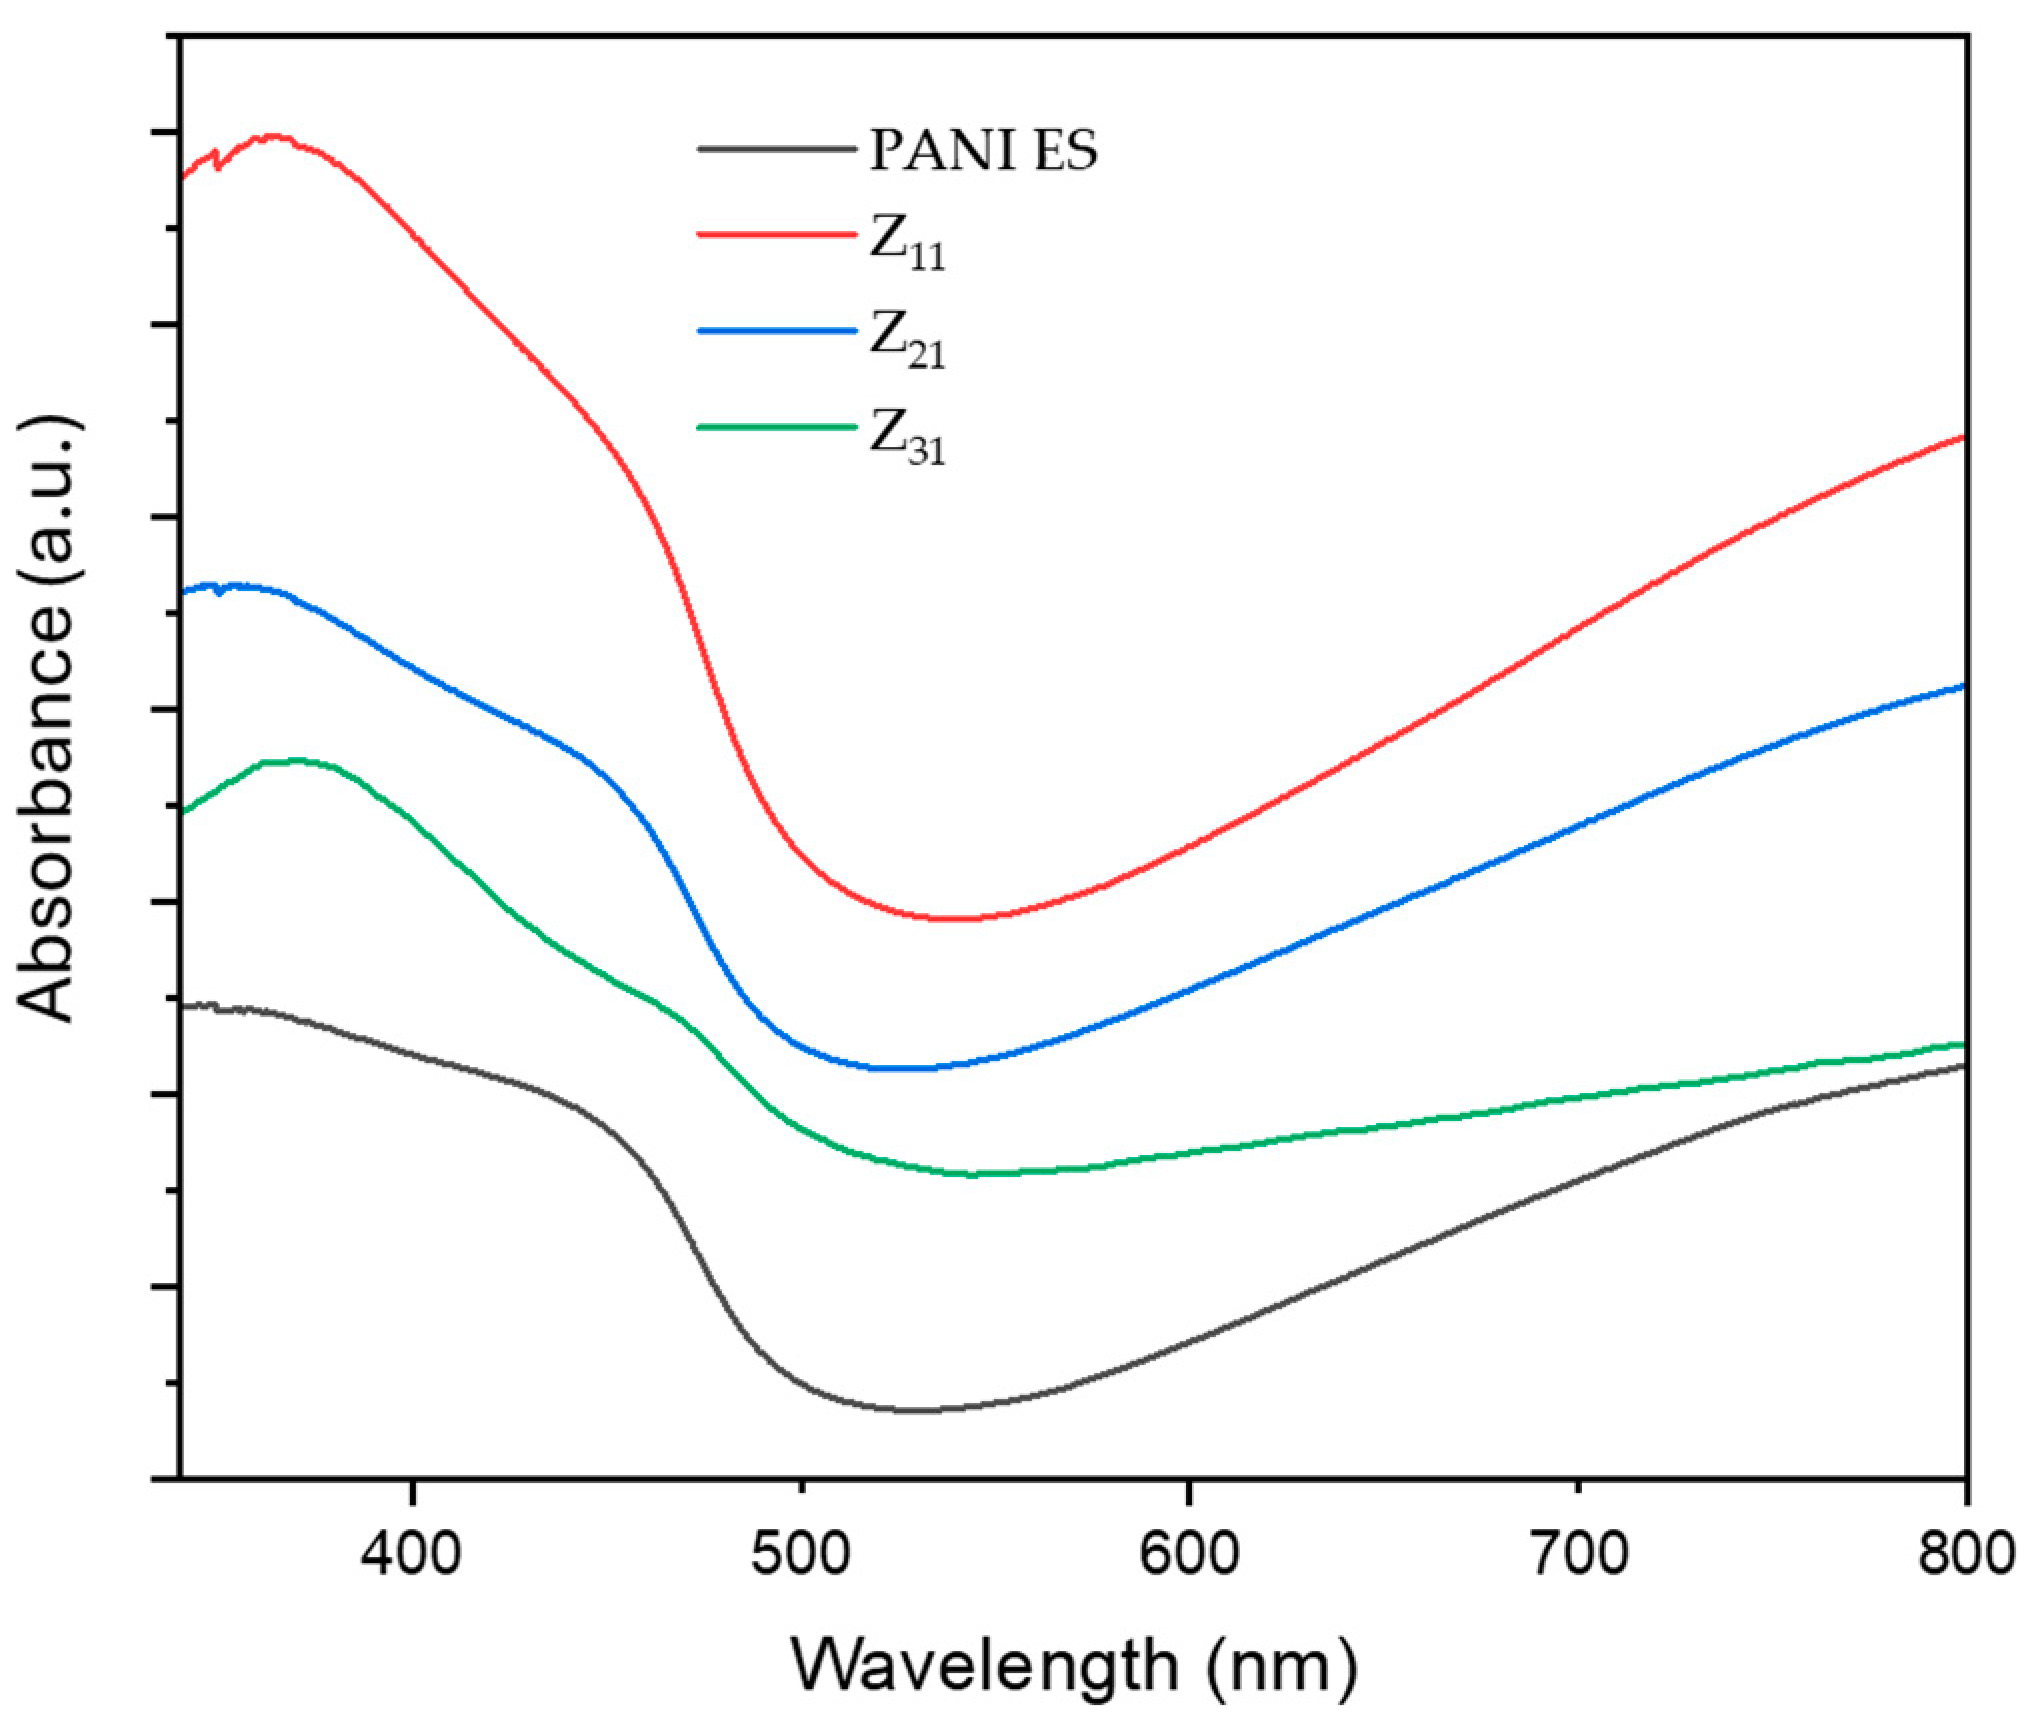
Figure 4 illustrates the UV-vis spectra of PANI-ES/starch biocomposites [
55].
Polyaniline absorption bands match those reported in the literature, where PANI species exhibits two significant absorption bands, one at 250-450 and a broader one between 500 and 900 nm. The first band corresponds to the π-π* transition, whereas the second is related to the transition of benzenoid rings into quinoid rings [
57,
58]. Other studies correlate these bands to the π-π* transition of benzenoid rings, localized polarons, and delocalized polarons [
50,
59,
60]. These peaks demonstrate that PANI is in an oxidized state, i.e. the emeraldine salt form. For the composites, in addition, the band around 370 nm may be attributed to bonds conjugation. Additional changes, with respect to PANI spectrum, are likely related to the interaction between PANI and starch, together with a variation in the quantity of quinoid and benzenoid units present in the materials.
3.6. RAMAN
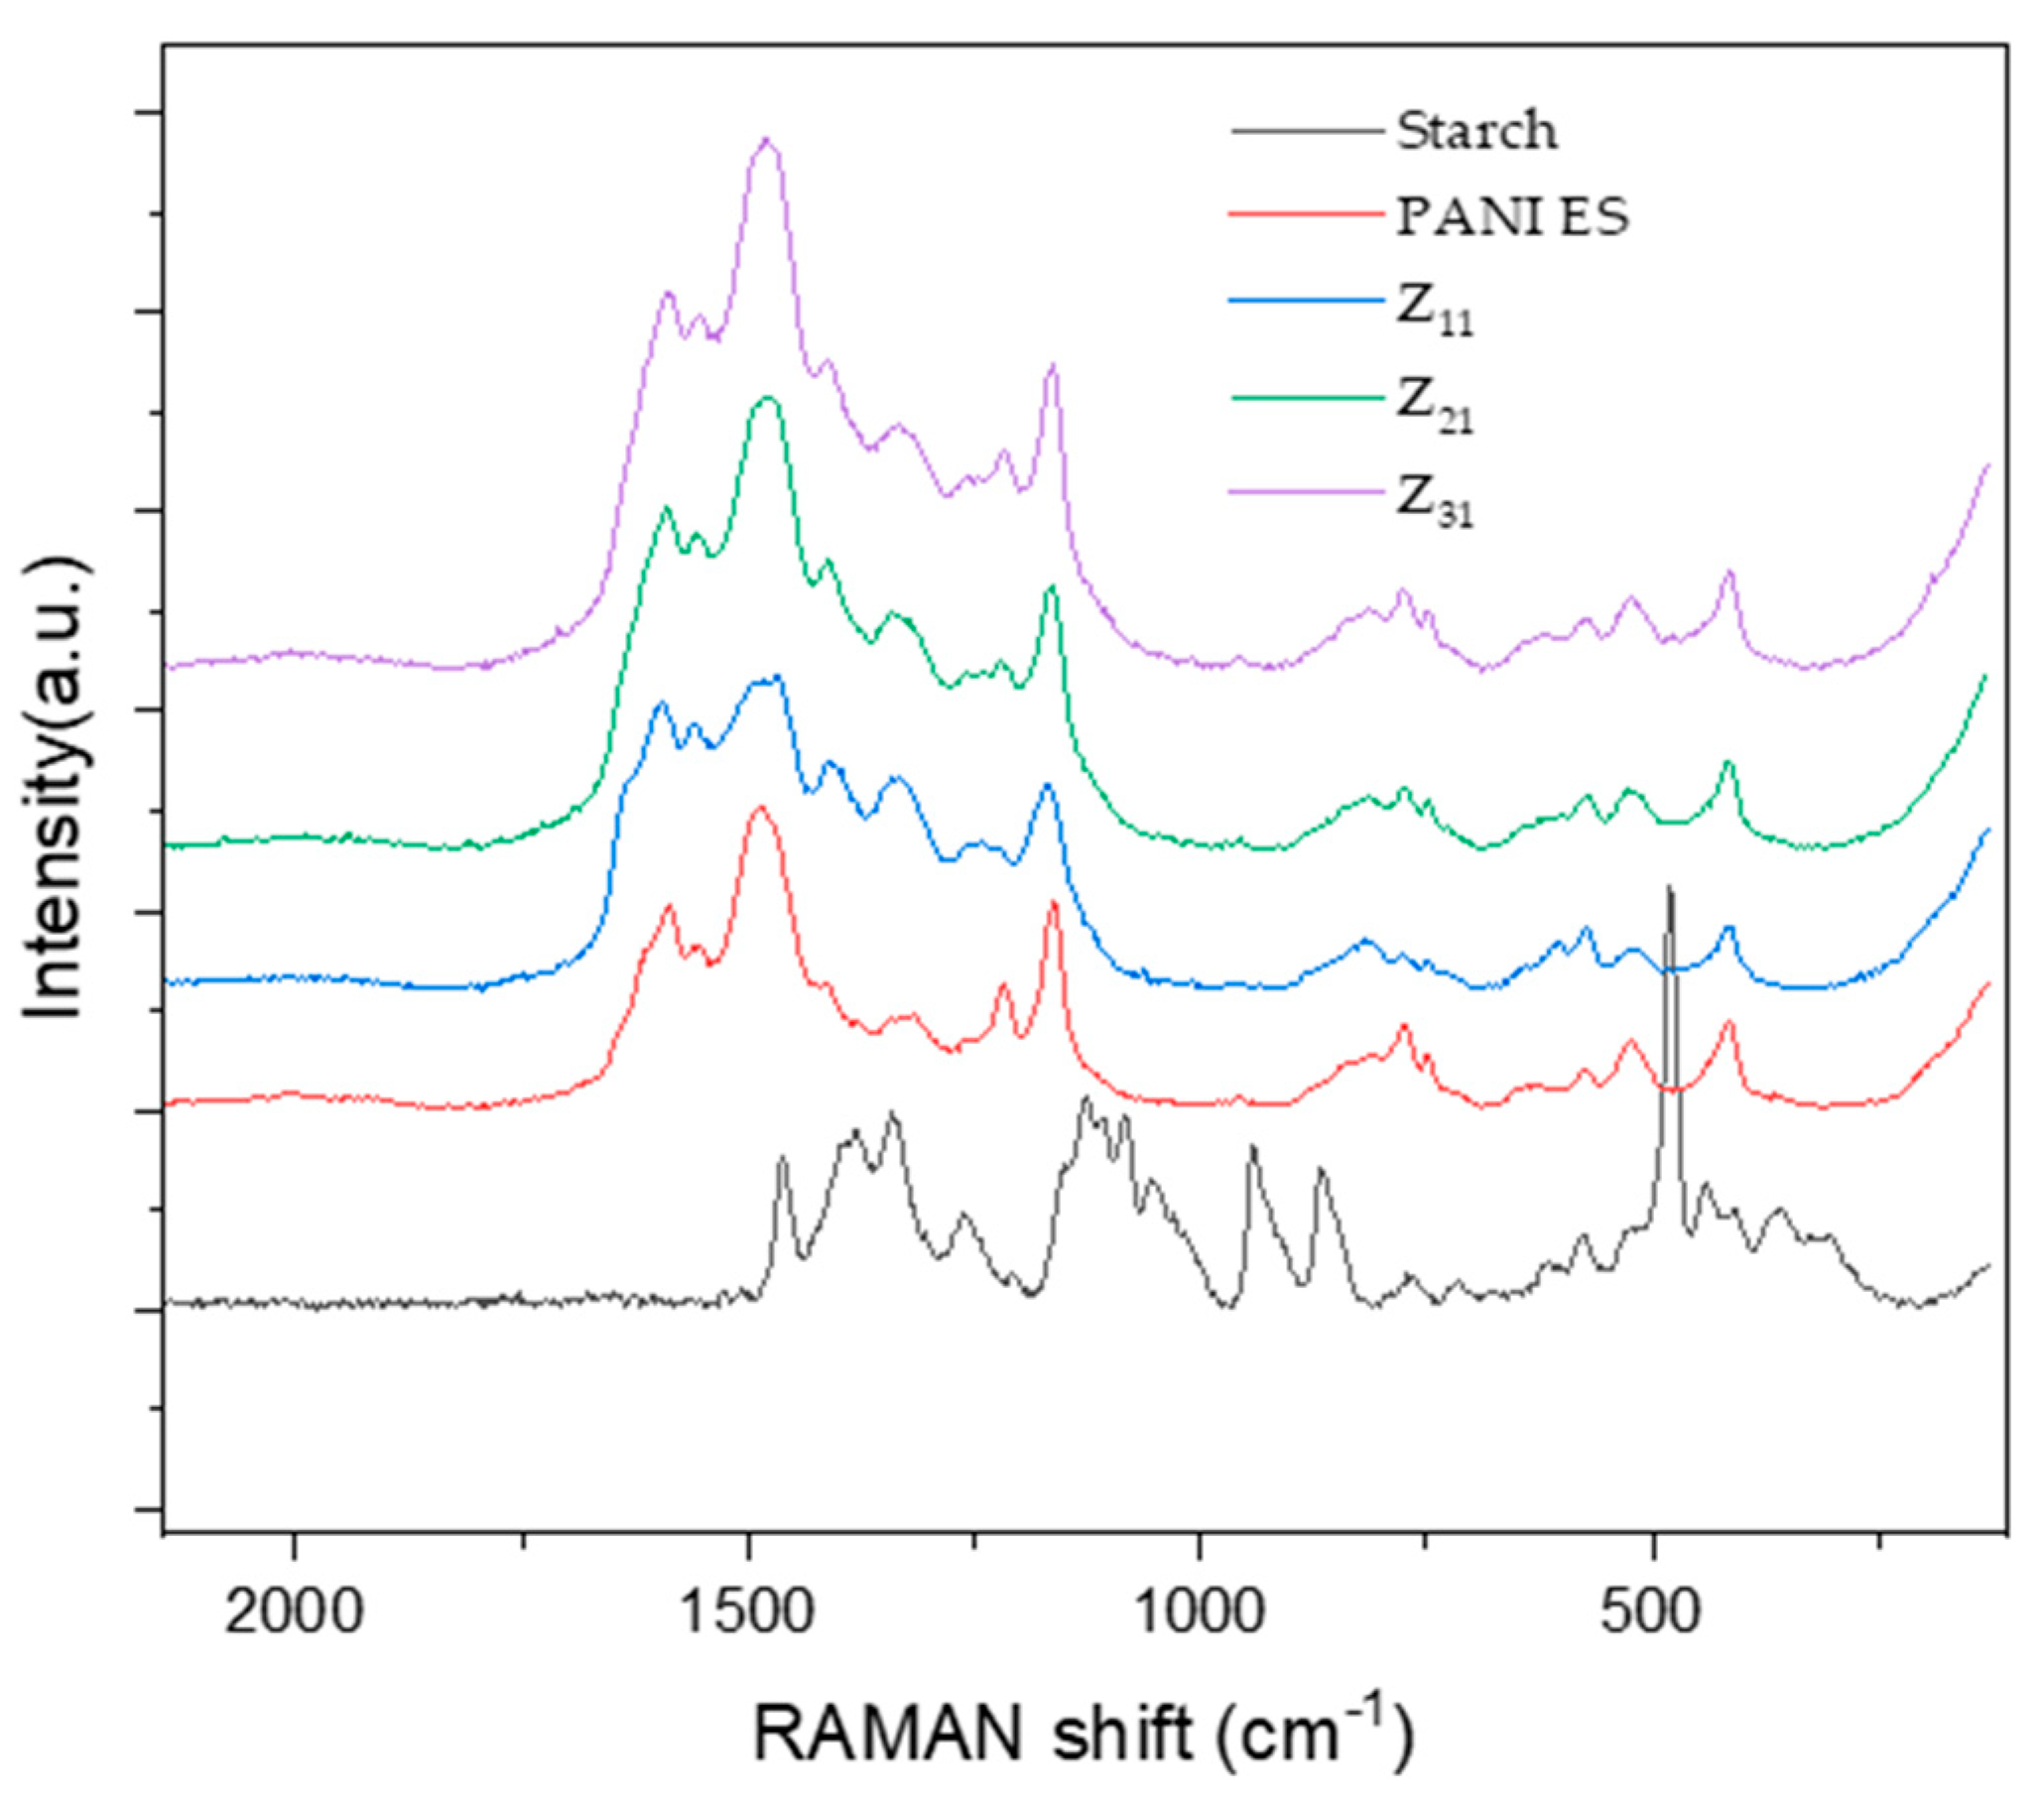
Figure 5 shows the Raman spectra of PANI (ES), starch, and their biocomposites, which were acquired at an excitation wavelength of 532 nm.
The Raman spectra of the composites illustrate the typical signals of PANI [
50,
59,
60] whose principal bands, at 1590 and 1558 cm
-1, correspond to quinine-type rings and carbon-carbon (ring's single and double band stretching vibrations), respectively [
61,
62]. Additionally, distinct bands, caused by the imine's C=N stretching modes at 1482 cm
-1 and the amine group’s C-N stretching at 1221 cm
-1, can be detected. Raman spectra show the stretching vibrations of an intermediate C ~N
+ bond at a characteristic frequency of about 1330 cm
-1, for which there is no agreement on the exact value of this frequency in the literature [
63,
64]. N-H bending vibrations are represented by the band at 1562 cm
-1, while the in-plain deformation mode of quinonoid C-H bonds is observed at 1166 cm
-1. For PANI chains, other small vibration modes have been observed, such as the band at 777 cm
-1, which most likely corresponds to quinine ring vibrations. In addition, there are additional bands at around 745 and 809 cm
-1, which probably correspond to amine and imine deformations [
64,
65]. Certain vibration modes exhibit variation in intensity and frequency between samples, which can be attributed to factors such as synthetic and doping methodologies, and structural imperfections in the polymer [
66].
The way PANI/starch biocomposites respond to laser stimulation is a further proof that starch grains are coated by a layer of PANI chain [
50], which prevents the laser beam from reaching the inner starch macromolecules.
3.7. X-ray Diffraction Pattern (XRD)
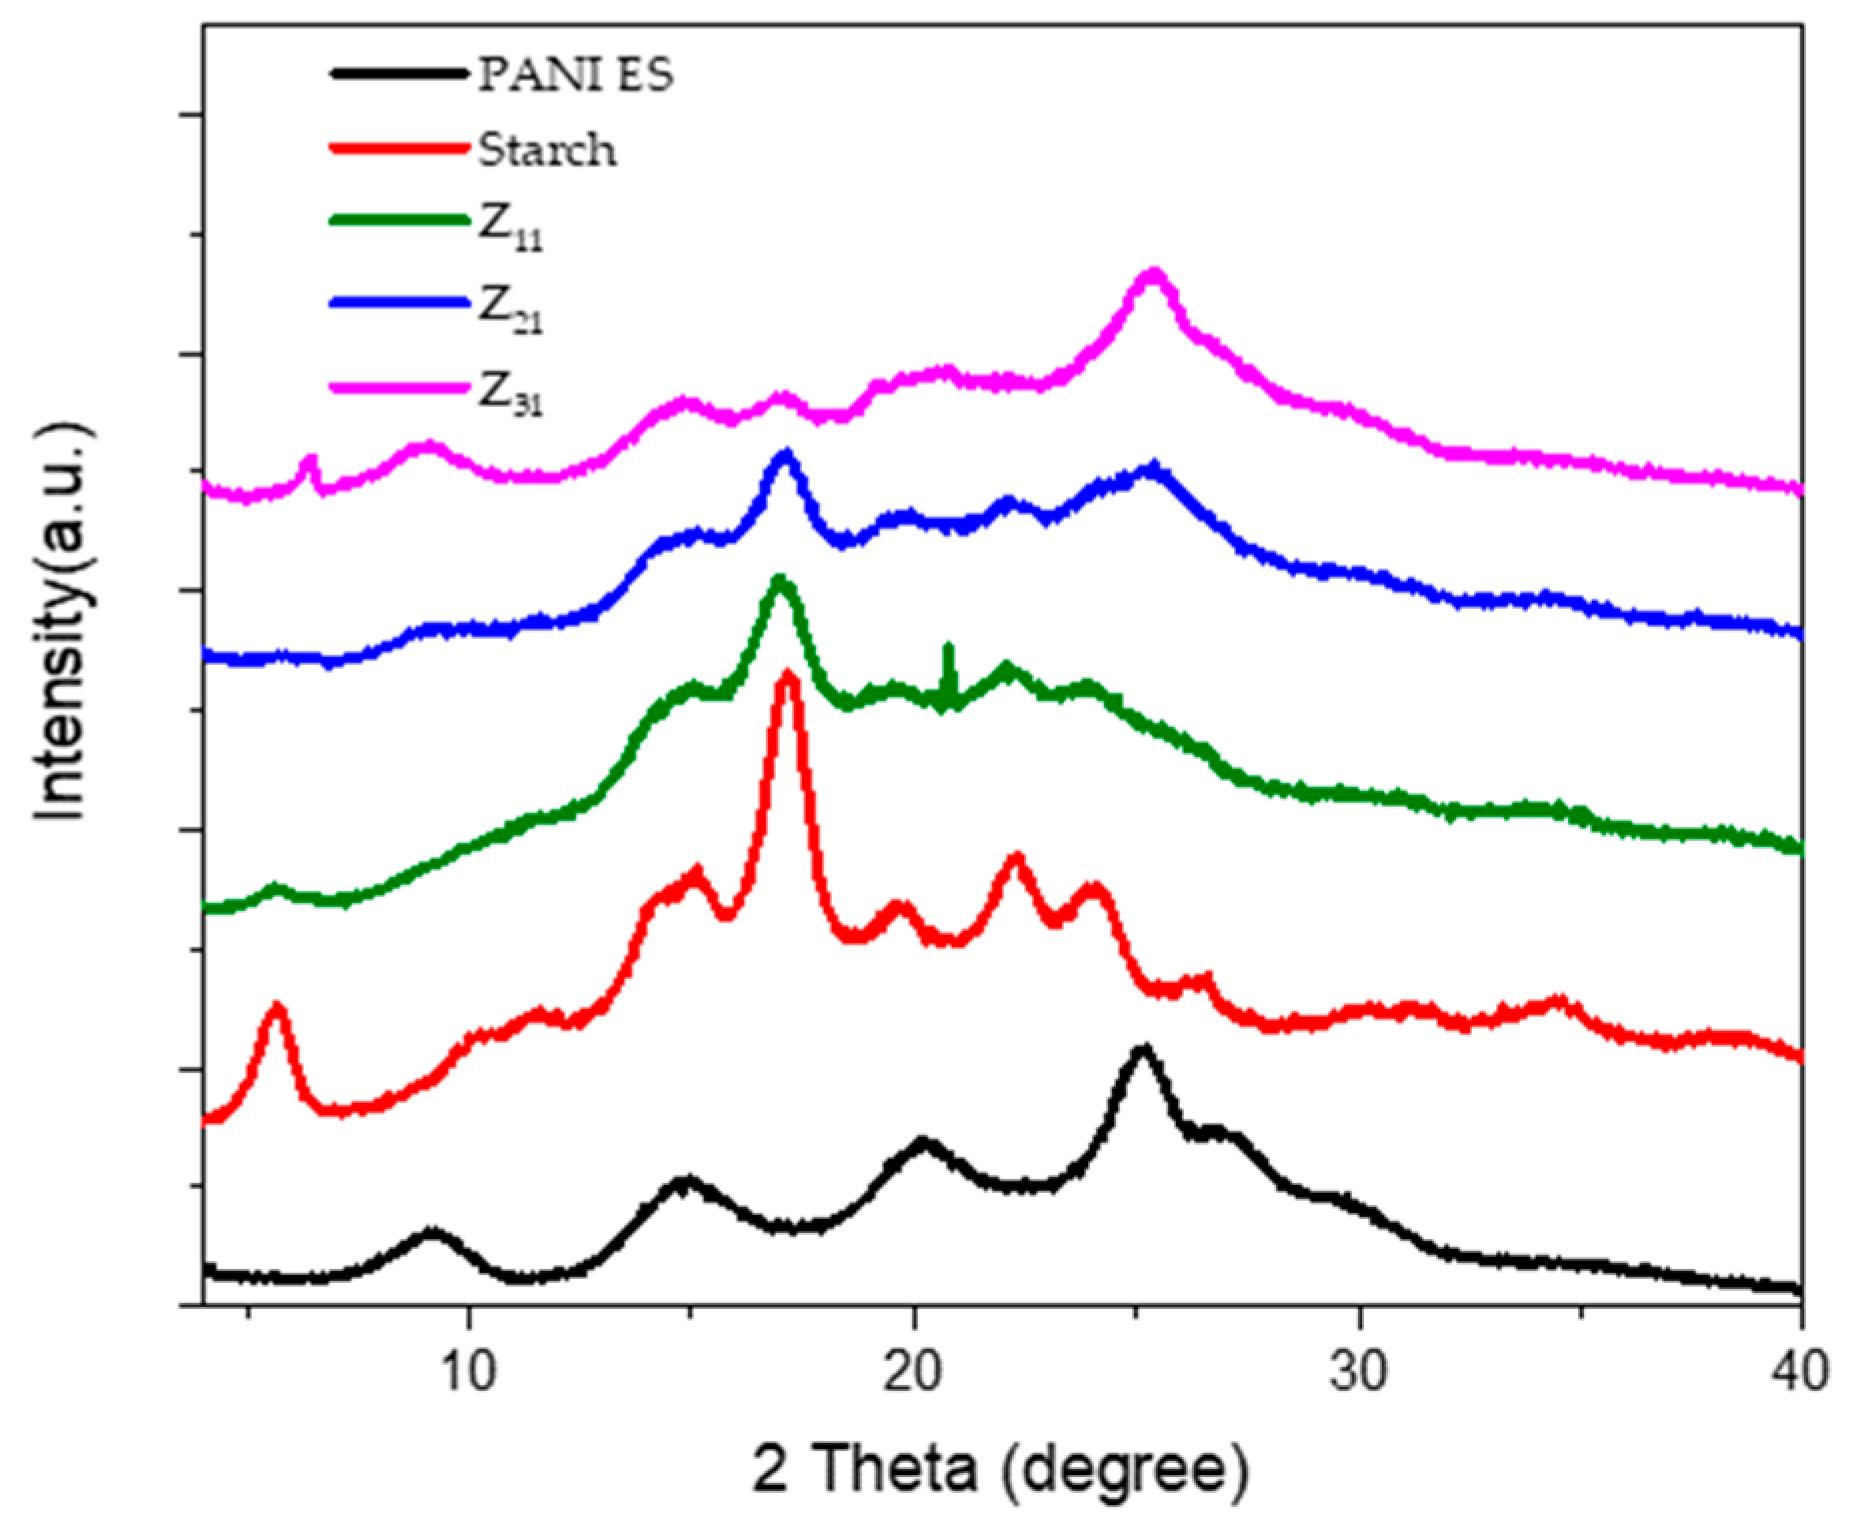
Figure 6 displays the X-ray diffraction patterns of polyaniline, starch, and PANI/starch biocomposites. The semi-crystalline structure of emeraldine salt (ES) is reflected by several wide reflection peaks in the XRD profile of PANI-ES, which represents the crystalline sections and is found at 2θ = 14.9°, 20.21°, and 25.2° [
67]. In addition, a semi-crystalline pattern for potato starch can be seen, with weak reflections at 2θ = 15.2° and 19.6°, moderate reflections at 2θ = 5.7°, 15.0°, 22.2°, and 24.1°, and strong reflections at 2θ = 17.2°. B-type crystalline starch structures, commonly referred to as tuber starches, typically exhibit this pattern [
50,
68].
The Bragg's equation is used for each peak to calculate the interplanar distance "d.":
wherein θ is the Bragg angle for the matching peak, λ = 1.542 Å, and n = 1 (first-order reflection). Table 2 shows our materials' diffraction spacing and Miller indices (hkl).
Table 2.
Calculated diffraction spacing “d” and miller indices of starch and PANI-ES.
Table 2.
Calculated diffraction spacing “d” and miller indices of starch and PANI-ES.
| Product |
2θ (°) |
hkl |
d (Å) |
| PANI-ES |
14.9 |
(011) 010 |
5.95 |
| 20.2 |
(020) 100 |
4.40 |
| 25.2 |
(200) 111 |
3.53 |
| Starch |
5.7 |
(001) |
15.51 |
| 11.4 |
(111) |
7.76 |
| 15.0 |
(140) |
5.89 |
| 17.3 |
(131) |
5.14 |
| 19.6 |
(103) |
4.53 |
| 22.2 |
(113) |
4.00 |
| 24.1 |
(132) |
3.69 |
| 26.6 |
(142) |
3.35 |
The ratio of the percentage of the peak's crystalline area to the overall area of the XRD pattern beneath the curve yielded the degree of crystallinity (Xc%) values. The following formula is used: [
69]
Hc: is the intensity of crystalline profiles, and Ha: the intensity of amorphous profiles.
Table 3 summarizes the crystallinity degree values of starch, polyaniline, and biocomposites. Compared to polyaniline (19%), native starch exhibits a higher degree of crystallinity (37%). For PANI–starch colloids, a contribution due to different starch content can be assessed. A shift in the crystallinity may cause changes in the XRD patterns, which might indicate modifications in the ultrastructure of the PANI and starch microdomains. The shift of PANI-ES peaks and the disappearance of the starch peaks at 2θ = 22.2° and 26.6° complement this observation. It appears that the original crystalline structure of starch is partially destroyed by the presence of aniline in the reaction media and PANI chains during propagation. This is especially true for Z
21 and Z
31.
3.8. Thermal Characterization
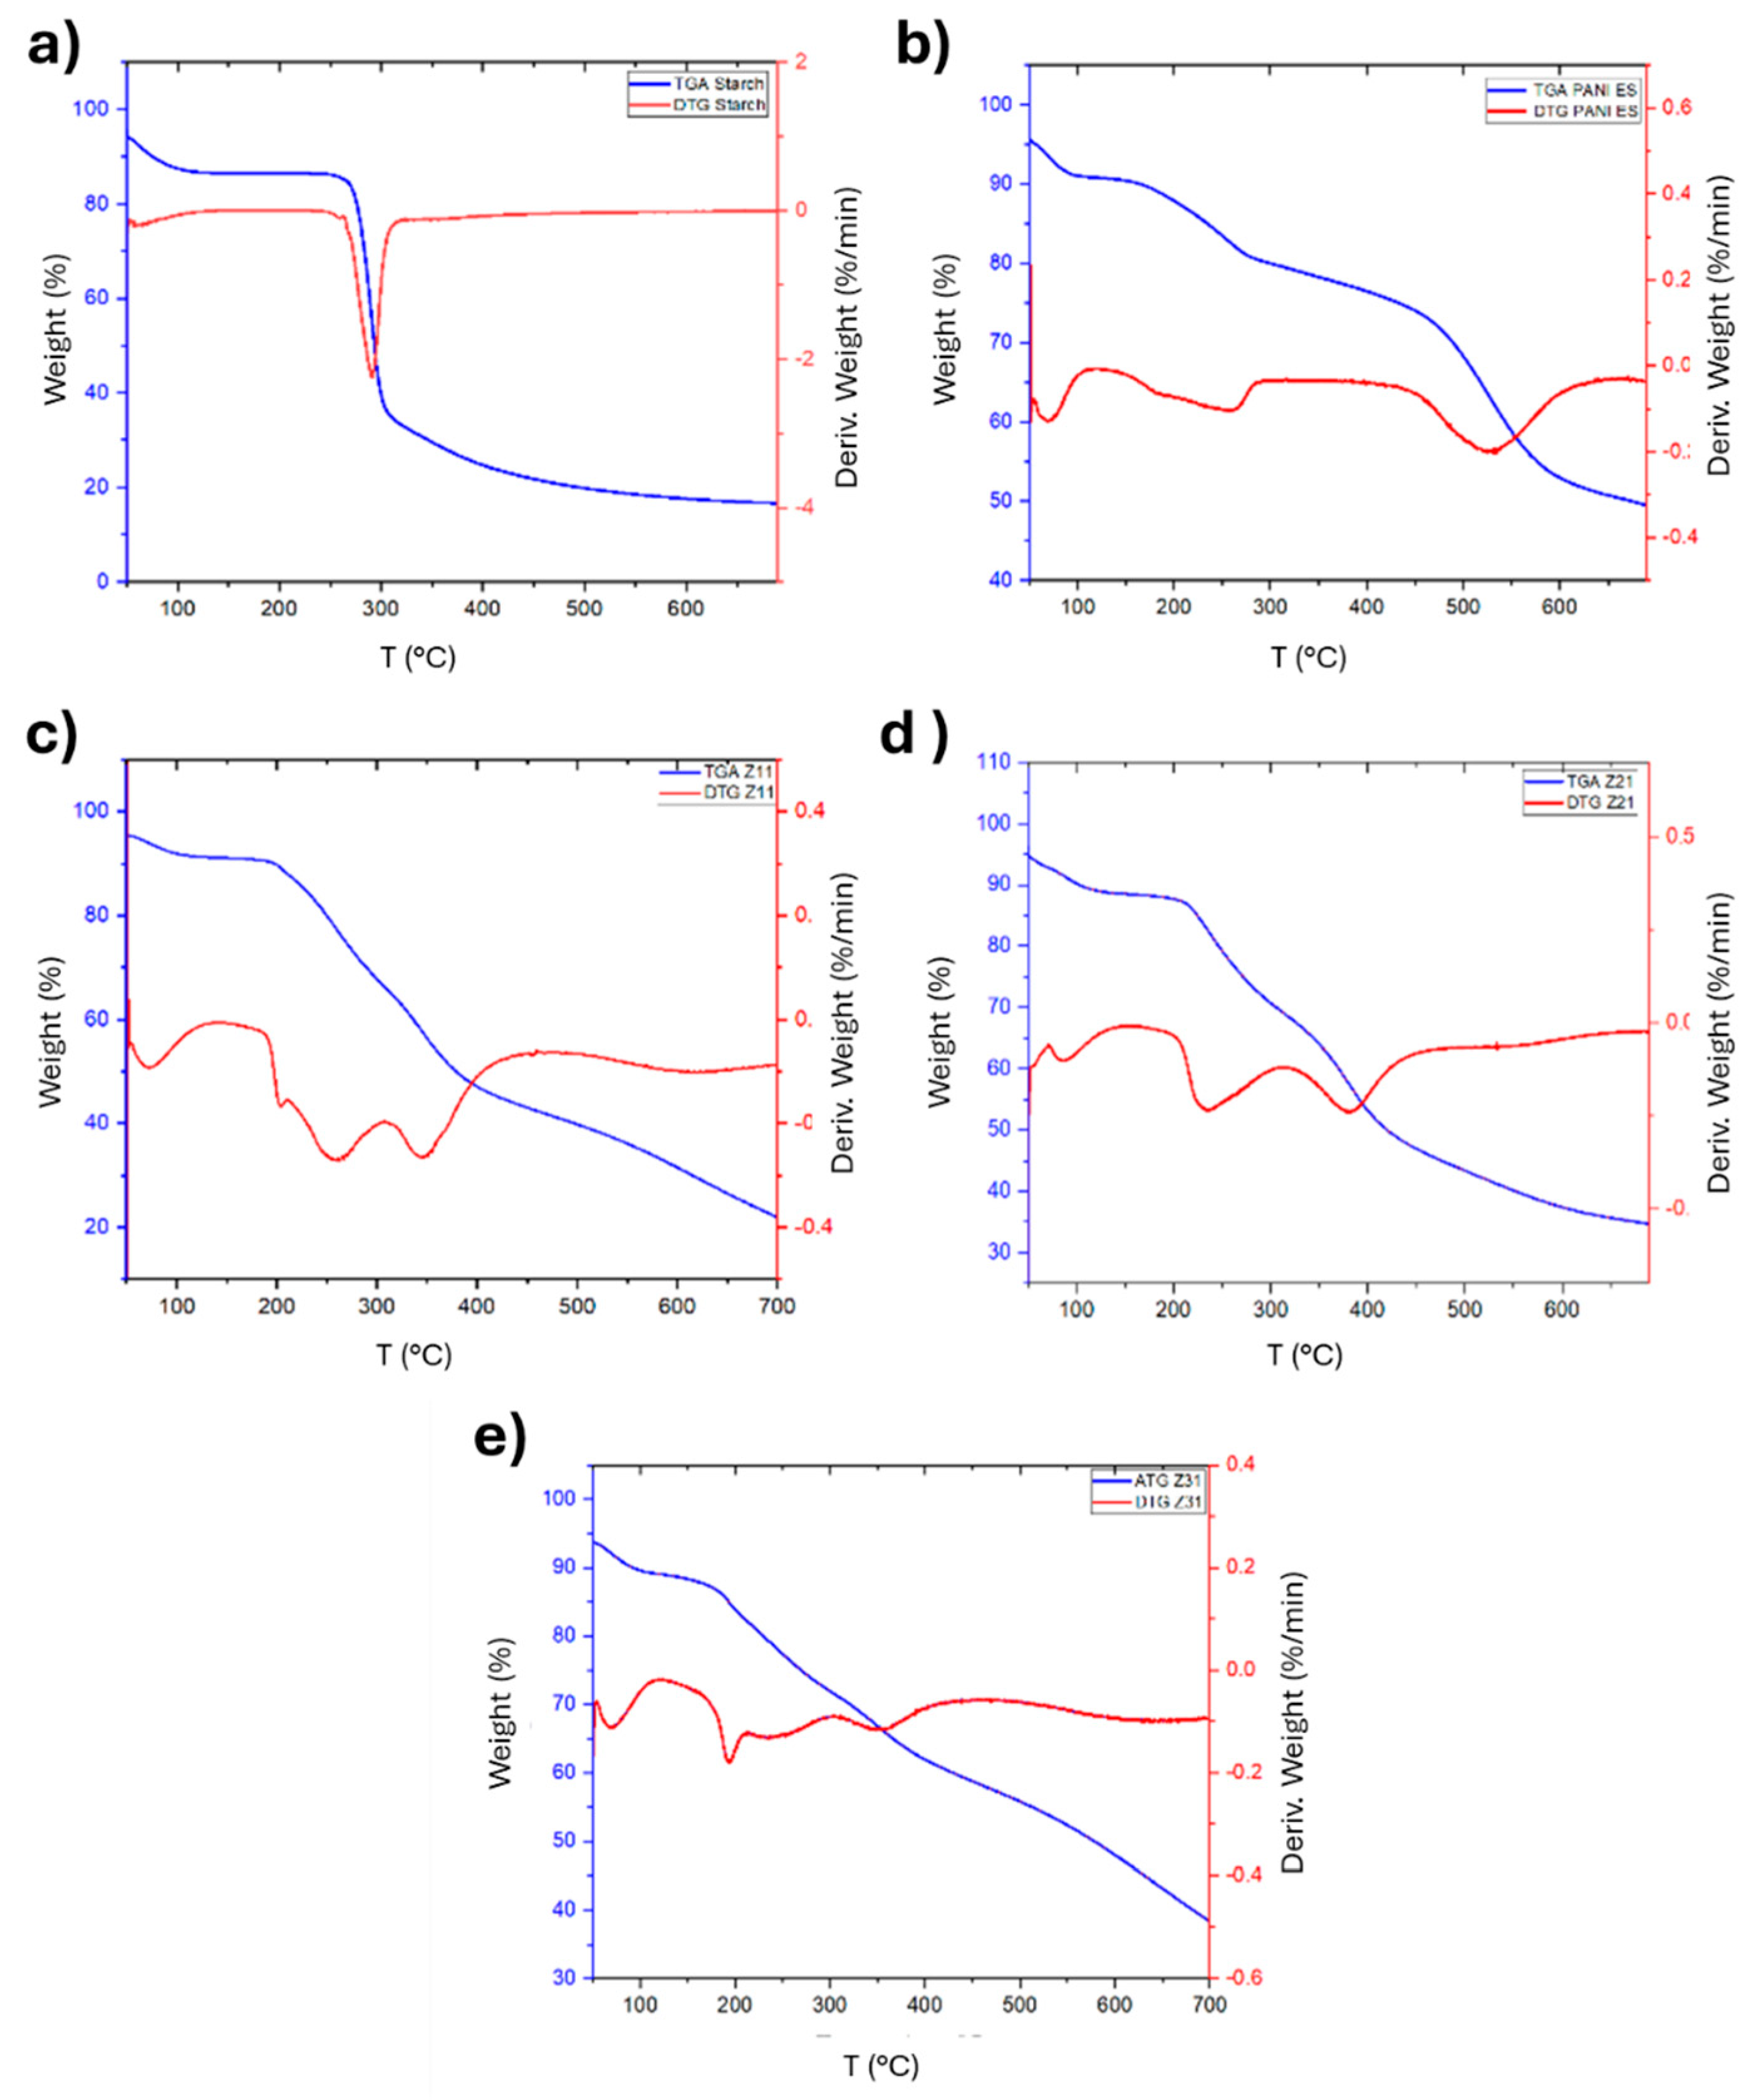
The TG/DTG curves resulting from the thermal gravimetric analysis of PANI, starch, and their biocomposites are depicted in
Figure 7, which illustrates a sharp step indicative of starch degradation, and a broad temperature range for weight loss of PANI. At 290 °C, native starch does in fact lose 50% of its weight (
Figure 7a and
Table 4, while PANI exhibits a corresponding decrease in weight at 673 °C (
Figure 7b and
Table 4). In detail, PANI-ES displays an initial weight loss occurring between 50 °C and 100 °C, most likely due to the removal of volatile molecules and evaporation of water. Additionally, a small endothermic peak is observed between 210 °C and 250 °C. Subsequently, a significant weight loss occurs from 400 °C onwards, due to the degradation of PANI chains [
54].
The DTG curves show that the biocomposites' overall degradation rate decreases as their aniline content increases, underscoring the significant influence of polyaniline on their thermal stability (
Figure 7c,d). It is also noteworthy that the distinctive decomposition pattern of PANI, highlighted by a prominent DTG peak at 500 °C, is no longer clearly evident for the composites.
The TGA thermograms, which are associated with thermal stability, also provide the values for T5, T50, and T95, that are the temperatures at which 5, 50, and 95% of the mass is volatilized, respectively, as illustrated in
Table 4. Biocomposites and PANI ES are noticeably more stable than starch.
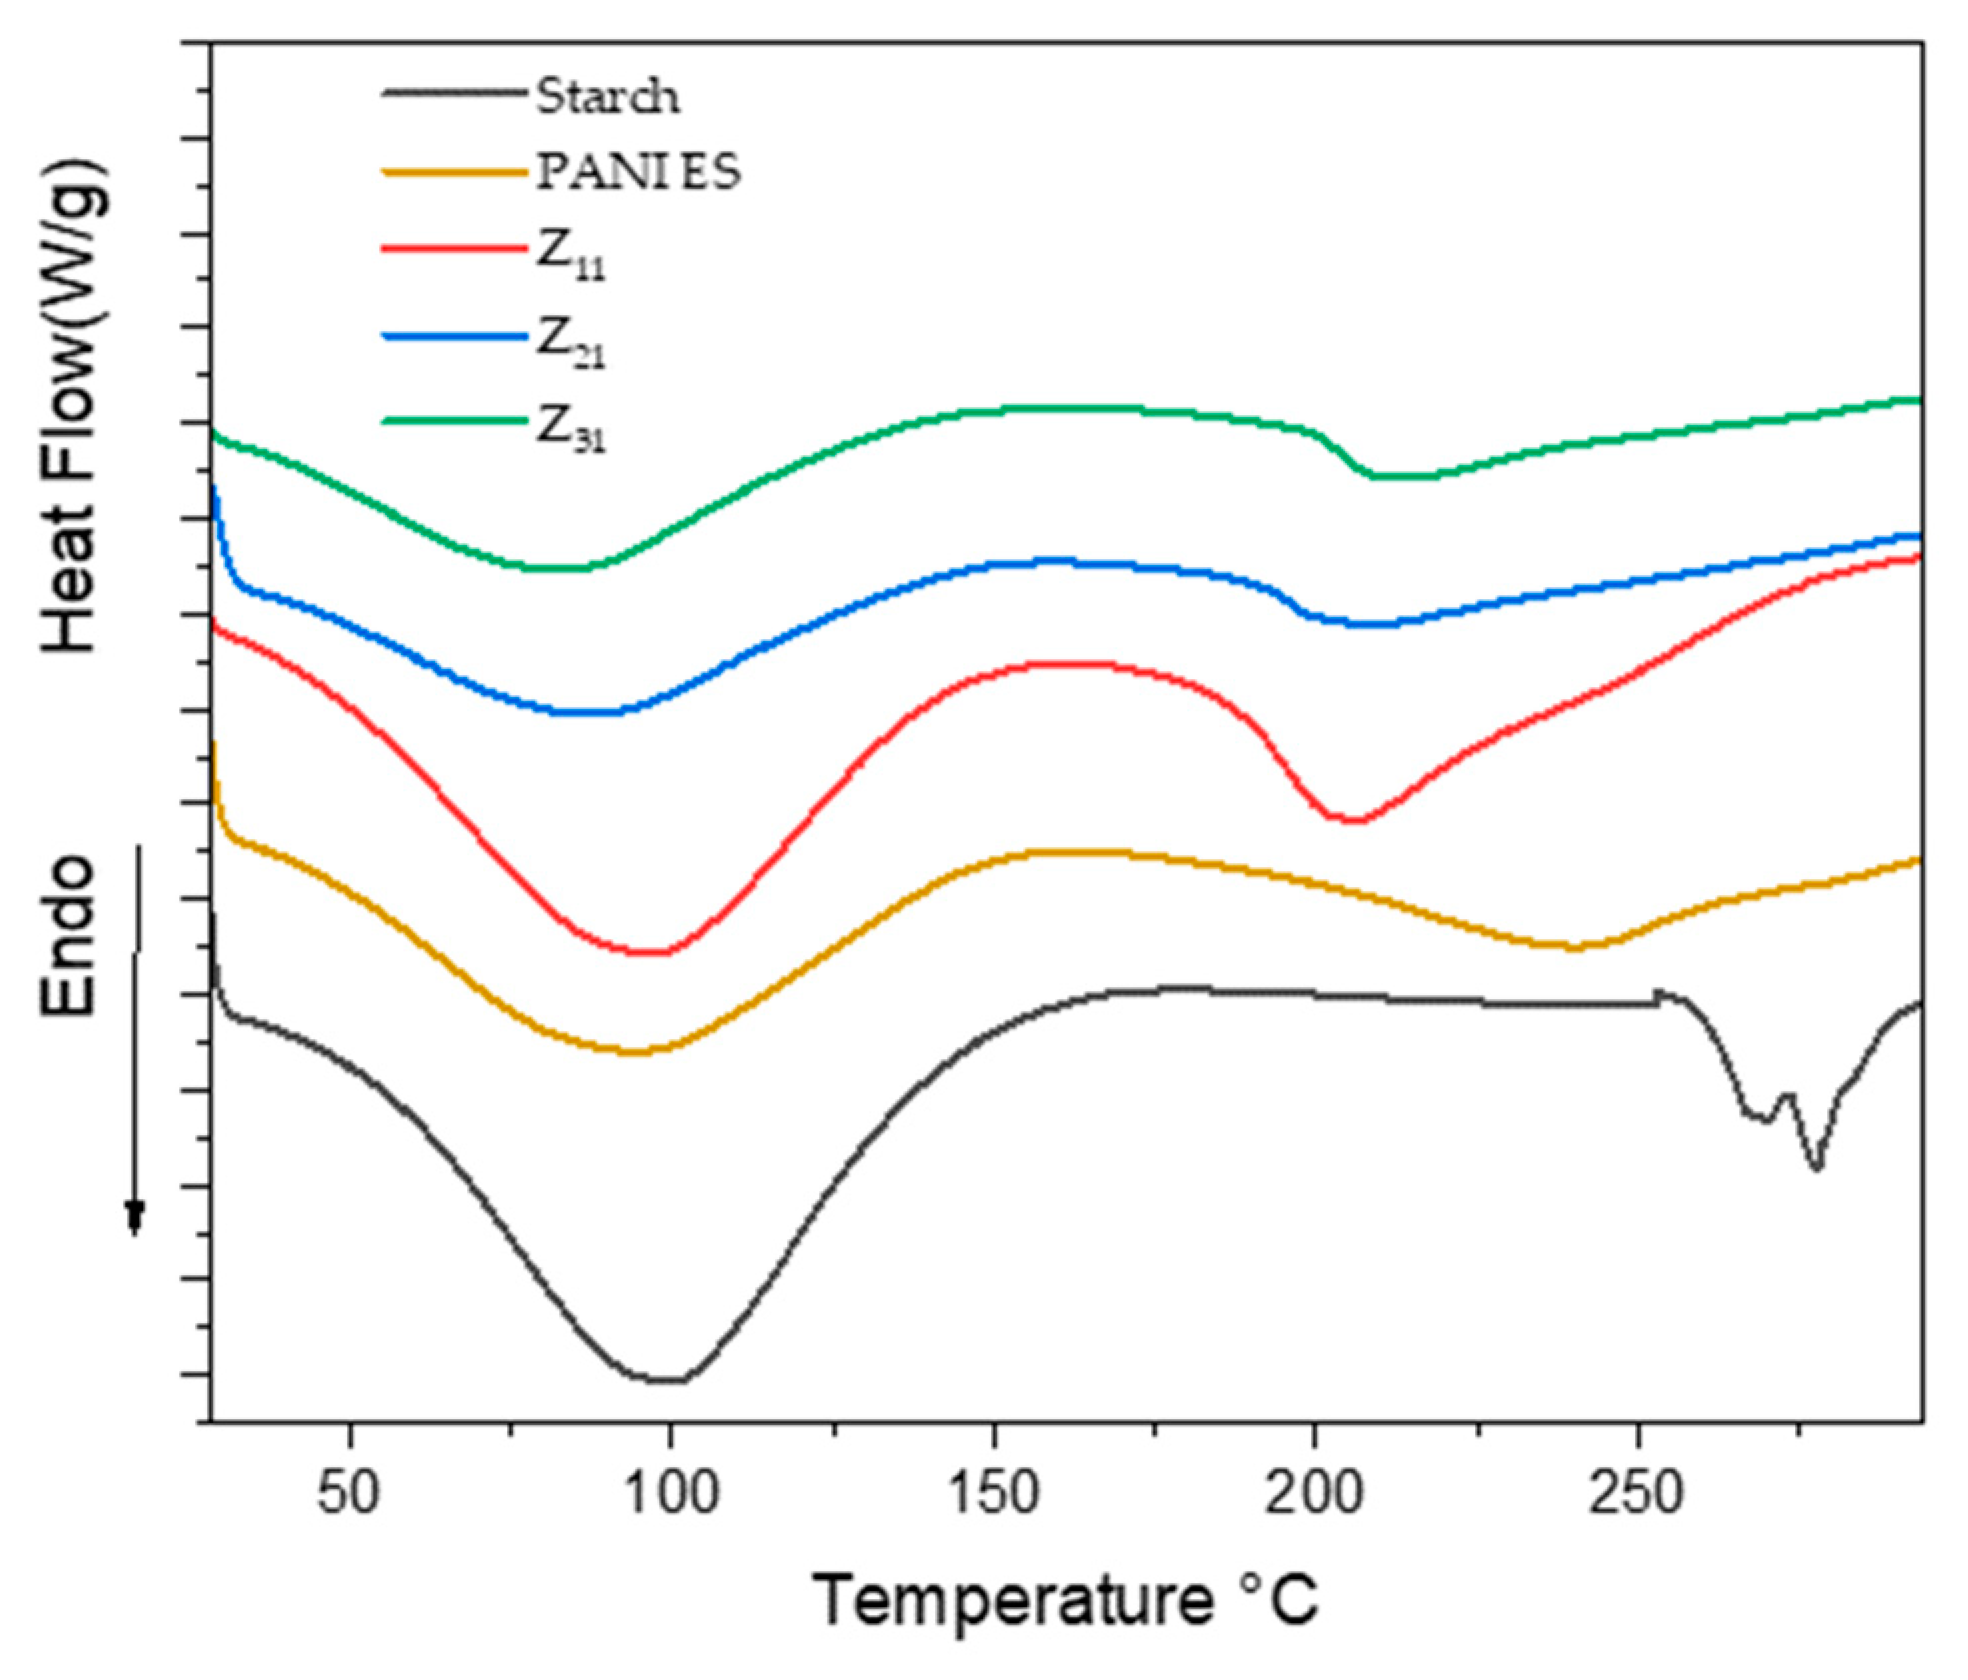
Figure 8 shows the DSC profiles of starch, polyaniline, and their biocomposites. Within the temperature range of 60–140 °C, broad endothermic peaks are observed, which can be attributed to the water evaporation, in accordance with the TGA and DTG data. Additionally, the PANI thermograms exhibit a second endothermic peak at T=240°C, Possibly illustrating the mobility of tiny chain segments and the glass transition temperature (Tg) [
70,
71]. Conversely, two well-defined, narrow endothermic peaks at 266°C and 278°C can be observed in the starch thermogram and are linked to the thermal breakdown of starch chains [
72]. However, these peaks are absent in the composites, aligning with the findings from TGA analysis. When examining PANI/starch materials, in the same temperature range, we observe the existence of the endothermic peak associated with water evaporation. On the other hand, the second endothermic peak, associated with the difference in PANI's Tg, moves to a lower temperature, especially for Z
11. This change, which is probably the result of the interactions between the components, validates the structural changes in the biocomposites. (for a comprehensive overview of the DSC data, see
Table 5).
3.9. Cyclic Voltammetry
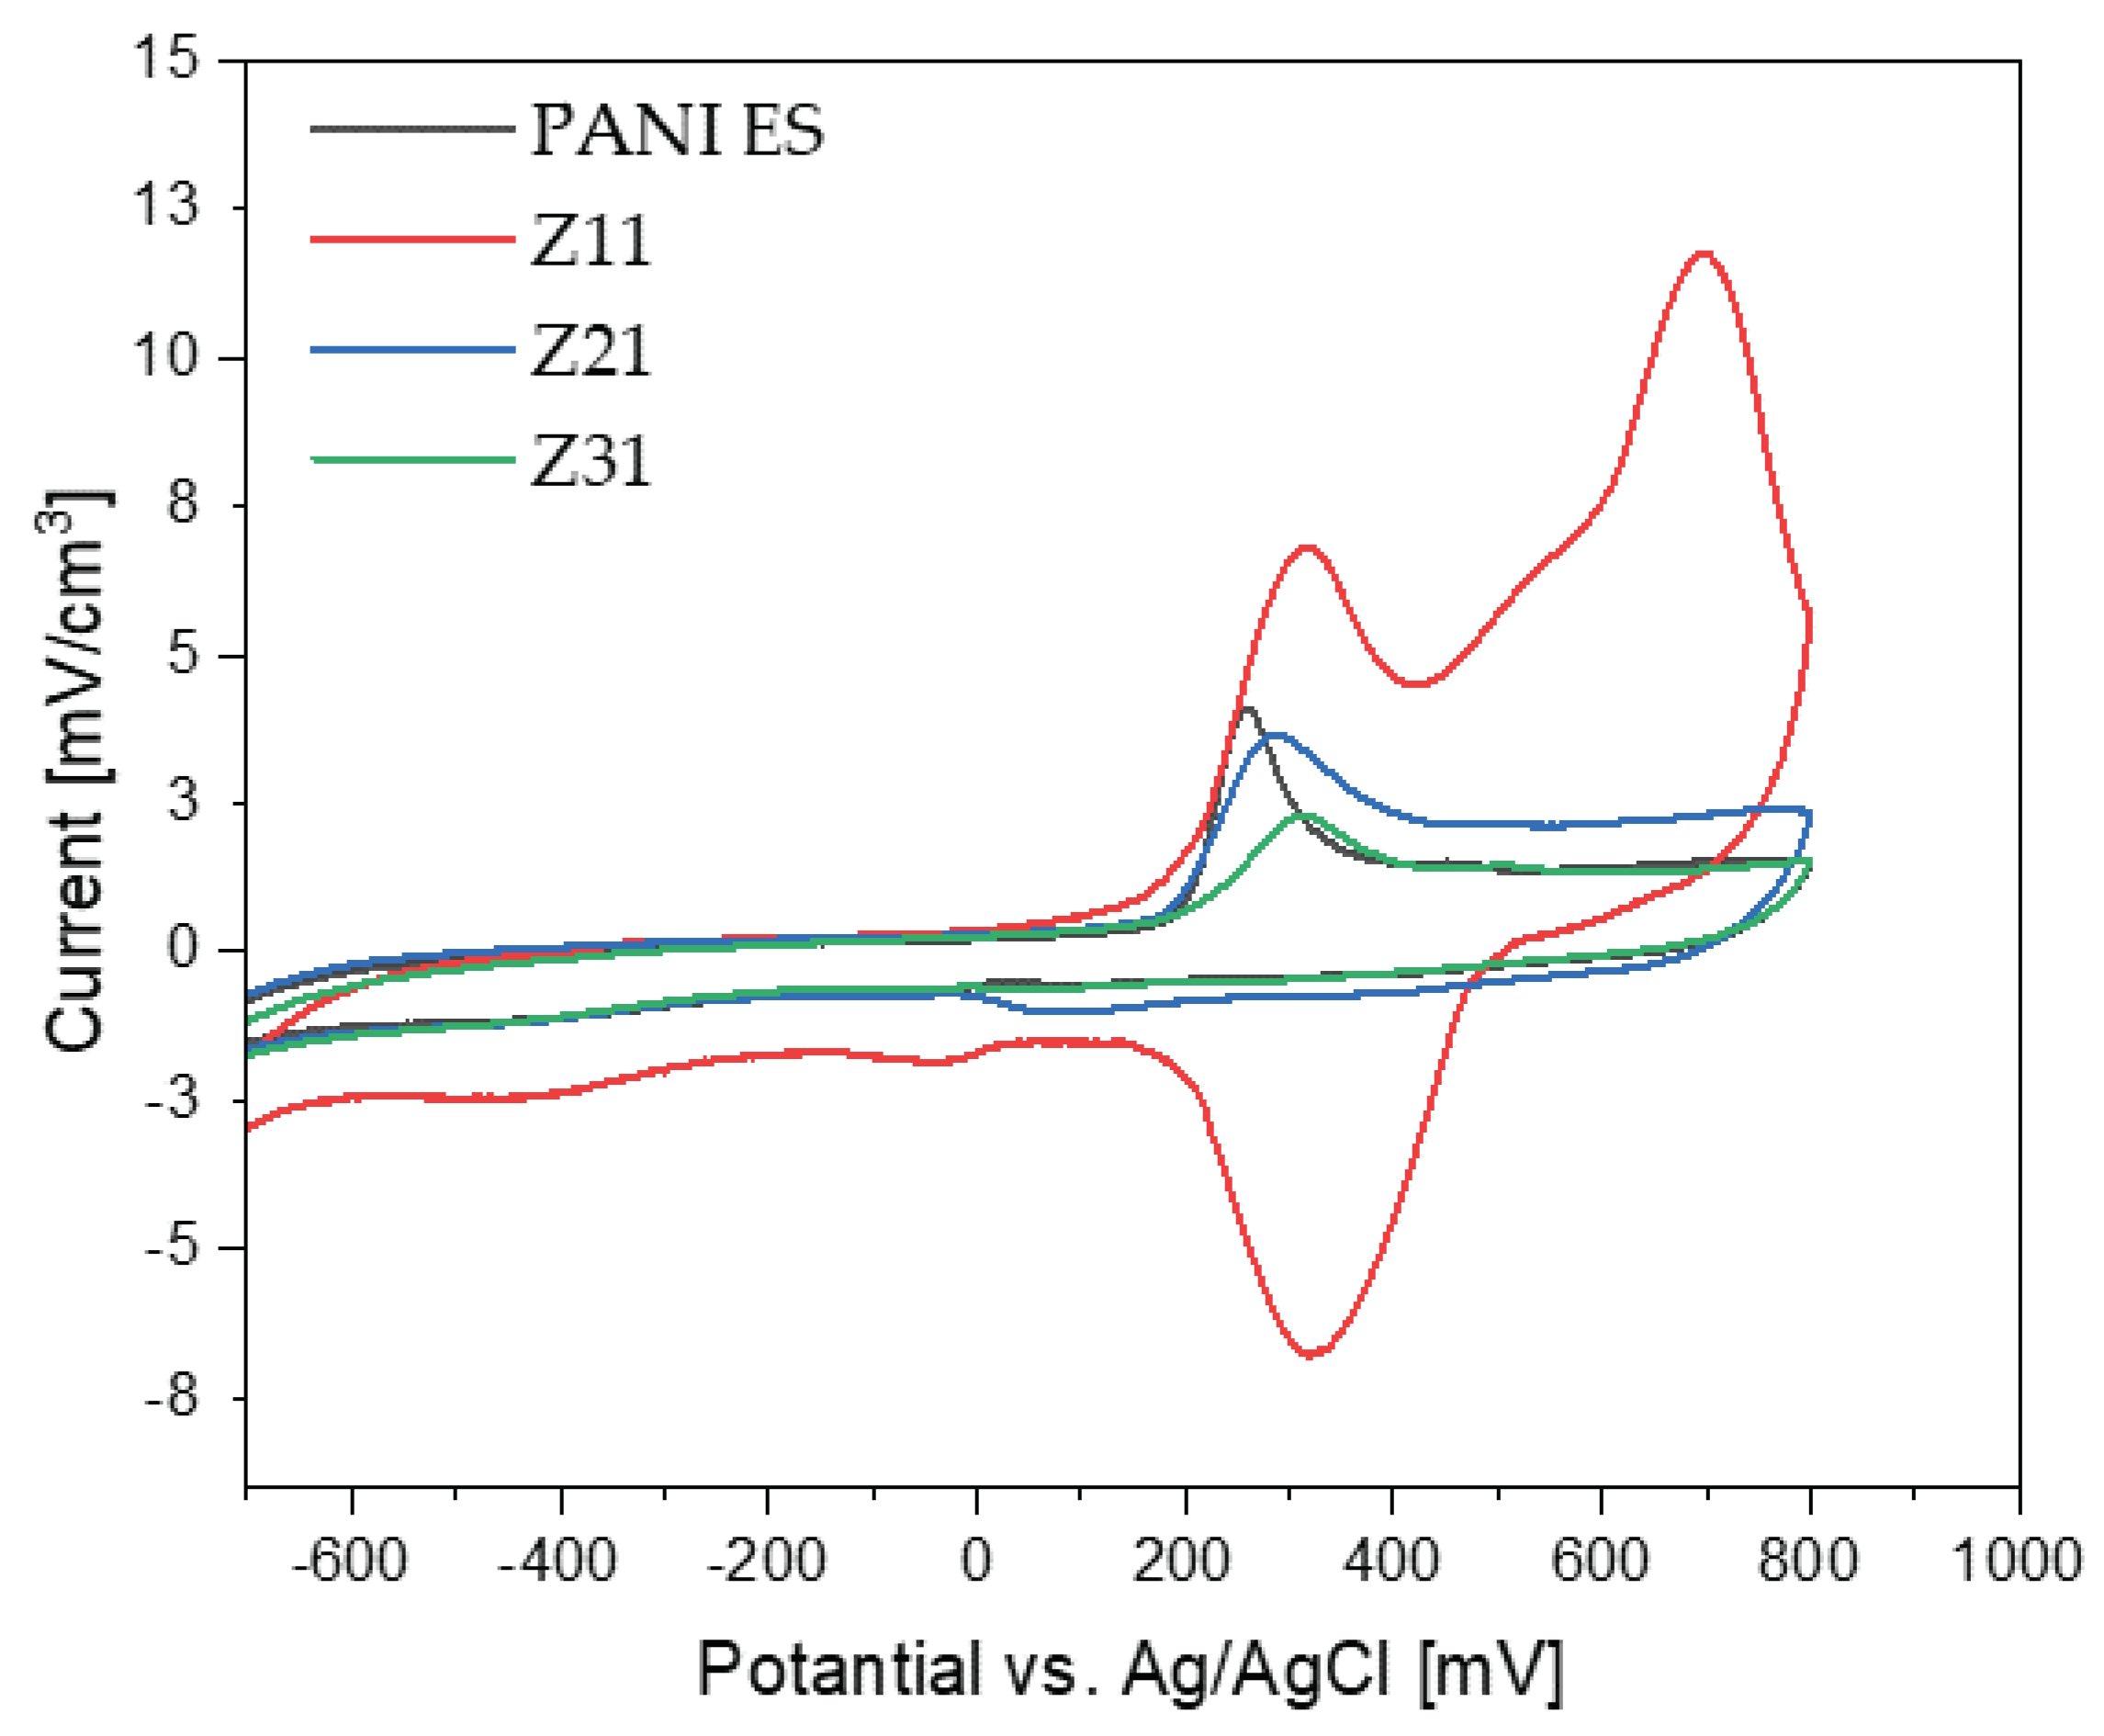
On the CV curve, two pairs of anodic and cathodic current peaks indicate two distinct sets of redox activity. The first pair of redox couple peaks appears between 0 and 0.25 V vs. Ag/AgCl reference electrode and represents the conversion of the completely reduced leucoemeraldine base to the partly oxidized emeraldine. The redox current peaks in the second set, which occur between 0.6 and 0.8 V vs. Ag/AgCl, is related to the conversion of emeraldine to the fully oxidized pernigraniline form. While the second redox couple (peaks Ox2 and Red1) potential is highly reliant on pH, the first redox couple (peaks Ox1 and Red2) potential is mostly independent of pH [
73]. Since no proton is involved, this latter reduction reaction (eq. 1) may be defined as follows: [
74].
However, the pH of the solution has a significant impact on the peak position of the second redox process, being reasonable to presume that protons are involved in the reaction illustrated below (eq. 2):
Notably, when the scan rate value increases (see
Figure S1 and
Table S2 in the Supporting Information), the current density increases as well, demonstrating the materials' strong electroactivity and electrochemical capacitive behaviour [
72].
All PANI/starch synthesized by chemical oxidation polymerization are conducting materials, thus representing an advancement with respect to previously reported PANI-emeraldine base/starch composites [
50]. Among the colloids, the Z
11 sample is the most electroactive material, showing the highest current for both oxidation and reduction processes in the explored range.
Figure 9.
Cyclic voltammograms of PANI and PANI/starch biocomposites, measured at 100 mV s-1 using a Ag/AgCl reference electrode, in H2SO4 solution (1 M).
Figure 9.
Cyclic voltammograms of PANI and PANI/starch biocomposites, measured at 100 mV s-1 using a Ag/AgCl reference electrode, in H2SO4 solution (1 M).
Table 6.
Current density measured at 100 mV s-1 against Ag/AgCl reference electrode in 1 M H2SO4 solution from the cyclic voltammogram peaks of PANI ES and the biocomposites PANI ES/starch.
Table 6.
Current density measured at 100 mV s-1 against Ag/AgCl reference electrode in 1 M H2SO4 solution from the cyclic voltammogram peaks of PANI ES and the biocomposites PANI ES/starch.
| Products |
OX 1 |
OX 2 |
Red 1 |
Red 2 |
| Z11 |
6.80 |
11.75 |
-6.77 |
-1.80 |
| Z21 |
3.63 |
2.41 |
-0.69 |
-0.77 |
| Z31 |
2.30 |
1.47 |
-0.47 |
-0.64 |
| PANI ES |
4.11 |
1.50 |
-0.37 |
-0.69 |
3.10. Processability Into a Polymeric Membrane
To demonstrate the easy processability of the biocomposites, the sample Z
11 has been used to prepare a thin membrane, based on polyether sulfone (PES). In order to make the membrane porous, a mixture of PEG (21 wt.%) and polyvinylpyrrolidone PVP (5 wt.%) was added to the blend as pore formers. The membranes were prepared from NMP solutions, by the phase inversion technique, upon immersion in a water coagulation bath after casting (casting thickness set at 250 μm) on a glass surface [
75]. The membranes were characterized in terms of FTIR, water contact angle (WCA), porosity, pores size surface, and cross-section SEM images.
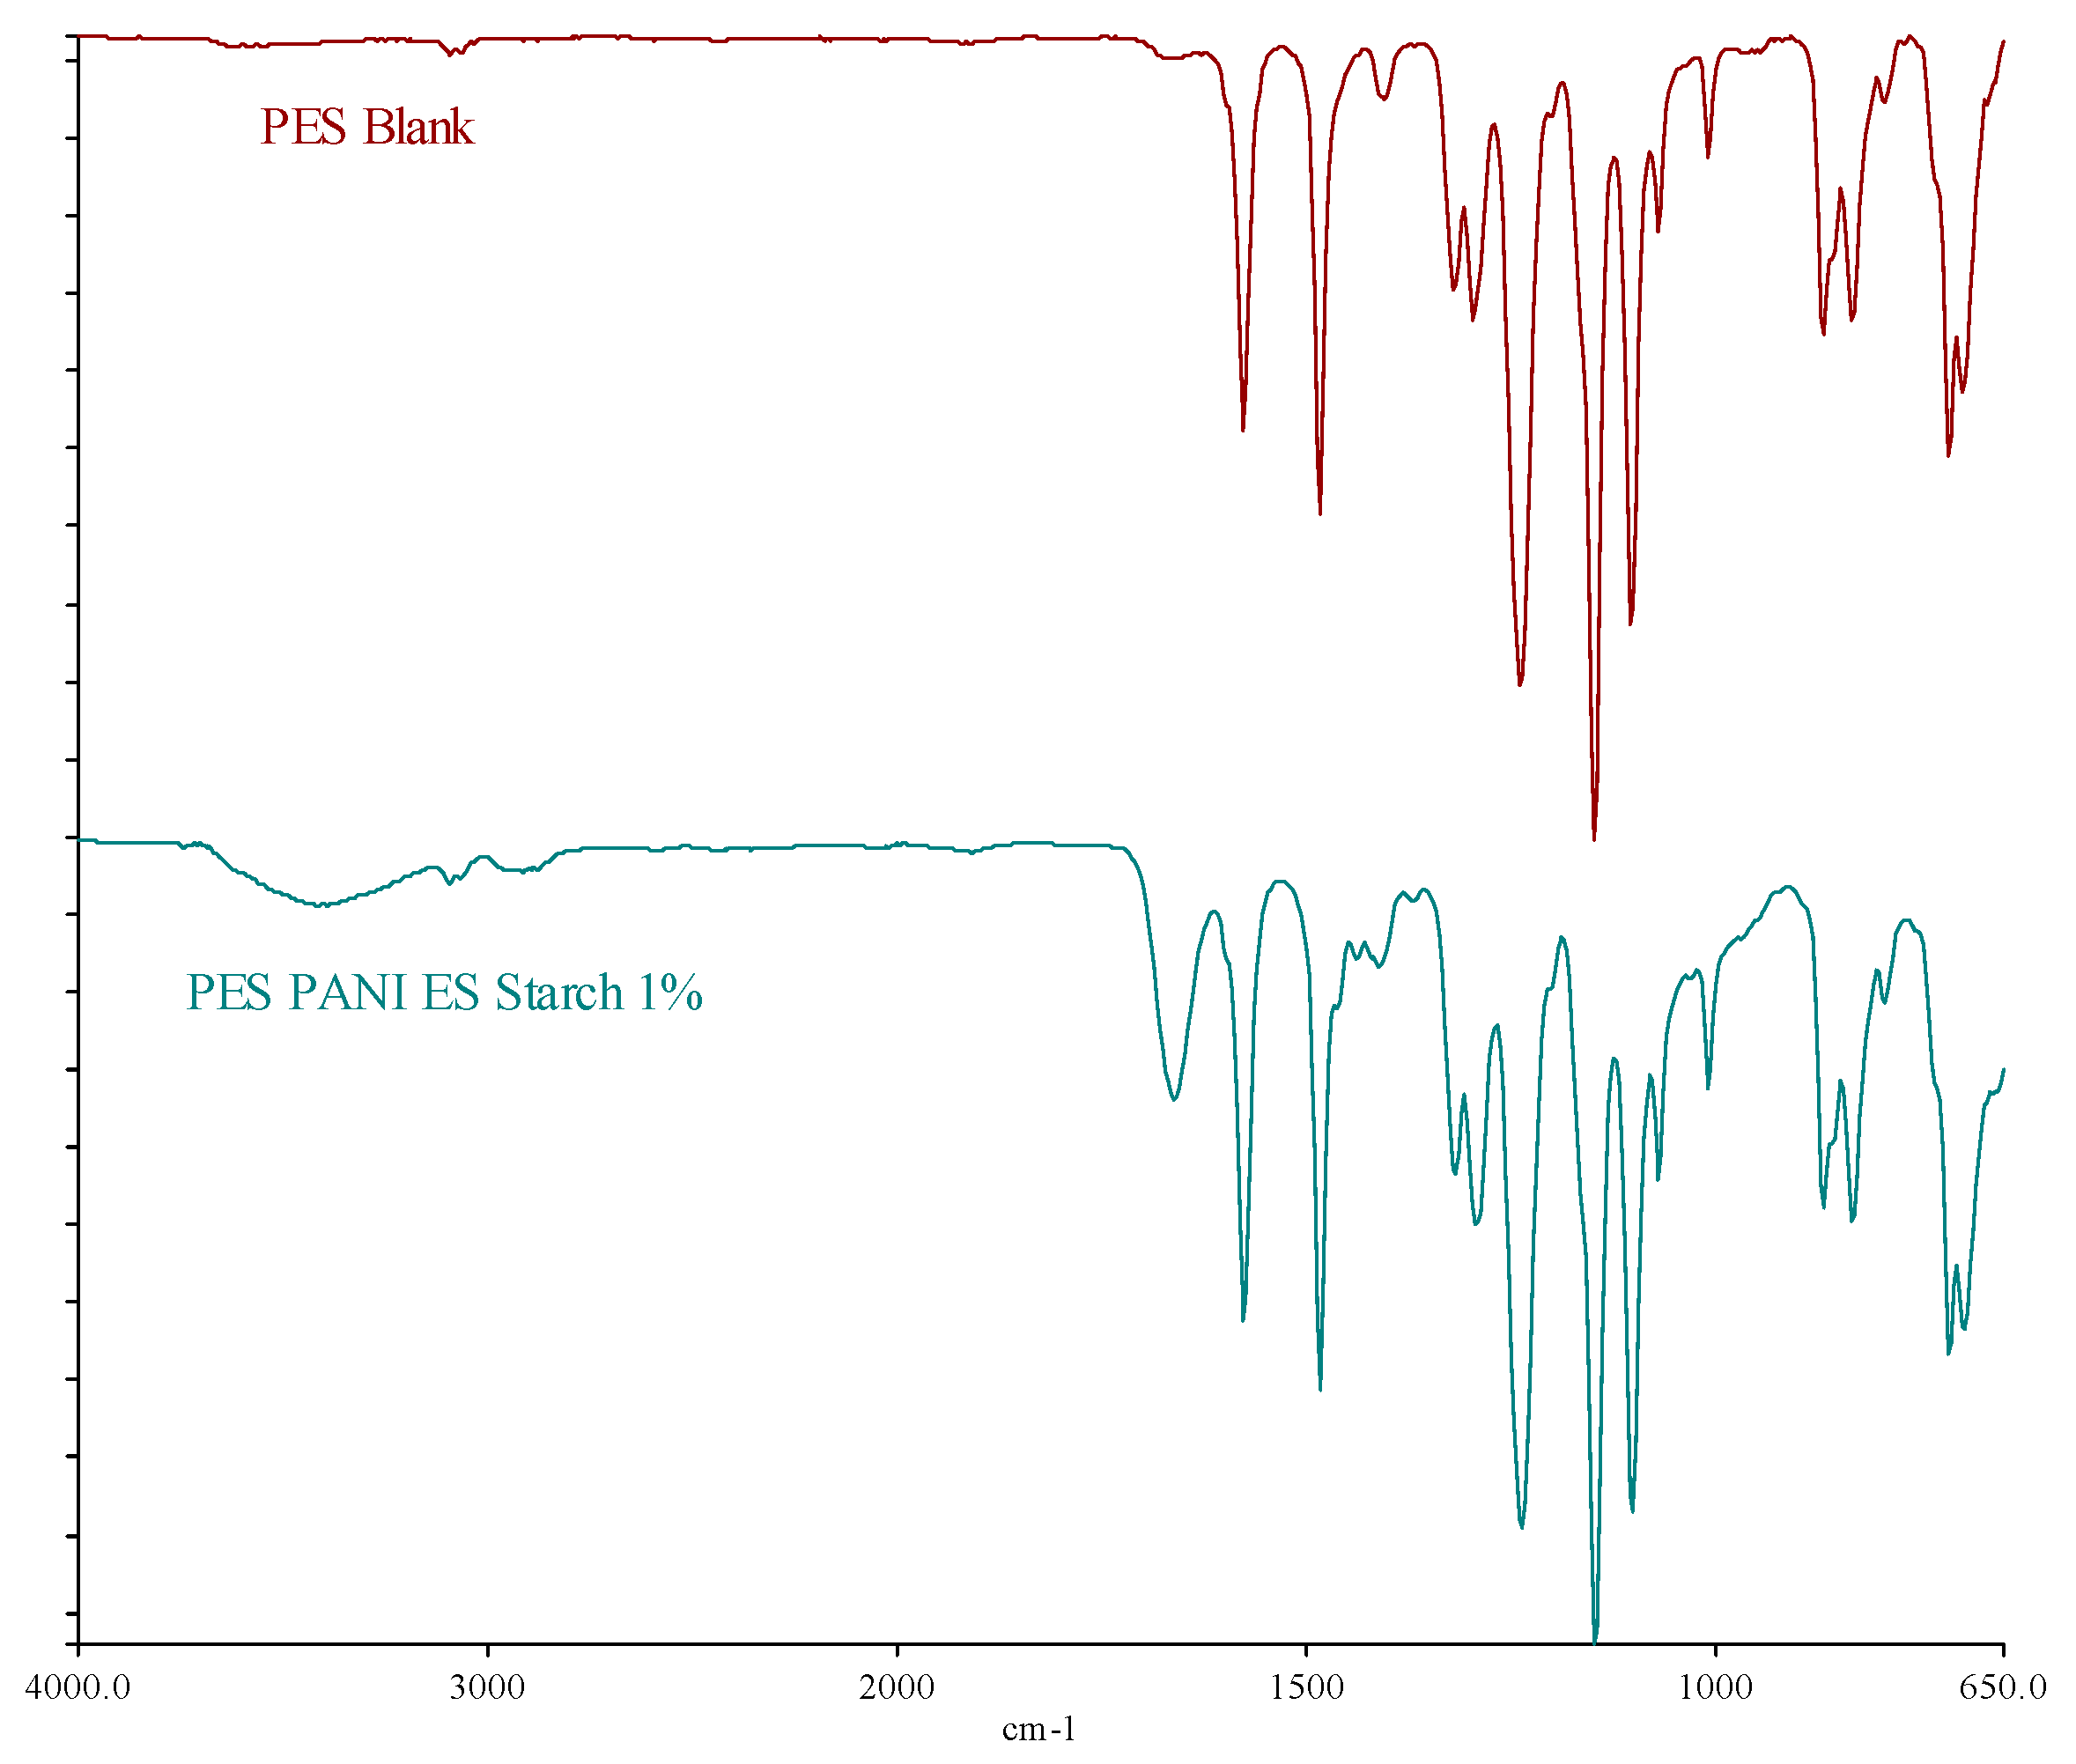
FTIR shows the membranes' spectra, which are presented in the following
Figure 10.
The investigation indicates that the 1% dopants has little effect on the surface composition of the membranes, which displays the signals pattern of the PES matrix. There are two more peaks, occurring at around 3410 cm
-1 and 1663 cm
-1 , for the PES membrane with Z
11, which are ascribed to the presence of hydroxyl (-OH) group and C=C bond [
59]. The -OH group refers to the presence of starch; while the C=C bond shows the presence of PANI in the membrane matrix.
WCAs were measured on top side of the PES membrane, in order to investigate their surface properties and the results are shown in
Table 7. WCAs range from 72° to 75°, showing the hydrophilic properties of both membranes, with negligible effect of the dopant.
SEM was used to get further insights into membranes features (see images in
Figure 11, which collects images of the cross-section, top and bottom surface of the prepared membranes).
From the SEM images, we observe that there is no agglomeration of Z
11 or phase separation, with the exception of some spots on the membrane surface, which is evidence of the miscibility of the PANI starch colloid blended in PES matrix. Both membranes (with and without dopant) exhibit macro-porous asymmetric structures. The asymmetry of the membrane consists of a dense top (or up) layer and a porous sub-layer (bottom) [
76]. For PES, the dense layer is supported by a region with finger-like type channels of ca. 0.9 μm diameter, being the overall thickness of about 153 μm and overall porosity of about 90%. For the composite membranes, the denser layer is also connected to regular finger-like macro-channels, with diameters of ca. 0.13 μm. The opposite side is characterized by the presence of even larger voids of a sponge-like region, confined by a bottom surface with narrower openings (diameter <3 μm). The impact of the dopants on the membranes’ thickness is more evident, being increased from 153 μm to 228 μm. This is probably due to the addition of dopants, that enhance the demixing of polymer and non-solvents, leading to a faster coagulation of the membrane. This behavior also favors the formation of smaller macro voids, and has an impact on the overall porosity decrease [
77], being thus appealing to increase selectivity and rejection during separation processes. All in all, these results are interesting for the development of conductive membrane for water filtration, which will be the object of future investigation. Conductive membranes, indeed, are promising for the possibility to tune the selectivity, impart antifouling properties or promote electrochemical processes such as electrocoagulation or electrooxidation. For example, conductive polymers can enhance the membrane's filtration efficiency by attracting and repelling charged particles in water. This can lead to better removal of contaminants such as heavy metals, bacteria, and organic compounds as ionic dyes [
78].
4. Conclusions
The outcomes of this work show how to easily synthesize PANI-based colloids. Specifically, potato starch was utilized as a steric stabilizer to produce stable dispersions of polyaniline (emeraldine salt). Thus, polyaniline/starch biocomposites with varying ratios of aniline to starch were produced via oxidative polymerization.
Starch act as template, leading to an improved solubility of polyaniline in DMSO, NMP and DMF while improving its higher-temperature dispersion in glycerol, water, and chloroform. This, in turn, is expected to enhance the polyaniline's processability. In order to assess the impact of variations in the aniline/starch ratios, several tests including cyclic voltammetry and FTIR-ATR, Raman, UV-Vis, XRD, TGA, and DSC, were carried out.
Surface analyses show that polyaniline chins grow on the surfaces of the starch granules. The degree of crystallinity and particle size show significant changes in the composite material, as evidenced by the growth of smaller particles and the loss of the native starch crystalline lattice. Despite being less thermally stable, the Z11 appears to be the one with better morphology and degree of crystallinity. In terms of electron exchange and capacitive behavior, the cyclic voltammetry tests demonstrate improved electro-activity in the composite materials, confirming Z11 as the best formulation.
As far as processability is concerned, a hydrophilic PES membrane has been prepared with the highly dispersed Z11. The latter has an effect on membrane morphology (thickness, pore size, and shape). In particular, the addition of dopant decreased the overall pore size, and increased the membrane thickness, while maintaining the same hydrophilicity, being thus promising for applications in the field of water filtration.
The obtained composites have thus demonstrated to be polyaniline colloids with appealing features, namely: conductivity, biocompatibility, processability. The polyaniline/starch composites are expected to be adaptable materials that will increase the range of uses for PANI.
Supplementary Materials
The following supporting information can be downloaded at the website of this paper posted on Preprints.org.
Author Contributions
Conceptualization, methodology, validation, and formal analysis, investigation, resources; data curation, writing—original draft preparation, S.B.; Investigation, data curation, S.B., X.L. G.C., F.R.; writing—review and editing, S.B, X.L., S.D., A.F. and M.C.; supervision, S.D. and M.C.; All authors have read and agreed to the published version of the manuscript.
Acknowledgments
We thank Nicola Dengo for his assistance with Raman analysis.
Conflicts of Interest
The authors declare no conflict of interest.
References
- Marcilla, R.; Ochoteco, E.; Pozo-Gonzalo, C.; Grande, H.; Pomposo, J. A.; Mecerreyes, D. New Organic Dispersions of Conducting Polymers Using Polymeric Ionic Liquids as Stabilizers. Macromolecular rapid communications 2005, 26, 1122–1126. [Google Scholar] [CrossRef]
- Cawdery, N.; Obey, T. M.; Vincent, B. Colloidal Dispersions of Electrically Conducting Polypyrrole Particles in Various Media. Journal of the Chemical Society, Chemical Communications 1988, 17, 1189–1190. [Google Scholar] [CrossRef]
- Digar, M. L.; Bhattacharyya, S. N.; Mandal, B. M. Conducting Polypyrrole Particles Dispersible in Both Aqueous and Non-Aqueous Media. Journal of the Chemical Society, Chemical Communications 1992, 1, 18–20. [Google Scholar] [CrossRef]
- Stejskal, J.; Sapurina, I. Polyaniline: Thin Films and Colloidal Dispersions (IUPAC Technical Report). Pure and Applied Chemistry 2005, 77, 815–826. [Google Scholar] [CrossRef]
- Lu, Y.; Pich, A.; Adler, H. P. Synthesis and Characterization of Polypyrrole Dispersions Prepared with Different Dopants; Wiley Online Library, 2004; Vol. 210, pp 411–417.
- Mandal, T. K.; Mandal, B. M. Ethylhydroxyethylcellulose Stabilized Polypyrrole Dispersions. Polymer 1995, 36, 1911–1913. [Google Scholar] [CrossRef]
- Kwon, J.-Y.; Kim, E.-Y.; Kim, H.-D. Preparation and Properties of Waterborne-Polyurethane Coating Materials Containing Conductive Polyaniline. Macromolecular research 2004, 12, 303–310. [Google Scholar] [CrossRef]
- Bjorklund, R. B.; Liedberg, B. Electrically Conducting Composites of Colloidal Polypyrrole and Methylcellulose. Journal of the Chemical Society, Chemical Communications 1986, 16, 1293–1295. [Google Scholar] [CrossRef]
- Stejskal, J.; Kratochvíl, P.; Helmstedt, M. Polyaniline Dispersions. 5. Poly (Vinyl Alcohol) and Poly (N-Vinylpyrrolidone) as Steric Stabilizers. Langmuir 1996, 12, 3389–3392. [Google Scholar] [CrossRef]
- Stejskal, J.; Kratochvíl, P.; Armes, S. P.; Lascelles, S. F.; Riede, A.; Helmstedt, M.; Prokeš, J.; Křivka, I. Polyaniline Dispersions. 6. Stabilization by Colloidal Silica Particles. Macromolecules 1996, 29, 6814–6819. [Google Scholar] [CrossRef]
- Armes, S. P.; Miller, J. F.; Vincent, B. Aqueous Dispersions of Electrically Conducting Monodisperse Polypyrrole Particles. Journal of colloid and interface science 1987, 118, 410–416. [Google Scholar] [CrossRef]
- Ohsawa, T.; Kabata, T.; Kimura, O.; Nakajima, S.; Nishihara, H.; Yoshino, K. Non-Linear Electric Properties of Polyaniline Doped with Organic Acceptors. Synthetic metals 1993, 57, 4842–4847. [Google Scholar] [CrossRef]
- Subathira, A.; Meyyappan, R. Inhibition of Corrosion of Steel Alloy Using Polyaniline Conducting Polymer Coatings. International Journal of Chemical Sciences 2010, 8, 2563–2574. [Google Scholar]
- Li, Y.; Ying, B.; Hong, L.; Yang, M. Water-Soluble Polyaniline and Its Composite with Poly (Vinyl Alcohol) for Humidity Sensing. Synthetic Metals 2010, 160, 455–461. [Google Scholar] [CrossRef]
- Shannon, K.; Fernandez, J. E. Preparation and Properties of Water-Soluble, Poly (Styrenesulfonic Acid)-Doped Polyaniline. Journal of the Chemical Society, Chemical Communications 1994, 5, 643–644. [Google Scholar] [CrossRef]
- Tallman, D. E.; Wallace, G. G. Preparation and Preliminary Characterization of a Poly (4-Vinylpyridine) Complex of a Water-Soluble Polyaniline. Synthetic metals 1997, 90, 13–18. [Google Scholar] [CrossRef]
- Winnik, M.; Lukas, R.; Chen, W.; Furlong, P. Studies of the Dispersion Polymerisation of Methyl Methacrylate in Nonaqueous Media; Wiley Online Library, 1987; Vol. 10, pp 483–501.
- Arenas, M.; Sánchez, G.; Martínez-Álvarez, O.; Castaño, V. Electrical and Morphological Properties of Polyaniline–Polyvinyl Alcohol in Situ Nanocomposites. Composites Part B: Engineering 2014, 56, 857–861. [Google Scholar] [CrossRef]
- Riede, A.; Helmstedt, M.; Riede, V.; Stejskal, J. Polyaniline Dispersions. 9. Dynamic Light Scattering Study of Particle Formation Using Different Stabilizers. Langmuir 1998, 14, 6767–6771. [Google Scholar] [CrossRef]
- Skotheim, T. A.; Reynolds, J. Conjugated Polymers: Theory, Synthesis, Properties, and Characterization; CRC press, 2006.
- Eisazadeh, H.; Gilmore, K.; Hodgson, A.; Spinks, G.; Wallace, G. Electrochemical Production of Conducting Polymer Colloids. Colloids and Surfaces A: Physicochemical and Engineering Aspects 1995, 103, 281–288. [Google Scholar] [CrossRef]
- Bober, P.; Humpolíček, P.; Syrový, T.; Capáková, Z.; Syrová, L.; Hromádková, J.; Stejskal, J. Biological Properties of Printable Polyaniline and Polyaniline–Silver Colloidal Dispersions Stabilized by Gelatin. Synthetic Metals 2017, 232, 52–59. [Google Scholar] [CrossRef]
- Eisazadeh, H.; Spinks, G.; Wallace, G. Electrochemical Production of Polypyrrole Colloids. Polymer 1994, 35, 3801–3803. [Google Scholar] [CrossRef]
- Kašpárková, V.; Jasenská, D.; Capáková, Z.; Maráková, N.; Stejskal, J.; Bober, P.; Lehocký, M.; Humpolíček, P. Polyaniline Colloids Stabilized with Bioactive Polysaccharides: Non-Cytotoxic Antibacterial Materials. Carbohydrate polymers 2019, 219, 423–430. [Google Scholar] [CrossRef] [PubMed]
- Cruz-Silva, R.; Arizmendi, L.; Del-Angel, M.; Romero-Garcia, J. pH-and Thermosensitive Polyaniline Colloidal Particles Prepared by Enzymatic Polymerization. Langmuir 2007, 23, 8–12. [Google Scholar] [CrossRef] [PubMed]
- Cruz-Silva, R.; Escamilla, A.; Nicho, M.; Padron, G.; Ledezma-Perez, A.; Arias-Marin, E.; Moggio, I.; Romero-Garcia, J. Enzymatic Synthesis of pH-Responsive Polyaniline Colloids by Using Chitosan as Steric Stabilizer. European polymer journal 2007, 43, 3471–3479. [Google Scholar] [CrossRef]
- Chattopadhyay, D.; Mandal, B. M. Methyl Cellulose Stabilized Polyaniline Dispersions. Langmuir 1996, 12, 1585–1588. [Google Scholar] [CrossRef]
- Luong, N. D.; Korhonen, J. T.; Soininen, A. J.; Ruokolainen, J.; Johansson, L.-S.; Seppälä, J. Processable Polyaniline Suspensions through in Situ Polymerization onto Nanocellulose. European Polymer Journal 2013, 49, 335–344. [Google Scholar] [CrossRef]
- Amarnath, C. A.; Venkatesan, N.; Doble, M.; Sawant, S. N. Water Dispersible Ag@ Polyaniline-Pectin as Supercapacitor Electrode for Physiological Environment. Journal of Materials Chemistry B 2014, 2, 5012–5019. [Google Scholar] [CrossRef] [PubMed]
- Djellali, S.; Touati, A.; Maya, K.; Sahraoui, R. Synthesis of Polyaniline/Pectin Composites and Their Use as Biosorbent for Cationic Dye Removal; 2019.
- Aridi, N.; Sapuan, S.; Zainudin, E.; AL-Oqla, F. M. Mechanical and Morphological Properties of Injection-Molded Rice Husk Polypropylene Composites. International Journal of polymer analysis and characterization 2016, 21, 305–313. [Google Scholar] [CrossRef]
- Schirp, A.; Barrio, A. Fire Retardancy of Polypropylene Composites Reinforced with Rice Husks: From Oxygen Index Measurements and Cone Calorimetry to Large-scale Single-burning-item Tests. Journal of Applied Polymer Science 2018, 135, 46654. [Google Scholar] [CrossRef]
- Salasinska, K.; Barczewski, M.; Górny, R.; Kloziński, A. Evaluation of Highly Filled Epoxy Composites Modified with Walnut Shell Waste Filler. Polymer Bulletin 2018, 75, 2511–2528. [Google Scholar] [CrossRef]
- Singh, T.; Gangil, B.; Patnaik, A.; Biswas, D.; Fekete, G. Agriculture Waste Reinforced Corn Starch-Based Biocomposites: Effect of Rice Husk/Walnut Shell on Physicomechanical, Biodegradable and Thermal Properties. Materials Research Express 2019, 6, 045702. [Google Scholar] [CrossRef]
- Jiménez, A.; Fabra, M. J.; Talens, P.; Chiralt, A. Physical Properties and Antioxidant Capacity of Starch–Sodium Caseinate Films Containing Lipids. Journal of Food Engineering 2013, 116, 695–702. [Google Scholar] [CrossRef]
- Yan, Q.; Hou, H.; Guo, P.; Dong, H. Effects of Extrusion and Glycerol Content on Properties of Oxidized and Acetylated Corn Starch-Based Films. Carbohydrate polymers 2012, 87, 707–712. [Google Scholar] [CrossRef] [PubMed]
- Azmi, N. S.; Kadir Bahsa, R.; Othman, S. H.; Mohammed, M. A. P. Characterization of Antioxidant Tapioca Starch/Polyaniline Composites Film Prepared Using Solution Casting Method. Food Res. 2019, 3, 317–324. [Google Scholar] [CrossRef] [PubMed]
- Torres, M. D.; Fradinho, P.; Rodríguez, P.; Falqué, E.; Santos, V.; Domínguez, H. Biorefinery Concept for Discarded Potatoes: Recovery of Starch and Bioactive Compounds. Journal of Food Engineering 2020, 275, 109886. [Google Scholar] [CrossRef]
- Saikia, J. P.; Banerjee, S.; Konwar, B. K.; Kumar, A. Biocompatible Novel Starch/Polyaniline Composites: Characterization, Anti-Cytotoxicity and Antioxidant Activity. Colloids and Surfaces B: Biointerfaces 2010, 81, 158–164. [Google Scholar] [CrossRef] [PubMed]
- Lukasiewicz, M.; Ptaszek, P.; Ptaszek, A.; Bednarz, S. Polyaniline–Starch Blends: Synthesis, Rheological, and Electrical Properties. Starch-Stärke 2014, 66, 583–594. [Google Scholar] [CrossRef]
- Pandi, N.; Sonawane, S. H.; Gumfekar, S. P.; Kola, A. K.; Borse, P. H.; Ambade, S. B.; Guptha, S.; Ashokkumar, M. Electrochemical Performance of Starch-Polyaniline Nanocomposites Synthesized by Sonochemical Process Intensification. Journal of Renewable Materials 2019, 7, 1279. [Google Scholar] [CrossRef]
- Janaki, V.; Vijayaraghavan, K.; Oh, B.-T.; Lee, K.-J.; Muthuchelian, K.; Ramasamy, A.; Kamala-Kannan, S. Starch/Polyaniline Nanocomposite for Enhanced Removal of Reactive Dyes from Synthetic Effluent. Carbohydrate polymers 2012, 90, 1437–1444. [Google Scholar] [CrossRef] [PubMed]
- Gautam, V.; Srivastava, A.; Singh, K. P.; Yadav, V. L. Preparation and Characterization of Polyaniline, Multiwall Carbon Nanotubes, and Starch Bionanocomposite Material for Potential Bioanalytical Applications. Polymer Composites 2017, 38, 496–506. [Google Scholar] [CrossRef]
- Hosseinzadeh, S.; Saadat, Y.; Abdolbaghi, S.; Afshar-Taromi, F.; Hosseinzadeh, A. Shape of the Particles Produced by Seeded Dispersion Polymerization of Styrene. Colloid Journal 2014, 76, 104–112. [Google Scholar] [CrossRef]
- Cho, Y.-S.; Shin, C. H.; Han, S. Dispersion Polymerization of Polystyrene Particles Using Alcohol as Reaction Medium. Nanoscale research letters 2016, 11, 1–9. [Google Scholar] [CrossRef]
- Amalina, A. N.; Suendo, V.; Reza, M.; Milana, P.; Sunarya, R. R.; Adhika, D. R.; Tanuwijaya, V. V. Preparation of Polyaniline Emeraldine Salt for Conducting-Polymer-Activated Counter Electrode in Dye Sensitized Solar Cell (DSSC) Using Rapid-Mixing Polymerization at Various Temperature. Bulletin of Chemical Reaction Engineering & Catalysis 2019, 14, 521–528. [Google Scholar]
- Rai, R.; Roether, J. A.; Boccaccini, A. R. Polyaniline Based Polymers in Tissue Engineering Applications: A Review. Prog. Biomed. Eng. 2022, 4, 042004. [Google Scholar] [CrossRef]
- Nazarzadeh, Z. E.; Najafi, M. P.; Azariyan, E.; Sharifian, I. Conductive and Biodegradable Polyaniline/Starch Blends and Their Composites with Polystyrene. 2011.
- Russo, F.; Tiecco, M.; Galiano, F.; Mancuso, R.; Gabriele, B.; Figoli, A. Launching Deep Eutectic Solvents (DESs) and Natural Deep Eutectic Solvents (NADESs), in Combination with Different Harmless Co-Solvents, for the Preparation of More Sustainable Membranes. Journal of Membrane Science 2022, 649, 120387. [Google Scholar] [CrossRef]
- Boudjelida, S.; Djellali, S.; Ferkous, H.; Benguerba, Y.; Chikouche, I.; Carraro, M. Physicochemical Properties and Atomic-Scale Interactions in Polyaniline (Emeraldine Base)/Starch Bio-Based Composites: Experimental and Computational Investigations. Polymers 2022, 14, 1505. [Google Scholar] [CrossRef] [PubMed]
- Sulimenko, T.; Stejskal, J.; Křivka, I.; Prokeš, J. Conductivity of Colloidal Polyaniline Dispersions. European polymer journal 2001, 37, 219–226. [Google Scholar] [CrossRef]
- Do Nascimento, G. M.; Silva, C. H.; Temperini, M. L. Spectroscopic Characterization of the Structural Changes of Polyaniline Nanofibers after Heating. Polymer Degradation and Stability 2008, 93, 291–297. [Google Scholar] [CrossRef]
- Furukawa, Y.; Ueda, F.; Hyodo, Y.; Harada, I.; Nakajima, T.; Kawagoe, T. Vibrational Spectra and Structure of Polyaniline. Macromolecules 1988, 21, 1297–1305. [Google Scholar] [CrossRef]
- Lee, D.; Char, K. Thermal Degradation Behavior of Polyaniline in Polyaniline/Na+-Montmorillonite Nanocomposites. Polymer Degradation and Stability 2002, 75, 555–560. [Google Scholar] [CrossRef]
- Hou, X.; Zhou, Y.; Liu, Y.; Wang, L.; Wang, J. Coaxial Electrospun Flexible PANI//PU Fibers as Highly Sensitive pH Wearable Sensor. J Mater Sci 2020, 55, 16033–16047. [Google Scholar] [CrossRef]
- Gautam, V.; Srivastava, A.; Singh, K. P.; Yadav, V. L. Vibrational and Gravimetric Analysis of Polyaniline/Polysaccharide Composite Materials. Polymer Science Series A 2016, 58, 206–219. [Google Scholar] [CrossRef]
- Laska, J.; Widlarz, J. Spectroscopic and Structural Characterization of Low Molecular Weight Fractions of Polyaniline. Polymer 2005, 46, 1485–1495. [Google Scholar] [CrossRef]
- Masters, J.; Sun, Y.; MacDiarmid, A.; Epstein, A. Polyaniline: Allowed Oxidation States. Synthetic metals 1991, 41, 715–718. [Google Scholar] [CrossRef]
- Šeděnková, I.; Trchová, M.; Stejskal, J. Thermal Degradation of Polyaniline Films Prepared in Solutions of Strong and Weak Acids and in Water–FTIR and Raman Spectroscopic Studies. Polymer Degradation and Stability 2008, 93, 2147–2157. [Google Scholar] [CrossRef]
- Ćirić-Marjanović, G.; Trchová, M.; Stejskal, J. The Chemical Oxidative Polymerization of Aniline in Water: Raman Spectroscopy. Journal of Raman Spectroscopy: An International Journal for Original Work in all Aspects of Raman Spectroscopy, Including Higher Order Processes, and also Brillouin and Rayleigh Scattering 2008, 39, 1375–1387. [Google Scholar] [CrossRef]
- Izumi, C. M.; Brito, H. F.; Ferreira, A. M. D.; Constantino, V. R.; Temperini, M. L. Spectroscopic Investigation of the Interactions between Emeraldine Base Polyaniline and Eu (III) Ions. Synthetic metals 2009, 159, 377–384. [Google Scholar] [CrossRef]
- do Nascimento, G. M.; Silva, C. H.; Izumi, C. M.; Temperini, M. L. The Role of Cross-Linking Structures to the Formation of One-Dimensional Nano-Organized Polyaniline and Their Raman Fingerprint. Spectrochimica Acta Part A: Molecular and Biomolecular Spectroscopy 2008, 71, 869–875. [Google Scholar] [CrossRef] [PubMed]
- Bober, P.; Trchová, M.; Prokeš, J.; Varga, M.; Stejskal, J. Polyaniline–Silver Composites Prepared by the Oxidation of Aniline with Silver Nitrate in Solutions of Sulfonic Acids. Electrochimica Acta 2011, 56, 3580–3585. [Google Scholar] [CrossRef]
- Mažeikienė, R.; Niaura, G.; Malinauskas, A. A Comparative Raman Spectroelectrochemical Study of Selected Polyaniline Derivatives in a pH-Neutral Solution. Synthetic metals 2010, 160, 1060–1064. [Google Scholar] [CrossRef]
- Hao, Q.; Lei, W.; Xia, X.; Yan, Z.; Yang, X.; Lu, L.; Wang, X. Exchange of Counter Anions in Electropolymerized Polyaniline Films. Electrochimica acta 2010, 55, 632–640. [Google Scholar] [CrossRef]
- Abdullah, H. S. Electrochemical Polymerization and Raman Study of Polypyrrole and Polyaniline Thin Films. Int. J. Phys. Sci 2012, 7, 5468–5476. [Google Scholar]
- Liu, R.; Qiu, H.; Zong, H.; Fang, C. Fabrication and Characterization of Composite Containing HCl-Doped Polyaniline and Fe Nanoparticles. Journal of Nanomaterials 2012, 2012, 1–1. [Google Scholar] [CrossRef]
- Colonna, P.; Buleon, A. MERCIER: In Starch: Properties and Potential, T. GALLIARD Ed. 1987.
- Doumeng, M.; Makhlouf, L.; Berthet, F.; Marsan, O.; Delbé, K.; Denape, J.; Chabert, F. A Comparative Study of the Crystallinity of Polyetheretherketone by Using Density, DSC, XRD, and Raman Spectroscopy Techniques. Polymer Testing 2021, 93, 106878. [Google Scholar] [CrossRef]
- Wei, Y.; Jang, G.-W.; Hsueh, K. F.; Scherr, E. M.; MacDiarmid, A. G.; Epstein, A. J. Thermal Transitions and Mechanical Properties of Films of Chemically Prepared Polyaniline. Polymer 1992, 33, 314–322. [Google Scholar] [CrossRef]
- Ding, L.; Wang, X.; Gregory, R. Thermal Properties of Chemically Synthesized Polyaniline (EB) Powder. Synthetic Metals 1999, 104, 73–78. [Google Scholar] [CrossRef]
- Hejna, A.; Lenża, J.; Formela, K.; Korol, J. Studies on the Combined Impact of Starch Source and Multiple Processing on Selected Properties of Thermoplastic Starch/Ethylene-Vinyl Acetate Blends. Journal of Polymers and the Environment 2019, 27, 1112–1126. [Google Scholar] [CrossRef]
- Song, E.; Choi, J.-W. Conducting Polyaniline Nanowire and Its Applications in Chemiresistive Sensing. Nanomaterials 2013, 3, 498–523. [Google Scholar] [CrossRef]
- Huang, W.-S.; Humphrey, B. D.; MacDiarmid, A. G. Polyaniline, a Novel Conducting Polymer. Morphology and Chemistry of Its Oxidation and Reduction in Aqueous Electrolytes. Journal of the Chemical Society, Faraday Transactions 1: Physical Chemistry in Condensed Phases 1986, 82, 2385–2400. [Google Scholar] [CrossRef]
- Yu, J.; Boudjelida, S.; Galiano, F.; Figoli, A.; Bonchio, M.; Carraro, M. Porous Polymeric Membranes Doped with Halloysite Nanotubes and Oxygenic Polyoxometalates. Advanced Materials Interfaces 2022, 9, 2102152. [Google Scholar] [CrossRef]
- Russo, F.; Galiano, F.; Pedace, F.; Aricò, F.; Figoli, A. Dimethyl Isosorbide As a Green Solvent for Sustainable Ultrafiltration and Microfiltration Membrane Preparation. ACS Sustainable Chem. Eng. 2020, 8, 659–668. [Google Scholar] [CrossRef]
- Wang, H. H.; Jung, J. T.; Kim, J. F.; Kim, S.; Drioli, E.; Lee, Y. M. A Novel Green Solvent Alternative for Polymeric Membrane Preparation via Nonsolvent-Induced Phase Separation (NIPS). Journal of Membrane Science 2019, 574, 44–54. [Google Scholar] [CrossRef]
- Yang, L.; Wu, S.; Chen, J. P. Modification of Activated Carbon by Polyaniline for Enhanced Adsorption of Aqueous Arsenate. Ind. Eng. Chem. Res. 2007, 46, 2133–2140. [Google Scholar] [CrossRef]
Figure 1.
SEM images of (a): Starch, (b) PANI ES and PANI ES/starch biocomposites: (c): (1:1), (d): (2:1) and (e): (3:1).
Figure 1.
SEM images of (a): Starch, (b) PANI ES and PANI ES/starch biocomposites: (c): (1:1), (d): (2:1) and (e): (3:1).
Figure 2.
Histogram of the average diameter of the particles (average values of 3 measurements).
Figure 2.
Histogram of the average diameter of the particles (average values of 3 measurements).
Figure 3.
FTIR-ATR spectroscopy spectra of PANI ES, starch, and the biocomposites PANI ES/starch.
Figure 3.
FTIR-ATR spectroscopy spectra of PANI ES, starch, and the biocomposites PANI ES/starch.
Figure 4.
UV-vis spectra of PANI and PANI/starch biocomposites in DMF. Spectra are stacked on an arbitrary scale for clarity reason.
Figure 4.
UV-vis spectra of PANI and PANI/starch biocomposites in DMF. Spectra are stacked on an arbitrary scale for clarity reason.
Figure 5.
RAMAN spectra of PANI, starch, and PANI/starch biocomposites.
Figure 5.
RAMAN spectra of PANI, starch, and PANI/starch biocomposites.
Figure 6.
XRD diffractograms of starch, PANI ES, and the biocomposites PANI ES/starch.
Figure 6.
XRD diffractograms of starch, PANI ES, and the biocomposites PANI ES/starch.
Figure 7.
TGA and first derivative DTG curves for starch, PANI ES and their blends Z11 (c), Z21 (d), and Z31 (e).
Figure 7.
TGA and first derivative DTG curves for starch, PANI ES and their blends Z11 (c), Z21 (d), and Z31 (e).
Figure 8.
DSC thermograms curves of starch, PANI ES, and of the Z11, Z21, and Z31 biocomposites.
Figure 8.
DSC thermograms curves of starch, PANI ES, and of the Z11, Z21, and Z31 biocomposites.
Figure 10.
FTIR of the PES membranes with and without 1% Z11 dopants. .
Figure 10.
FTIR of the PES membranes with and without 1% Z11 dopants. .
Figure 11.
SEM images (top, bottom and cross-section) of the PES membranes with and without 1% Z11 dopants.
Figure 11.
SEM images (top, bottom and cross-section) of the PES membranes with and without 1% Z11 dopants.
Table 1.
Names of the prepared samples and their aniline: starch wt ratio.
Table 1.
Names of the prepared samples and their aniline: starch wt ratio.
| Aniline: Starch wt ratio |
1:1 |
2:1 |
3:1 |
| Codes |
Z11
|
Z21
|
Z31
|
Table 2.
Components of casting solutions.
Table 2.
Components of casting solutions.
| |
PES(wt.%) |
Z11(wt.%) |
PVP(wt.%) |
PEG(wt.%) |
NMP(wt.%) |
| PES-0 |
12 |
0 |
5 |
35 |
48 |
| PES-1 |
12 |
1 |
5 |
35 |
47 |
Table 3.
Degree of crystallinity of starch, PANI-ES, and their biocomposites.
Table 3.
Degree of crystallinity of starch, PANI-ES, and their biocomposites.
| Material |
Degree of crystallinity (%) |
| Starch |
37.0 |
| Z11
|
35.4 |
| Z21
|
33.6 |
| Z31
|
22.8 |
| PANI ES |
19.6 |
Table 4.
Elaborated thermal characteristics (% weight loss at specific temperatures) data obtained from TGA curves by TA Universal Analysis software of starch, PANI ES, and the biocomposites, respectively Z11, Z21, and Z31.
Table 4.
Elaborated thermal characteristics (% weight loss at specific temperatures) data obtained from TGA curves by TA Universal Analysis software of starch, PANI ES, and the biocomposites, respectively Z11, Z21, and Z31.
| Materials |
T 5% (°C) |
T 10% (°C) |
T 50% (°C) |
T 95% (°C) |
Residual (%) at 700 °C |
| PANI ES |
56.4 |
164.2 |
673.0 |
-- |
50 |
| Starch |
50.2 |
70.2 |
289.6 |
- |
16.5 |
| Z11
|
59.8 |
197.1 |
376.8 |
-- |
23.9 |
| Z21
|
50.3 |
102.2 |
416.7 |
-- |
35.1 |
| Z31
|
50.6 |
91.7 |
574.3 |
-- |
40.7 |
Table 5.
DSC thermograms curves, elaborated by the TA Universal Analysis software of starch, PANI ES, and the biocomposites, respectively Z11, Z21, and Z31.
Table 5.
DSC thermograms curves, elaborated by the TA Universal Analysis software of starch, PANI ES, and the biocomposites, respectively Z11, Z21, and Z31.
| Material |
1st peak |
2nd peak |
| Peak (°C) |
Onset (°C) |
∆H
(j/g) |
Peak (°C) |
Onset (°C) |
∆H
(j/g) |
| Z11
|
95.9 |
42.7 |
234.5 |
207.8 |
186.7 |
103.6 |
| Z21 |
84.4 |
37.8 |
287.3 |
217.6 |
199.9 |
95.2 |
| Z31
|
98.9 |
45.8 |
247.6 |
205.4 |
168.4 |
212.9 |
| PANI ES |
98.1 |
35.3 |
275.1 |
218.4 |
199.6 |
23.3 |
| 293.5 |
281.2 |
1.1 |
| Starch |
100.0 |
50.5 |
439.7 |
266.4 |
261.7 |
9.1 |
| 278.1 |
273.8 |
15.8 |
Table 7.
Characteristics of the prepared PES membranes with and without 1% Z11 dopants.
Table 7.
Characteristics of the prepared PES membranes with and without 1% Z11 dopants.
| Z11 content in membranes |
WCA
(Top Surface) (°) |
Thickness
(µm) |
Porosity
(%) |
Mean flow pore size diameter (MFD) * (µm) |
| 0% |
72 ± 3 |
153 ± 6 |
91 ± 0 |
0.9 |
| 1% |
75 ± 2 |
228 ± 7 |
90 ± 0 |
0.13 |
|
Disclaimer/Publisher’s Note: The statements, opinions and data contained in all publications are solely those of the individual author(s) and contributor(s) and not of MDPI and/or the editor(s). MDPI and/or the editor(s) disclaim responsibility for any injury to people or property resulting from any ideas, methods, instructions or products referred to in the content. |
© 2024 by the authors. Licensee MDPI, Basel, Switzerland. This article is an open access article distributed under the terms and conditions of the Creative Commons Attribution (CC BY) license (http://creativecommons.org/licenses/by/4.0/).


