1. Introduction
The key to optimal training lies in the best possible knowledge of the physical and mental state of the athlete, a principle also applicable to equestrian sports.
Daily fine-tuning of training in professional sport occurs based on the assessment of the state of fatigue. Psychological questionnaires or assessments can evaluate an athlete's mental fatigue, mood disorders, stress levels and general wellbeing. This can include measurements such as the Profile of Mood States (POMS) or specialised questionnaires to assess fatigue and recovery, with the aim being to maximise the training effect while avoiding prolonged recovery deficits [
2,
3]. Numerous fatigue markers are known in human elite sport, which have been used for decades, with the caveat of great individual variability. The correspondingly wide reference ranges make it difficult to accurately assess the athlete's individual state of fatigue [
4,
5].
Evidence of documented training protocols for sport horses is scarce [
6]. Only a few studies have begun to analyse training protocols and workloads [
7]. Mental and physical stress are consistent and early markers for overload and overtraining [
8]. In human sports, generalised stress has been described as sensitive to weekly training adaptations [
1]. Self-report is one method of documenting this. A review by Saw et al. [
9] points out that modern sport has adopted an increasingly scientific approach to sports preparation via athlete monitoring. Self-report measurements of athletes have the potential to provide valuable insights into training response. This is supported by Thorpe et al. [
10] who found that perceived ratings of wellbeing are more sensitive than heart rate monitoring to intra-week variations in training load, experienced by elite football players during in-season training weeks. Optimal performance is achievable when athletes recover appropriately after training and competitions and obtain an optimal balance between a training response and an adequate recovery [
11].
Eventing consists of three disciplines: dressage, show jumping and a cross-country. Beside the schooling of the three different individual disciplines, the training includes balance training, as well as endurance and units of strength training [
12,
13].The assessment of the horses in training is based on the riders’ own experiences. Daily training regime documentation is variable amongst riders. As a result, it is not possible to systematically use physical and mental condition of riders and horses to adapt their training across the board. The correct assessment of the horse's fitness by its rider is fundamentally important in order to present the horse competition ready at an event and complete the cross-country course safely bearing in mind animal welfare [
14]. Overtraining can not only manifest itself in the refusal to complete a task, but also in states of exhaustion that become visible during the ride. Various measurable parameters are used to define overtraining and states of exhaustion in a horse. Some indirect measurements include heart and respiratory rate, blood lactate levels etc. as well as changes in movement patterns [
15,
16,
17,
18]. However, behaviour and behavioural changes are also indicators of fatigue [
19,
20].
The aim of this study was therefore to apply a tool for self-report measurement based on the Short Recovery and Stress Scale (SRSS) [
21] amongst riders and to record their assessment of the mental and physical condition of themselves and their horses. The SRSS is used in varouis sports to assess the daily conditions of athletes within a few minutes [
22,
23]. In this study, associations between different factors, such as access to pasture, participation and success in competitions and the reported well-being of both, horse and rider, were identified. Moreover, the data recorded across the season was analysed to detect signs of fatigue. Finally, we analysed the association between self-assessment (rider) and the assessment of the horse´s condition. It was investigated whether the answers to the questions increased or decreased depending on the workload, actual and perceived, how strong the maximum changes had been and which training units or competitions had a particular influence on the rider's perceived fitness of the horse.
2. Materials and Methods
2.1. Participants and Study Design
The subjects of the present prospective longitudinal study were horse-rider combinations that were monitored as part of the "Performance Diagnostics" programme of the German Olympic Equestrian Committee (DOKR). Prior informed written consent was obtained from all participating riders and owners of the study and agreement to participate was voluntarily and not financially compensated.
15 out of 22 sampled horses could be included in this study and were observed at seven international eventing competitions at CCI2* to CCI4* level held in Germany and Poland in 2022 (March to September). All horses were examined before participation and declared as fit to compete.
2.2. Questionnaire
The content of the questionnaire was based on the Short Recovery and Stress Scale (SRSS) [
21], which is validated in various countries and sports [
22,
23]. The authors modified the questionnaire to be appropriate for equestrian sport. It consisted of a description of the training the horse had undergone, as well as 5 questions assessing general performance, ability to concentrate, general state of mind, general condition of the muscles and the emotional wellbeing of the horse and the rider. To assess the questions, a 0-10 rating score was used, with 0 points representing the worst possible condition and 10 points the best possible condition of the respective topics covered. The questionnaires were completed after each training session. The electronic version was generated using as purpose specific website (
www.limeservey.org, Lime Survey Community Edition, Version 3.28.21+220726) and a link to the questionnaire was available to all participating riders.
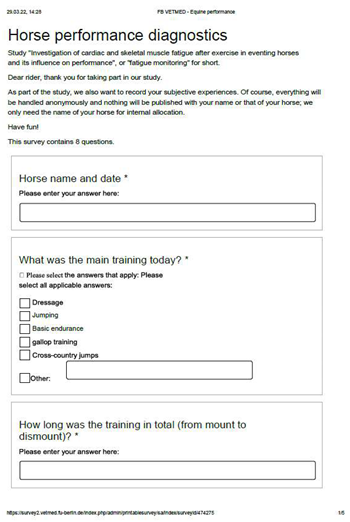
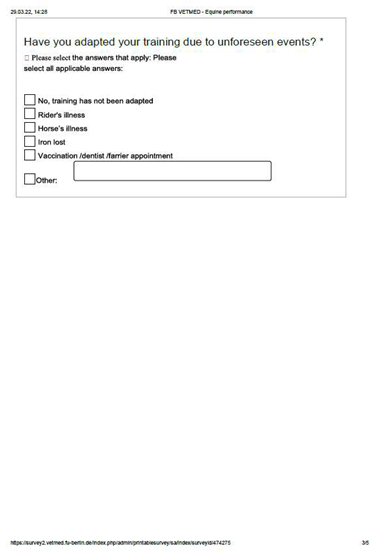
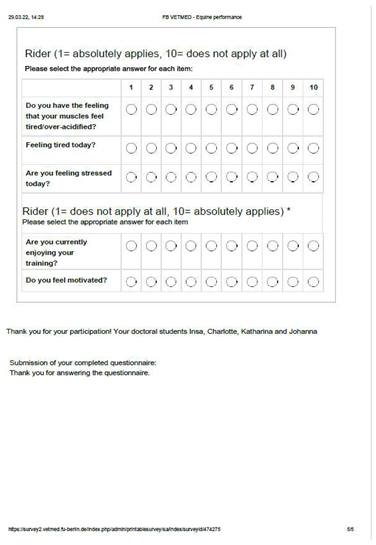
A test version was initially dispersed to the riders in February 2022, in order to eliminate unclear wording or technical problems before the study commenced. The questionnaire included five questions about training organisation, the impression of the horse's fitness and the rider's self-assessment (see appendix). The riders were instructed to answer the questionnaire for an entire week before, while and after every competition, starting with the first competition in March. The riders received the link to the questionnaire website with daily reminders to answer the questionnaire henceforth.
2.3. Data Processing and Analysis
The completed questionnaires were exported from Lime Survey to Excel (Microsoft Excel 2019, Microsoft Corporation, Redmond, Washington), incomplete data sets were removed. Statistical analyses were performed in Excel, Jamovi (The Jamovi Project [2022, version 2.3], available at
https://www.jamovi.org) and SPSS (IBM SPSS Software, SPSS Statistics 29). The distribution of the quantitative data was checked visually using boxplots and histograms as well as a Kolmogorov-Smirnov test to determine normality. Descriptive statistics were performed to test the hypotheses. Cross tables, scatter plots and box plots were created to illustrate correlations between two or more variables. Differences were analysed statistically using the chi-square test (qualitative characteristics), Kruskal-Wallis test (quantitative, non-normally distributed characteristics) or analysis of variance (quantitative, normally distributed characteristics). The ANOVA was tested for homogeneity using a Levene test; in the case of inhomogeneity, a Welch test was performed. To facilitate comparison between the condition of the horses and riders, a score for the rider and the horse (maximum 50 points each) was calculated from the 5 questions on general performance, ability to concentrate, general state of mind, general muscular condition, and emotional well-being (see Figure 2). A score below 6 points from either rider or horse, categorised the ride as "fatigued". The relationship between the horse and rider score was calculated using Spearman rank correlation.
The influence of the individual training types (dressage, show jumping, endurance, canter and cross-country training, as well as “days off”, where horses performed non-ridden exercise or underwent transport) were also assessed. An ANOVA was used to determine the influence of the type of training on the horse score. The influence of pasture/paddock access within the respective training type on the horse score could be calculated using a linear mixed model, in which "access to pasture" and training type were used as fixed effects, "horse" as a random effect and "horse score" as a target variable.
Evolution of the scores across the period studied was verified in relation to the horse score using an ANOVA. The evolution of the rider score across the same period was verified using a Kruskal-Wallis test, as the rider score is not normally distributed. In addition, an ANOVA was used to test the evolution of the horse score before a competition and a Welch test was used to test it after the competition. The placings of the horses were obtained from the FEI database and classified according to the age of the horse, the history of being placed at this level previously and the ranking and expertise of the co-competitors. This resulted in placings of individual competitions being categorized as poor, average and good performance according to the author's considerations. The correlation between the competition success and the horse score was determined using an ANOVA. The illustrations were processed using Affinity Designer (Serif Inc., West Bridgford, Great Britain).
3. Results
A total of 15 horses, eight geldings and seven mares aged 7 to 15 years were observed in 2022 at seven international eventing competitions ranging from CCI2* to CCI4* level held in Germany and Poland. The horses were seven Hanoverians, two Oldenburg show jumpers, two Irish sport horses, one Holsteiner, one Rhinelander, one Polish sport horse and one Selle Francais. The horses were ridden by eight riders (five females, three males, aged between 21 and 39 years), all belonging to the perspective or national eventing squads of Germany. Four of the horses were ridden by one rider, a further four riders rode two horses each and the remaining three riders rode one horse each. The average penalty score in the cross-country phase was 9.0 penalty points, while the rate of incompletion was 6%.
3.1. The Welfare Assessment of Horse and Rider
The horse score was calculated summating the scores of the five questions on the horse's condition (
Table 1). The data was normally distributed and the average score was 38 out of a maximum of 50 points. The question on the condition of the horse's musculature was the lowest with an average of 6.6 out of 10 points. The question about the horse's ability to concentrate was rated highest with an average of 8.1 out of 10 points. All questions were mainly answered positively with points ranging between 5 and10 being awarded and only 9.3% of all questions about the horse were awarded points below 4. Zero points were only given once for the question about the condition of the horse's musculature, while 10 points were only awarded on three occasions, once for the question regarding the horse’s satisfaction and balance, about its ability to concentrate and about its strength and energy respectively.
Analogue to the questions on the condition of the horse, the riders also had to estimate their own condition (
Table 2). The sum of the scores of these questions resulted in the rider score and in contrast this was not normally distributed. The riders rated themselves with a mean value of 38.1 points (also out of a maximum of 50 points). The question about their own fatigue was rated the lowest on average with 6.1 points and the question about their own motivation was rated the highest with an average of 9.3 points. All answers to this question were above 5 points. A total of 13.8% of all questions were answered with less than 5 points, with 32.5% of the questions about the rider's fatigue scoring less than 5 points.
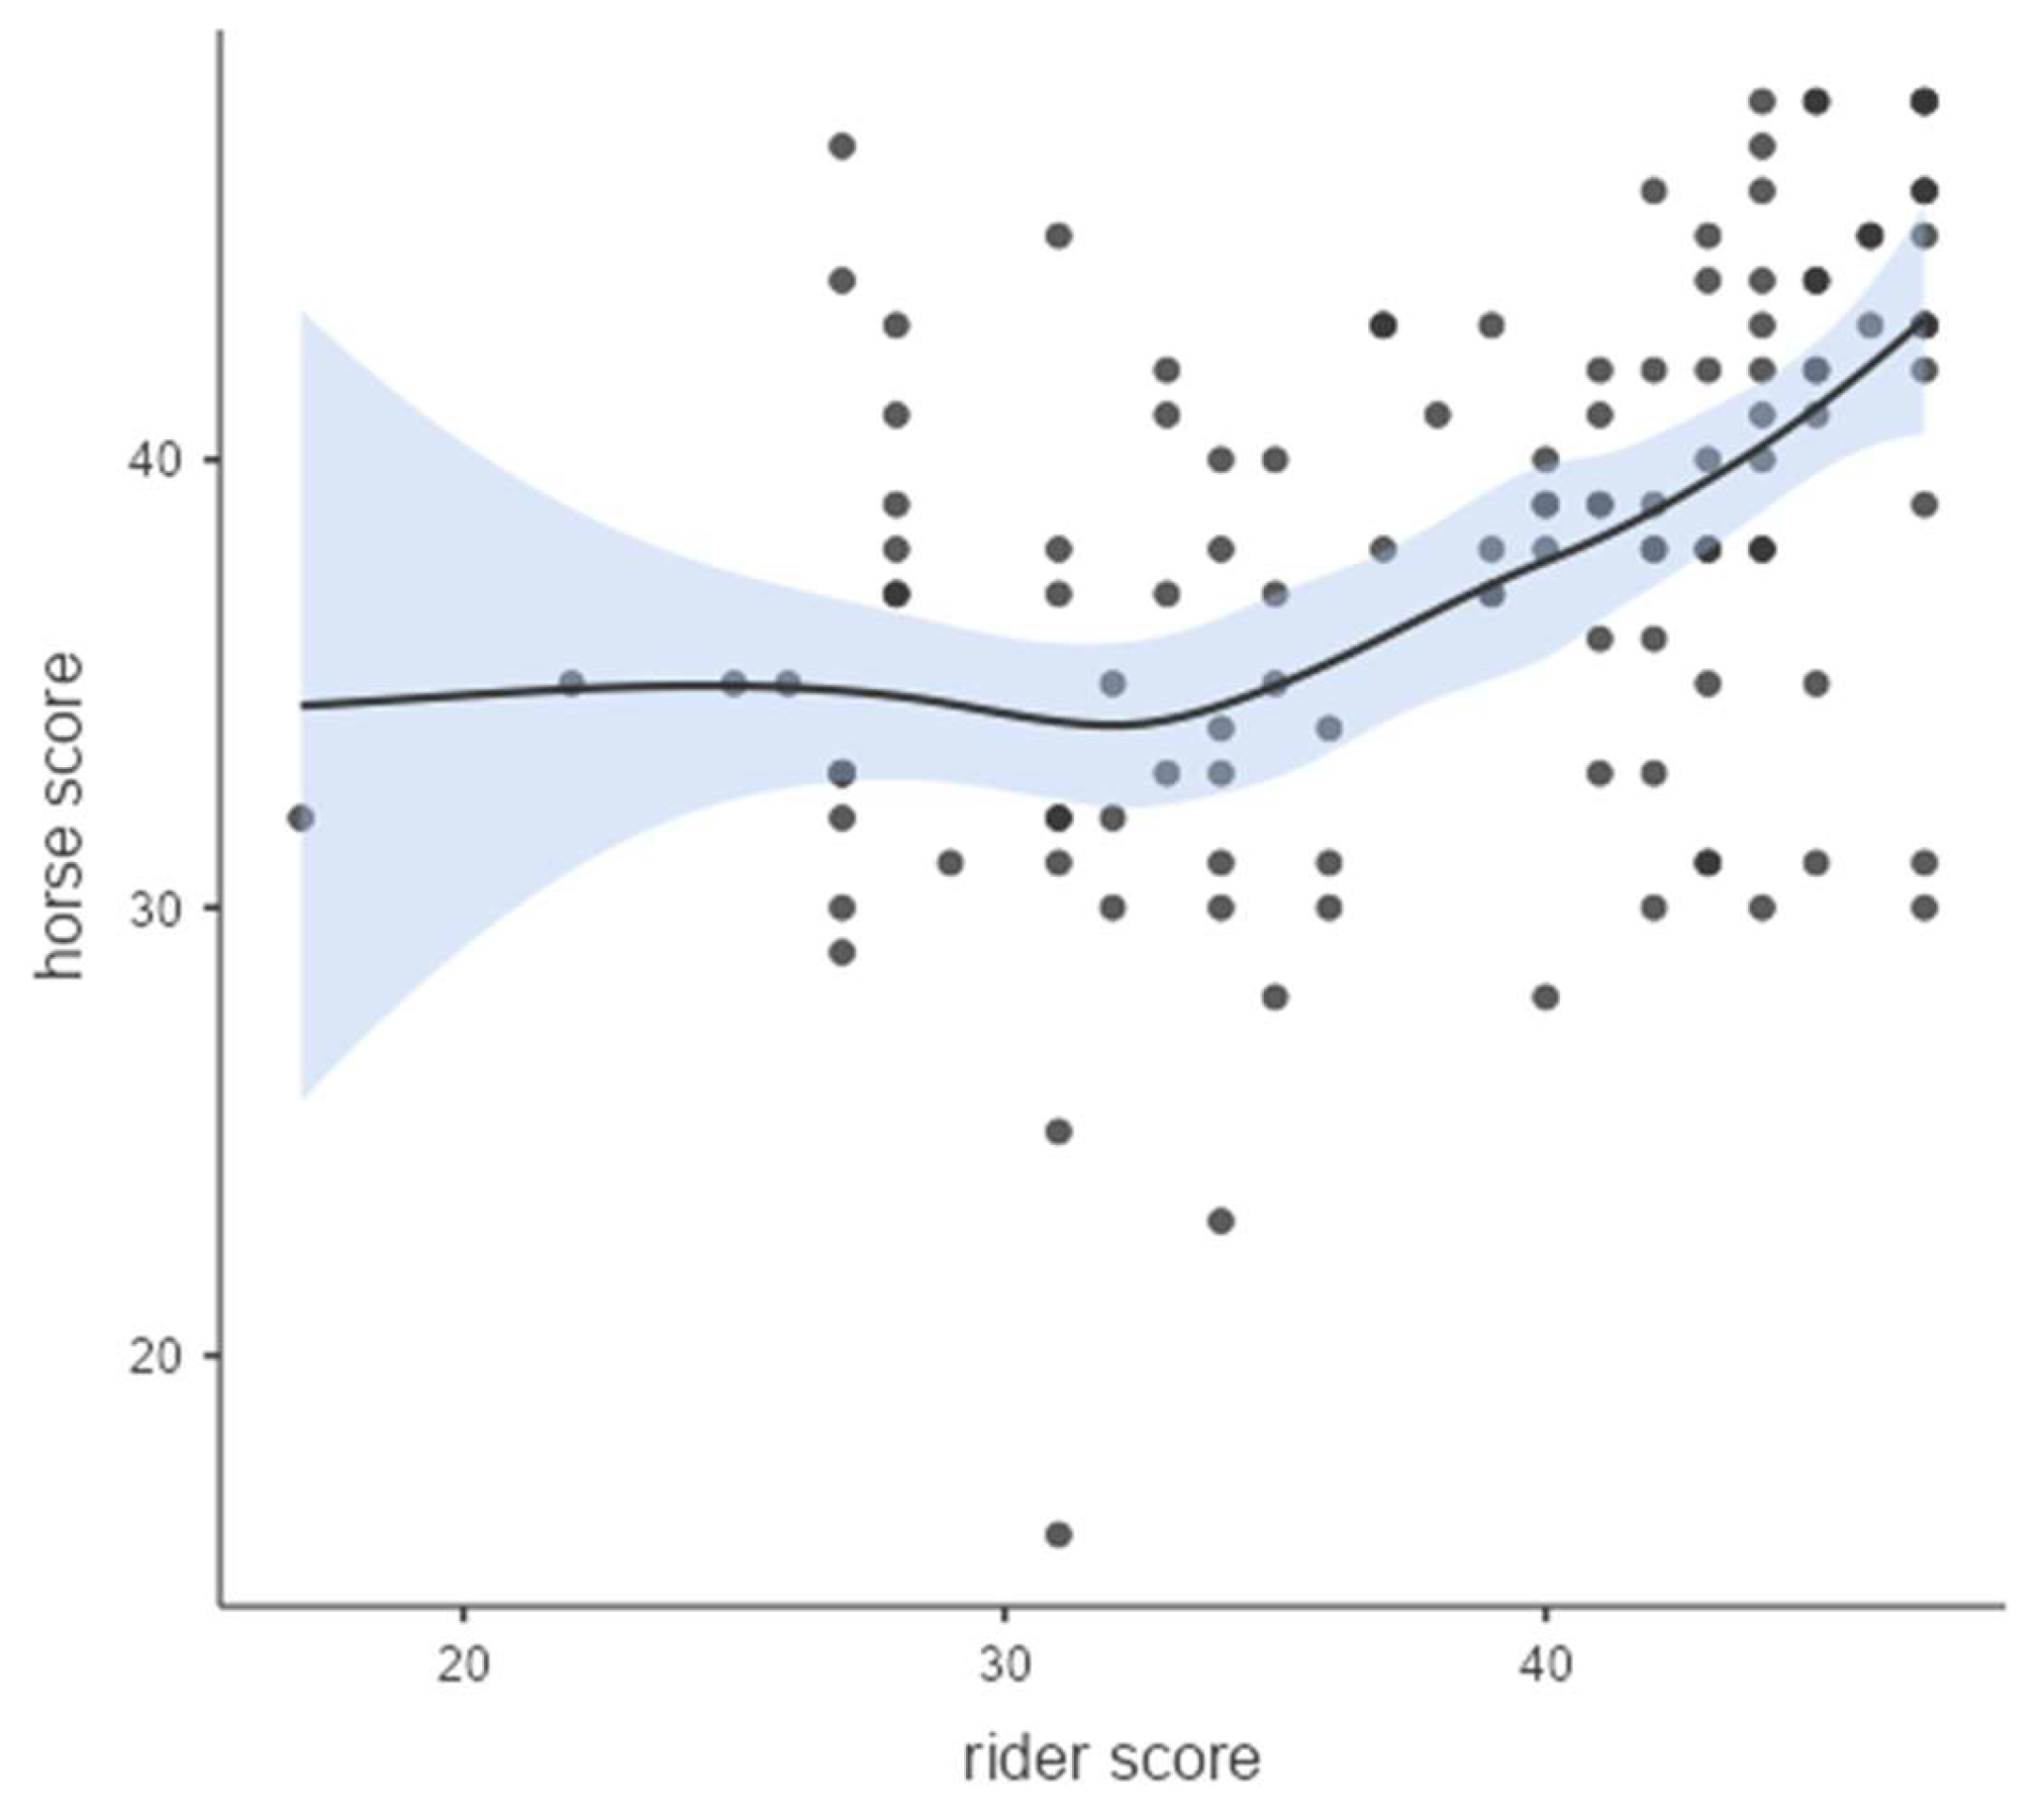
The scatter plot of horse and rider score (
Figure 1) shows that at a rider score above 30 points, a linear relationship starts to develop, showing a positive correlation between welfare scores of horse and rider. Below this point, there is no clear correlation due to the low number of data points. Overall, there was a medium correlation between the two scores.
3.2. Effect of the Type of Training and the Horse's Welfare (Horse Score)
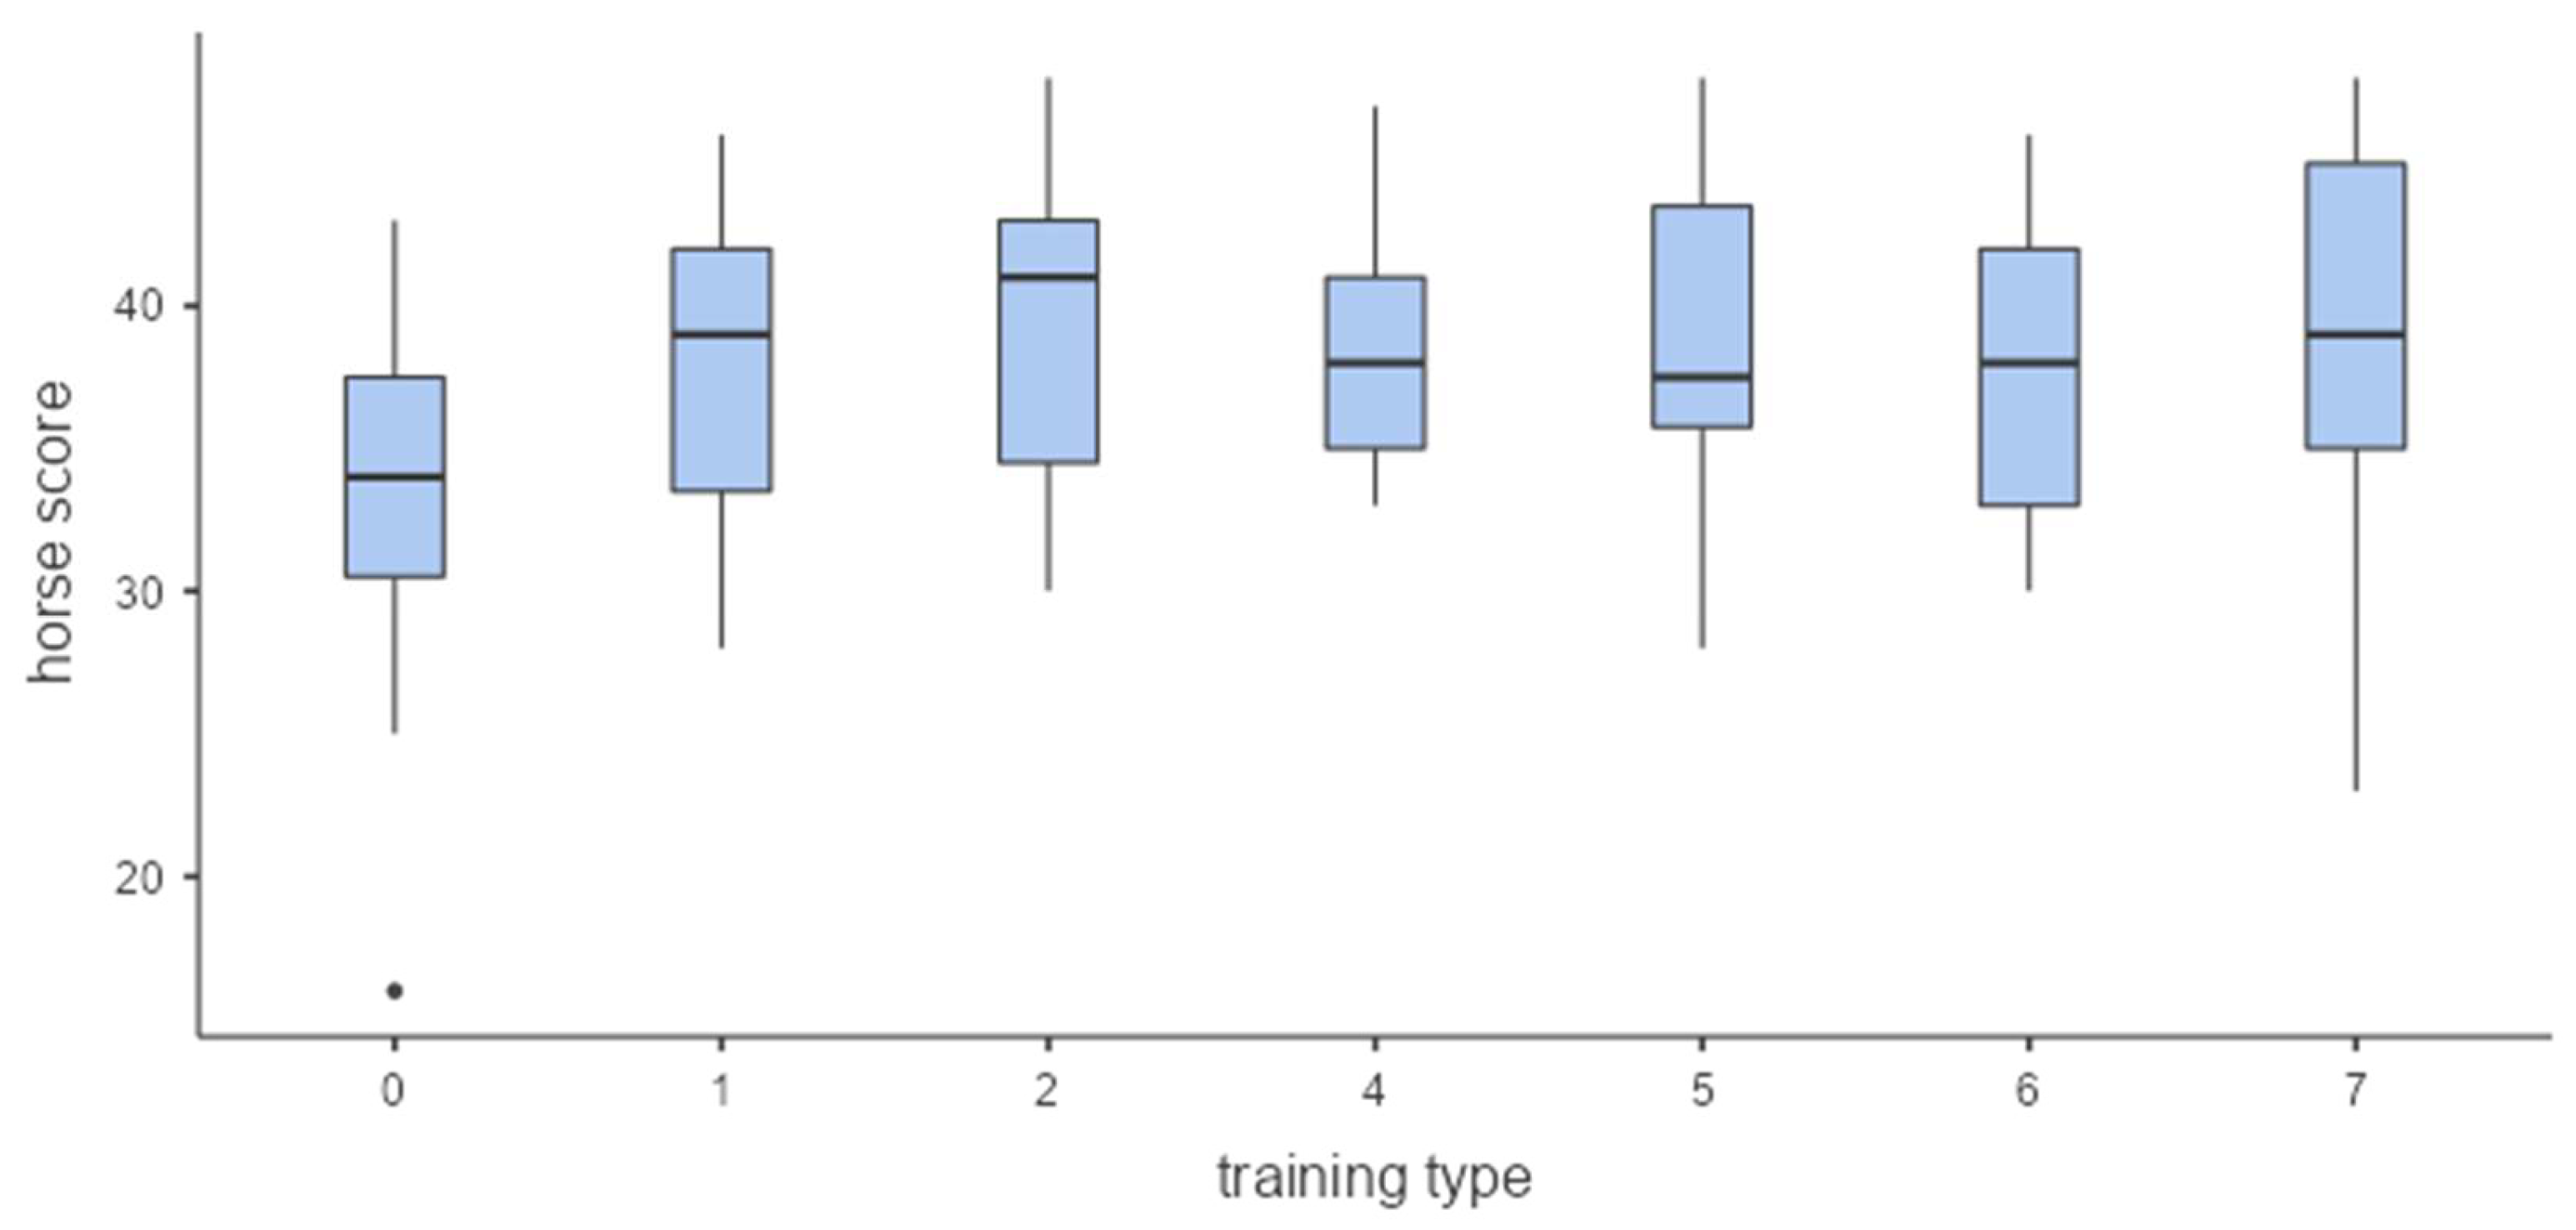
Figure 2 shows the horse score correlating to the type of training. There were no significant differences (ANOVA, p=0.1).
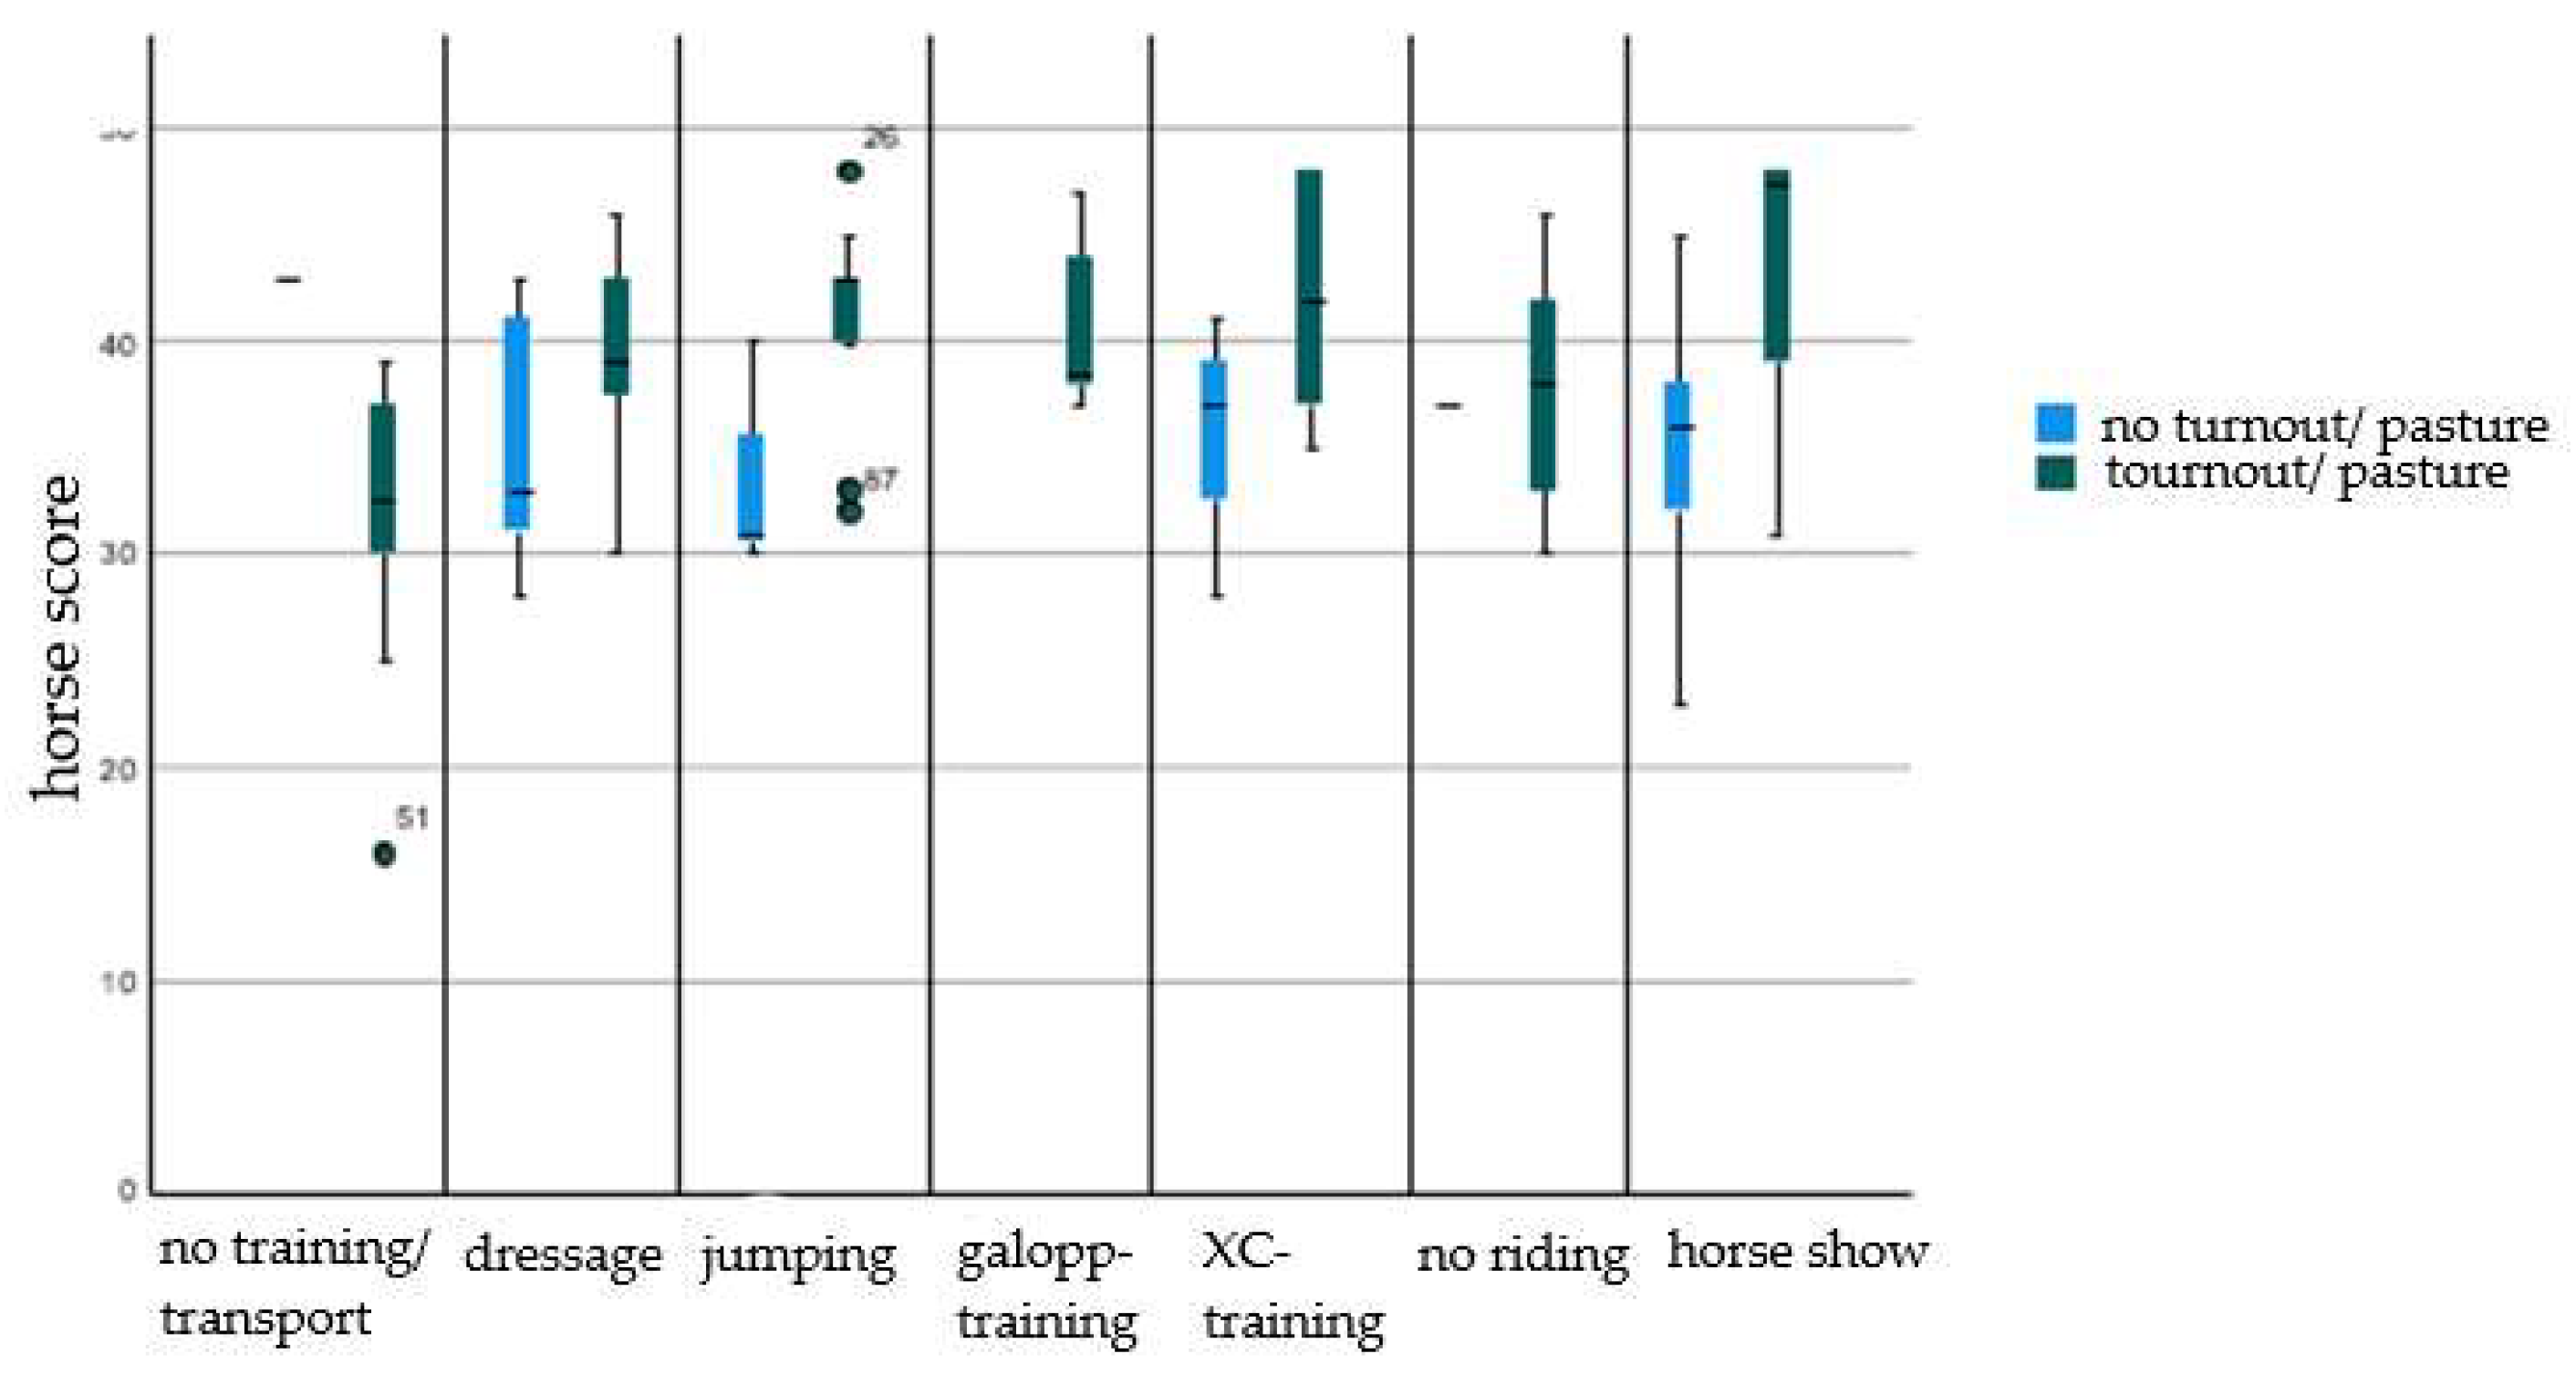
Figure 3 shows the score of all horses grouped by type of training and compared to access to pasture/ turnout (green) or no access to pasture/turnout (blue). It was observed that the horses' scores were 3.8 points lower on average if the horse had no access to pasture/turnout (Linear mixed model, confidence interval: -6.4 - -1.2, standard error = 1.3, p = 0.03). Access to pasture/turnout resulted in a significant increase in the rider's assessment of the horse's wellbeing (Linear mixed model, p=0.04, n=120).
3.3. Evolution of the Horse and Rider Scores Over the Eventing Season
It was observed that the riders rated their horses similarly across the eventing season (
Figure 4a, average 37-41 points), as no significant differences were found (ANOVA, p=0.15, n=120). In contrast, the rider’s average self-assessment (
Figure 4b) was significantly higher between April (40 points) and July (43 points) when compared to the beginning of the season (March, 35 points) and the end of the season (August, 37 points and September, 36 points) (Kruskal Wallis test, p <0,001, n=120).
3.4. Evolution of Horse Scores Immediately Prior and Post the Cross-Country Phase
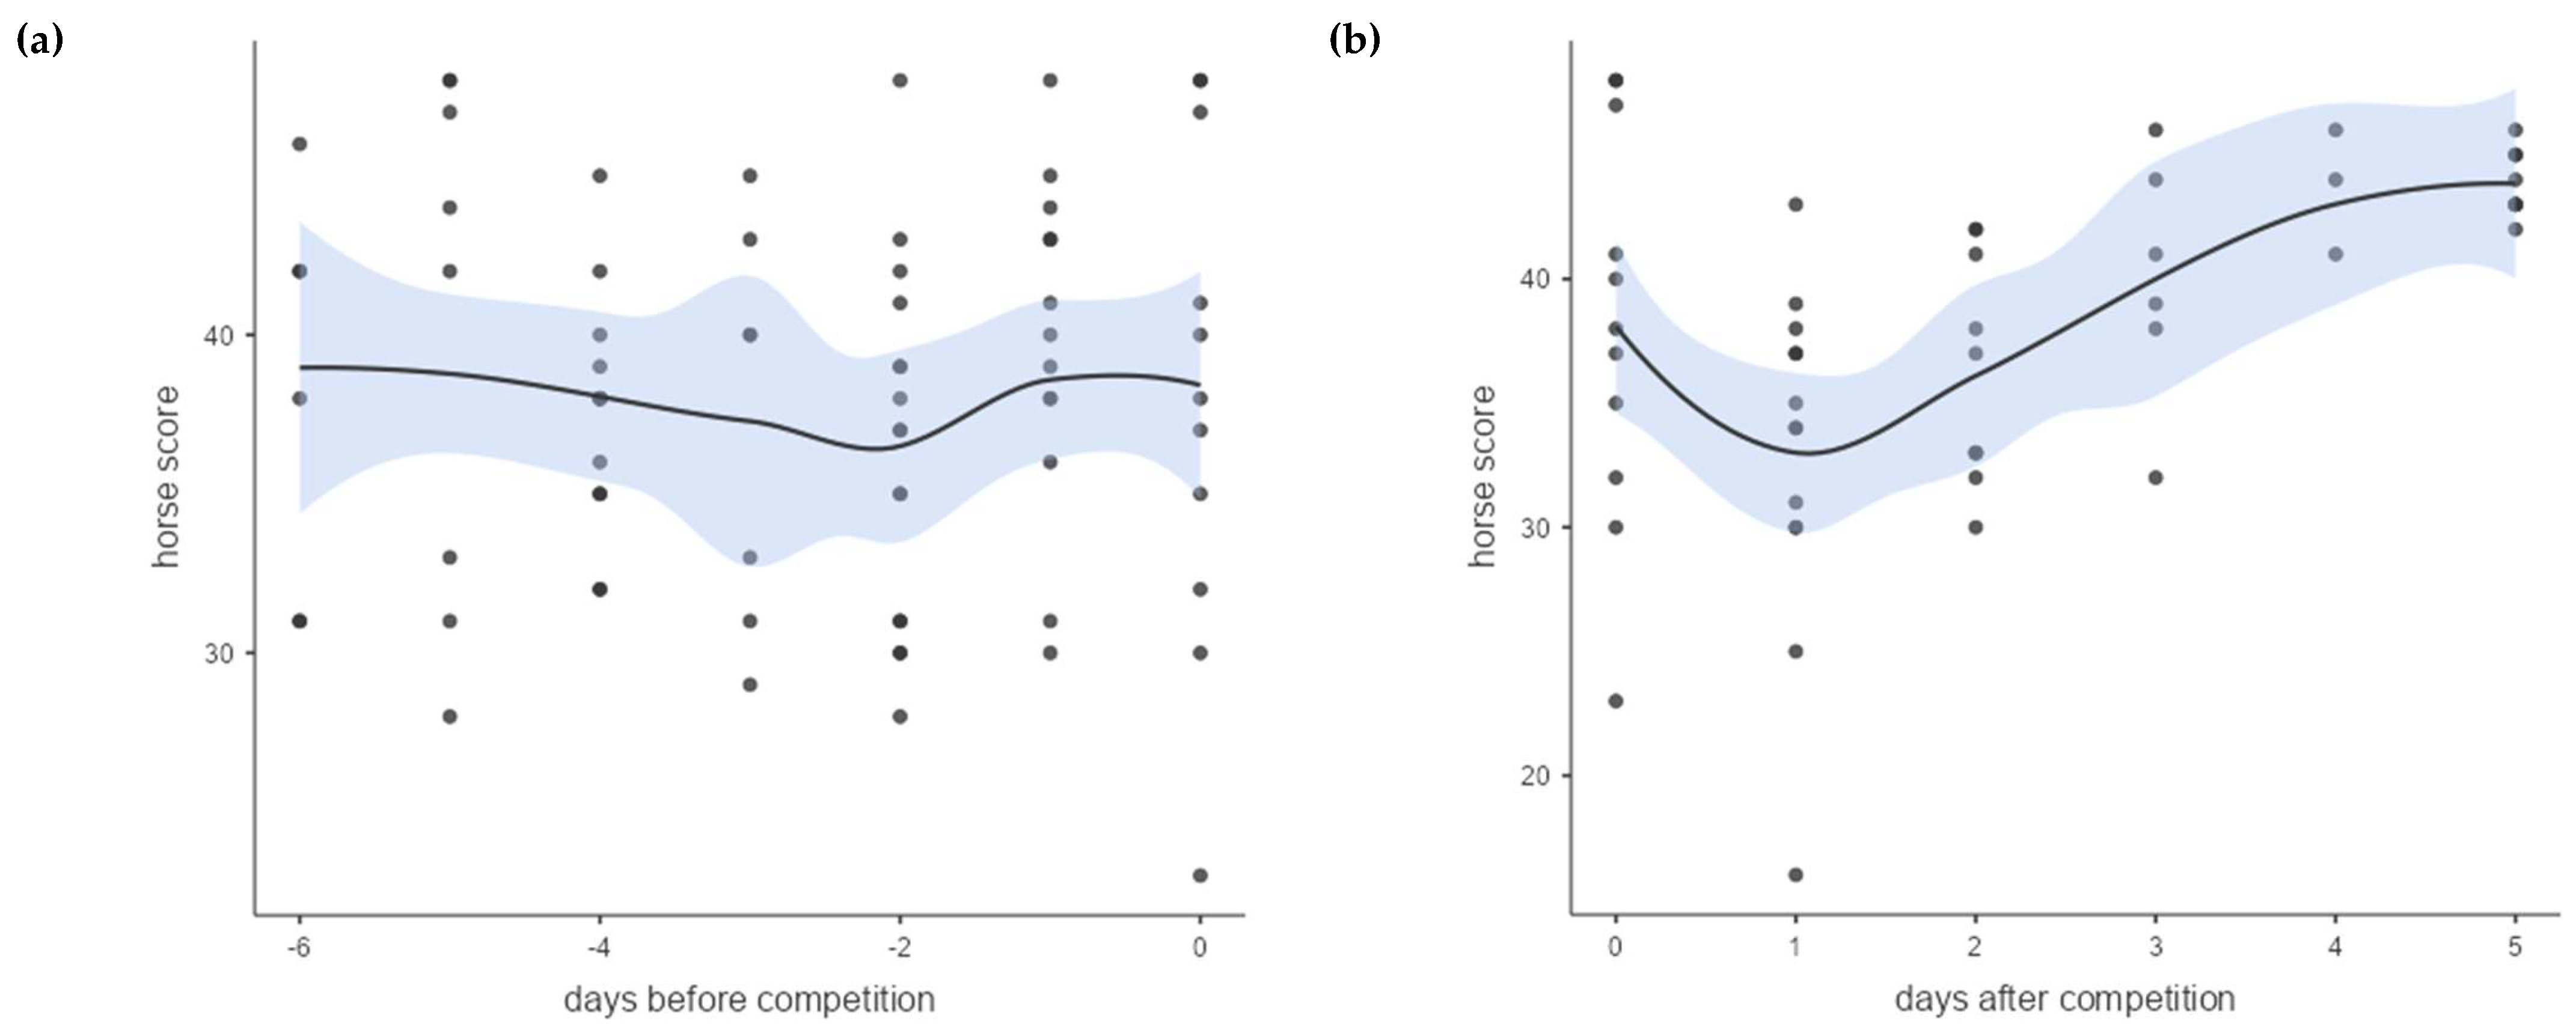
The horse score was analysed for variations in the week before and after a competition (
Figure 5a and b). The horse with the lowest average score (33 points) was assessed on the day after the competition. From the third day after the competition onwards, the horses were judged to be "fit above average” (40-44 points on day 5).
3.5. Correlation between the Horse's Welfare (Horse Score), Competition Success and Its Influencing Factors
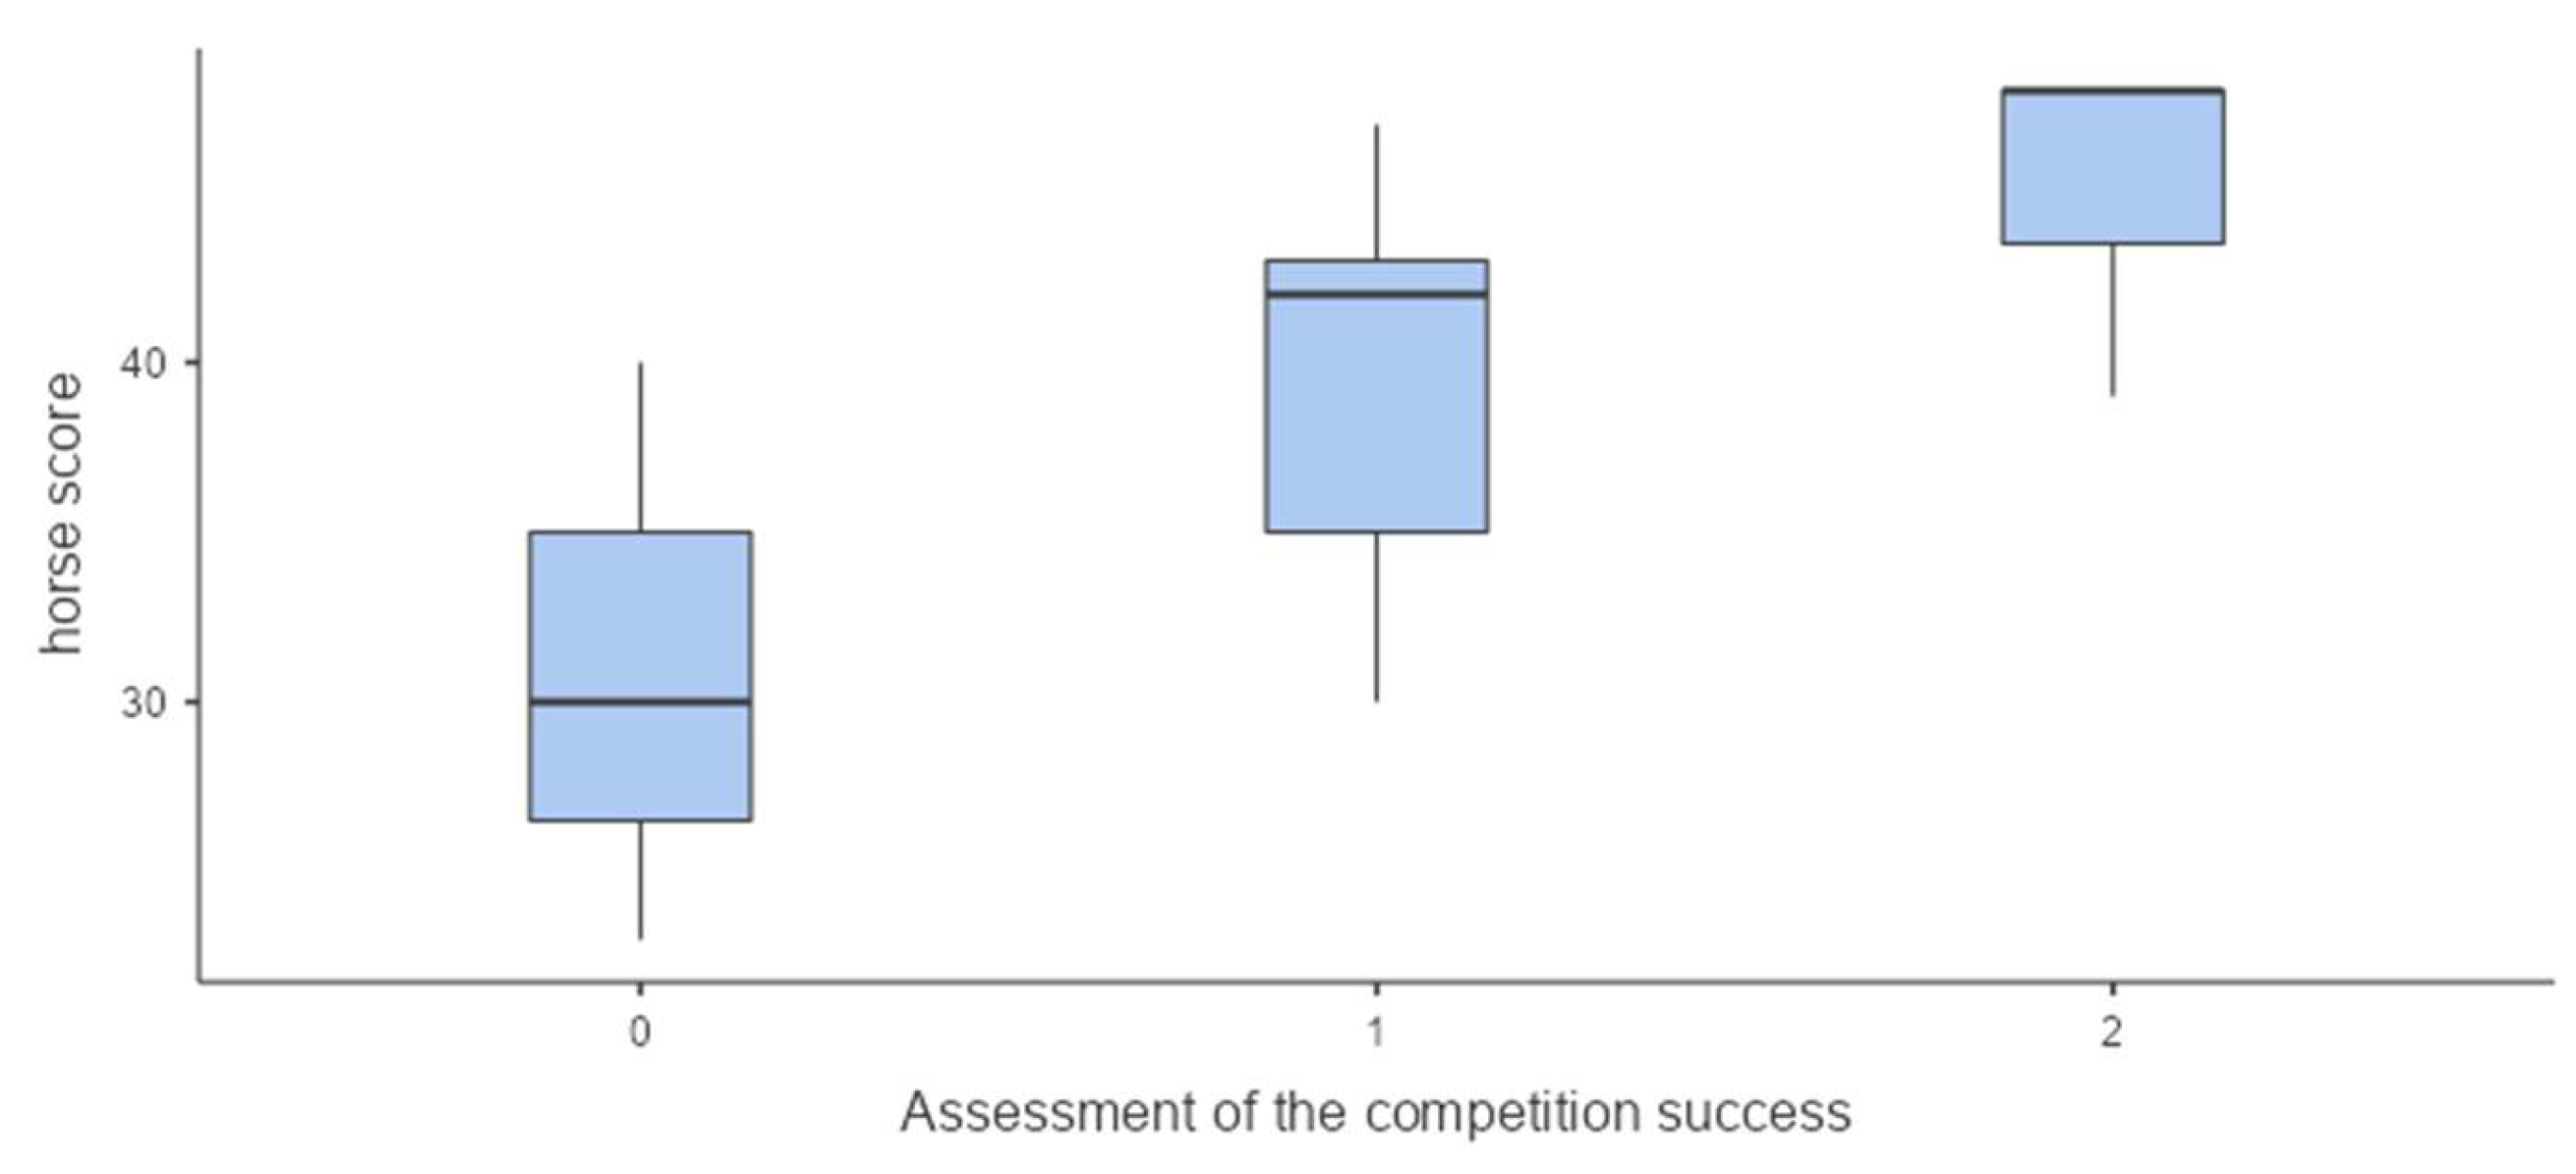
The assessment of the competition success was classified as poor, average and good (
Figure 6). The boxplots show that the quality of the placement increases with the horse's score on the day of the competition. The horse score correlates significantly with the assessment of its success (ANOVA, p = 0.05, n = 15).
4. Discussion
A form of self-report measurement, a questionnaire based on the Short Recovery and Stress Scale, was adapted successfully to be used by riders competing in the sport of eventing to assess the well-being of their horses. While the horses´ score did not fluctuate significantly, the riders assessed their own well-being better in the middle compared to worse at the beginning and towards the end of the competition season. However, data collection proved to be difficult, particularly regarding the regularity of responses to the questionnaires. It was not possible to obtain 14 questionnaires from a single rider on the 7 consecutive days before including and after a competition. Care was taken to ensure that the questionnaire was easy to use with a response time recorded being generally less than 3 minutes. Nevertheless, the riders did not answer the questionnaires every day without several active reminders.
The horse and rider scores showed an increasing linear correlation, this is especially true for higher scores of perceived wellbeing. We suggest this is due to a rider who is capable of maximising their own performance is also more able to train their horse optimally, thereby improving the horse's perceived wellbeing. This hypothesis is supported by the work of Pursley, who investigated the influence of the rider's mood on their horse [
24]. In the lower range of scores, the horse score was observed to be independent of the rider score. A rider who therefore perceives themselves as less fit, is still capable to perceive their horse as fit. In this instance, the results contradicted those of Pursley, this study however was limited to the fact that only athletes who compete professionally in eventing took part. Fundamentally a better basic fitness was therefore to be expected and this was consistent with the fact that a value below 5 (median option) was given in only 9.3% of all questions answered. We suspect that with amateur riders, the assessment of the horse's fitness could be lower, resulting in an increased correlation between the rider and horse score.
It is a limiting factor to the questionnaire that the rider has to answer the questions about their horse, the athlete, horse in this instance, cannot answer the questions on its own. An additional limiting factor is, particularly on “days off” or transport days, that the rider has reduced contact with their horse affecting that day’s score. Other influencing factors studied, include the condition of the horse on the previous day and access to pasture or paddocks. It was expected that turnout (self-determined movement) would have a positive effect on the horse’s behaviour and fitness, as has already been observed by other publications [
25]. The types of training, on the other hand, showed no influence on the horse score. A reason for this could be the fact, that horses and riders favour different disciplines to each other, and the assessment was therefore evenly distributed across all types of training. Regardless of the type of training, the horse was rated more positively overall if it was given access to pasture or paddocks on the same days. Access to turnout fulfil the horse's natural need to move freely and thus provides both, active and passive rest as decided by the horse. It also aids in maintaining the horse's basic fitness compared to pure stabling and reduces stress for the horse, which has a positive effect on recovery times [
25].
The significant improvement in the overall impression of the horse's fitness compared to the day before the competition and from the second day after the competition has also been confirmed in other sports [
10,
26]. The overall low score on the day after the competition is likely caused by acute fatigue, this is also observed in many other sports [
27,
28]. Intensive sports sessions deplete a horse's physiological carbohydrate stores. Highly influenced by a given feeding regime, it takes horses usually 48-72 hours to fully recover their carbohydrate stores after an intensive training session [
29]. Similarly, our data shows an average of 50 hours to regain an average score of 38 points after a competition. The increase in the score beyond this average can be explained by the theory of supercompensation. According to this theory, the body adapts its ability to perform to a higher demand after a particularly tiring activity and a subsequent recovery phase. This allows the athlete to be better prepared for future tasks [
2,
8,
30]. A limiting factor to the overall low horse score on the day after a competition is again the fact that the riders had a limited contact to their horses due to the fact that it was a day off or a day of transport.
The assessment of a horse's competition success within a season cannot be solely determined by the placing of any individual competition. Therefore, the authors also used the age and experience of the horse as well as the difficulty of the competition to classify the quality of a placement. For instance, placements of younger horses were ranked higher by the authors than placings of more experienced horses on the same level of difficulty. The horses' successes showed a significant positive correlation with perceived horse wellbeing (higher horse scores). It was also observed that the riders' assessment of their horses' fitness corresponded with their successes. However, the riders' perception of their horses’ wellbeing could have been influenced by their knowledge of their own placing of the competition in question. Nevertheless, the correlation of the horses’ success with their perceived horse scores demonstrates the validity of the questionnaire. In future it will be advisable to compare the results of this questionnaire with physiological parameters of fatigued horses.
5. Conclusions
The importance of the methodology to determine training sessions depends largely on the rider's compliance and is therefore not applicable for every rider. To assess a horse's welfare, a complete survey of the individual reference values over a longer period is required. Deviations from the individual average self-report measurement can indicate a lack of recovery or a developing pathology. Analysis of the daily training regime and the resulting signs of fatigue can help to create an optimised training plan in preparation for major sporting events. If conspicuously low values of wellbeing are observed for a certain type of training, which can aid in the uncovering of the horses’ or riders’ weakness, the training can be adapted accordingly. The correlation between competition success and horse score shows that riders assess their horses well and are therefore able to prepare their horses appropriately for the competition. However, it must be observed that only riders who belong to the German squad in their respective age groups were taken into consideration for this study. In all cases, the riders surveyed in this study, are trainers or otherwise professionally active in the equestrian sports industry. A correct assessment of the wellbeing of their horses is crucial for their professional success. A good rider’s feeling about the wellbeing of their horse is a good indication of a good placing at a show.
This study provides a basis for exploring the characteristics of a horse's exhaustion. Since fatigue is a multifactorial event, it can therefore not be determined on the assessment of a single measured parameter. However, self-report questionnaires can close part of the gap without requiring additional equipment and can be transposed down the ranks to even reach amateur sports.
Author Contributions
Conceptualization, K.C.J., A.L. and H.G.; methodology, A.L., K.C.J. and H.G.; software, K.C.J..; validation, K.C.J., A.L. and H.G.; formal analysis, K.C.J. and I.R.-D., investigation, I.R.-D..; resources, K.C.J., A.L. and H.G.; data curation, K.C.J. and I.R.-D.; writing—original draft preparation, I.R.-D.; writing—review and editing, K.C.J., A.L. and H.G.; visualization, K.C.J. and I.R.-D.; supervision, H.G.; project administration, H.G.; funding acquisition, H.G. All authors have read and agreed to the published version of the manuscript.
Funding
The publication of this article was funded by Freie Universität Berlin. This research was funded by Bundesinstitut für Sportwissenschaften (BISp), ZMVI4-070101_16-17.
Institutional Review Board Statement
The study was registered with the regulatory state office of Berlin (1-02.04.40.2022.VG006) but was not classified as an animal experiment.
Informed Consent Statement
Riders and owners received written information about the studied conditions and agreed in writing to the voluntary and unremunerated participation of their horses.
Data Availability Statement
The data presented in this study are available on request from the corresponding author. The data are not publicly available due to privacy.
Acknowledgments
The author would like to thank the DOKR and its lovely colleagues for their support.
Conflicts of Interest
The authors declare no conflict of interest.
References
- Gastin, P.M.D.; Robinson, D. Perceptions of Wellness to Monitor Adaptive Responses to Training and Competition in Elite Australian Football. Journal of Strength and Conditioning Research 2013. [CrossRef] [PubMed]
- Bourdon, P.C.; et al. Monitoring Athlete Training Loads: Consensus Statement. Int J Sports Physiol Perform 2017, 12 (Suppl 2), S2161–S2170. [Google Scholar] [CrossRef] [PubMed]
- Russell, S.; et al. The application of mental fatigue research to elite team sport performance: New perspectives. J Sci Med Sport 2019, 22, 723–728. [Google Scholar] [CrossRef] [PubMed]
- Hecksteden, A.; Meyer, T. Personalized Sports Medicine – Principles and tailored implementations in preventive and competitive sports. Deutsche Zeitschrift für Sportmedizin 2018, 2018, 73–80. [Google Scholar] [CrossRef]
- MacIntosh, B.R.; Rassier, D.E. What is fatigue? Can J Appl Physiol 2002, 27, 42–55. [Google Scholar] [CrossRef] [PubMed]
- Castejon-Riber, C.; et al. Objectives, Principles, and Methods of Strength Training for Horses. Journal of Equine Veterinary Science 2017, 56, 93–103. [Google Scholar] [CrossRef]
- Munsters, C.; et al. A prospective cohort study on the acute: chronic workload ratio in relation to injuries in high level eventing horses: A comprehensive 3-year study. Prev Vet Med 2020, 179, 105010. [Google Scholar] [CrossRef] [PubMed]
- Meeusen, R.; et al. Prevention, diagnosis, and treatment of the overtraining syndrome: joint consensus statement of the European College of Sport Science and the American College of Sports Medicine. Med Sci Sports Exerc 2013, 45, 186–205. [Google Scholar] [CrossRef] [PubMed]
- Saw, A.E.; Main, L.C.; Gastin, P.B. Monitoring the athlete training response: subjective self-reported measures trump commonly used objective measures: a systematic review. Br J Sports Med 2016, 50, 281–91. [Google Scholar] [CrossRef] [PubMed]
- Thorpe, R.T.; et al. Tracking Morning Fatigue Status Across In-Season Training Weeks in Elite Soccer Players. Int J Sports Physiol Perform 2016, 11, 947–952. [Google Scholar] [CrossRef] [PubMed]
- Kellmann, M. Preventing overtraining in athletes in high-intensity sports and stress/recovery monitoring. Scand J Med Sci Sports 2010, 20 (Suppl 2), 95–102. [Google Scholar] [CrossRef] [PubMed]
- Dutton, P. Modern Eventing with Phillip Dutton: The Complete Resource: Training, Conditioning, and Competing in All Three Phases. 2013, Trafalgar Square Books. p. 334.
- (FN), D.R.V.e.V., Weiterführende Ausbildung für Pferd und Reiter - Richtlinien für Reiten und Fahren, Band 2. 14 ed. 2020, Warendorf, Germany: Deutsche Reiterliche Vereinigung e.V. (FN).
- Justiz, B.d. , Tierschutzgesetz §3.
- Bitschnau, C.; et al. Performance parameters and post exercise heart rate recovery in Warmblood sports horses of different performance levels. Equine Vet J Suppl 2010, 17–22. [Google Scholar] [CrossRef]
- Bond, S.; et al. Assessment of high-intensity over-ground conditioning and simulated racing on aerobic and anaerobic capacities in racehorses. Comparative Exercise Physiology 2019, 15, 199–207. [Google Scholar] [CrossRef]
- Fisher, A.L.; et al. Lactate-guided conditioning program using variable exercise intensities improves fitness and alters muscle enzyme activity but not inflammatory response in horses. Comparative Exercise Physiology 2016, 12, 183–192. [Google Scholar] [CrossRef]
- Soroko, M.; et al. Exercise-induced changes in skin temperature and blood parameters in horses. Arch Anim Breed 2019, 62, 205–213. [Google Scholar] [CrossRef] [PubMed]
- Malinowski, K. Stress Management for equine Athletes. Rutgers Cooperative Research & Extension, 1993: FS716.
- Fenner, K.; et al. The Development of a Novel Questionnaire Approach to the Investigation of Horse Training, Management, and Behaviour. Animals (Basel) 2020, 10. [Google Scholar] [CrossRef]
- Kellmann, M.; Kölling, S.; Hitzschke, B. Das Akutmaß und die Kurzskala zur Erfassung von Erholung und Beanspruchung im Sport - Manual. Hellenthal: Sportverlag Strauß, 2016.
- Kölling, S.; Hitzschke, B.; Holst, T.; Ferrauti, A.; Meyer, T.; Pfeiffer, M.; Kellmann, M. Validity of the Acute Recovery and Stress Scale – training Monitoring of the German Junior National Field Hockey Team. Int J Sports Sci Coach 2015, 10, 529–542. [Google Scholar] [CrossRef]
- Kölling, S.; Schaffran, P.; Bibbey, A.; Drew, M.; Raysmith, B.; Nässi, A.; Kellmann, M. Validation of the Acute Recovery and Stress Scale (ARSS) and the Short Recovery and Stress Scale (SRSS) in three English-speaking regions. J Sports Sci. 2020, 38, 130–139. [Google Scholar] [CrossRef] [PubMed]
- Pursley, C. An exploratory study of mood states and transient emotion in amateur dressage riders. 2018.
- Graham-Thiers, P.M.; Bowen, L.K. Improved Ability to Maintain Fitness in Horses During Large Pasture Turnout. Journal of Equine Veterinary Science 2013, 33, 581–585. [Google Scholar] [CrossRef]
- Gomez, A.L.; et al. The Effects of a 10-Kilometer Run on Muscle Strength and Power. The Journal of Strength and Conditioning Research 2002, 16. [Google Scholar]
- Ament, W.; Verkerke, G.J. Exercise and Fatigue. Sports Med 2009, 389–422. [Google Scholar] [CrossRef] [PubMed]
- Johnston, R.D.; Gabbett, T.J.; Jenkins, D.G. Influence of an intensified competition on fatigue and match performance in junior rugby league players. J Sci Med Sport 2013, 16, 460–5. [Google Scholar] [CrossRef]
- Jose-Cunilleras, E.; Hinchcliff, K.W. Carbohydrate metabolism in exercising horses. Equine and Comparative Exercise Physiology 2007, 1, 23–32. [Google Scholar] [CrossRef]
- Rivero, J.L.; et al. Unexplained underperformance syndrome in sport horses: classification, potential causes and recognition. Equine Vet J 2008, 40, 611–8. [Google Scholar] [CrossRef] [PubMed]
Figure 1.
Correlation of the rider and horse score showing the relationship between horse and rider welfare (standard error in blue). There is a significant correlation across all scores (Spearman Correlation 0.5, p= 0.01, n=120). At a higher welfare score (above 30 points) it becomes obviously linear showing that, as the rider perceives themselves as fitter, the horse also appears to be fitter.
Figure 2.
Horse score correlating to the type of training, ANOVA, p=0.1, 0= day off/ transport only (n=10), 1= dressage (n=34), 2= jumping (n=14), 4= gallop training (n=7), 5= cross-country training (n=8), 6= exercise other than riding (lunge etc., n= 29), 7= competition (n=17).
Figure 2.
Horse score correlating to the type of training, ANOVA, p=0.1, 0= day off/ transport only (n=10), 1= dressage (n=34), 2= jumping (n=14), 4= gallop training (n=7), 5= cross-country training (n=8), 6= exercise other than riding (lunge etc., n= 29), 7= competition (n=17).
Figure 3.
Comparison of pasture/paddock and no pasture/paddock on the horse score split by type of training shows the significant impact that turnout had on the perceived welfare of the horse represented by a higher score (Linear mixed model, p = 0.04, n day off/ transport = 10, n dressage = 34, n jumping = 14, n gallop training = 7, n cross-country training = 8, n lunge or similar = 29, n competition = 17).
Figure 4.
(a) Over the course of the year no significant differences were observed in the horses’ scores (ANOVA, F = 1.7, p = 0.15, n=120). (b) Significantly higher rider scores were observed in April, May and July compared with earlier and later on in the season (Kruskal Wallis p = <0.001, n=120).
Figure 4.
(a) Over the course of the year no significant differences were observed in the horses’ scores (ANOVA, F = 1.7, p = 0.15, n=120). (b) Significantly higher rider scores were observed in April, May and July compared with earlier and later on in the season (Kruskal Wallis p = <0.001, n=120).
Figure 5.
(a) Development of the horse score within the days before the competition (the blue area describes the standard error, ANOVA before the competition, F = 0.5, p = 0.8, n=56) (b) Development of the horse score after the competition (Welch test after the competition F = 9.8, p = <0.001, n=41).
Figure 6.
The horse score correlated to the classification of the competition success (0 = poor, 1 = average, 2 = good; ANOVA, F = 3.8, p = 0.05, n = 15).
Figure 6.
The horse score correlated to the classification of the competition success (0 = poor, 1 = average, 2 = good; ANOVA, F = 3.8, p = 0.05, n = 15).
Table 1.
Descriptive statistics of the horse score (n=120).
Table 1.
Descriptive statistics of the horse score (n=120).
| |
Median |
Minimum |
Maximum |
| Does your horse feel powerful, full of energy and capable? |
8 |
2 |
10 |
| Does your horse seem focussed and attentive when you are working? |
8 |
2 |
10 |
| Do you think your horse is happy, balanced and in a good mood right now? |
9 |
3 |
10 |
| Does your horse's musculature feel overworked, fatigued, hardened? |
8 |
0 |
9 |
| Do you have the feeling that your horse is emotionally stressed and easily irritable? |
8 |
1 |
9 |
Table 2.
Descriptive statistics of the riders score (n=120).
Table 2.
Descriptive statistics of the riders score (n=120).
| |
Median |
Minimum |
Maximum |
| Do you have the feeling that your muscles feel tired/over-acidified? |
7 |
1 |
9 |
| Do you feel tired today? |
7 |
0 |
9 |
| Do you feel stressed today? |
8 |
2 |
9 |
| Are you currently enjoying your training? |
10 |
5 |
10 |
| Do you feel motivated? |
10 |
5 |
10 |
|
Disclaimer/Publisher’s Note: The statements, opinions and data contained in all publications are solely those of the individual author(s) and contributor(s) and not of MDPI and/or the editor(s). MDPI and/or the editor(s) disclaim responsibility for any injury to people or property resulting from any ideas, methods, instructions or products referred to in the content. |
© 2024 by the authors. Licensee MDPI, Basel, Switzerland. This article is an open access article distributed under the terms and conditions of the Creative Commons Attribution (CC BY) license (http://creativecommons.org/licenses/by/4.0/).
