Introduction
The replacement of internal combustion engine (ICE) cars with electric vehicles runs on slower progression than expected due to several reasons: higher cost, shorter driving range, and lack of charging station network, especially in some countries [
1,
2,
3]. The implementation of electric vehicles (EVs) depends on the power source configuration, hybrid electric vehicle (HEV), plug-in hybrid electric vehicle (PHEV), battery electric vehicle (BEV), and fuel cell electric vehicle (FCEV) [
4,
5]. The disruption of a sudden unexpected vehicle stop because of a lack of available charging stations reduces people's expectations to buy a fully electric vehicle, even more if the user must drive for long-distance trips [
6,
7].
An alternative to the fully electric vehicle, BEV or FCEV, is the hybrid configuration, either PHEV or HEV. Recently, a new configuration, derived from the HEV one, the mild hybrid electric vehicle (MHEV), integrates the electric vehicle fleet offer. Hybrid electric vehicles have the advantage of low or null dependence on electric charging stations, especially the MHEV or HEV configuration, since they may run on fuel for the entire trip.
HEV and MHEV suffer from higher weight than ICE cars due to the battery, tending to reduce vehicle performance and shorten driving range [
8,
9,
10]. Indeed, increasing the vehicle mass produces a higher energy consumption rate, thus lowering the traveling distance for the same available energy. The higher performance of the electric motor, which has lower energy transmission losses, compensates for this drawback, resulting in a driving range extension compared to the ICE cars [
11,
12,
13].
The longer driving distance, however, depends on the driving pattern, driver's attitude, and driving conditions. Considering equal driving conditions, the way of driving influences critically the energy consumption rate and the vehicle driving range [
14]. Previous works demonstrate that high average speed and acceleration provoke a drastic increase in energy consumption [
15,
16,
17,
18,
19]; therefore, a significant reduction in vehicle autonomy [
20,
21,
22,
23,
24].
Electric vehicle manufacturers offer a selection of driving modes to adapt the vehicle performance to the driver’s attitude and expected way of driving for the different power source configurations. The selection currently includes sport, normal, and eco mode, corresponding to the aggressive, conventional, and moderate way of driving, respectively [
25]. Unfortunately, drivers do not use the appropriate driving mode increasing energy consumption rate [
26].
In current conditions, the driver selects a driving mode, maintaining this driving mode forever or for long driving periods, days, or even weeks, independent of the traffic and route conditions, due to the driver’s willingness to have a specific response from the vehicle or because the driver does not pay much attention to traffic and route conditions, forgetting to change to a more efficient driving mode [
27].
On the other hand, drivers do not know much about the performance of an electric vehicle, hybrid or not, and doubt the convenience of changing from one driving mode to another to reduce energy consumption rate, extending the driving range [
28]. Due to this situation, drivers run electric vehicles in non-optimal conditions, wasting energy and lowering vehicle efficiency [
29], which is especially significant in hybrid electric vehicles due to the safeguarding of the internal combustion engine that guarantees the continuous operation of the car and ensures carrying out the planned route.
The best solution to optimize the energy use in a battery electric vehicle is to disconnect the vehicle power source from the driver operation, thus avoiding interaction between the driver and the power management. The automatic control of driving operation enhances the vehicle performance, reduces the energy consumption rate, extends the driving range, and reduces greenhouse gas (GHG) emissions to the environment. Of course, manual operation selection is mandatory since the drivers must have vehicle control for security reasons like emergency cases or unexpected traffic conditions.
Many efforts and work are devoted to enhancing energy management in electric vehicles, full-electric or hybrid, but most of them set up a defined protocol without considering specific circumstances or driving history. Among these works, we can mention those focused on developing algorithms to evaluate the battery performance [
30,
31], optimizing the battery management system (BMS) to ensure an appropriate and secure battery operation [
32,
33], dealing with power management to improve battery performance [
34], analyzing the battery parameters, like state of charge, temperature, equalization, etc., to make the battery operates at optimum conditions [
35,
36], or evaluating the influence of battery management to achieve sustainable developments [
37].
Another strategy is dealing with the energy management system (EMS) to evaluate the battery response to power demand from electric engines or ancillary equipment [
38,
39] and analyze the electric vehicle power sources [
40,
41,
42,
43]. Among the works that use the EMS strategy, it is worth highlighting those that focus on consumption management seeking to minimize energy use; our work falls within this category.
In this work, we proposed a new method to improve battery management; the new method develops a protocol based on energy consumption rate optimization for every driving condition. The protocol considers the energy consumption rate as the parameter for automatically changing the driving mode. To this goal, the protocol uses dynamic motion parameters like vehicle speed and acceleration and road characteristics such as pavement type and road slope. The protocol evaluates the energy consumption continuously and compares the result with the estimated value for optimum driving conditions according to traffic characteristics and road restrictions, changing the driving mode or not depending on the comparison result.
Theoretical Fundations
Energy consumption rate,
ξr, is defined as the ratio of energy use,
ξ, to travelled distance,
d; mathematically:
The energy use depends on the required power,
Pt, and operating time,
top, as in Equation 2.
Power requirements derive from applied force to propel the vehicle,
F, and average speed,
<v>, according to:
Dynamic force includes inertial, drag, rolling, and weight force:
a and v are the acceleration and vehicle speed, m is the vehicle mass, κ and µ are the drag and rolling coefficient, and α is the road slope.
Combining the above Equations:
Because a route consists of segments with different dynamic and road conditions, Equation 5 should be transformed into:
Since the fraction in the summation is equal to 1:
The rolling and weight force in Equation 7 can be expressed in terms of effective acceleration; therefore, Equation 7 converts into:
where the effective acceleration is:
To minimize the energy consumption rate, we should apply the first derivative. Nevertheless, since there are two variables, acceleration and speed, we must express the acceleration in terms of the vehicle speed; therefore:
Sub-indexes o and f account for the initial and final vehicle speed in the segment, and di is the traveled distance for segment i.
On the other hand, we can express the vehicle speed in the drag term as:
Now, applying the first derivative, using the vehicle speed as the reference variable, developing the summations in Equation 7, considering that the initial speed of segment
i+1 is the final speed of segment
i, and grouping terms, we have:
Last term in Equation 12 vanishes for flat terrain, thus:
d1 corresponds to the first segment traveled distance, and vo is the starting vehicle speed.
Distance for every segment is calculated from the route pattern, which can be obtained from a navigation map (Google Maps [
44], Geo Tracker [
45], Petal Maps [
46], Sygic [
47], Waze [
48] or any other); therefore, the only remaining variable is the vehicle speed.
Provided the starting vehicle speed is known, the first term in Equations 12 and 13 can be calculated from the vehicle characteristics; therefore:
where coefficient
Co is:
Energy Management
Energy consumption in a hybrid electric vehicle derives from the fuel and battery supply; the battery represents the traction system (series hybrid) or supplies power in combination with the ICE (parallel hybrid), depending on the vehicle configuration [
49]. In the first mode, the battery receives energy from the electric generator powered by the ICE. In the second mode, the internal combustion engine and the electric motor, powered by the battery, are mechanically connected to the transmission and can directly power the vehicle. The vehicle can operate on either the internal combustion engine, the electric motor, or by combining both power sources.
Electric vehicles (EVs) and hybrid electric vehicles (HEVs) depend heavily on battery management systems (BMS). Essentially the brains and heart of these cars, the BMS keeps an eye on the battery pack and regulates it while guaranteeing longevity, safety, dependability, and peak performance.
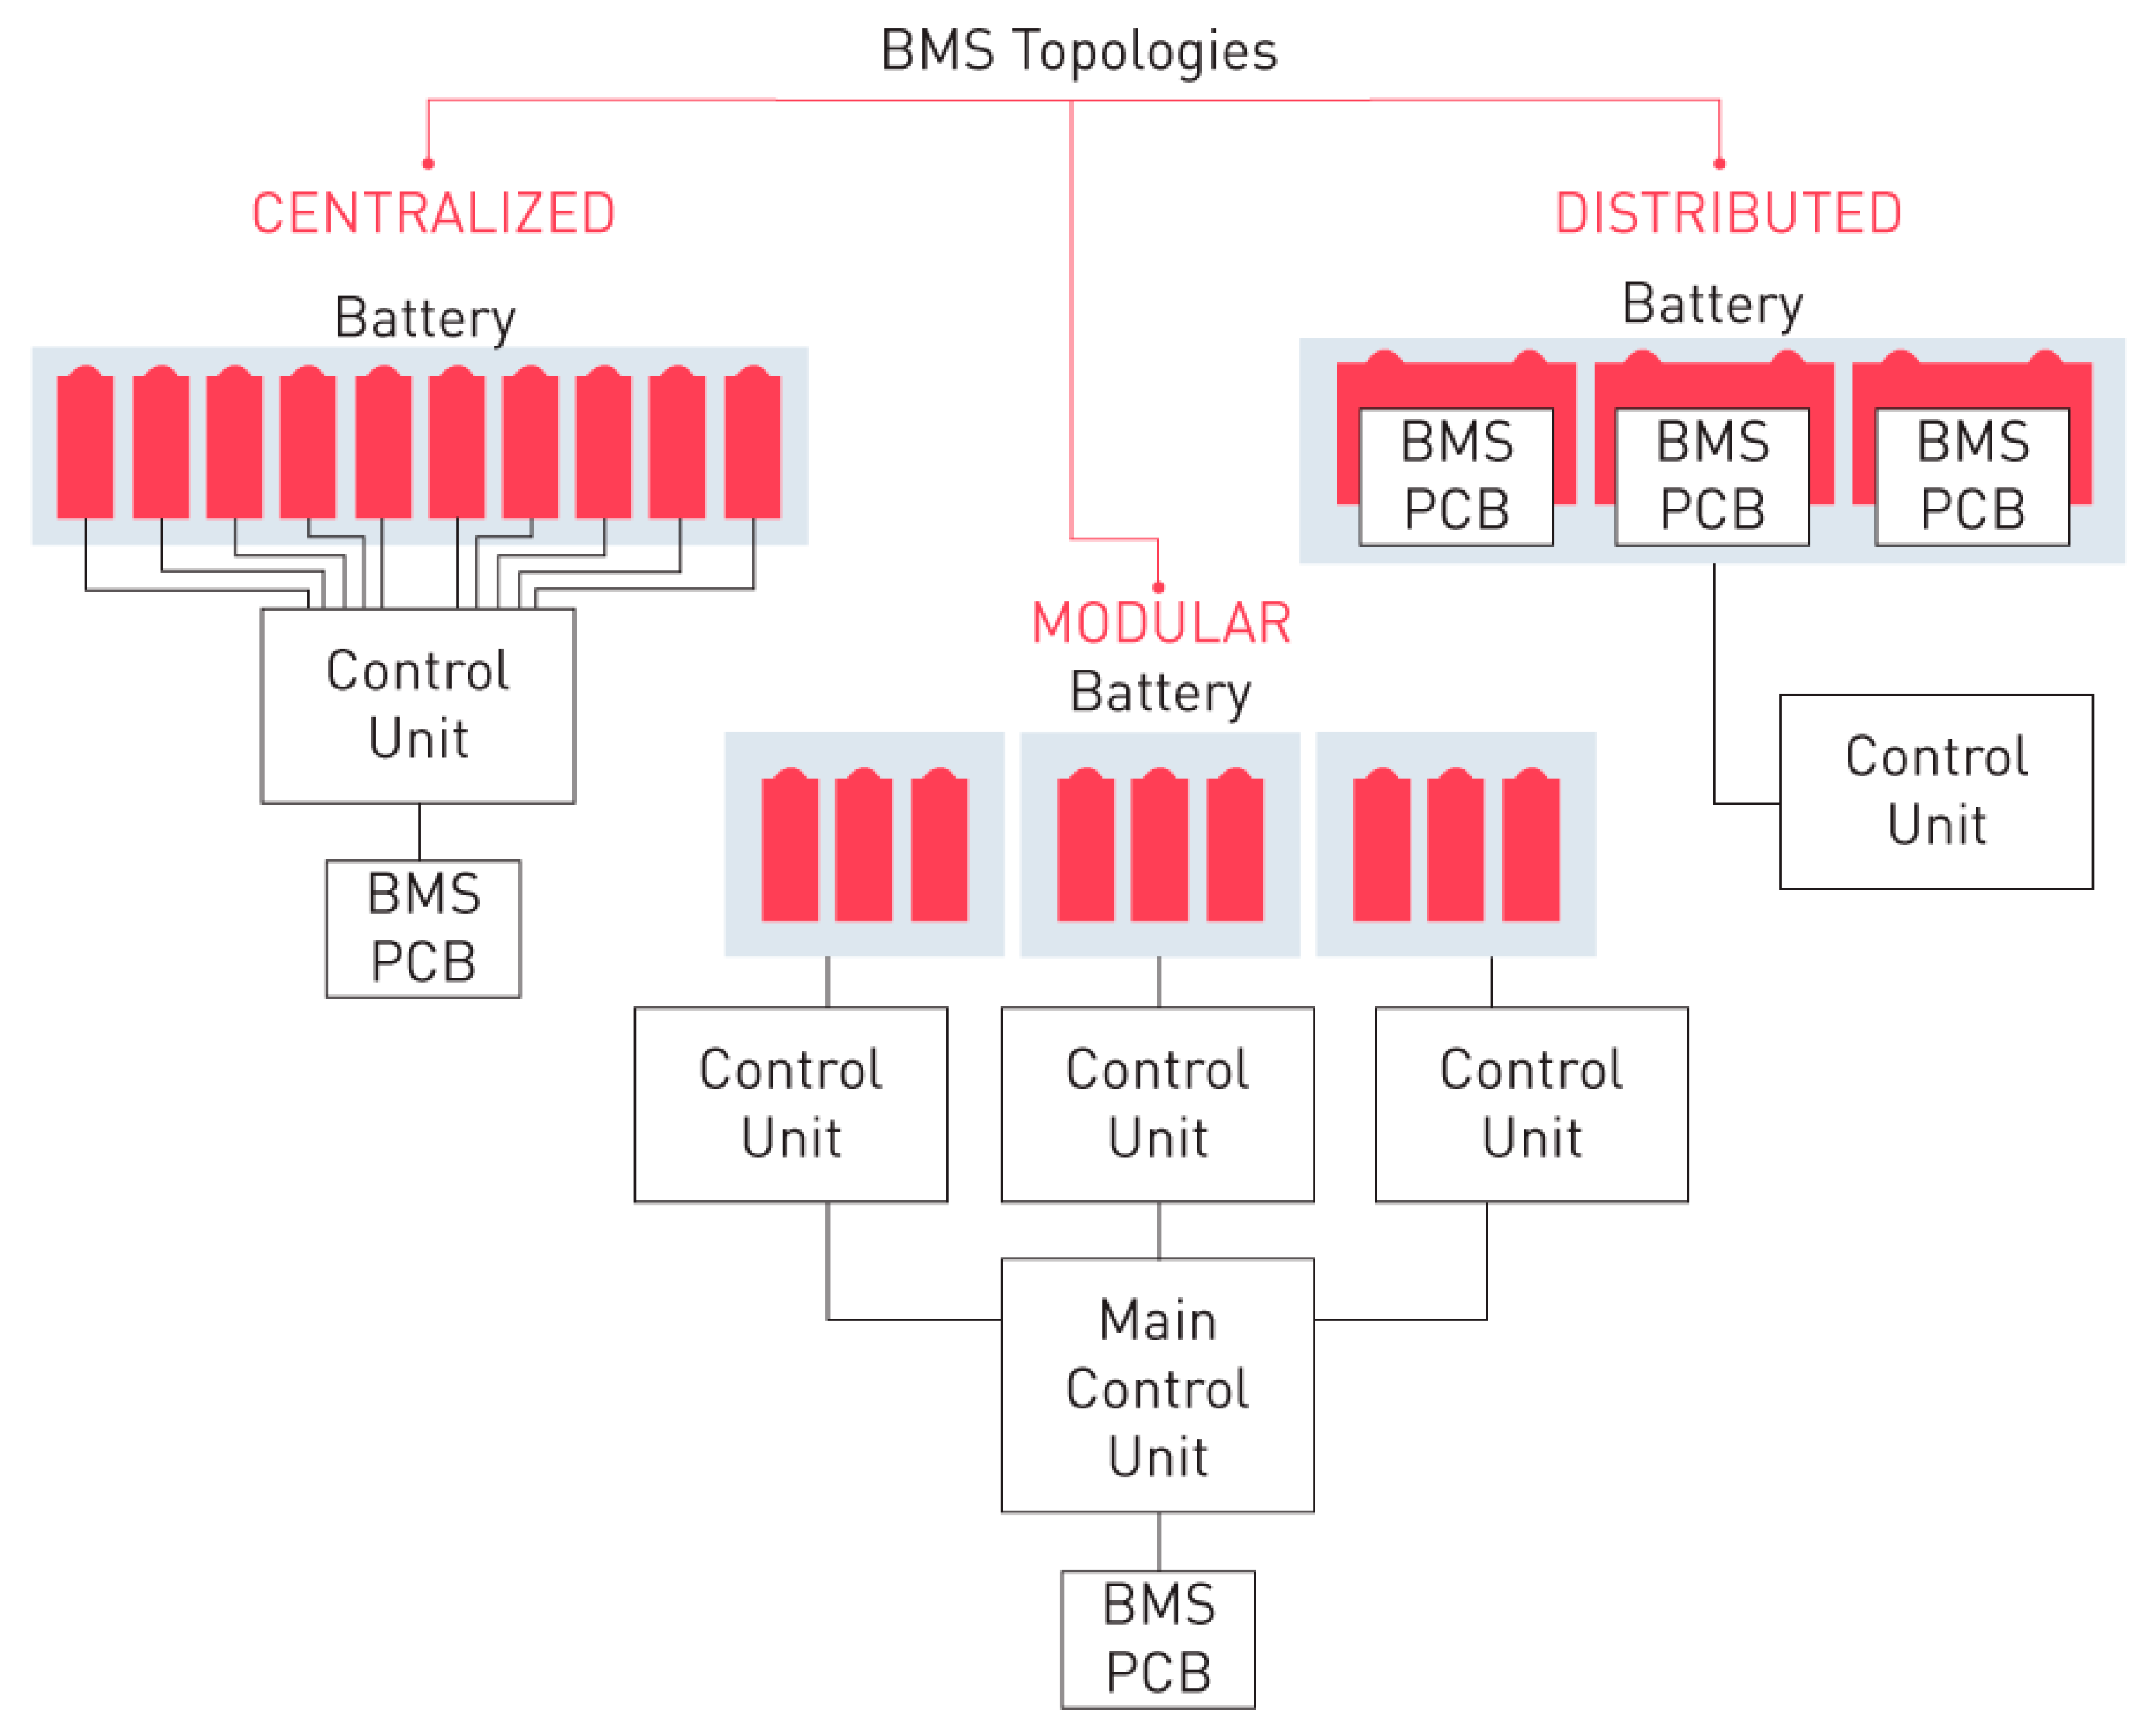
Three types of battery management systems operate in hybrid electric vehicles: centralized, distributed, and modular [
50].
Figure 1 shows the schematic representation of every system.
The strategy of the battery management system depends on the EV manufacturer. Toyota applies the following protocol: in slow-moving traffic, the generator can cut out the petrol engine and let the electric motor take over for zero-emissions traveling [
51]. To charge the battery, the BMS continuously monitors the battery voltage; below a threshold, the electric generator, powered by the ICE, charges the battery. Additionally, the regenerative braking system charges the battery when braking or decelerating. Hyundai hybrid electric vehicles similarly use the BMS, although some differences arise [
52]; depending on the driving situation, BMS switches seamlessly between its petrol engine and electric motor. The regenerative braking system charges the battery using the electric motor to slow the car. The energy stored in the battery then powers the electric motor to help in acceleration, uphill driving, and low-speed driving. Renault BMS operates differently [
53]; hybrid cars start with 100% electric power, which continues during the first few miles to offer a more lively pick-up. Under the combined electric and combustion engine types, hybrids can drive in electric mode most of the time. Nevertheless, E-Tech technology captures more energy than most hybrids; therefore, the user can drive in electric mode for as long as possible. When the battery lacks enough power, the combustion engine comes to the rescue and offers full hybrid traction, with the two power sources running simultaneously.
Other electric vehicle manufacturers similarly operate the BMS to the above methodologies. BMS maintains the battery state of charge (SOC) between limits, currently 20% to 80% [
54].
Since the battery management system is responsible for preserving a safe and operational state of charge, and because of the close relation between the battery and internal combustion engine operability, any operation form reflects on the energy consumption rate. Indeed, if we apply Equation 2, the required energy to traction the hybrid electric vehicle comes from the ICE or the battery; however, the mechanical transmission from engine to wheel is different depending on the power source, ICE, or battery.
Considering the necessary energy for vehicle traction, we have:
Sub-indexes pw and wh account for the power source and wheel. ηt is the transmission efficiency.
Considering a hybrid electric vehicle operates partially in the electric mode, the required energy from the power source is:
Fbat and FICE are the fraction of demanded energy supplied by the battery and internal combustion engine, and ηmech and ηel are the mechanical and electric transmission efficiency.
Since the battery charges from the ICE through an electric generator, the energy injected into the battery depends on the generator’s efficiency; therefore:
and represent the output energy from the ICE and input energy into the battery, and ηgen is the generator efficiency.
On the other hand, the power extraction from the battery suffers from energy losses; therefore:
Combining Equations 18 and 19 and replacing in Equation 17:
Retrieving data from the literature, we obtain electric, mechanic and generator efficiency [
55,
56,
57,
58,
59], and battery performance [
60,
61,
62]. From these values, we can determine the combined energy consumption as a function of the operational electric mode fraction.
If we divide by time, Equation 21 converts into:
Which expresses the energy consumption ratio when using a combined battery and ICE power source related to an internal combustion engine only.
Energy Consumption Simulation
Provided the efficiencies in Equation 21 are known, we can determine the energy consumption as a function of the power fraction supplied by the battery. Using the literature database, we have (
Table 1):
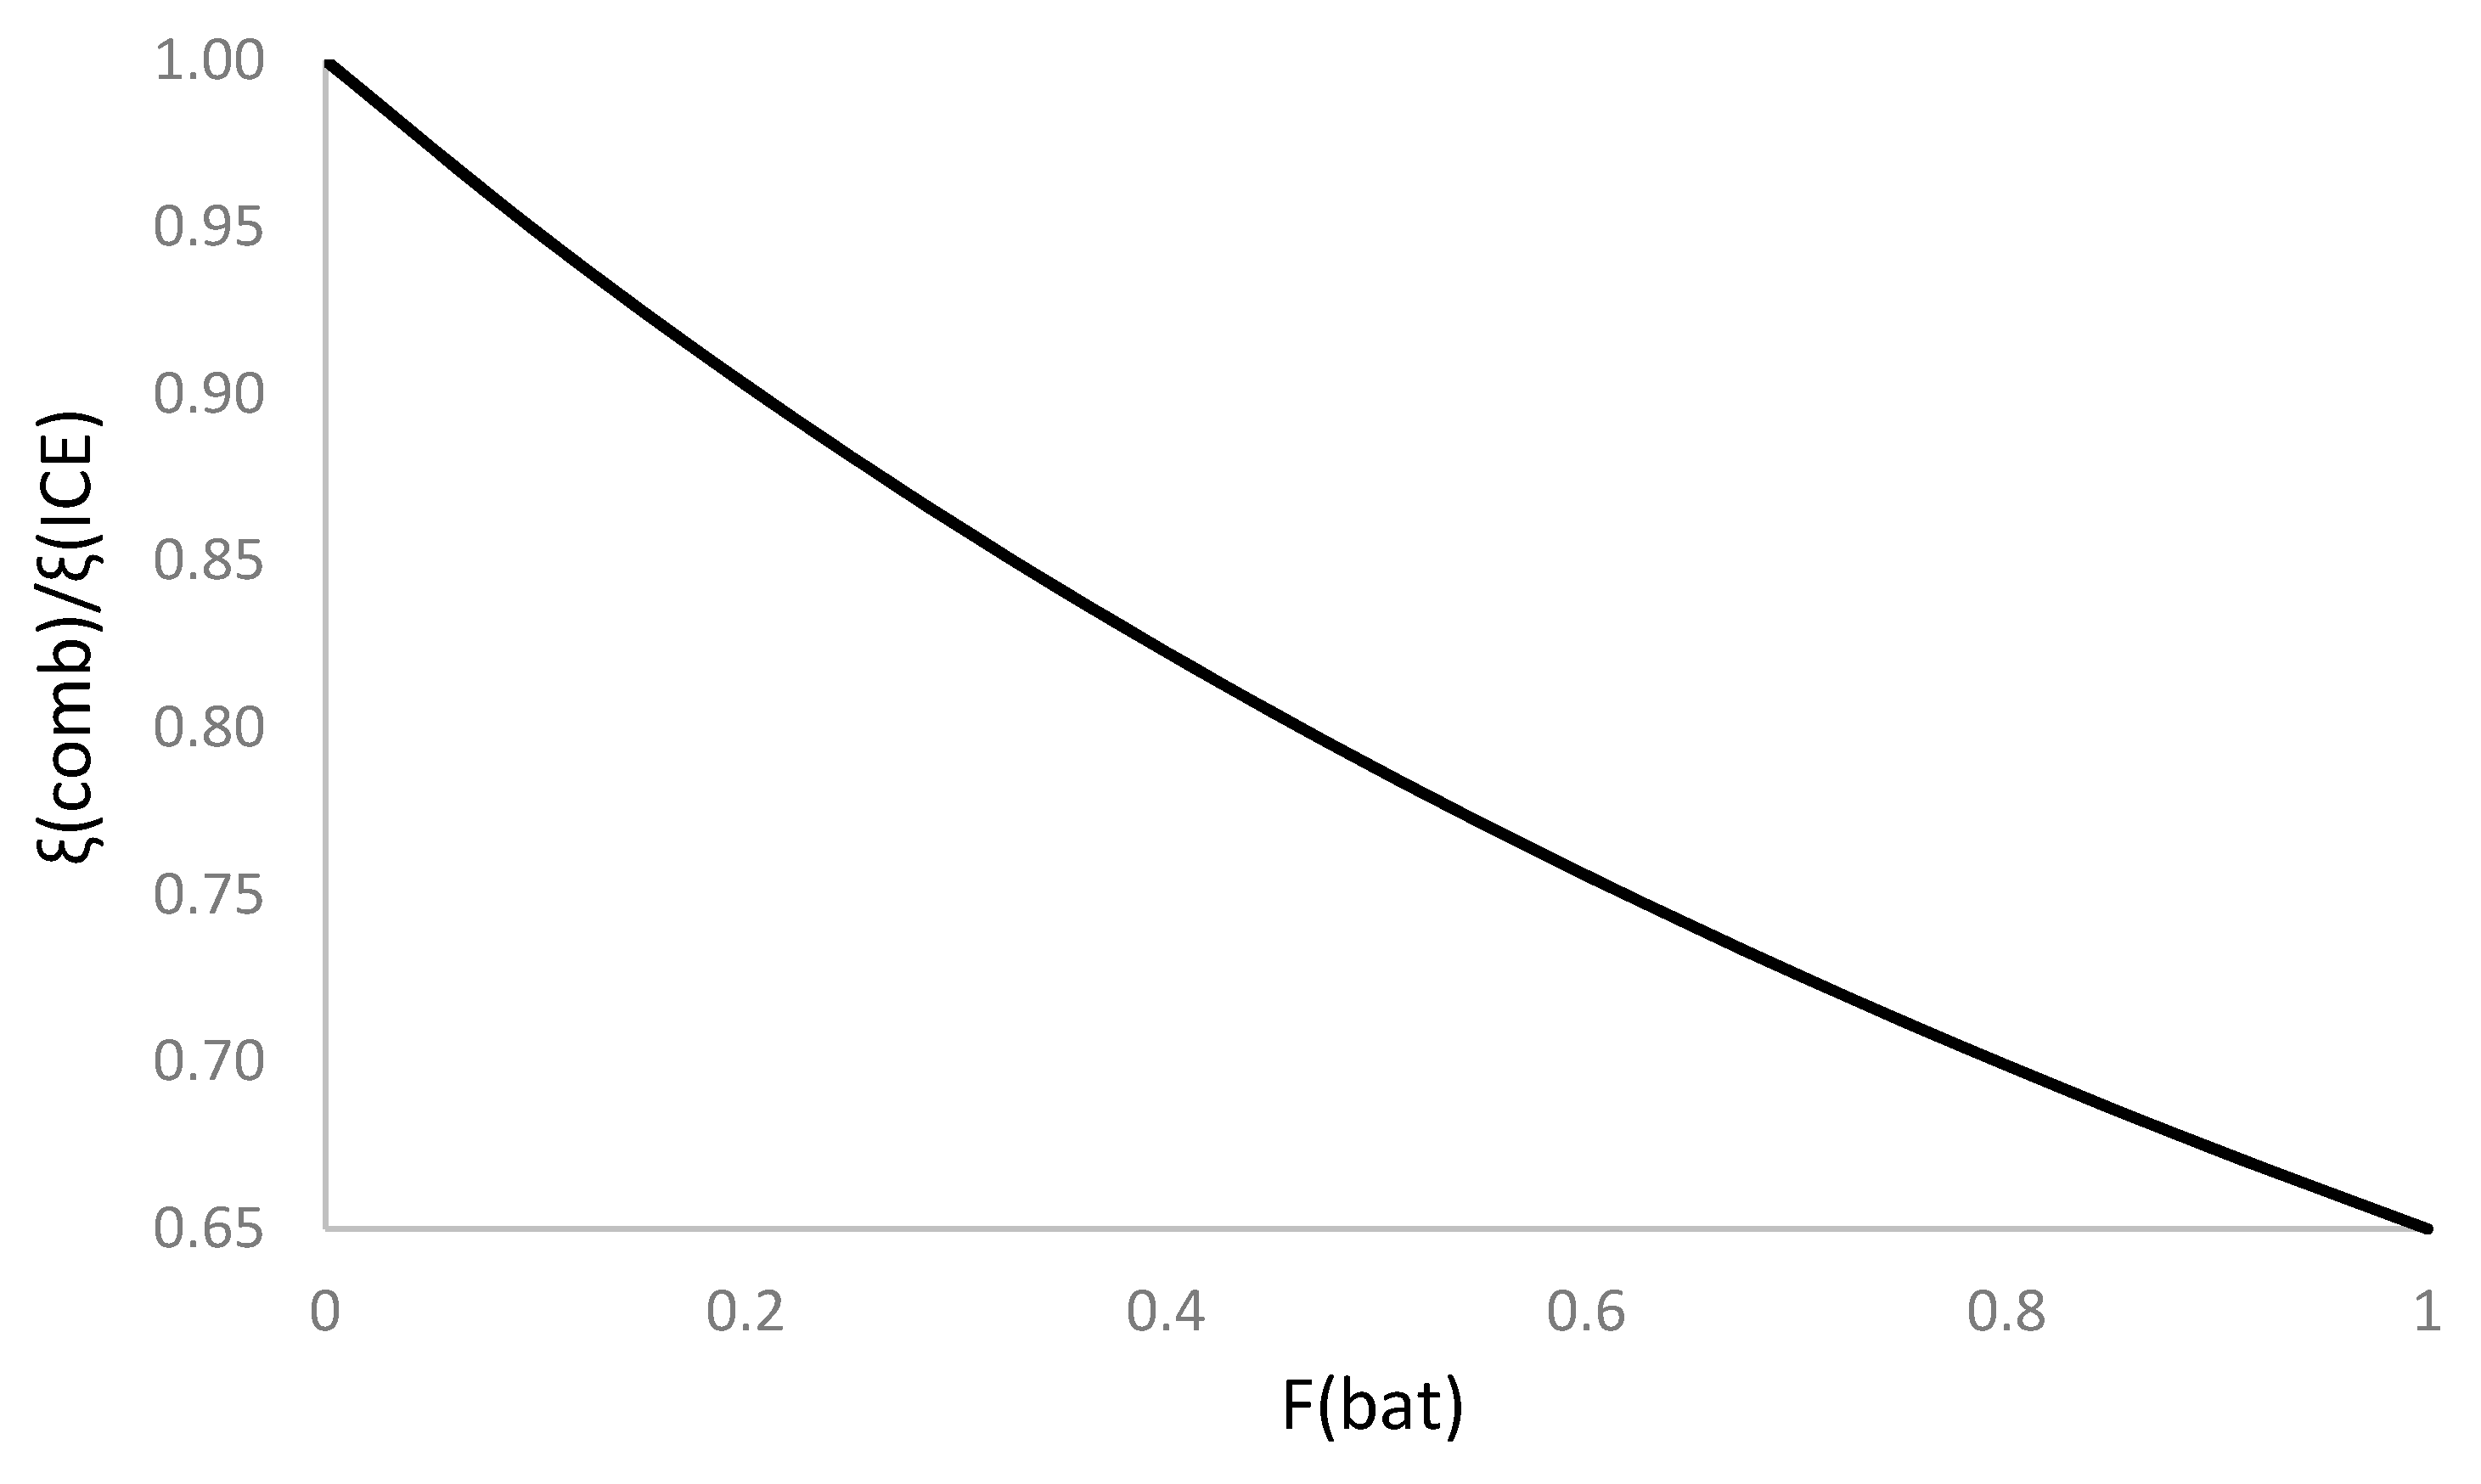
Figure 2 shows the evolution of the
ξcomb/ξICE ratio as a function of the battery use fraction.
We observe how increasing the battery use as a source reduces the energy consumption rate, which may reach up to 35% for full-use battery use.
Simulation
To analyze the protocol, we run a simulation based on the algorithm of Equation 21. We use a light-duty vehicle as a reference.
Table 2 lists the main characteristics of the vehicle.
We calculate the drag coefficient from the aerodynamic coefficient,
Cx, using the following Equation:
For the simulation, we have considered a variable starting vehicle speed and segment distance, up to 50 km/h (31.25 mph) and 1 km (0.625 miles), in steps of 10 km/h (6.25 mph) and 100 m (0.0625 miles). We establish the upper and lower limit of the starting vehicle speed according to current practice driving conditions. The initial segment distance extends to 1 km (0.625 miles) to cover a wide range.
To run the simulation, we propose a standard urban route composed of horizontal, uphill, and downhill segments, with variable speed for everyone.
Figure 3 shows the graphic representation of the simulated route.
Labels in
Figure 3 indicate the vehicle speed at the end of the segment for standard road traffic in a daily urban route. These values correspond to the recommended speed limitation according to traffic rules dictated by local authorities. The vehicle identifies the speed limitation using a camera that points to the speed traffic limit signal next to the road. We use these values as a reference for the simulation. The group of measures extends for 213 days for the same urban route and similar traffic conditions [
63]. In the simulation, we use values from daily driving conditions to reproduce a current situation, representing a faithful panorama of what is happening.
According to local regulations in many cities, the traffic speed limit is 50-70 km/h in urban routes, including peripheral zones [
64]. Since the traffic regulations change depending on the country, we averaged values for two zones, within towns (50 km/h) and interurban roads (90) km/h. The peripheral route represents an intermediate road between urban and interurban; therefore, we estimate the speed limit as 70 km/h, taken as the reference value. The 80 km/h value corresponds to a temporary vehicle speed due to the inertial effects in the route downhill section. We assume that this speed limit overpassing is compatible with traffic rules due to the low-speed excess and the short time it lasts.
We divide the urban route into 14 segments for a total distance of 17.1 km (10.7 miles). The total distance corresponds to the worldwide average daily driving distance considering a one-way trip [
65].
Table 3 shows the distance distribution for the one-way route. We obtain the values averaging data from a statistical analysis of daily trips run by drivers in urban zones [
65].
The average value of this test for the whole route is 40.8 km/h (25.5 mph).
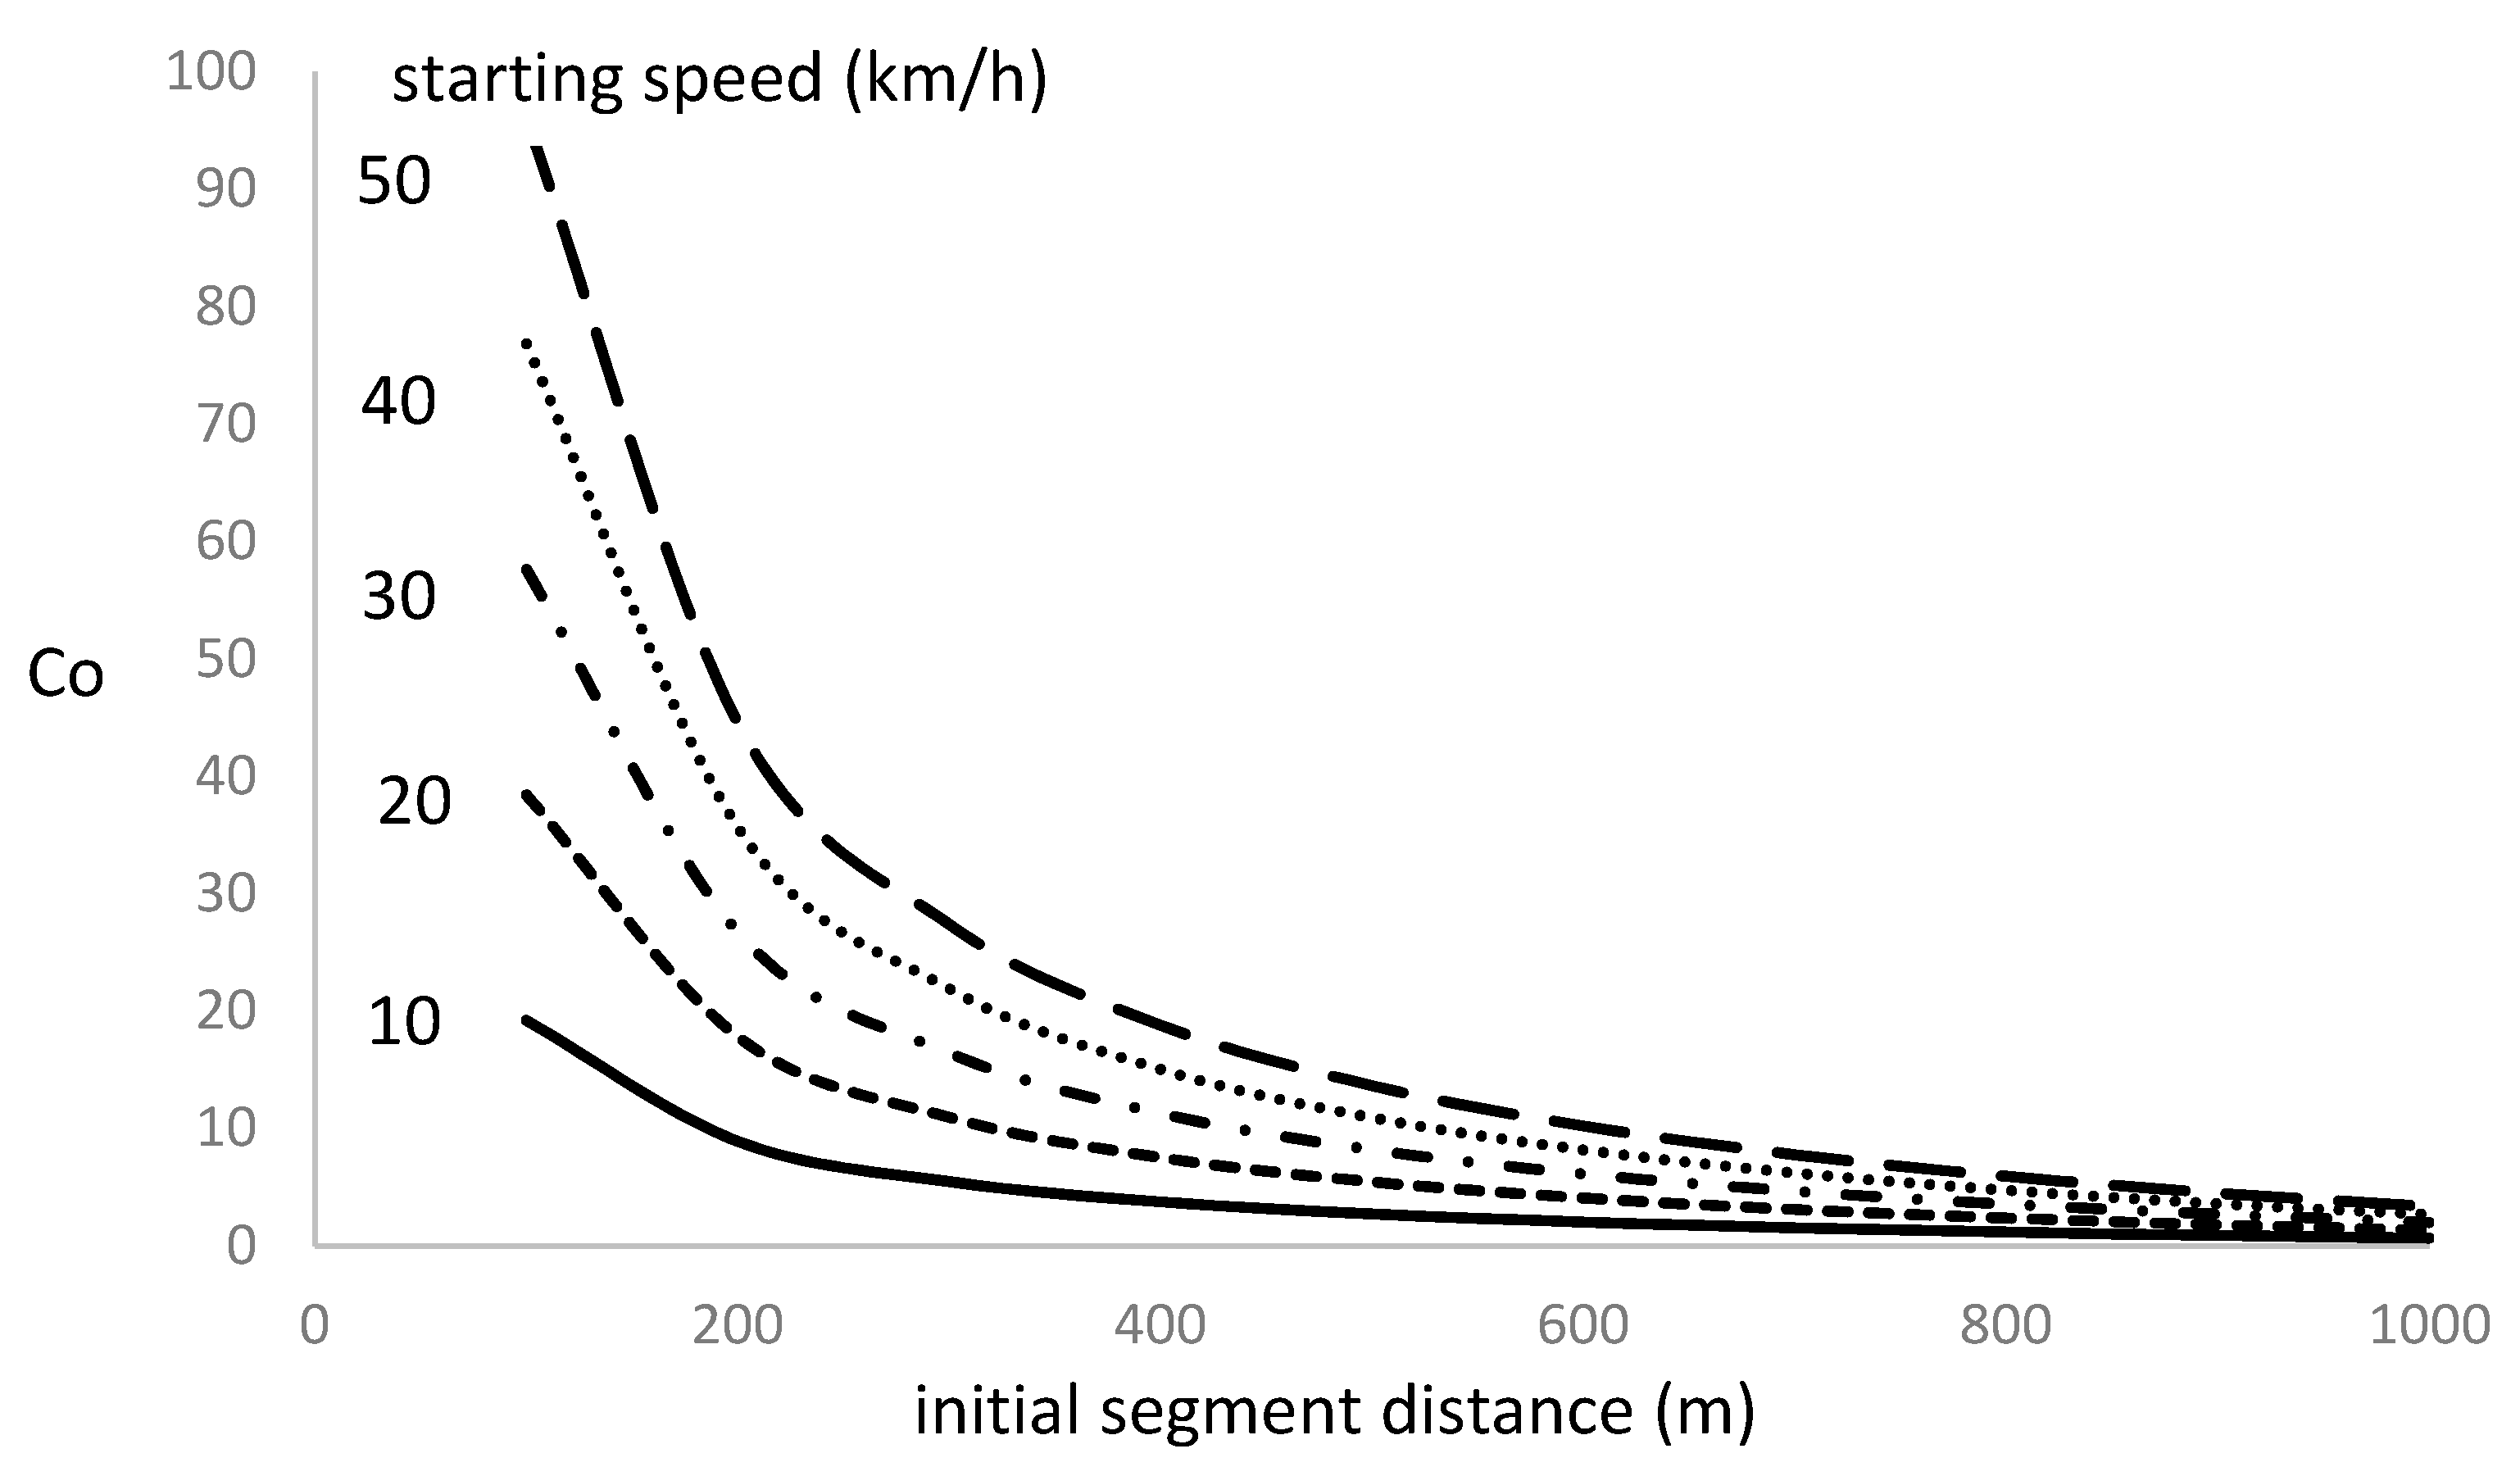
Figure 4 shows the evolution of the coefficient
Co as a function of the initial segment distance and starting vehicle speed.
We notice that the coefficient Co rapidly raises for low initial segment distance, below 200 m, and merges to a unique value as the initial segment distance increases. The increase in the Co coefficient for short initial segment distance is faster as the starting vehicle speed increases. We deduce that minimum energy consumption rate condition, imposed by Equation 21, is more sensitive to short initial segment distance and high starting vehicle speed.
Applying values from
Table 2 and
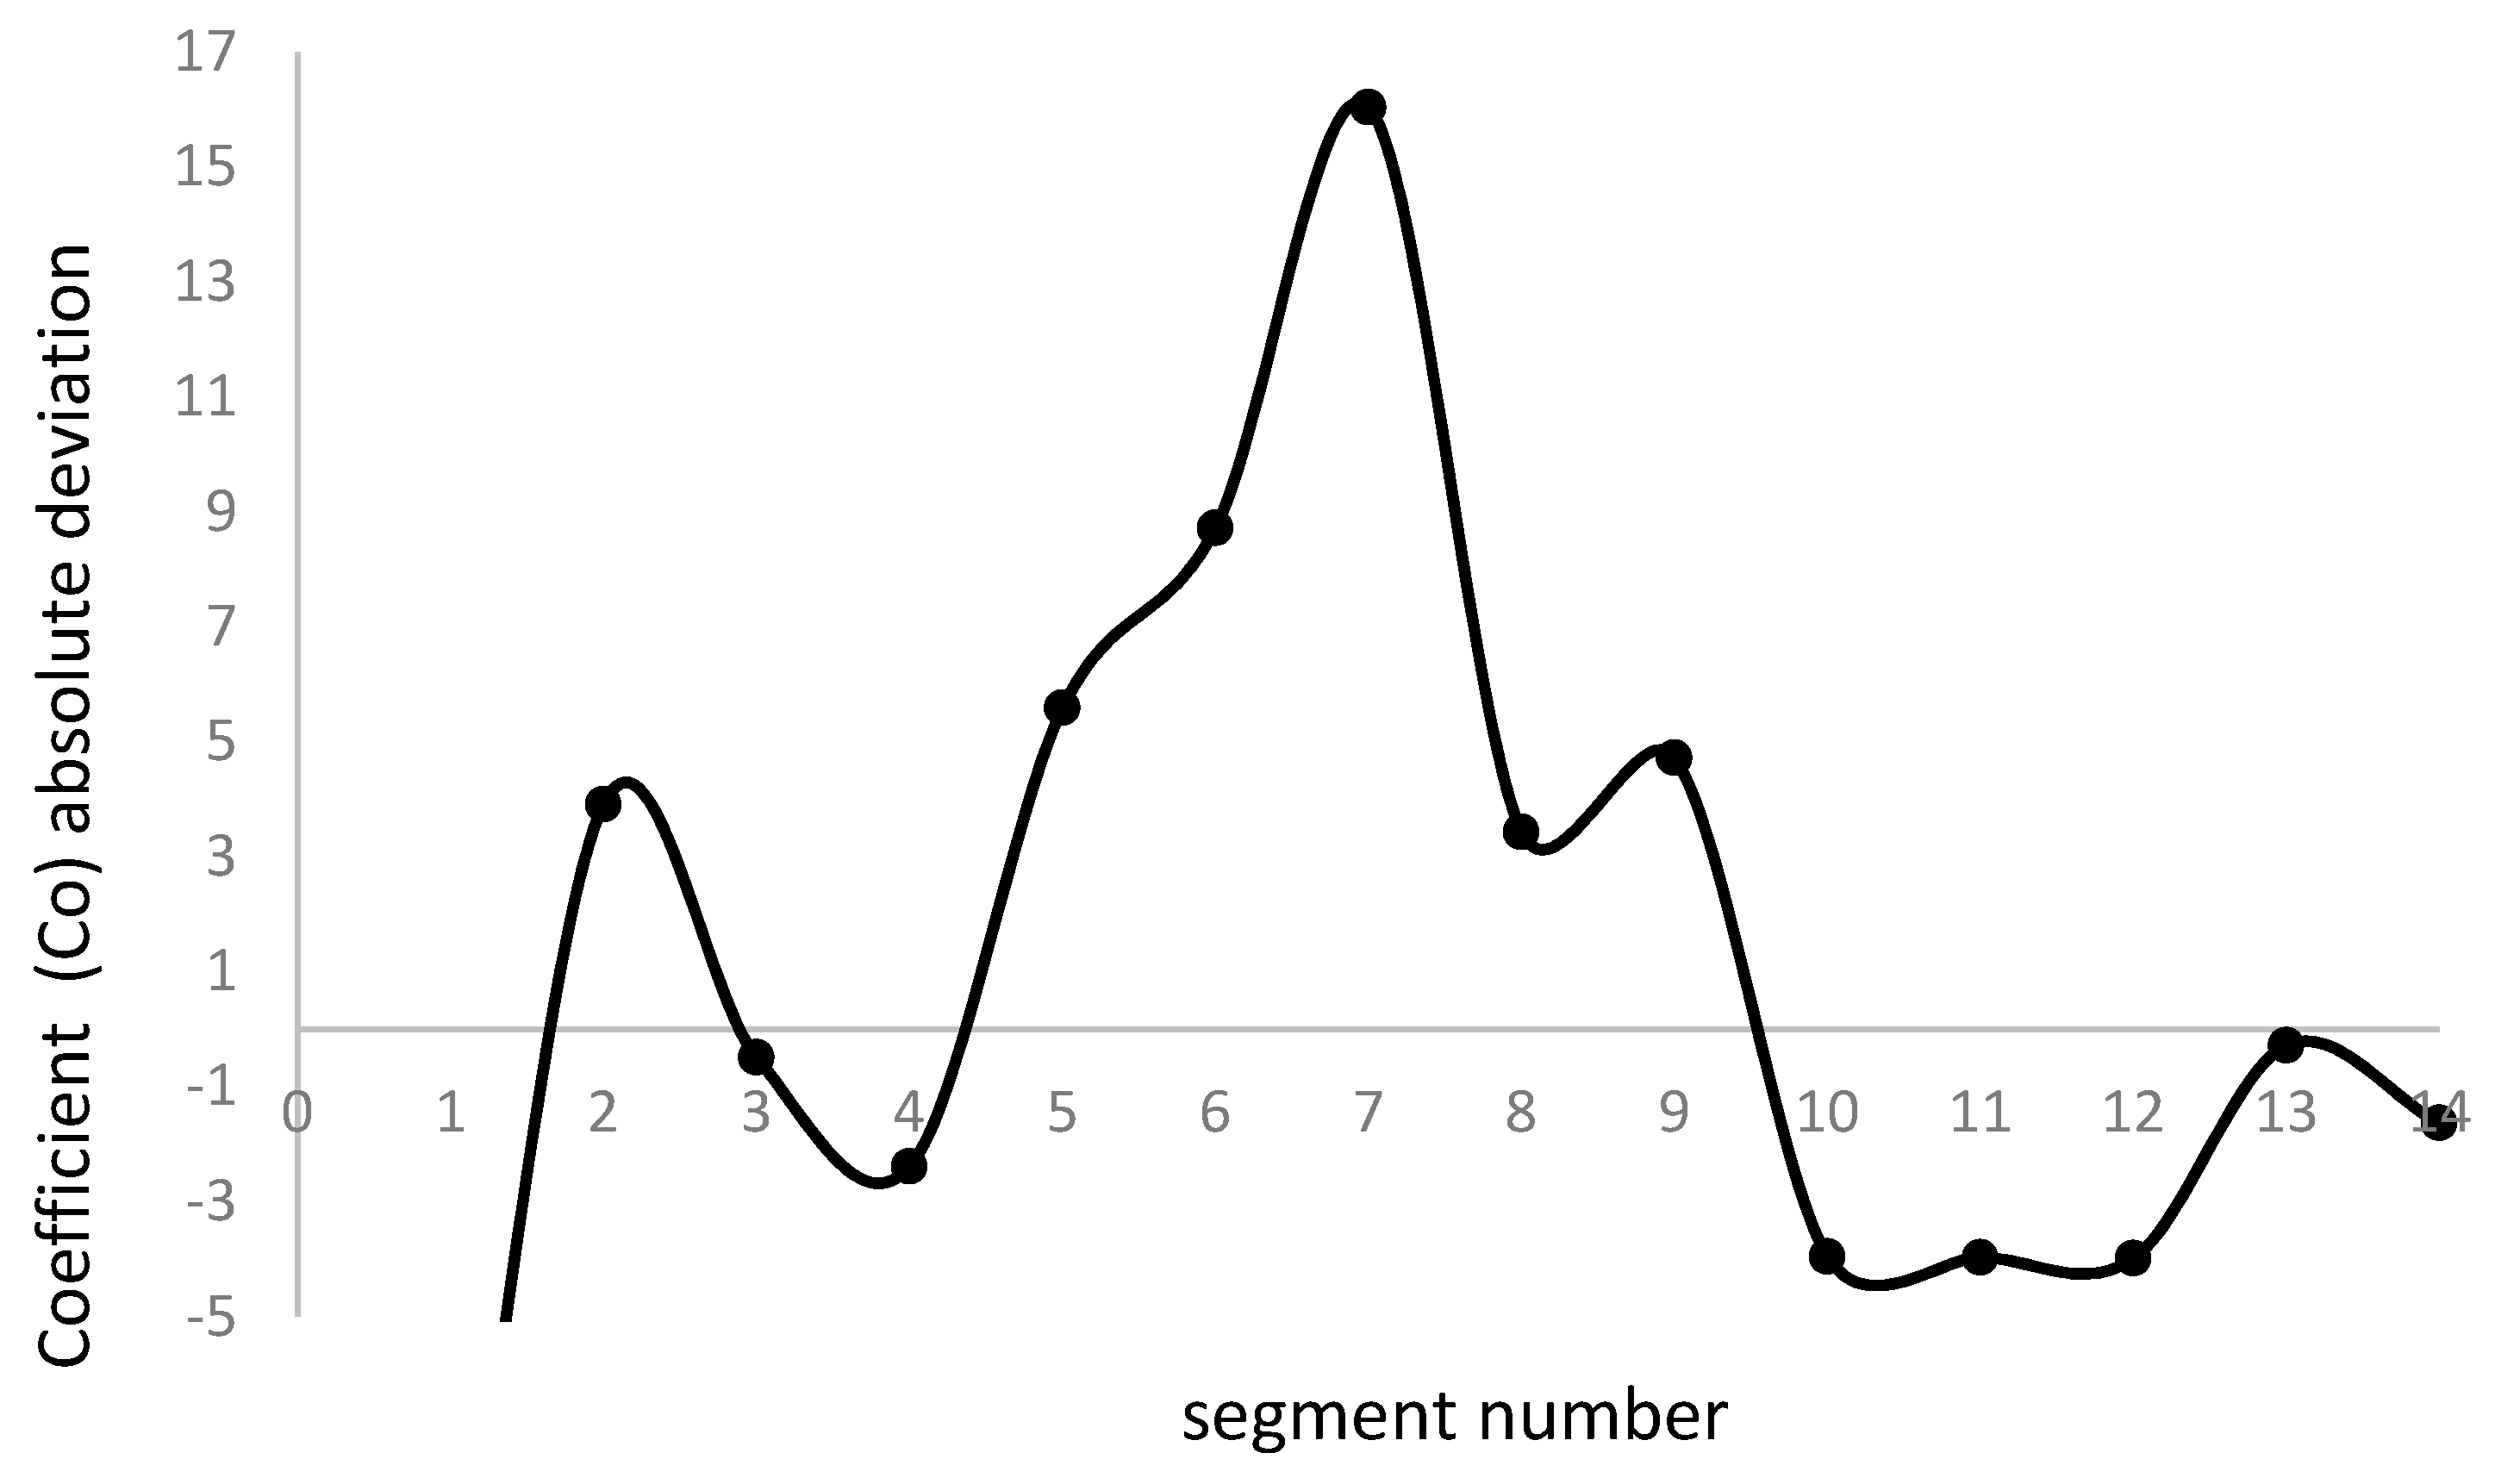
Table 3 to Equation 21 for every segment, we obtain the following results (
Figure 5):
From C
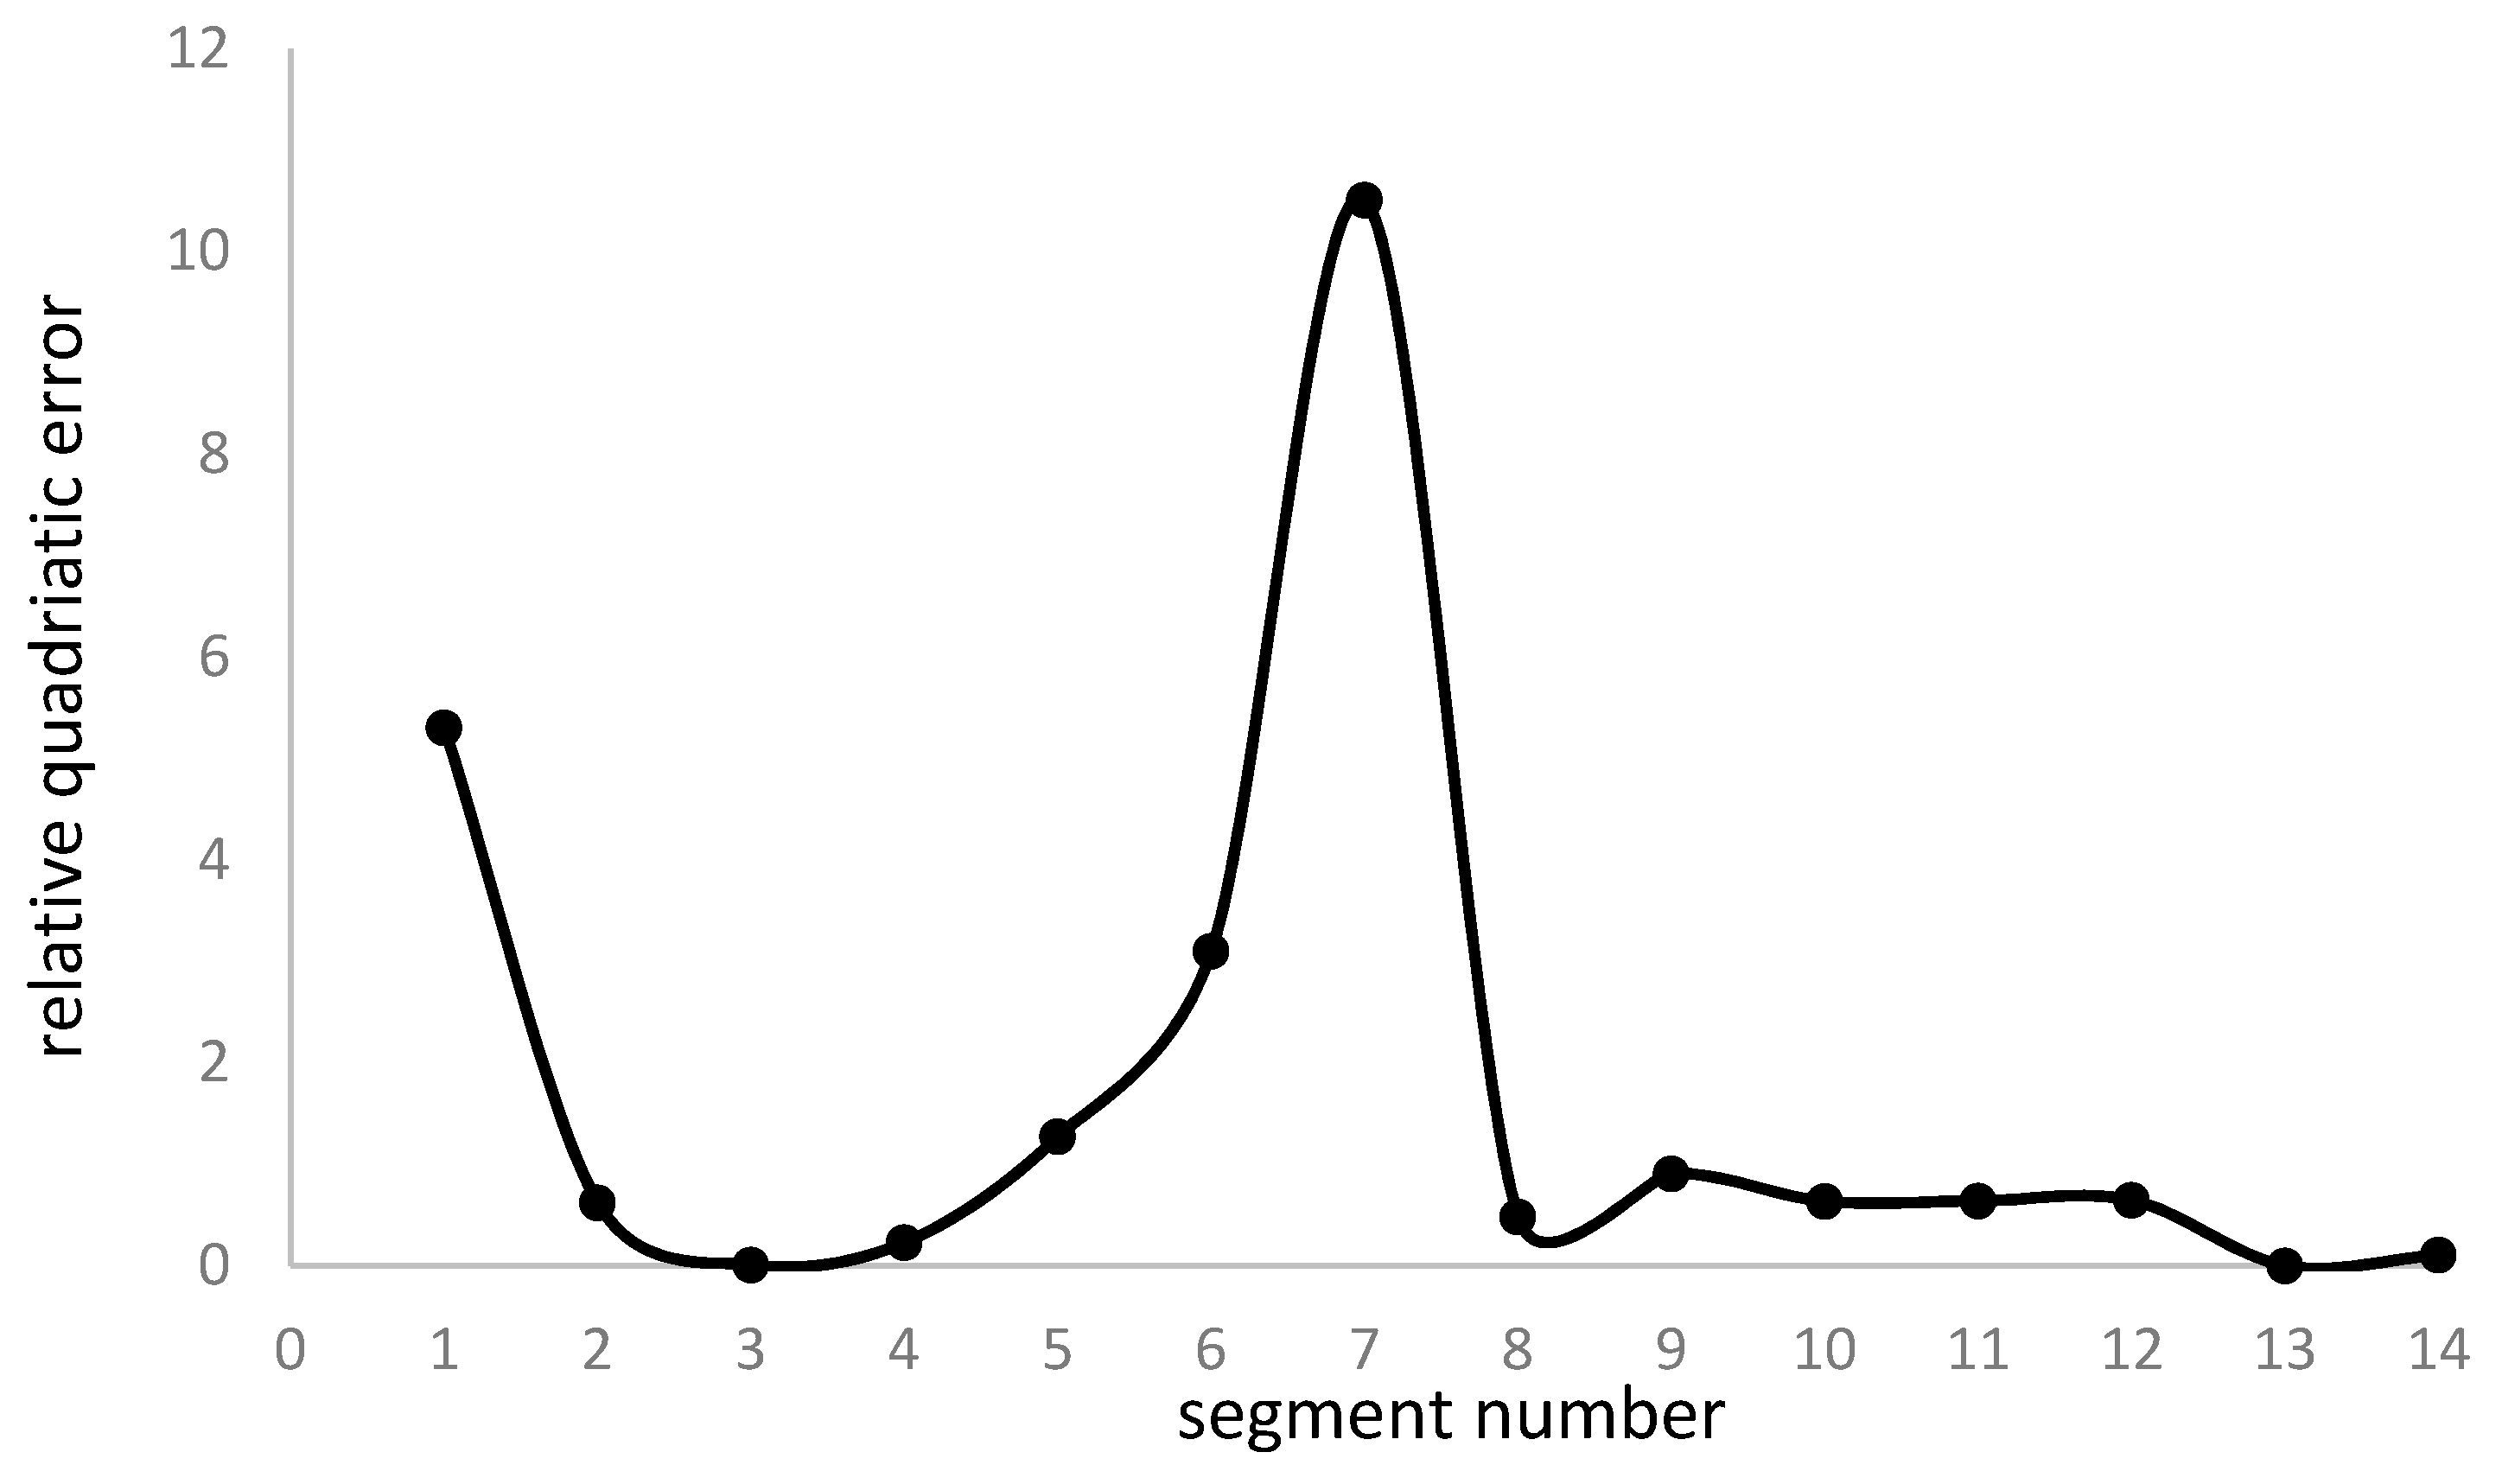
o deviation values, we can determine the excess of energy consumption rate related to the optimum value. To do so, we calculate the relative quadratic error for every segment, obtaining (
Figure 6):
The graph displays the coefficient Co's solid line, which determines the accuracy of achieving the minimum energy consumption rate, ξr. It is evident from the black dots representing segment values that there is a deviation, indicating the suboptimal performance of the hybrid electric vehicle's driving mode. The deviation value quantifies how far the driving mode falls from the optimal mode, with higher deviation values indicating lower efficiency of the HEV.
We realize that the highest quadratic error values correspond to segments 1, 6, and 7. Segment 1 accounts for the starting of the vehicle with a high acceleration process, and segments 6 and 7 correspond to the uphill section. We, therefore, conclude that acceleration and maintaining vehicle speed in the uphill section represent the most penalizing processes for the energy consumption rate.
The analysis of results from
Figure 5 shows that the maximum deviation accounts for segments 5 to 7, corresponding to the uphill route section where power requirements increase. Therefore, we conclude that the energy consumption rate diverges from the optimum value with power demand.
We realize that, for many segments, the relative quadratic error is near zero, which indicates that the driving conditions are close to the optimum performance. Segment 3 matches the condition of null error, meaning the vehicle operates at optimum performance for this segment's driving conditions. For segments 8 to 14, the energy consumption rate is higher than optimum, thus generating fuel overconsumption and operating the battery at poorer management.
At the beginning of the route and uphill segments, the relative error is high, which indicates that the energy consumption rate is much higher than expected and not at its optimum value. One reason for this could be the acceleration rate at the start of the journey, which needs to be lowered. Also, maintaining the vehicle speed on uphill roads can cause fuel overconsumption, negatively impacting energy consumption and battery energy management.
Since the energy consumption rate directly relates to power management efficiency, the lower the ξr value, the higher the efficiency. On the other hand, because the energy consumption rate includes battery energy management, a high value of the ξr parameter means poor battery management and vice versa. Therefore, to achieve an optimum battery energy management process, the deviation of the Co coefficient should be null for every route segment.
The correction of the deviation of the Co coefficient implies modifying the vehicle speed at every segment to match a null deviation.
We achieve this goal by correcting the vehicle speed until the deviation becomes null. The correction factor is 0.9 for the simulated case, but it changes when modifying driving conditions like the route profile, segment distribution, and vehicle speed at every segment. This coefficient applies for urban and peripheral routes with a speed limitation of 50 km/h and 70 km/h.
If the vehicle exceeds the speed limit indicated above, the correction coefficient must be modified by an additional 0.1 for each additional 10 km/h in which the established speed limit exceeds; therefore, for a speed of 80 km/h, the coefficient should be 0.2, for 90 km/h, 0.3, and so on.
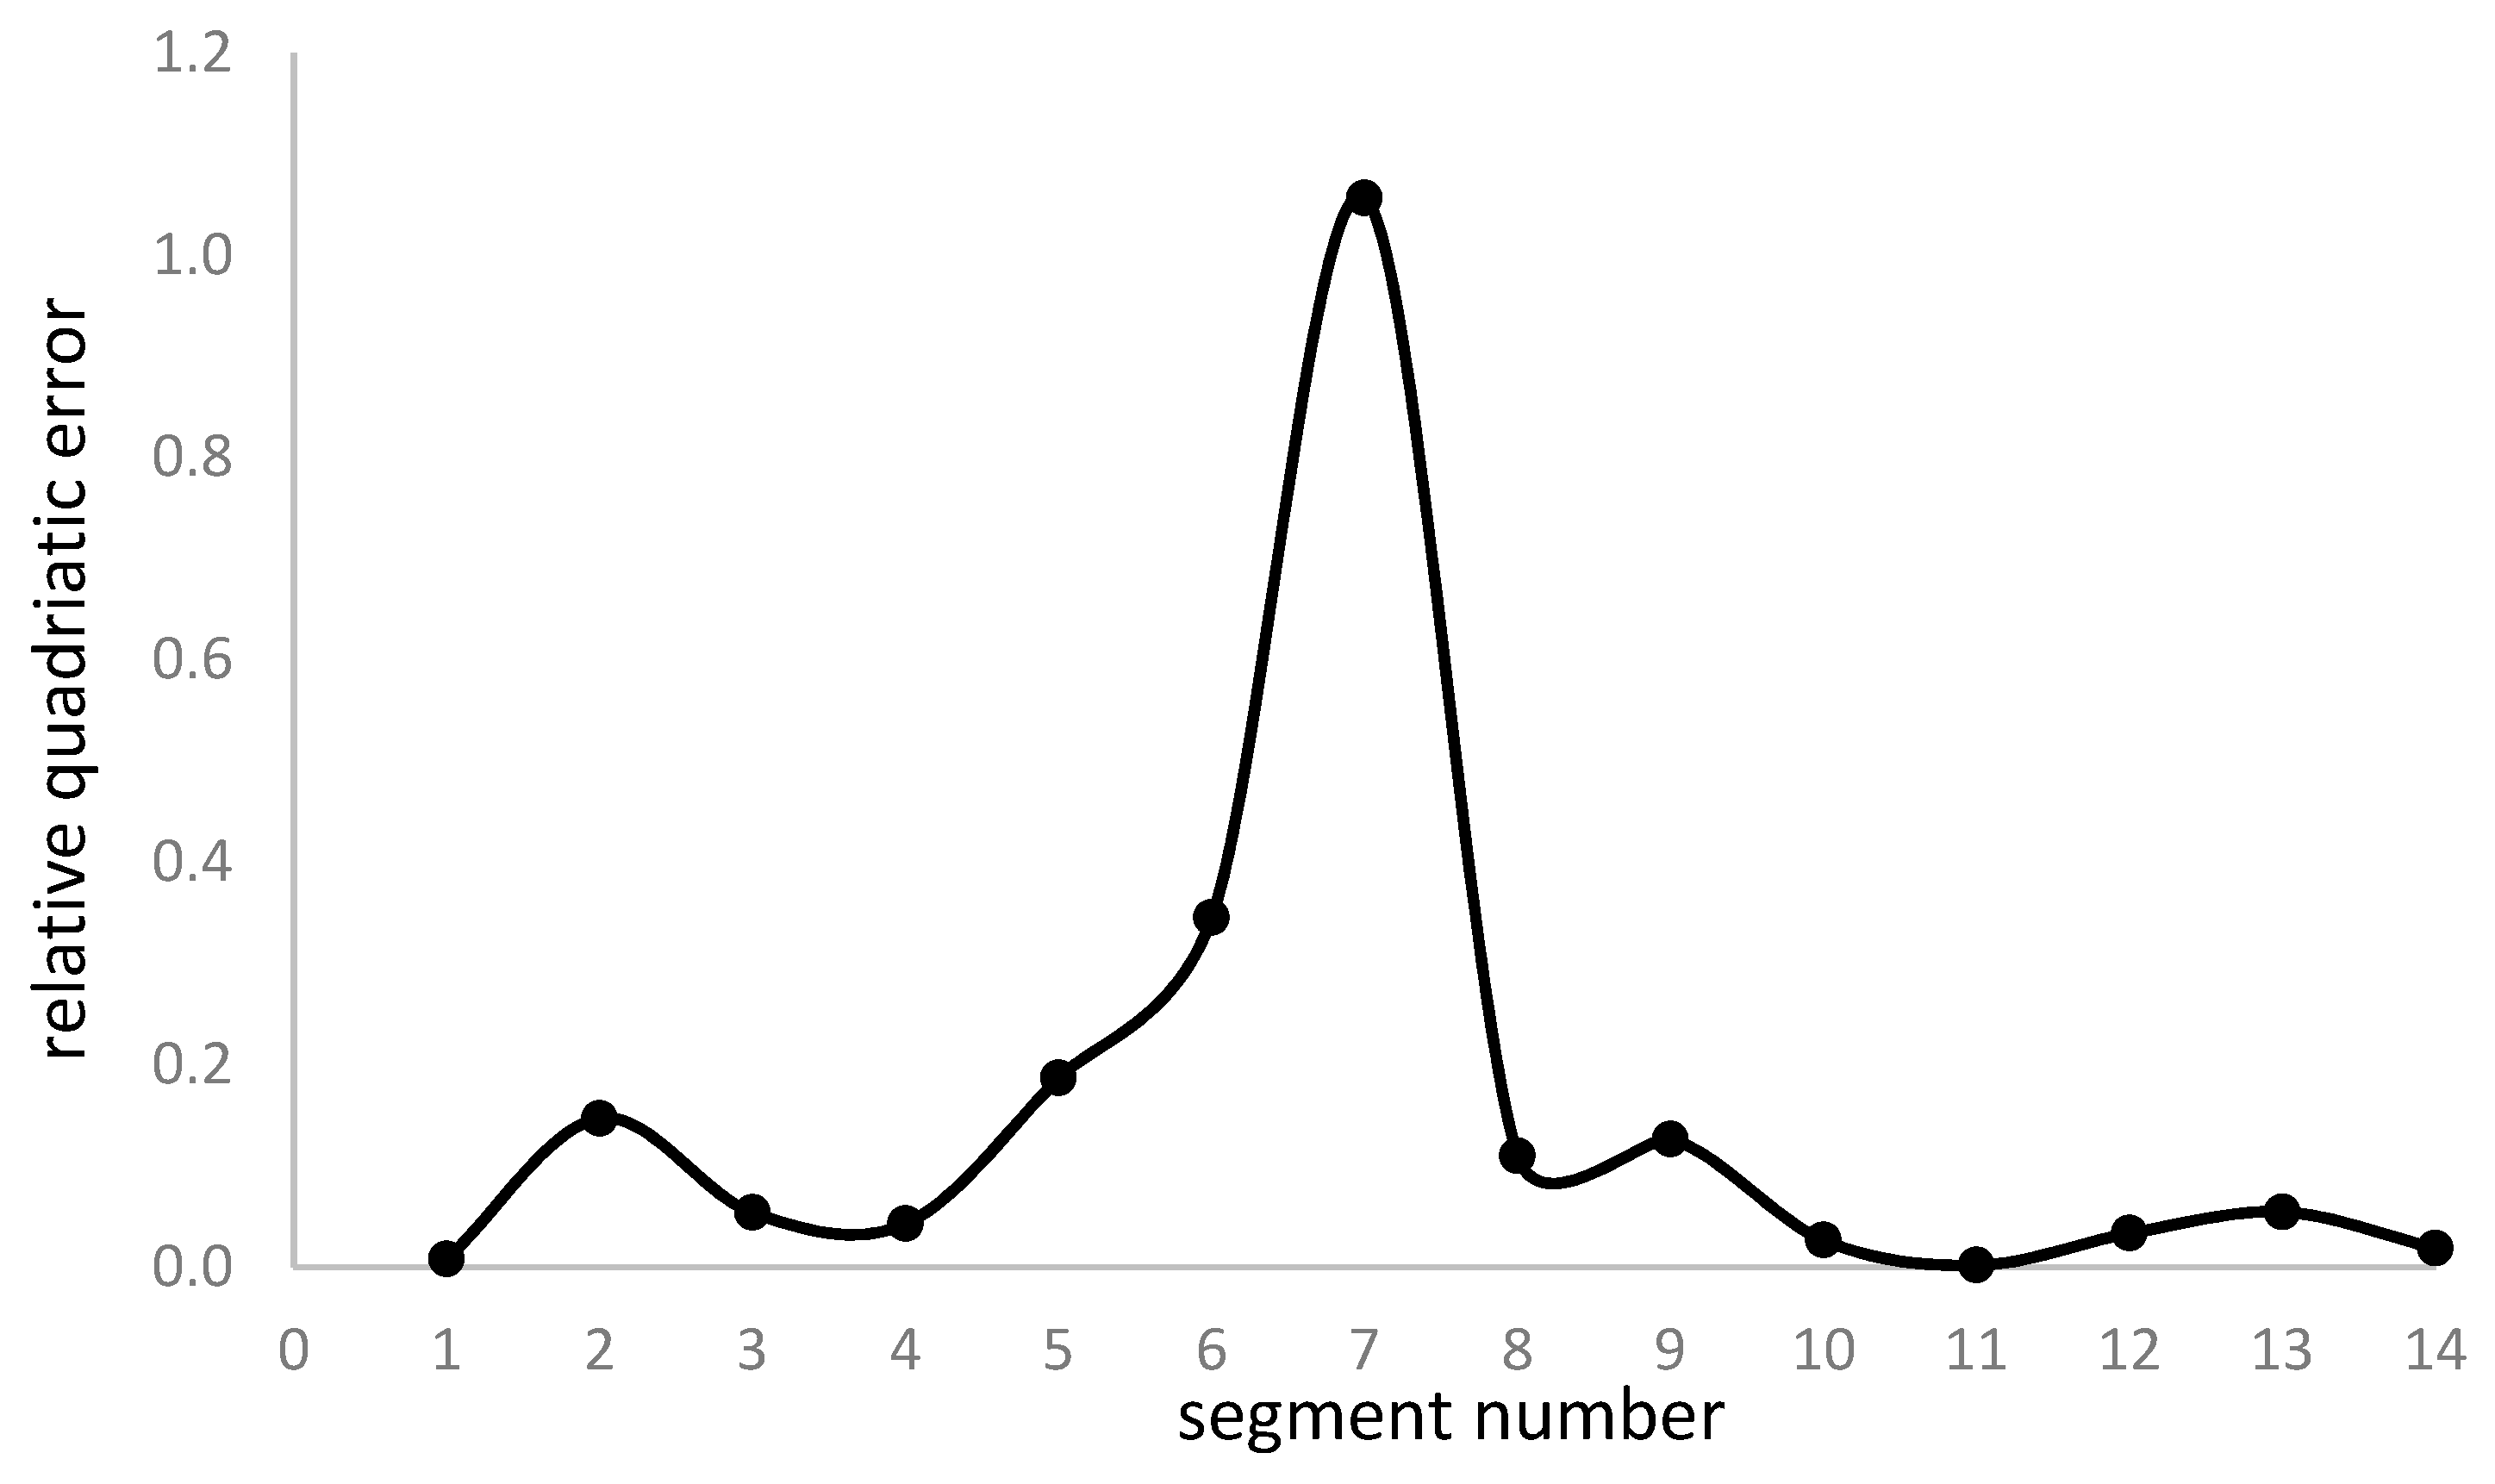
Figure 7 shows the relative quadratic error after applying the correction factor to the vehicle speed.
We notice the relative error is low, 0.16 on average, and below 0.4 for all segments except number 7, corresponding to the maximum vehicle speed during the uphill road section. The low error warrants the improvement of battery management since the energy consumption rate lowers. The correction algorithm may modify the vehicle speed until reaching the expected relative error to reduce the deviation in segment 7 to match the average value; nevertheless, if the resulting vehicle speed is too low for warrantying secure driving conditions, the program maintains the correction factor despite the vehicle speed penalizes the global energy consumption and the battery power management.
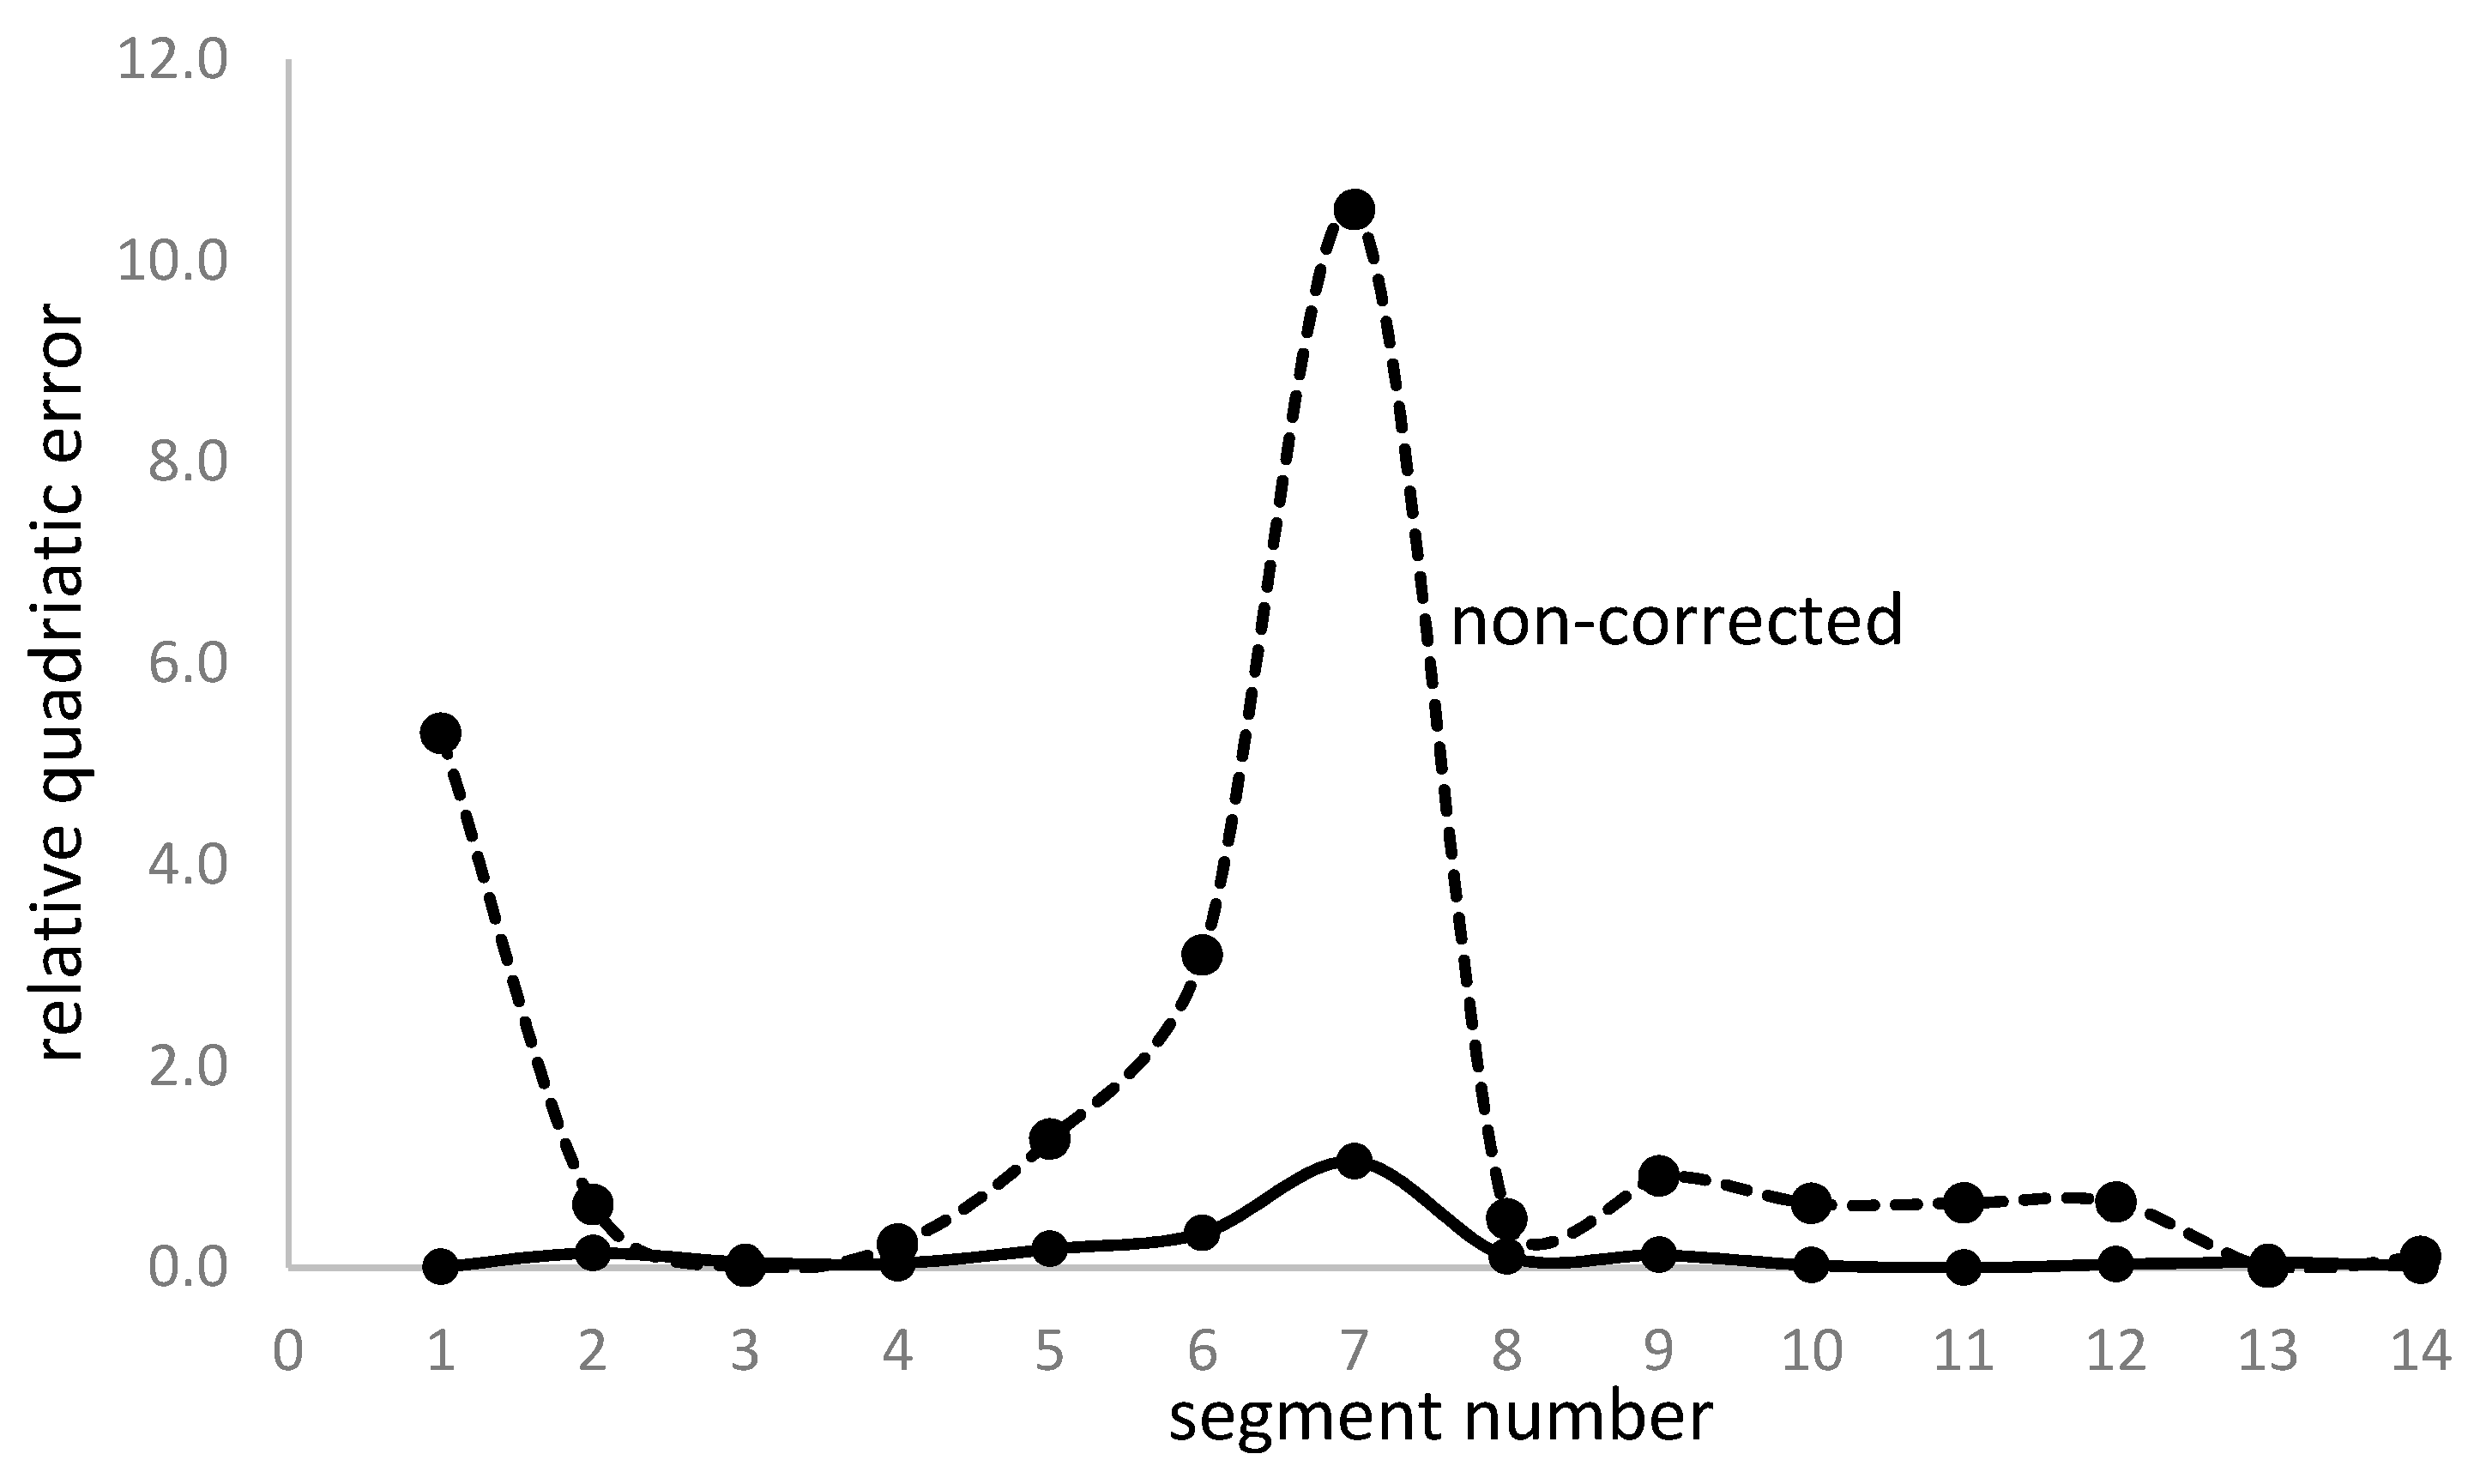
Now, comparing the relative quadratic error for corrected and non-corrected vehicle speed, we have (
Figure 8):
We observe a noticeable reduction in the relative quadratic error when applying the vehicle speed lowering, a sign of the effectiveness of the proposed action on the energy consumption rate.
To reinforce the analysis developed for the previous urban route, we ran a second test in a flat-terrain urban route with different segment numbers and vehicle speeds.
Figure 9 shows the driving profile of the urban route for the second test.
We divide this second urban route into 9 segments for the same global distance of 17.1 km (10.7 miles).
Table 4 shows the distance distribution for the one-way route. We obtain the values averaging data from a statistical analysis of daily trips run by drivers in urban zones [
66].
The average value of this second test for the whole route is 57.9 km/h (36.2 mph).
Figure 10 shows the evolution of the coefficient
Co as a function of the initial segment distance and starting vehicle speed.
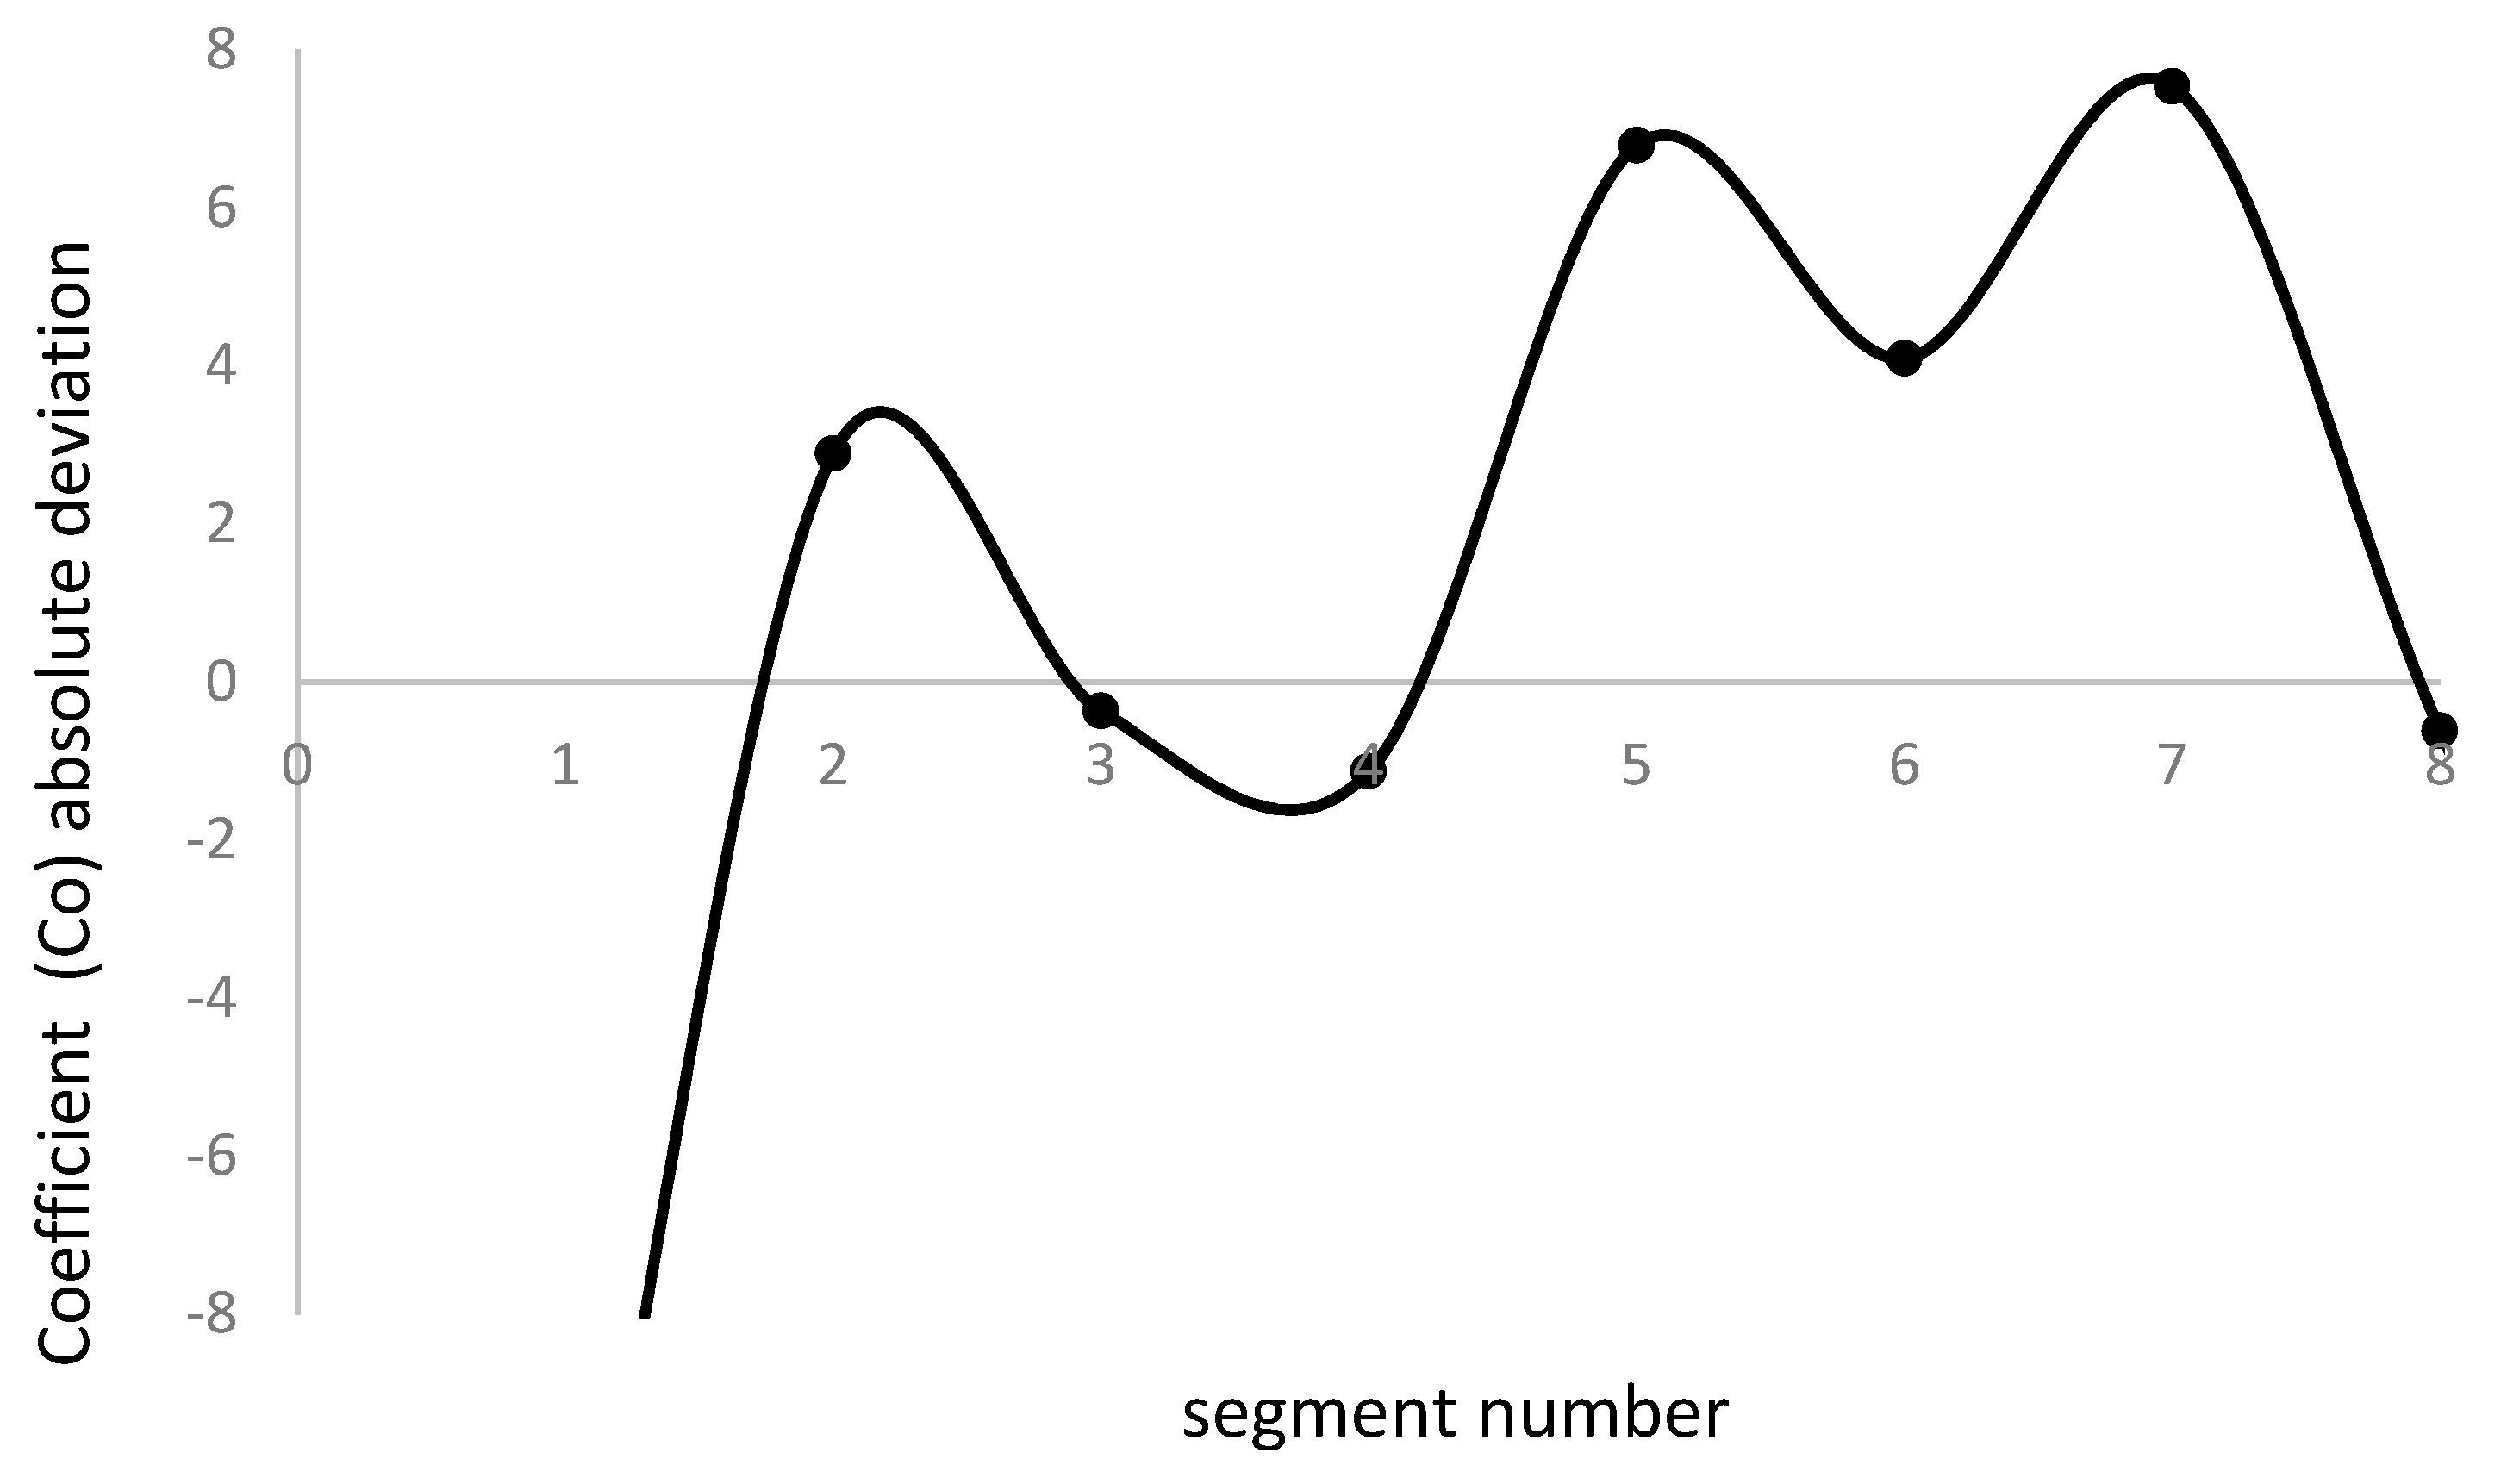
Comparing with the first test, we obtain (
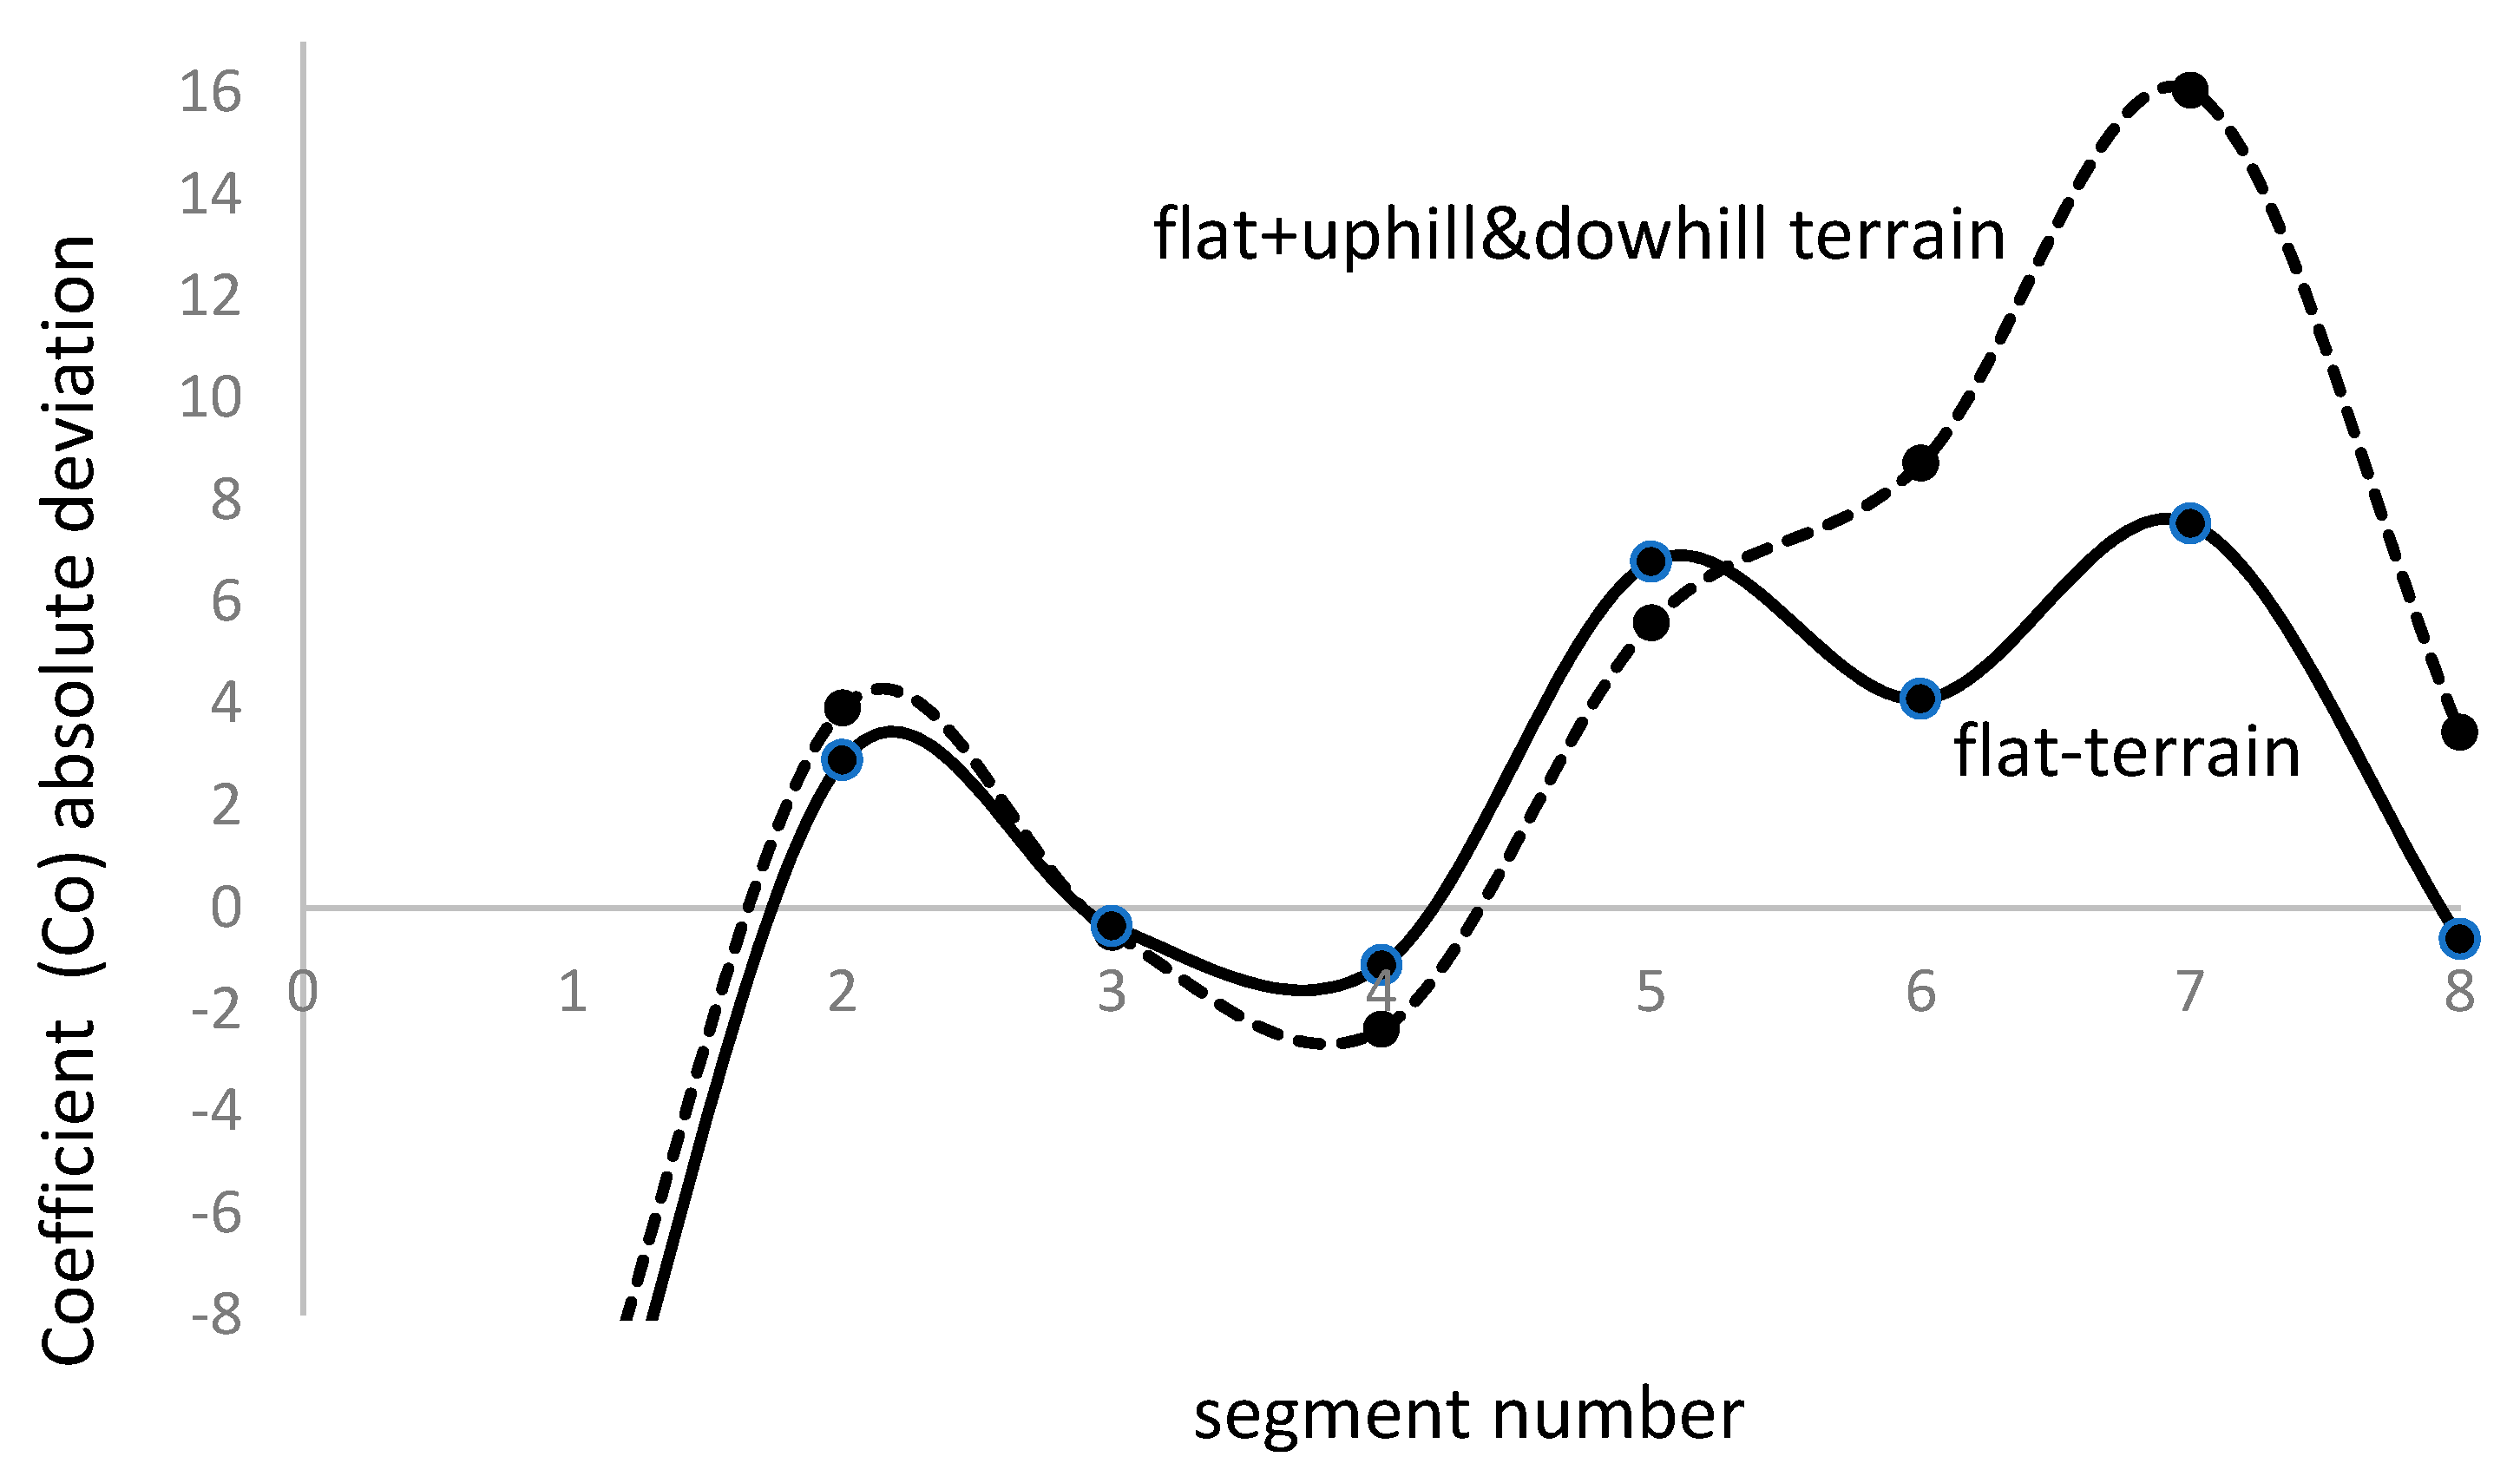
Figure 11):
We observe that the absolute deviation is very close while the terrain is flat, segments 1 to 5, but diverges as soon as the terrain changes to uphill orography. We reduce the comparison to the first 8 segments, which includes a flat-terrain and an uphill section.
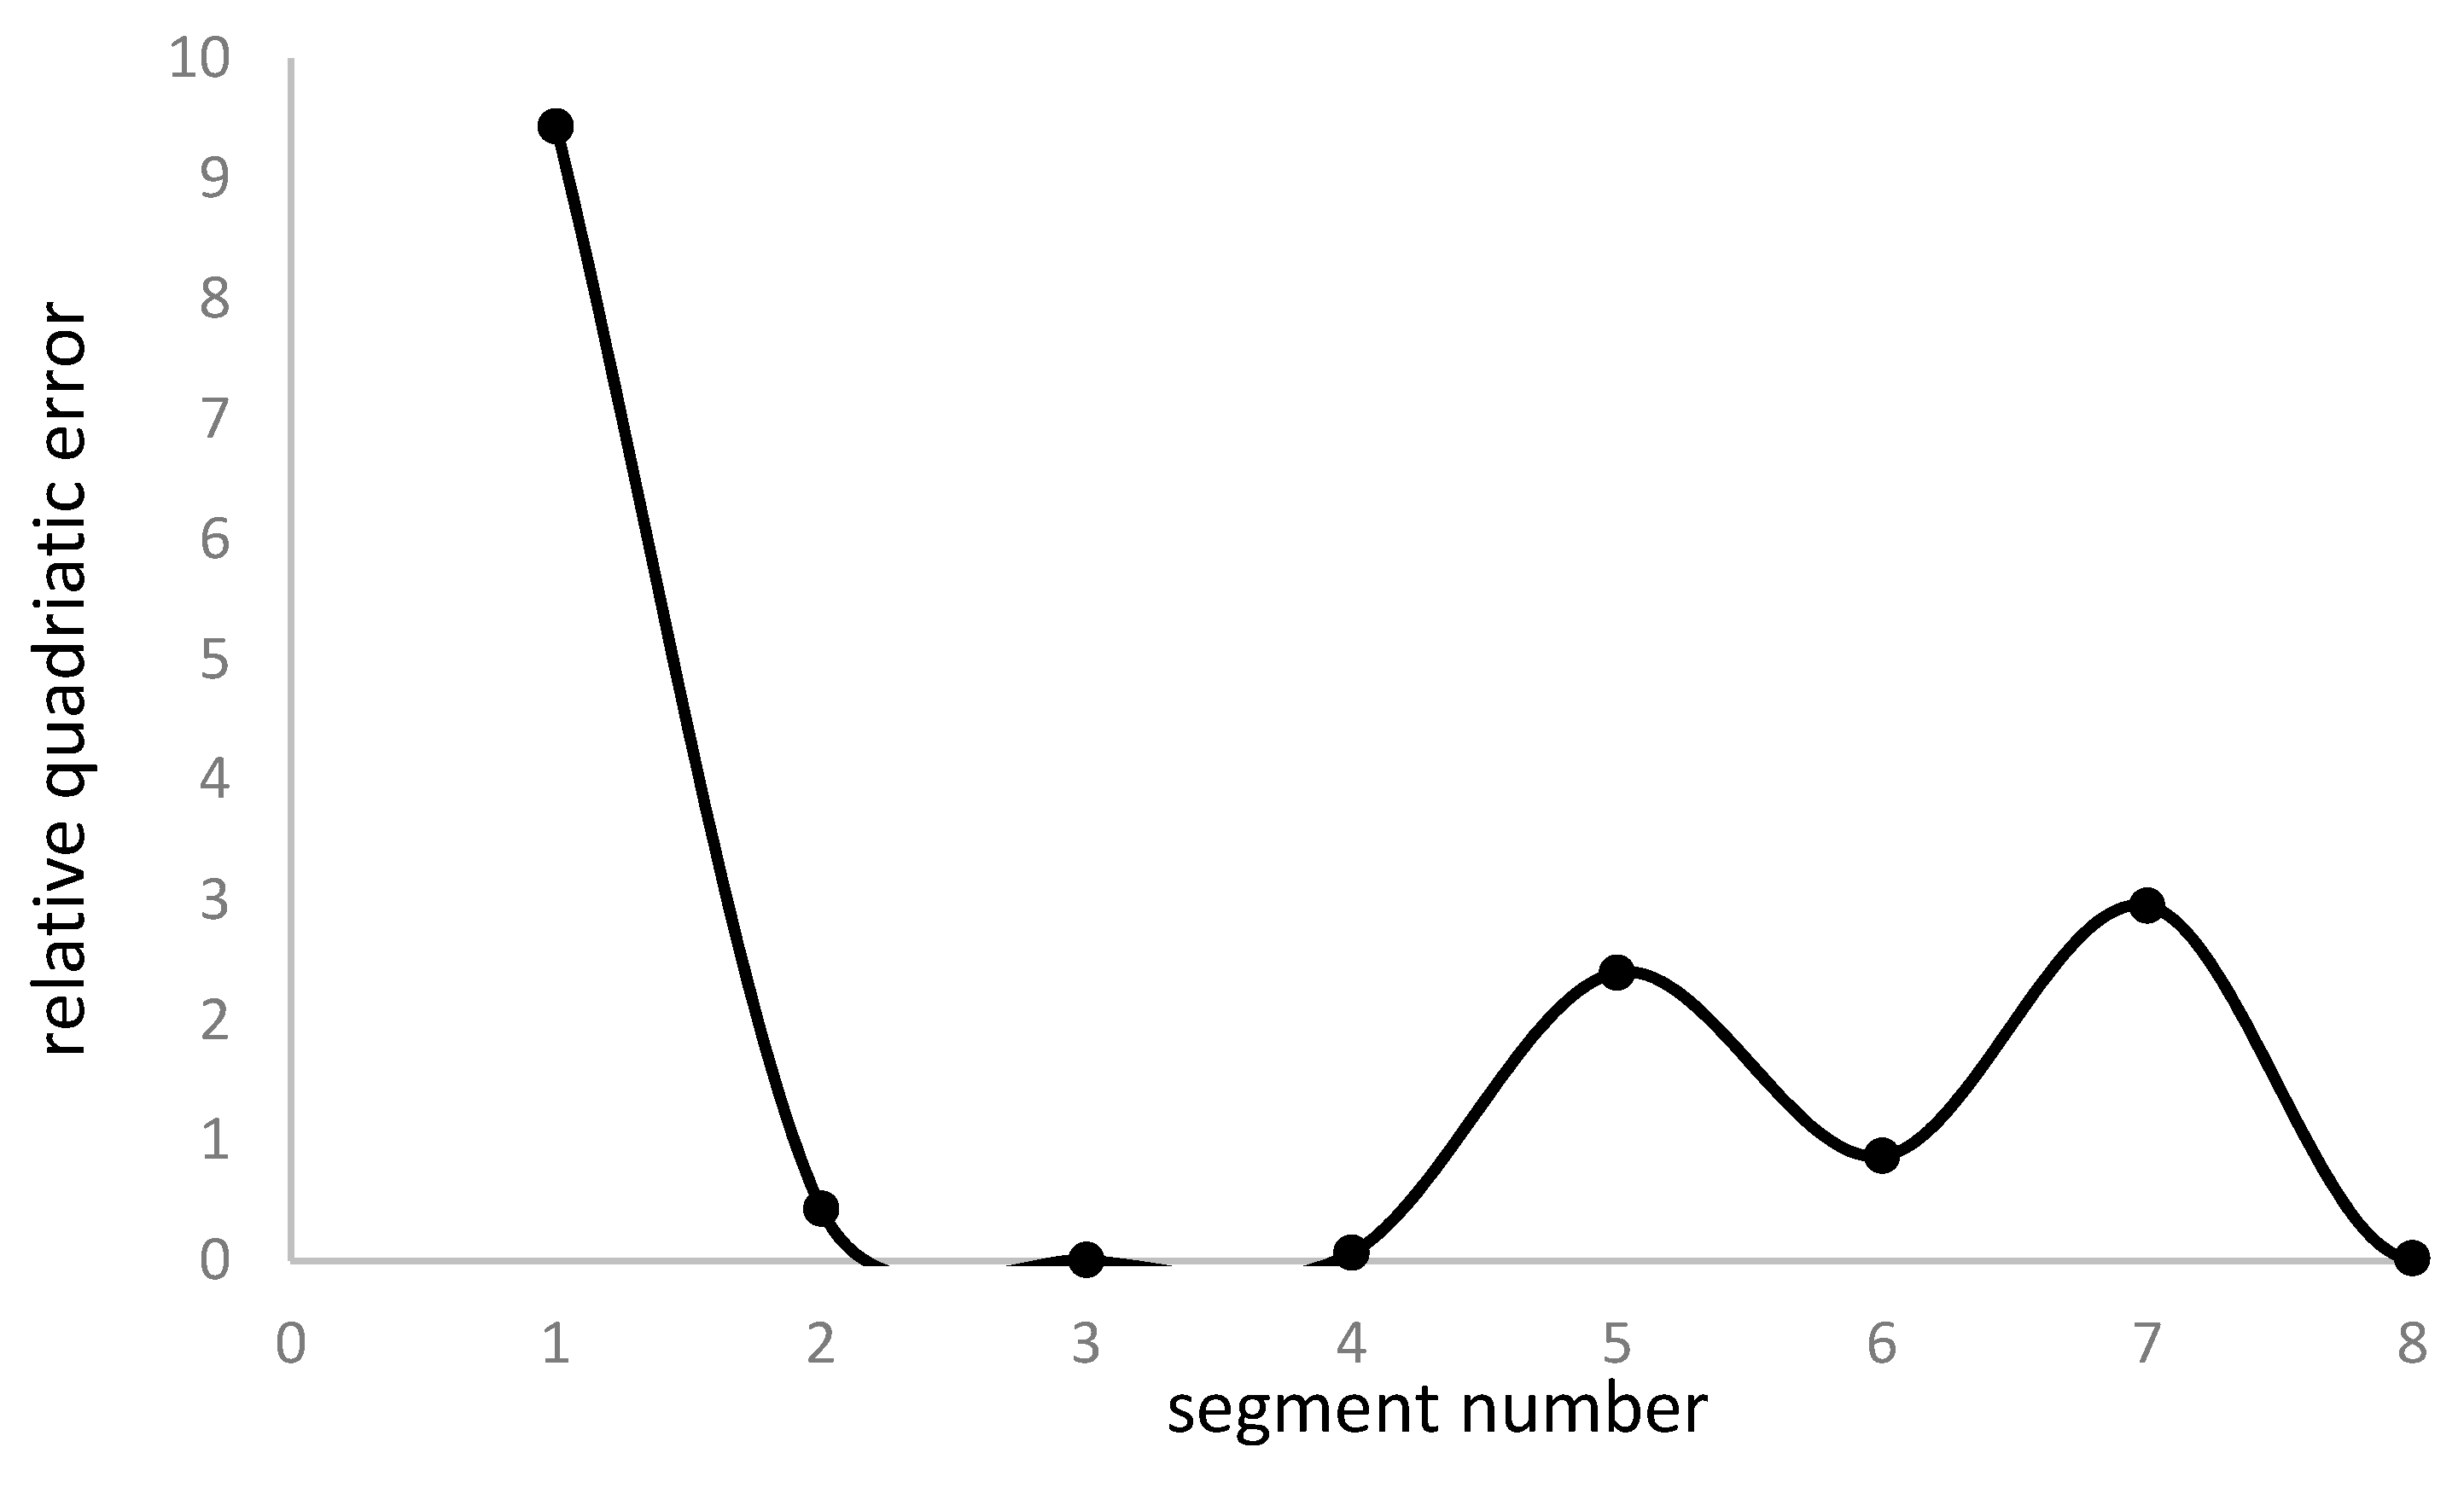
The relative quadratic error associated to the second test is shown in
Figure 12.
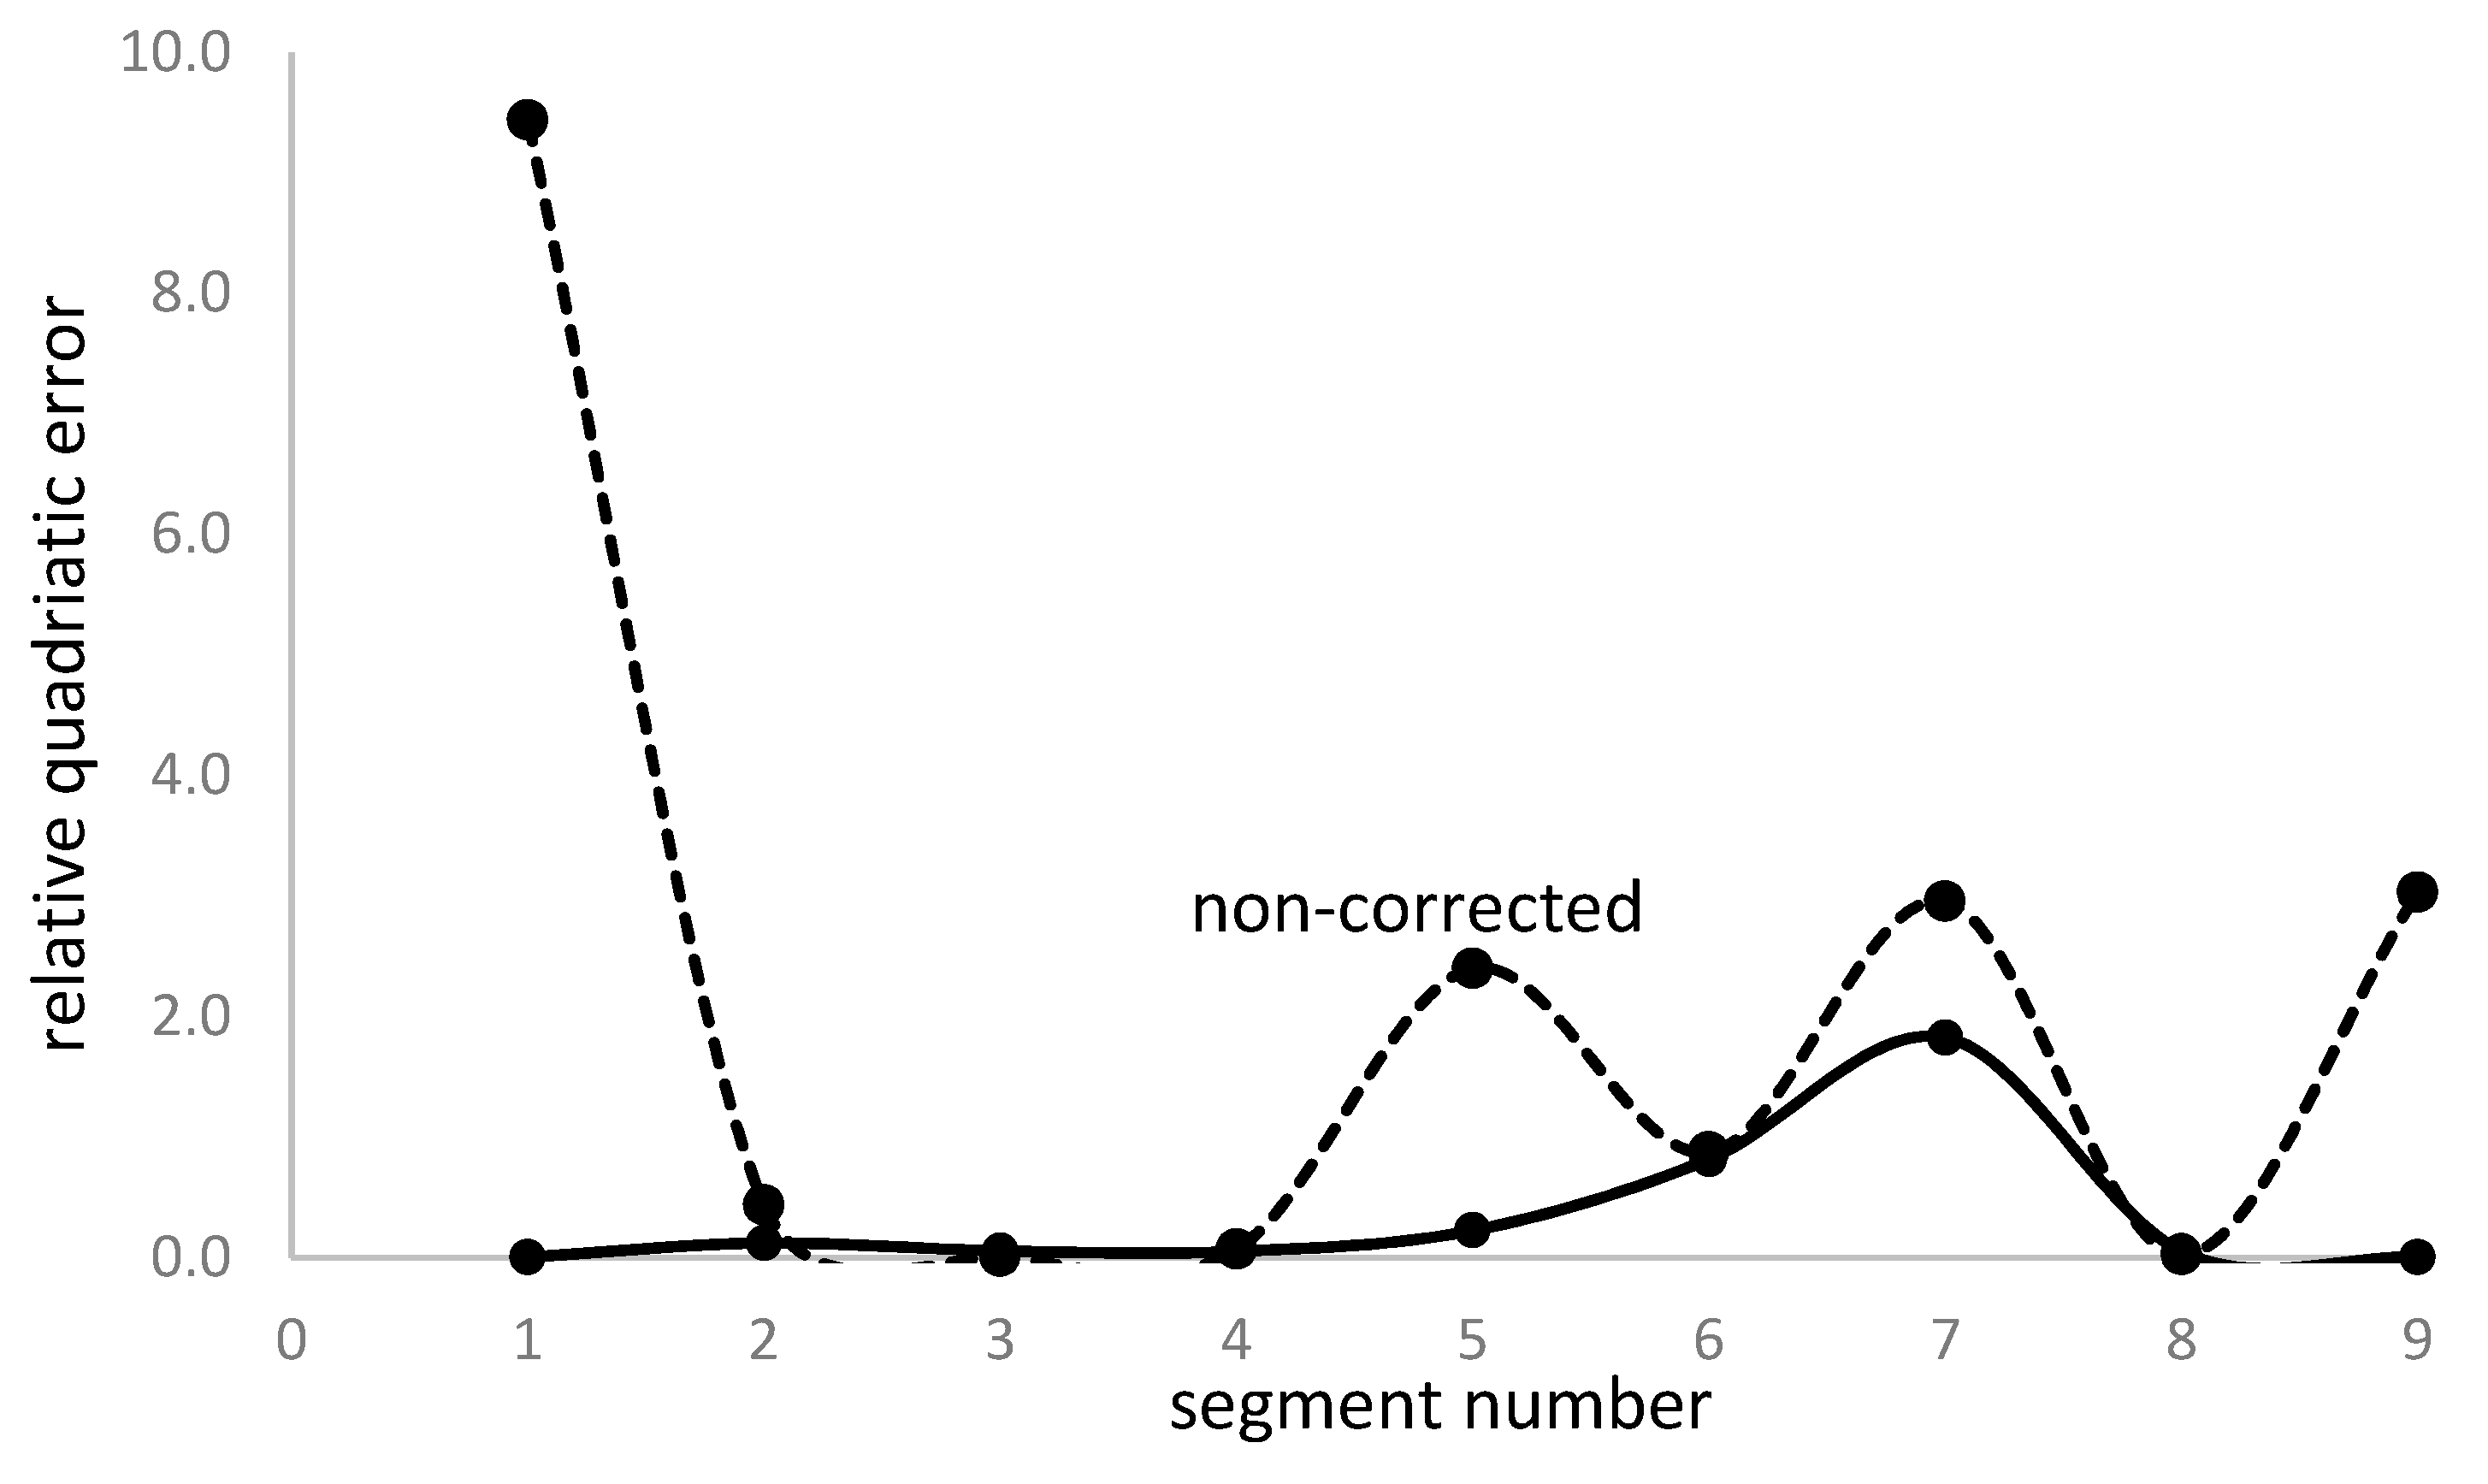
Repeating the comparative analysis for corrected and non-corrected vehicle speed, we obtain (
Figure 13):
As in the first case, the vehicle speed reduction application reduces the relative quadratic error, which means the vehicle performance and battery management are enhanced.
Experimental Tests
We run experimental tests in a light-duty vehicle of identical characteristics, as mentioned in the simulation process, to verify the validity of the proposed methodology. The first group of tests aims to determine the evolution of the
ξcomb/ξICE ratio as a function of the battery use fraction, as reflected in
Figure 2.
Since driving conditions may vary during the route, we have determined the battery fraction use as the ratio between the time the vehicle operates in electric mode and the global time. The method is applied for 213 days driving the same route at the same time to maintain regular driving conditions for the entire group of tests.
Table 5 shows the travelled distance for every battery fraction use.
Electric vehicle software provides the battery fraction use value and the traveled distance at the end of every route. Data are collected by adding the values for the selected battery fraction to obtain the travelled distance.
Energy consumption rate in experimental tests is determined from Equation 1; electric vehicle computer provides the fuel consumption and the travelled distance.
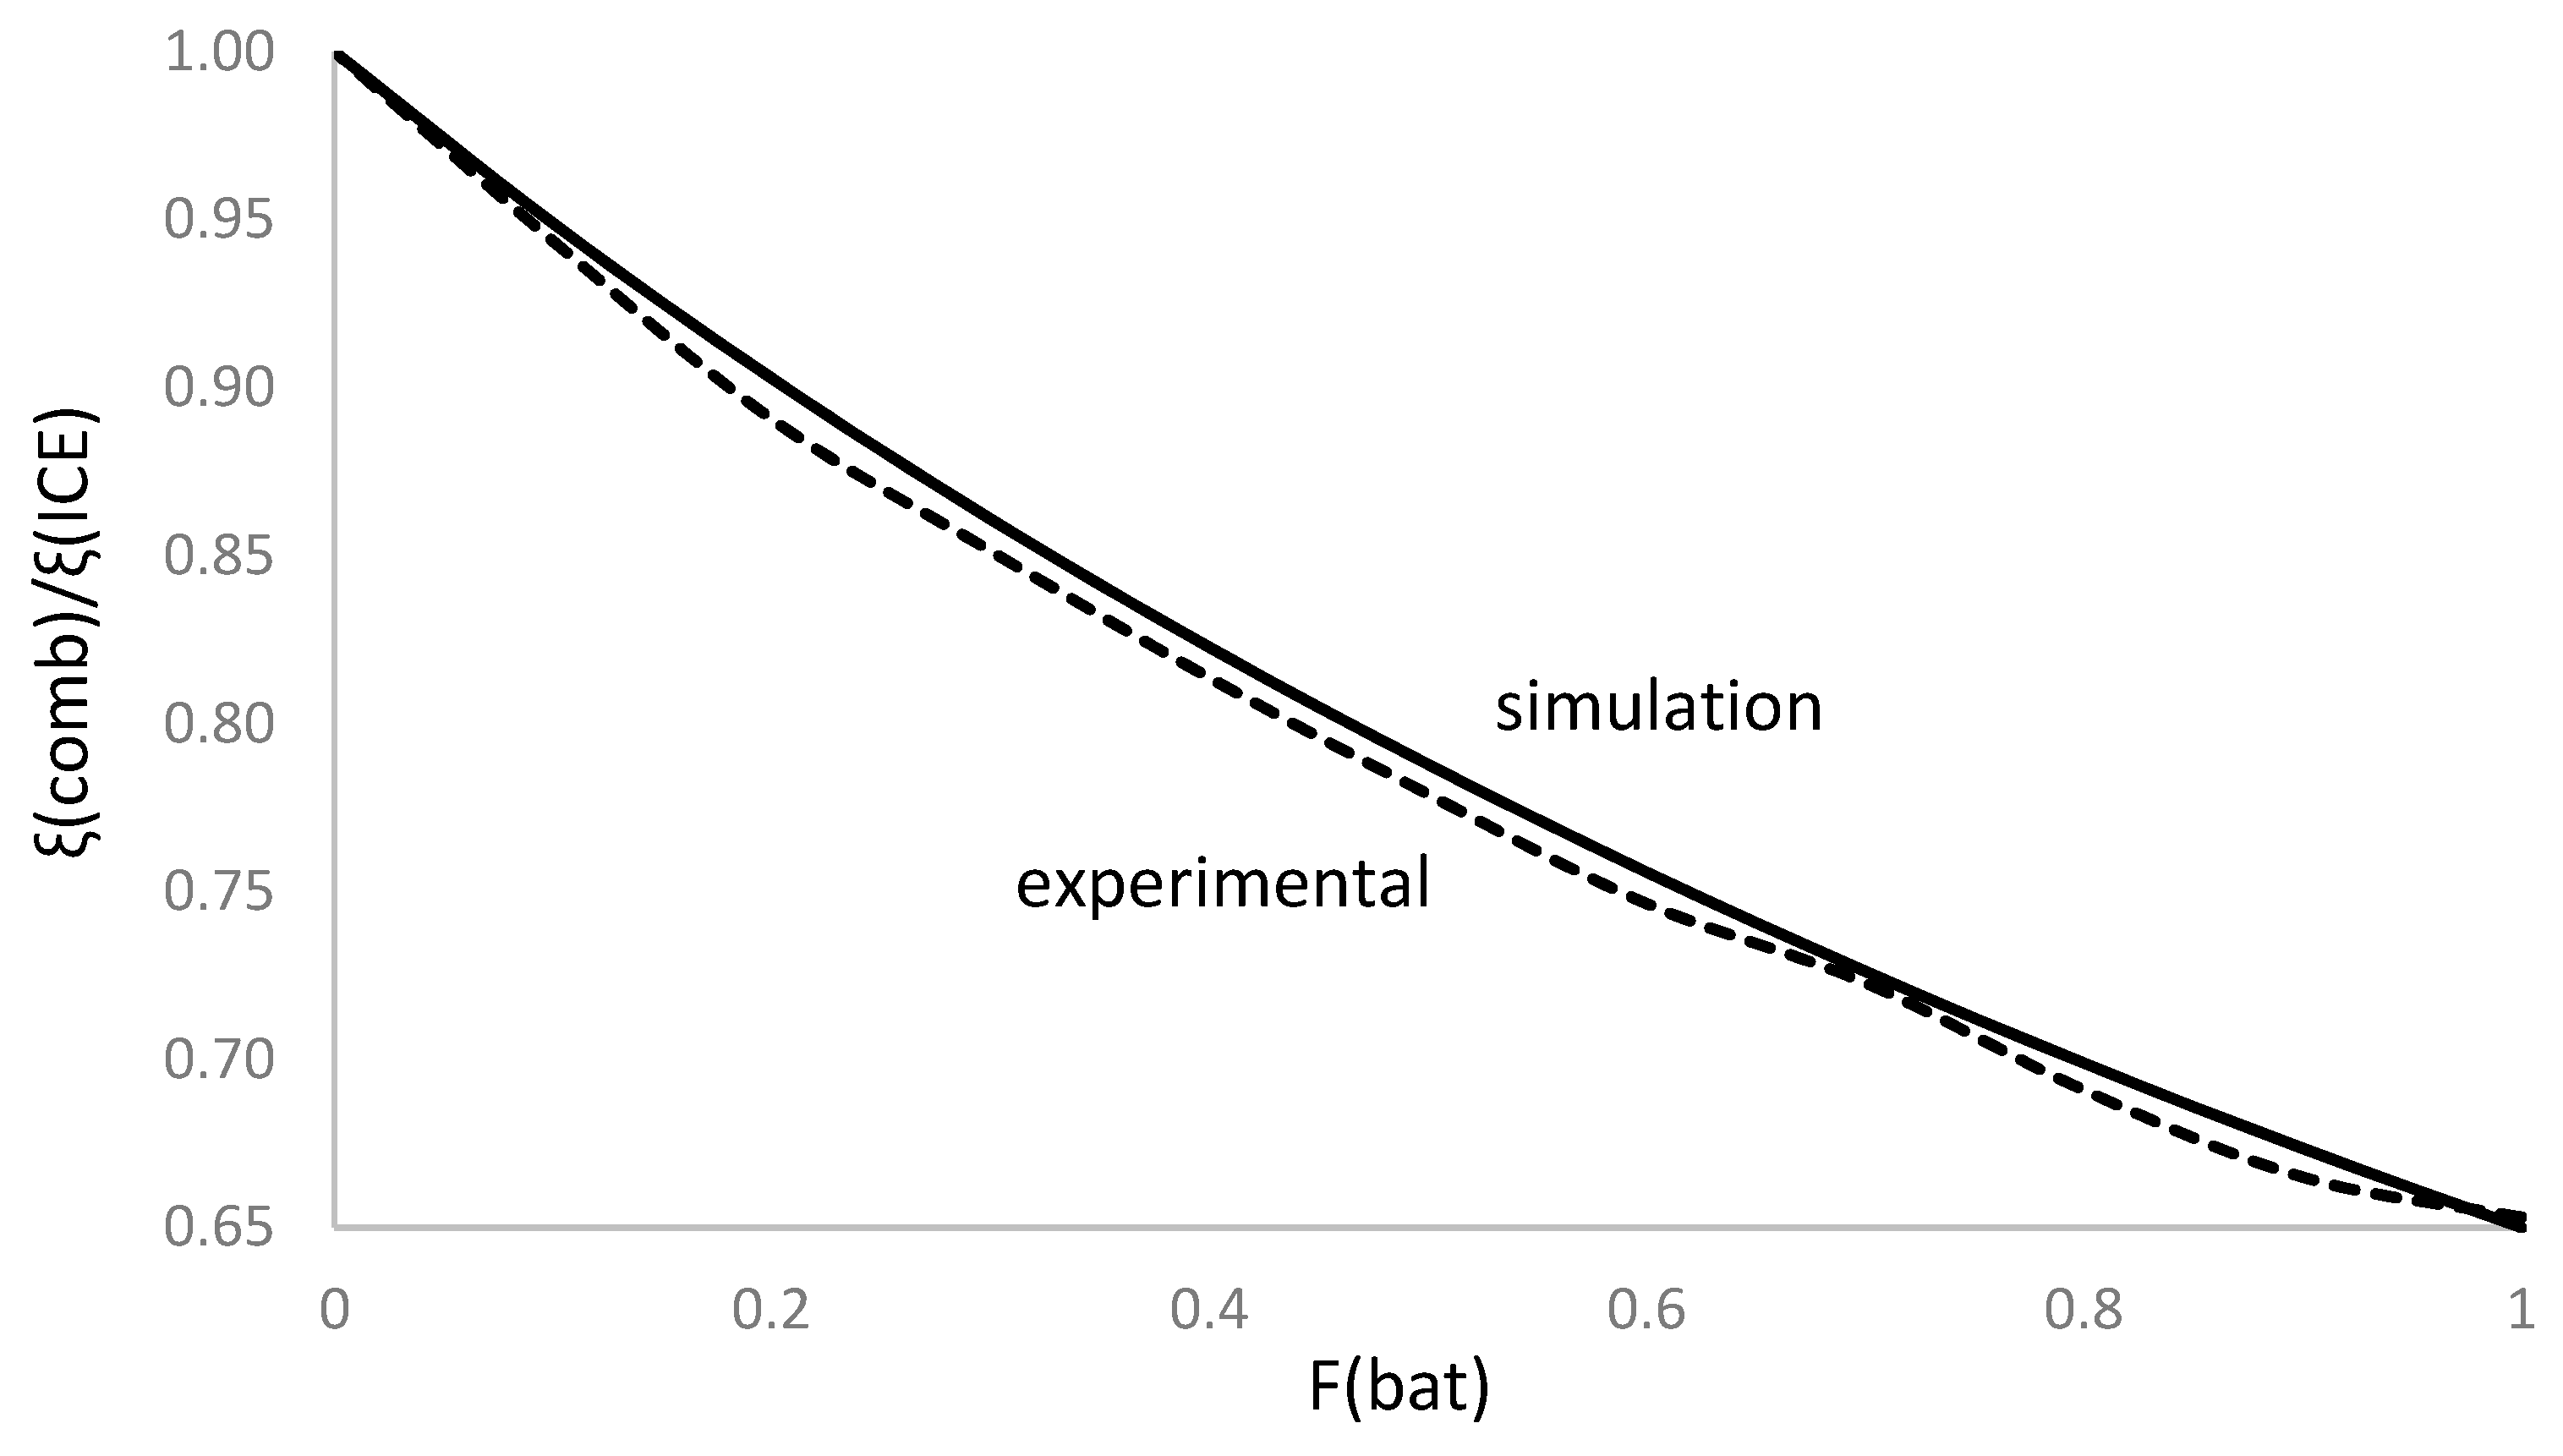
Figure 14 shows the comparative analysis between simulated data and experimental results for the energy consumption rate.
The comparative analysis in
Figure 14 shows a good agreement between experimental results and simulated data for the calculation method provided in Equation 21. The accuracy of predicting energy consumption rate is 99.1%, which proves the validity of the proposed algorithm.
Applying driving conditions established in
Figure 3, we run experimental tests to evaluate the coefficient
Co in current driving conditions. Experimental vehicle speed is set up with the cruise control system, and distance is regulated with the vehicle computer. A slight delay occurs when changing from one speed to another since the change is manual; however, the travelled distance during the transient time is low compared to the segment distance, below 4% in all cases.
Table 6 shows the transient distance for every vehicle speed change in route type I (flat plus uphill & downhill terrain).
The results of experimental tests for the coefficient
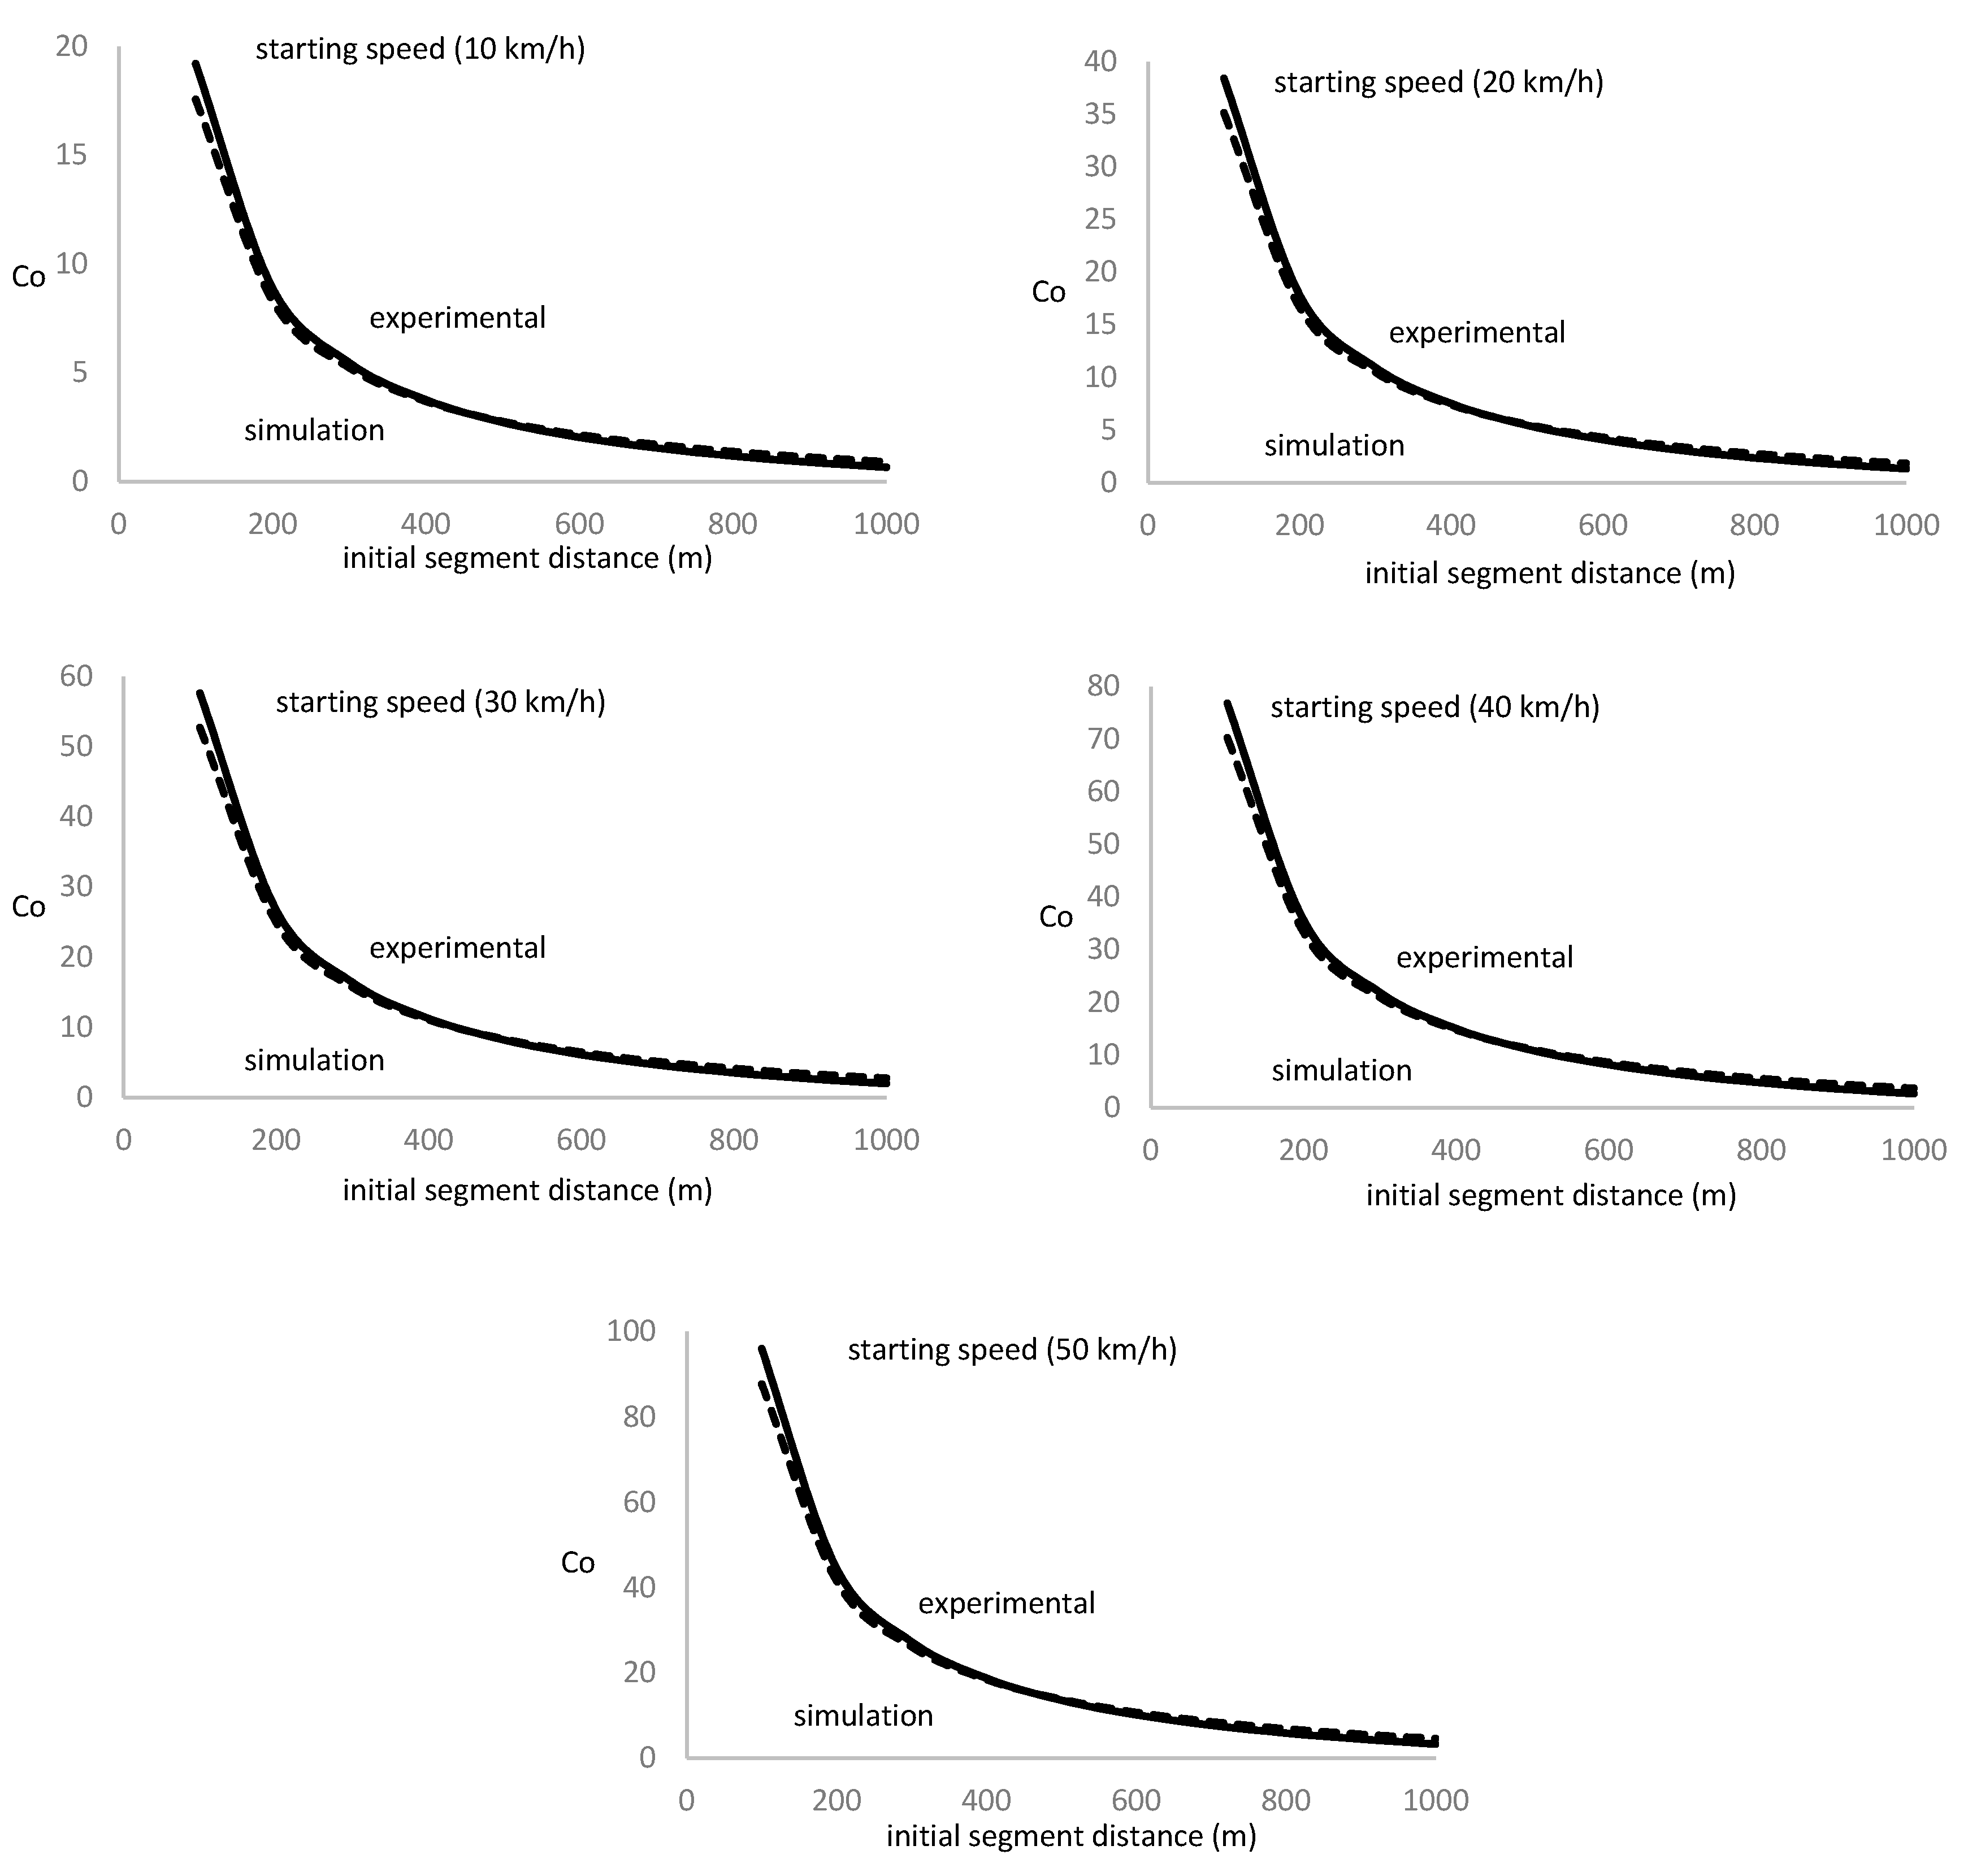
Co evolution with starting vehicle speed are shown in
Figure 15.
Experimental results show a good agreement with simulation prediction, with 94% accuracy. The comparative analysis shows a slight overestimation for low distance values at the initial traveling segment and a slight underestimation for the high one.
Conclusions
We present a protocol based on proposed algorithms focused on battery management performance enhancement. The protocol looks to minimize the energy consumption rate in hybrid electric vehicles, reducing the fuel consumption. Battery management is associated with fuel consumption and energy use, so the lower the energy use, the better the battery management.
The protocol based on the developed algorithms uses vehicle speed as the reference parameter to minimize energy use and optimize battery management. It also computes traveling distance for route segments using data from a navigation application for the specific route.
The study concludes that reducing vehicle speed by 10% in urban routes optimizes the energy consumption rate. This reduction should be increased by an additional 10% for every 10 km/h the vehicle overpasses the recommended traffic speed limit. Energy use and battery management deviation is only 0.2% from the optimum value when applying the speed reduction, while in current conditions, the deviation rises to 18%.
The protocol applies to urban and peripheral routes for daily trips. Although developed for moderate one-way traveling distances, the protocol applies to any distance, even back-and-forth daily trips.
The algorithm that rules the protocol for battery management optimization uses the vehicle mass and aerodynamic and rolling coefficient as variables to determine the minimum energy use and optimum battery management for specific driving conditions; therefore, it applies to any hybrid electric vehicle type and route characteristics.
The analysis applies to flat, uphill, and downhill terrain with maximum vehicle speed up to 90 km/h, a current value for peripheral routes in modern cities. Vehicle speed in downtown urban routes is limited to 60 km/h in the present study.
The developed protocol has been tested for starting vehicle speed from 10 to 50 km/h, considering the three typical driving patterns, aggressive, moderate, and conservative, corresponding to sport, normal, and eco driving modes set up by car manufacturers.
Funding
This research received no external funding.
Author contributions
not applicable.
Data Availability Statement
Data are available from author on request.
Acknowledgments
not applicable.
Conflicts of Interest
The authors declare no conflict of interest.
References
- Boulanger, A.G.; Chu, A.C.; Maxx, S.; Waltz, D.L. Vehicle Electrification: Status and Issues. Proc. IEEE 2011, 99, 1116–1138. [Google Scholar] [CrossRef]
- Sierzchula, W.; Bakker, S.; Maat, K.; van Wee, B. The influence of financial incentives and other socio-economic factors on electric vehicle adoption. Energy Policy 2014, 68, 183–194. [Google Scholar] [CrossRef]
- Hardman, S.; Fleming, K.; Kare, E.; Ramadan, M. A perspective on equity in the transition to electric vehicle. MIT Sci. Policy Rev. 2021, 46–54. [Google Scholar] [CrossRef]
- National Research Council, Transportation Research Board, Division on Engineering, Physical Sciences, Board on Energy, Environmental Systems, & Committee on Overcoming Barriers to Electric-Vehicle Deployment. (2015). Overcoming barriers to deployment of plug-in electric vehicles. National Academies Press.
- National Research Council, Transportation Research Board, Division on Engineering, Physical Sciences, Board on Energy, Environmental Systems, & Committee on Overcoming Barriers to Electric-Vehicle Deployment. (2013). Overcoming barriers to electric-vehicle deployment: Interim report. National Academies Press.
- Coffman, M.; Bernstein, P.; Wee, S. Electric vehicles revisited: A review of factors that affect adoption. Transp. Rev. 2017, 37, 79–93. [Google Scholar] [CrossRef]
- Wolbertus, R.; Kroesen, M.; van den Hoed, R.; Chorus, C.G. Policy effects on charging behaviour of electric vehicle owners and on purchase intentions of prospective owners: Natural and stated choice experiments. Transp. Res. Part D Transp. Environ. 2018, 62, 283–297. [Google Scholar] [CrossRef]
- Reynolds, C.; Kandlikar, M. How hybrid-electric vehicles are different from conventional vehicles: The effect of weight and power on fuel consumption. Environ. Res. Lett. 2007, 2, 014003. [Google Scholar] [CrossRef]
- Berjoza, D.; Jurgena, I. Effects of change in the weight of electric vehicles on their performance characteristics. Agron. Res. 2017, 15. [Google Scholar]
- Jung, H. Fuel Economy of Plug-In Hybrid Electric and Hybrid Electric Vehicles: Effects of Vehicle Weight, Hybridization Ratio and Ambient Temperature. World Electr. Veh. J. 2020, 11, 31. [Google Scholar] [CrossRef]
- Roshandel, E.; Mahmoudi, A.; Kahourzade, S.; Yazdani, A.; Shafiullah, G. Losses in Efficiency Maps of Electric Vehicles: An Overview. Energies 2021, 14, 7805. [Google Scholar] [CrossRef]
- Ruan, J.; Walker, P.; Zhang, N. A comparative study energy consumption and costs of battery electric vehicle transmissions. Appl. Energy 2016, 165, 119–134. [Google Scholar] [CrossRef]
- Hengst, J.; Werra, M.; Küçükay, F. Evaluation of Transmission Losses of Various Battery Electric Vehicles. Automot. Innov. 2022, 5, 388–399. [Google Scholar] [CrossRef]
- Badin, F.; Le Berr, F.; Briki, H.; Dabadie, J.-C.; Petit, M.; Magand, S.; Condemine, E. Evaluation of EVs energy consumption influencing factors, driving conditions, auxiliaries use, driver's aggressiveness. World Electr. Veh. J. 2013, 6, 112–123. [Google Scholar] [CrossRef]
- Braun, A.; Rid, W. The influence of driving patterns on energy consumption in electric car driving and the role of regenerative braking. Transp. Res. Procedia 2017, 22, 174–182. [Google Scholar] [CrossRef]
- Wang, H.; Zhang, X.; Ouyang, M. Energy consumption of electric vehicles based on real-world driving patterns: A case study of Beijing. Appl. Energy 2015, 157, 710–719. [Google Scholar] [CrossRef]
- Zhang, J.; Wang, Z.; Liu, P.; Zhang, Z. Energy consumption analysis and prediction of electric vehicles based on real-world driving data. Appl. Energy 2020, 275, 115408. [Google Scholar] [CrossRef]
- Ma, H.; Xie, H.; Huang, D.; Xiong, S. Effects of driving style on the fuel consumption of city buses under different road conditions and vehicle masses. Transp. Res. Part D Transp. Environ. 2015, 41, 205–216. [Google Scholar] [CrossRef]
- Galvin, R. Energy consumption effects of speed and acceleration in electric vehicles: Laboratory case studies and implications for drivers and policymakers. Transp. Res. Part D Transp. Environ. 2017, 53, 234–248. [Google Scholar] [CrossRef]
- Graba, M.; Mamala, J.; Bieniek, A.; Sroka, Z. Impact of the acceleration intensity of a passenger car in a road test on energy consumption. Energy 2021, 226, 120429. [Google Scholar] [CrossRef]
- Ahn, K.; Rakha, H.; Trani, A.; Van Aerde, M. Estimating Vehicle Fuel Consumption and Emissions based on Instantaneous Speed and Acceleration Levels. J. Transp. Eng. 2002, 128, 182–190. [Google Scholar] [CrossRef]
- Wu, X.; Freese, D.; Cabrera, A.; Kitch, W.A. Electric vehicles’ energy consumption measurement and estimation. Transp. Res. Part D Transp. Environ. 2015, 34, 52–67. [Google Scholar] [CrossRef]
- Wager, G.; Whale, J.; Braunl, T. Driving electric vehicles at highway speeds: The effect of higher driving speeds on energy consumption and driving range for electric vehicles in Australia. Renew. Sustain. Energy Rev. 2016, 63, 158–165. [Google Scholar] [CrossRef]
- Wang, J.; Besselink, I.; Nijmeijer, H. Electric Vehicle Energy Consumption Modelling and Prediction Based on Road Information. World Electr. Veh. J. 2015, 7, 447–458. [Google Scholar] [CrossRef]
- Driving modes available in electric vehicles. Electric Vehicles.Sep 30, 2021 Driving modes available in electric vehicles (iwheels.co) [Accessed online: 03/04/2024].
- Karanam, V.; Davis, A.; Sugihara, C.; Sutton, K.; Tal, G. From shifting gears to changing modes: The impact of driver inputs on plug-in hybrid electric vehicle energy use & emissions. Transp. Res. Interdiscip. Perspect. 2022, 14, 100597. [Google Scholar] [CrossRef]
- The Difference Between Driving Modes Explained. The Difference Between Driving Modes Explained | Motorama [Accessed online: 03/04/2024].
- EV Explainer: Do driving modes matter in electric vehicles?. EV Explainer: Do driving modes matter in electric vehicles? (thedriven.io) [Accessed online: 03/04/2024].
- Sugihara, C.; Sutton, K.; Davis, A.; Karanam, V.; Tal, G. From sport to eco: A case study of driver inputs on electric vehicle efficiency. Transp. Res. Part F Traffic Psychol. Behav. 2021, 82, 412–428. [Google Scholar] [CrossRef]
- Lipu, M.H.; Hannan, M.; Karim, T.F.; Hussain, A.; Saad, M.H.M.; Ayob, A.; Miah, S.; Mahlia, T.I. Intelligent algorithms and control strategies for battery management system in electric vehicles: Progress, challenges and future outlook. J. Clean. Prod. 2021, 292, 126044. [Google Scholar] [CrossRef]
- Saleeb, H.; Sayed, K.; Kassem, A.; Mostafa, R. Power Management Strategy for Battery Electric Vehicles. IET Electr. Syst. Transp. 2019, 9, 65–74. [Google Scholar] [CrossRef]
- Mishra, S., Swain, S.C., & Samantaray, R.K. (2021, October). A Review on Battery Management system and its Application in Electric vehicle. In 2021 International Conference on Advances in Computing and Communications (ICACC) (pp. 1-6). IEEE.
- Brandl, M.; Gall, H.; Wenger, M.; Lorentz, V.; Giegerich, M.; Baronti, F.; Fantechi, G.; Fanucci, L.; Roncella, R.; Saletti, R.; et al. Batteries and battery management systems for electric vehicles. In Proceedings of the 2012 Design, Automation and Test in Europe Conference & Exhibition (DATE), Dresden, Germany, 12–16 March 2012; pp. 1–6. [Google Scholar]
- Sakhdari, B.; Azad, N. An Optimal Energy Management System for Battery Electric Vehicles. IFAC-PapersOnLine 2015, 48, 86–92. [Google Scholar] [CrossRef]
- Hannan, M.A.; Hoque, M.D.M.; Hussain, A.; Yusof, Y.; Ker, A.P.J. State-of-the-Art and Energy Management System of Lithium-Ion Batteries in Electric Vehicle Applications: Issues and Recommendations. IEEE Access 2018, 6, 19362–19378. [Google Scholar] [CrossRef]
- Habib, A.K.M.A.; Hasan, M.K.; Issa, G.F.; Singh, D.; Islam, S.; Ghazal, T.M. Lithium-Ion Battery Management System for Electric Vehicles: Constraints, Challenges, and Recommendations. Batteries 2023, 9, 152. [Google Scholar] [CrossRef]
- Lipu, M.S.H.; Al Mamun, A.; Ansari, S.; Miah, S.; Hasan, K.; Meraj, S.T.; Abdolrasol, M.G.M.; Rahman, T.; Maruf, H.; Sarker, M.R.; et al. Battery Management, Key Technologies, Methods, Issues, and Future Trends of Electric Vehicles: A Pathway toward Achieving Sustainable Development Goals. Batteries 2022, 8, 119. [Google Scholar] [CrossRef]
- Rimpas, D.; Kaminaris, S.D.; Aldarraji, I.; Piromalis, D.; Vokas, G.; Papageorgas, P.G.; Tsaramirsis, G. Energy management and storage systems on electric vehicles: A comprehensive review. Mater. Today: Proc. 2022, 61, 813–819. [Google Scholar] [CrossRef]
- Armenta-Déu, C.; Coulaud, T. Design of a control system for determining the autonomy of electric vehicles. J. Mechatron. Autom. 2023, 9, 1–16. [Google Scholar]
- Tie, S.F.; Tan, C.W. A review of energy sources and energy management system in electric vehicles. Renew. Sustain. Energy Rev. 2013, 20, 82–102. [Google Scholar] [CrossRef]
- Jinrui, N.; Fengchun, S.; Qinglian, R. A Study of Energy Management System of Electric Vehicles. 2006 IEEE Vehicle Power and Propulsion Conference; pp. 1–6.
- Hannan, M.; Azidin, F.; Mohamed, A. Multi-sources model and control algorithm of an energy management system for light electric vehicles. Energy Convers. Manag. 2012, 62, 123–130. [Google Scholar] [CrossRef]
- Aruna, P., & Vasan, P.V. (2019, August). Review on energy management system of electric vehicles. In 2019 2nd International Conference on Power and Embedded Drive Control (ICPEDC) (pp. 371-374). IEEE.
- Google Maps. Available online: http://maps.google.com/ (accessed on 10 March 2011).
- Geo Tracker. https://geo-tracker.org/en.
- Petal Maps. https://www.petalmaps.com.
- Sygic. https://www.sygic.com.
- Free Driving Directions, Traffic Reports & GPS Navigation App by Waze. Available online: https://www.waze.com/ (accessed on 22 November 2018).
- Role of Car Batteries in Hybrid Vehicles. CarBike360. Available online: https://www.carbike360.ae/articles/car-batteries-in-hybrid-vehicles (accessed on 5 April 2024).
- Automotive Electronics. Electric Vehicles and Hybrid Power Systems. EV Battery Management System (BMS). MPS. Available online: https://www.monolithicpower.com/en/automotive-electronics/electric-vehicles-and-hybrid-power-systems/ev-battery-management-systems#:~:text=Electric%20vehicles%20(Evs)%20and%20hybrid,%2C%20dependability%2C%20and%20peak%20performance (accessed on 5 April 2024).
- Toyota Hybrid - How does it works? Joe Clifford. Posted on 9 July 2020. Available online: https://mag.toyota.co.uk/how-does-toyota-hybrid-work/ (accessed on 5 April 2024).
- Hyundai. Features. Energy flow. Available online: https://www.hyundai.com/eu/models/tucson-plug-in-hybrid/features.html (accessed on 5 April 2024).
- How do the electric engines and combustion engine work together? How a Full Hybrid Works. Renault. Available online: https://www.renault.co.uk/engines-innovation/help-use-hybrid.html (accessed on 5 April 2024).
- What is an EV battery state of charge (SOC). EV Engineering. Aharon Etengoff. Posted on December 13, 2023. Available online: https://www.evengineeringonline.com/what-is-an-ev-battery-state-of-charge-soc/#:~:text=Maximizing%20performance%3A%20EV%20batteries%20deliver,%25%20to%2080%25%20SOC%20range (accessed on 5 April 2024).
- T. Hofman, C.H. Dai (2010) Energy Efficiency Analysis and Comparison of Transmission Technologies for an Electric Vehicle. Technische Universiteit Eindhoven (TU/e) Department of Mechanical Engineering, Control Systems Technology Group, PO BOX 512, 5600 MB Eindhoven, The Netherlands. Available online: https://www.iri.upc.edu/people/riera/VPPC10/vppc2010.univ-lille1.fr/uploads/PDF/papers/RT4/95-43218-final.pdf (accessed on 7 April 2024).
- Boloor, Madhur; Valderrama, Patricia; Statler, Ada; Garcia, Samuel What are electric vehicles? Efficient, for one. Electric Vehicle Basics. Posted on 31 July 2019. Available online: https://www.nrdc.org/bio/madhur-boloor/electric-vehicle-basics#:~:text=Electric%20motors%20makes%20vehicles%20substantially,for%20a%20gas%20combustion%20engine (accessed on 7 April 2024).
- Lacock, S.; du Plessis, A.A.; Booysen, M.J. Electric Vehicle Drivetrain Efficiency and the Multi-Speed Transmission Question. World Electr. Veh. J. 2023, 14, 342. [Google Scholar] [CrossRef]
- Energy losses in EV drivetrain. Department of Energy (DOE). Available online: https://www.google.com/search?client=opera&q=efficiency+of+an+electric+motor+transmission&sourceid=opera&ie=UTF-8&oe=UTF-8#ip=1 (accessed on 7 April 2024).
- Drivetrain Losses (Efficiency). X-Engineer. Available online: https://x-engineer.org/drivetrain-losses-efficiency/#:~:text=Overall%20efficiency%20of%20the%20drivetrain&text=This%20means%20that%20around%2015.9,which%20have%20a%20central%20differential (accessed on 7 April 2024).
- Motor/generator efficiency. Available online: https://www.researchgate.net/figure/Motor-generator-efficiency-37_tbl2_330251602 (accessed on 7 April 2024).
- BU-808c: Coulombic and Energy Efficiency with the Battery. Battery University. Available online: https://batteryuniversity.com/article/bu-808c-coulombic-and-energy-efficiency-with-the-battery (accessed on 7 April 2024).
- Armenta-Déu, C.; Boucheix, B. Evaluation of Lithium-Ion Battery Performance under Variable Climatic Conditions: Influence on the Driving Range of Electric Vehicles. Futur. Transp. 2023, 3, 535–551. [Google Scholar] [CrossRef]
- Armenta-Déu, C. (2024) Analysis of the performance of a light-duty hybrid electric vehicle for daily urban route under standard traffic conditions. Internal report CAD-RC/e-tech 01/24.
- Speed limit by country. Speed limits by country - Wikipedia [Accessed online: 08/04/2024].
- Worldwide Daily Driving Distance. Available online: https://www.solaronev.com/post/average-daily-driving-distance-for-passenger-vehicles#:~:text=While%20the%20EU%20also%20shows,most%20at%2037.7km%20daily (accessed on 4 April 2024).
- Armenta-Déu, C., Rincón, C.; Pedrosa, S. (2024) Analysis of driving patterns in urban zones. Project RUTW-CAM56: Sustainable urban transportation in cities. Report 01/24.
Figure 1.
Schematic representation of BMS for HEVs.
Figure 1.
Schematic representation of BMS for HEVs.
Figure 2.
Evolution of the ξcomb/ξICE ratio as a function of the battery use fraction.
Figure 2.
Evolution of the ξcomb/ξICE ratio as a function of the battery use fraction.
Figure 3.
Schematic representation of the simulated urban route.
Figure 3.
Schematic representation of the simulated urban route.
Figure 4.
Evolution of coefficient Co as a function of starting vehicle speed and initial segment distance.
Figure 4.
Evolution of coefficient Co as a function of starting vehicle speed and initial segment distance.
Figure 5.
Absolute deviation of coefficient Co.
Figure 5.
Absolute deviation of coefficient Co.
Figure 6.
Relative quadratic error for the coefficient Co.
Figure 6.
Relative quadratic error for the coefficient Co.
Figure 7.
Corrected absolute deviation of coefficient Co.
Figure 7.
Corrected absolute deviation of coefficient Co.
Figure 8.
Corrected and non-corrected relative quadratic error of coefficient Co.
Figure 8.
Corrected and non-corrected relative quadratic error of coefficient Co.
Figure 9.
Schematic representation of the simulated flat terrain urban route.
Figure 9.
Schematic representation of the simulated flat terrain urban route.
Figure 10.
Absolute deviation of coefficient Co (flat-terrain).
Figure 10.
Absolute deviation of coefficient Co (flat-terrain).
Figure 11.
Comparison of absolute deviation of coefficient Co.
Figure 11.
Comparison of absolute deviation of coefficient Co.
Figure 12.
Relative quadratic error for the coefficient Co (flat-terrain).
Figure 12.
Relative quadratic error for the coefficient Co (flat-terrain).
Figure 13.
Corrected and non-corrected relative quadratic error of coefficient Co (flat-terrain).
Figure 13.
Corrected and non-corrected relative quadratic error of coefficient Co (flat-terrain).
Figure 14.
Correlation between simulation data and experimental results of energy consumption rate for a variable fraction of battery use as a power source.
Figure 14.
Correlation between simulation data and experimental results of energy consumption rate for a variable fraction of battery use as a power source.
Figure 15.
Comparison between experimental results and simulation data of the coefficient Co for the urban route type I (flat + uphill & downhill terrain).
Figure 15.
Comparison between experimental results and simulation data of the coefficient Co for the urban route type I (flat + uphill & downhill terrain).
Table 1.
Efficiencies in a hybrid electric vehicle.
Table 1.
Efficiencies in a hybrid electric vehicle.
| ηel |
ηmech |
ηel |
ηbat |
| 0,855 |
0,65 |
0,9 |
0,95 |
Table 2.
Vehicle characteristics.
Table 2.
Vehicle characteristics.
| Mass (kg) |
1326 |
| Aerodynamic coefficient: Cx |
0.29 |
| Front area: Af (m2) |
2.52 |
Table 3.
Daily route distance distribution by segment.
Table 3.
Daily route distance distribution by segment.
| Segment |
1 |
2 |
3 |
4 |
5 |
6 |
7 |
| Distance (m) |
350 |
1550 |
950 |
850 |
1750 |
1250 |
1950 |
| Distance (miles) |
0,219 |
0,969 |
0,594 |
0,531 |
1.094 |
0,781 |
1.219 |
| Segment |
8 |
9 |
10 |
11 |
12 |
13 |
14 |
| Distance (m) |
1350 |
1450 |
1150 |
2250 |
750 |
950 |
550 |
| Distance (miles) |
0,844 |
0,906 |
0,719 |
1,406 |
0,469 |
0,594 |
0,344 |
Table 4.
Daily route distance distribution by segment.
Table 4.
Daily route distance distribution by segment.
| Segment |
1 |
2 |
3 |
4 |
5 |
6 |
7 |
8 |
9 |
| Distance (m) |
350 |
1550 |
1650 |
2250 |
2750 |
2300 |
2750 |
1750 |
1750 |
| Distance (miles) |
0,219 |
0,969 |
1,031 |
1,406 |
1,719 |
1,438 |
1,719 |
1,094 |
1,094 |
Table 5.
Test characteristics.
Table 5.
Test characteristics.
| Fbat
|
0 |
0,1 |
0,2 |
0,3 |
0,4 |
0,5 |
| Distance (m) |
99,8 |
98,0 |
101,5 |
92,8 |
94,5 |
109,4 |
| Distance (miles) |
62,3 |
61,3 |
63,4 |
58,0 |
59,1 |
68,4 |
| Fbat
|
0,6 |
0,7 |
0,8 |
0,9 |
1 |
|
| Distance (m) |
91,9 |
100,6 |
96,3 |
87,5 |
105,0 |
|
| Distance (miles) |
57,4 |
62,9 |
60,2 |
54,7 |
65,6 |
|
Table 6.
Absolute and relative transient distance in vehicle speed change (Urban route type I).
Table 6.
Absolute and relative transient distance in vehicle speed change (Urban route type I).
| Segment |
1 |
2 |
3 |
4 |
5 |
6 |
7 |
| Absolute distance (m) |
13,3 |
23,6 |
30,0 |
31,1 |
26,7 |
27,8 |
20,8 |
| Relative distance (%) |
3,8 |
1,5 |
3,2 |
3,7 |
1,5 |
2,2 |
1,1 |
| Segment |
8 |
9 |
10 |
11 |
12 |
13 |
14 |
| Absolute distance (m) |
31,7 |
29,2 |
33,3 |
48,6 |
25,0 |
24,4 |
6,1 |
| Relative distance (%) |
2,3 |
2,0 |
2,9 |
2,2 |
3,3 |
2,6 |
1,1 |
|
Disclaimer/Publisher’s Note: The statements, opinions and data contained in all publications are solely those of the individual author(s) and contributor(s) and not of MDPI and/or the editor(s). MDPI and/or the editor(s) disclaim responsibility for any injury to people or property resulting from any ideas, methods, instructions or products referred to in the content. |
© 2024 by the authors. Licensee MDPI, Basel, Switzerland. This article is an open access article distributed under the terms and conditions of the Creative Commons Attribution (CC BY) license (http://creativecommons.org/licenses/by/4.0/).
