Submitted:
10 April 2024
Posted:
11 April 2024
You are already at the latest version
Abstract
Keywords:
1. Introduction
2. Materials and Methods
2.1. Collection of Third-stage Larvae (AcL3) of A. cantonensis
2.2. Induction of Animal Models of Eosinophilic Meningitis
2.3. Cerebral Edema Determination
2.4. Measurement of Brain Water Content
2.5. Measurement of BBB Permeability
2.6. Western blot
2.7. Gelatin zymography
2.8. Statistical analysis
3. Results
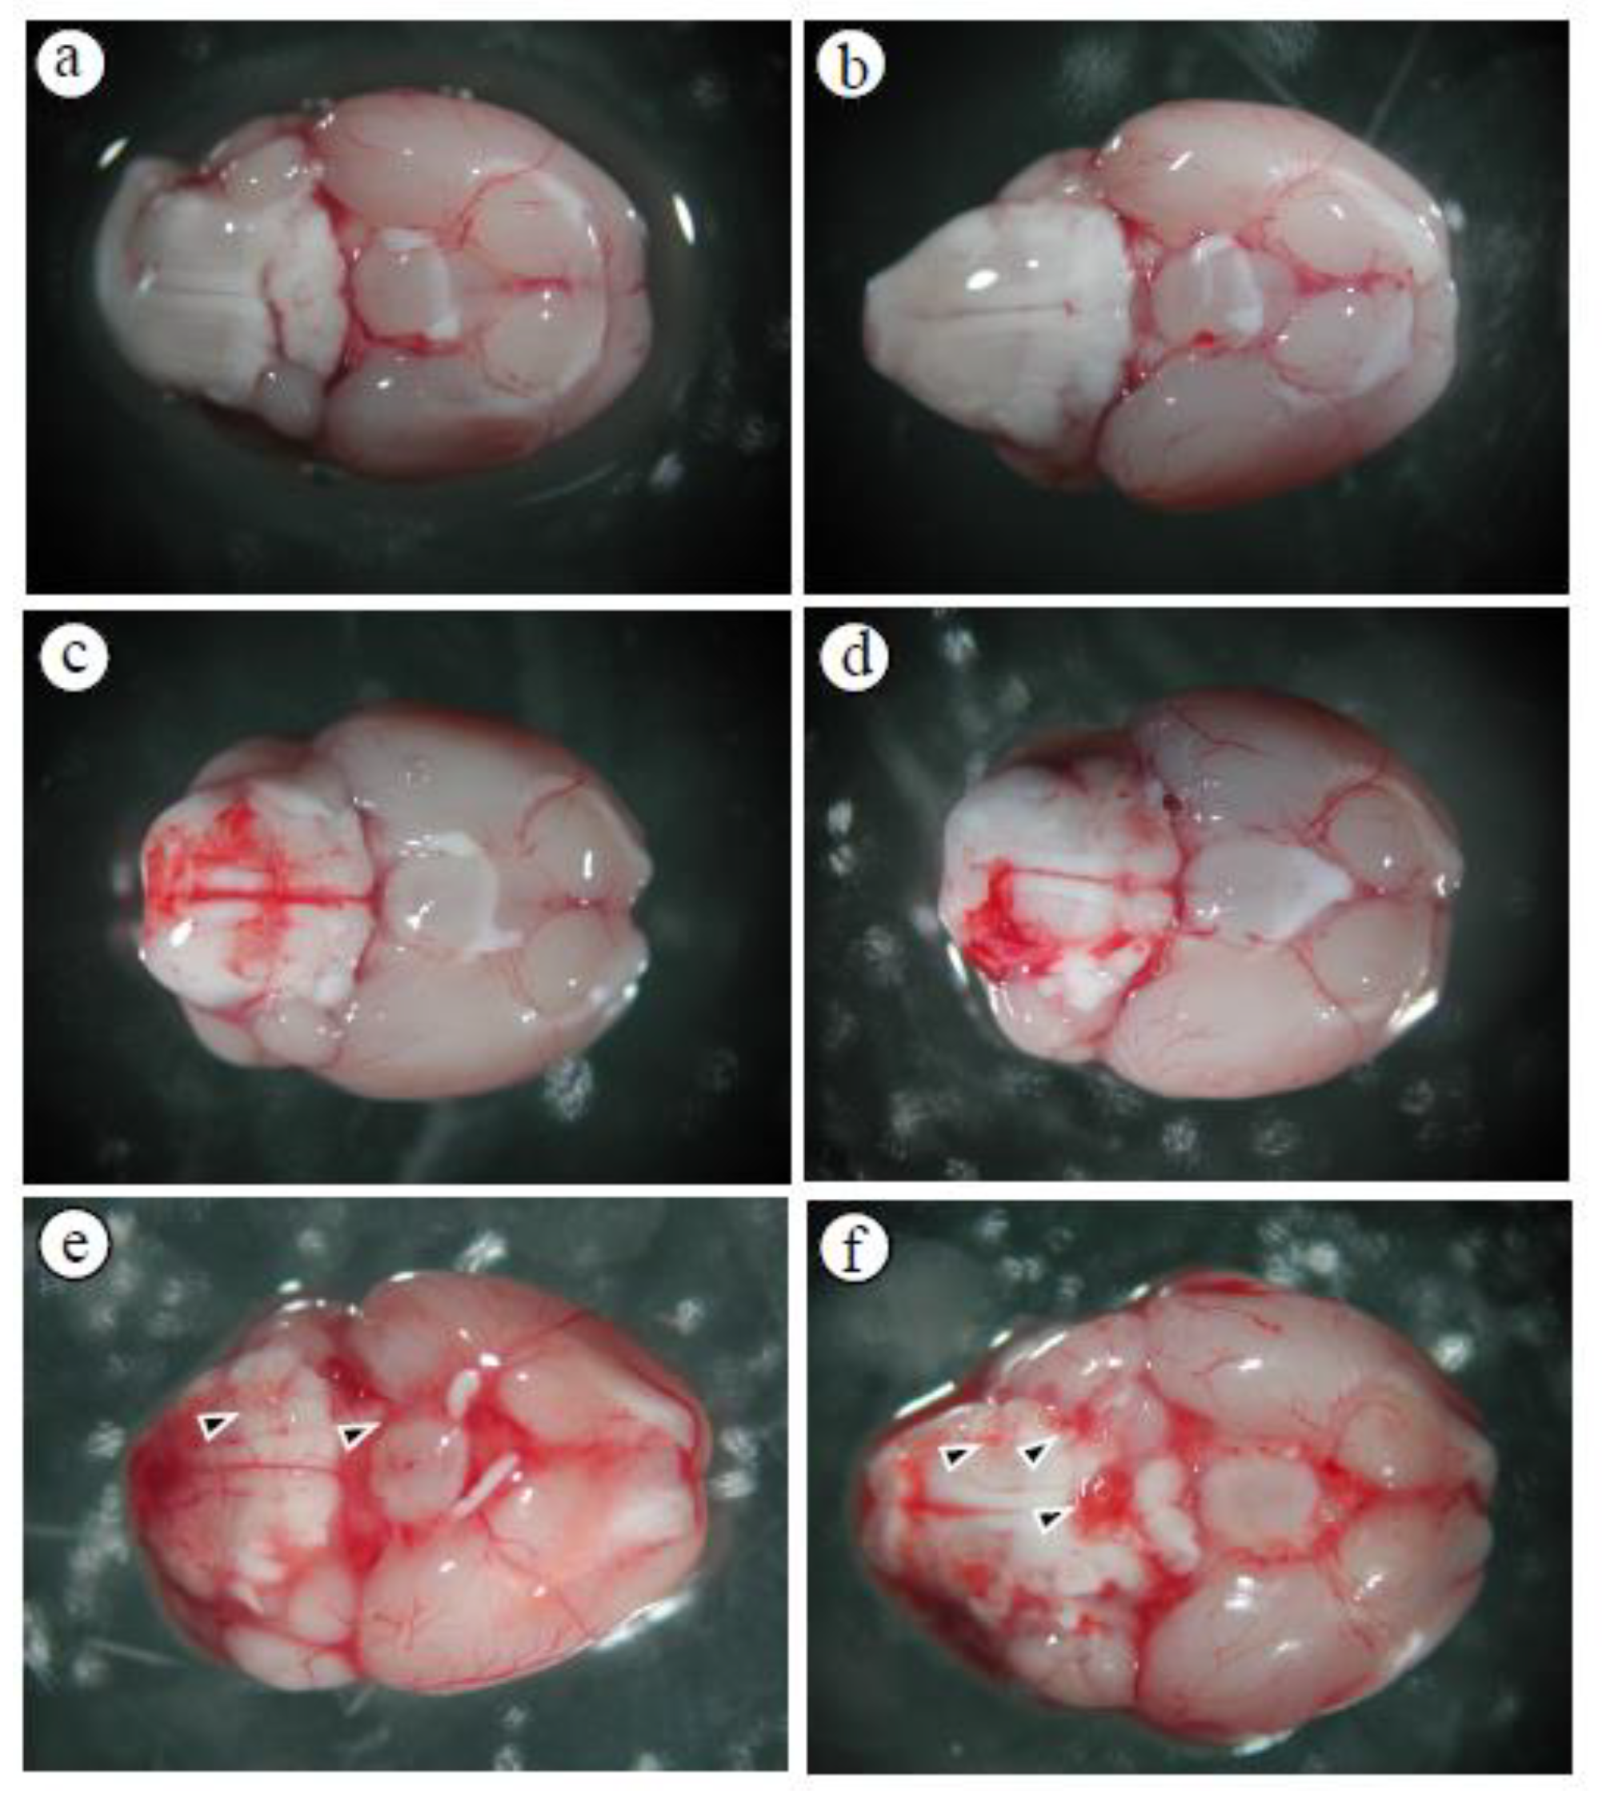
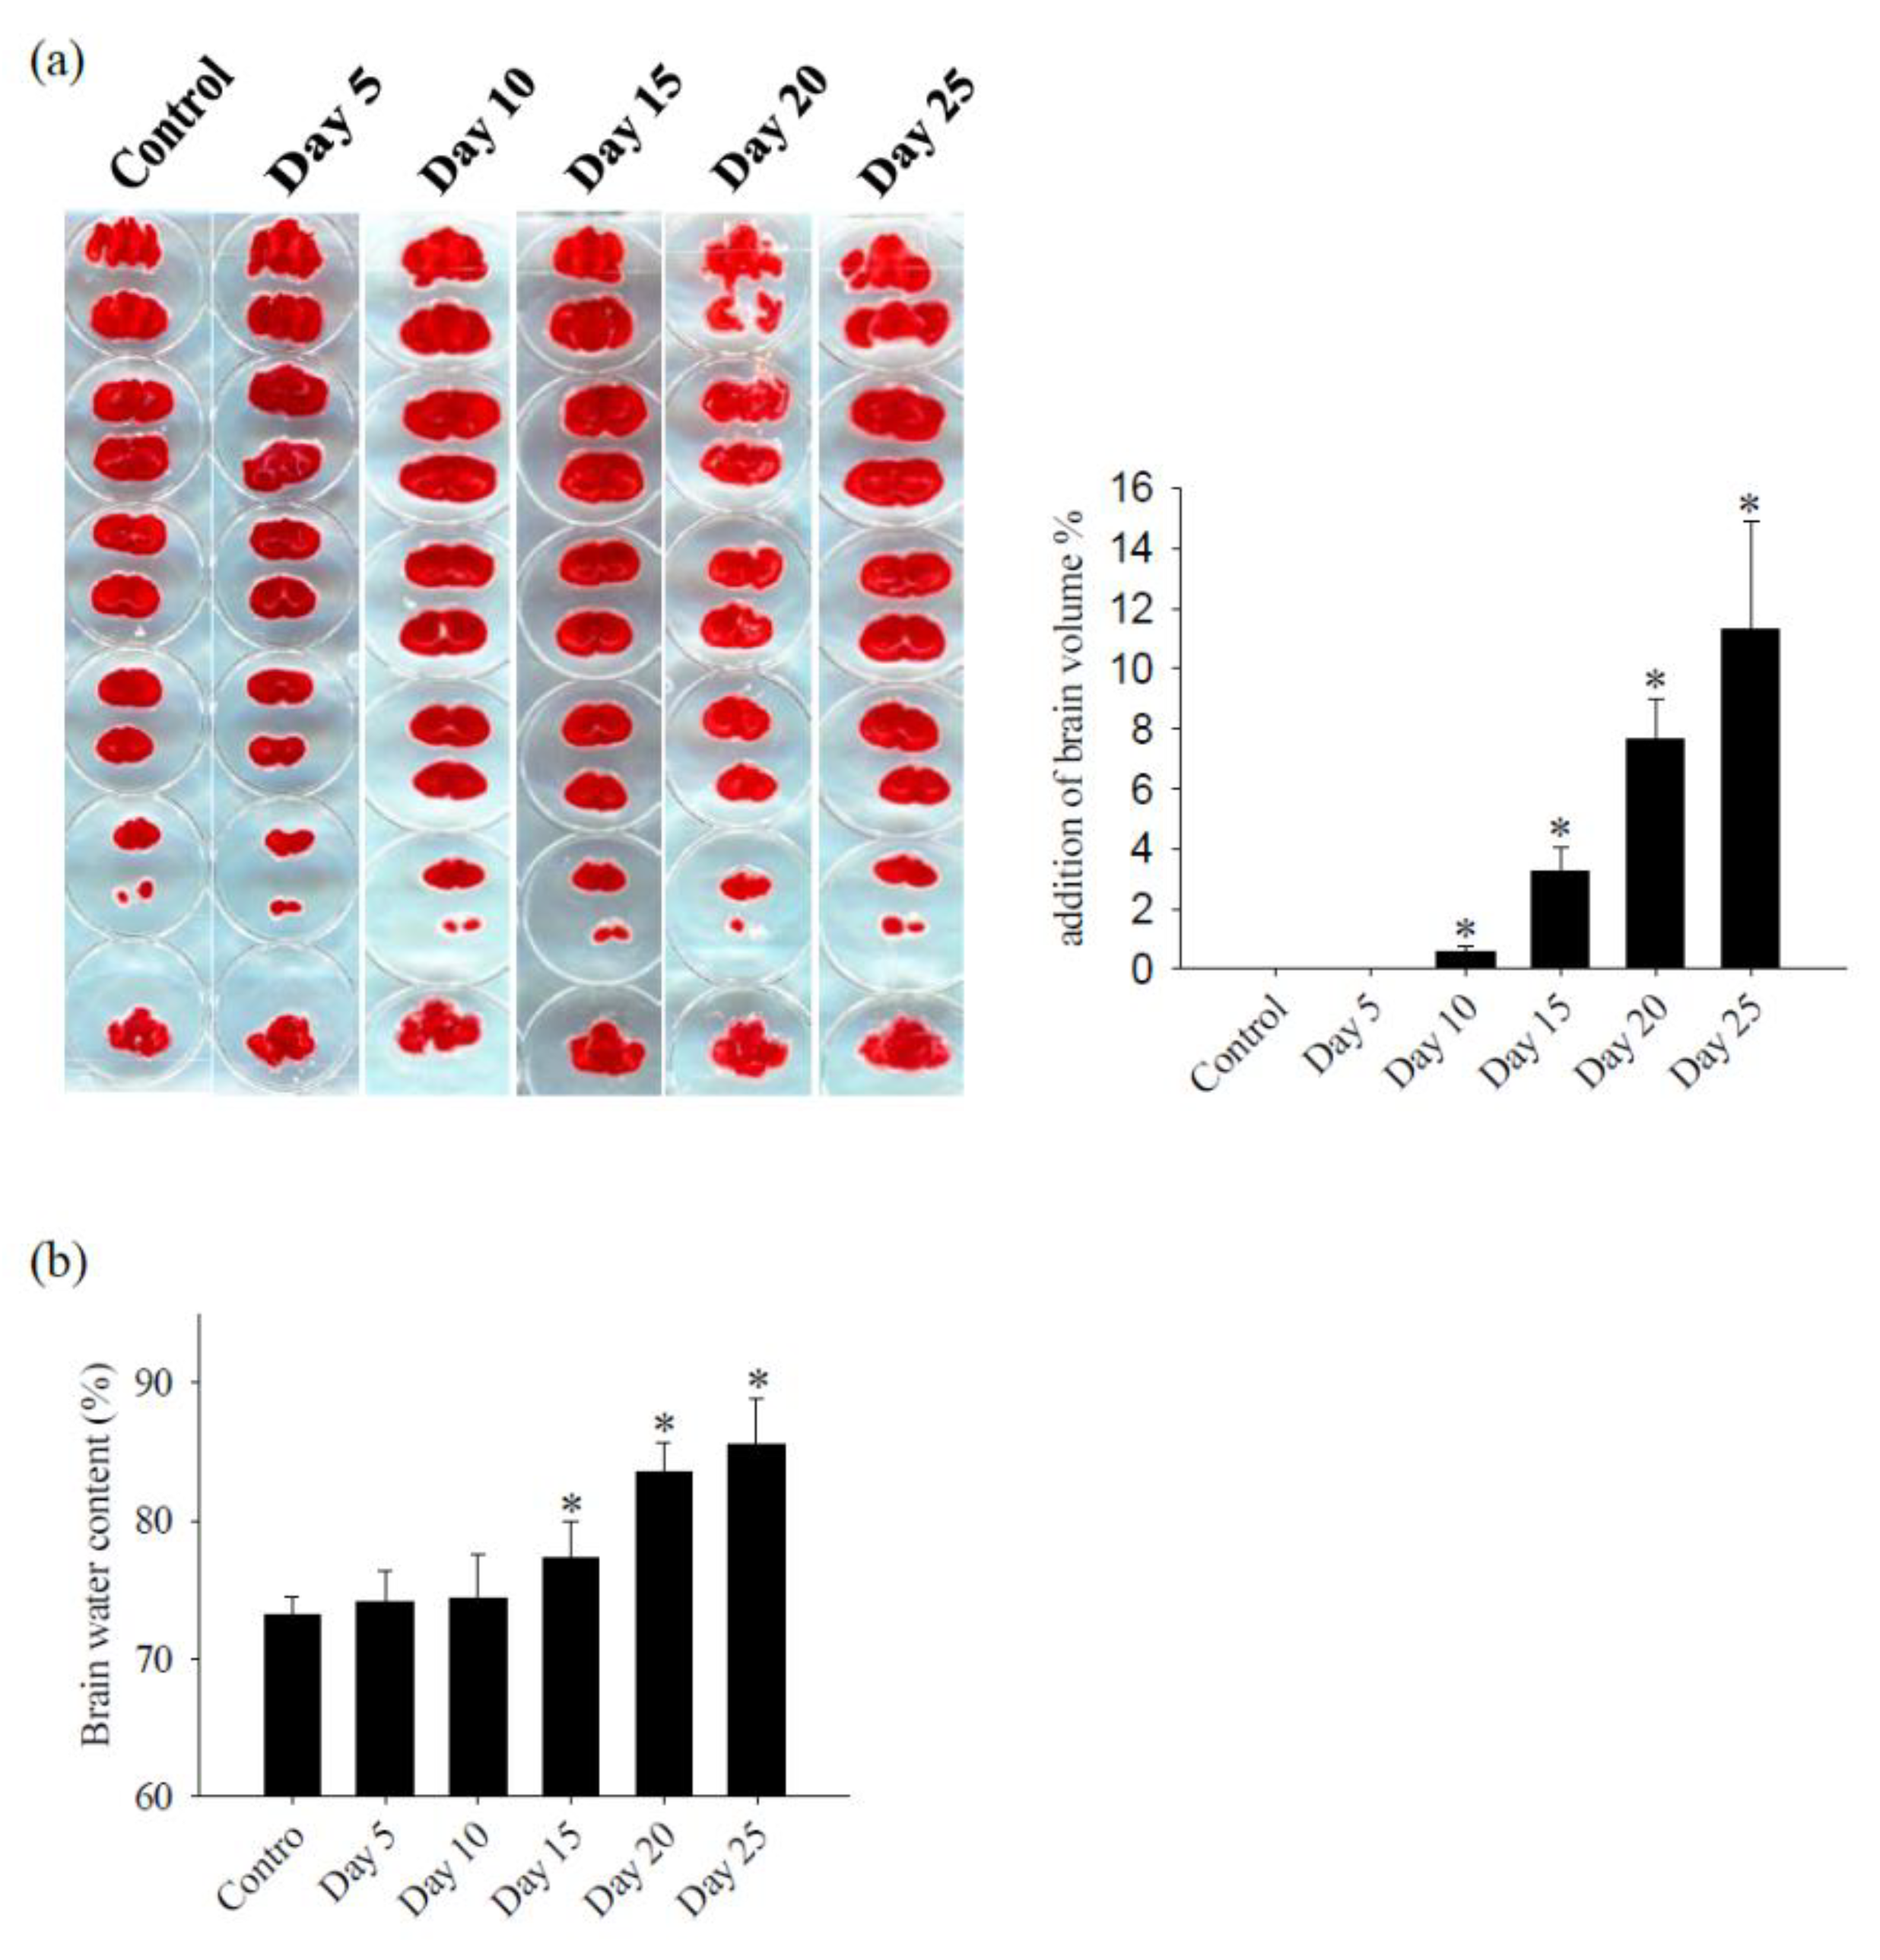
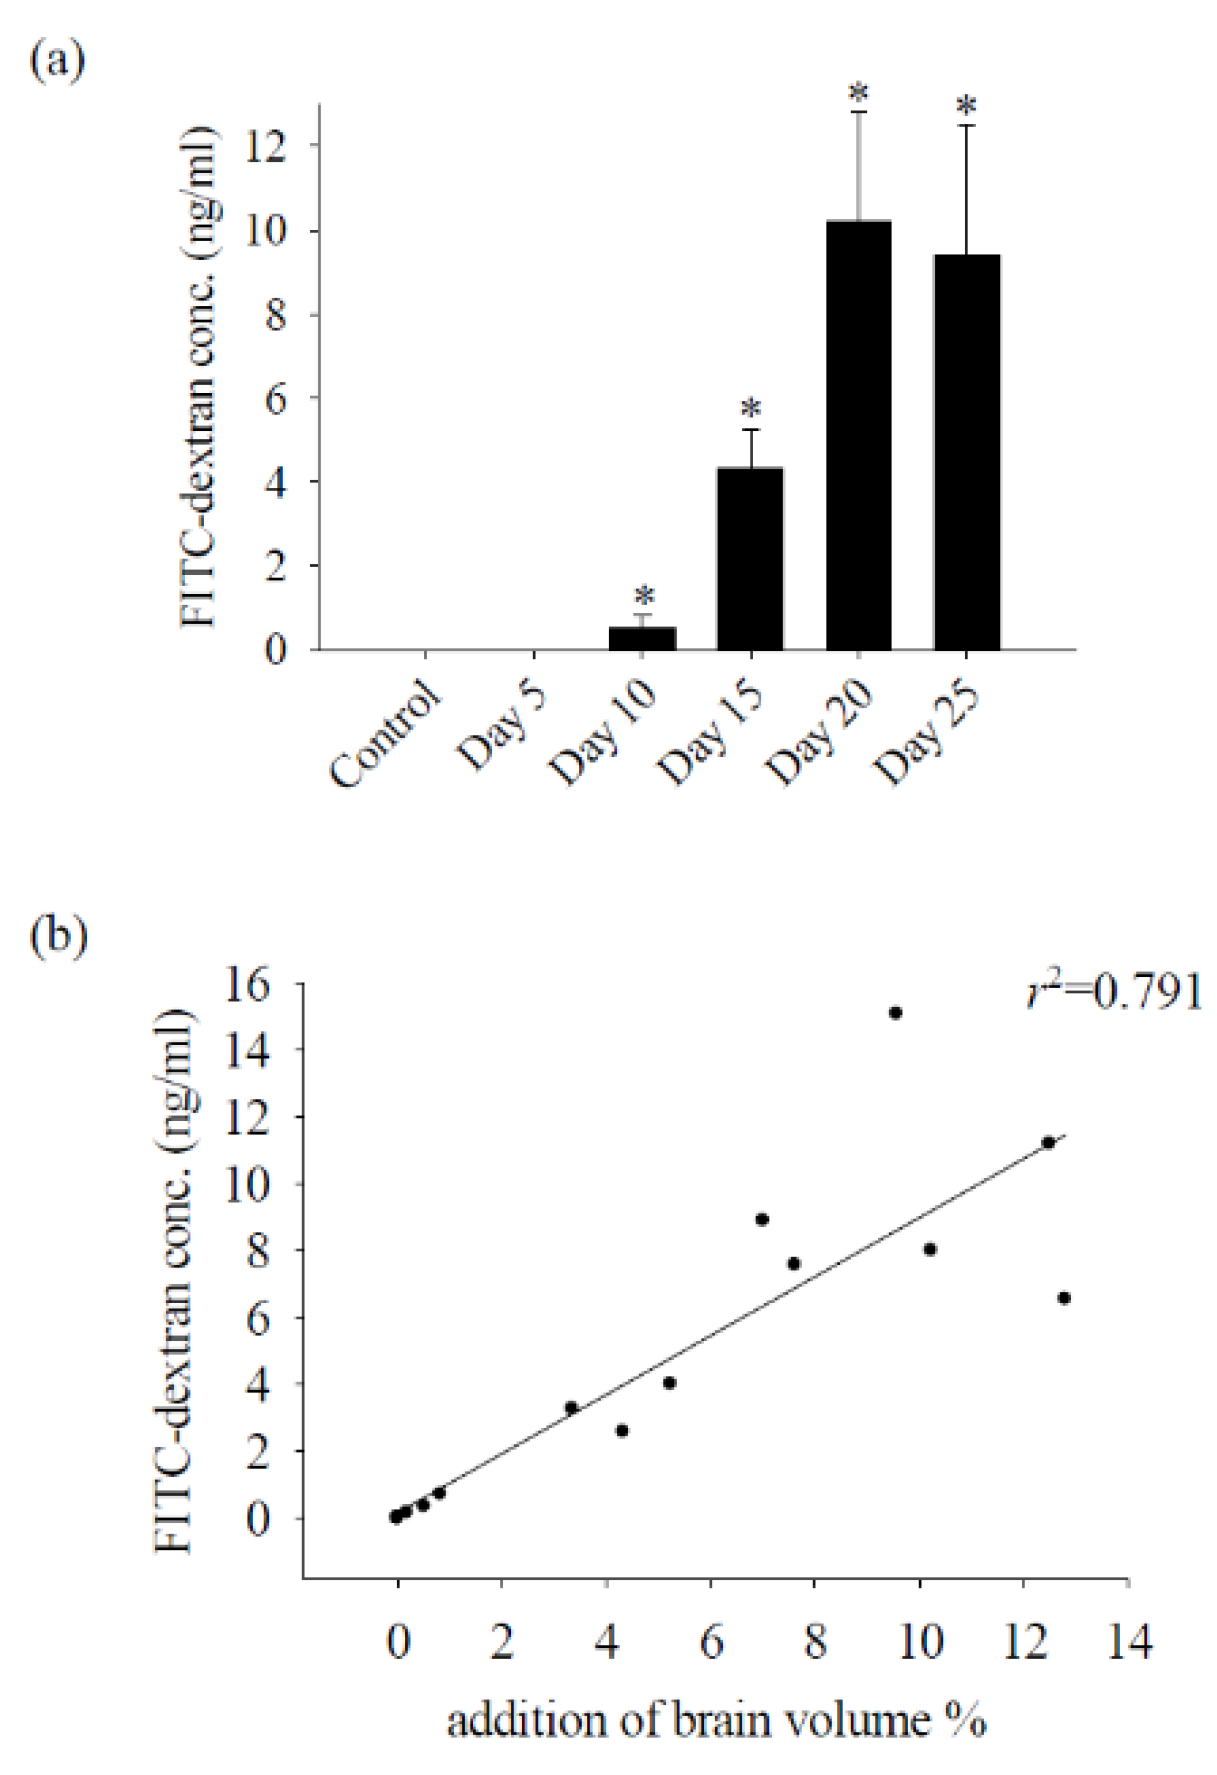
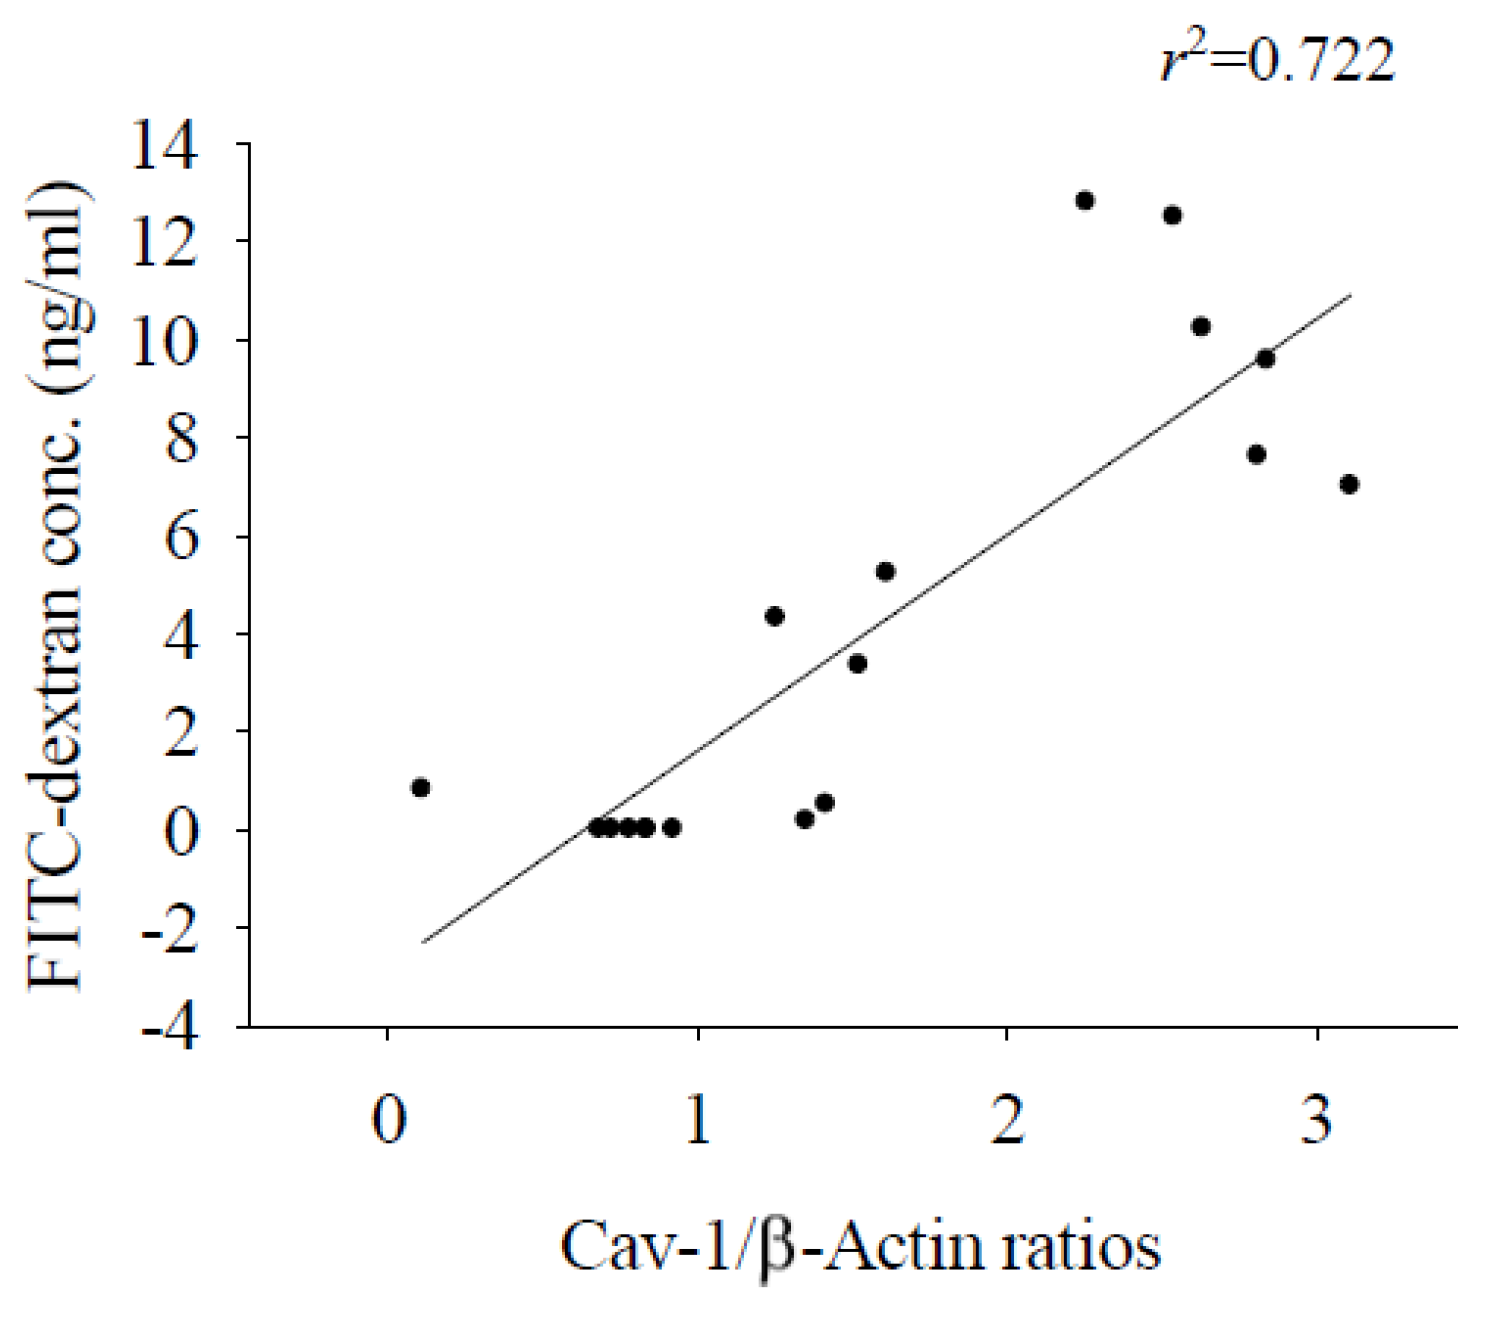
3.1. Alterations in the Permeability of the BBB Result in Cerebral Edema and Haemorrhage
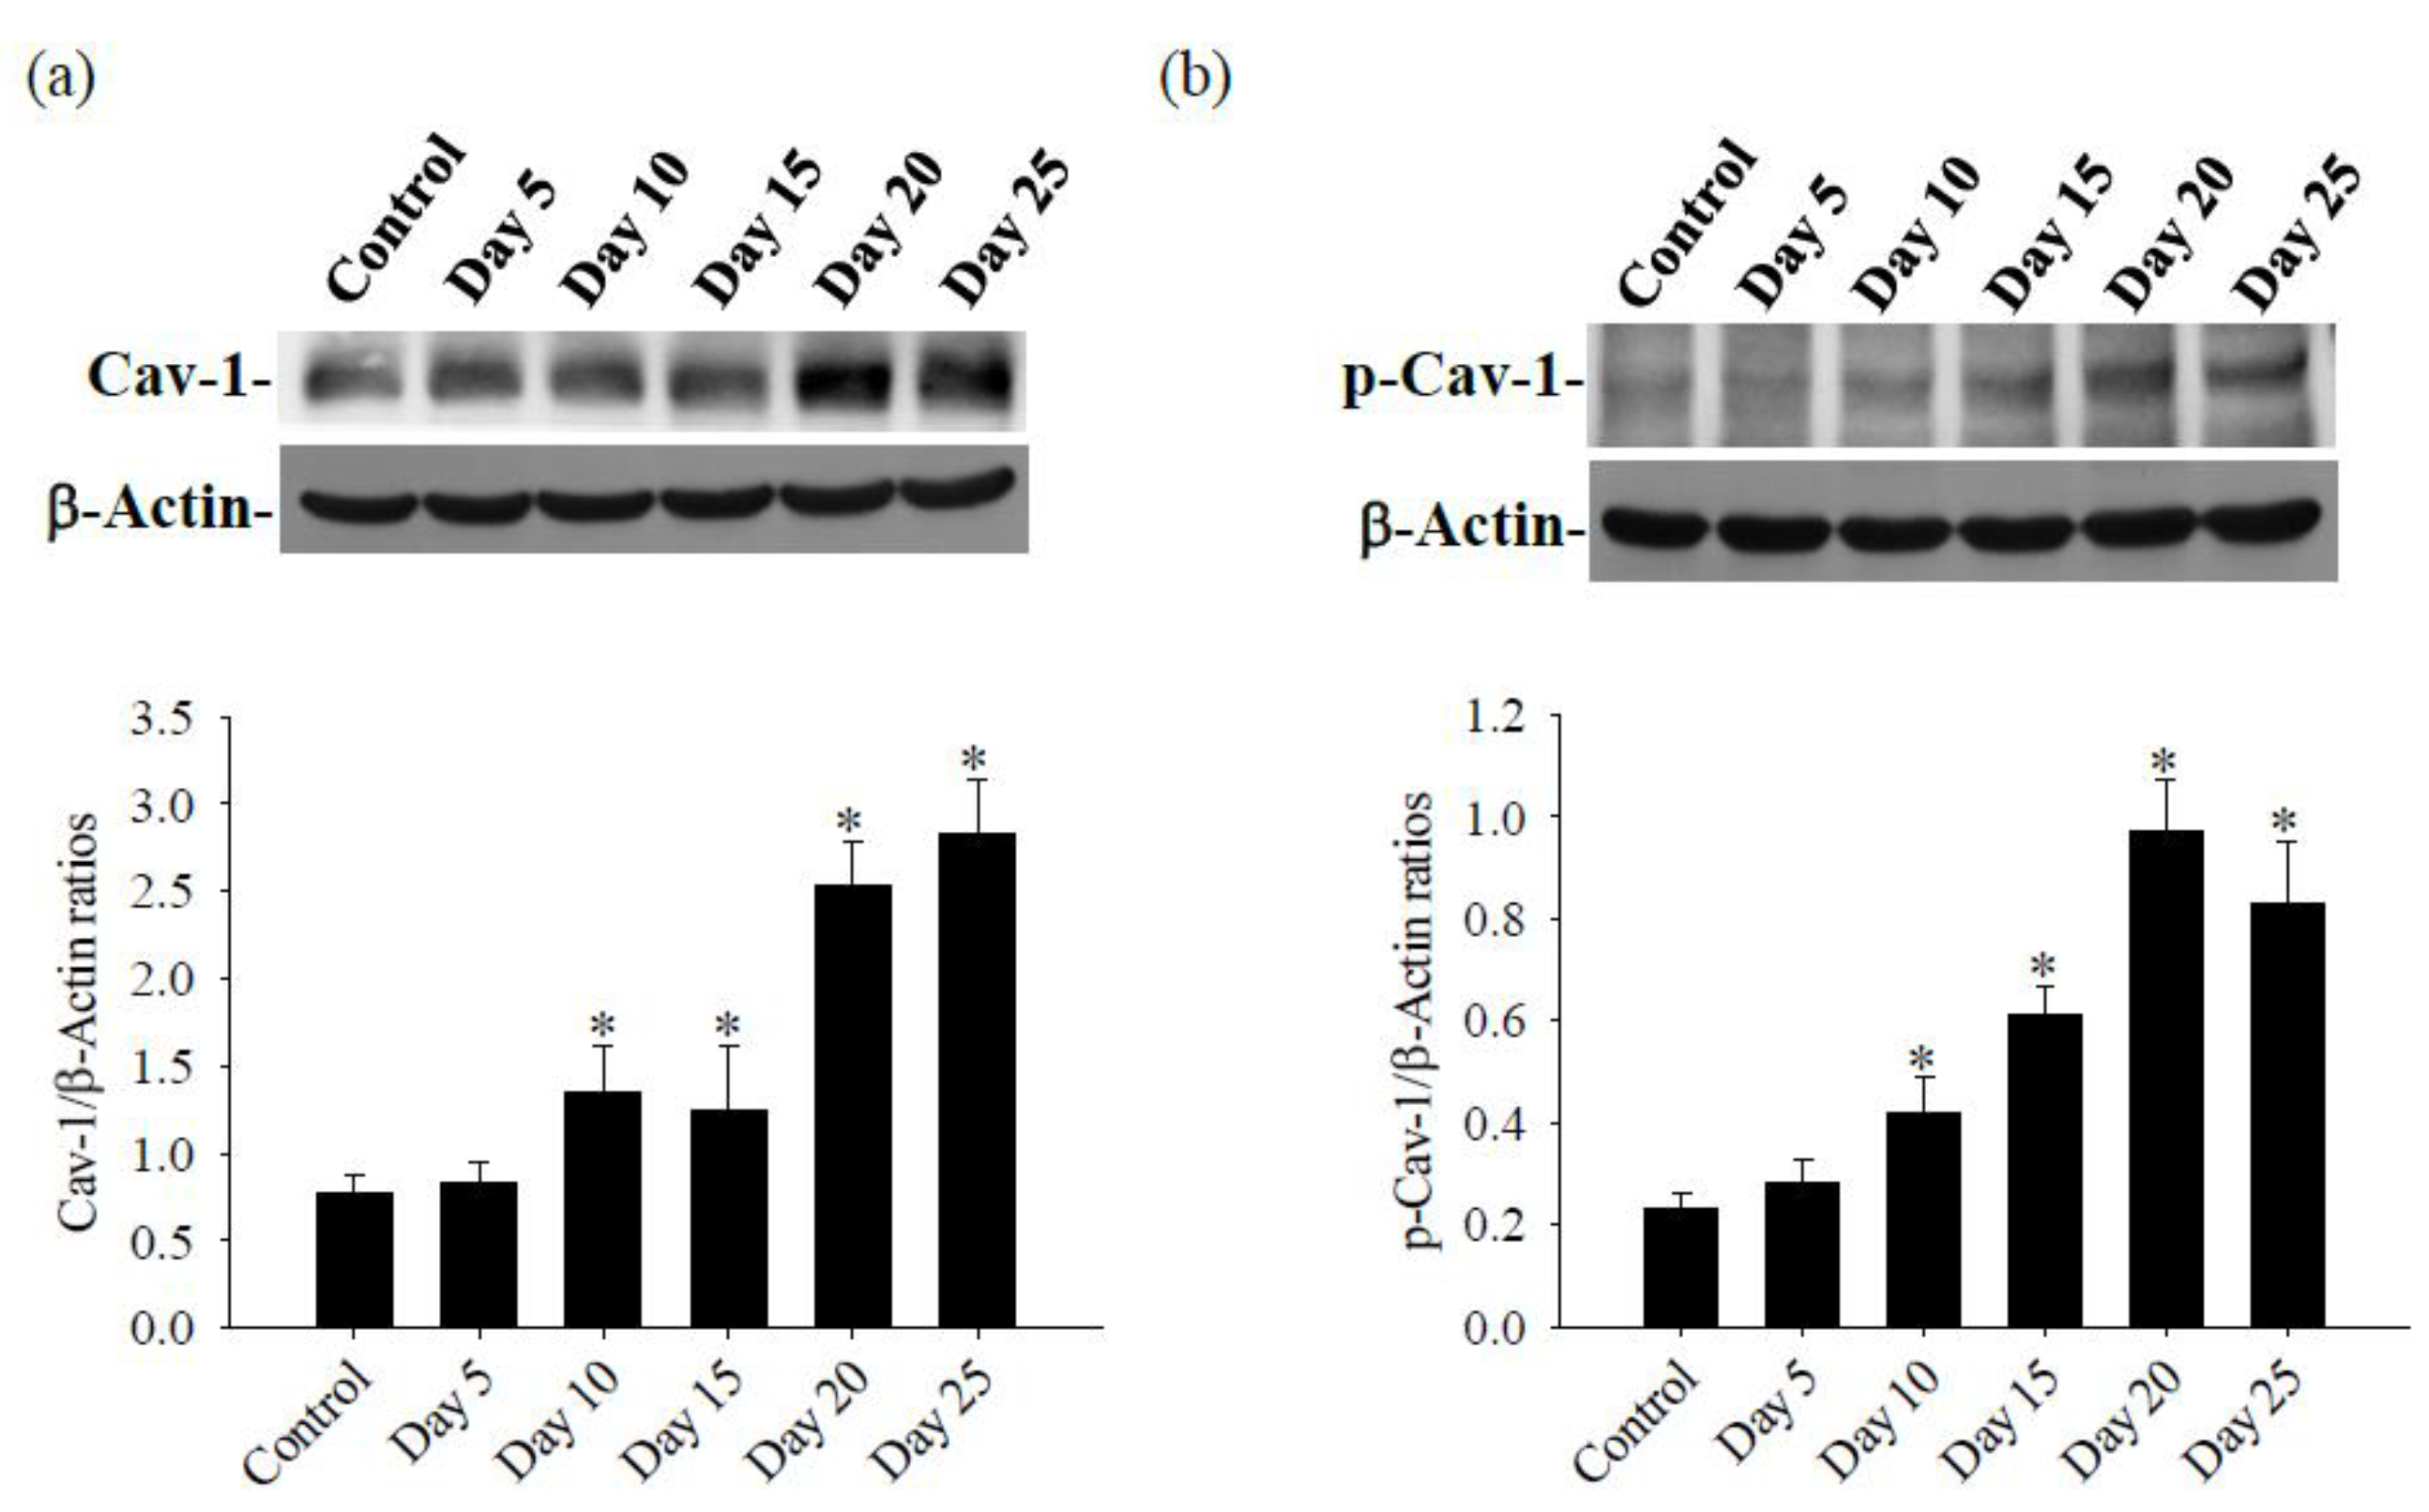
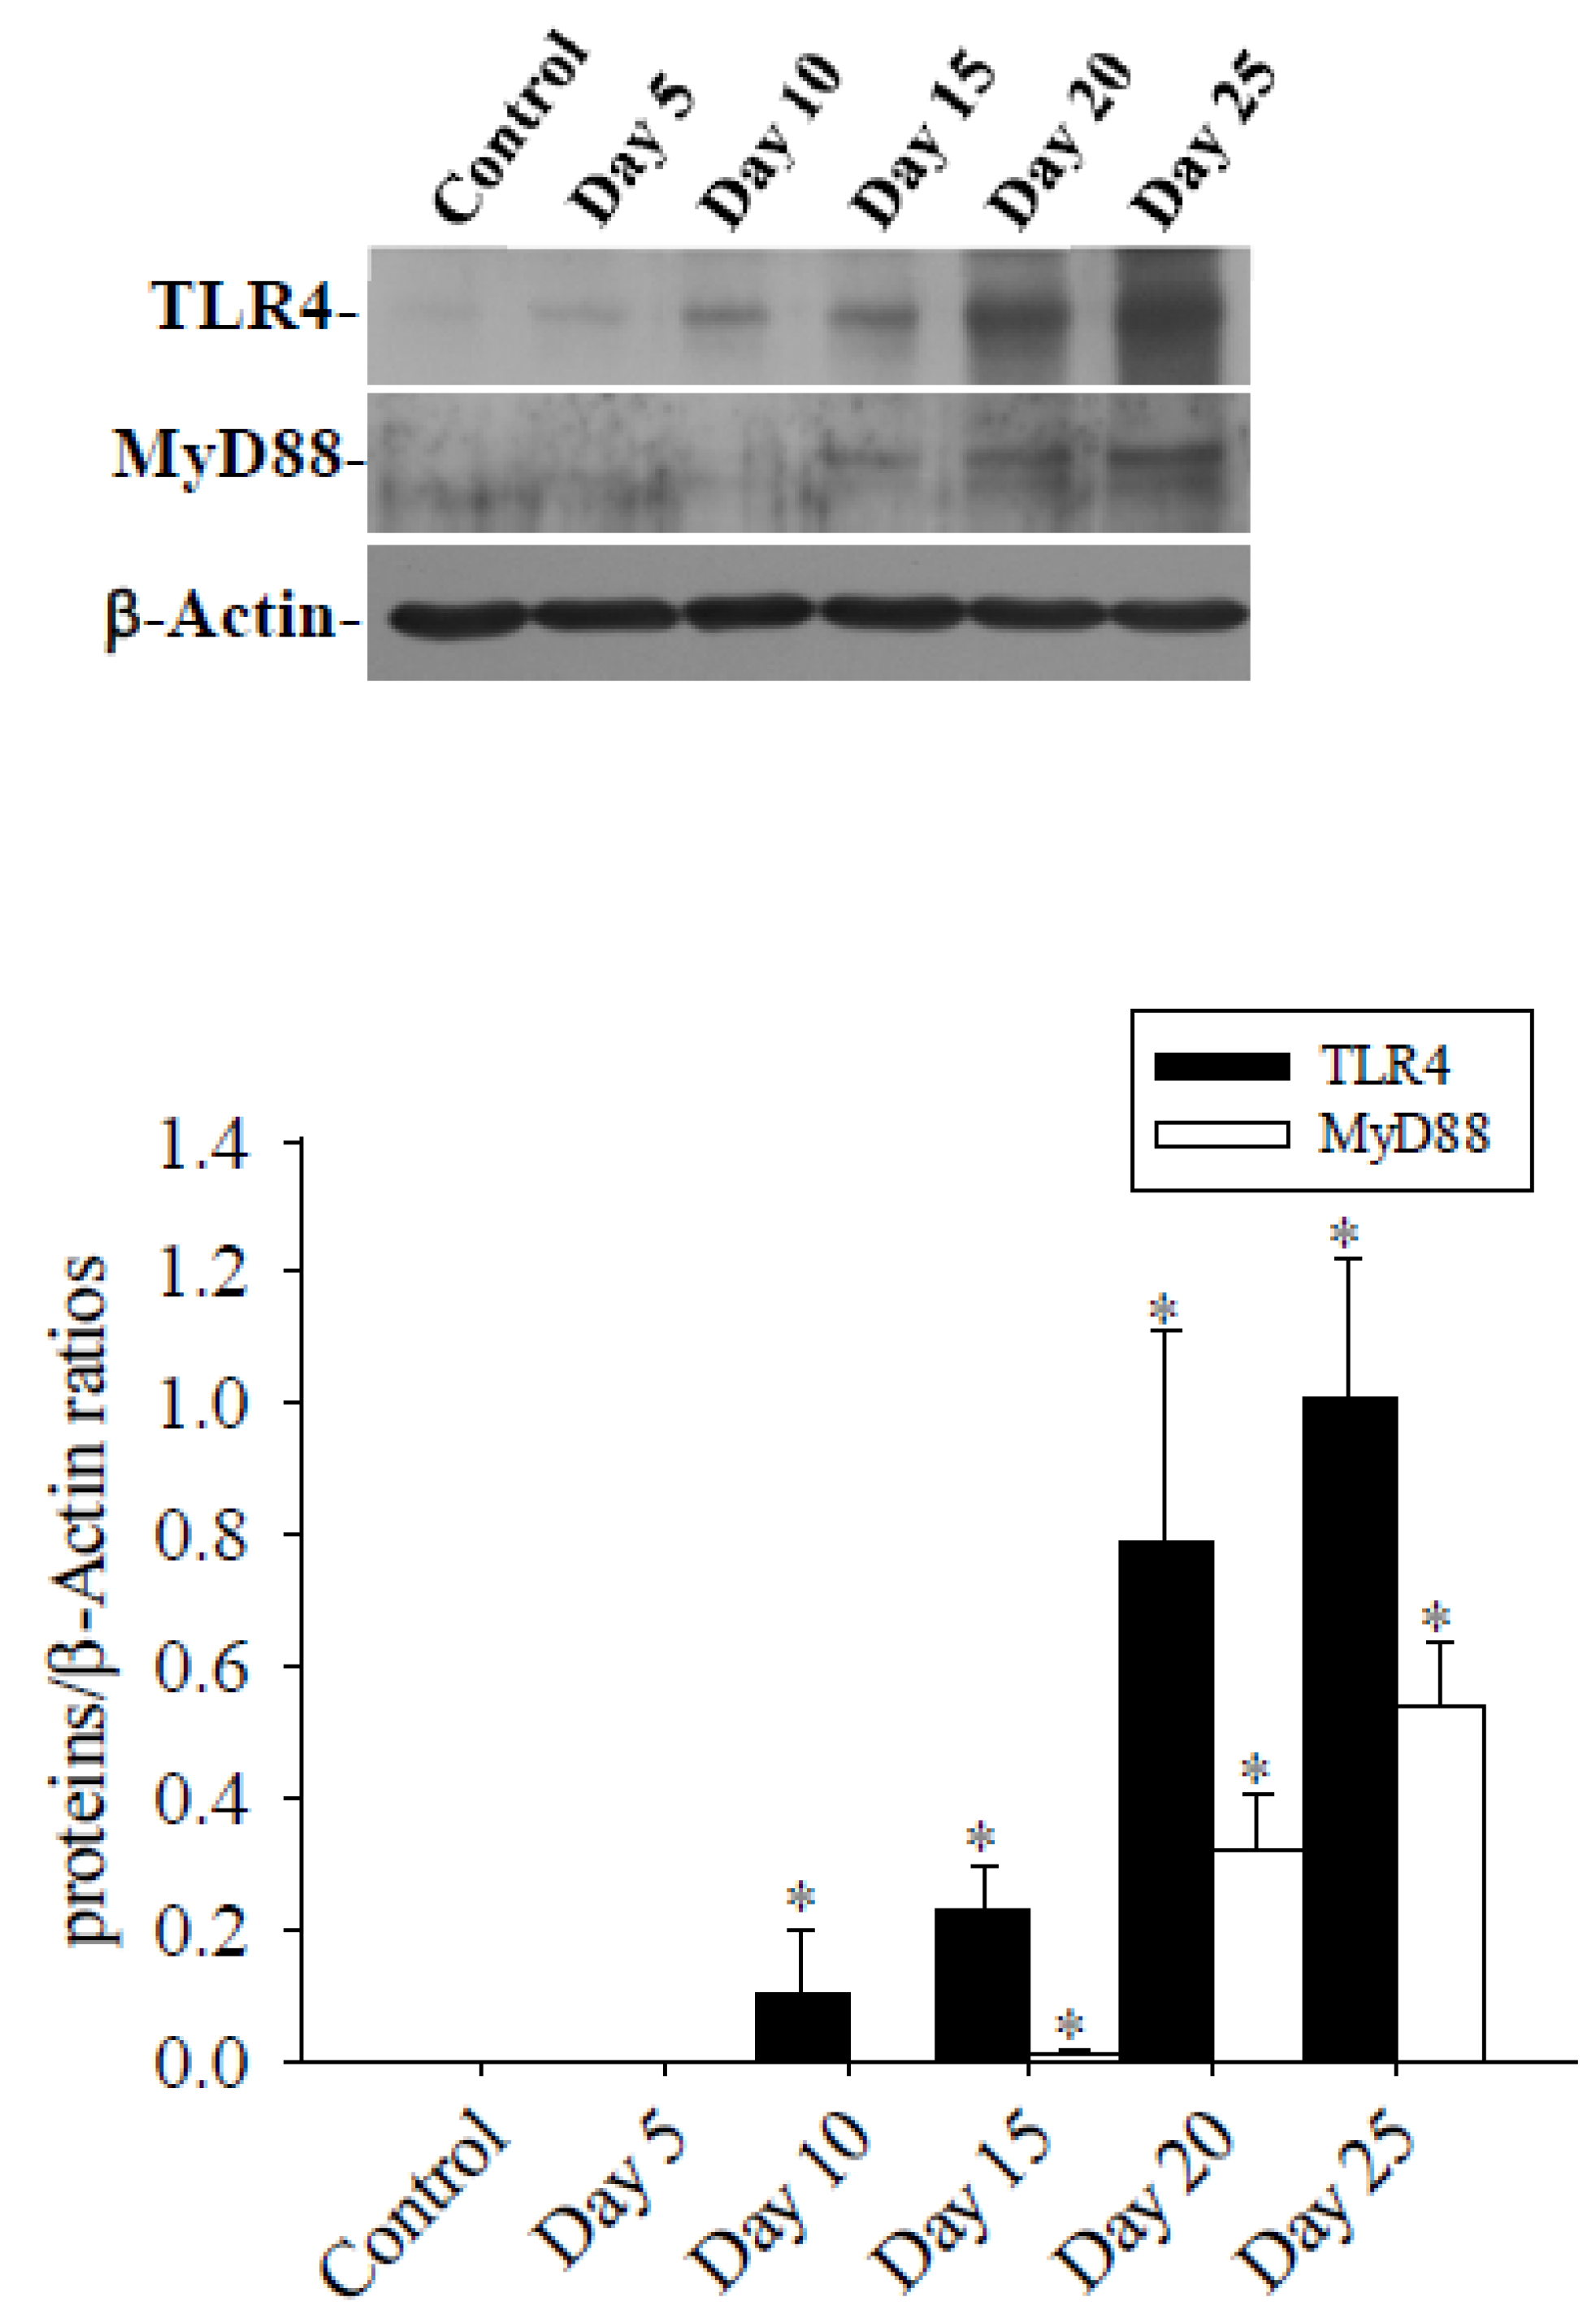
3.2. Cav-1 Through the TLR4 / MyD88 Signaling Pathway Modifies BBB Permeability
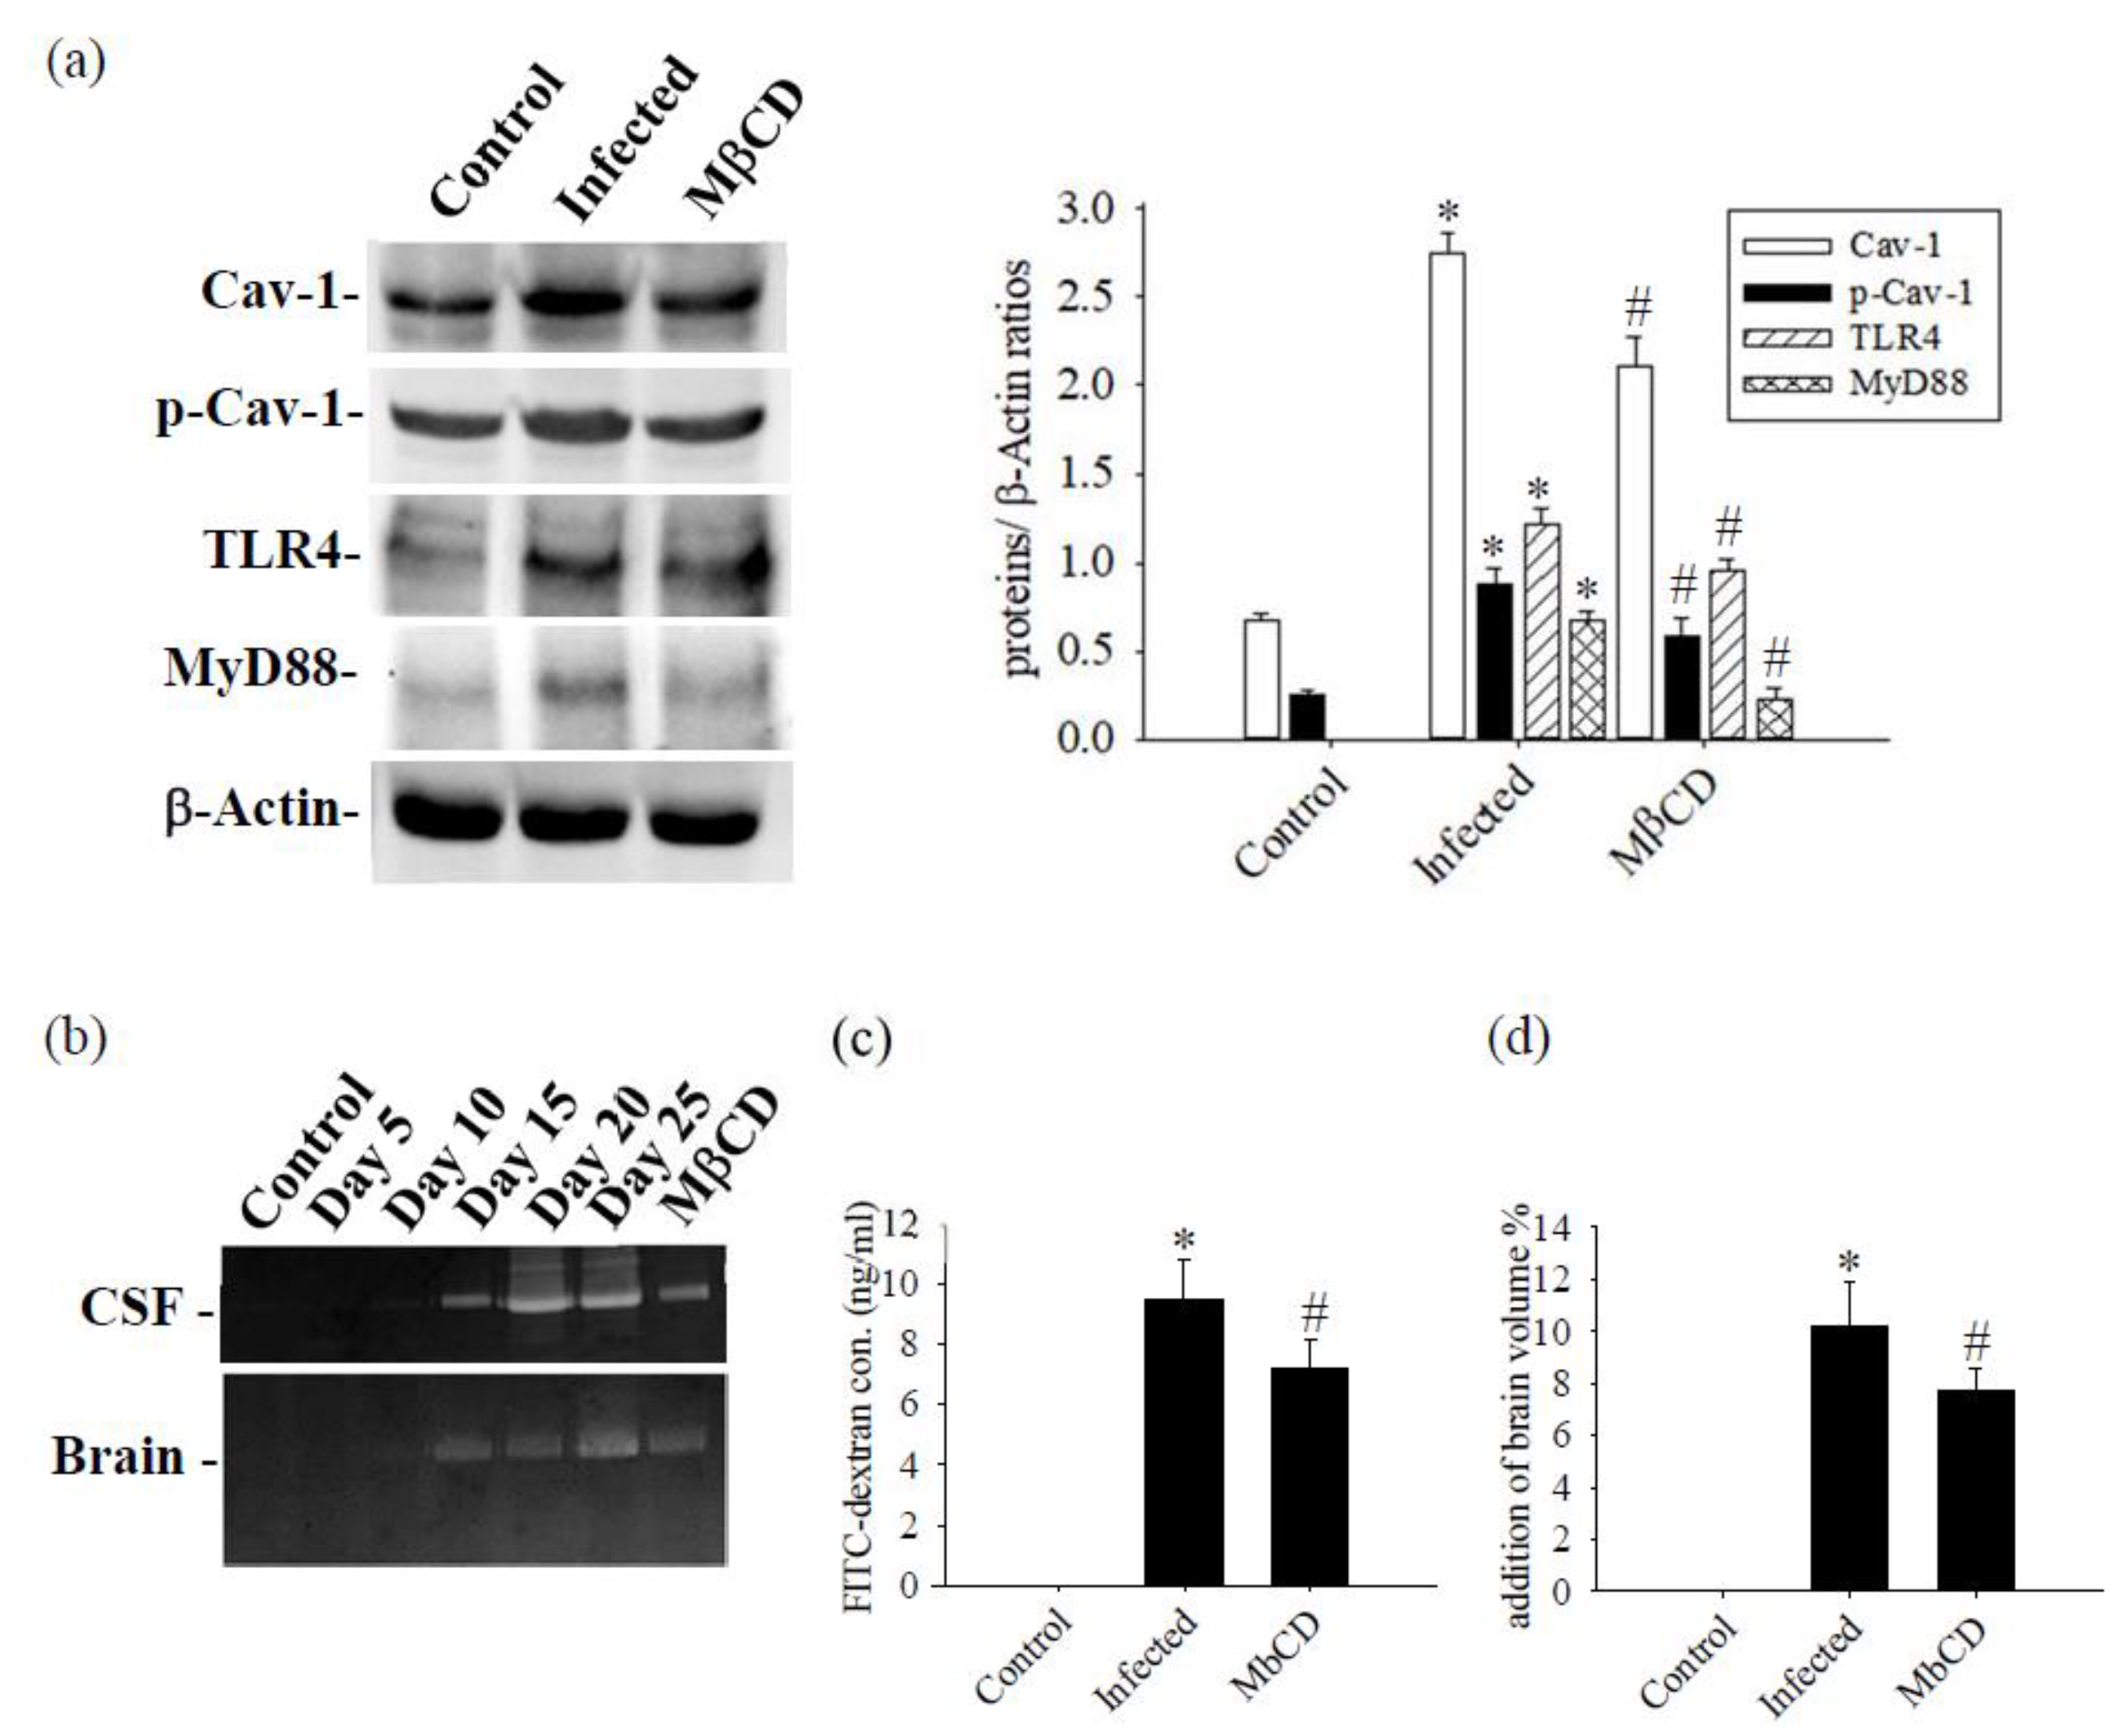
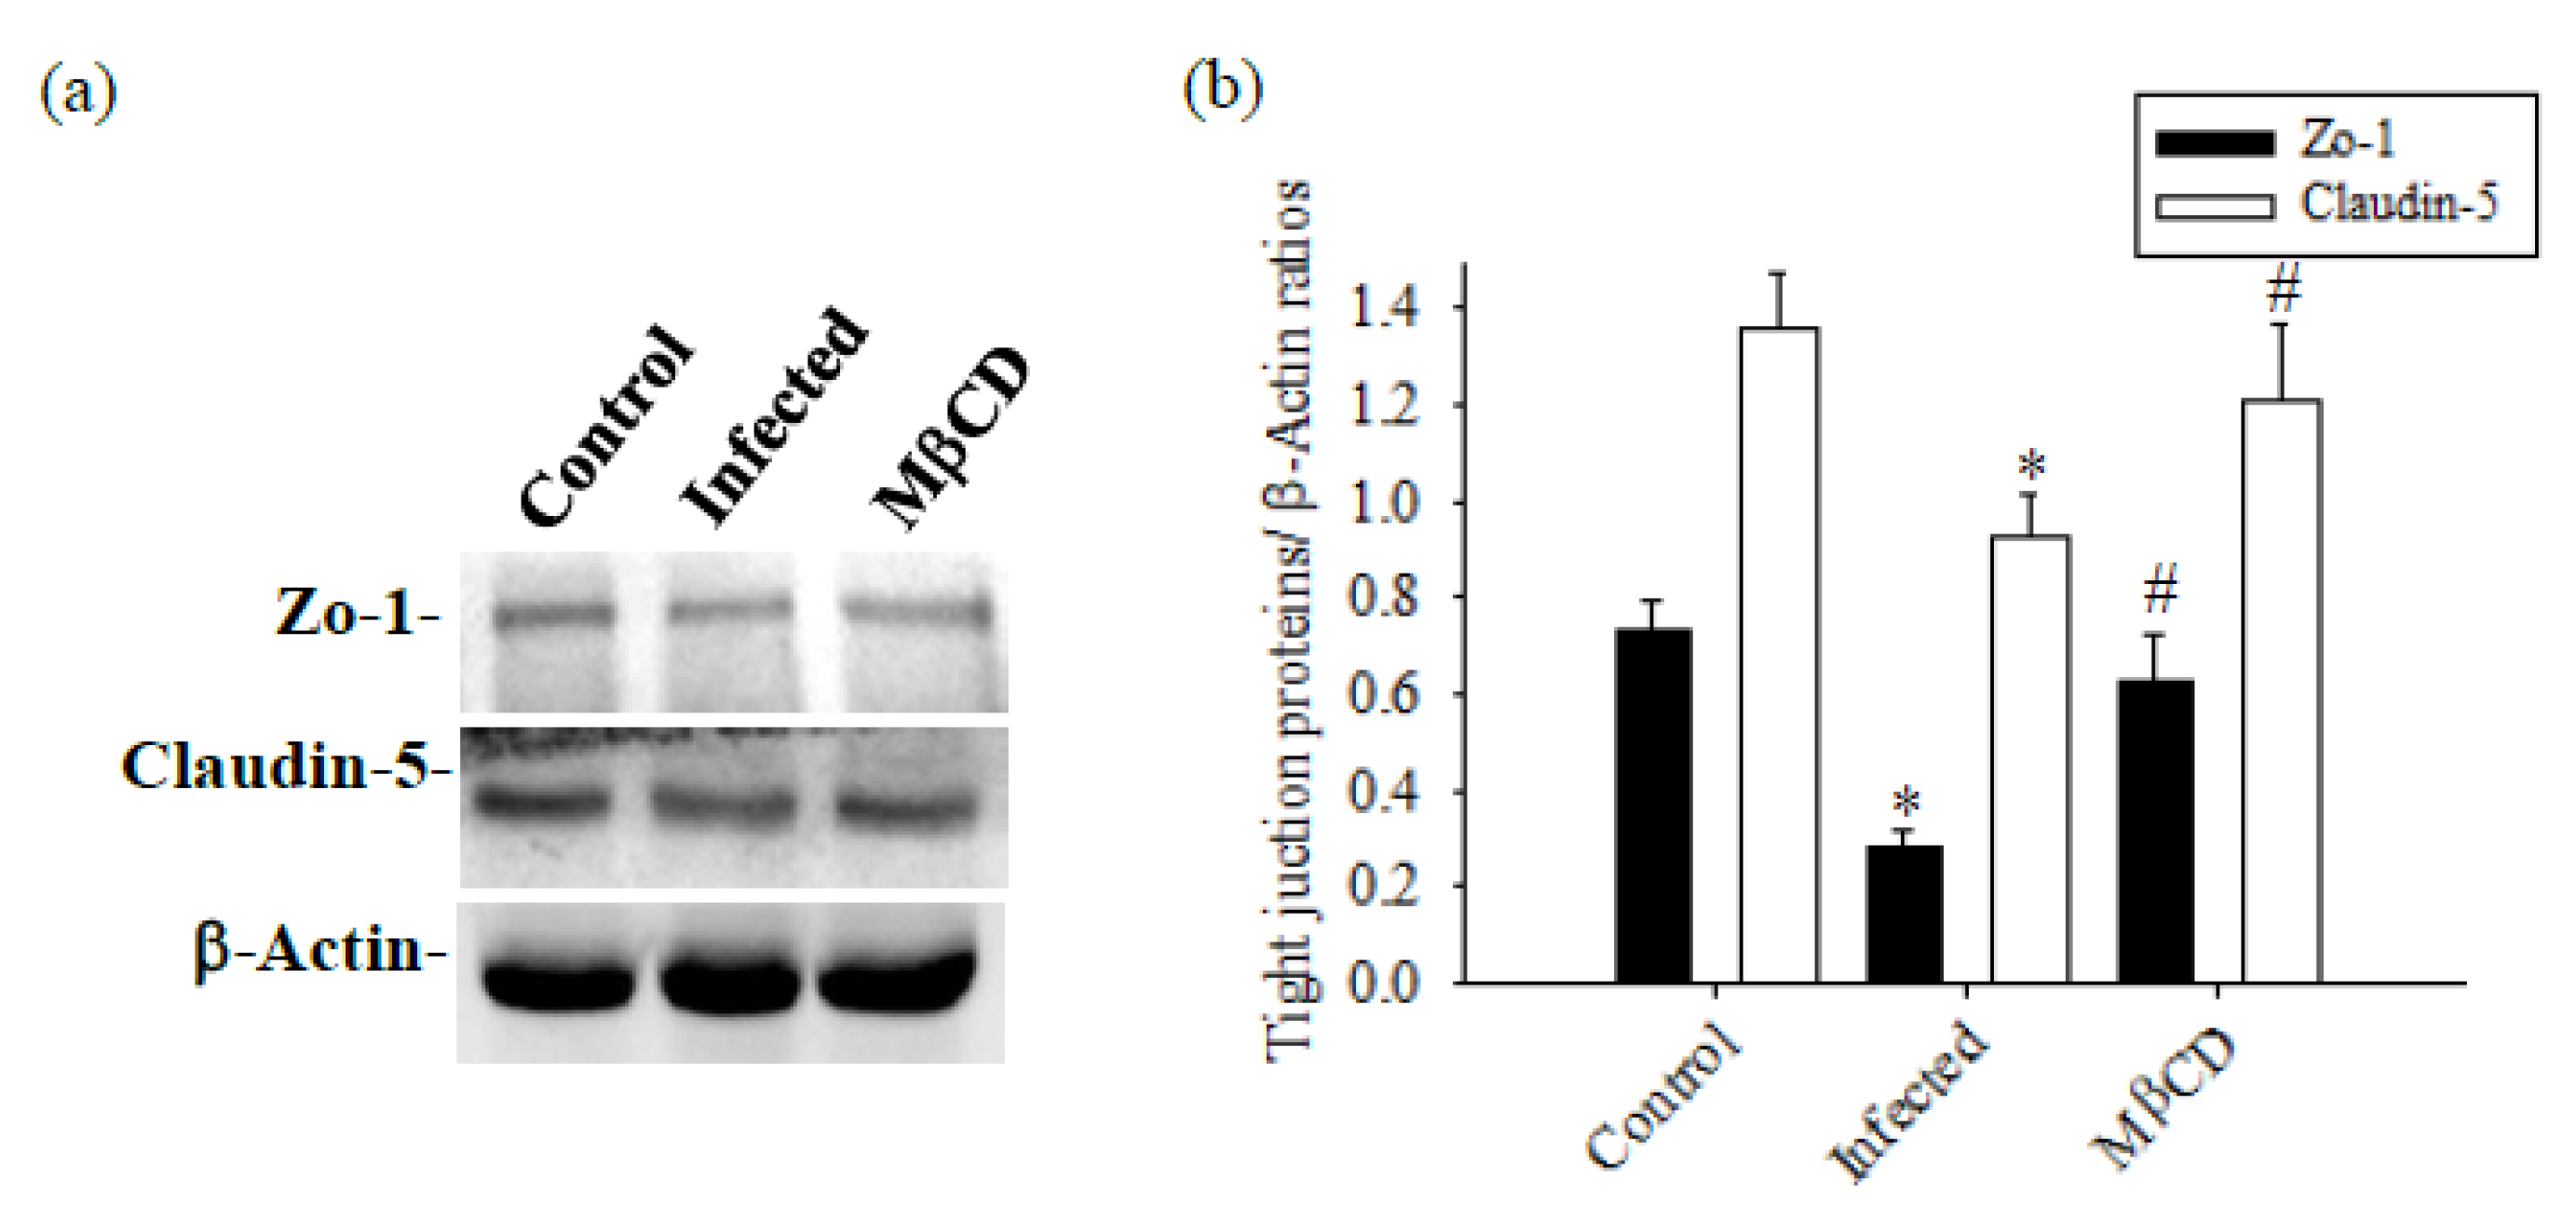
3.3. Treatment with Caveolae / Cav-1 Specific Inhibitor MβCD
4. Discussion
5. Conclusions
6. Patents
Author Contributions
Funding
Institutional Review Board Statement
Informed Consent Statement
Data Availability Statement
Conflicts of Interest
References
- Alicata, J.E. Biology and distribution of the rat lungworm, Angiostrongylus cantonensis, and its relationship to eosinophilic meningoencephalitis and other neurological disorders of man and animals. Adv Parasitol. 1965, 223–248. [Google Scholar]
- Tsai, H.C.; Chen, Y.S.; Yen, C.M. Human Parasitic Meningitis Caused by Angiostrongylus cantonensis Infection in Taiwan. Hawaii J Med Public Health. 2013, 72, 26–27. [Google Scholar]
- Finsterer, J.; Auer, H. Parasitoses of the human central nervous system. J Helminthol. 2013, 87, 257–270. [Google Scholar] [CrossRef] [PubMed]
- Chen, K.M.; Lee, H.H.; Lai, S.C.; Hsu, L.S.; Wang, C.J.; Liu, J.Y. Apoptosis in meningoencephalitis of Angiostrongylus cantonensis-infected mice. Exp Parasitol. 2008, 119, 385–390. [Google Scholar] [CrossRef] [PubMed]
- Mengying, Z.; Yiyue, X.; Tong, P.; Yue, H.; Limpanont, Y.; Ping, H.; Okanurak, K.; Yanqi, W.; Dekumyoy, P.; Hongli, Z.; Watthanakulpanich, D.; Zhongdao, W.; Zhi, W.; Zhiyue, L. Apoptosis and necroptosis of mouse hippocampal and parenchymal astrocytes, microglia and neurons caused by Angiostrongylus cantonensis infection. Parasit Vectors. 2017, 10, 611. [Google Scholar] [CrossRef] [PubMed]
- Lin, K.Y.; Chen, K.M.; Lan, K.P.; Lee, H.H.; Lai, S.C. Alterations of myelin proteins in inflammatory demyelination of BALB/c mice caused by Angiostrongylus cantonensis. Vet Parasitol. 2010, 171, 74–80. [Google Scholar] [CrossRef] [PubMed]
- Yoshimura, K. Mechanism of parasite killing by eosinophils in parasitic infections. Nihon Rinsho. 1993, 51, 657–663. [Google Scholar] [PubMed]
- Chen, K.M.; Lee, H.H.; Lu, K.H.; Tseng, Y.K.; Hsu, L.S.; Chou, H.L.; Lai, S.C. Association of matrix metalloproteinase-9 and Purkinje cell degeneration in mouse cerebellum caused by Angiostrongylus cantonensis. Int J Parasitol. 2004, 34, 1147–1156. [Google Scholar] [CrossRef] [PubMed]
- Lai, S.C.; Lu, C.Y.; Shyu, L.Y.; Chen, K.M. Angiostrongylus cantonensis infection induces MMP-9 and causes tight junction protein disruption associated with Purkinje cell degeneration. Parasitol Res. 2020, 119, 3433–3441. [Google Scholar] [CrossRef]
- Chen, K.M.; Liu, J.Y.; Lai, S.C.; Hsu, L.S.; Lee, H.H. Association of plasminogen activators and matrix metalloproteinase-9 proteolytic cascade with blood-CNS barrier damage of angiostrongyliasis. Int J Exp Pathol. 2006, 87, 113–119. [Google Scholar] [CrossRef]
- Villabona-Rueda, A.; Erice, C.; Pardo, C.A.; Stins, M.F. The Evolving Concept of the Blood Brain Barrier (BBB): From a Single Static Barrier to a Heterogeneous and Dynamic Relay Center. Front Cell Neurosci. 2019, 13, 405. [Google Scholar] [CrossRef] [PubMed]
- Zhong, W.; Huang, Q.; Zeng, L.; Hu, Z.; Tang, X. Caveolin-1 and MLRs: A potential target for neuronal growth and neuroplasticity after ischemic stroke. Int J Med Sci. 2019, 16, 1492–1503. [Google Scholar] [CrossRef] [PubMed]
- Lamaze, C.; Tardif, N.; Dewulf, M.; Vassilopoulos, S.; Blouin, C.M. The caveolae dress code: structure and signaling. Curr Opin Cell Biol. 2017, 47, 117–125. [Google Scholar] [CrossRef] [PubMed]
- Ikezu, T.; Ueda, H.; Trapp, B.D.; Nishiyama, K.; Sha, J.F.; Volonte, D.; Galbiati, F.; Byrd, A. L.; Bassell, G.; Serizawa, H.; Lane, W.S.; Lisanti, M.P.; Okamoto, T. Affinitypurification and characterization of caveolins from the brain differential expression of caveolin-1, -2, and -3 in brain endothelial and astroglial cell types. Brain Res.
- de Almeida, C.J.G. Caveolin-1 and Caveolin-2 Can Be Antagonistic Partners in Inflammation and Beyond. Front Immunol. 2017, 8, 1530. [Google Scholar] [CrossRef]
- Liu, P.; Rudick, M.; Anderson, R.G. Multiple functions of caveolin-1. J Biol Chem. 2002, 277, 41295–41298. [Google Scholar] [CrossRef] [PubMed]
- Nag, S.; Manias, J.L.; Stewart, D.J. Expression of endothelial phosphorylated caveolin-1 is increased in brain injury. Neuropathol Appl Neurobiol. 2009, 35, 417–426. [Google Scholar] [CrossRef] [PubMed]
- Pang, L.; Yang, S.; Dai, W.; Wu, S.; Kong, J. Role of caveolin-1 in human organ function and disease: friend or foe? Carcinogenesis. 2022, 43, 2–11. [Google Scholar] [CrossRef] [PubMed]
- Knowland, D.; Arac, A.; Sekiguchi, K.J.; Hsu, M.; Lutz, S.E.; Perrino, J.; Steinberg, G.K.; Barres, B.A.; Nimmerjahn, A.; Agalliu, D. Stepwise recruitment of transcellular and paracellular pathways underlies blood-brain barrier breakdown in stroke. Neuron. 2014, 82, 603–617. [Google Scholar] [CrossRef] [PubMed]
- Blochet, C.; Buscemi, L.; Clément, T.; Gehri, S.; Badaut, J.; Hirt, L. Involvement of caveolin-1 in neurovascular unit remodeling after stroke: Effects on neovascularization and astrogliosis. J Cereb Blood Flow Metab. 2020, 40, 163–176. [Google Scholar] [CrossRef]
- Badaut, J.; Ajao, D.O.; Sorensen, D.W.; Fukuda, A.M.; Pellerin, L. Caveolin expression changes in the neurovascular unit after juvenile traumatic brain injury: signs of blood-brain barrier healing? Neuroscience. 2015, 285, 215–226. [Google Scholar] [CrossRef]
- Gu, Y.; Zheng, G.; Xu, M.; Li, Y.; Chen, X.; Zhu, W.; Tong, Y.; Chung, S.K.; Liu, K.J.; Shen, J. Cav-1 regulates nitric oxide-mediated matrix metalloproteinases activity and blood-brain barrier permeability in focal cerebral ischemia and reperfusion injury. J Neurochem. 2012, 120, 147–156. [Google Scholar] [CrossRef] [PubMed]
- Roberts, J.; Kahle, M.P.; Bix, G.J. Perlecan and the blood-brain barrier: beneficial proteolysis? Front Pharmacol. 2012, 3, 55. [Google Scholar] [CrossRef] [PubMed]
- Weiss, N.; Miller, F.; Cazaubon, S.; Couraud, P.O. The blood-brain barrier in brain homeostasis and neurological diseases. Biochim Biophys Acta. 2009, 1788, 842–857. [Google Scholar] [CrossRef] [PubMed]
- Kimbler, D.E.; Shields, J.; Yanasak, N.; Vender, J.R.; Dhandapani, K.M. Activation of P2X7 promotes cerebral edema and neurological injury after traumatic brain injury in mice. PLoS One. 2012, 7, e41229. [Google Scholar] [CrossRef] [PubMed]
- Kovacs, M.A.; Babcock, I.W.; Royo, M.A.; Sibley, L.A.; Kelly, A.G.; Harris, T.H. Vascular Endothelial Growth Factor-C Treatment Enhances Cerebrospinal Fluid Outflow during Toxoplasma gondii Brain Infection but Does Not Improve Cerebral Edema. Am J Pathol. 2024, 194, 225–237. [Google Scholar] [CrossRef] [PubMed]
- Lee, J.D.; Tsai, L.Y.; Chen, C.H.; Wang, J.J.; Hsiao, J.K.; Yen, C.M. Blood-brain barrier dysfunction occurring in mice infected with Angiostrongylus cantonensis. Acta Trop. 2006, 97, 204–211. [Google Scholar] [CrossRef] [PubMed]
- Chen, K.M.; Lai, S.C. Biochemical and pathological evaluation of albendazole/thalidomide co-therapy against eosinophilic meningitis or meningoencephalitis induced by Angiostrongylus cantonensis. J Antimicrob Chemother. 2007, 59, 264–276. [Google Scholar] [CrossRef] [PubMed]
- Chiu, P.S.; Lai, S.C. Matrix metalloproteinase-9 leads to claudin-5 degradation via the NF-κB pathway in BALB/c mice with eosinophilic meningoencephalitis caused by Angiostrongylus cantonensis. PLoS One. [CrossRef]
- Chiu, P.S.; Lai, S.C. Matrix metalloproteinase-9 leads to blood-brain barrier leakage in mice with eosinophilic meningoencephalitis caused by Angiostrongylus cantonensis. Acta Trop. 2014, 140, 140,141–50. [Google Scholar] [CrossRef] [PubMed]
- Cheng, H.; Huang, S.S.; Lin, S.M.; Lin, M.J.; Chu, Y.C.; Chih, C.L.; Tsai, M.J.; Lin, H.C.; Huang, W.C.; Tsai, S.K. The neuroprotective effect of glial cell line-derived neurotrophic factor in fibrin glue against chronic focal cerebral ischemia in conscious rats. Brain Res. 2005, 1033, 28–33. [Google Scholar] [CrossRef]
- Lin, K.Y.; Lai, S.C. Induction of 2',3'-cyclic nucleotide 3'-phosphodiesterase in demyelination of BALB/c mice caused by Angiostrongylus cantonensis. J Comp Pathol. 2009, 141, 248–253. [Google Scholar] [CrossRef]
- Liu, W.Y.; Wang, Z.B.; Wang, Y.; Tong, L.C.; Li, Y.; Wei, X.; Luan, P.; Li, L. Increasing the Permeability of the Blood-brain Barrier in Three Different Models in vivo. CNS Neurosci Ther. 2015, 21, 21,568–74. [Google Scholar] [CrossRef] [PubMed]
- Xue, Y.; Wang, X.; Wan, B.; Wang, D.; Li, M.; Cheng, K.; Luo, Q.; Wang, D.; Lu, Y.; Zhu, L. Cav-1 accelerates hypoxia-induced endothelial dysfunction in high-altitude cerebral edema. Cell Commun Signal. 2022, 20, 160. [Google Scholar] [CrossRef] [PubMed]
- Jin, X.; Sun, Y.; Xu, J.; Liu, W. Cav-1 mediates tissue plasminogen activator-induced MMP-9 up-regulation in cultured brain microvascular endothelial cells. J Neurochem. 2015, 132, 132,724–30. [Google Scholar] [CrossRef]
- Madaro, L.; Antonangeli, F.; Favia, A.; Esposito, B.; Biamonte, F.; Bouché, M.; Ziparo, E.; Sica, G.; Filippini, A.; D'Alessio, A. Knock down of Cav-1 affects morphological and functional hallmarks of human endothelial cells. J Cell Biochem. 2013, 114, 1843–1851. [Google Scholar] [CrossRef] [PubMed]
- Huang, Q.; Zhong, W.; Hu, Z.; Tang, X. A review of the role of cav-1 in neuropathology and neural recovery after ischemic stroke. J Neuroinflammation. 2018, 15, 348. [Google Scholar] [CrossRef] [PubMed]
- Hua, H.; Munk, S.; Whiteside, C.I. Endothelin-1 activates mesangial cell ERK1/2 via EGF-receptor transactivation and caveolin-1 interaction. Am J Physiol Renal Physiol. 2003, 284, 284,F303–12. [Google Scholar] [CrossRef] [PubMed]
- Niesman, I.R.; Schilling, J.M.; Shapiro, L.A.; Kellerhals, S.E.; Bonds, J.A.; Kleschevnikov, A.M.; Cui, W.; Voong, A.; Krajewski, S.; Ali, S.S.; Roth, D.M.; Patel, H.H.; Patel, P.M; Head, B.P. Traumatic brain injury enhances neuroinflammation and lesion volume in caveolin deficient mice. J Neuroinflammation. 2014, 11, 39. [Google Scholar] [CrossRef] [PubMed]
- Chang, C.F.; Chen, S.F.; Lee, T.S.; Lee, H.F. Chen, S.F.; Shyue, S.K. Cav-1 deletion reduces early brain injury after experimental intracerebral hemorrhage. Am J Pathol. 2011, 178, 178,1749–61. [Google Scholar] [CrossRef] [PubMed]
- D'Alessio, A.; Al-Lamki, R.S.; Bradley, J.R.; Pober, J.S. Caveolae participate in tumor necrosis factor receptor 1 signaling and internalization in a human endothelial cell line. Am J Pathol. 2005, 166, 1273–1282. [Google Scholar] [CrossRef]
- Frank, P.G. Endothelial caveolae and Cav-1 as key regulators of atherosclerosis. Am J Pathol. 2010, 177, 544–546. [Google Scholar] [CrossRef]
- Fernández-Hernando, C.; Yu, J.; Suárez, Y.; Rahner, C.; Dávalos, A.; Lasunción, M.A.; Sessa, W.C. Genetic evidence supporting a critical role of endothelial Cav-1 during the progression of atherosclerosis. Cell Metab. 2009, 10, 10,48–54. [Google Scholar] [CrossRef] [PubMed]
- Choi, K.H.; Kim, H.S.; Park, M.S.; Lee, E.B.; Lee, J.K.; Kim, J.T.; Kim, J.H.; Lee, M.C.; Lee, H.J.; Cho, K.H. Overexpression of Cav-1 attenuates brain edema by inhibiting tight junction degradation. Oncotarget. 2016, 7, 67857–67867. [Google Scholar] [CrossRef] [PubMed]
- Chen, K.M.; Lan, K.P.; Lai, S.C. Heme oxygenase-1 modulates brain inflammation and apoptosis in mice with angiostrongyliasis. Parasitol Int. 2022, 87, 102528. [Google Scholar] [CrossRef] [PubMed]
- Zhao, X.; Tian, J.; Liu, Y.; Ye, Z.; Xu, M.; Huang, R.; Song, X. TLR4-Myd88 pathway upregulated caveolin-1 expression contributes to coronary artery spasm. Vascul Pharmacol. 2022, 142, 106947. [Google Scholar] [CrossRef] [PubMed]
- Kim, H.J.; Kim, H.; Lee, J.H.; Hwangbo, C. Toll-like receptor 4 (TLR4): new insight immune and aging. Immun Ageing. 2023, 20, 67. [Google Scholar] [CrossRef] [PubMed]
- Deguine, J.; Barton, G.M. MyD88: a central player in innate immune signaling. F1000Prime Rep. 2014, 6, 97. [Google Scholar] [CrossRef] [PubMed]
- Lei, C.; Li, Y.; Zhu, X.; Li, H.; Chang, X. HMGB1/TLR4 induces autophagy and promotes neuroinflammation after intracerebral hemorrhage. Brain Res. 2022, 9, 148003. [Google Scholar] [CrossRef] [PubMed]
- Gorina, R.; Font-Nieves, M.; Márquez-Kisinousky, L.; Santalucia, T.; Planas, A.M. Astrocyte TLR4 activation induces a proinflammatory environment through the interplay between MyD88-dependent NFkappaB signaling, MAPK, and Jak1/Stat1 pathways. Glia. 2011, 59, 242–255. [Google Scholar] [CrossRef]
- Bhaskar, S.; Sudhakaran, P.R.; Helen, A. Quercetin attenuates atherosclerotic inflammation and adhesion molecule expression by modulating TLR-NF-κB signaling pathway. Cell Immunol. 2016, 310, 131–140. [Google Scholar] [CrossRef]
- Xu, L.; Wang, L.; Wen, Z.; Wu, L.; Jiang, Y.; Yang, L.; Xiao, L.; Xie, Y.; Ma, M.; Zhu, W.; Ye, R.; Liu, X. Caveolin-1 is a checkpoint regulator in hypoxia-induced astrocyte apoptosis via Ras/Raf/ERK pathway. Am J Physiol Cell Physiol. 2016, 310, C903–C910. [Google Scholar] [CrossRef]
- Head, B.P.; Patel, H.H.; Tsutsumi, Y.M.; Hu, Y.; Mejia, T.; Mora, R.C.; Insel, P.A.; Roth, D.M.; Drummond, J.C.; Patel, P.M. Caveolin-1 expression is essential for N-methyl-D-aspartate receptor-mediated Src and extracellular signal-regulated kinase 1/2 activation and protection of primary neurons from ischemic cell death. FASEB J. 2008, 22, 828–840. [Google Scholar] [CrossRef] [PubMed]
- Jin, H.Q.; Jiang, W.F.; Zheng, X.T.; Li, L.; Fang, Y.; Yang, Y.; Hu, X.W.; Chu, L.S. MiR-199a-5p enhances neuronal differentiation of neural stem cells and promotes neurogenesis by targeting Cav-1 after cerebral ischemia. CNS Neurosci Ther. 2023, 29, 3967–3979. [Google Scholar] [CrossRef] [PubMed]
- Lan, K.P.; Wang, C.J.; Hsu, J.D.; Chen, K.M.; Lai, S.C.; Lee, H.H. Induced eosinophilia and proliferation in Angiostrongylus cantonensis-infected mouse brain are associated with the induction of JAK/STAT1, IAP/NF-kappaB and MEKK1/JNK signals. J Helminthol. 2004, 78, 78,311–7. [Google Scholar] [CrossRef] [PubMed]
- Lee, H.H.; Shiow, S.J.; Chung, H.C.; Huang, C.Y.; Lin, C.L.; Hsu, J.D.; Shyu, L.Y.; Wang, C.J. Development of brain injury in mice by Angiostrongylus cantonensis infection is associated with the induction of transcription factor NF-kappaB, nuclear protooncogenes, and protein tyrosine phosphorylation. Exp Parasitol. 2000, 95, 202–208. [Google Scholar] [CrossRef] [PubMed]
- Shin, J.S.; Abraham, S.N. Co-option of endocytic functions of cellular caveolae by pathogens. Immunology. 2001, 102, 2–7. [Google Scholar] [CrossRef] [PubMed]
- Norkin, L.C. Caveolae in the uptake and targeting of infectious agents and secreted toxins. Adv Drug Deliv Rev. 2001, 49, 301–315. [Google Scholar] [CrossRef] [PubMed]
- Sieczkarski, S.B.; Whittaker, G.R. Influenza virus can enter and infect cells in the absence of clathrin-mediated endocytosis. J Virol. 2002, 76, 10455–10464. [Google Scholar] [CrossRef] [PubMed]
- Xing, Y.; Wen, Z.; Gao, W.; Lin, Z.; Zhong, J.; Jiu, Y. Multifaceted Functions of Host Cell Caveolae/Cav-1 in Virus Infections. Viruses. 2020, 12, 487. [Google Scholar] [CrossRef]
- Huang, W.; András, I.E.; Rha, G.B.; Hennig, B.; Toborek, M. PPARα and PPARγ protect against HIV-1-induced MMP-9 overexpression via caveolae-associated ERK and Akt signaling. FASEB J. 2011, 25, 3979–3988. [Google Scholar] [CrossRef]
- Rodríguez, N.E.; Gaur, U.; Wilson, M.E. Role of caveolae in Leishmania chagasi phagocytosis and intracellular survival in macrophages. Cell Microbiol. 2006, 8, 1106–1120. [Google Scholar] [CrossRef]
- Rai, A.K.; Johnson, P.J. Trichomonas vaginalis extracellular vesicles are internalized by host cells using proteoglycans and caveolin-dependent endocytosis. Proc Natl Acad Sci U S A. 2019, 116, 21354–21360. [Google Scholar] [CrossRef] [PubMed]
Disclaimer/Publisher’s Note: The statements, opinions and data contained in all publications are solely those of the individual author(s) and contributor(s) and not of MDPI and/or the editor(s). MDPI and/or the editor(s) disclaim responsibility for any injury to people or property resulting from any ideas, methods, instructions or products referred to in the content. |
© 2024 by the authors. Licensee MDPI, Basel, Switzerland. This article is an open access article distributed under the terms and conditions of the Creative Commons Attribution (CC BY) license (http://creativecommons.org/licenses/by/4.0/).


