1. Introduction
The generation of random and pseudorandom sequences is of importance to areas such as science and technology [
1,
2,
3]. Therefore, the design of RNG or PRNG generators that can produce this type of sequence in hardware or software, must have good statistical properties to be used for different purposes such as biological systems [
4,
5]. The RNG
Random Number Generator is a random number generator that uses sources such as noise from electronic circuits, the quantum effect of semiconductors, the combination of temperature and time, among others [
1,
6,
7]. The TRNG
True Random Number Generator is widely used in cryptographic systems and is capable of generating truly random sequences [
8,
9] and the PRNG uses an RNG as a seed, i.e., initial data [
1,
5]. Furthermore, it produces pseudorandom or perfectly pseudorandom sequences [
5]. Pseudorandom sequences are those that are deterministic, but appear to be random [
10,
11]. Some applications include areas such as cryptography for use in key encryption, electronic circuits testing, simulation process, financial models, etc. [
1,
4,
5,
8,
10].
One method to generate pseudorandom numbers is the LFSR
Linear Feedback Shift Register, as seen in
Figure 1. This is a PRNG generator that can generate binary sequences. Its, simplicity and favorable statistical qualities make the generator an important element for processes such as stream encryption [
8,
9]. The LFSR uses a mathematical model to produce the sequence of maximum length using Equation (1) [
2]. This is obtained when the feedback is characterized by a primitive polynomial of degree
m [
4,
8,
9]. Xilinx provided in its document in [
12] a table of the recommended pins to use for feedback according to the length of the LFSR and obtain the maximum sequence that can be generated [
12].
To validate that the sequences are random, pseudorandom or perfectly pseudorandom, there are different types of statistical tests that are included in a set. One is the Diehard test, which is made up of 14 statistical tests [
13,
14]. These are the Birthday spacings, Overlapping permutations, Ranks of matrices, Monkey tests, 20-bit word stream, Count de ones in a byte sequence, Count of ones in a specific byte, Parking lot test, Minimum distance, Random spheres test, Reduction test, Overlapping sums test, Runs test and the Craps test [
13,
14,
15]. Another set of tests to evaluate and validate random sequences is TestU01, which is a library implemented in ANSI C [
16] and the 15 statistical tests proposed by NIST. The fifteen tests are the Frequency (Monobit) test, the Frequency test within a Block, the Runs test, the Longest-Run-of-Ones in a Block test, Binary Matrix Rank test, the Discrete Fourier Transform (Spectral) Test, the Non-overlapping Template Matching test, the Overlapping Template Matching test, the Maurer’s Universal Statistical test, the Linear Complexity test, the Serial test, the Approximate Entropy test, the Cumulative Sums (Cusums) test, the Random Excursions test and the Random Excursions Variant test [
5,
13].
This work presents the design of a new pseudorandom number neuro-generator that produces sequences with good statistical properties, as is shown by the results of the NIST tests. This neuro-generator consists of two LFSR shift registers, which are loaded with initial data called seed or external data. The circuit has a neuronal module connected to the clk signal of one of the LFSRs to produce pulses aperiodically, while the other LFSR maintains periodicity in the pulses clk. The parallel output of the registers is connected to a logic block to process the data and decides through a multiplexer which one passes to the output of the neuro-generator. To evaluate the sequences that the neuro-generator produces, a series of tests were performed. The first is with the neuronal module disabled to maintain the clock pulses of the LFSRs constants. Hence, the frequency of the first LFSR varies, while the frequency of the second one remains at a certain frequency. The seed data was loaded in the first test series without a neuronal module, and the external data was in the second series. Tests were also conducted with the neuronal module connected, while keeping the LFSRs at the same frequency as the impulse neurons. In this case, the frequency was changed from 4 kHz to 100 MHz. The sequences produced by the neuro-generator with different frequencies pass approximately ten statistical tests. Some of these with results where the conclusion of the sequence is perfectly random, as the Frequency (Monobit) test. This test is the first of the fifteen statistical tests of the NIST and one of the most important of the entire set [
5].
2. Statistical Tests Proposed by NIST for Validation of RNG and PRNG Generators
Each of the statistical tests proposed by NIST must conclude whether or not the sequence being validated is random, perfectly random, pseudorandom or perfectly pseudorandom [
1,
5]. For each one, a statistical value called a
P-value is calculated, which has to be greater than 0.01 for sequences of 100 and greater than 0.001 for sequences of 1000 [
1,
5,
6,
10]. The
P-value is a probabilistic value that uses a statistical test to give strength of evidence against the null hypothesis
[
1,
5,
6]. The purpose of the null hypothesis is to prove that the sequence is random. However, when the sequence is not random, we have the alternative hypothesis
[
5,
6,
17].
Table 1 shows the different cases of hypothesis and the type of error corresponding to each one. Error type I indicates that
has been rejected when true and error type II accepts
when false [
5,
6,
17].
Table 2 shows the description and equation to obtain the
P-value of each of the statistical tests proposed by NIST in [
5]. It is important to highlight that each of the tests has a different methodology to evaluate the sequences [
5].
3. Design of the PRNG Pseudorandom Number Neuro-Generator
The design of a new neuro-generator type PRNG was carried out as shown in
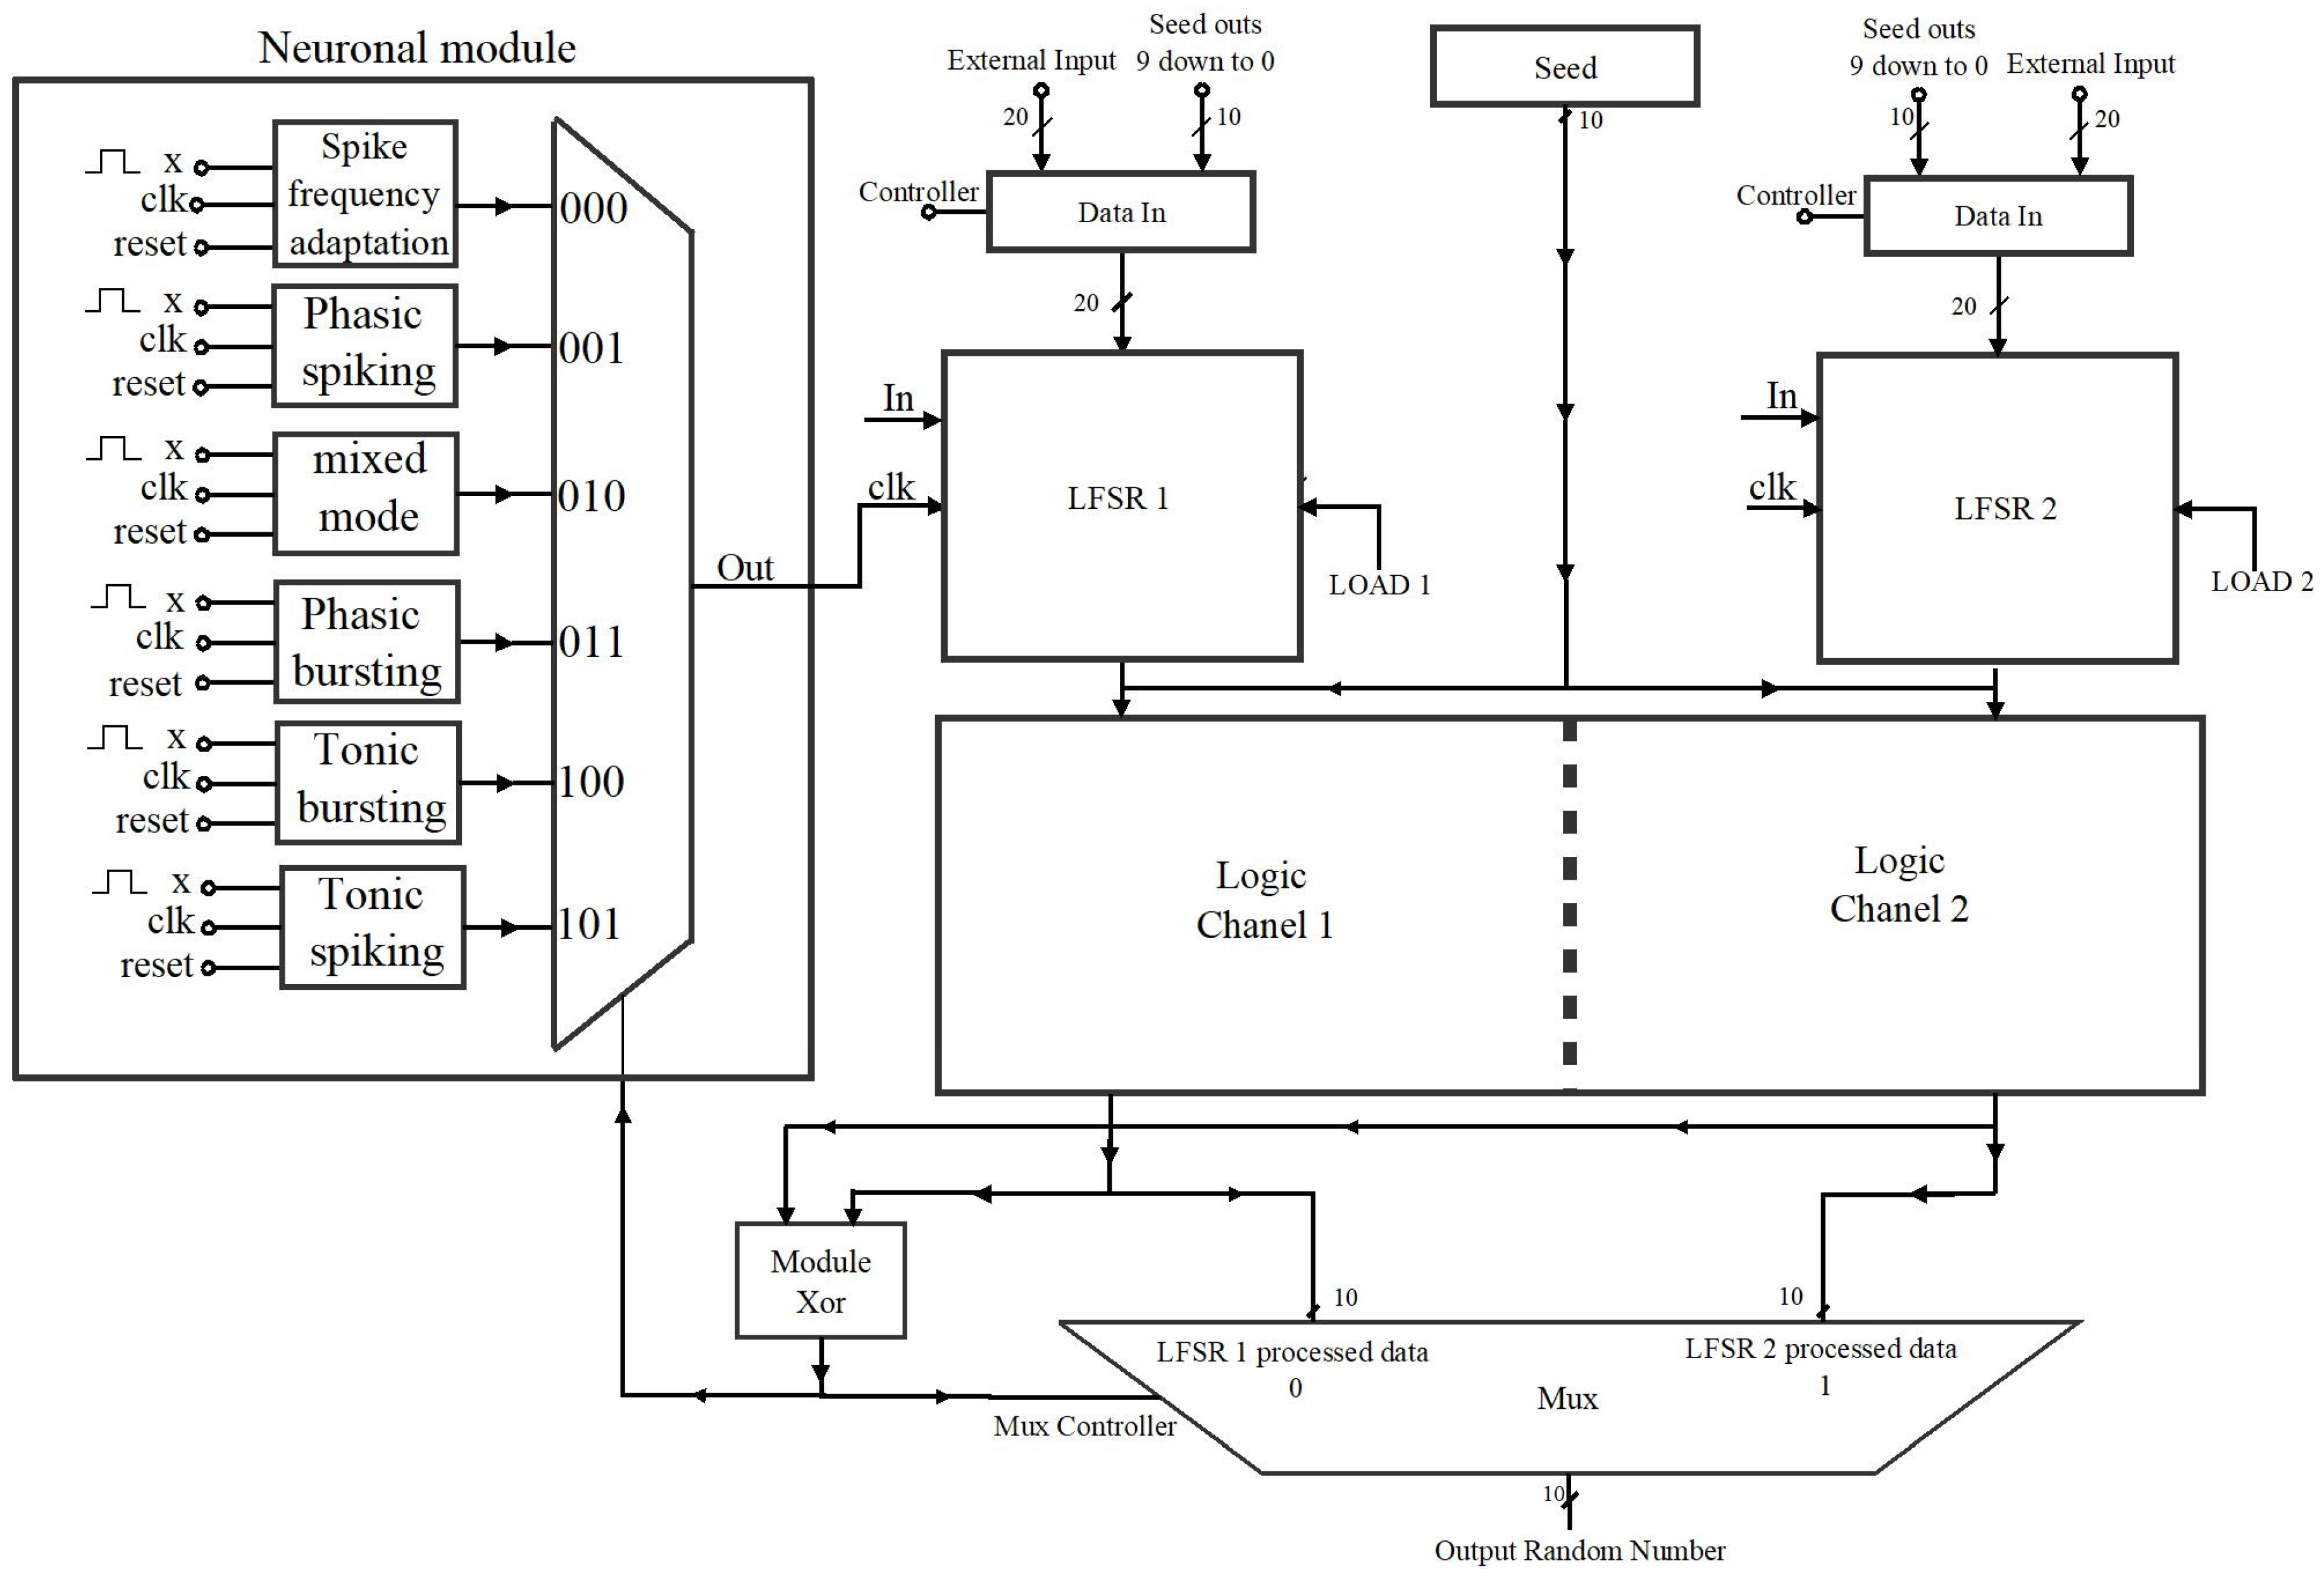
Figure 2. The neuro-generator circuit consists of two Data In blocks that determine if the data that is loaded to the LFSR is external data or seed data only if LOAD is enabled. The data already loaded in both registers, for each pulse that generates the clock signal clk, is moved one position to the right. This allow a new feedback bit to enter the missing position, while at the same time new parallel output data is generated. The output values of the LFSRs are processed by logical blocks to obtain a new sequence, that will be part of the output sequence. To select the bits that pass to the output of the neuro-generator, the processed data from LFSR1 or LFSR2 passes to a MUX multiplexer. The XOR module connected to the controller determines the source of the data that is passed to the output. When the output of this module is 0, the bits that are passed to the output are those of Logic Channel 1. On the other hand, if the value is 1, the bits of Logic Channel 2 are passed to the output.
The neuronal module that is connected to the neuro-generator was designed with impulse neurons, each with different behaviors. In
Figure 2, it is seen that the output of the module is connected to register LFSR1. The module decides through a multiplexer, the pulses that pass to the clk signal to generate an aperiodic signal, while, in the LFSR2 the clock signal clk remains periodic.
3.1. Neuro-Generator Neuronal Module
The neuronal module of the neuro-generator uses six impulse neurons with different behaviors, which base their behavior on impulses from mammalian cortical neurons [
10,25–29]. The simple Izhikevich model of Equations (2) and (3) is used to simulate the 20 behaviors of impulse neurons. These consist of two ordinary differential equations to represent the membrane potential and Equation (4) is the recovery variable that uses a reset condition when the impulse is generated [
10], [25–29]. The variables are:
v the membrane potential,
‘ the derivative concerning time,
u the recovery variable,
a the time scale of the recovery variable
u,
b the sensitivity of recovery variable
u to subthreshold fluctuations of the membrane potential,
c the reset value that the membrane potential adopts after the impulse and
d is the reset after the recovery variable
u [
10,25–29].
Modifying the values of parameters
a,
b,
c and
d, lead to different behaviors [25–29]. On the official website of Dr. Izhikevich [29] it is possible to find the relevant information on impulse neurons and the MATLAB code provided by the author himself. In this case, frequency adaptation, phasic impulse, mixed mode, phasic bursts, tonic bursts and tonic impulse were used for the neuronal module.
Table 3 shows the values that correspond to each behavior used. The description in hardware of the neuron block as the one seen in
Figure 3, was made using VHDL hardware description. This block has a clock signal clk, reset and a stimulus input called x. For each neuron, it is necessary to enter a pulse to stimulate it and begin to produce a series of pulses corresponding to the type of behavior.
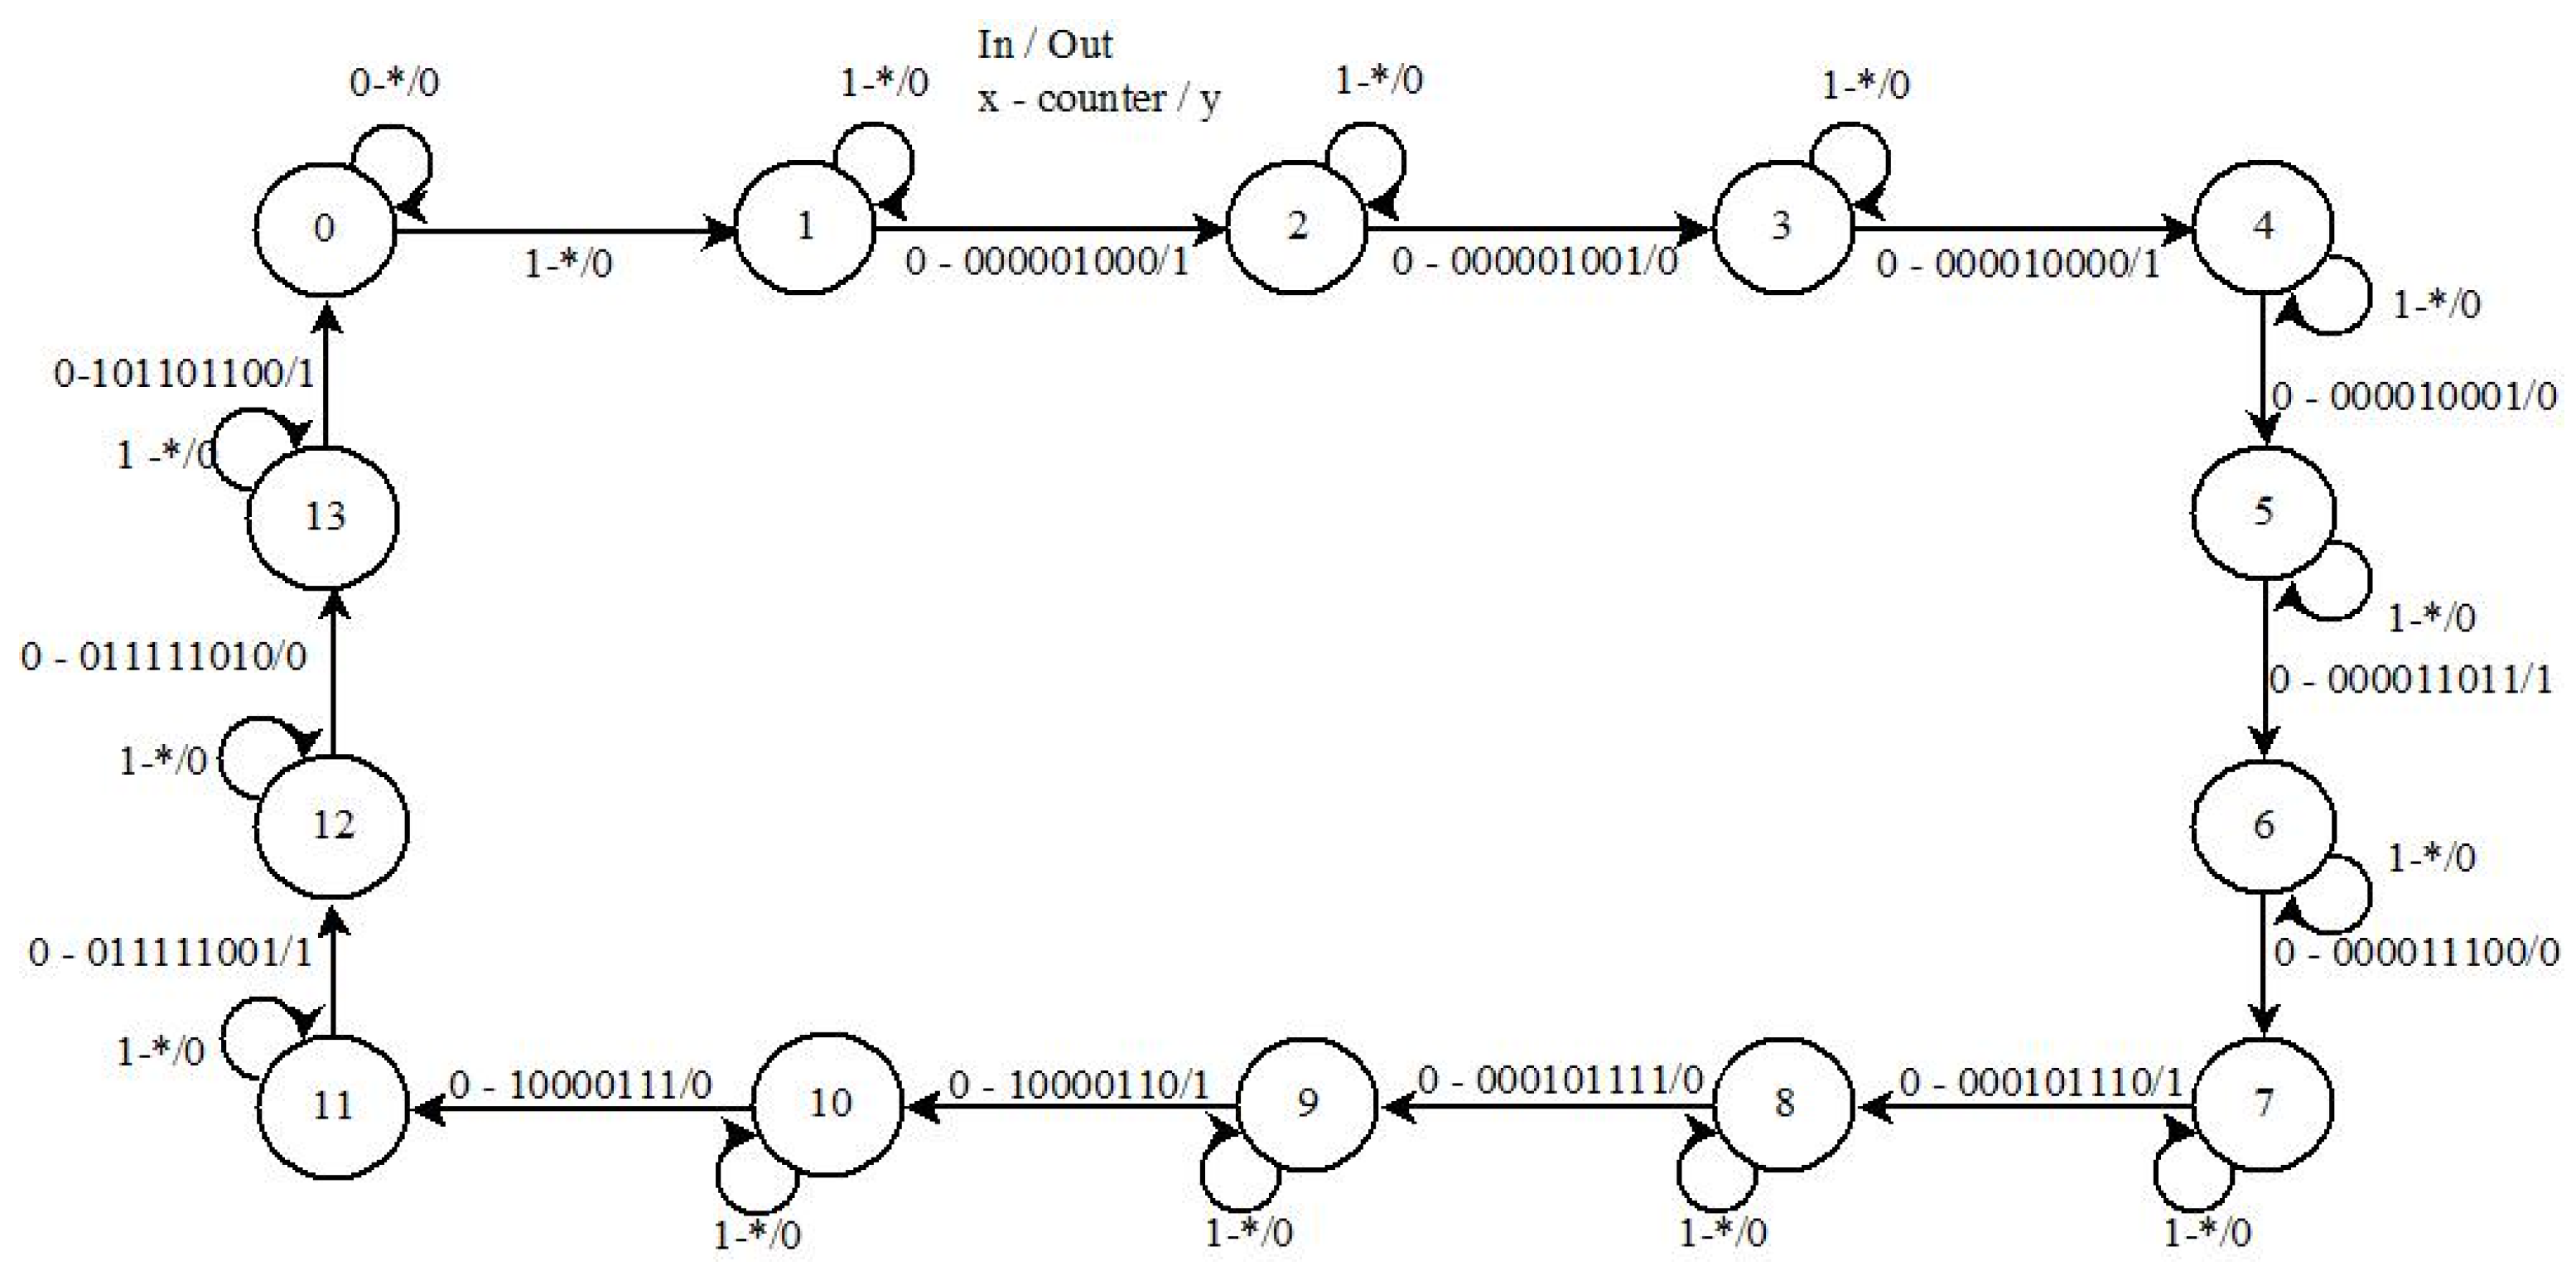
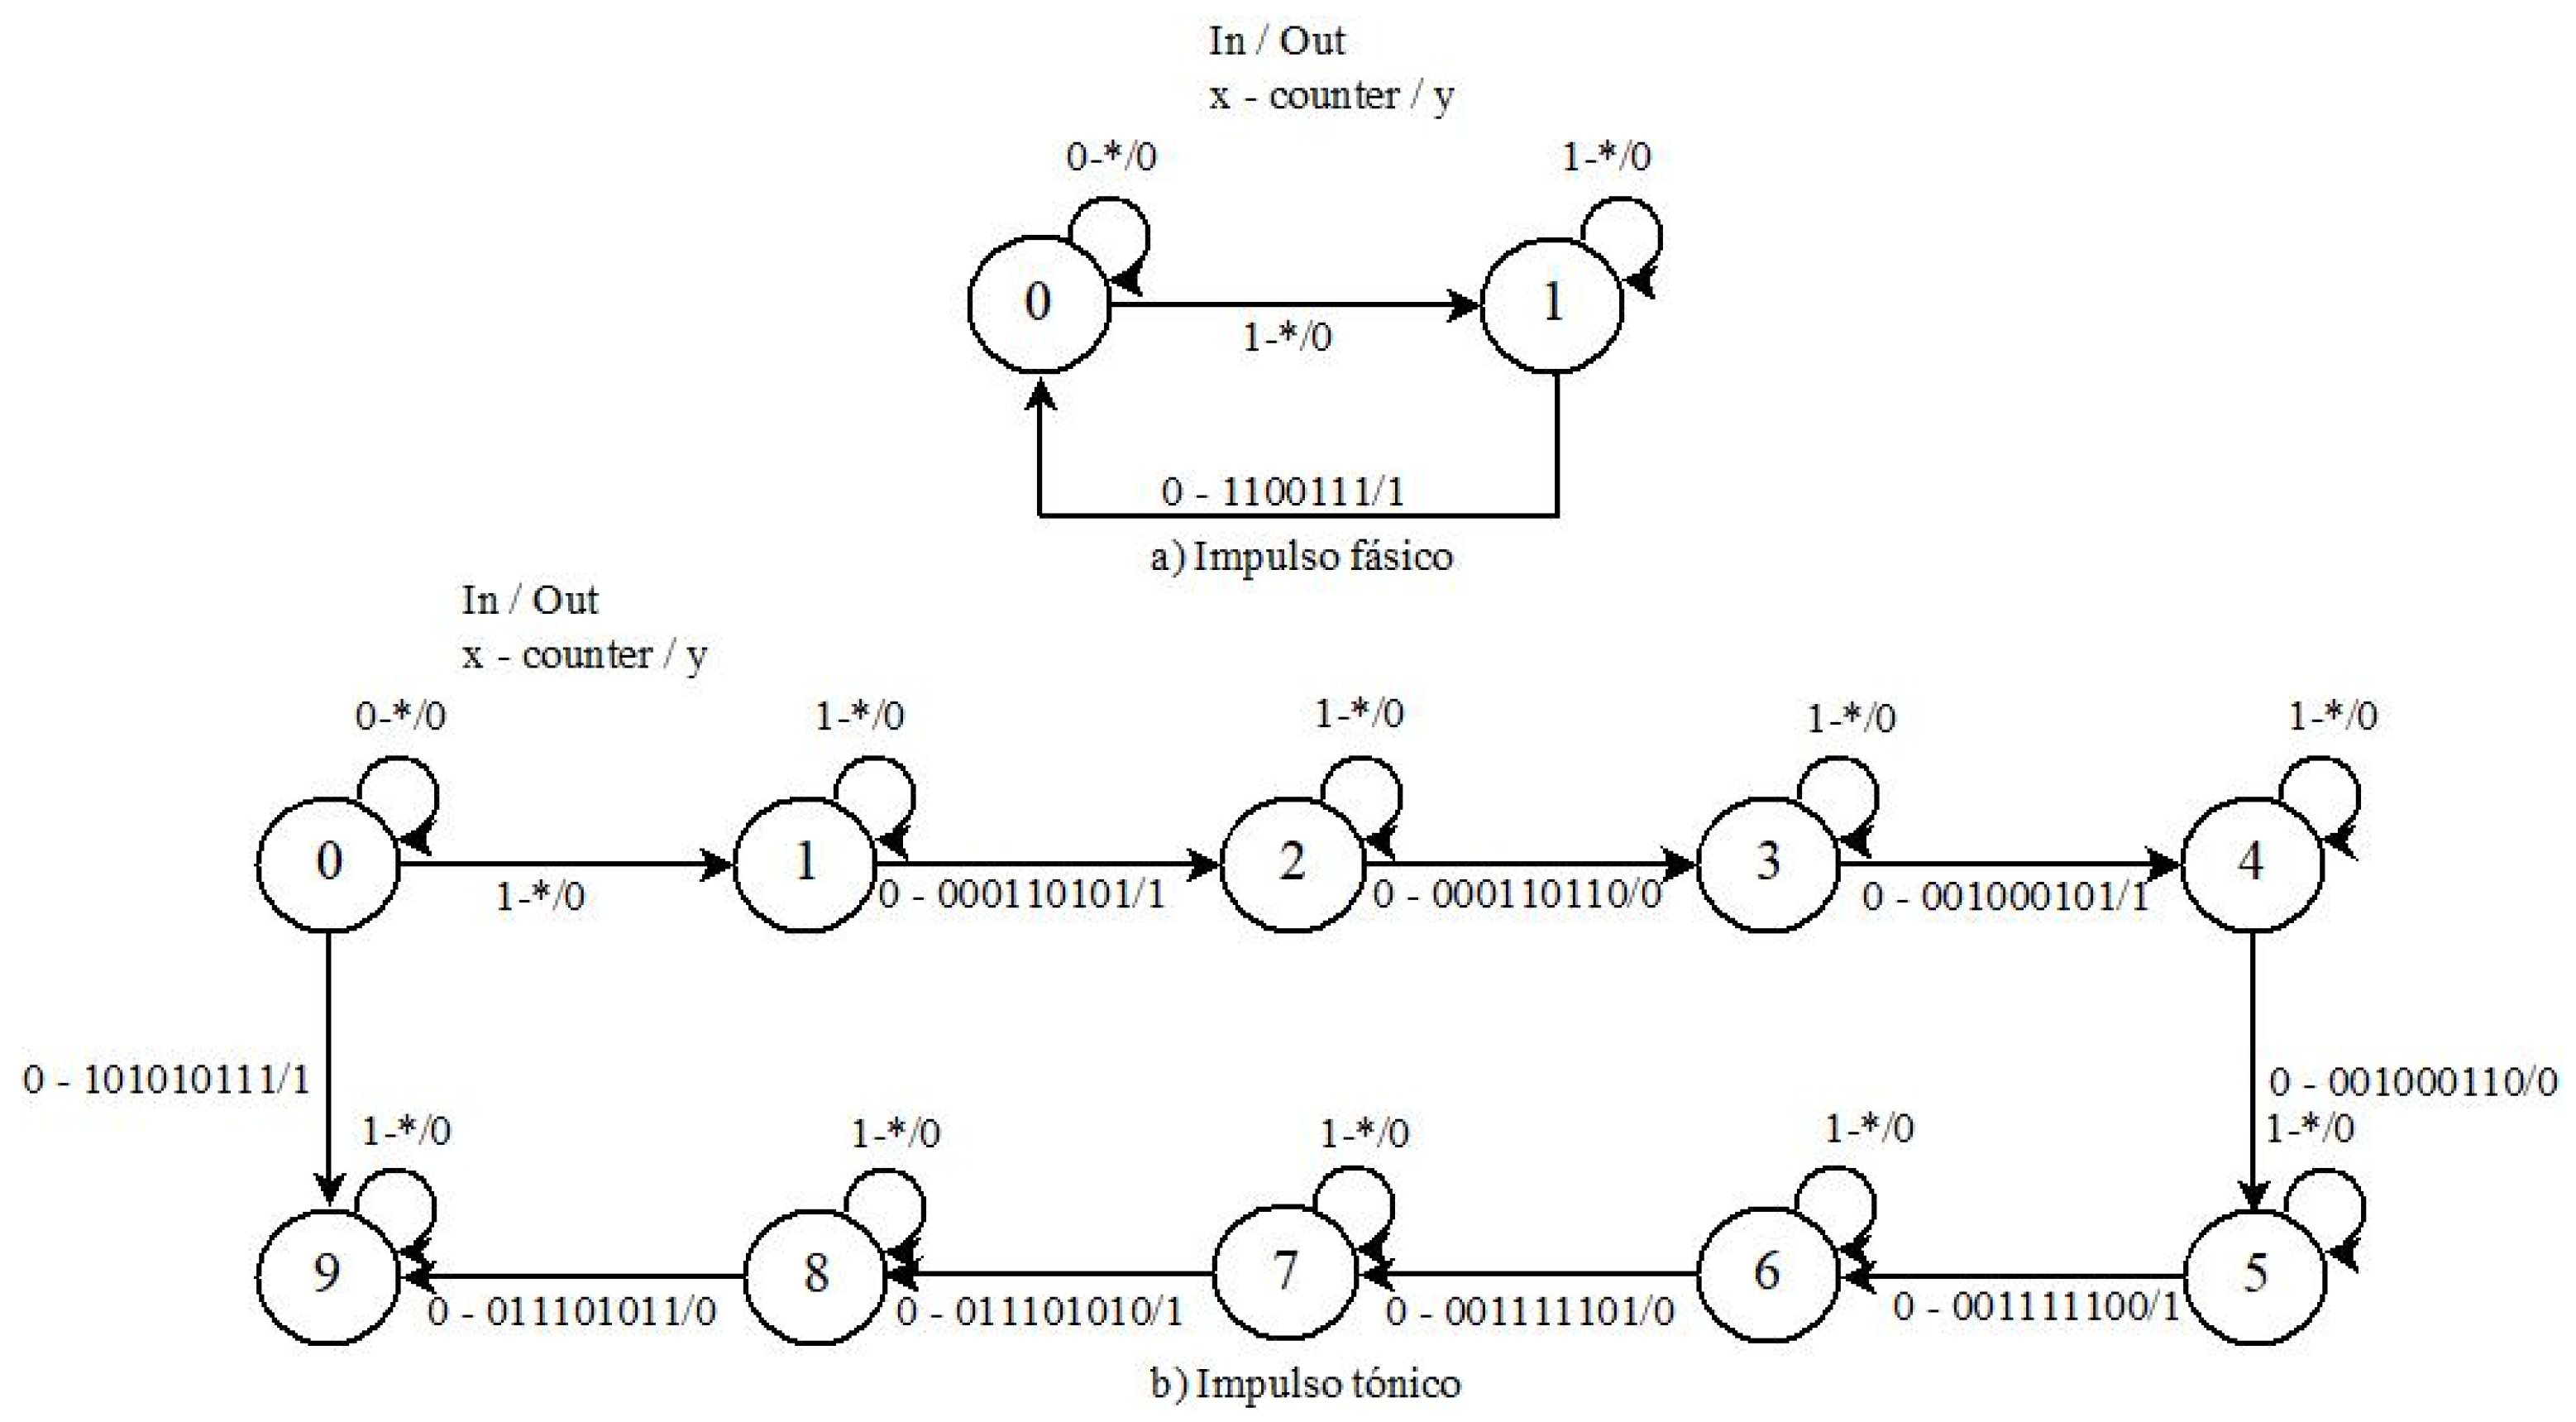
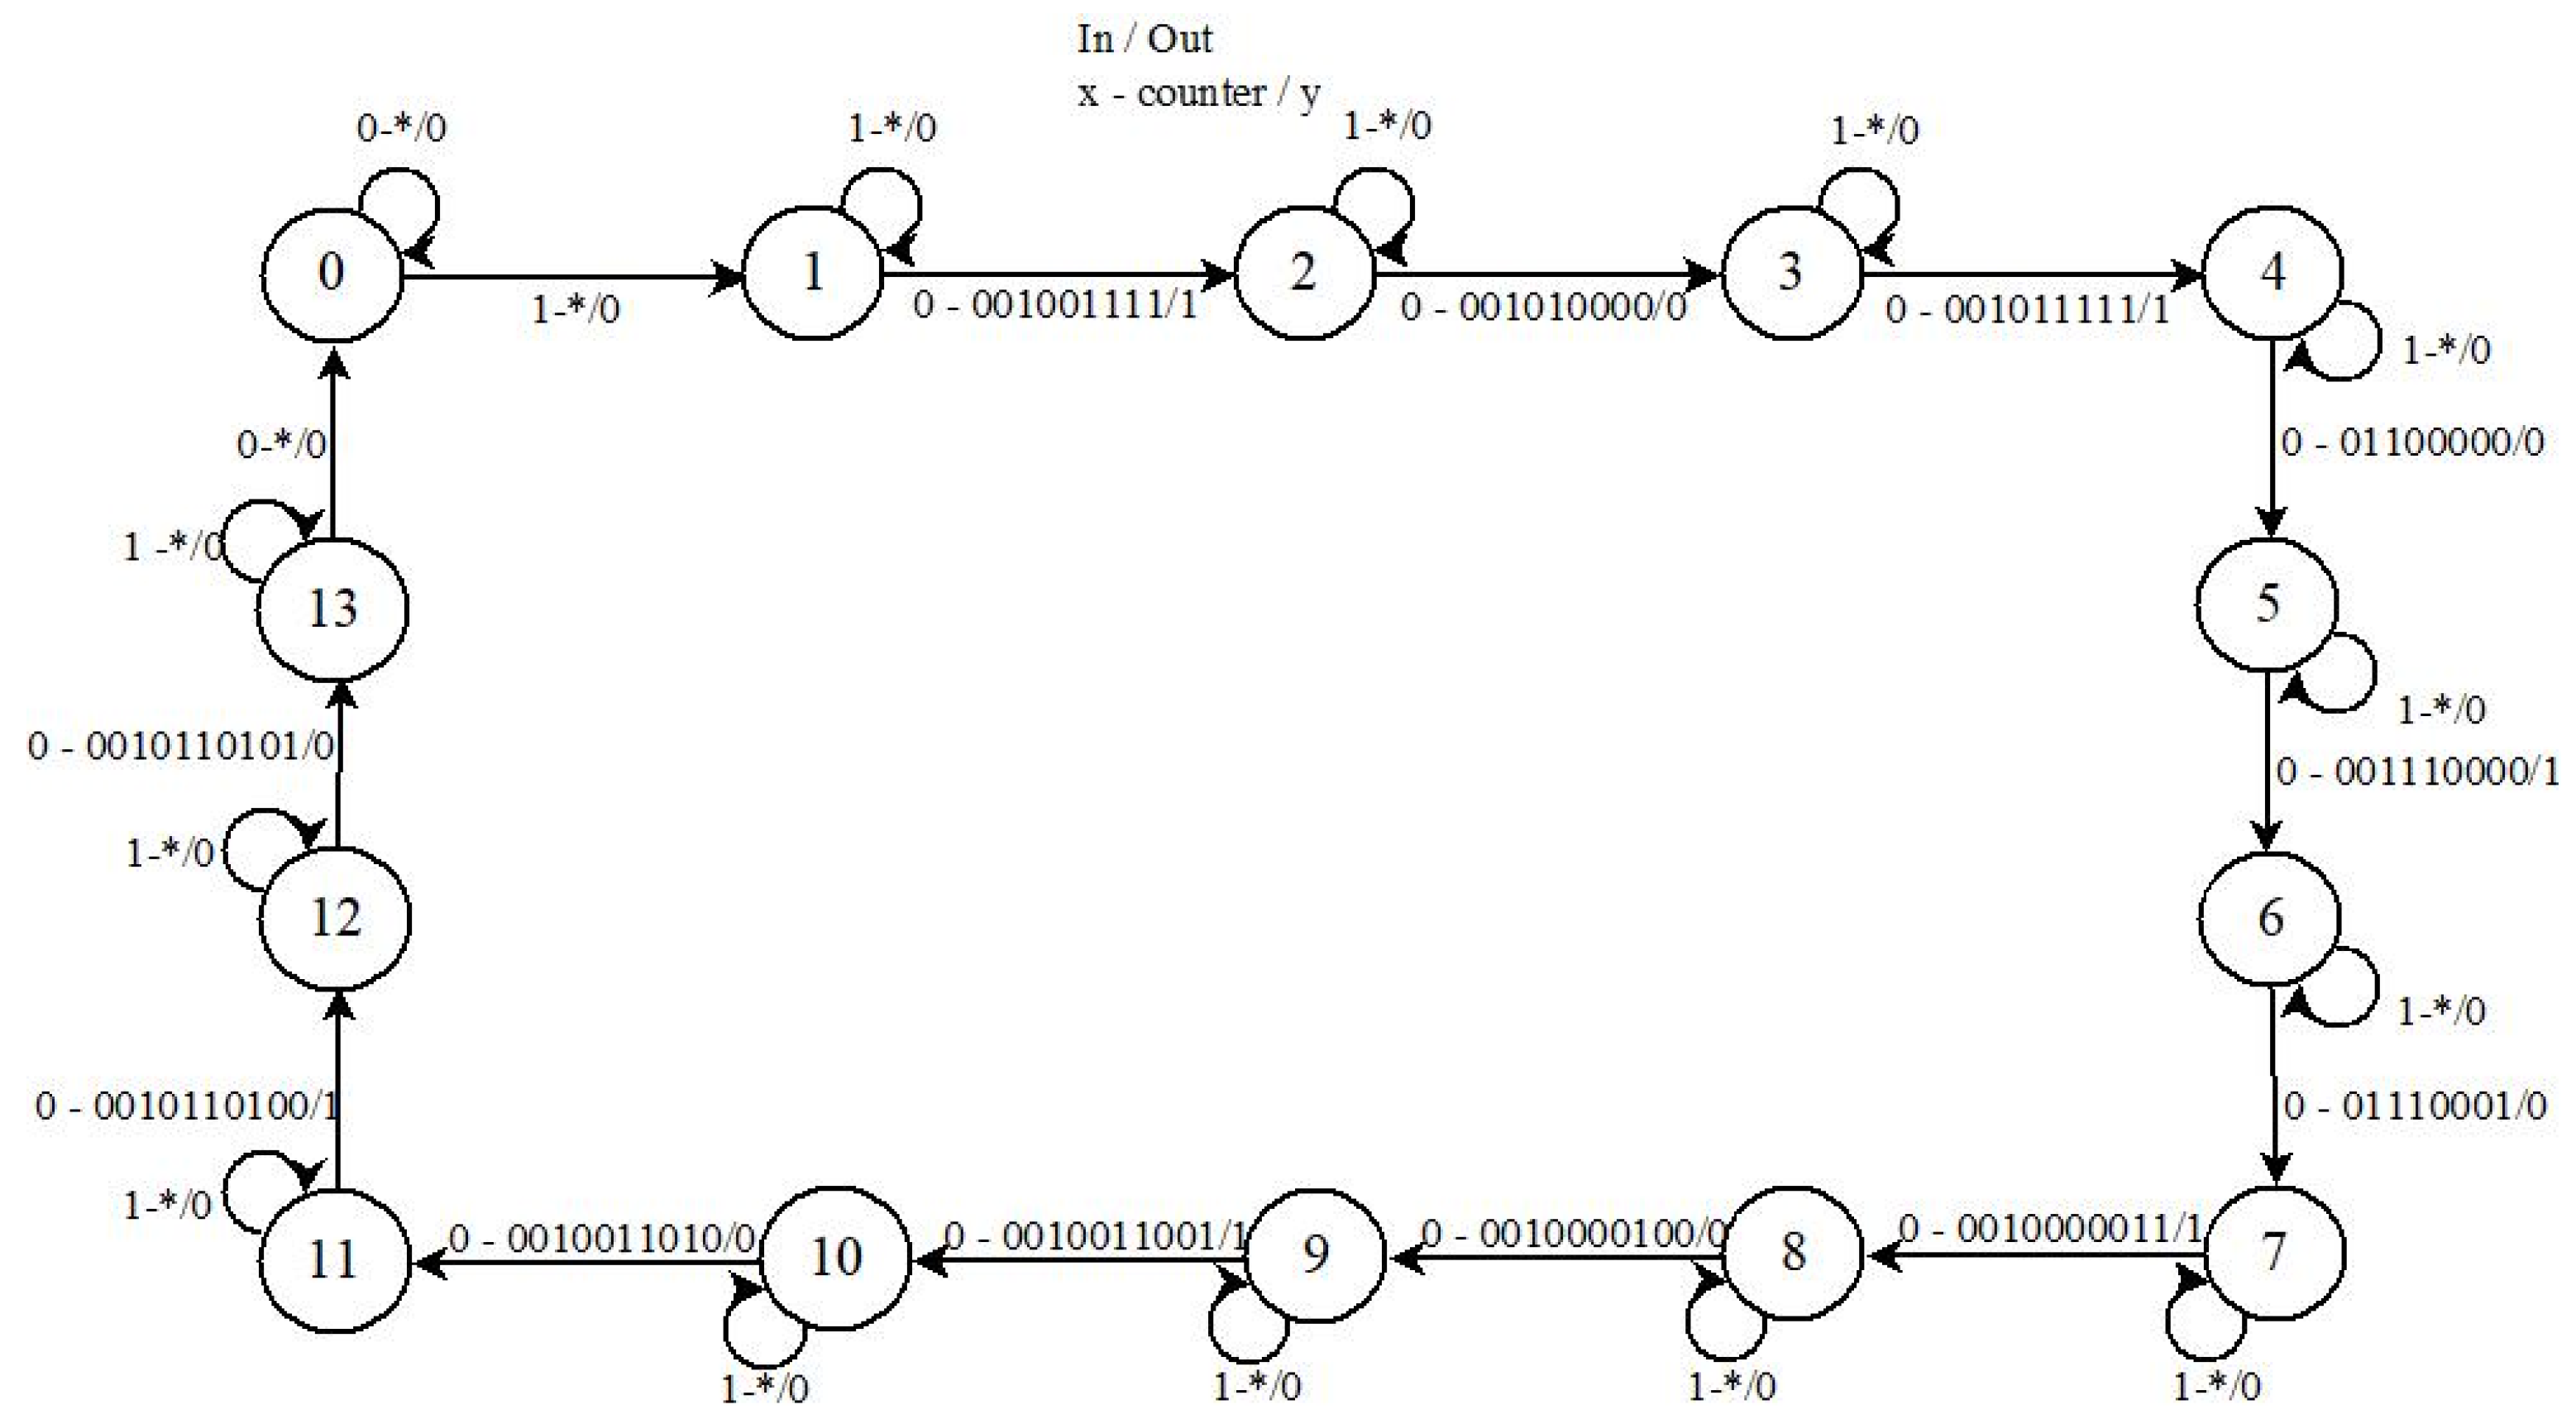
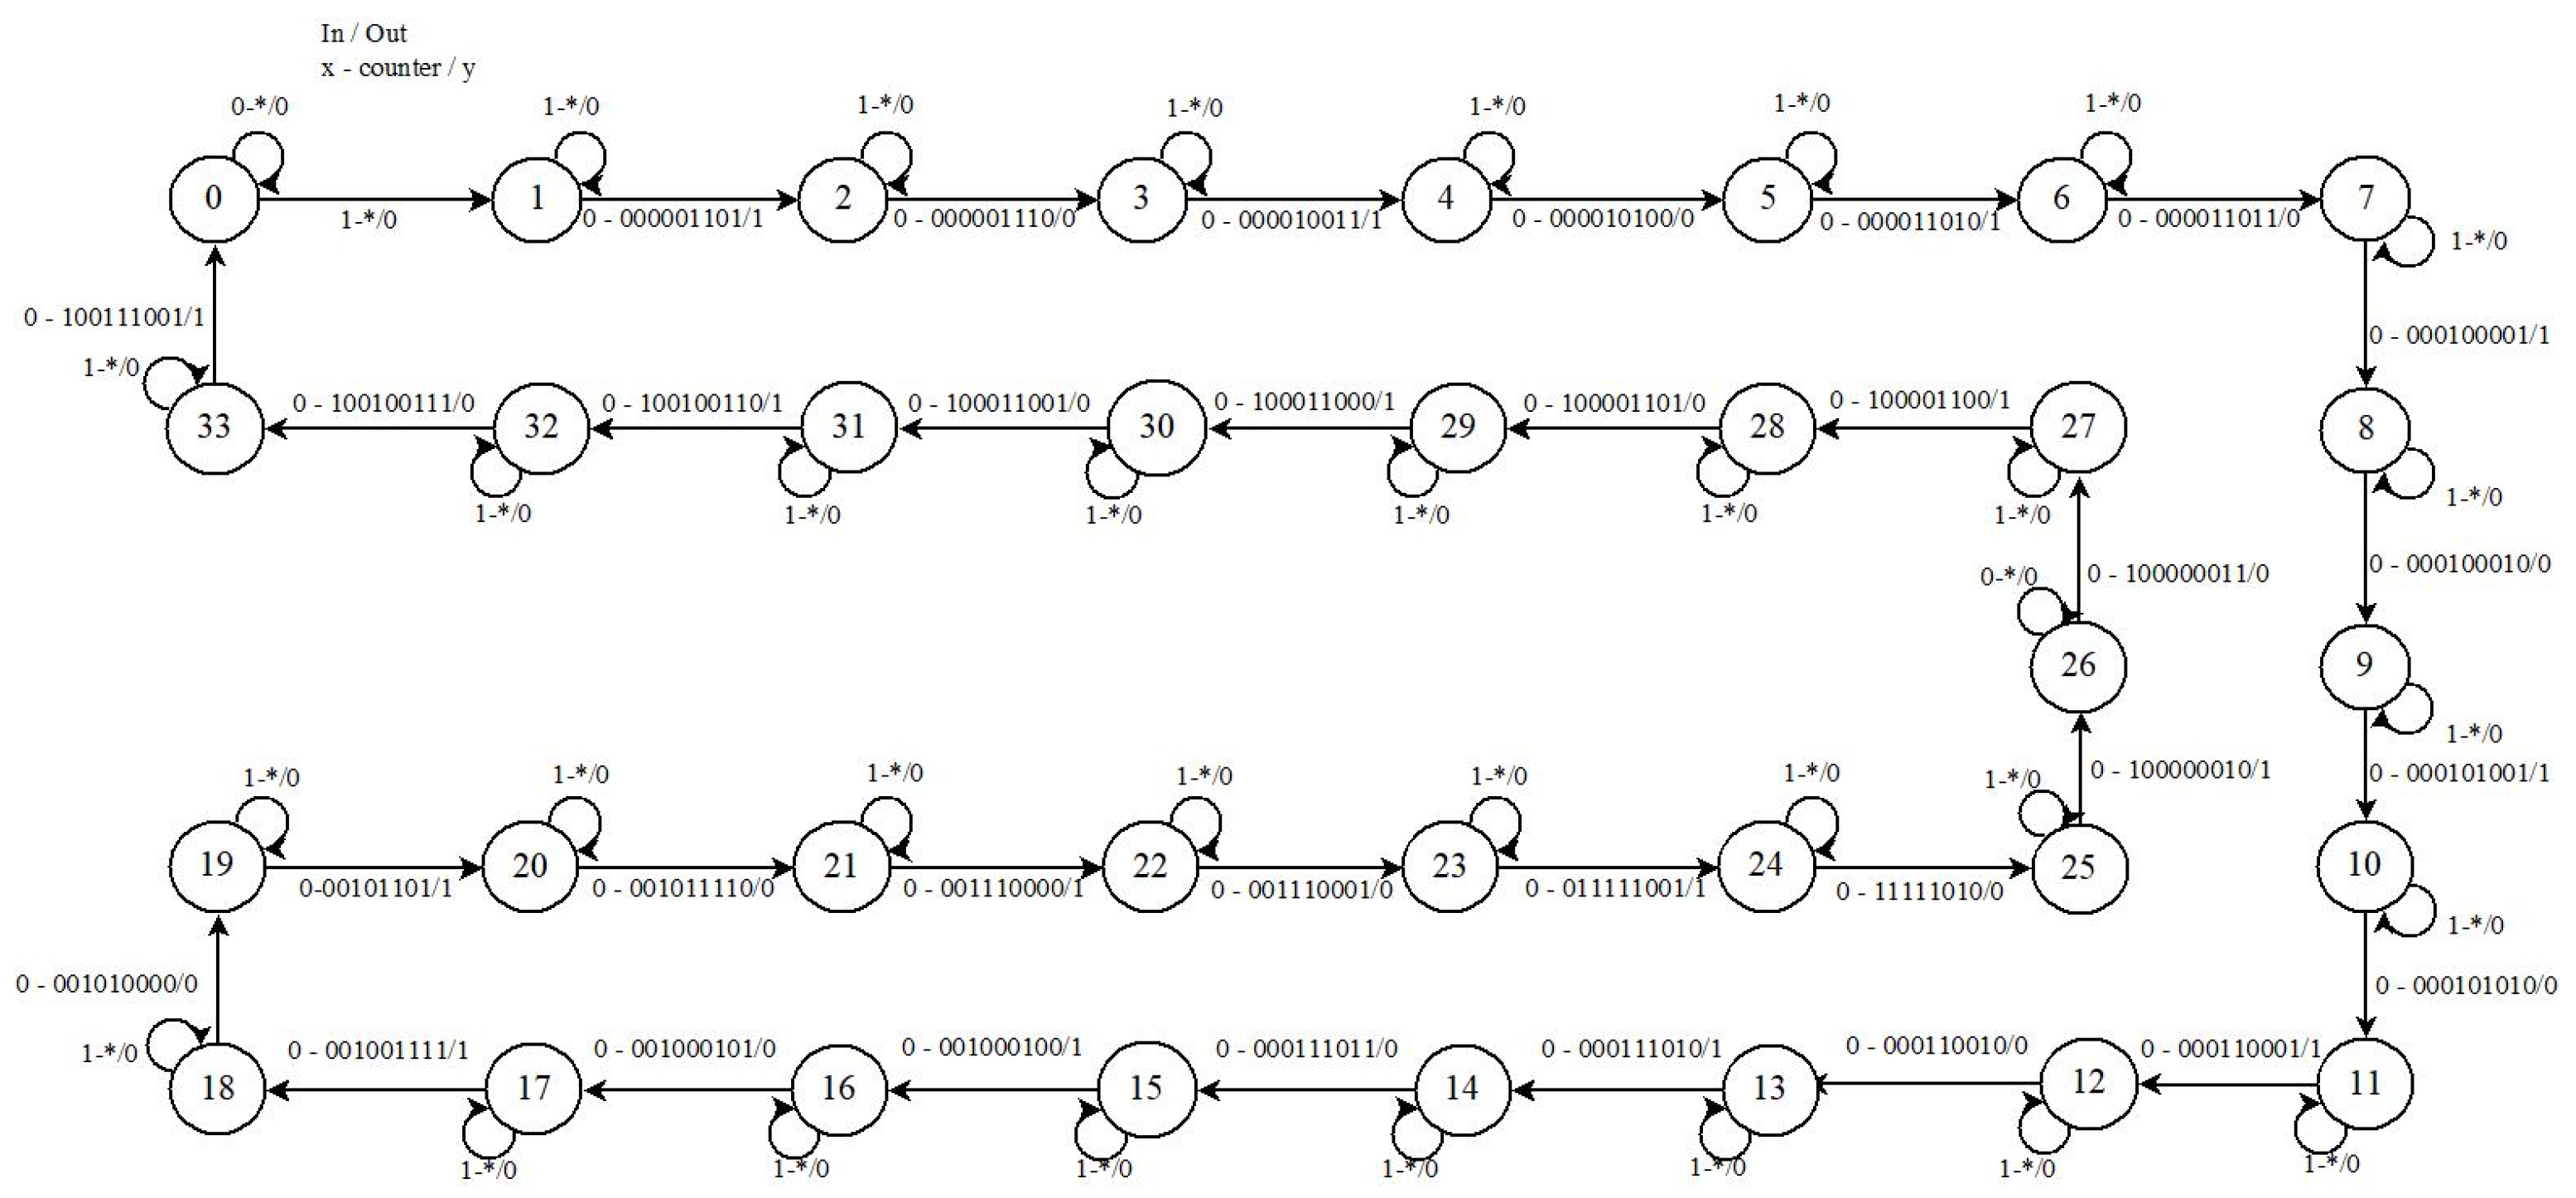
For each neuron used in the neuronal module, a state machine was designed. Each one has an input variable x, which must be in a high state to stimulate the neuron, without needing to remain in this state. The counter is the variable that represents each of the iterations to generate the start and end of the pulse, which is reflected in the output of the neuron in “y”. The number of pulses shown at the output of the neuron depends on its behavior and the reset variable is used to restart the neuron.
When the input stimulus is presented, the neuron with frequency adaptation behavior can produce a series of seven pulses [25–29].
Figure 4 shows the state machine that describes this behavior to represent it, where for every two states, starting with state one, they correspond to the start and end of the first pulse. This continues until the five pulses have been completed. If the condition is not met in any of the states, then it remains in the same state until all the conditions are completed and the cycle can continue [25–29].
The estate machine of phasic impulse behavior in a) of
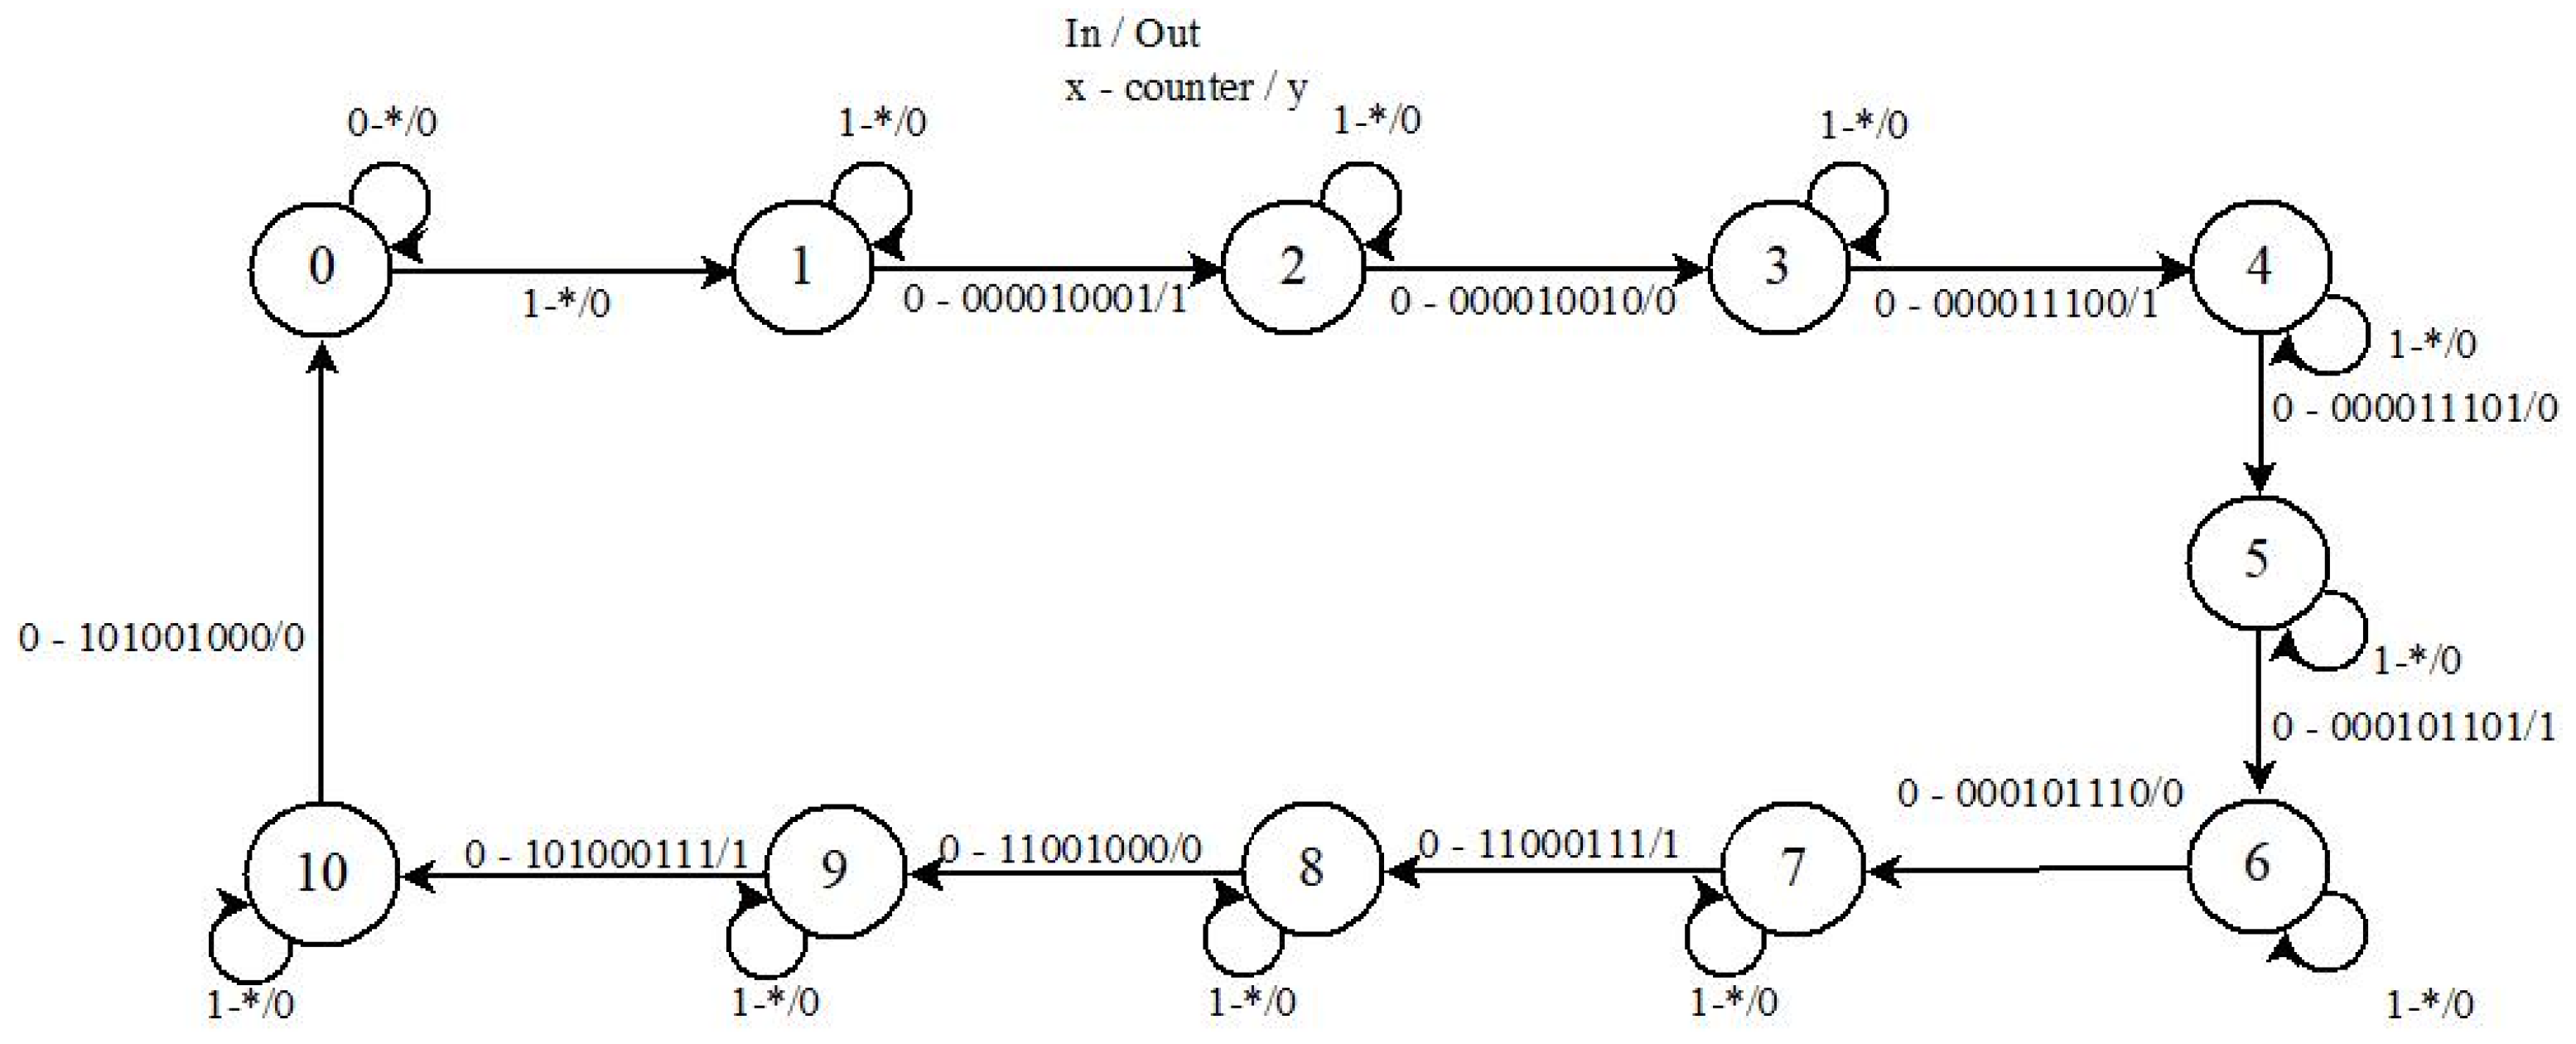
Figure 5, only has two states to produce a single output pulse when the neuron is stimulated. On the other hand, the tonic impulse neuron in b), consists of nine states to produce five output pulses. In the mixed mode neuron in its state machine in
Figure 6, a total of ten states are observed to produce five pulses [25–29].
Lastly, the state machines of the neuron’s phasic burst behavior in
Figure 7, need a total of 13 states to produce six pulses and tonic bursts in
Figure 8, require 33 states for a series of sixteen pulses [
10,25–29].
4. Simulation and Implementation of the Neuro-Generator in the FPGA Virtex 7 xc7vx85t-2ffg1761
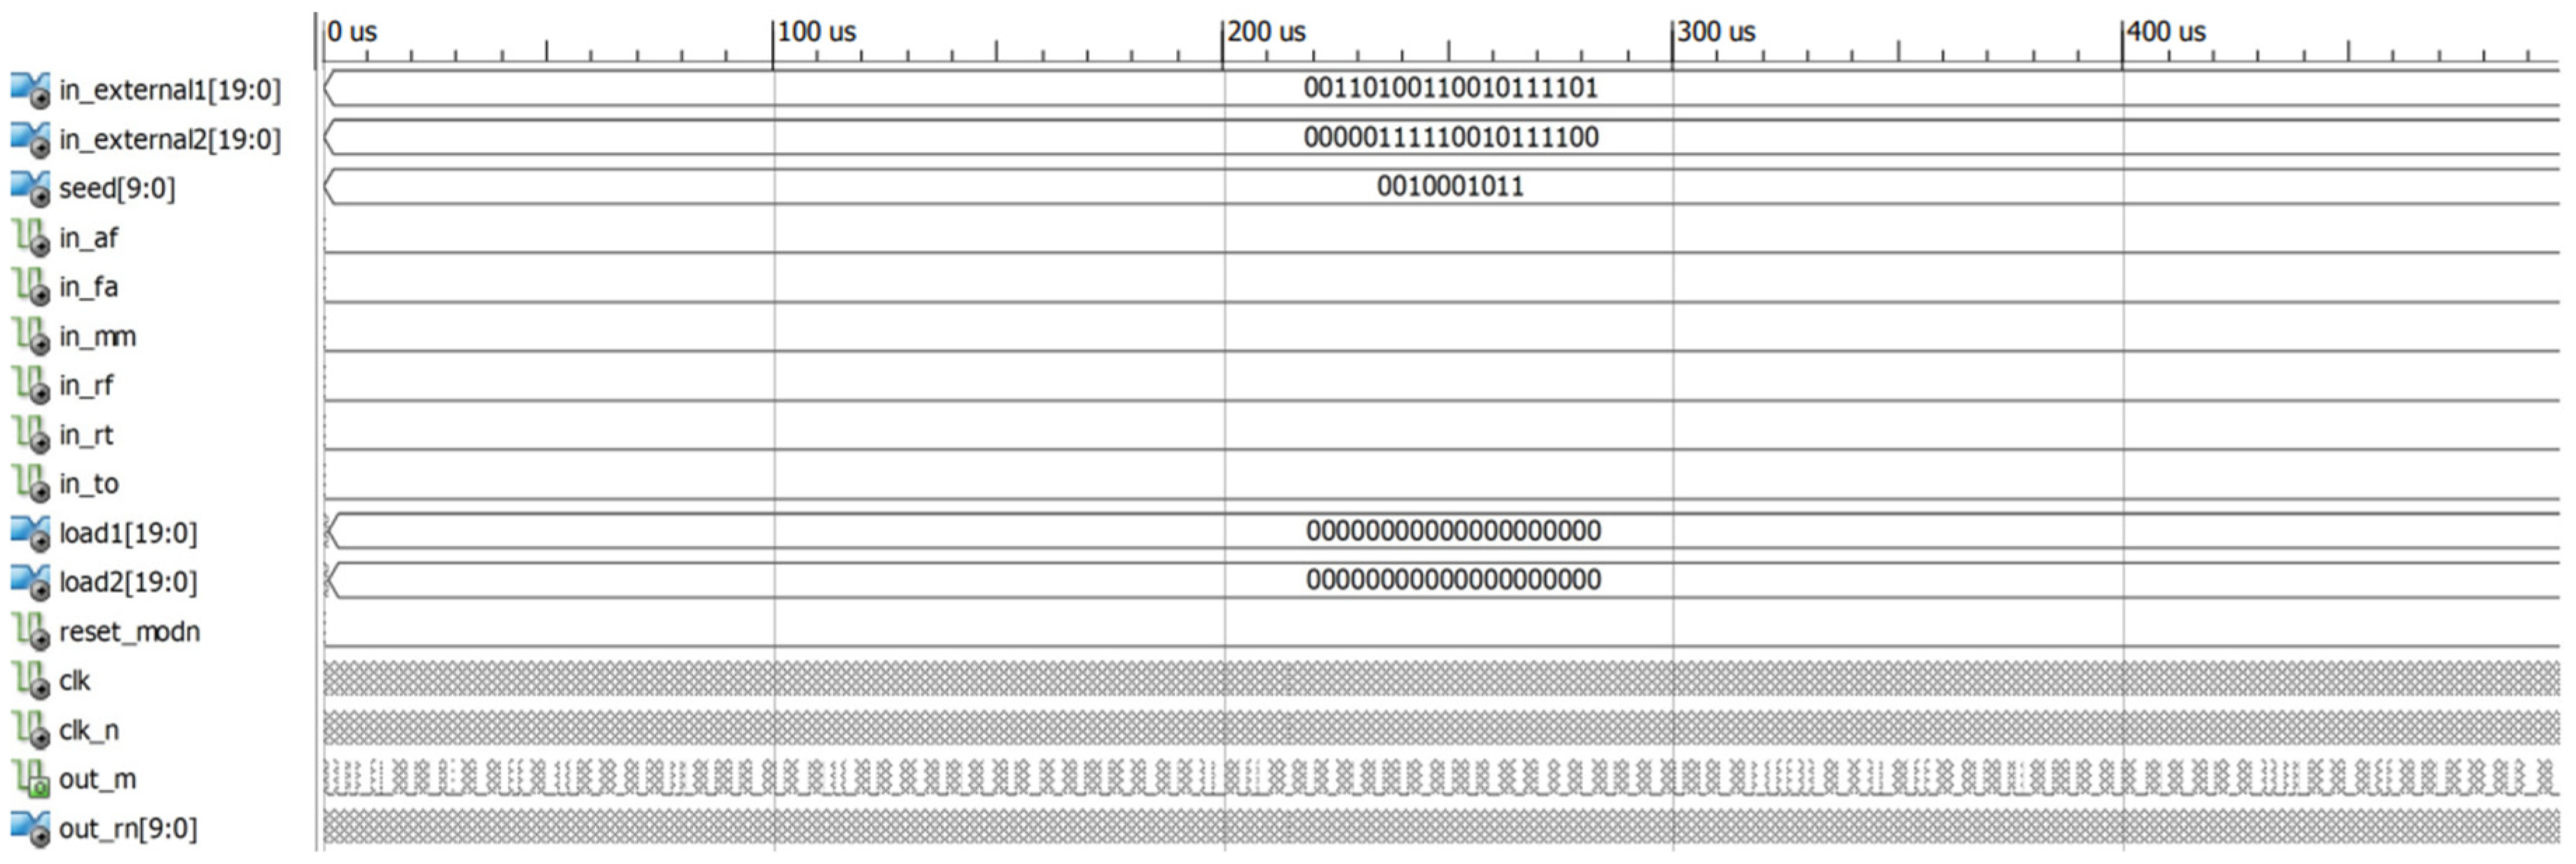
The circuit design of the neuro-generator was described in VHDL hardware description language. The simulation of the neuro-generator was carried out, with a frequency of 4 kHz in a time of 10 s to appreciate the output pulses of the out_m neural module. As shown in
Figure 9, this signal does not maintain periodicity. However, to obtain a greater number of pulses at the output of this module, the frequency was modified to 100 MHz.
Figure 10 shows the simulation at this frequency in a much shorter time of 500 us.
The neuro-generator circuit was implemented in the
Virtex 7 cxvx85t-2ffg1761 reconfigurable device, which has available 607200 slice registers, 303600 LUT’S, 429 LUT-FF, 700 IOBs and 32 BUFG/BUFGCTRLS.
Table 4 shows the percentages of resources used by the neuro-generator circuit, where the lowest is 0.025% of slice registers and the highest is 31.701% of LUT-FF pairs. These percentages indicate that the neuro-generator can be implemented without affecting its performance.
5. Results and Discussion
NIST statistical tests were used to evaluate the sequences produced by the new neuro-generator with different frequencies and demonstrate that they meet the statistical testing requirements, which conclude whether the sequence being evaluated is pseudorandom or perfectly pseudorandom. The first eight tests involved disabling the neuronal module of the neuro-generator, varying the frequency of the LFSR1 to 50 MHz, 25 MHz, 12.5 MHz and 6.25 MHz, keping the frequency of the LFSR2 fixed at 50 MHz for each half-clock cycle, which is equivalent to 100 MHz, 50 MHz, 25 MHz and 12.5 MHz of the full cycle. The seed data was loaded for four of the cases, while external data was loaded for the other four.
5.1. NIST Test Results of the Neuro-Generator with the Neuronal Module Disable
The
P-value results with the neuronal module disabled and with the data seed loaded to the LFSR are shown in
Table 5. Where the results are divided according to the output sequence of the neuro-generator with different frequencies. In all cases from the Frequency (Monobit) test to the Runs test,
P-value is greater than 0.01. On the other hand, for the Binary Matrix Range test,
P-value = 0.000000 when the neuro-generator is at 50 MHz. the same situation occurs with the Non-overlapping Template Matching test, where the test is divided into 148 templates. To identify the number of templates that determine the sequence to be satisfactory, they are marked with 1/1 and those that did not are marked with 0/1. For the Random Excursion test and Random Excursion Variant test, the results corresponding to each state are observed, that is, each one calculates an independent value of
P-value. These range from -4 to +4 for the Random Excursion test and -9 to +9 for the Random Excursion Variant. Nonetheless, the dotted line at 25 MHz for this test, indicates that it was not executed due to the insufficient number of cycles [
5].
The results of the Non-overlapping Template Matching test in this case are shown in
Table 6 and
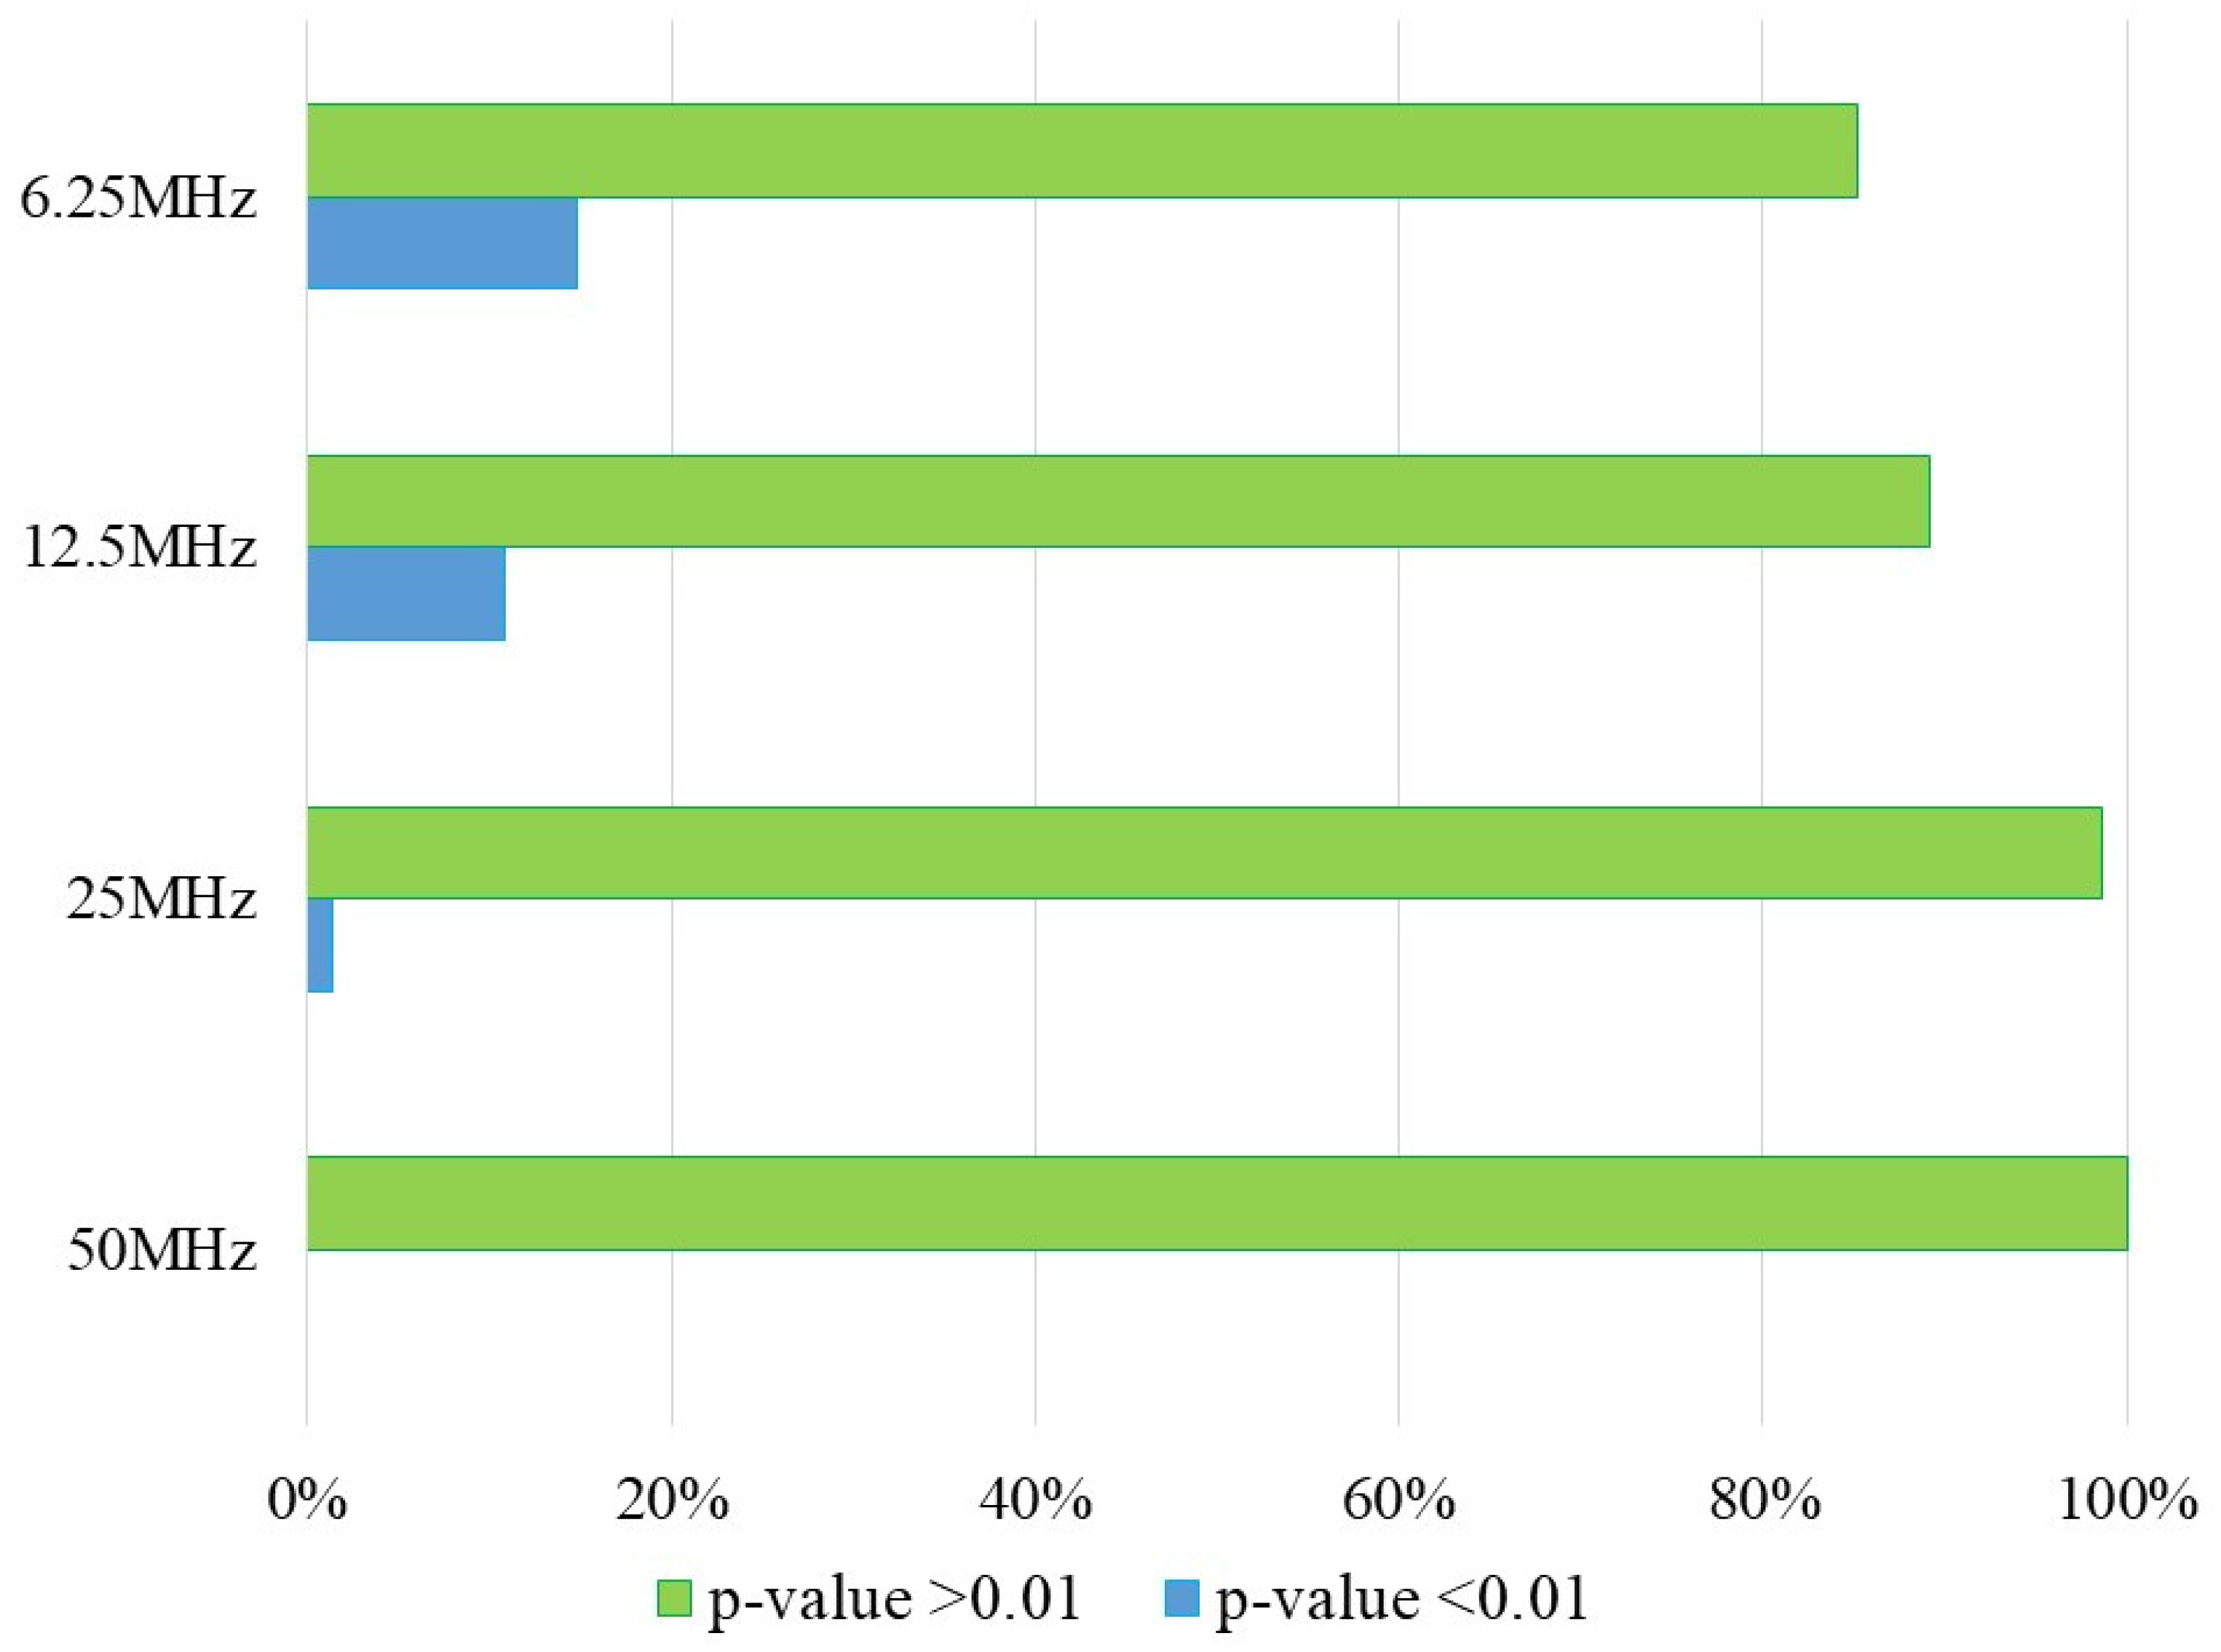
Figure 11, where the percentages of the
P-value results of the sequences obtained at different frequencies are observed. These show that at a frequency of 50 MHz, 100 % of the data is concluded as pseudorandom, while this percentage decreases for the lower frequencies.
The
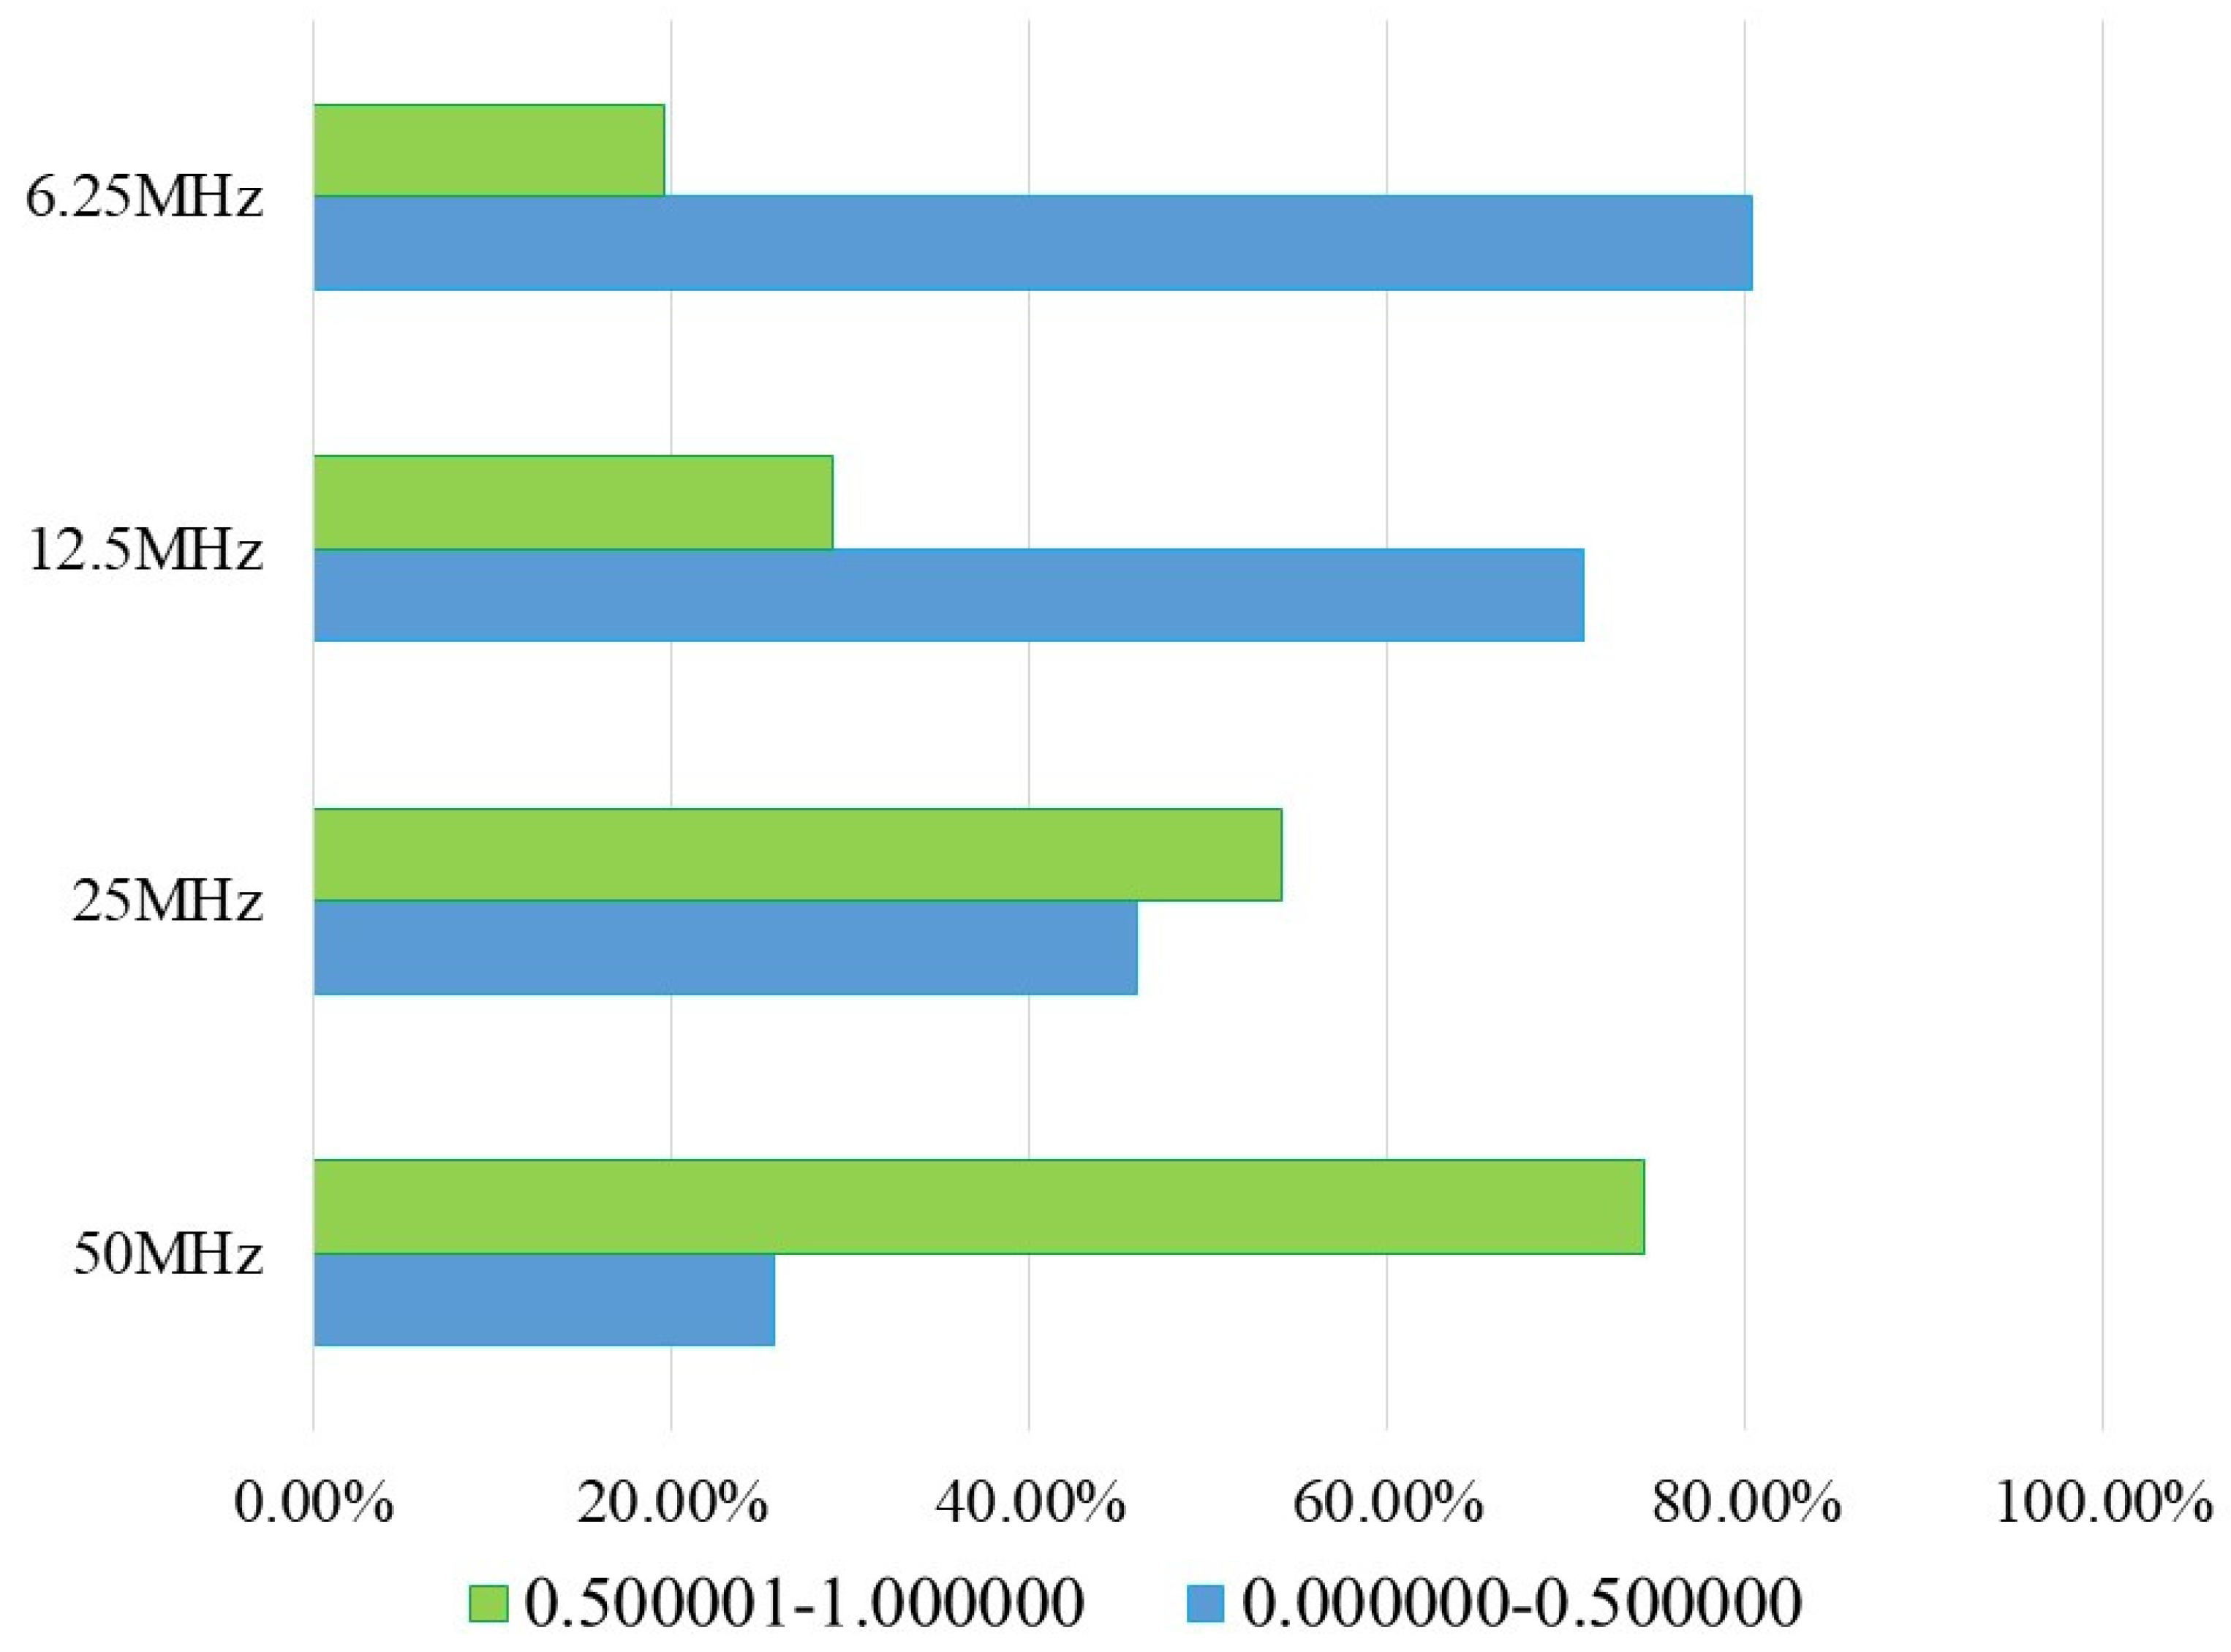
P-value values of this test were also classified into different ranges, as shown in
Table 7 and the graph of
Figure 12. According to the results, when the neuro-generator has a frequency of 50 MHz, the percentage of data in rank 2 is 74.32%. While, for a low frequency like 6.25 MHz, 80.40% of the data is in rank 1 which is low
P-values. Including the results that do not pass the test for a specific template. This demonstrates a relationship with the results in
Table 5, where the percentage of
P-value < 0.01 is included in the percentages of rank 1.
In addition, the results of the neuro-generator with the external data loaded to the LFSRs (
Table 8), where the
P-value is greater than 0.01 in most cases. The only exception is the Approximate Entropy test, which has a perfectly pseudorandom
P-value when the frequency of the neuro-generator is at 50 MHz. However, when the frequency is less than this frequency, the
P-value result for this test suggests that the output sequence of the neuro-generator as completely non-pseudorandom. In the Random Excursion and Randon Excursion Variant test (
Table 5), there are a total of eight states ranging from -4 to +4 and 18 states from -9 to +9. Each state calculates a probabilistic
P-value to ascertain whether the sequence being validated is pseudorandom or not in the specific state.
The Non-overlapping Template Matching test in
Table 8, shows with 1/1 the number of templates with a
P-value > 0.01 and with 0/1 those with a
P-value < 0.01. The percentage of these data is shown in
Table 9 and the graph in
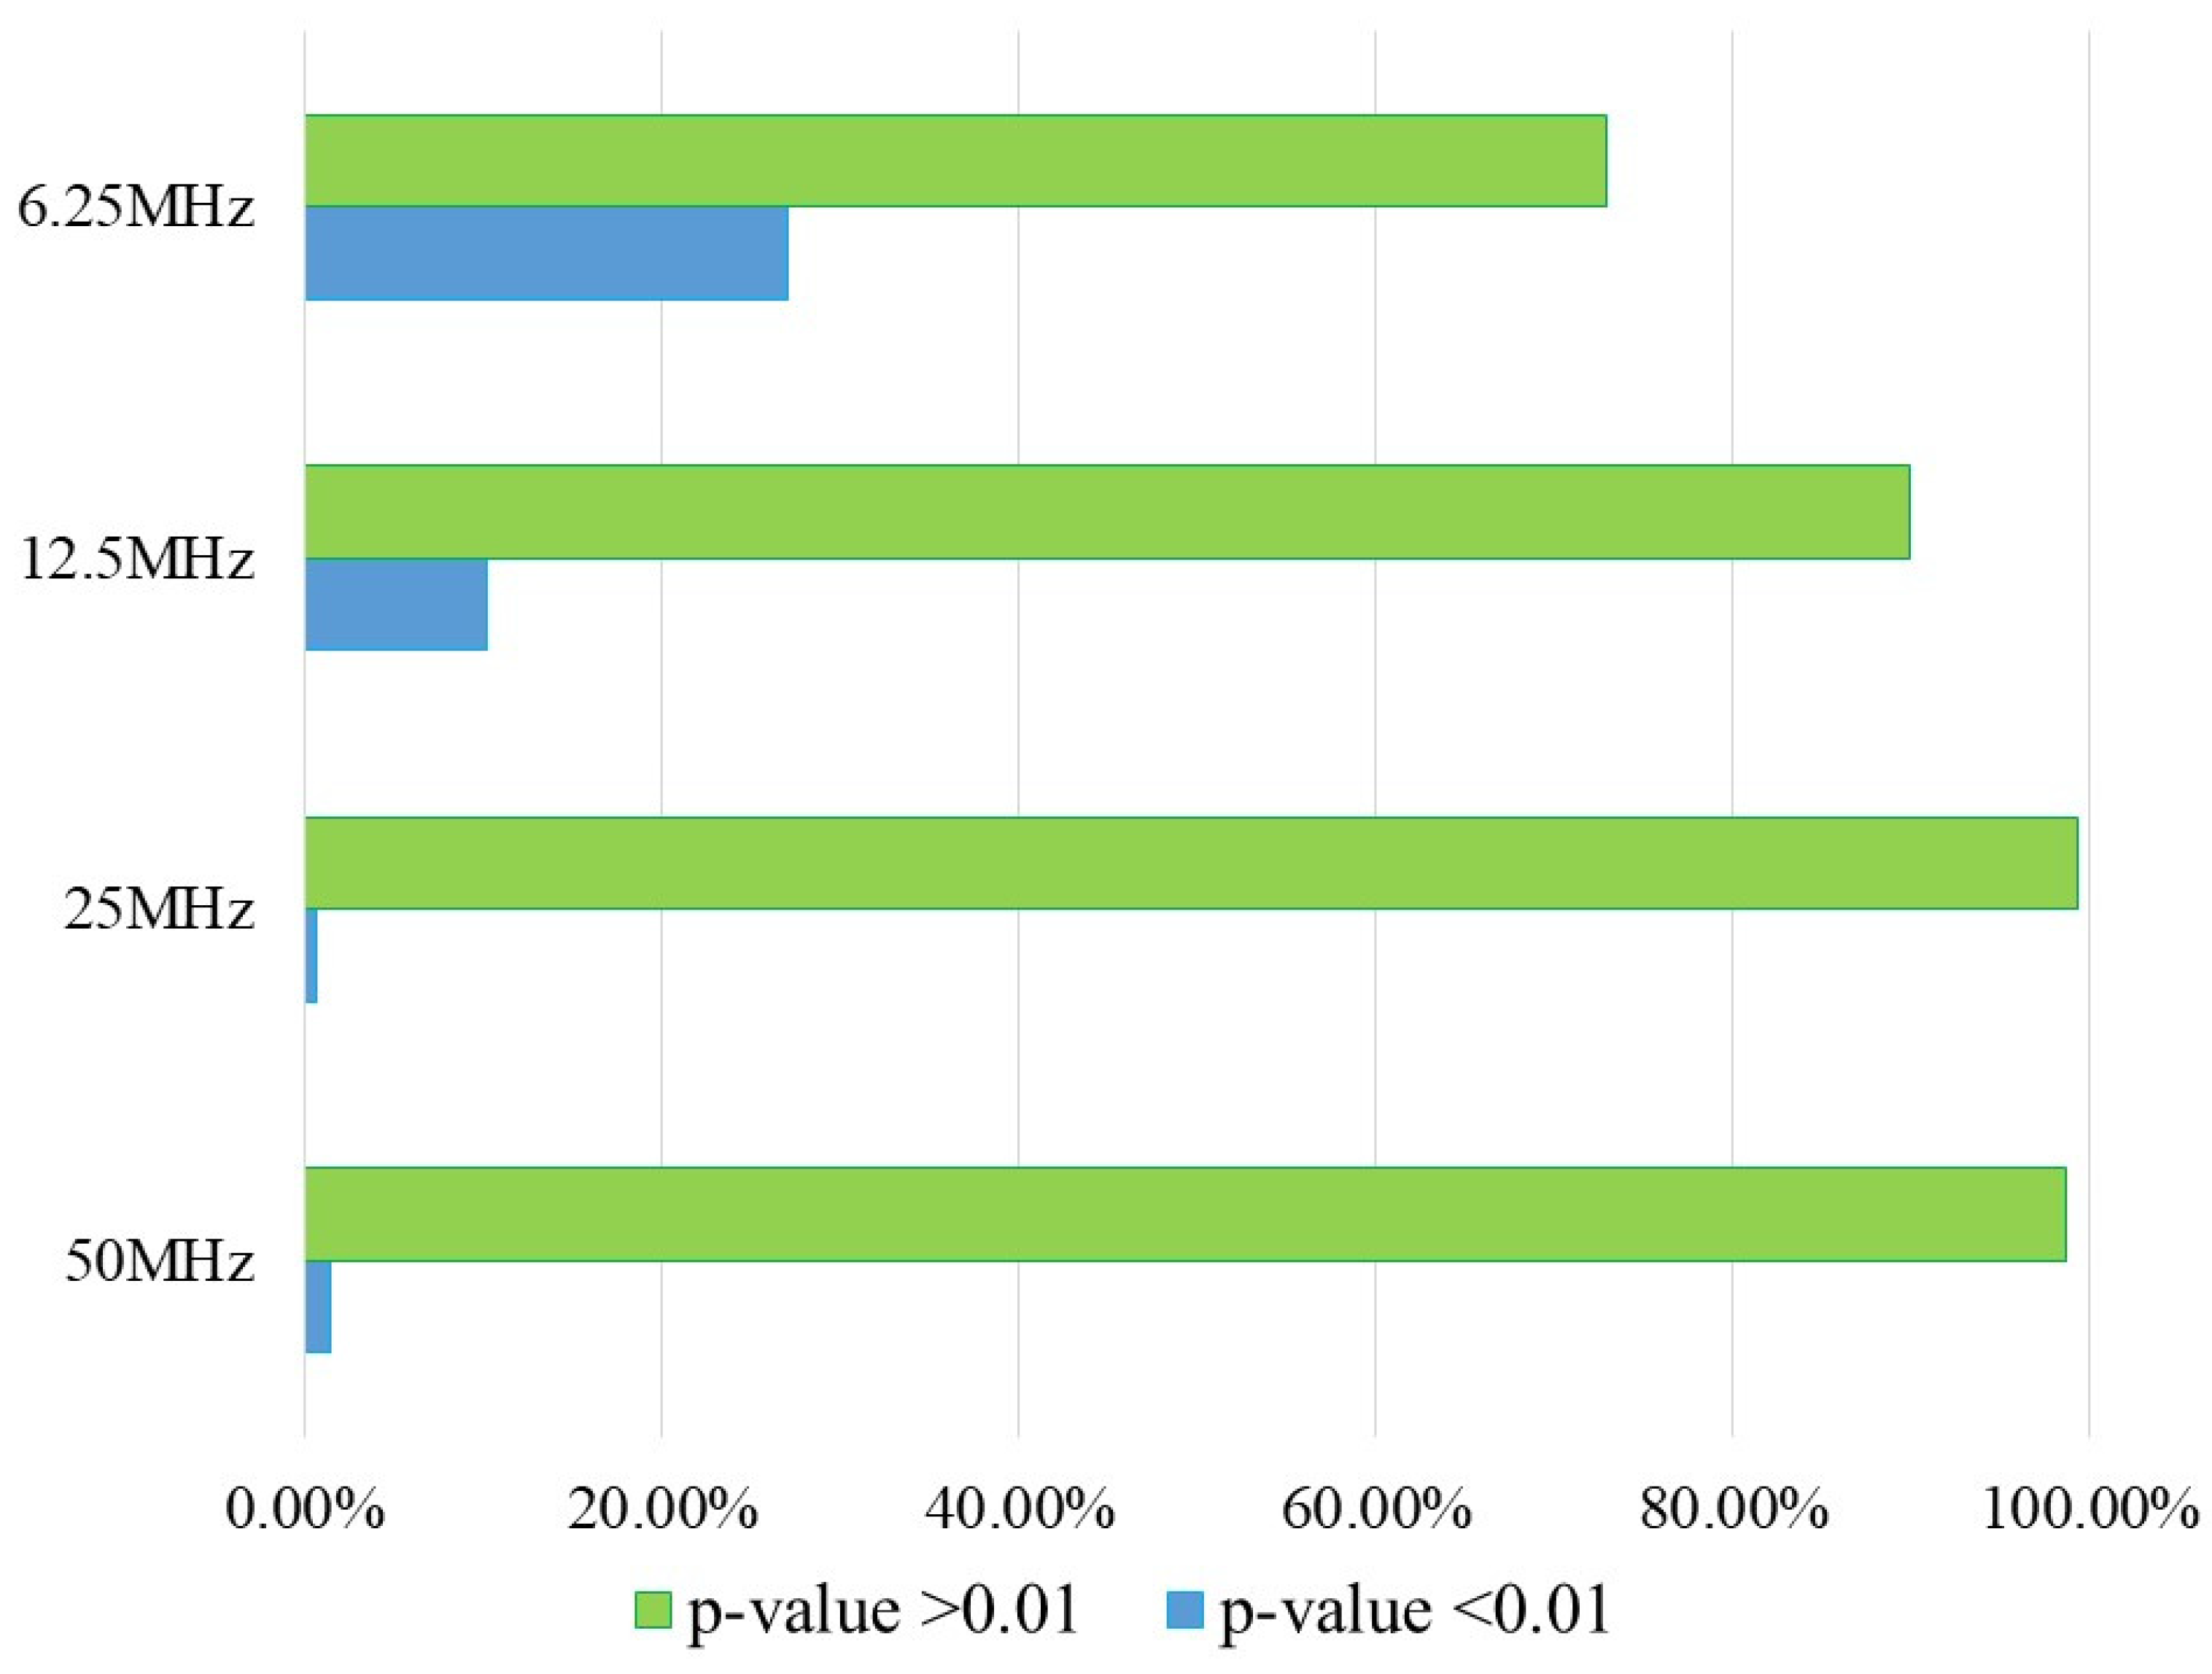
Figure 13. It is observed that in the case where the neuro-generator has a frequency of 50 MHz, 98.6% of the templates conclude it to be pseudorandom. Additionally, 99.32% of the templates conclude the data to be pseudorandom when the neuro-generator has a frequency of 25 MHz. The percentage of the templates with a
P-value < 0.01 with the frequencies at 12.5 MHz and 6.25 MHz increase to 27.02%. These percentages are included in
Table 10, where the
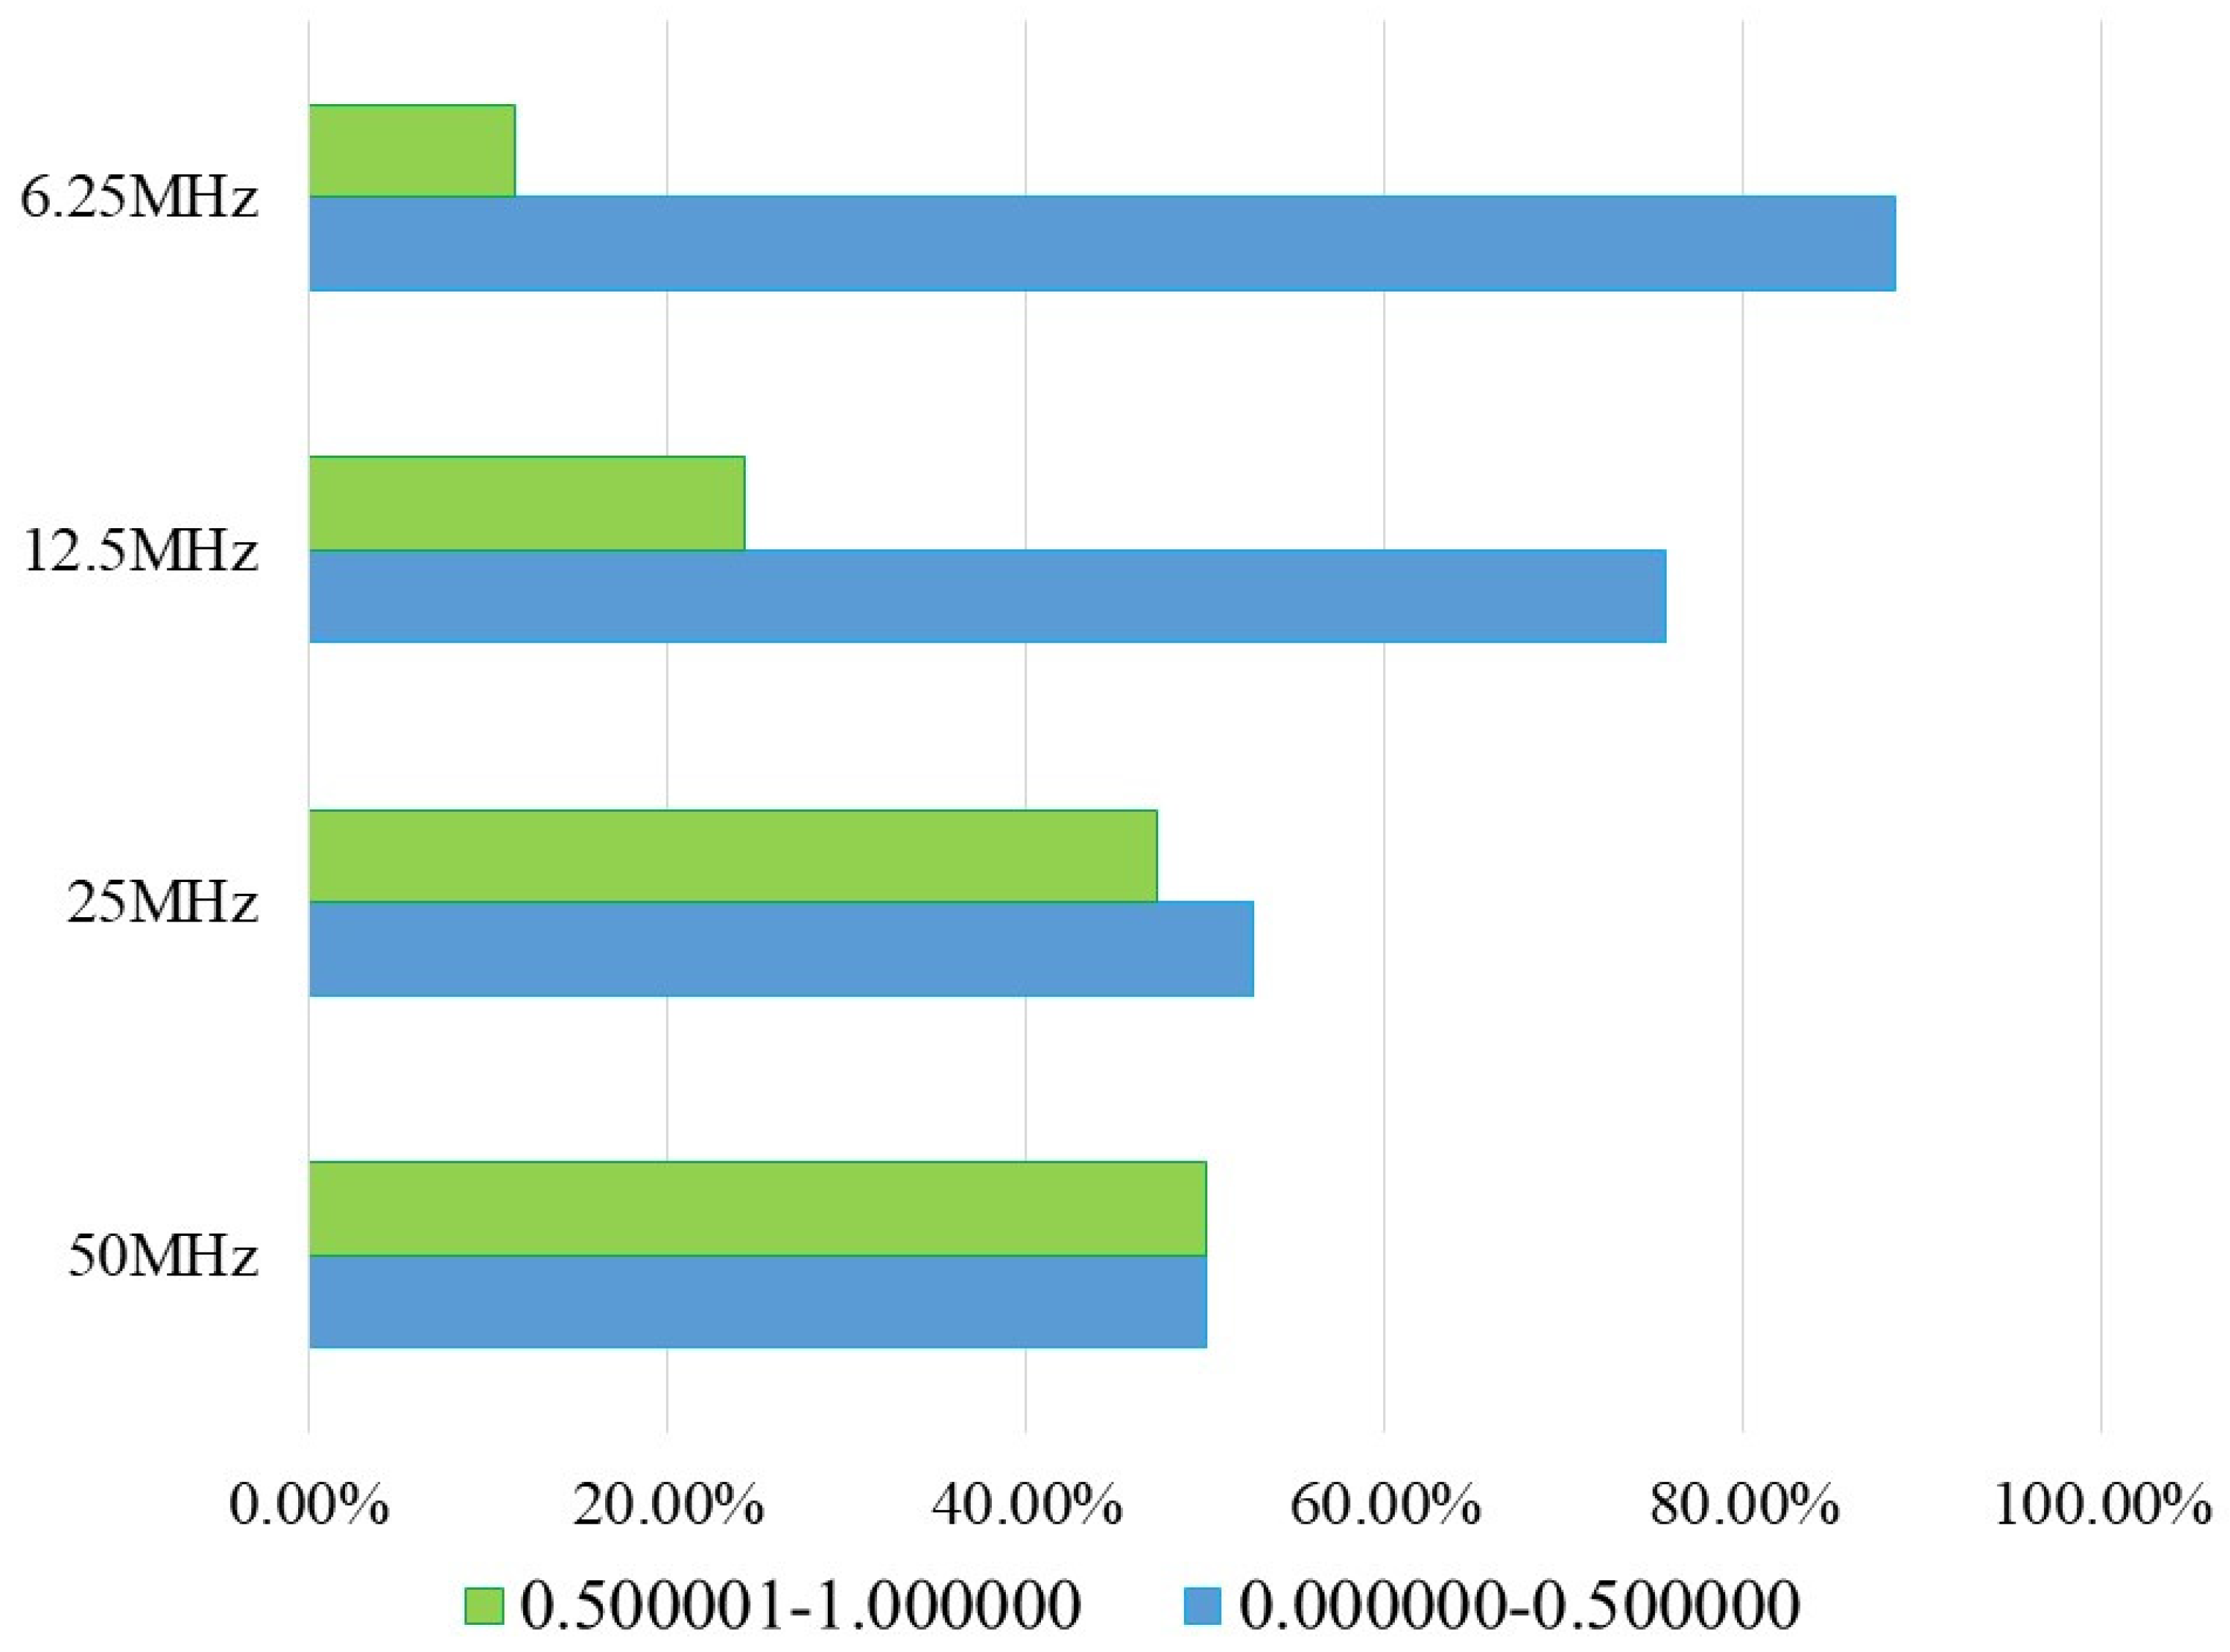
P-value results were divided into range 1 ranging from 0.000000-0.500000 and range 2 with values from 0.500001-1.000000. 50% of the
P-value data are in range 1 and the remaining 50% are in range 2. This means that 1.35% belong to results with
P-value < 0.01 as indicated in
Table 9 and the 98.6% is divided between rank 1 and rank 2. To better visualize these results, the percentages from
Table 10 were graphed in
Figure 14. The results obtained with the seed data and the external data loaded into the neuro-generator indicate that the initial data that enters the LFSR does not matter. Despite this, the working frequency of the neuro-generator does influence whether it passes more or fewer NIST statistical tests.
5.2. NIST Test Results of Neuro-Generator with Neuronal Module Enabled
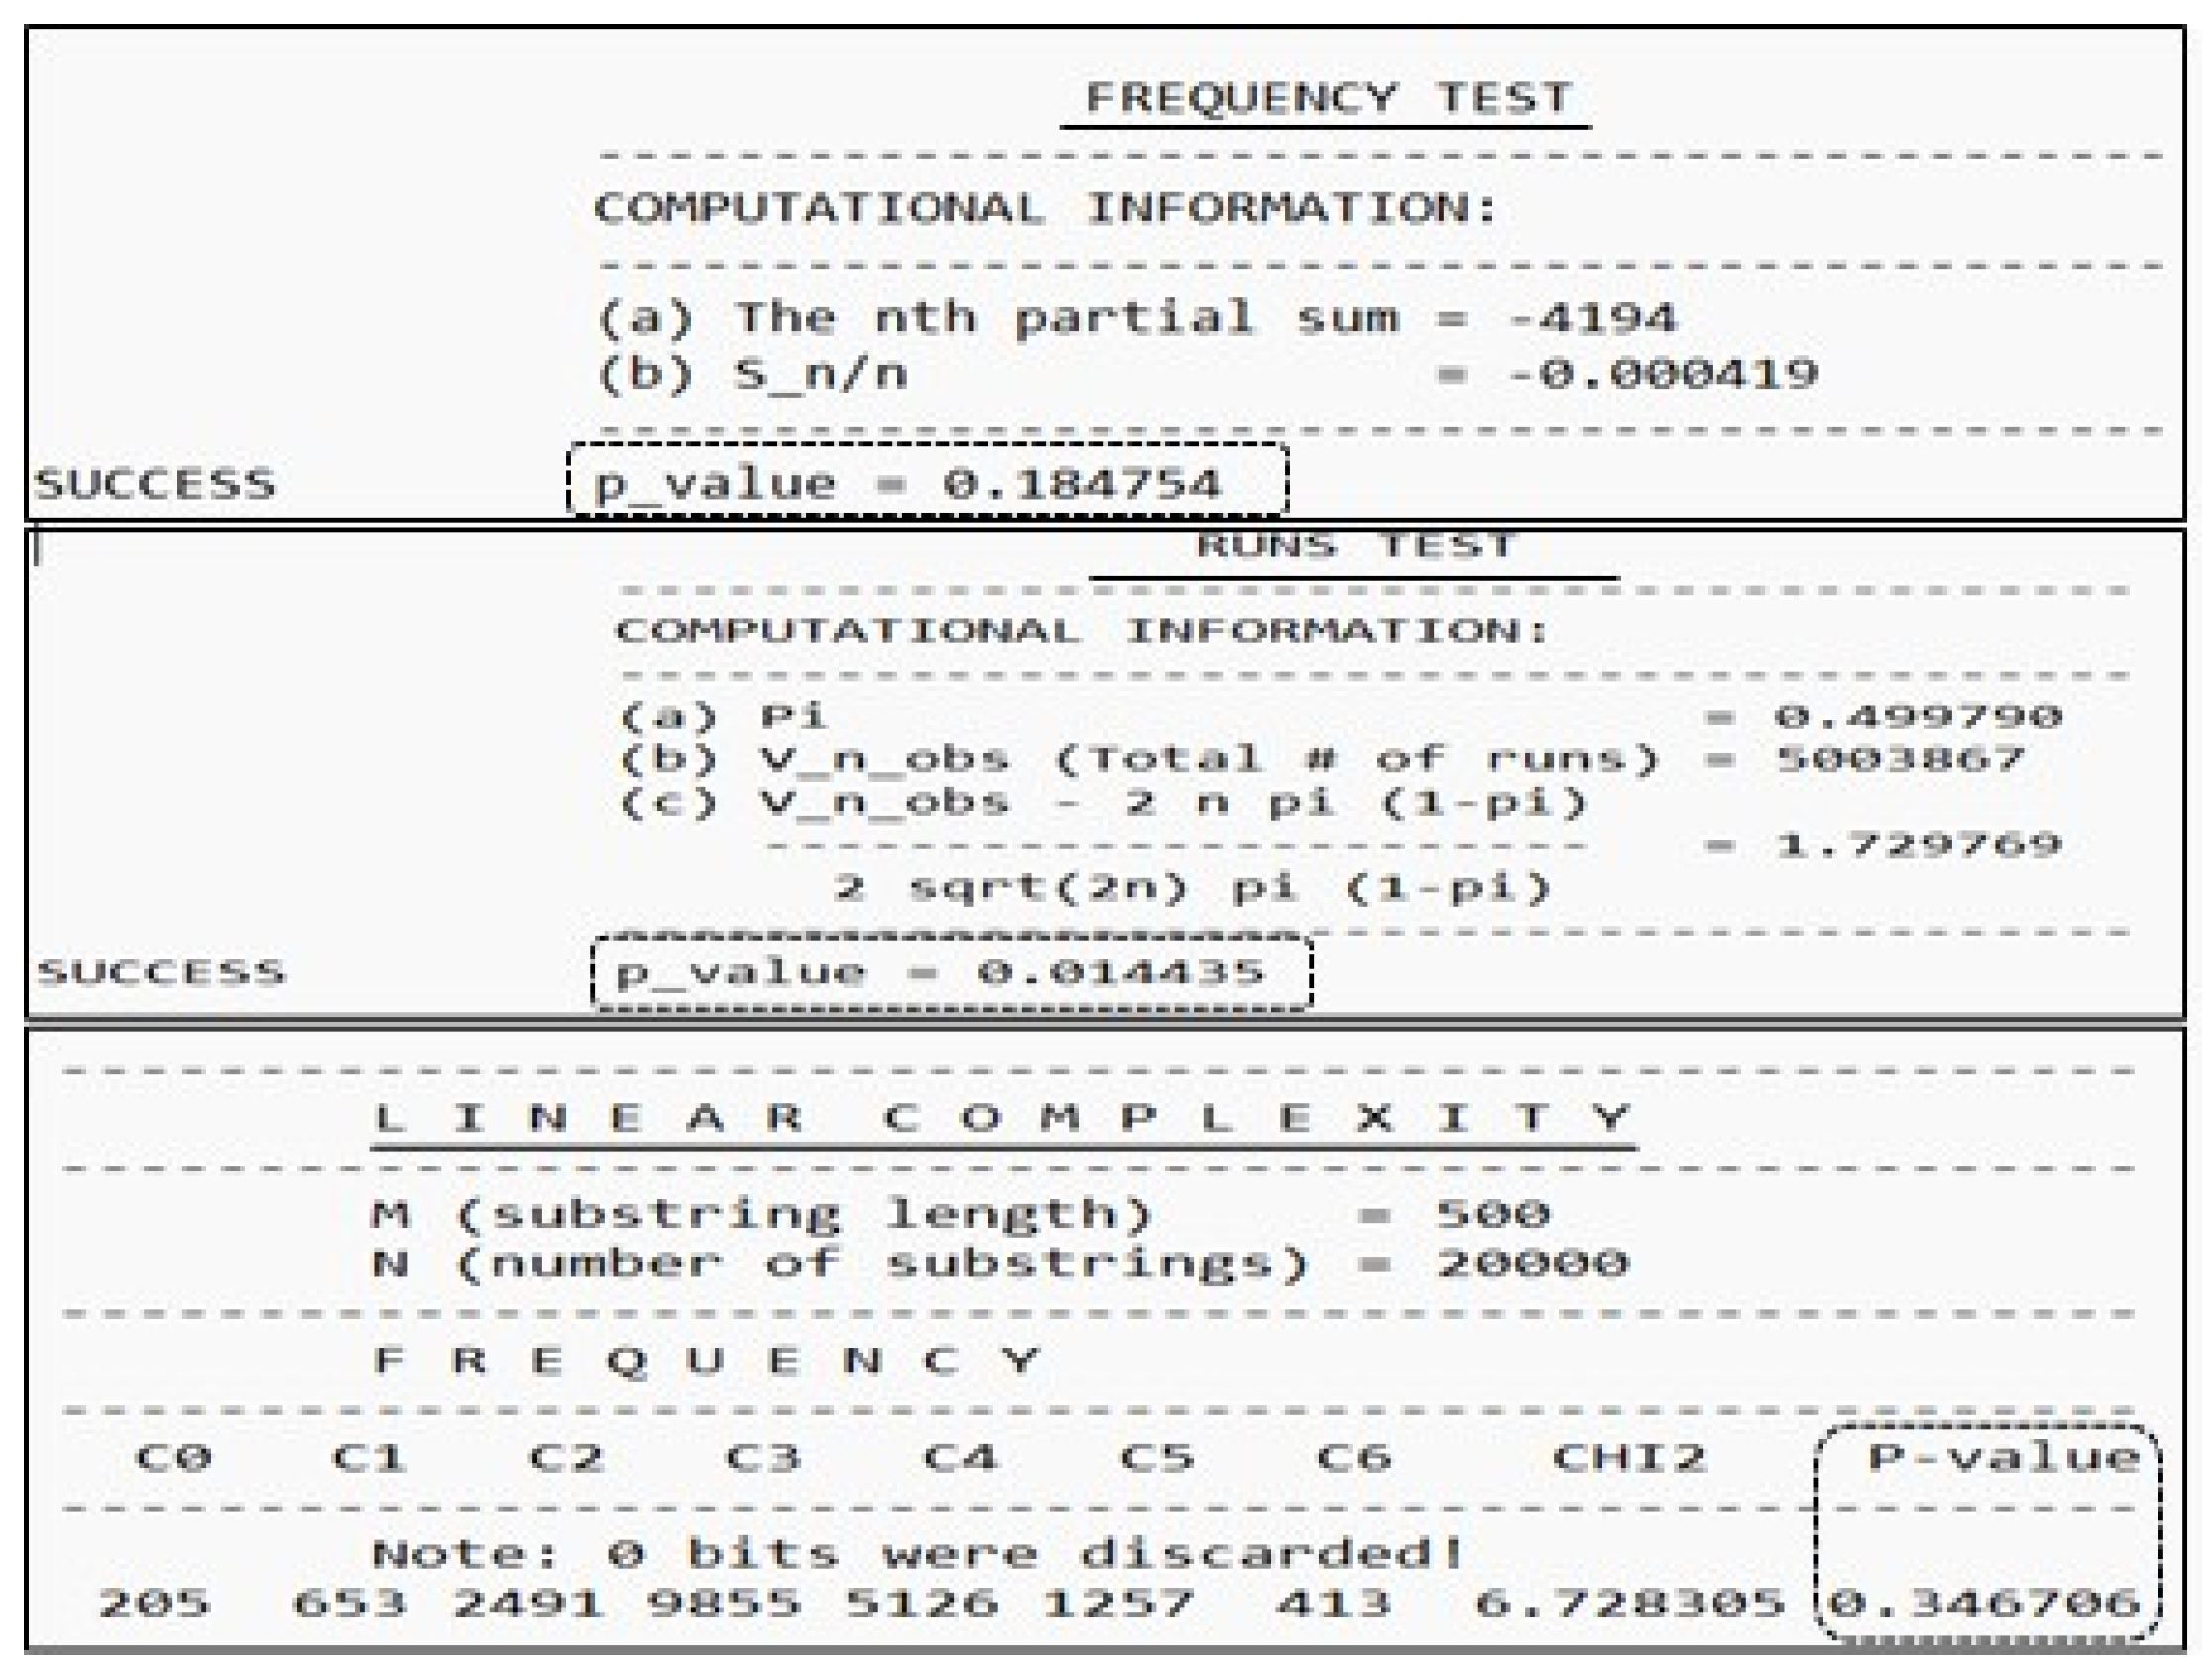
With the neuronal module of the neuro-generator enabled, the output sequence was obtained with the LFSR2 at a periodic frequency of 4 kHz. While that of LFSR1 depends on the pulses of impulse neurons, which generate an aperiodic signal. This sequence was validated by NIST statistical tests with the loaded seed data as the first case and with the external data as the second case. With the seed data loaded into the neuro-generator, the sequence passes only the Linear Complexity test. On the other hand, with the external data as initial data,
Figure 15 shows the tests that determine the sequence to be pseudorandom. These are the Frequency (Monobit) test with a result of
P-value = 0.184754, the Runs test with
P-value = 0.014435 and the Linear Complexity test with
P-value = 0.346706.
The frequency of the neuronal module was modified to 100 MHz per clock cycle, to produce a greater number of pulses at the output of this module. In this way, a higher frequency is generated in the LFSR1. The sequence obtained from the neuro-generator under these conditions and with the external data as initial data, passes three more tests than with a frequency of 4 kHz in the neuronal module.
Table 11 shows the
P-value results for these tests, which are the Frequency (Monobit) test, all states of the Random Excursion test and Random Excursion Random Variant test and the Linear Complexity test. However, when the initial seed value is loaded to the neuro-generator, under the same frequency conditions the results yield a satisfactory conclusion only for the Linear Complexity test with
P-value = 0.640503.
According to the validation results of the neuro-generator with different frequencies, it is shown that it can generate pseudorandom or perfectly pseudorandom sequences, regardless of the data entered into the design’s LFSR registers as the initial value. Furthermore, it is observed that in all the situations to which the neuro-generator was subjected, the Linear Complexity test always concluded as pseudorandom to all the output sequences that were generated under different conditions in the design of the neuro-generator. This means that the test considers the entire sequence to be sufficiently complex and with an adequate bit distribution.
7. Conclusions
The neuro-generator circuit design can be implemented in the FPGA Virtex 7 xcvx85t-2ffg1761 device without affecting its performance, due to the few percentages of the device’s resources used. The highest percentage is 31.701%, which corresponds to the number of LUT-FF used.
In addition, the neuro-generator can generate complex sequences with an adequate bit distribution, regardless of the conditions in which it is found. In other words, the frequency can be modified to a higher frequency than 100 MHz or reach a lower frequency such as the original frequency of the neurons of the neuronal module, which is 4 kHz per clock cycle. This module that is connected to the clk of LFSR1 can generate a non-periodic frequency, which depends entirely on the output pulses that the neurons produce. Therefore, until that moment the register generates a new series of bits that are processed by the rest of the circuit blocks together with the data from LFSR2. If the frequency of the neuronal module increases, as shown in the circuit simulation results, it is possible to generate a greater number of pulses. This means increasing the frequency of the LFSR1.
In the frequency range of 100 MHz – 4 kHz, a good response is guaranteed in the validation by the NIST statistical test of the entire sequence, as demonstrated in the P-value results obtained in the different cases. The results of most tests showed that a sequence of approximately 10 million bits is pseudorandom and perfectly pseudorandom for some of these. For example, the Approximate Entropy test and some states of the Random Excursion and Random Excursion Variant test, had P-value = 1.000000.
Finally, considering all of the above and the different conditions that the neuro-generator has, it is concluded that it can be used for different areas of interest as required. Some of these are in biological systems, where the properties that impulse neurons have can be taken advantage of to manipulate themselves and modify their output response. As in this case, the frequencies were modified from a very low to a higher one, to have a better response in the output sequence of the neuro-generator. Other applications are in different types of simulations, in electronic circuits to test their operation, among others.
Author Contributions
Conceptualization, M.R., J.J.R., S.O., E.B. and J.R.; methodology, M.R., J.J.R., S.O., E.B. and J.R.; software, M.R. and J.R.; validation, M.R., J.J.R., S.O., E.B. and J.R..; formal analysis, M.R. and J.J.R.; investigation, M.R., J.J.R. and J.R.; resources, J.J.R. and E.B.; data curation, M.R., J.J.R and J.R.; writing—original draft preparation, M.R.; writing—review and editing, M.R. and J.R.; visualization, M.R., J.J.R., S.O., E.B. and J.R.; supervision, J.J.R and E.B..; project administration, J.J.R, and E.B.; funding acquisition, S.O. All authors have read and agreed to the published version of the manuscript.
Funding
This research received no external funding.
Data Availability Statement
The data presented in this study are available in this article.
Acknowledgments
The present work has been supported by the National Council of Humanities, Science and Technology (CONAHCYT, Consejo Nacional de Humanidades, Ciencia y Tecnología), the University of Guadalajara and CINVESTAV Guadalajara for its financing.
Conflicts of Interest
The authors declare no conflicts of interest.
References
- María d. L., R. B.; Juan., R. P.; Edwin. C., B. A.; Susana, O. C.; Jose L., G. V., Two new hardware implementations of random number generators on reconfigurable devices. 2023 3er Congreso Iberoamericano de Instrumentación y Ciencias Aplicadas SOMI XXXVII Congreso de Instrumentación, Bogotá, Colombia, 2023, number 01, ISSSN: 2395-8499.
- D.Guillermo, C. C. Generación de Secuencias Pseudoaleatorias Gaussianas Mediante Registros de Desplazamiento con Realimentación Lineal en Cuerpos Extendidos. PHD Thesis, Universidad de Málaga, Malaga Spain, November 2021. https://hdl.handle.net/10630/24143.
- Ernesto J., C. F.; José L., M. M. Secuencias pseudoaleatorias para telecomunicaciones, UPC Eds.; Publisher: Barcelona, Spain, 1996. ISBN: 9788483011645.
- Thomas E., T. A Hardware Random Number Generator. Kaliski, B.S., Koc, c.K., Paar, C. Eds. Cryptographic Hardware and Embedded Systems – CHES 2002. CHES 2002. Lecture Notes in Computer Science, Vol. 2523.; Publisher: Springer, Berlin, Heidelberg, 2003. ISBN: 978-3-540-00409-7. [CrossRef]
- NIST Technical Series Publications. Available online: https://nvlpubs.nist.gov/nistpubs/legacy/sp/nistspecialpublication800-22r1a.pdf (accessed on 01 February 2023).
- Juan. J., R. P.; Edwin. C. B. A.; Maria. d. L., R. B.; Cesar. A.; O. A.; M. Lorena; B. V. and Susana, O.C., Design and Implementation in FPGA a Random Number Generator of 10 bits validated by NIST Maurer’s “Universal Statistical” and Binary Matrix Rank tests. 2022 International Conference on Mechatronics, Electronics and Automotive Engineering (ICMEAE), Cuernavaca, Mexico, 2022, pp. 158-163. [CrossRef]
- Röck A. Pseudorandom Number Generators for Cryptographic Applications. MPhil Thesis, Diplomarbeit zur Erlangung des Magistergrades an der Naturwissenschaftlichen Fakultät der Paris-Lodron-Universit¨at Salzburg, Salzburg, Austria, March 2005.
- Giovanni G.; Loris, B.; Procedimiento y circuito para generar números aleatorios y producto informático para ordenar del mismo. Oficina Española de patentes y marcas, España, 16 April 2008. Publication No. 2295829.
- David H., K. H.; Jonathan, M. C.; Juan C., C.; Chris D., M.; Mukul V., S.; Cellular Automata-Based Parallel Random Number Generators Using FPGAs, International Journal of Reconfigurable Computing, vol. 2012, Article ID 219028, 13 pages, 2012. [CrossRef]
- María d. L., R. B.; Juan. J., R. P.; Christian E., B. A.; Jaime, R. A.; Mario, J.; Susana, O. C. Impulse Neurons: Phasic Bursts and Tonic Bursts, To Generate Pseudorandom Sequences, 2023 IEEE International Autumn Meeting on Power, Electronics and Computing (ROPEC), Ixtapa, Mexico, 2023, pp. 1-6. [CrossRef]
- L. G. de la Fraga, E. Torres Perez, E. Tlelo Cuautle and C. Mancillas Lopez, “Hardware implementation of pseudo-random number generators based on chaotic maps,” Nonlinear Dyn, vol. 90, pp. 1661-1670, August 2017. [CrossRef]
- P. Alfke. Efficient Shift Registers, LFSR Counters, and Long PseudoRandom Sequence Generators [Online]. Available at: http://docs.xilinx.com/v/u/en-US/xapp052 (Accessed on: June 01, 2023).
- N. Comas Arias, B. Catala Gonzalez and O. Oro Dosouto, “Prueba de bondad de ajuste para la distribucion de distancias en secuencias de datos categoricos,” Revista Cubana de Ciencias Informaticas, vol. 15, pp.62-76, No. 2, 2021, ISSN: 1994-1536, 2227-1899.
- L. Castro Argudin and Y. Medina Perez, “Analisis estadistico de las sucesiones de salida del generador de secuencias pseudoaleatorias fortuna”Serie Cientifica de la Universidad de las Ciencias Informaticas, vol. 14,pp. 32-40, No. 4, April 2022. ISSN: 2306-2495.
- R.G. Brown, Dieharder: A Random Number Test Suite. Version 3.31.1. available at https://webhome.phy.duke.edu/~rgb/General/dieharder.php.
- P. L’Ecuyer and R. Simard, “TestU01: A C library for empirical testing of random number generators,” ACM Transactions on Mathematical Software, vol. 33, pp. 1-40, August 2007. [CrossRef]
- a. m. Mancilla, “Números aleatorios. Historia, teoría y aplicaciones,” Ingenieria y Desarrollo, Vol. 8, pp 49 – 69, 2000. ISSN: 0122 – 3461.
- Lai KC. In: David EG. Elementary Probability Theory with Stochastic Processes. New York: SpringerVerlag 1979: pp. 210-217.
- Maclaren N. Cryptographic Pseudo-random Numbers in Simulation. Cambridge Security Workshop on Fast Software Encryption. Cambridge: R. Anderson 1993: pp. 185-190.
- Bittor A. Analysis of the Statistical Independence of the NIST SP 800-22 Randomness Tests. BSc Thesis. Universidad Complutense de Madrid. Madrid, España. June 2020.
- A. Canteaut, “Berlekamp-Massey Algorithm,” in van Tilborg, H.C.A., Jajodia, S. Encyclopedia of Cryptography and Security, Boston, MA: Springer, 2011.
- J. L. Massey, “Shift-Register Synthesis and BCH Decoding,” in IEEE Transactions on Information Theory, vol. 15, no. 1, pp. 122-127, January 1969. [CrossRef]
- Spitzer F. Principles of Random Walk. Princeton: Van Nostrand, 1964: p. 269.
- National Institute of Standards and Technology. US. Department of Commerce.Publications. A Statistical Test Suite for Random and Pseudorandom Number Generators for Cryptographic Applications. Available at: https://www.nist.gov/publications/statistical-test-suite-forrandom-and-pseudorandom-number-generators-for-cryptographic Applications | NIST (Accessed on: February 01, 2024).
- J. A. Salamanca Chavarin, “Diseño e implementacion de una neurona de impulsos en hardware reconfigurable,” M.S. thesis, University of Guadalajara, ON, Guadalajara, Mexico, 2017.
- S. Barrios del Villar, “Diseño De Una Red Neuronal De Impulsos en Hardware,” M.S. thesis, University of Guadalajara, ON, Guadalajara, Mexico, 2014.
- Macias Mendoza, J.J. Raigoza Panduro, E. C. Becerra Alvares, M. Jimenez Rodriguez, J. L. Gonzalez Vidal and J. R. Reyes Barón, “Behavioral Design of Spiking Neurons in Reconfigurable Hardware Based on Izhikevich Model,” Pistas educativas, vol. 43, pp. 645-661, January 2022, ISNN: 2448-847X.
- E. M. Izhikevich, “Which model to use for cortical spiking neurons?,” in IEEE Transactions on Neural Networks, vol. 15, no. 5, pp. 1063-1070, Sept. 2004. [CrossRef]
- E. M. Izhikevich. Simple Model of Spiking Neurons [Online]. Available: Simple Model of Spiking Neurons (izhikevich.org).
Figure 1.
Linear Feedback Shift Register LFSR.
Figure 1.
Linear Feedback Shift Register LFSR.
Figure 2.
Design circuit of the pseudorandom number neuro-generator.
Figure 2.
Design circuit of the pseudorandom number neuro-generator.
Figure 3.
Impulse neuron block.
Figure 3.
Impulse neuron block.
Figure 4.
Neuron state machine with frequency adaptation behavior.
Figure 4.
Neuron state machine with frequency adaptation behavior.
Figure 5.
The state machine of the neuron with behavior a) phasic impulse and b) tonic impulse.
Figure 5.
The state machine of the neuron with behavior a) phasic impulse and b) tonic impulse.
Figure 6.
Neuron state machine with mixed mode behavior.
Figure 6.
Neuron state machine with mixed mode behavior.
Figure 7.
Neuron state machine with phasic burst behavior.
Figure 7.
Neuron state machine with phasic burst behavior.
Figure 8.
Neuron state machine with tonic burst behavior.
Figure 8.
Neuron state machine with tonic burst behavior.
Figure 9.
Simulation results of the neuro-generator with a frequency of 4 kHz.
Figure 9.
Simulation results of the neuro-generator with a frequency of 4 kHz.
Figure 10.
Simulation results of the neuro-generator with a frequency of 100 MHz.
Figure 10.
Simulation results of the neuro-generator with a frequency of 100 MHz.
Figure 11.
Percentages of P-value > 0.01 and P-value < 0.01 of the Non-overlapping Template Matching test approved by the neuro-generator with the neuronal module disabled and with the seed data loaded.
Figure 11.
Percentages of P-value > 0.01 and P-value < 0.01 of the Non-overlapping Template Matching test approved by the neuro-generator with the neuronal module disabled and with the seed data loaded.
Figure 12.
Ranked
P-value percentages from
Table 7.
Figure 12.
Ranked
P-value percentages from
Table 7.
Figure 13.
Percentages of P-value > 0.01 and P-value < 0.01 of the Non-overlapping Template Matching test approved by the neuro-generator with the neuronal module disabled and with external data.
Figure 13.
Percentages of P-value > 0.01 and P-value < 0.01 of the Non-overlapping Template Matching test approved by the neuro-generator with the neuronal module disabled and with external data.
Figure 14.
Ranked
P-value percentages from
Table 10.
Figure 14.
Ranked
P-value percentages from
Table 10.
Figure 15.
Results of NIST statistical tests passed by the neuro-generator with the neuronal module enabled and external data loaded.
Figure 15.
Results of NIST statistical tests passed by the neuro-generator with the neuronal module enabled and external data loaded.
Table 1.
Hypothesis testing [
5].
Table 1.
Hypothesis testing [
5].
| |
True |
False |
| Accept |
No error |
Type I error |
| Reject |
Type II error |
No error |
Table 2.
Statistical tests proposed by NIST [
5].
Table 2.
Statistical tests proposed by NIST [
5].
| Test |
Description |
P-value equation |
| The Frequency (Monobit) Test |
The test focuses on the proportion of ones and zeros of a sequence between, seeking to make it approximately the same [5,18]. |
|
| Frequency Test within a Block |
The test focuses on determining the proportion of ones within M-bit blocks [5,19]. |
|
| The Runs Test |
The test focuses on the total number of runs in a sequence, where the sequence of identical bits is uninterrupted [5,20]. |
|
| Test for the Longest-Run-of-Ones in a block |
The test focuses on the longest length of ones within M-bit blocks [5,20]. |
|
| The Binary Matrix Rank Test |
The purpose of the test is to detect whether or not there is linear dependence in the substrings of the original sequence [5,6,20]. |
|
| The Discrete Fourier Transform (Spectral) Test |
The test targets periodic characteristics, i.e., repetitive patterns that are close to each other [5,20]. |
|
| The Non-overlapping Template Matching Test |
The test seeks to detect generators that produce sequences with too many occurrences of a non-periodic pattern [5,20]. |
|
| The Overlapping Template Matching Test |
The objective of the Overlapping Template Matching test is the number of occurrences of the prespecified target [5,20]. |
|
| Maurer’s “Universal Statistical” Test |
The test seeks to compress the length of the entire sequence and detect that it can be compressed without losing information [5,6,20]. |
|
| The Linear Complexity Test |
The test determines if the sequence is complex enough to be considered random [5,20,21,22]. |
|
| The Serial Test |
The test focuses on possible overlapping m-bit patterns in the entire sequence [5,20]. |
|
| The Approximate Entropy Test |
The test focuses on the frequency of all possible m-bit patterns overlapping in the sequence [5,20]. |
|
| The Cumulative Sums (Cusums)Test |
The Cusums test focuses on making a cumulative sum where the digits of the entire sequence are set to -1 if it is 0 and +1 when it is 1. This determines whether the sum is very large or very small [1,5,20,23]. |
|
| The Random Excursions Test |
The test determines the deviation in the number of visits to a particular state. This test is divided into a series of eight states, from which a conclusion must be obtained for each one [1,5,20]. |
|
| The Random Excursions Variant Test |
The purpose of the test is to detect deviations from the number of visits expected in various states in a random walk. This test has a total of eighteen states [1,5,20]. |
|
Table 3.
Values of the parameters of the Izhikevich equation to obtain six different behaviors of the impulse neurons [25–29].
Table 3.
Values of the parameters of the Izhikevich equation to obtain six different behaviors of the impulse neurons [25–29].
| Behaviors |
a |
b |
c |
d |
I |
V |
| Spike frequency adaptation |
0.01 |
0.2 |
-65 |
8 |
30 |
-70 |
| Phasic spiking |
0.02 |
0.25 |
-65 |
6 |
0.5 |
-64 |
| Tonic spiking |
0.02 |
0.2 |
-65 |
6 |
14 |
-70 |
| Mixed mode |
0.02 |
0.2 |
-55 |
4 |
10 |
-70 |
| Phasic bursting |
0.02 |
0.25 |
-55 |
0.05 |
0.6 |
-64 |
| Tonic bursting |
0.02 |
0.2 |
-50 |
2 |
15 |
-70 |
Table 4.
Occupancy percentages per element of the FPGA Virtex 7 xc7vx85t-2ffg1761 device.
Table 4.
Occupancy percentages per element of the FPGA Virtex 7 xc7vx85t-2ffg1761 device.
| Logic Utilization |
Used |
Available |
Utilization |
| Number of Slice Registers |
156 |
607200 |
0.025% |
| Number of Slice LUT’S |
409 |
303600 |
0.134% |
| Number of fully used LUT-FF |
136 |
429 |
31.701% |
| Number of bonded IOBs |
110 |
700 |
15.714% |
| Number of BUFG/BUFGCTRLs |
3 |
32 |
9.375% |
Table 5.
Results of the NIST tests of the output sequence of the neuro-generator with the neuronal module disabled at different frequencies and with the seed data uploaded to the LFSR.
Table 5.
Results of the NIST tests of the output sequence of the neuro-generator with the neuronal module disabled at different frequencies and with the seed data uploaded to the LFSR.
| Test |
|
50 MHz |
25 MHz |
12.5 MHz |
6.25 MHz |
| The Frequency (Monobit) Test |
|
0.566642 |
0.410968 |
0.862421 |
0.878356 |
| The Cumulative Sums (Cusums) Test |
Forward |
0.849404 |
0.160562 |
0.189089 |
0.243269 |
| Reverse |
0.584841 |
0.431933 |
0.267939 |
0.326047 |
| The Runs Test |
|
0.783632 |
0.630602 |
0.668979 |
0.077638 |
| The Binary Matrix Rank Test |
|
0.000000 |
0.738692 |
0.114706 |
0.876409 |
| The Non-overlapping Template Matching Test |
Success |
1/1 |
146 – 1/1 |
132 – 1/1 |
131 – 1/1 |
| Failure |
- |
2 - 0/1 |
16 – 0/1 |
17 – 1/1 |
| Maurer’s “Universal Statistical” Test |
|
0.579130 |
0.253059 |
0.003783 |
0.692034 |
| The Approximate Entropy Test |
|
1.000000 |
0.000000 |
0.000000 |
0.000000 |
| The Random Excursions Test |
-4 |
0.467367 |
- |
0.191100 |
0.607683 |
| -3 |
0.884720 |
- |
0.069412 |
0.936361 |
| -2 |
0.384523 |
- |
0.148666 |
0.351011 |
| -1 |
0.762988 |
- |
0.898411 |
0.203527 |
| 1 |
0.323487 |
- |
0.319206 |
0.000782 |
| 2 |
0.683140 |
- |
0.595639 |
0.020346 |
| 3 |
0.720380 |
- |
0.273911 |
0.168472 |
| 4 |
0.567868 |
- |
0.044792 |
0.188158 |
| The Random Excursions Variant Test |
-9 |
0.384418 |
- |
0.164916 |
0.848559 |
| -8 |
0.188230 |
- |
0.109903 |
0.916051 |
| -7 |
0.240596 |
- |
0.083463 |
0.734095 |
| -6 |
0.338072 |
- |
0.119670 |
0.964935 |
| -5 |
0.488889 |
- |
0.177896 |
0.907143 |
| -4 |
0.668621 |
- |
0.376890 |
0.912238 |
| -3 |
0.910389 |
- |
0.607316 |
0.744405 |
| -2 |
0.598397 |
- |
0.868265 |
0.578495 |
| -1 |
0.592797 |
- |
0.416608 |
0.243443 |
| 1 |
0.257429 |
- |
0.781490 |
0.293819 |
| 2 |
0.555006 |
- |
0.655514 |
0.469101 |
| 3 |
0.932730 |
- |
0.314576 |
0.220253 |
| 4 |
0.509320 |
- |
0.208368 |
0.238271 |
| 5 |
0.321720 |
- |
0.195518 |
0.321461 |
| 6 |
0.409263 |
- |
0.312705 |
0.408537 |
| 7 |
0.392529 |
- |
0.337617 |
0.610385 |
| 8 |
0.395996 |
- |
0.507669 |
0.734749 |
| 9 |
0.436434 |
- |
0.996166 |
0.686851 |
| The Linear Complexity Test |
|
0.156728 |
0.953487 |
0.247299 |
0.325363 |
Table 6.
Percentages of P-value greater and less than 0.01 of the Non-overlapping Template Matching test of the neuro-generator with the neuronal module disabled and with the initial seed data.
Table 6.
Percentages of P-value greater and less than 0.01 of the Non-overlapping Template Matching test of the neuro-generator with the neuronal module disabled and with the initial seed data.
| |
50 MHz |
25 MHz |
12.5 MHz |
6.25 MHz |
|
P-value < 0.01 |
0% |
1.35% |
10.81% |
14.86% |
|
P-value > 0.01 |
100% |
98.64% |
89.18% |
85.13% |
Table 7.
Percentages of the data classified in rank 1 and rank 2 of P-value of the test Non-overlapping Templates Matching test with the neuronal module disabled and the seed data loaded.
Table 7.
Percentages of the data classified in rank 1 and rank 2 of P-value of the test Non-overlapping Templates Matching test with the neuronal module disabled and the seed data loaded.
| Rank number |
Range |
50 MHz |
25 MHz |
12.5 MHz |
6.25 MHz |
| 1 |
0.000000-0.500000 |
0% |
1.35% |
10.81% |
14.86% |
| 2 |
0.500001-1.000000 |
100% |
98.64% |
89.18% |
85.13% |
Table 8.
NIST test results of the output sequence of the neuro-generator without neuronal module at different frequencies and with the external data uploaded to the LFSR.
Table 8.
NIST test results of the output sequence of the neuro-generator without neuronal module at different frequencies and with the external data uploaded to the LFSR.
| Test |
|
50 MHz |
25 MHz |
12.5 MHz |
6.25 MHz |
| The Frequency (Monobit) Test |
|
0.884843 |
0.728427 |
0.687972 |
0.989403 |
| The Cumulative Sums (Cusums) Test |
Forward |
0.509655 |
0.945094 |
0.592716 |
0.528836 |
| Reverse |
0.399454 |
0.653469 |
0.298575 |
0.540060 |
| The Runs Test |
|
0.936982 |
0.658912 |
0.998950 |
0.462778 |
| The Binary Matrix Rank Test |
|
0.919194 |
0.247820 |
0.384542 |
0.009961 |
| The Non-overlapping Template Matching Test |
Success |
146 - 1/1 |
147 – 1/1 |
133 – 1/1 |
109 – 1/1 |
| Failure |
2 – 0/1 |
1 - 0/1 |
15 – 0/1 |
39 – 1/1 |
| Maurer’s “Universal Statistical” Test |
|
0.133589 |
0.388333 |
0.011062 |
0.815387 |
| The Approximate Entropy Test |
|
1.000000 |
0.000000 |
0.000000 |
0.000000 |
| The Random Excursions Test |
-4 |
0.045122 |
0.817261 |
0.874869 |
0.570161 |
| -3 |
0.492951 |
0.285619 |
0.748484 |
0.016769 |
| -2 |
0.556605 |
0.271948 |
0.340548 |
0.276724 |
| -1 |
0.772149 |
0.171385 |
0.943792 |
0.678371 |
| 1 |
0.495950 |
0.579563 |
0.524852 |
0.311659 |
| 2 |
0.325464 |
0.502241 |
0.768692 |
0.722220 |
| 3 |
0.381388 |
0.447861 |
0.881182 |
0.068291 |
| 4 |
0.799388 |
0.130351 |
0.353430 |
0.027115 |
| The Random Excursions Variant Test |
-9 |
0.810827 |
0.761053 |
0.910869 |
0.762147 |
| -8 |
0.972437 |
1.000000 |
0.995678 |
0.652559 |
| -7 |
0.666139 |
0.665152 |
0.625005 |
0.249275 |
| -6 |
0.919655 |
0.760662 |
0.418128 |
0.153372 |
| -5 |
0.492830 |
0.909033 |
0.493135 |
0.189997 |
| -4 |
0.418370 |
0.907717 |
0.703488 |
0.283471 |
| -3 |
0.148806 |
0.815005 |
1.000000 |
0.719361 |
| -2 |
0.058377 |
0.370381 |
0.836859 |
0.447279 |
| -1 |
0.127966 |
0.143933 |
1.000000 |
0.199808 |
| 1 |
0.323690 |
0.759078 |
0.413242 |
0.259216 |
| 2 |
0.072449 |
0.879953 |
0.536747 |
0.074035 |
| 3 |
0.041878 |
1.000000 |
0.721445 |
0.066537 |
| 4 |
0.104200 |
0.861961 |
0.510442 |
0.028500 |
| 5 |
0.108316 |
0.634735 |
0.385858 |
0.032612 |
| 6 |
0.110998 |
0.787734 |
0.194720 |
0.162475 |
| 7 |
0.157074 |
0.880679 |
0.065959 |
0.253193 |
| 8 |
0.199588 |
0.872326 |
0.038017 |
0.295527 |
| 9 |
0.198426 |
0.813217 |
0.055723 |
0.433272 |
| The Linear Complexity Test |
|
0.971171 |
0.453292 |
0.182665 |
0.862476 |
| |
|
|
|
|
|
Table 9.
Percentages of P-value greater than and less than 0.01 of the Non-overlapping Template Matching test of the neuro-generator with the neuronal module disabled and with external initial data.
Table 9.
Percentages of P-value greater than and less than 0.01 of the Non-overlapping Template Matching test of the neuro-generator with the neuronal module disabled and with external initial data.
| |
50 MHz |
25 MHz |
12.5 MHz |
6.25 MHz |
|
P-value < 0.01 |
1.35% |
0.675% |
10.13% |
27.02% |
|
P-value > 0.01 |
98.6% |
99.32% |
89.86% |
72.97% |
Table 10.
Percentages of the data classified in rank 1 and rank 2 of P-value of the test Non-overlapping Templates Matching test of the neuro-generator with the neuronal module disabled and the external data loaded.
Table 10.
Percentages of the data classified in rank 1 and rank 2 of P-value of the test Non-overlapping Templates Matching test of the neuro-generator with the neuronal module disabled and the external data loaded.
| Rank number |
Range |
50 MHz |
25 MHz |
12.5 MHz |
6.25 MHz |
| 1 |
0.000000-0.500000 |
50% |
52.70% |
75.67% |
88.51% |
| 2 |
0.500001-1.000000 |
50% |
47.29% |
24.32% |
11.48% |
Table 11.
NIST approved test results of the output sequence of the neuro-generator with the neuronal module enabled at a frequency of 100 MHz and with external data loaded.
Table 11.
NIST approved test results of the output sequence of the neuro-generator with the neuronal module enabled at a frequency of 100 MHz and with external data loaded.
| Test |
|
External |
| The Frequency (Monobit) Test |
|
0.077959 |
| The Random Excursions Test |
-4 |
0.808997 |
| -3 |
0.723267 |
| -2 |
0.526459 |
| -1 |
0.628777 |
| 1 |
0.215893 |
| 2 |
0.167534 |
| 3 |
0.337069 |
| 4 |
0.834364 |
| The Random Excursions Variant Test |
-9 |
0.314745 |
| -8 |
0.154227 |
| -7 |
0.084630 |
| -6 |
0.091567 |
| -5 |
0.437046 |
| -4 |
0.883230 |
| -3 |
0.745636 |
| -2 |
0.463622 |
| -1 |
0.265290 |
| 1 |
0.154200 |
| 2 |
0.316284 |
| 3 |
0.516469 |
| 4 |
0.563460 |
| 5 |
0.580490 |
| 6 |
0.690361 |
| 7 |
0.719403 |
| 8 |
0.888289 |
| 9 |
0.865288 |
| The Linear Complexity Test |
|
0.640503 |
|
Disclaimer/Publisher’s Note: The statements, opinions and data contained in all publications are solely those of the individual author(s) and contributor(s) and not of MDPI and/or the editor(s). MDPI and/or the editor(s) disclaim responsibility for any injury to people or property resulting from any ideas, methods, instructions or products referred to in the content. |
© 2024 by the authors. Licensee MDPI, Basel, Switzerland. This article is an open access article distributed under the terms and conditions of the Creative Commons Attribution (CC BY) license (http://creativecommons.org/licenses/by/4.0/).

