Preprint
Article

A Modified Enthalpic Lattice Boltzmann Method for Simulating Conjugate Heat Transfer Problems in Non-homogeneous Media

Altmetrics

Downloads

105

Views

34

Comments

0

A peer-reviewed article of this preprint also exists.

Submitted:

10 April 2024

Posted:

11 April 2024

You are already at the latest version

Alerts
Abstract
This paper introduces a new adaptation of the enthalpic lattice Boltzmann method (LBM) tailored to simulate the intricate dynamics of conjugate heat transfer in non-homogeneous media, showcasing considerable potential for enhancing heat exchanger designs. This approach expands upon the conventional enthalpic LBM framework by seamlessly incorporating tailored source terms, enabling precise representation of local and transient variations in the medium’s thermophysical properties. The resulting LBM model comprehensively captures the energy conservation equation, with exceptions made only for flow compressibility and viscous dissipation, thereby significantly augmenting its versatility in analyzing heat exchanger configurations. Verification tests, comprising assessments of both transient and steady-state solutions, unequivocally validate the accuracy of the proposed model, further bolstering its reliability for analyzing heat exchange processes within intricate heat exchanger geometries. To demonstrate its efficacy, simulations of conjugate heat transfer processes involving fluid natural convection within structured cavities were performed, imposing both Dirichlet and Neumann boundary conditions to emulate scenarios encountered in practical heat exchanger operations. The findings yield compelling insights, particularly in the transient regime, revealing the beneficial impact of structured cavities on enhancing heat transfer processes. These insights inform potential design optimizations for heat exchangers. The results emphasize the potential of the modified enthalpic LBM approach to elucidate complex heat transfer phenomena in non-homogeneous media and structured geometries, offering valuable implications for heat exchanger engineering and optimization.
Keywords: 
Subject: Engineering  -   Mechanical Engineering

1. Introduction

Natural convection processes have demonstrated numerous applications in refrigerating electronic devices and technology, including the cooling of printed circuit boards, memory devices, processors, and more [1,2]. This heat transfer phenomenon has also been utilized in cooling mechanisms for buildings, electric motors, air conditioning and refrigeration systems, nuclear reactors, among others [3,4]. Typically, in these applications, the cooling process by natural convection is facilitated through heat exchangers, which come in various geometrical configurations and types. Given its widespread use and low operational cost, enhancing this heat transfer mechanism is of significant interest.
Various methods employed for this purpose involve surface modifications, such as adding fins or utilizing small cavities or grooves. Several studies found in the literature [5,6,7,8,9] investigate the impact of surface modifications on enhancing free convection heat transfer processes. Generally, these studies examine surface modifications with configurations resembling waves, employing sinusoidal functions [10,11], evenly spaced geometries like triangular [8,12] or squared [9,13] patterns. These works are often categorized based on modifications made to horizontal [11,12], vertical [6,9,10], or inclined surfaces [7,13], typically employing experimental and Computational Fluid Dynamics (CFD) techniques to analyze the problem.
By its nature, the free convection process occurs under conjugate heat transfer conditions, initially defined by [14]. Consequently, numerical simulations of such a problem prove to be challenging, with many works resorting to directly imposing boundary conditions at the fluid nodes [6,8]. Traditionally, computational procedures primarily rely on finite differences, finite volume, or finite element methods [15,16,17,18]. These methods typically involve creating coupling schemes at the solid-fluid interface, where Dirichlet and Neumann boundary conditions are imposed on different sides and solving the energy conservation equation separately. Despite their applicability, implementing these methods on more complex interfaces can become challenging, particularly in ensuring continuity at the interface.
On the other hand, the Lattice Boltzmann Method (LBM), a mesoscopic simulation technique that solves the Boltzmann transport equation on a discrete lattice [19], offers advantages over traditional methods. It excels in handling complex geometries, simulating multiphase flows [20,21,22,23,24], conjugate heat transfer [25,26,27,28,29], and capturing non-equilibrium effects [30]. Due to its inherent nature, the LBM does not necessitate specific coupling schemes at solid-liquid interfaces for simulating conjugate heat transfer problems. The method is capable of dealing with interfaces more seamlessly, which, in many aspects, can facilitate its implementation for more complex geometries.
Most of the studies identified in our literature review have focused on analyzing the impact of adding protuberances (such as fins) to enhance the natural convection process. Typically, these analyses are conducted under stationary regimes, overlooking the dynamics leading to such conditions. Furthermore, many studies do not consider the surface, imposing thermal boundary conditions directly at the solid-fluid interface. This approach may, once again, influence the transient regime of the problem. By its very nature, this type of problem involves heat transfer between different mediums, or, in other words, occurs under conjugate heat-transfer conditions. Therefore, to accurately capture the transient regime, both the solid and fluid must be modeled.
To address this issue, the authors of this paper propose the implementation of a modified model of the enthalpic thermal LBM to handle conjugate heat transfer. The LBM possesses intrinsic characteristics that make it well-suited for addressing such problems, as demonstrated throughout this study. Therefore, this work aims to develop an LBM model to address conjugate heat transfer conditions and simulate a natural convection problem with different surface geometries.
The considered computational domain characterizes a typical heat exchanger configuration employed in electronic cooling applications. The development of the conjugate heat transfer model is based upon the expansion of the complete energy conservation equation assuming an incompressible flow and neglecting viscous dissipation, and finally by inserting the resulting additional term to the lattice Boltzmann equation (LBE) through a thermal forcing scheme. Since the proposed model is based upon the inclusion of missing term of the energy equation into the LBE through a source term, and no special treatment of the interface is applied, the proposed model can be easily implemented when considering complex interfaces and extended to higher dimensions, while incorporating the physics associated with non-homogeneous mediums.
The paper is structured into three main sections. The first section (Sec. Section 2) outlines the employed methodology, which includes the presentation of momentum and thermal LBM models, as well as the derivation and integration of a source term to address conjugate heat transfer. Following this, the second section (Sec. Section 3) presents the results obtained from benchmark tests. These tests involve comparisons with analytical solutions for pure diffusion problems, both transient and stationary, as well as convection diffusion problems. Additionally, a mesh refinement study is conducted using natural convection results sourced from existing literature. The final section (Sec. Section 4) examines the effects of structural geometries on the natural convection problem. Finally, the principal conclusions drawn from the study are presented in the concluding Section 5).

2. Mathematical Modeling

In this section it is presented the mathematical models employed for performing the simulations of this paper. We are considering the dimensional approach proposed by Martins et al. [31], given its facility to deal directly with real fluid properties.

2.1. Lattice Boltzmann Method for Fluid Flow

For the fluid flow modeling it was considered the traditional LBE with the BGK collision operator [32], which considers only a single relaxation time, τ . Giving a time and space discrete intervals Δ t and Δ x , the LBE for the fluid flow is given by Eq. 1[30]. In this equation, f i is the density distribution function, f i e q represents the equilibrium distribution function and S f i is the forcing term, which depend on the forcing scheme chosen. The sub-index i represents each discrete velocity direction, while c i is the particle velocity vector, according to the selected velocity scheme [33].
f i ( x + c i Δ t , t + Δ t ) f i ( x , t ) = Δ t τ f i ( x , t ) f i e q ( x , t ) + S f i ( x , t ) Δ t .
The equilibrium distribution functions for the fluid flow LBE are calculated by Eq. 2 [34], where u and ρ are the macroscopic velocity and density, respectively, c s is the sound speed and w i are the weighs related to each velocity direction i, both depending on the velocity scheme considered.
f i e q ( x , t ) = w i ρ ( x , t ) 1 + c i · u c s 2 + ( c i · u ) 2 2 c s 4 u · u 2 c s 2 ( x , t ) .
In the simulations performed here, we used a two-dimensional approach with the D 2 Q 9 velocity scheme. Thus, according to [33] the particle velocity vectors and the respective weighs are given by Eq. 3 and Eq. 4, being c = Δ x / Δ t and c s = c / 3 .
c i = c ( 0 , 0 ) , i = 0 , ( 1 , 0 ) , ( 0 , 1 ) , ( 1 , 0 ) , ( 0 , 1 ) , i = 1 , . . . , 4 , ( 1 , 1 ) , ( 1 , 1 ) , ( 1 , 1 ) , ( 1 , 1 ) , i = 5 , . . . , 8 .
w i = 4 / 9 , i = 0 , 1 / 9 , i = 1 , . . . , 4 , 1 / 36 , i = 5 , . . . , 8 .
For the source term in Eq. 1, the forcing scheme proposed by Guo et al. [35] was used. Then, the source term is defined by Eq. 5, where F is the total specific force acting over the domain.
S f i = 1 Δ t 2 τ w i c i u c s 2 + ( c i · u ) c i c s 4 ( x , t ) · F ( x , t )
Additionally, the macroscopic fields can be obtained from the distribution functions as depicted in Eq. 6 and Eq. 7, being q the number of discrete velocity directions (for example, q = 9 for the D 2 Q 9 scheme).
ρ ( x , t ) = i = 0 q 1 f i ( x , t )
ρ ( x , t ) u ( x , t ) = i = 0 q 1 f i ( x , t ) c i + Δ t 2 F ( x , t )
Through the Chapman-Enskog analysis [36] it is possible to recover the Navier-Stokes equation, Eq. 8, from the LBE. This process results in a relation between the relaxation time, τ , and the kinematic viscosity, ν , which is given by ν = ( τ 0.5 Δ t ) c s 2 .
ρ u t + · ρ u u = p + · ν ρ u + u T + F .
Regarding boundary conditions (BC), it was implemented the bounce-back (BB) rule for both static walls and fluid inlet BCs, given by Eq. 9, where i ¯ indicates the opposite direction of i, x b are the boundary nodes and the variables with sub-index w stand for the values defined at the boundary. The more complexes geometries, as the cavities for the natural convection, were also implemented using the BB rule.
f i ¯ ( x b , t + Δ t ) = f i * ( x b , t ) 2 w i ρ w c i · u w c s 2
The periodic kind of BC was simply implemented considering that the populations leaving one side are the same that enter at the opposite side of the domain. This relation can be expressed by the following expression: f i ( x b , t + Δ t ) = f i * ( x b + L c i Δ t , t ) , where L is the size of the domain pointing at the normal direction of the boundary.

2.2. Boussinesq Approach for Natural Convection

In the natural-convection, the local temperature variations cause small local density changes, which create mass fluxes through the domain because of the gravitational field influence. These fluxes are commonly denominated "convection currents", which help to transfer the heat in the entire domain.
A practical way to include the effects of density fluctuations in the LB simulations is by using the Boussinesq approach. Instead of considering a temperature-dependent density, ρ ( T ) , it is assumed that the fluid remains at a mean density, ρ ¯ , measured at the reference temperature of T ¯ . Then, the thermal expansion coefficient can be expressed according to Eq. 10, and the buoyancy force that is given by Eq. 11 is added to the momentum LBE (Eq. 1) for taking into consideration the density fluctuations. In this equation, g is the gravitational acceleration.
β e x p = 1 ρ ρ T 1 ρ ¯ / ρ ( x , t ) T ( x , t ) T ¯
F b ( x , t ) = β e x p g ρ ¯ T ( x , t ) T ¯
In this paper we are simulating transient conjugate heat transfer problems, including transient natural convection problems, which can be driven by a constant heat flux or surface temperature. For all cases the determination of the reference temperature ( T ¯ ) becomes a challenge and a necessity. This is because even if the fluid is initially at an uniform temperature, the local temperature values increase non-equally over time. Then, the mean temperature of the domain changes every time and it is needed to determine T ¯ for each time-step.
Consequently, in this work all the fluid properties that are independent of the distribution functions are re-calculated for each new T ¯ value. These properties include the dynamic viscosity, specific heat capacity, conductivity and thermal expansion coefficient. For this task, we propose to use polynomial approaches for determining the variation of these properties with the temperature. Here, these polynomials were obtained with the help of EES software [37]. Hence, the employed LBM model has the capability of dealing with local and temporal thermophysical property changes. The new T ¯ values are calculated explicitly, i.e., considering the average mean temperature of the fluid domain from the previous time step.

2.3. Lattice Boltzmann Method for Conjugate Heat-Transfer

As pointed by Korba et al. [25], the two more accurate LBM models to deal with conjugate heat transfer are the interface treatment, proposed by Li et al. [26], and the ”enthalpy like" models, as the developed by Chen et al. [27], Rihab et al. [38]. In general, models with a direct interface treatment have good precision for any boundary position in relation to the boundary lattices. However, in the presence of structured surfaces or complicated geometries the implementation of these interface conditions become considerably difficult.
The main advantage of the “enthalpy-like” models is that they do not have to perform special treatments for the interfaces, in which effects are naturally incorporated by the LBE. Then, there is no additional difficulties related to complicated geometries between the different materials. Furthermore, for the link-wise approach [25], both methods have second order accuracy when it is used the link-wise approach for the boundary nodes. Thus, in this paper, we propose a modification of the Chen et al. [27] model for accounting the temporal and local variation of the medium (solid and fluid) properties, considering conjugate heat transfer problems. The procedure for re-calculating the thermophysical properties as a function of the temperature was explained in the previous Section 2.2.
The conservative form of the energy conservation equation [39] for a system without volumetric heat source, written in terms of temperature, T, and constant pressure specific heat, c P , for a generic system is given by Eq. 12. In this equation, the term ln V ln T D P d t stands for the energy transfer due to compressible effects, while τ : u refers to the viscous dissipation.
t ( ρ c p T ) + · ( ρ c p T u ) = k T + ln V ln T D P D t + τ : u + T D ρ c P D t
Now, the left-hand side of Eq. 12 can be re-written as follows:
t ( ρ c p T ) + · ( ρ c p T u ) = ρ c P [ t T + · ( T u ) ] + T D ρ c P D t .
Substituting Eq. 13 into Eq. 12, blue we have:
ρ c P [ t T + · ( T u ) ] = k T + ln V ln T D P D t + τ : u
Neglecting the viscous heat dissipation, the energy conservation equation, is given by Eq. 15. It is important to note that this equation is generic enough for being valid for a non-homogeneous domain.
ρ c P [ t T + · ( T u ) ] = k T
Similarly to the model developed by Chen et al. [27], a new variable h 0 = ρ c P 0 T is defined, being ρ c P 0 a constant reference heat capacitance. Substituting T = h 0 / ρ c P 0 into Eq. 15 and defining σ = ρ c p / ρ c P 0 , we obtain Eq. 16, where, α = k / ( ρ c p ) is the local thermal diffusivity.
t h 0 + · ( u h 0 ) = ( α h 0 ) k ρ c P 0 h 0 1 σ
Defining a new distribution function g i related to h 0 , and using the source term proposed by Seta [40], the LBE with the dimensional approach for the energy conservation equation is described by Eq. 17. In this equation, Ω g i ( x , t ) is the collision operator. Considering the traditional BGK approach, it is defined as Ω i B G K = g i g i e q / τ T . Also, g i e q is the equilibrium distribution function, given by Eq. 18.
g i ( x + c i Δ t , t + Δ t ) g i ( x , t ) = Ω i ( x , t ) Δ t + Δ t w i 1 Δ t 2 τ T S g ( x , t )
g i e q = w i h 0 ( x , t ) 1 + c i · u c s 2 + ( c i · u ) 2 2 c s 4 u · u 2 c s 2 ( x , t )
By the Chapman-Enskog analysis it is possible to recover the Eq. 16 from the thermal LBE (Eq. 17), resulting that the relaxation time for the BGK collision operator is related to the thermal diffusivity of the domain as, α = k / ( ρ c p ) , by the following expression: α = ( τ T 0.5 Δ t ) c s 2 . The procedure for this analysis is provided in Appendix A. Additionally, is is possible to note that, by this expansion, the LBE only recovers the the first term in the right-hand side of Eq. 16. Consequently, the other terms must be included in the LBE via the source term, which is defined by Eq. 19.
S g ( x , t ) = k ρ c P 0 h 0 1 σ
The additional terms that must be added to via source term to the LBE are not easy to calculate, as it involves gradient of quantities that depends on the distribution functions g i . Thus, it is interesting to make some manipulations using the definition of heat flux from Karani and Huber [41], resulting in the following representation,
k ( ρ c p ) 0 h 0 = σ k ρ c p h 0 = σ 1 Δ t 2 τ T i g i g i e q c i .
Also, the spatial derivative of 1 / σ can be evaluated by a isotropic scheme as χ ( x , t ) = ( c s 2 Δ t ) 1 i w i χ ( x + c i Δ t , t + Δ t ) c i [19]. Then, for the BGK collision operator, the source term can be re-defined by Eq. 21.
S g B G K ( x , t ) = σ 1 Δ t 2 τ T i g i g i e q c i · 1 c s 2 Δ t i w i 1 σ ( x + c i Δ t , t + Δ t ) c i
The local temperature values in each lattice can be calculated from the distribution functions as follows,
T ( x , t ) = 1 ( ρ c p ) 0 i = 0 q 1 g i ( x , t ) + Δ t 2 S g B G K ( x , t )
There are cases where the BGK collision operator can suffer of instabilities. Then, the multiple-relaxation-time (MRT) collision operator can be used to prevent these issues. This operator is defined by Ω i M R T = M 1 Λ M i j ( g j g j e q ) , where [ M ] is the transformation matrix, responsible to transform the distribution functions to the moment space and vice-versa. [ Λ ] is the collision matrix, which is usually a diagonal matrix containing the relaxation rates related to each moment of the distribution function.
Considering the D 2 Q 9 velocity scheme, the transformation matrix [ M ] for the dimensional LBM is defined in Martins et al. [31], and the collision matrix here is defined as [ Λ ] = d i a g ( ω 0 , ω 1 , . . . , ω 8 ) . The relaxation frequencies can be given by ω 3 1 = ω 5 1 = α / c s 2 + Δ t / 2 [42], while the other frequencies can be arbitrarily chosen in such a way that guarantees the stability of the method, usually assuming values close to Δ t 1 .
Additionally, it is very common to perform the collision process with the MRT collision operator directly in the moment space, for facility. Thus, all the Eq. 17 is transformed to the moment space multiplying the equation by [ M ] . Defining the moments of the distribution functions by m = [ M ] g , the collision process in the moment space can be represented by Eq. 23. Then, the post-collision distribution functions can be recovered applying the inverse of the transformation matrix: g * = [ M ] 1 m * .
m * ( x , t ) m ( x , t ) = Δ t [ Λ ] m ( x , t ) m eq ( x , t ) + Δ t w [ I ] Δ t 2 [ Λ ] S g M R T ( x , t )
It is important to note that the spatial derivative of h 0 was previously defined for the BGK collision operator. Then, it needs to be adapted for the MRT collision operator, resulting in Eq. 24.
k ( ρ c p ) 0 h 0 = σ k ρ c p h 0 = σ i [ M ] 1 [ I ] Δ t 2 [ Λ ] g g eq i c i ,
Thus, we have that the source term for the MRT collision operator will be given by Eq. 25.
S g M R T ( x , t ) = σ i [ M ] 1 [ I ] Δ t 2 [ Λ ] g g eq i c i · 1 c s 2 Δ t i w i 1 σ ( x + c i Δ t , t + Δ t ) c i
Here we proposed a model based on the Chen et al.’s [27] enthalpy-based LBM. Our method was deducted from the conservative energy conservation equation. Through this formulation, no hypothesis regarding homogeneous mediums, or time and local independence of thermal properties, were made, and as such, both local and temporal variations of thermodynamics properties are allowed. The spatial variations enters through the source term in the thermal LBE (Eq. 17), meanwhile, the temporal variation are naturally accounted through our formulation, granting the correct capture of the transient phenomena.

3. Benchmark Tests

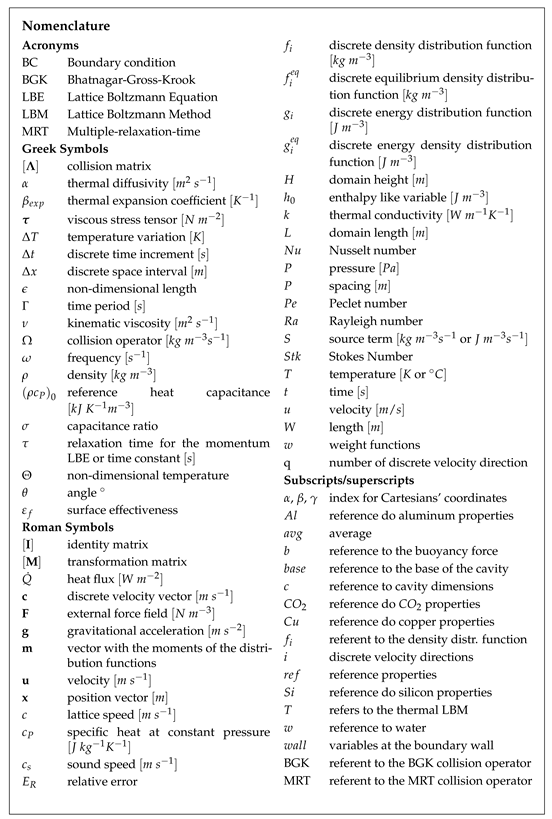
Before exploring the natural convection in an enclosure of a heat exchanger structured with cavities and under conjugate heat transfer conditions, three benchmark tests are explored for validating the proposed methodology. These are: a 1D conduction between three different solids, a forced convection between two fluids and the natural convection in a partially-heated enclosure considering conjugate heat transfer conditions. The numerical results were compared against reference solutions, being analytical for the first two and numerical for the third, for its validation. These comparisons were quantitatively evaluated using the global relative error, defined by Eq. 26. [r] E R relative error
E R = 100 % ( T a n a l y t i c a l T L B M ) 2 T a n a l y t i c a l 2

3.1. Heat Diffusion between Three Solids

The first benchmark problem solved is the transient one-dimensional conduction between three different solids. A square domain with side L = 0.60 m is considered, being the first layer made of copper (starting from the left of the domain), the second one is silicon and the third one, aluminum. Each layer has a length of d = 0.20 m , and then the interfaces are located at x 1 = 0.20 m and x 2 = 0.40 m . Both left and right wall are set with constant temperatures (Dirichlet’s boundary conditions) about T w a l l l = 313.15 K and T w a l l r = 293.15 K , respectively.
Here all the solid’s properties are assumed to be constants, calculated at a temperature of 293.15 K . Being k the thermal conductivity, the properties are: for copper k C u = 401.2 W m 1 K 1 , c p C u = 384.5 J k g 1 K 1 and ρ C u = 8934.0 k g m 3 ; for silicon k S i = 149.6 W m 1 K 1 , c p S i = 709.1 J k g 1 K 1 and ρ S i = 2330.0 k g m 3 ; and for aluminum k A l = 237.0 W m 1 K 1 , c p A l = 905.0 J k g 1 K 1 and ρ A l = 2707.0 k g m 3 . The simulation was performed using the D 1 Q 3 velocity scheme. The space and time were discretized considering intervals of Δ x = 1.2 · 10 3 m and Δ t = 2.5 · 10 3 s , respectively. The analytical solution for this problem is depicted in Appendix B [43].
The results for several time steps are depicted in Figure 1, as expect the major divergences between both the analytical and the numerical solutions, occurs at the interfaces. Despite that the method are shown to capture the overall dynamics of the problem over the transient regime, and also correctly predict the stationary regime.
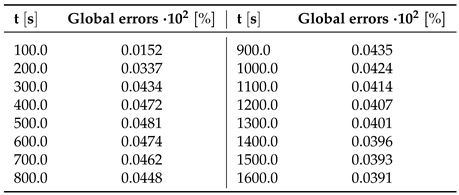
Additionally, the global errors between the numerical and the analytical solution, estimated through Eq. 26, are given in Table 1. From a quantitative point of view, both solutions present a good agreement, resulting in relatively small errors (bellow 0.05 · 10 2 % ) for all time steps, thus further corroborating with the results shown in Figure 1.
Analyzing both results (Figure 1 and Table 1), it can be affirm that the employed model is shown to capture both transient and stationary regimes referent to the heat-diffusion between different mediums with a relatively good accuracy, returning low global errors between the analytical and numerical solutions.

3.2. Convection-Diffusion with a Flat Interface

Next, a transient convection-diffusion problem with a thin flat interface is studied. The solution for this problem is given in Li et al. [26]. This problem consists on a channel with fixed high H and length L, separated in two subdomains: the bottom half, with water flowing, and the top half, with carbon dioxide flowing. A periodic boundary condition is imposed on the left and right boundaries, while a Dirichlet boundary condition on the form of Eq. 27 is imposed on both top and bottom boundaries. Both fluids are assumed to have a constant uniform velocity u = P e α w H in the x-direction, and Δ T is set to 20 K . The analytical solution for this problem is given Appendix C.
T x , 0 , t = T x , L , t = T 0 + Δ T cos 2 π L x + 2 π S t k 2 α w H 2 t = T 0 + Δ T cos K x + ω t
where P e refers to the Péclet number and S t k to the Stokes number, and they were set as 20 and 1, respectively. The properties were assumed as: ρ w = 978.16114 k g m 3 , c P w = 4188.10655 J K g 1 K 1 and α w = 1.61 · 10 7 m 2 s 1 for the water, evaluated at P w = 101325 P a and T r e f = 343.15 K ; and ρ C O 2 = 177.45 k g m 3 , c P C O 2 = 1688.66 J K g 1 K 1 and α C O 2 = 9.76 · 10 8 m 2 s 1 for C O 2 , evaluated at P C O 2 = 8115030 P a and T r e f = 343.15 K . The simulation is performed using a two-dimensional velocity scheme, the D 2 Q 9 . For numerical simulation the space and time were discretized with Δ x = 1 · 10 4 m and Δ t = 1 · 10 4 s .
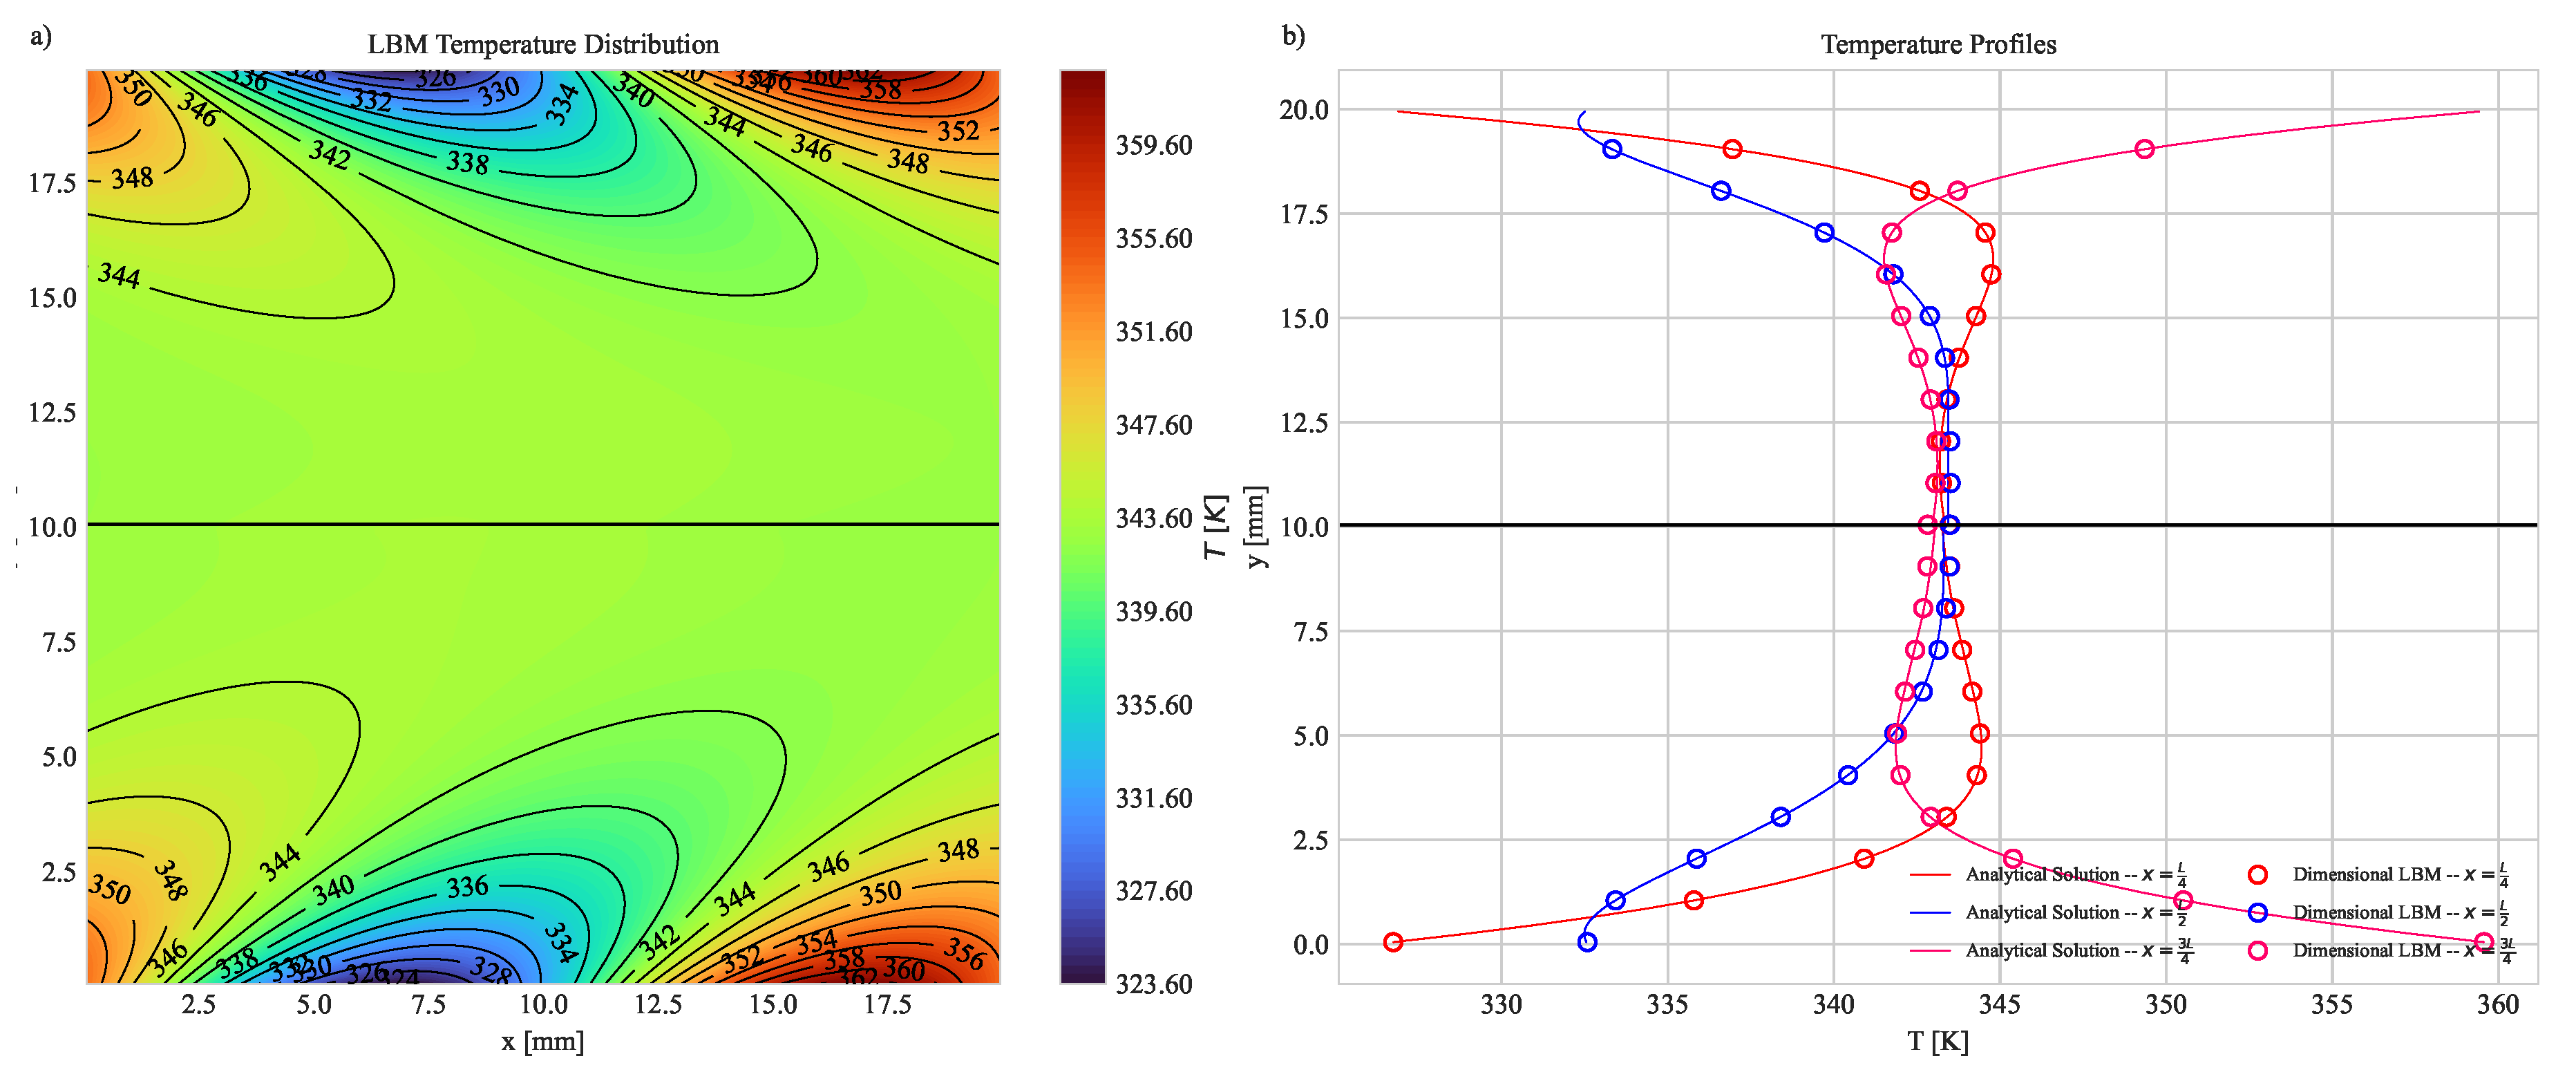
To facilitate the comparisons, the results are shown for various time fractions related to one period Γ = 1 / ω , considering that the solution is periodic in time. Figure 2 shows both the two-dimensional temperature distribution obtained with the LBM , Figure 2 a), and the numerical and analytical temperature profiles along different cuts in the x-axis, Figure 2 b), for a fixed time fraction t = 0.75 Γ . Although Figure 2 represents only a single time, we can still drawn some important conclusions about it. First, from Figure 2 b), we can see that both the temperatures profiles presents a good agreement. The numerical results (hollow circles) almost entirely coincide with the analytical solution (solid lines). Next, we can also observe that yet again, the major divergences between the solutions will occur at the interface, as expected.
Additionally, to better study the performance of our proposed model, we also estimated the global errors (Eq. 26) between the numerical and analytical solutions. The results are given in Table 2. Overall, the results are shown to be in good agreement, with error values bellow 3 · 10 2 % . It is interesting to observe that for the initial moments the output errors were bigger, about 2 · 10 2 % . This results can be associated with a difficult to precisely match the initial conditions for both solutions. Finally, we can also see that once the initial times have passed, the errors will both diminish and stabilize, resulting in a almost constant error for the remaining studied times.

3.3. Natural Convection with a Fixed Heat Flux

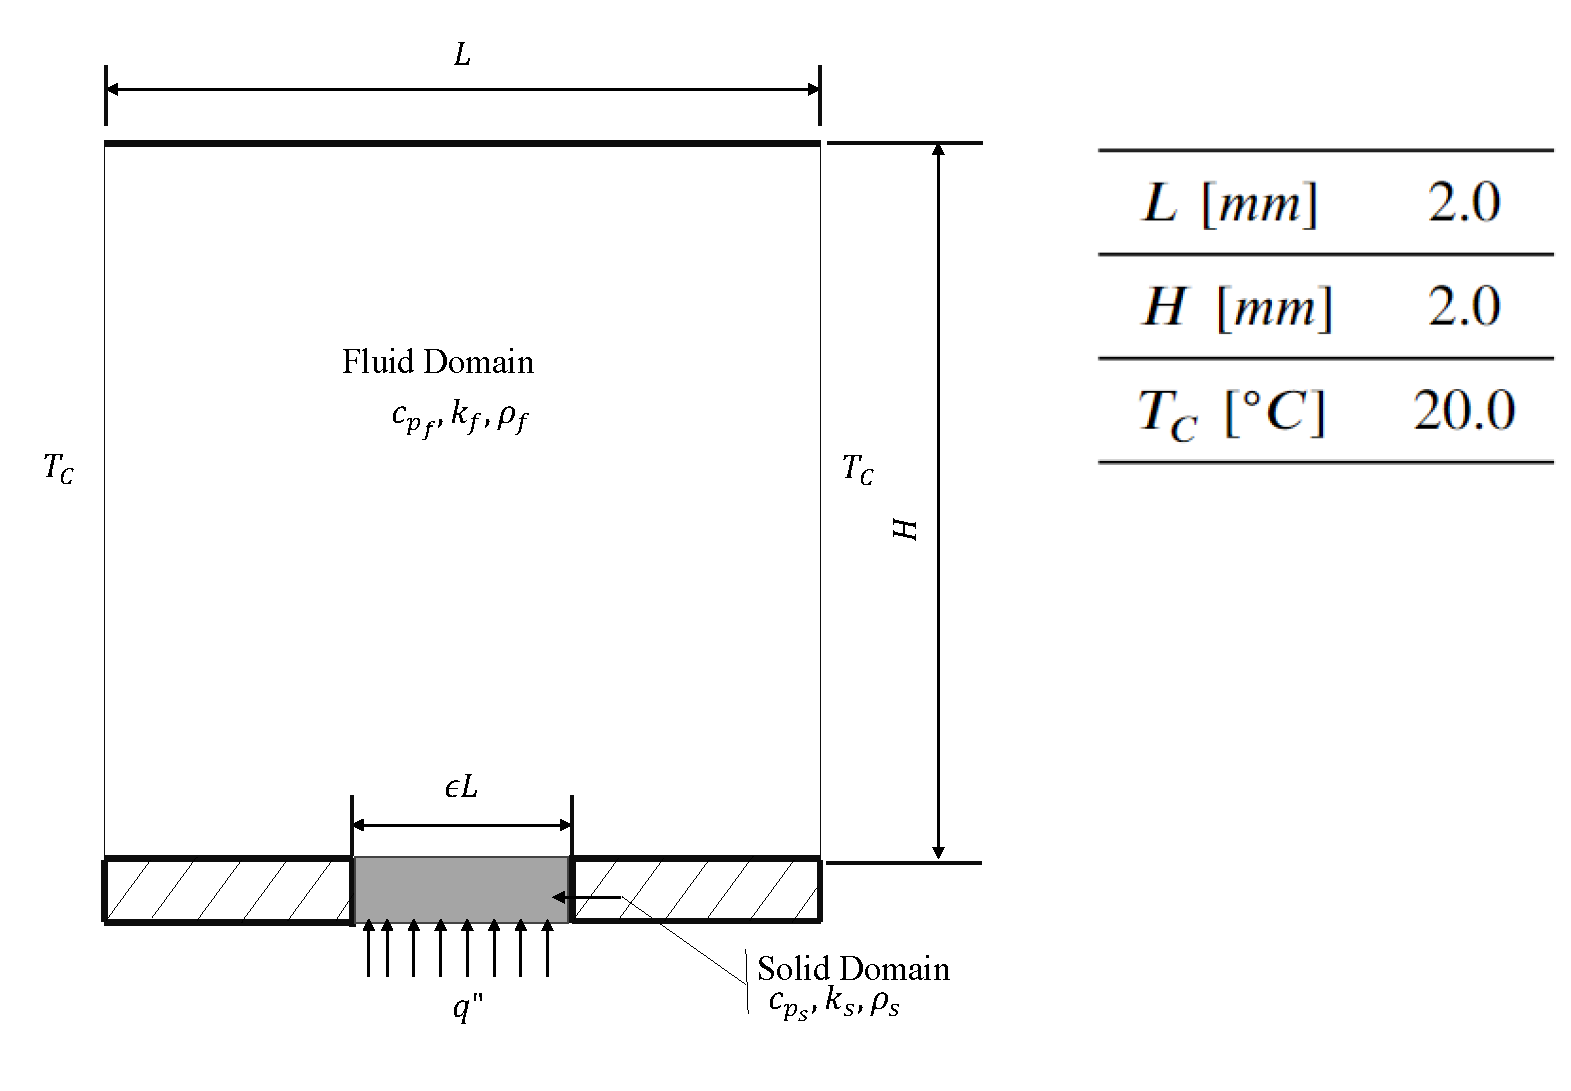
In this case, a natural convection problem consisting of a closed square cavity with a partially heated bottom, was tested. The problem configuration, along with its main dimensions are presented in Figure 3, the problem was presented and simulated in Cheikh et al. [44]. It is important to effort that some modification were made to the original problem, instead of imposing heat directly into the fluid. The heat flux was applied to a thin layer of copper, with a thickness equal to one d x , thus also serving to evaluate the conjugate model.
In simulations the Rayleigh number was maintained at R a = 10 4 and the dimensionless length of the heat source were set as ϵ = 0.8 . Besides, serving the purpose of the validating the employed model, this test was performed with the intuit of choosing a reasonable mesh size to correctly predict the natural convection phenomenon that will be studied on the proceeding chapters of this paper. For the boundary conditions, the adiabatic wall (black lines in Figure 3) and the no-slip boundary conditions, were implemented via bounce-back scheme, while the Dirichlet boundary conditions were implemented via anti-bounce-back scheme. Lastly, for the Neumann boundary conditions, the scheme proposed in Martins et al. [45] were used.
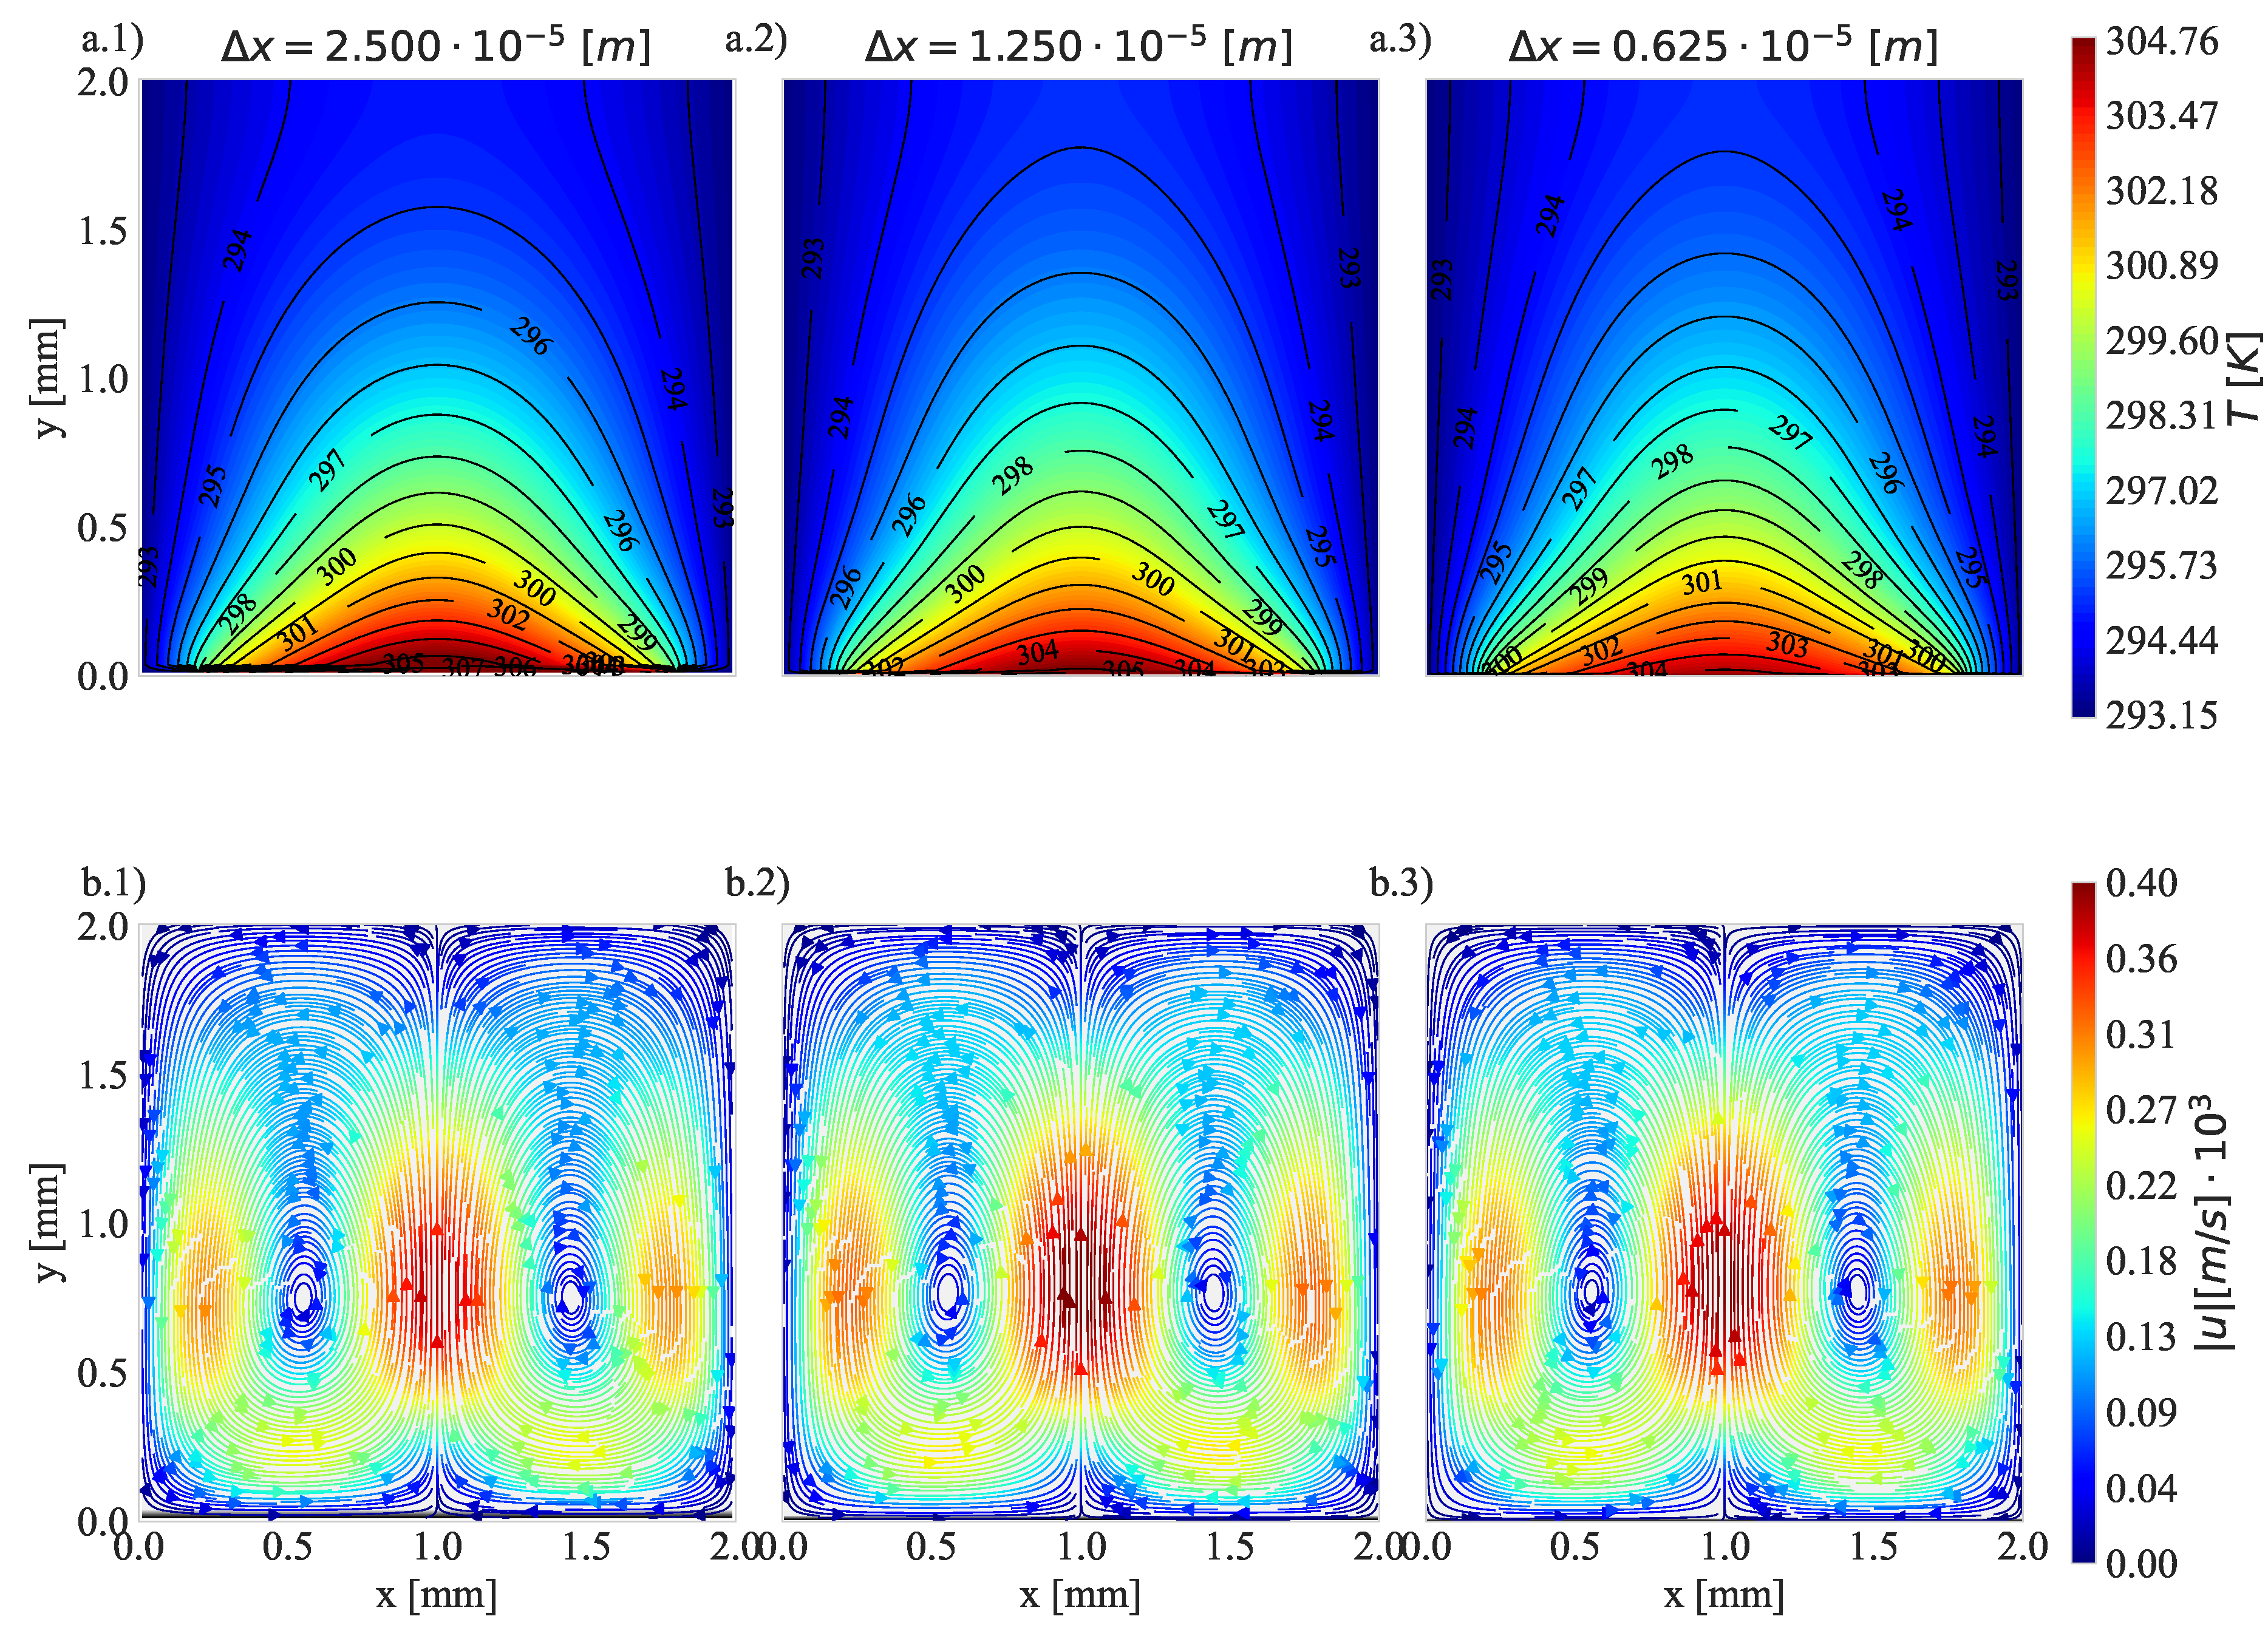
First, the results were organized with reference to the mesh size in Table 3, to facilitate the comparison between different meshes. As we expect, a clear reduction in the relative errors can be observed with the mesh refinement. The model is shown to correctly predict the Nusselt number for all meshes with relative errors bellow 3 % , even with the bigger meshes, thus advocating for its accuracy. Additionally, Figure 4, presents both the temperature distributions and the streamlines for each mesh. Overall all simulations produced similar results, with the fluid presenting higher temperatures close to the cavity, and thus rising from this point, creating 2 recirculating vortexes.
Considering both results (Table 3 and Figure 4), the mesh with Δ x = 6.25 · 10 6 m , produced better results, consequently presenting a better estimation of the resulting Nusselt number, with errors inferiors to 0.1 % . Thus, it is the most reasonable choice for the simulations presented in the following Sec. 4.

4. Results for Natural Convection with Structured Cavities

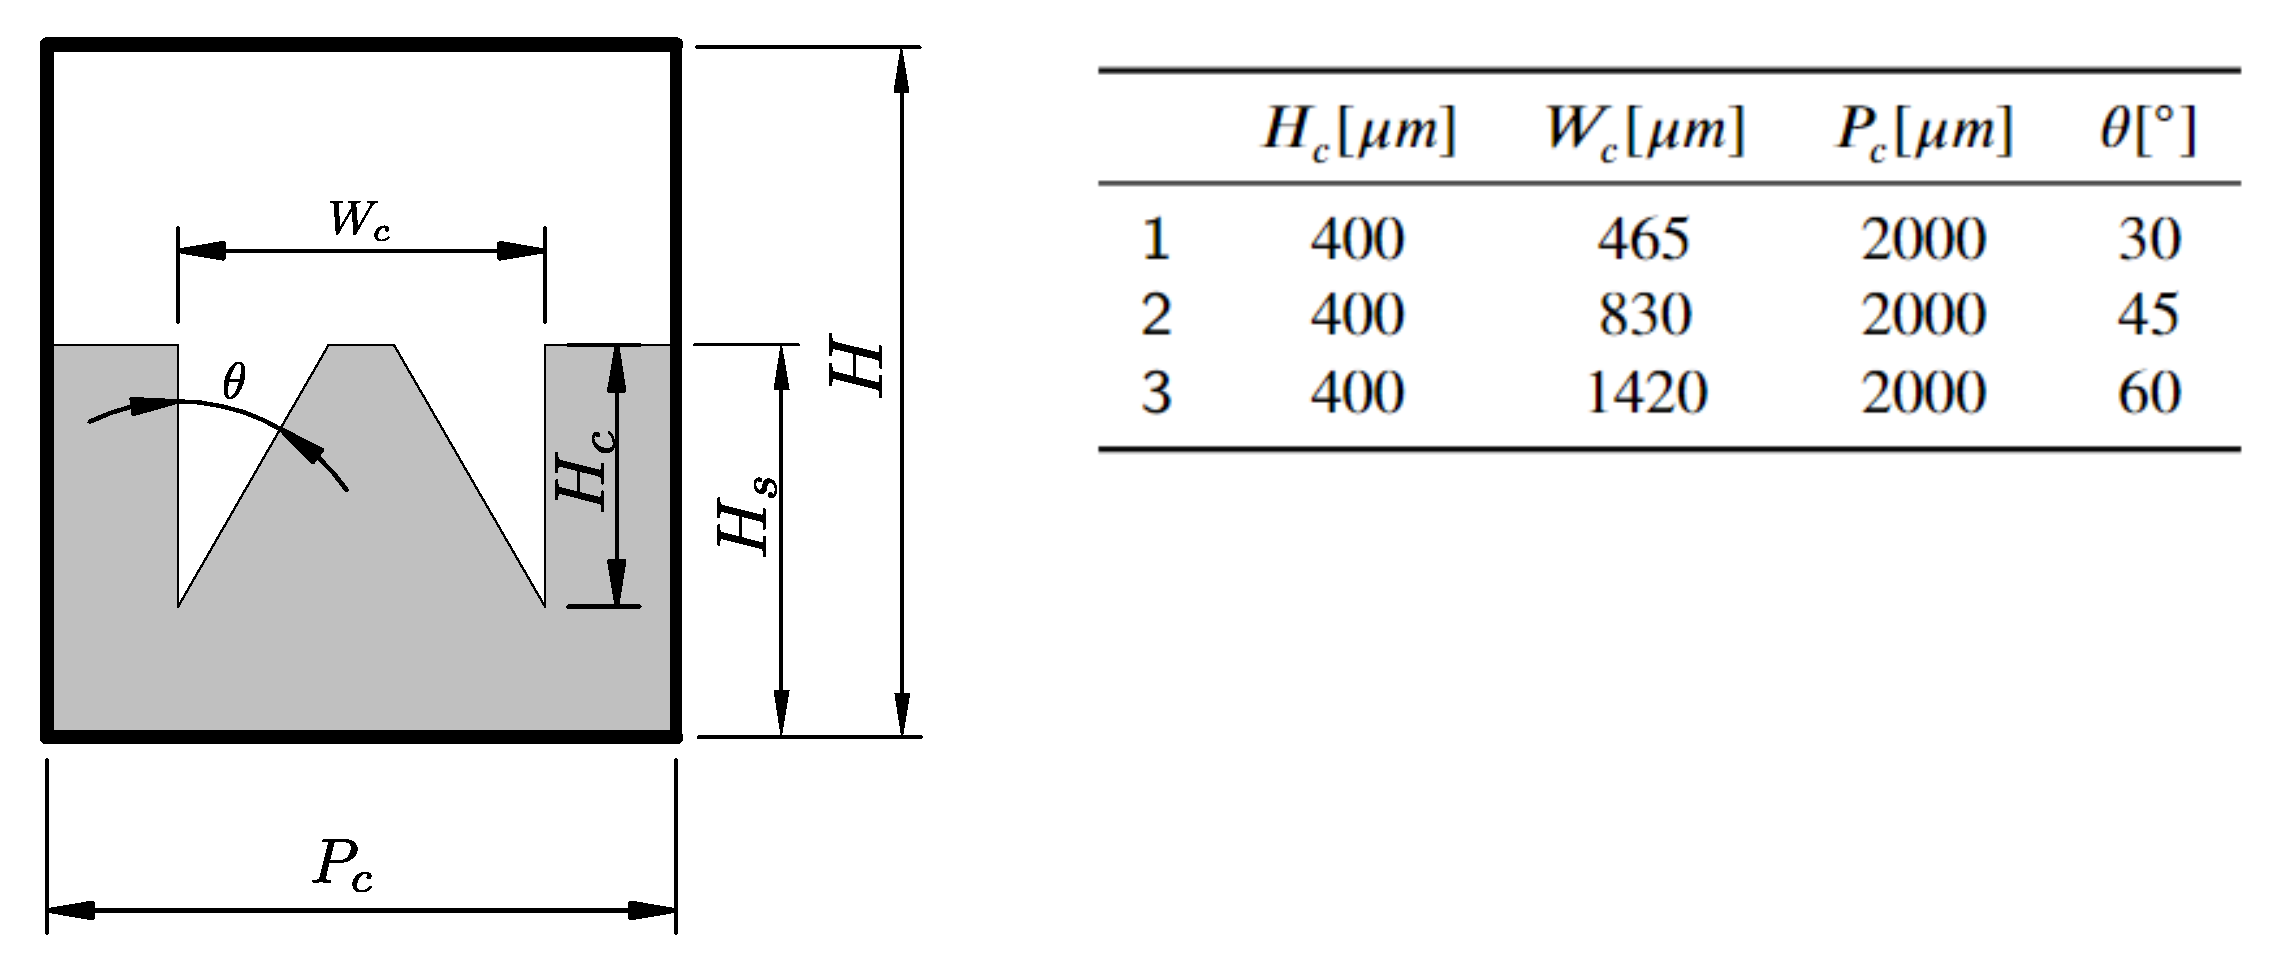
The study examines natural convection under conjugate heat transfer conditions on structured cavities, analyzing transient and steady-state operations. Both Dirichlet and Neumann boundary conditions at the enclosure’s bottom are considered to assess how cavities affect heat transfer, determining their impact on intensifying heat transfer rates at the solid surface. We conducted natural convection simulations using the structured cavities outlined in Moreira et al. [46]. Figure 5 provides schematic representation of the tested geometries. Through these simulations, we aim to accomplish two primary objectives: firstly, to exhibit the method’s proficiency in handling complex problems, and secondly, to investigate the influence of structured cavities on the natural convection phenomenon inside a heat exchanger under conjugate heat transfer conditions.
The structured cavities examined in this study have demonstrated the ability to enhance the flow boiling phenomenon, as shown in Moreira et al. [46]. Consequently, we aim here to investigate whether natural convection can be enhanced by the same surface structures. In fact the free convection is the first step in the nucleating boiling process. Our simulations employ water at P = 1 a t m and a solid copper base characterized by the following thermal properties: k C u = 401.2 W m 1 K 1 , c p C u = 384.5 J k g 1 K 1 , and ρ C u = 8934.0 k g m 3 .
The simulations are categorized as follows: firstly, simulations with a fixed heat flux at the base are conducted to explore the transient regime. Subsequently, simulations with a fixed base temperature are performed to investigate both transient and steady-state regimes.
For the hydrodynamic LBE, a non-slip boundary condition is adopted for all boundaries, implemented via the bounce-back scheme. Regarding the energy LBE, an adiabatic condition is assumed for both lateral boundaries, again, via the bounce-back scheme. For the bottom and top boundaries, Dirichlet boundary conditions are implemented via the anti-bounce-back scheme, while for the Neumann boundary condition, the boundary condition proposed in Martins et al. [45] is utilized. Finally, considering the results presented in Section 3.3, the simulations in this section are performed with Δ x = 6.25 × 10 6 m and Δ t = 6.50 × 10 6 s .

4.1. Geometry Impact on Natural Convection with Imposed Heat Flux

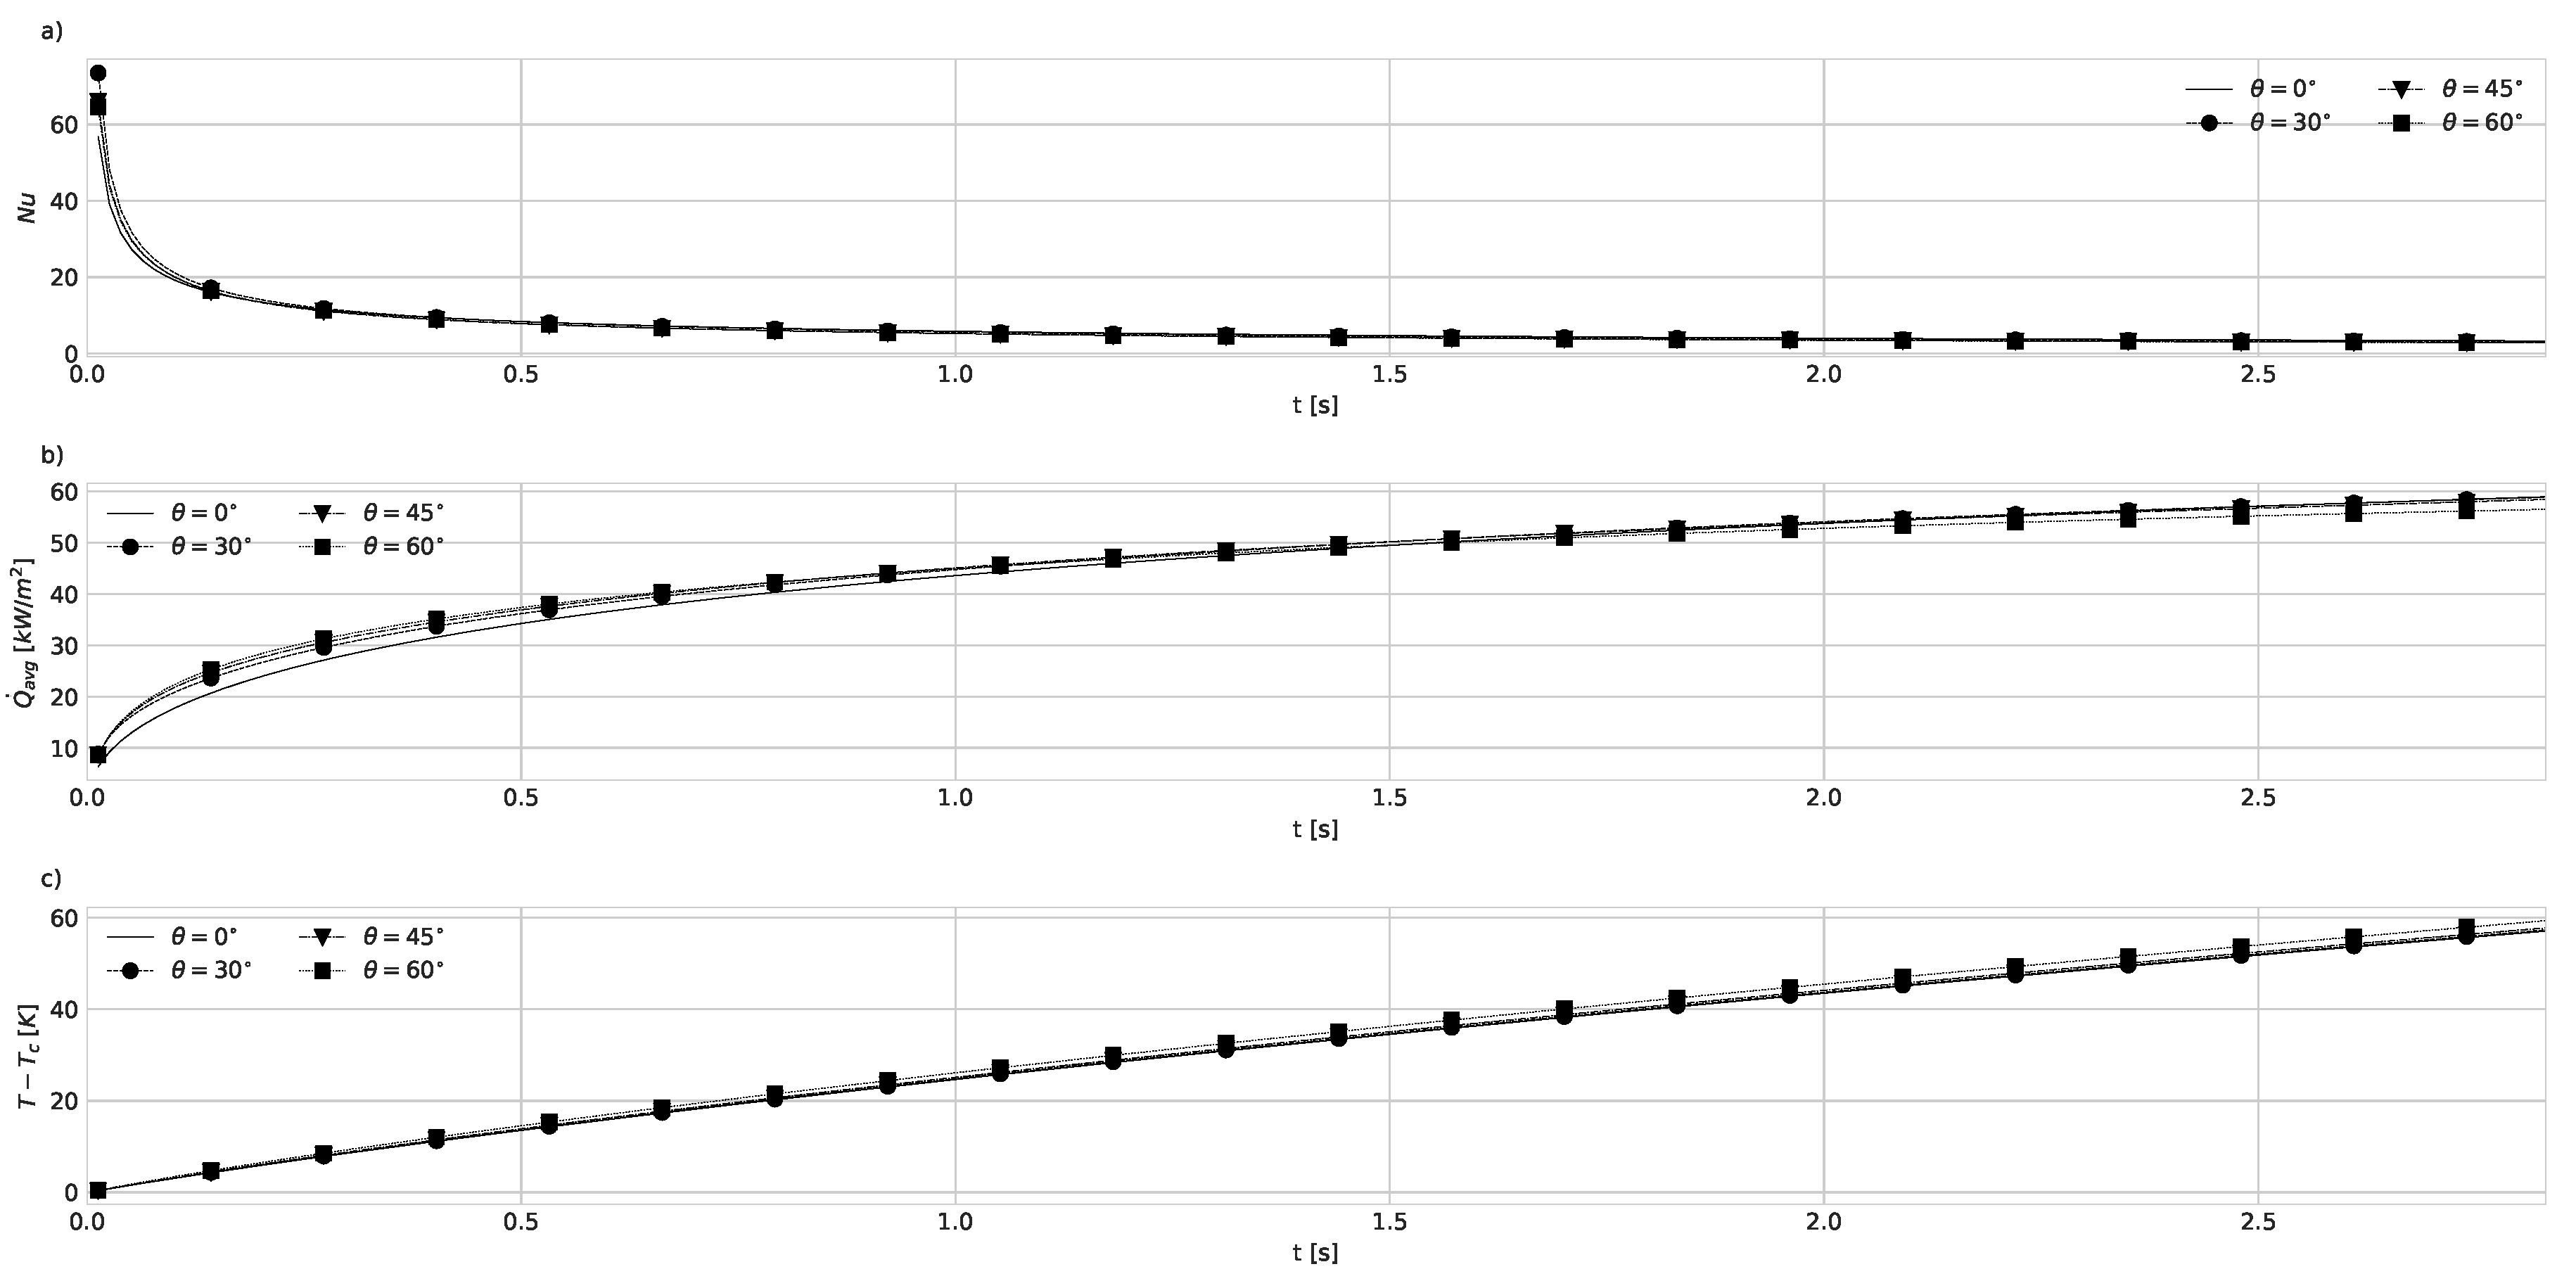
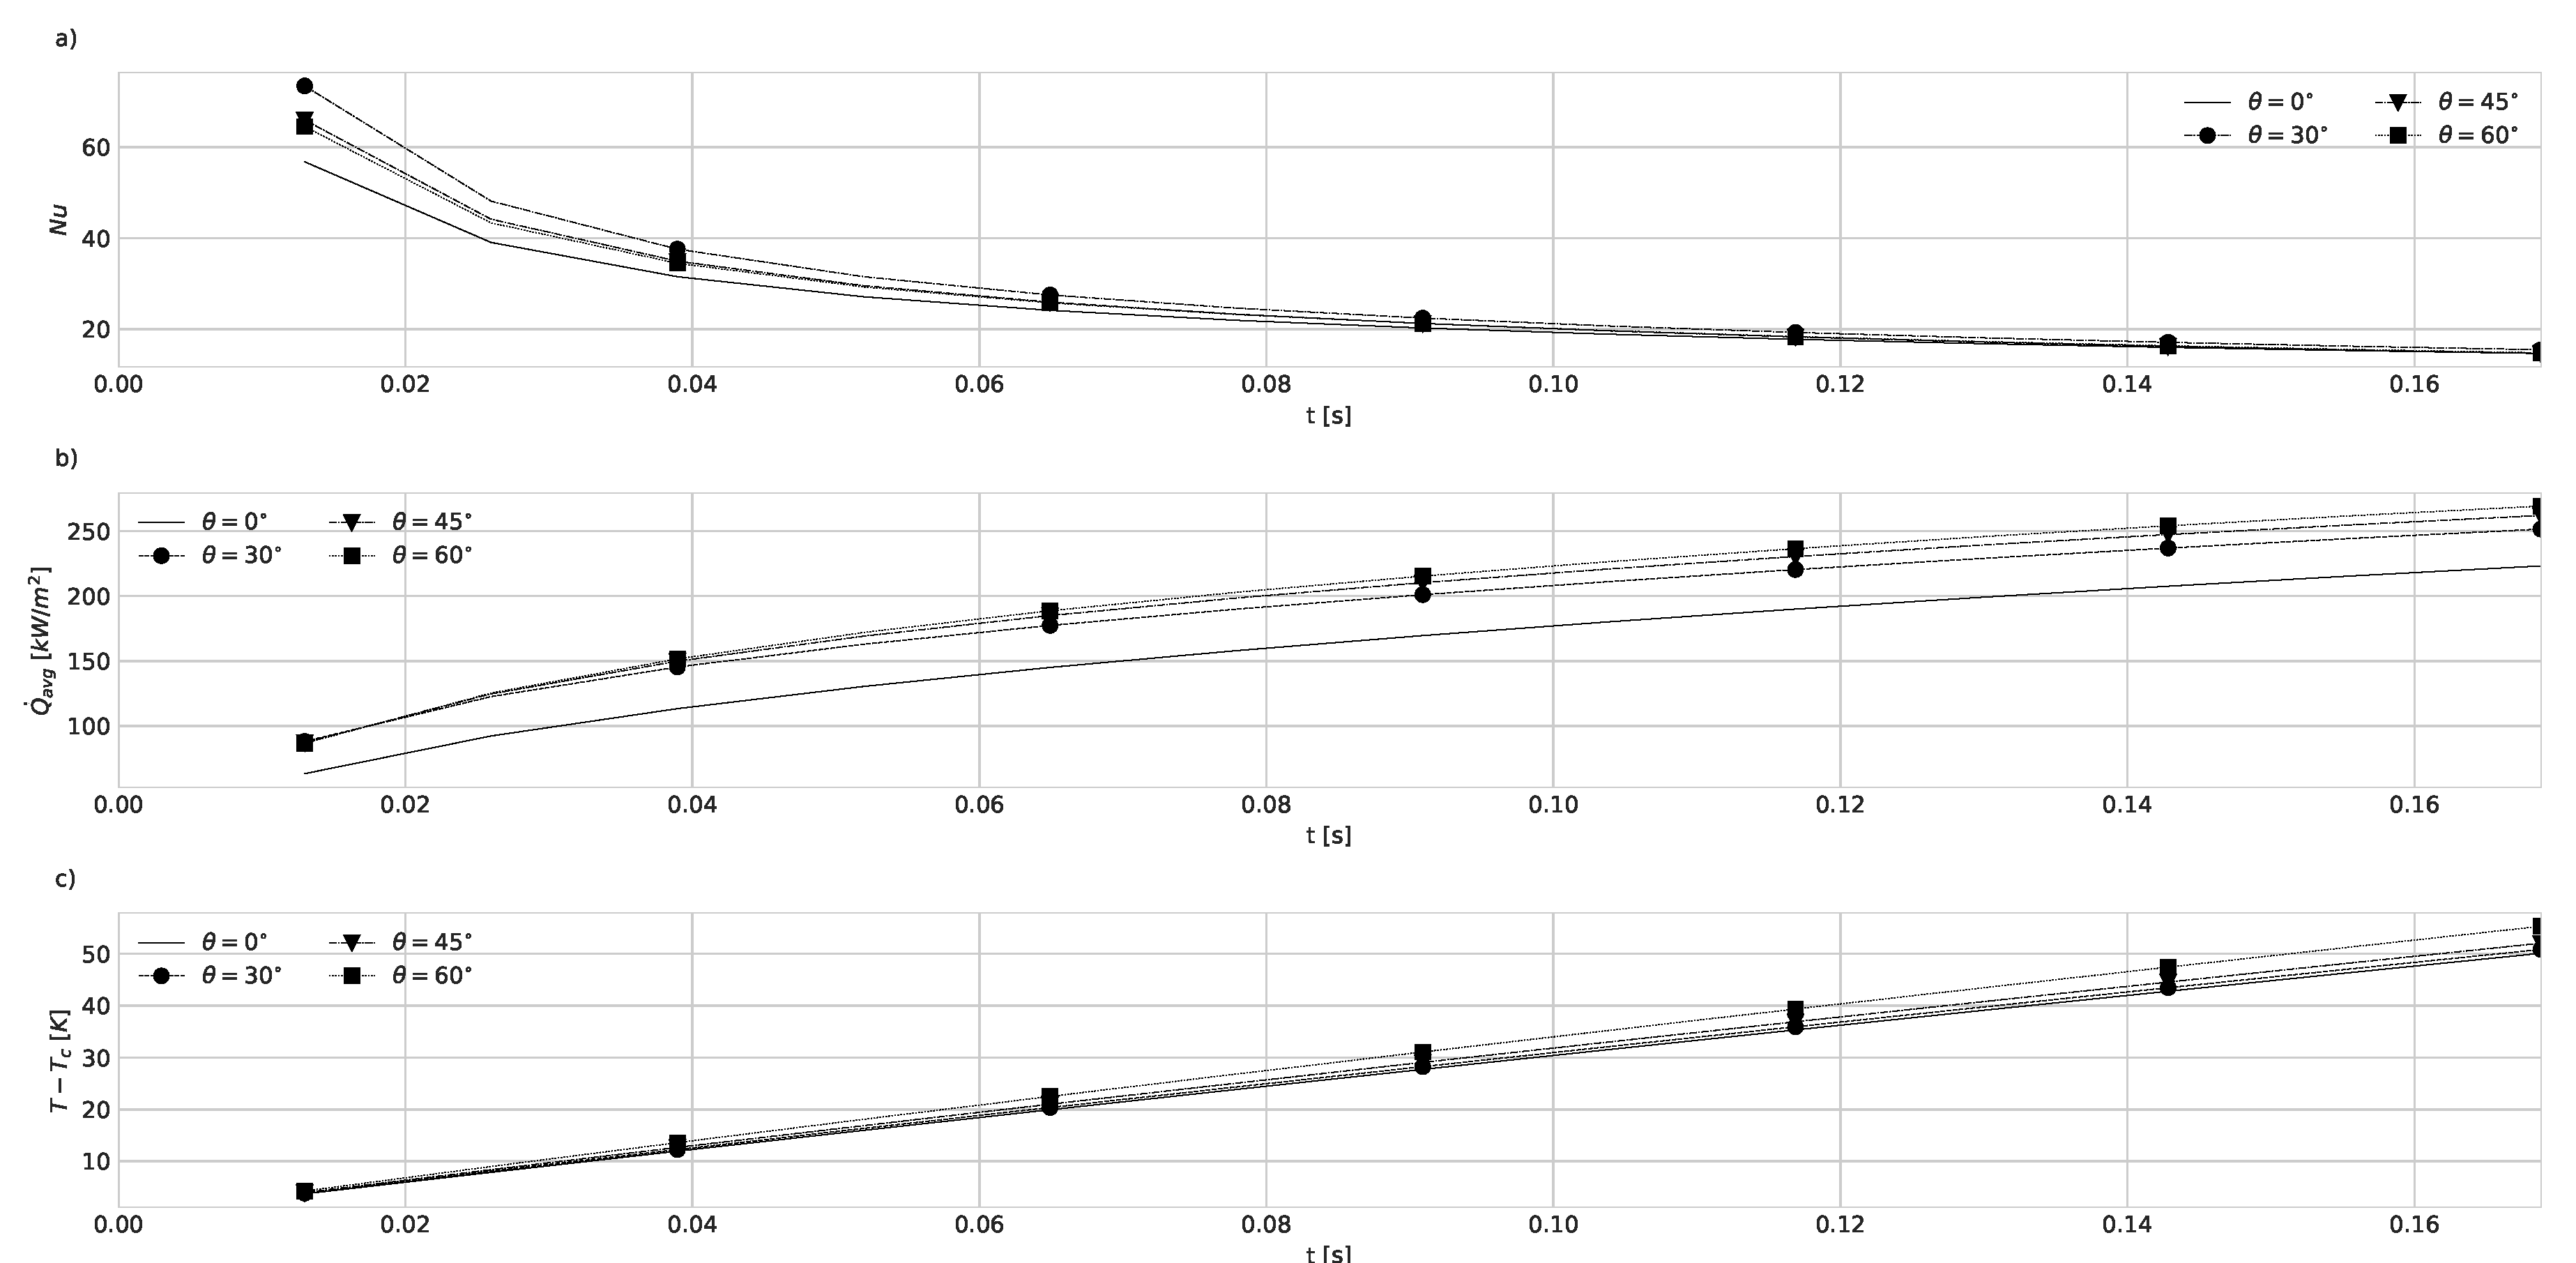
In this section the results for the simulations where a heat flux, Q ˙ w a l l , was imposed at the base, will be presented for each geometry configuration and for a flat surface. Two different heat fluxes were tested: Q ˙ w a l l = 1 × 10 5 W m 2 and Q ˙ w a l l = 1 × 10 6 W m 2 , resulting in Rayleigh numbers of R a = 3.8 × 10 4 and R a = 3.8 × 10 5 , respectively. Unlike previous works [5,6,7,8,9], we specifically address the transient regime, which can be most relevant for heat exchangers operating under real cooling conditions. For example an electronic device can be refrigerated by a tested surfaces in a submerged application.
For a more comprehensive understanding of the simulation results, it is interesting to analyze the temporal evolution of the variables of interest. Therefore, Figure 6 and Figure 7 present spatially averaged values for the Nusselt number ( N u L e q ¯ ), for the heat flux transferred across the base interface ( Q ˙ ¯ b a s e ), and for the temperature difference ( T a v g , b a s e T c ). It is important to note that all averaged values presented were estimated considering the actual cavity length. As time evolves, both the heat flux and the temperature differences increase. However, in contrast, the predicted Nusselt number experiences a significant decline from the values observed at the outset. This effect can be associated with the tendency of heat transfer to approach a steady-state condition, reaching heat transfer rate values close to the imposed heat flux, while the temperature difference demonstrates an almost linear growth.
From Figure 6 and Figure 7, it is evident that the structured cavities have a positive impact on the heat transfer process, leading to an increase in the Nusselt number compared to the plane surface. Among the studied geometries, geometry 3 (with θ = 60 ) exhibits a more significant influence on the process. This enhanced heat transfer efficiency is further illustrated by the base temperature differences, as shown in Figure 6 c) and Figure 7 c). Initially, the temperature differences for the geometries are lower than those observed for the plane surface, suggesting a more efficient heat transfer from the structured surfaces (resulting in higher heat fluxes). However, as the estimated heat transfer rate for the plane interface surpasses that of the structured geometries, these geometries begin to exhibit higher temperature differences than the plane surface.
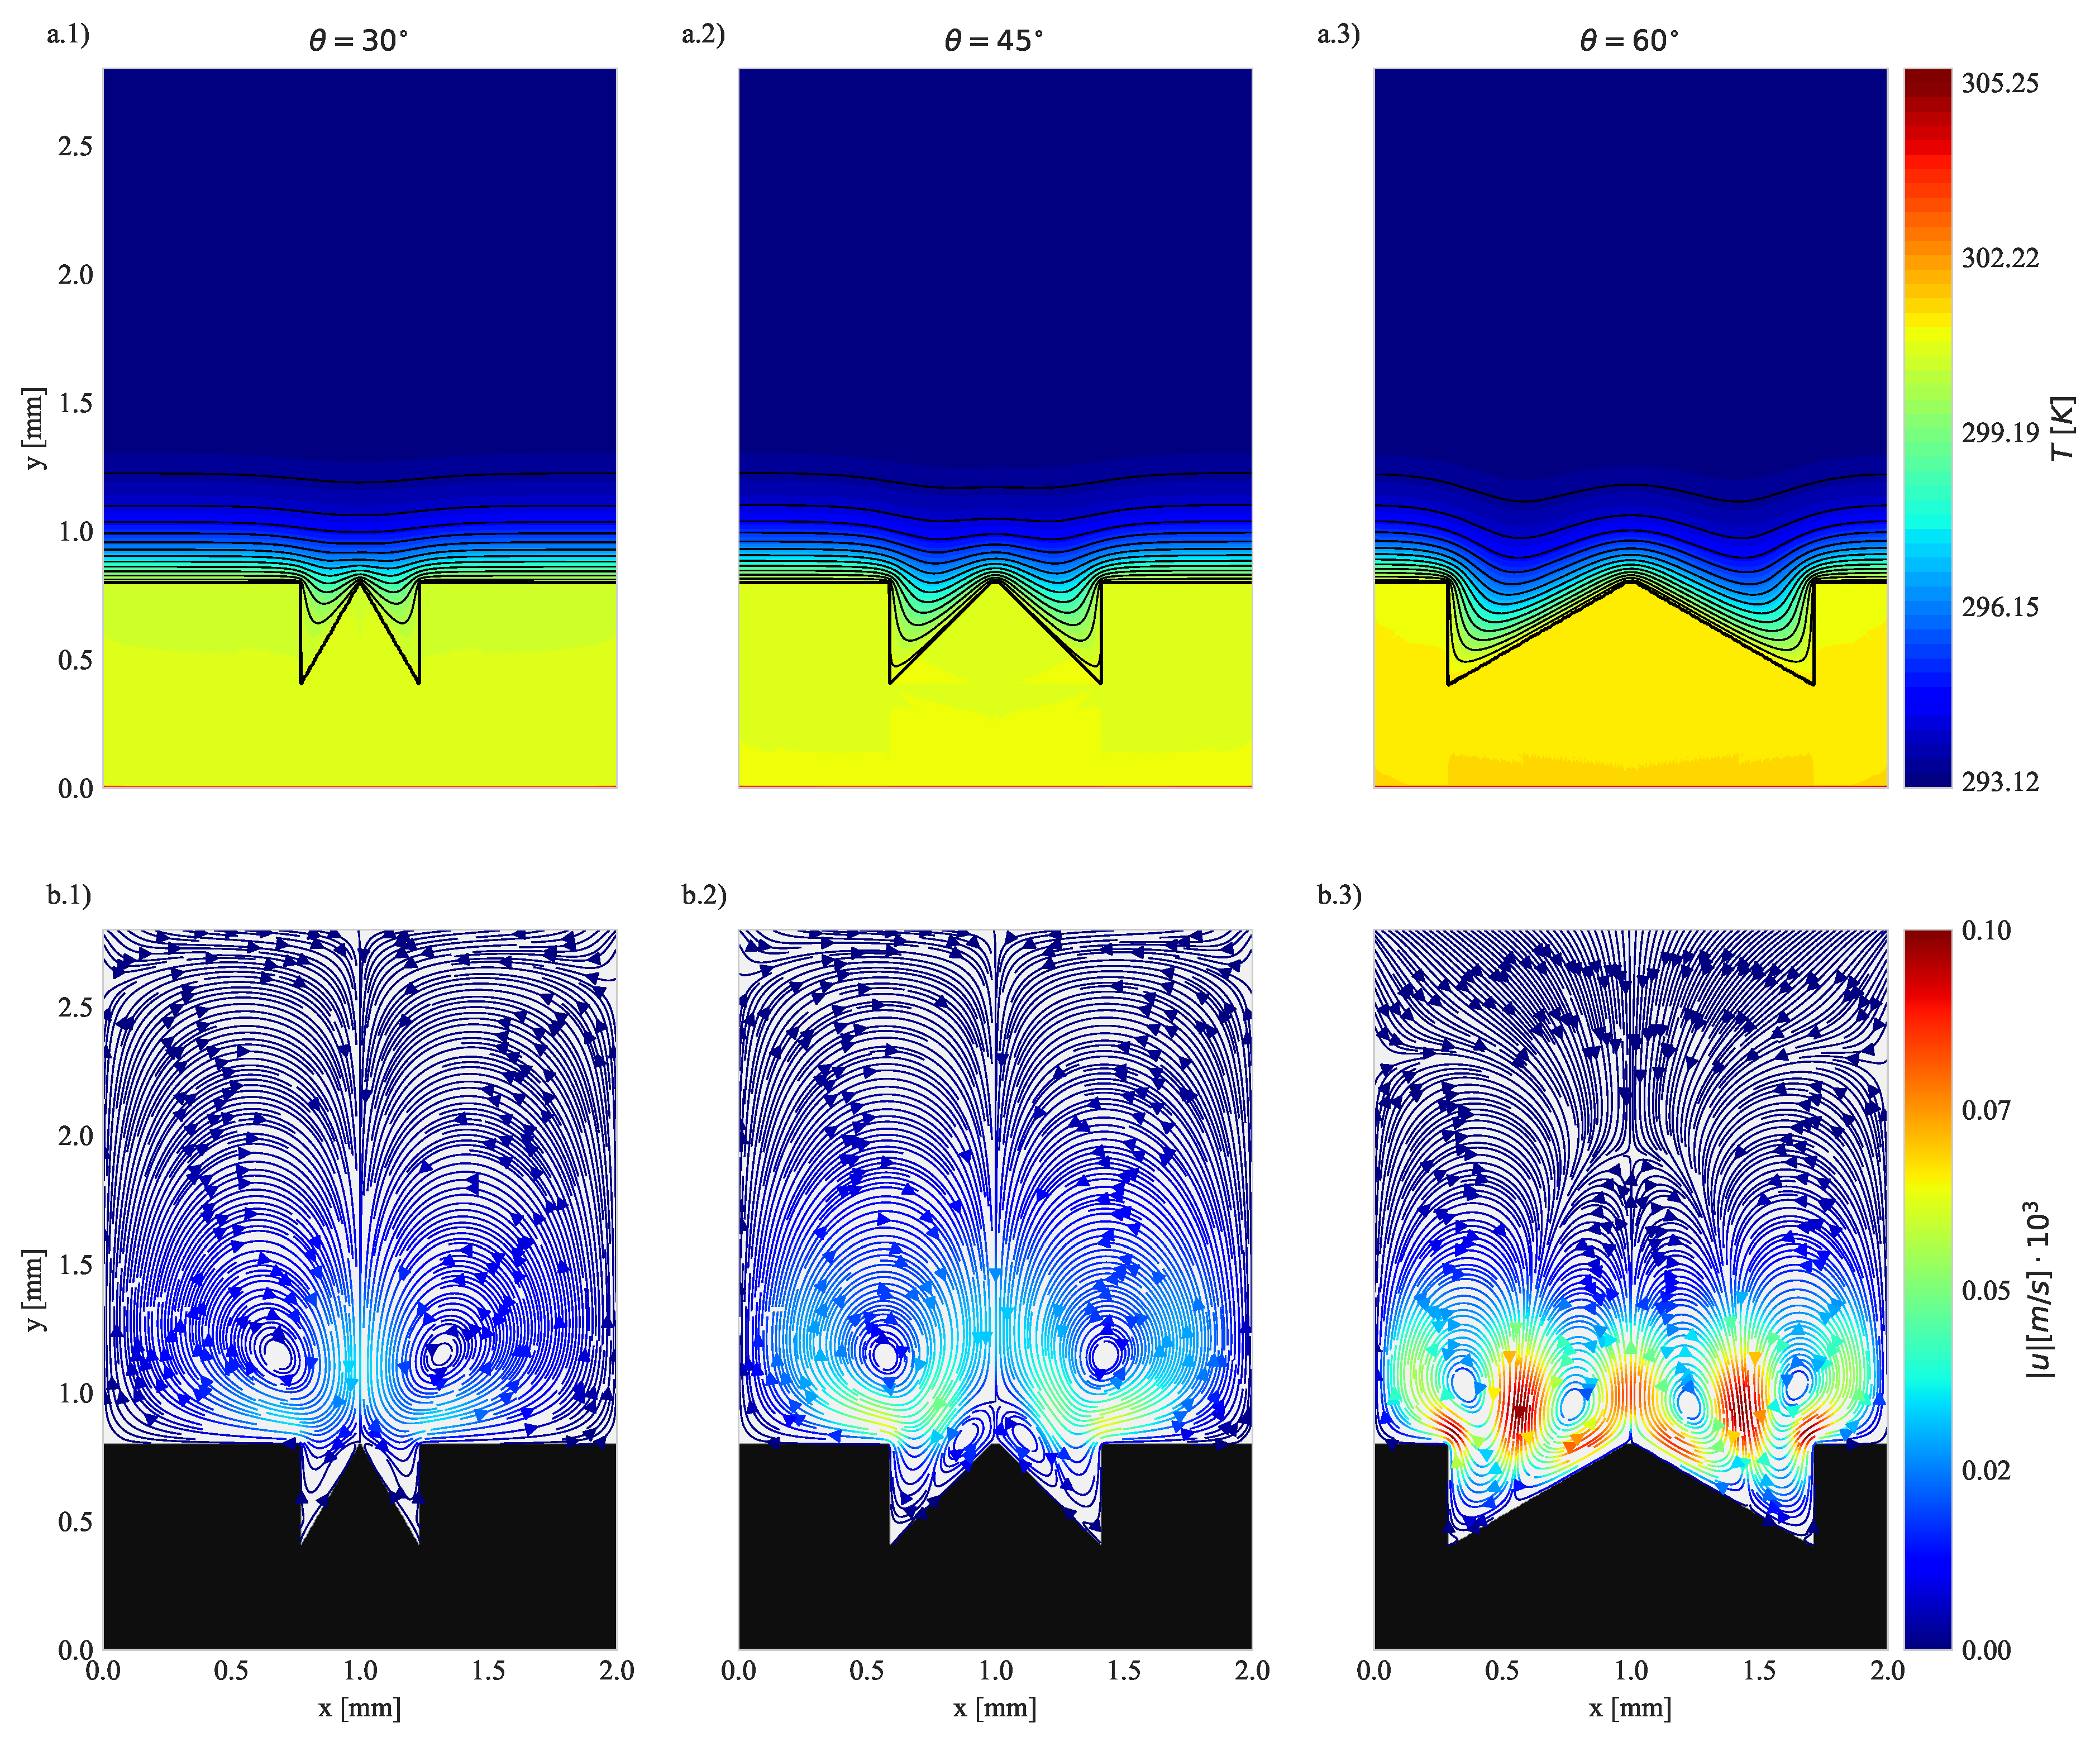
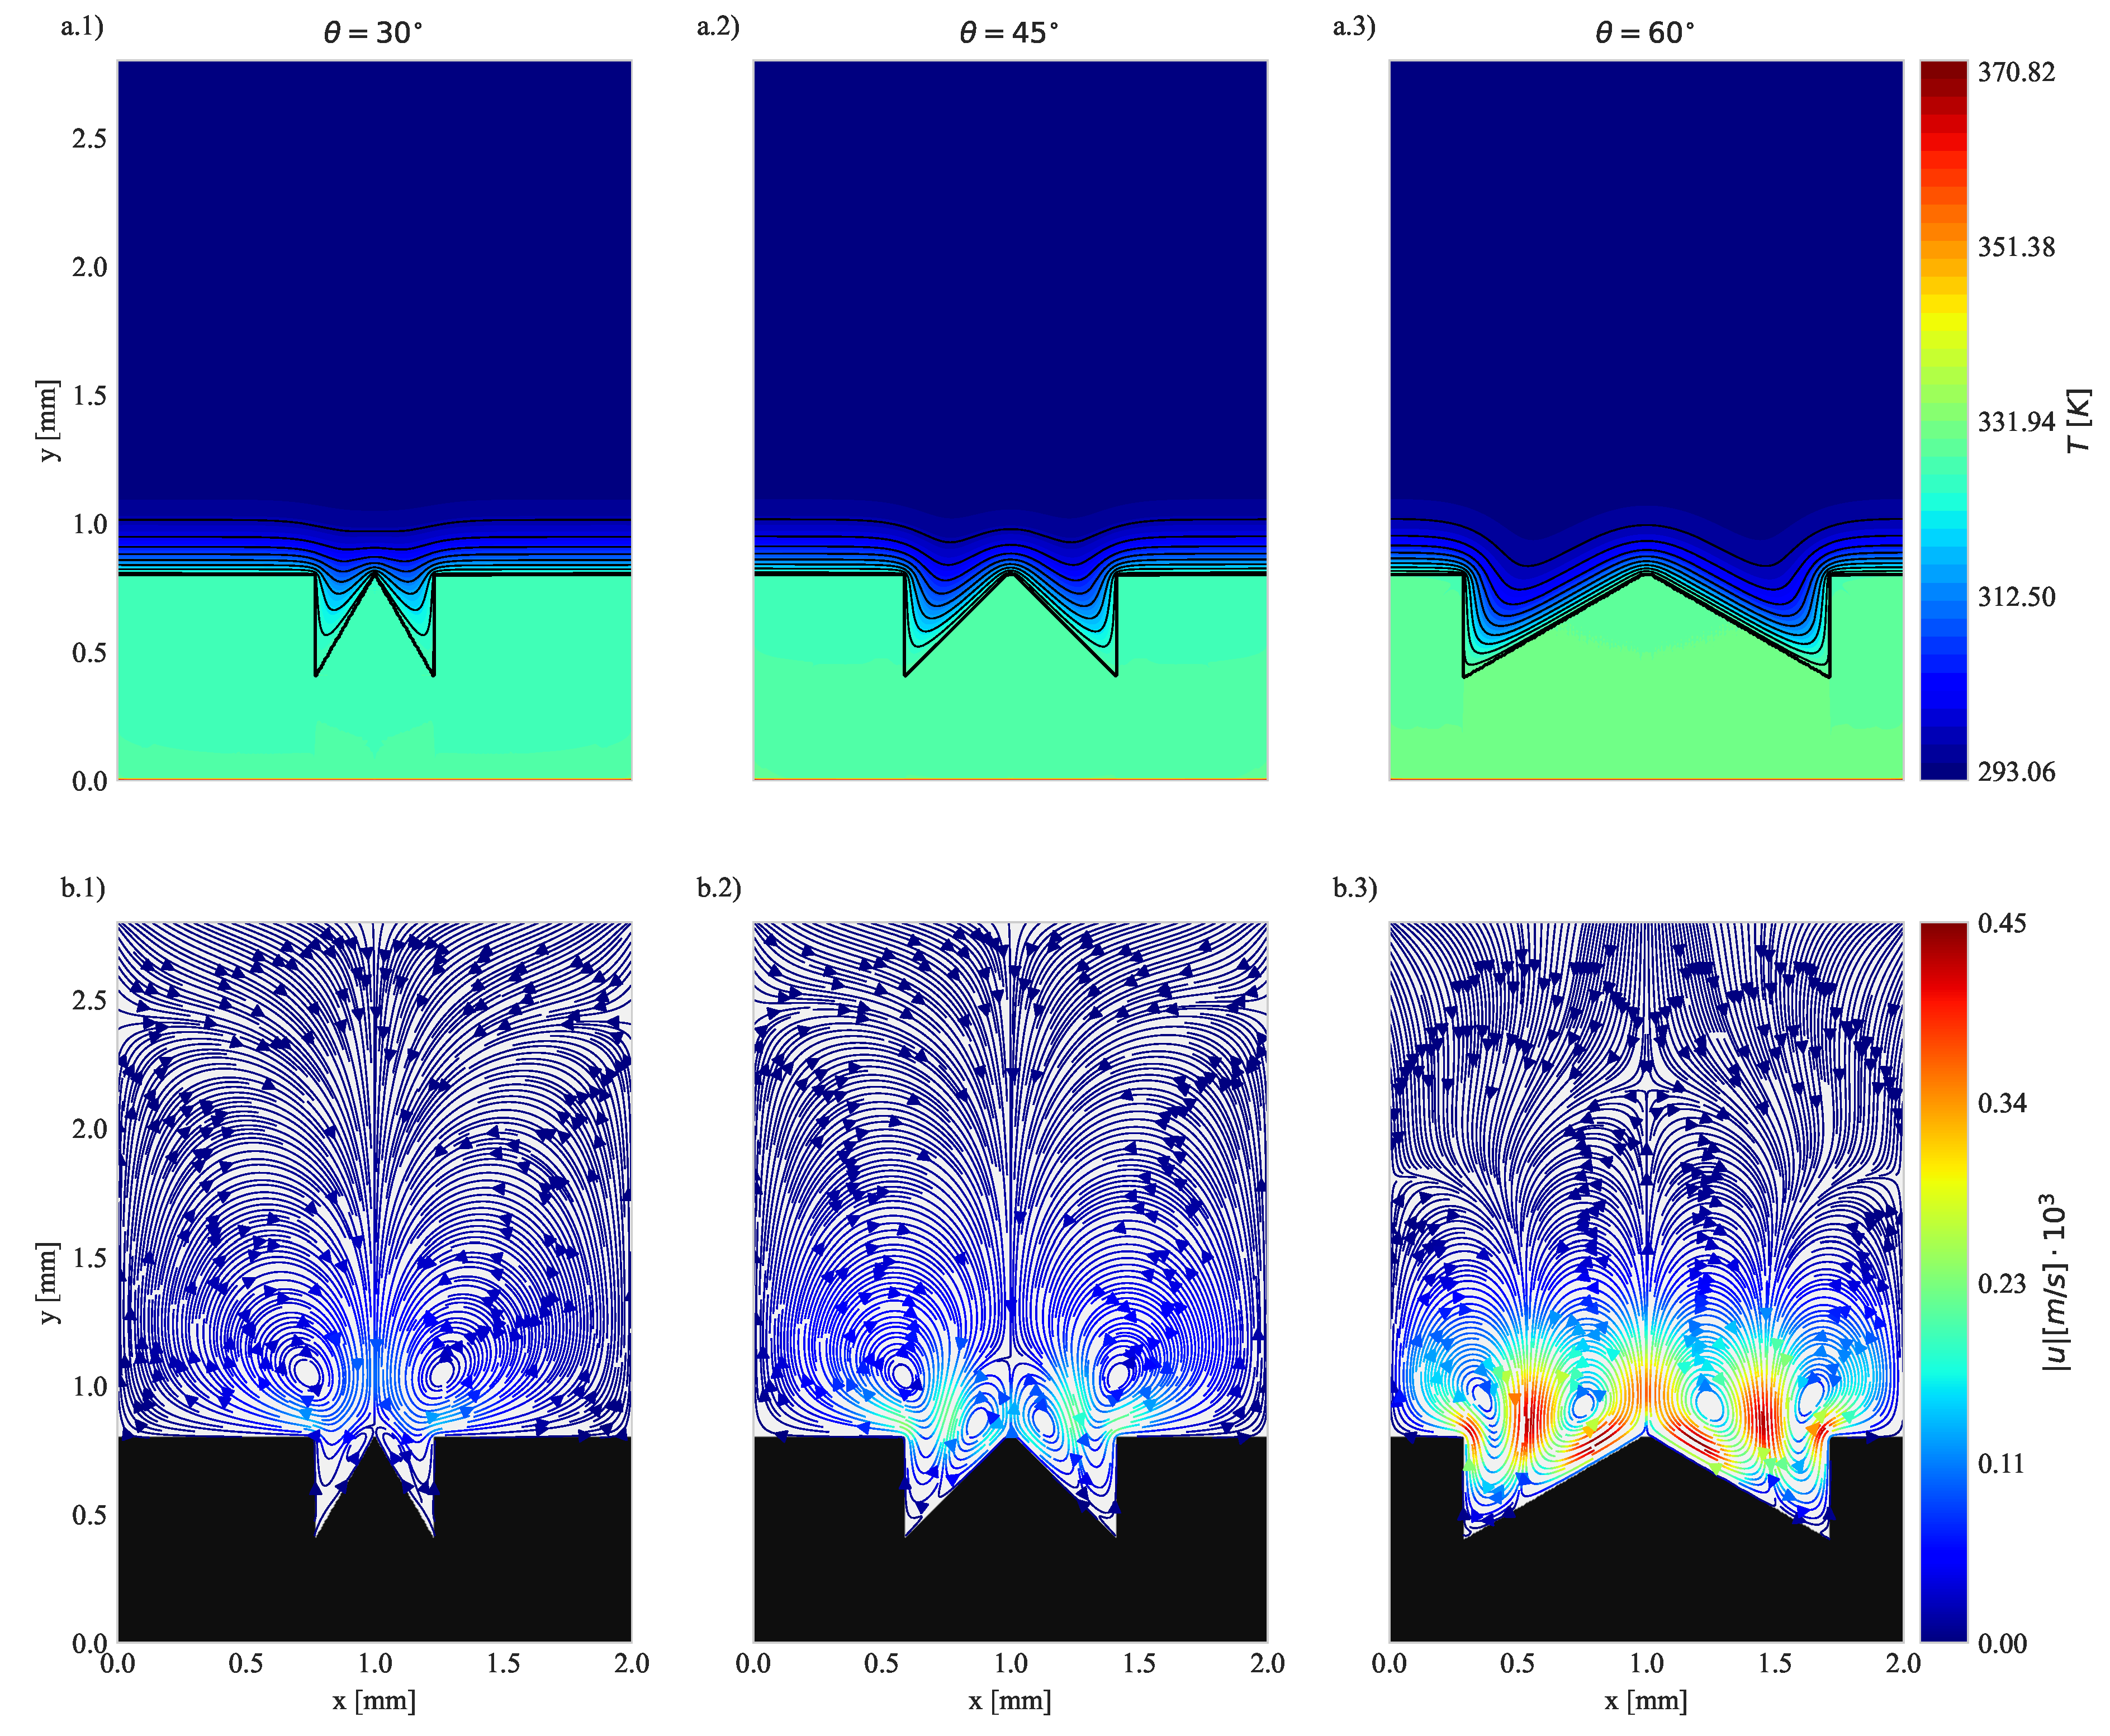
The enhancement in the heat transfer process observed in Figure 6 and Figure 7 can be further investigated by analyzing both the temperature profiles and fluid motion. To perform such analysis, we plotted both the two-dimensional temperature profiles and the streamlines for each geometry at a given instant. Figure 8 and Figure 9 show the plotted results for Q w a l l = 1 × 10 5 at t = 0.25 s and Q w a l l = 1 × 10 6 at t = 0.05 s , respectively. Both instants are associated with periods of time in which the structured geometry is shown to augment the heat transfer process.
Starting with the temperature distributions, we observed a concentration of isothermal lines at the interface between the fluid and the solid wall, indicating higher heat transfer in those regions, particularly at the upper parts of the structured cavities (middle of the cavity). Additionally, from left to right, the isotherms appear more closely packed, indicating enhanced heat transfer. These observations serve as confirmation of the performance shown in Figure 6 and Figure 7.
Now, considering the resultant fluid flow as shown in Figure 8 b) and Figure 9 b), we observe that the fluid flows in and out of the cavities created by the geometries, thus avoiding stagnation. Upon closer observation, we note that the fluid still exhibits relatively low speed in relation to the surfaces, especially for the sharper geometry ( θ = 30 ). The higher velocities and the circulating fluid can be associated with the observed results in two aspects. Firstly, this observed circulation avoids the creation of stagnation zones, where the fluid would almost be stationary, effectively reducing thermal resistance zones. Secondly, the moving fluid advects energy from the surface, thus increasing the heat transferred between the solid and the fluid.
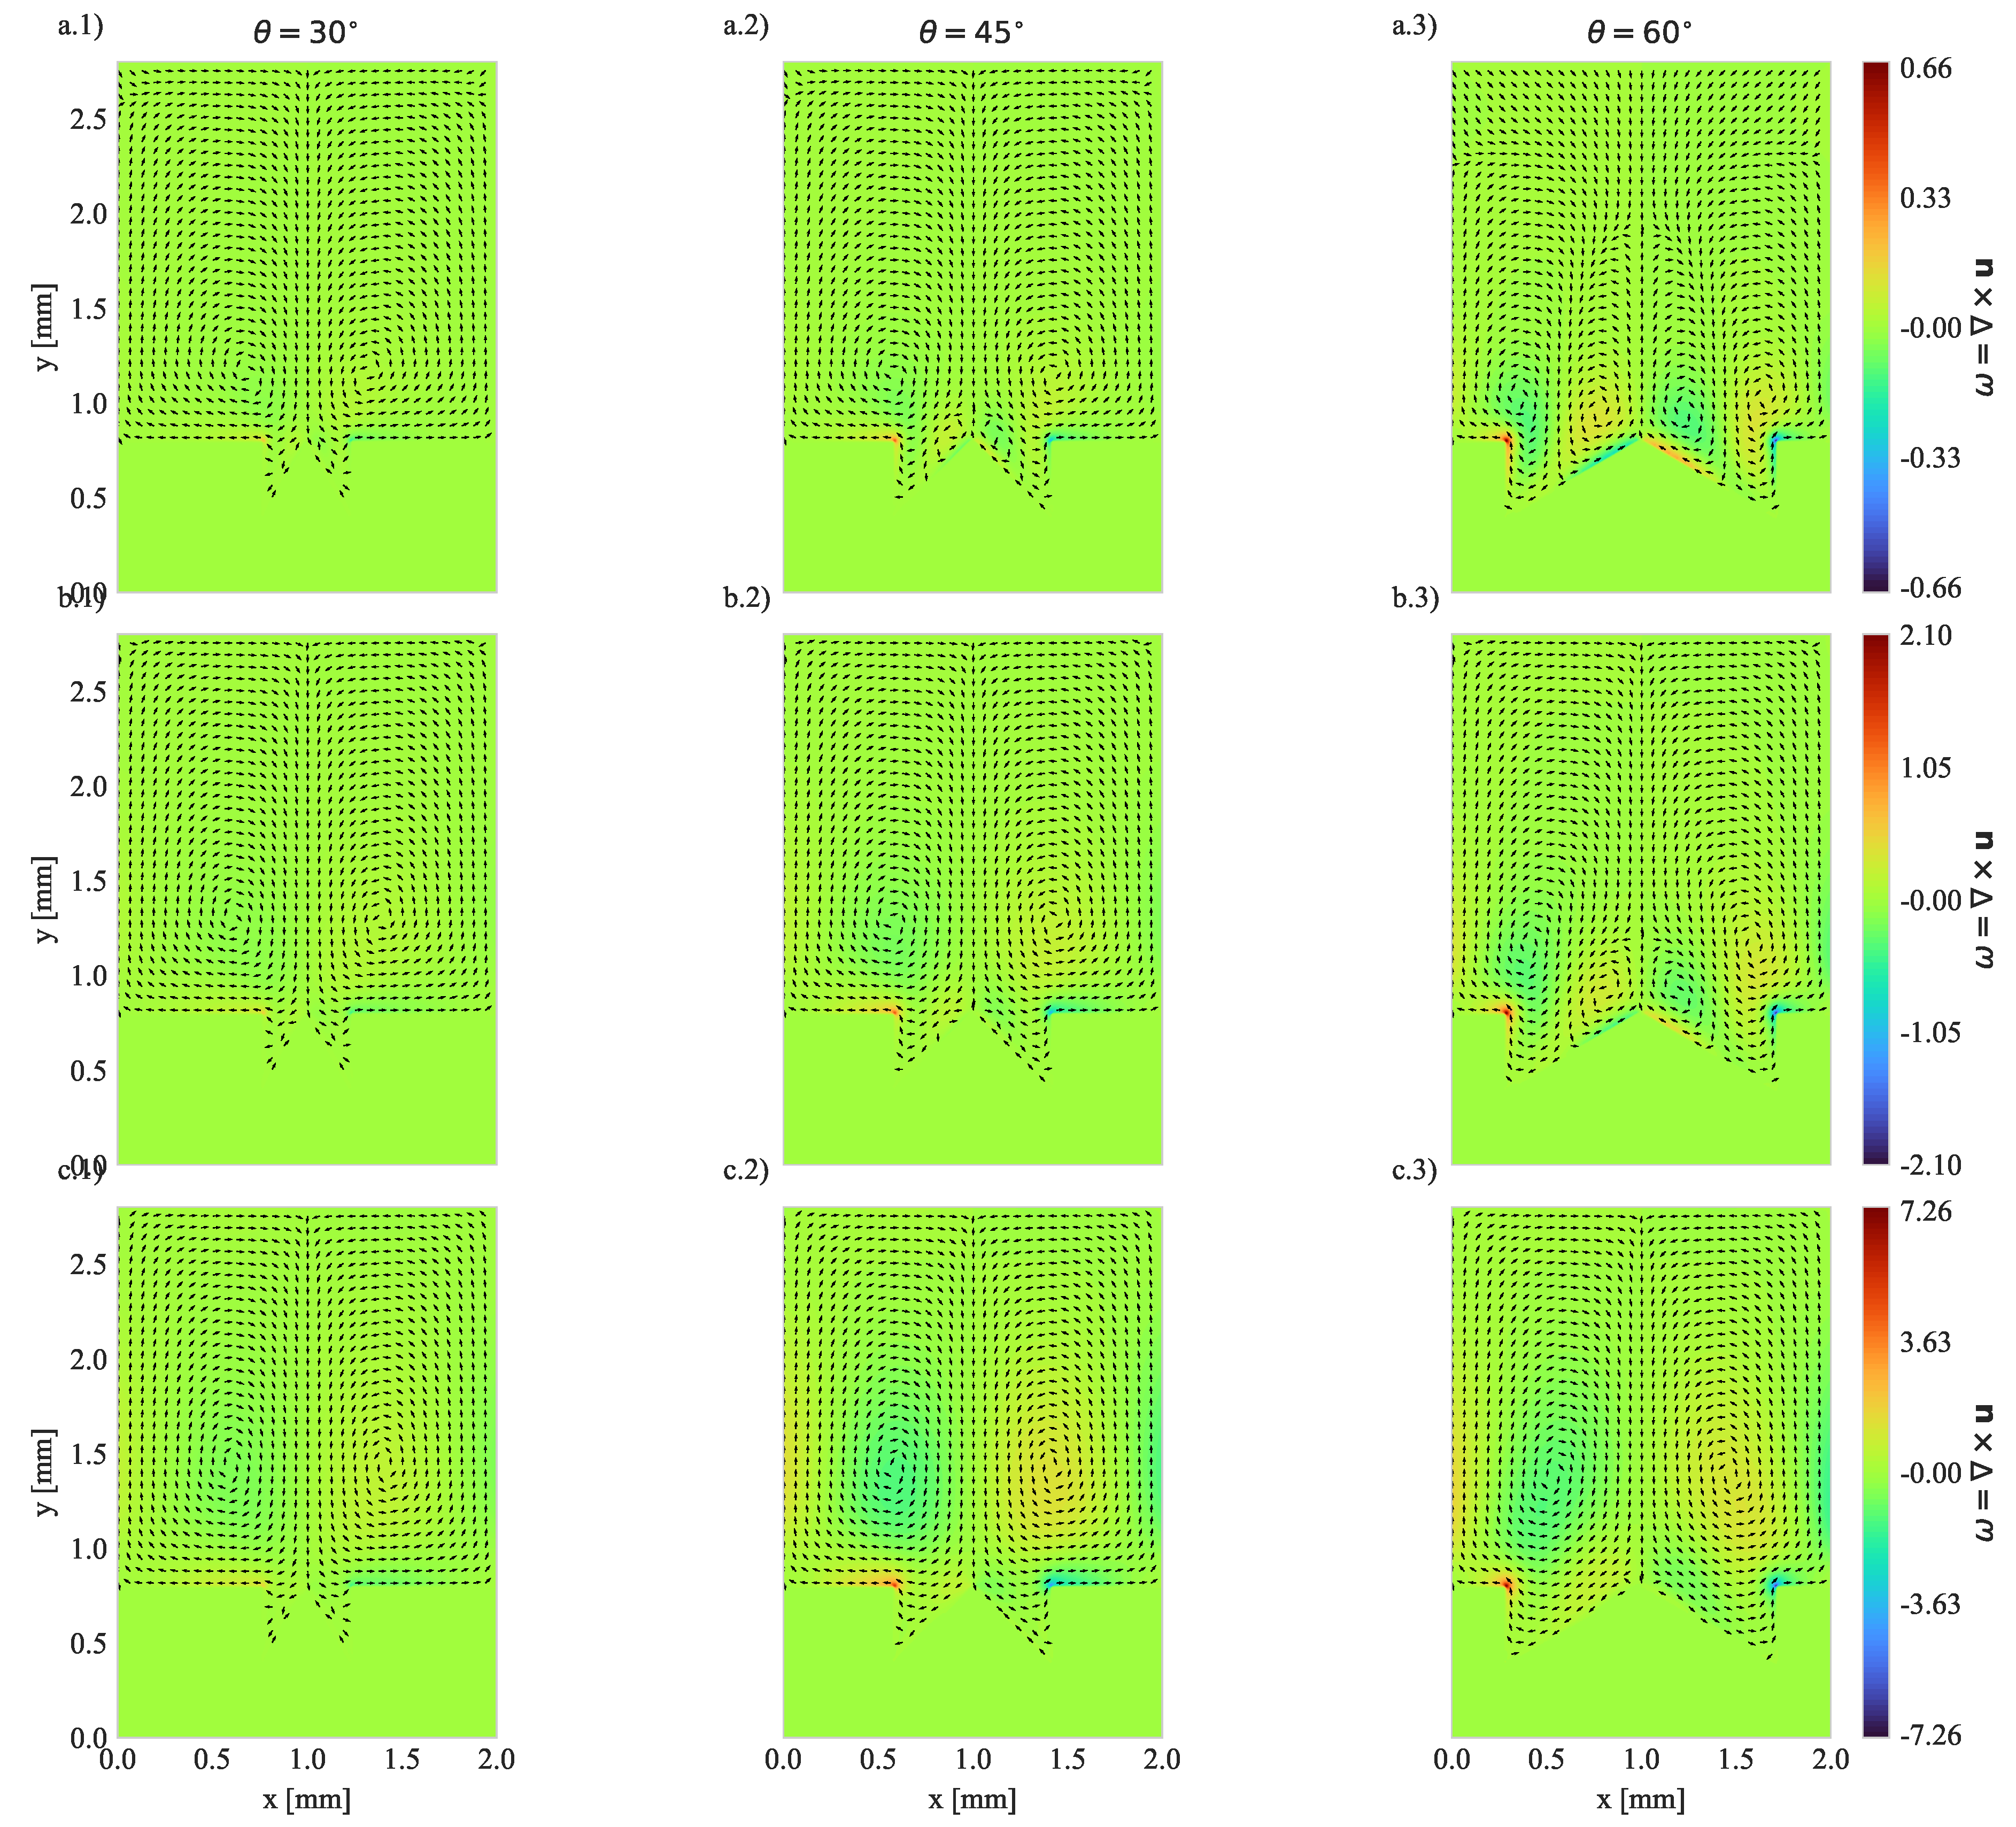
In addition to the streamlines and temperature plots, we also estimated the vorticity at different times for the Q w a l l = 1 × 10 5 condition. The selected times shown in Figure 10 correspond to regions where the geometries exhibit better performance ( t = 0.25 s ), a region where the geometries and the surfaces have similar performance ( t = 1.00 s ), and finally, regions where the plane surface surpasses the cavities ( t = 2.50 s ). By comparing the results in Figure 10a) with Figure 8 and Figure 6, it is evident that the higher performance of the cavities is associated with the observed vorticity, where higher levels of vorticity indicates better performance. Still considering Figure 10a), it can be seen that the smoother geometries (greater θ ) favor the formation of vortices near the surfaces, thereby aiding energy advection.
Considering the different times plotted in Figure 10, it is observable that all configurations favor the formation of counter-rotating symmetrical vortices. Overall, the vorticity is shown to increase, indicating a higher circulation of the fluid within the domain, and consequently in overall fluid rotation speed. Given the present configurations, the smoother geometries are shown to maintain the inner vortices for longer times. By comparing the results from Figure 10 with those of Figure 6, we can see that the presence of these vortices is fundamental for the better performance of the cavities. These vortices ensure that the "extra" length provided by the surface modifications remains in contact with moving fluid, thus avoiding creation of stagnation zones, and favoring the heat transfer process.
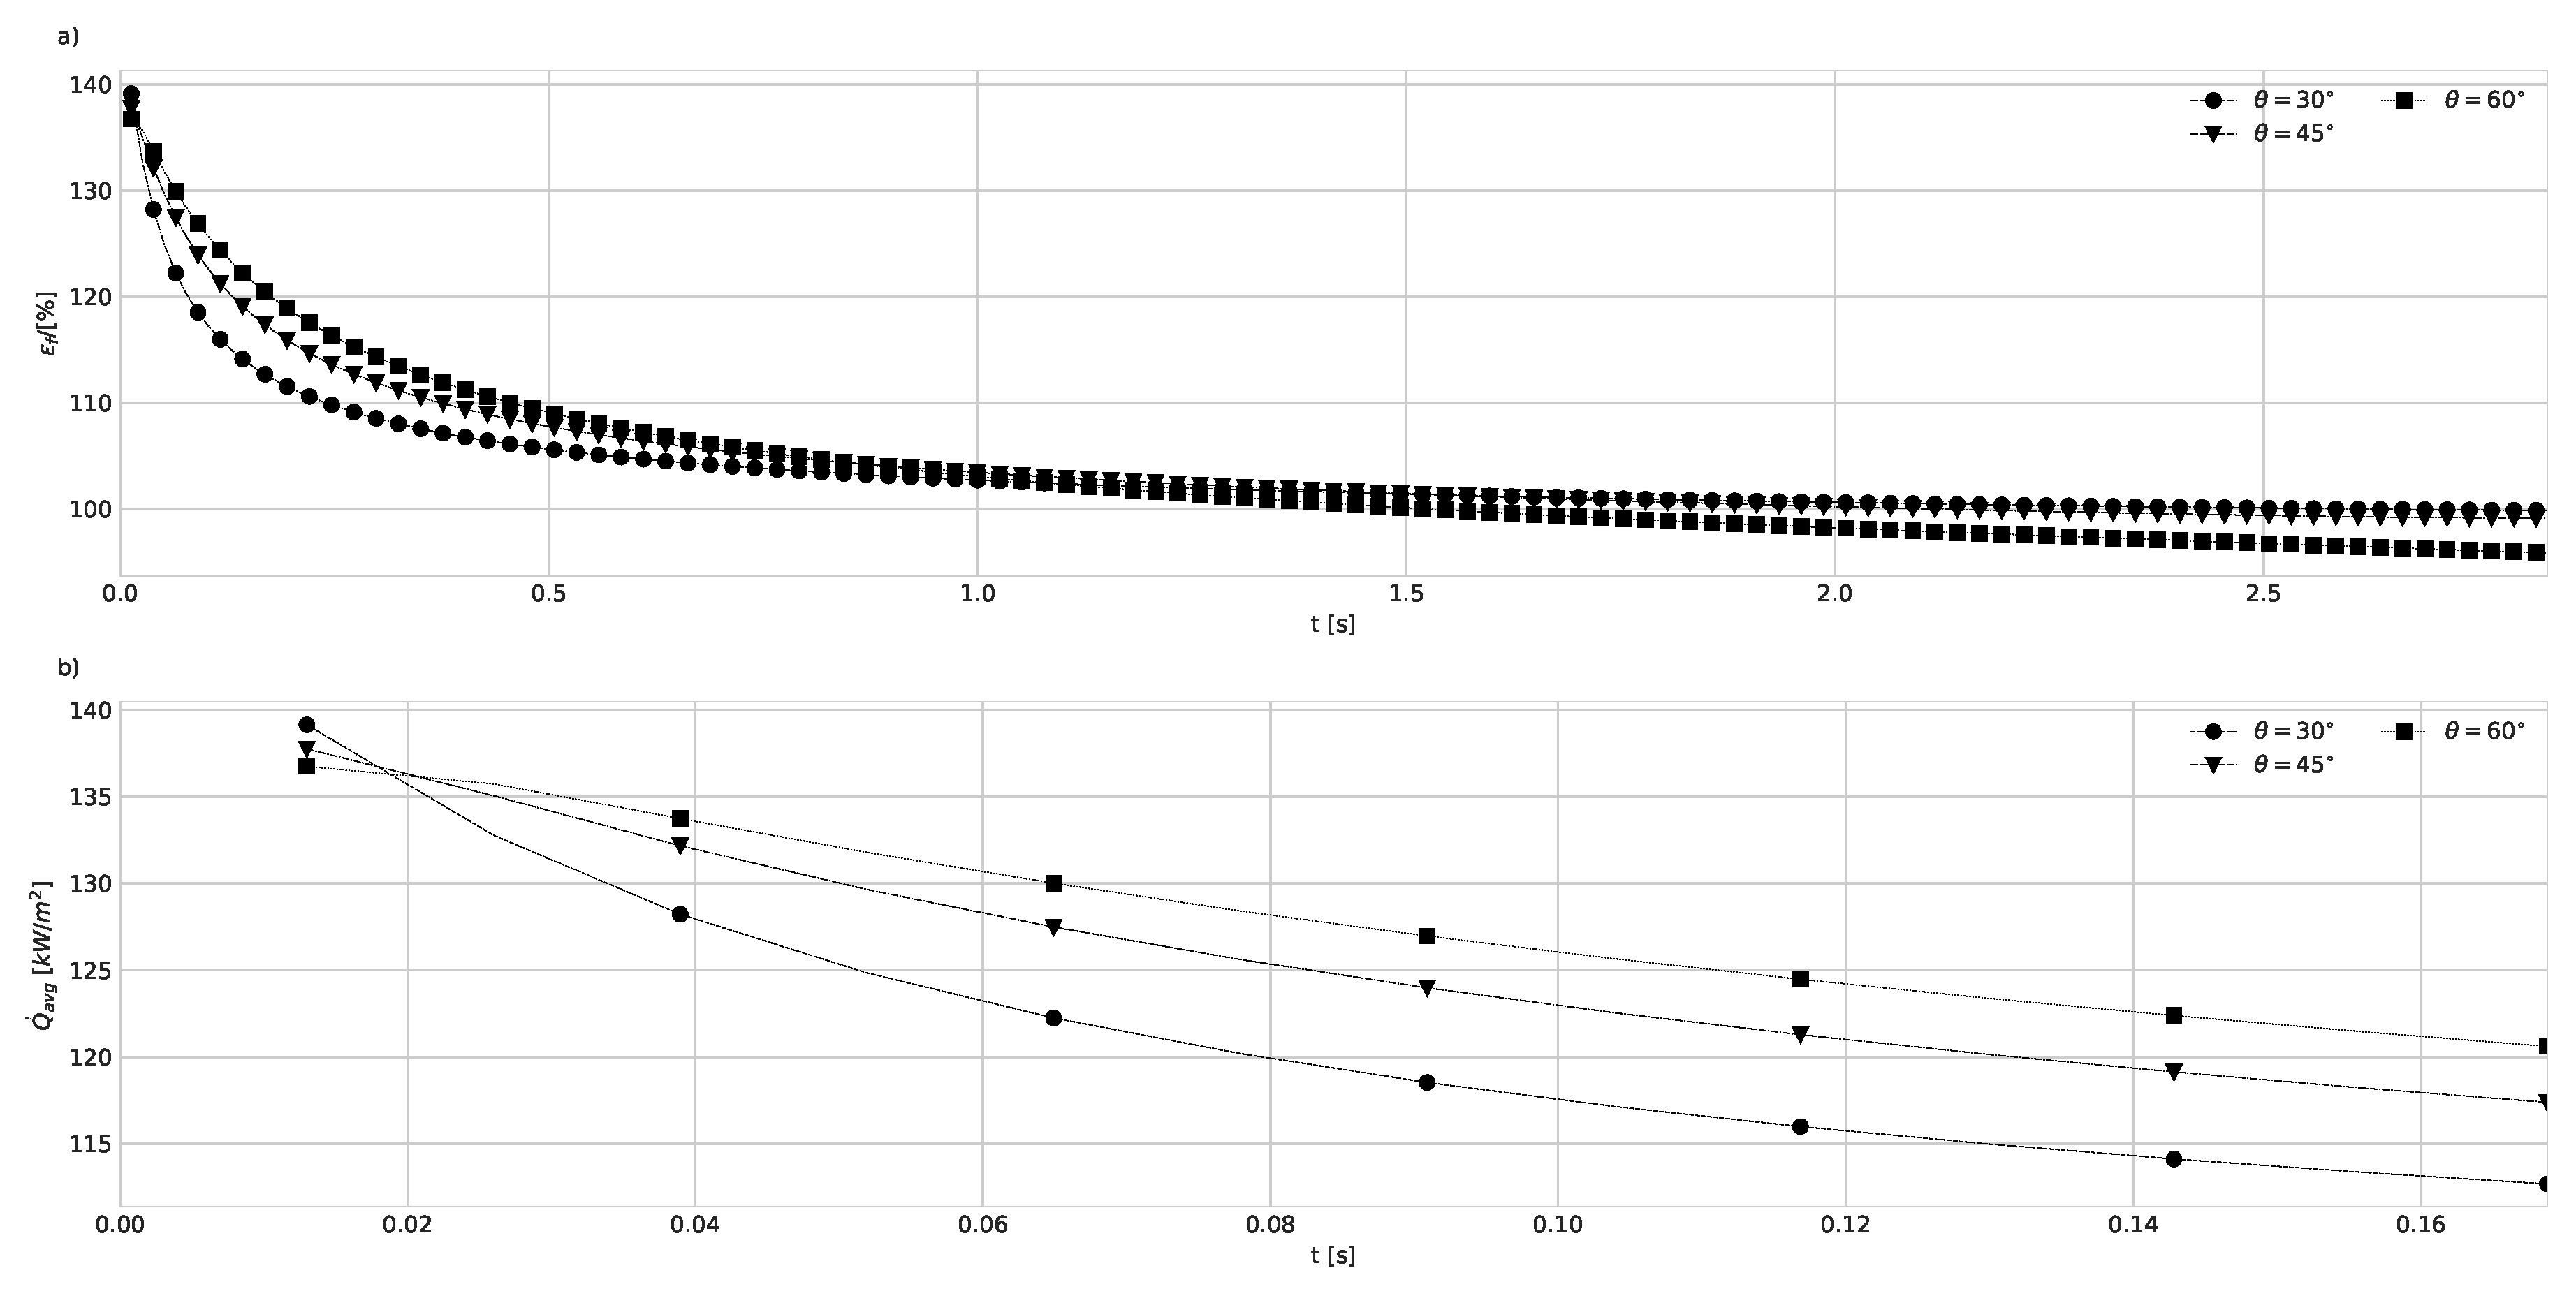
Alternatively, the impact of structured cavities can be assessed through their effectiveness or enhancement factor, ε f , defined as the ratio between the heat transferred through the structured geometry and the plane geometry, respectively [47,48]. Figure 11 shows the evolution of the effectiveness of the geometries over time, confirming the previous results. Geometry 3 with θ = 60 presents the best performance, especially in the initial moments. One interesting observation concerns the evolution of effectiveness. Since the maximum heat flux is limited, it is expected that as time advances, the effectiveness reaches a value of about 100 % , due to energy conservation. In a steady-state condition, the heat flux at the solid-fluid interface should be the same as the one imposed at the base. Thus, the steady-state effectiveness may not be the best parameter to evaluate the structured cavities.
Nonetheless, transient analysis of ε f can provide interesting results. By analyzing the results displayed in Figure 11a), it is observable that the effectiveness of Geometry 3 takes longer to decay, followed by Geometry 2 and then by Geometry 1. This indicates that the heat fluxes at the solid-fluid interface of structured cavities grow faster than those for the plane interface.
Additionally, a time constant for each geometry can be estimated, providing a way to evaluate the transient performance of each geometry. Since, we are measuring the time needed for ε f to reach a value of 100 % , a higher time constant means that the heat flux for the cavities reaches the value of the stationary heat flux imposed at the base faster than the plane surface. As expected, Geometry 3 presented a higher estimated time constant, which again serves as an indication of its better performance.
Table 4. Time constant estimation.
Q w a l l [ W / m 2 ] 1 · 10 5 1 · 10 6
θ ° 30 45 60 30 45 60
t a u [ s ] 0.22 0.34 0.48 0.06 0.10 0.18
The higher effectiveness exhibited by the geometries in Figure 11, for both heat flux values, can also be observed in the evolution of the fluid temperatures, or alternatively, of the temperature differences shown in Figure 6c) and Figure 7c). Since the structured cavities demonstrate effectiveness over 100 % , it is expected that these geometries transfer heat more efficiently than the plane surface, resulting in higher temperature differences for the more "efficient" geometries. This observation further confirms the obtained results.

4.2. Natural Convection with Fixed Base Temperature

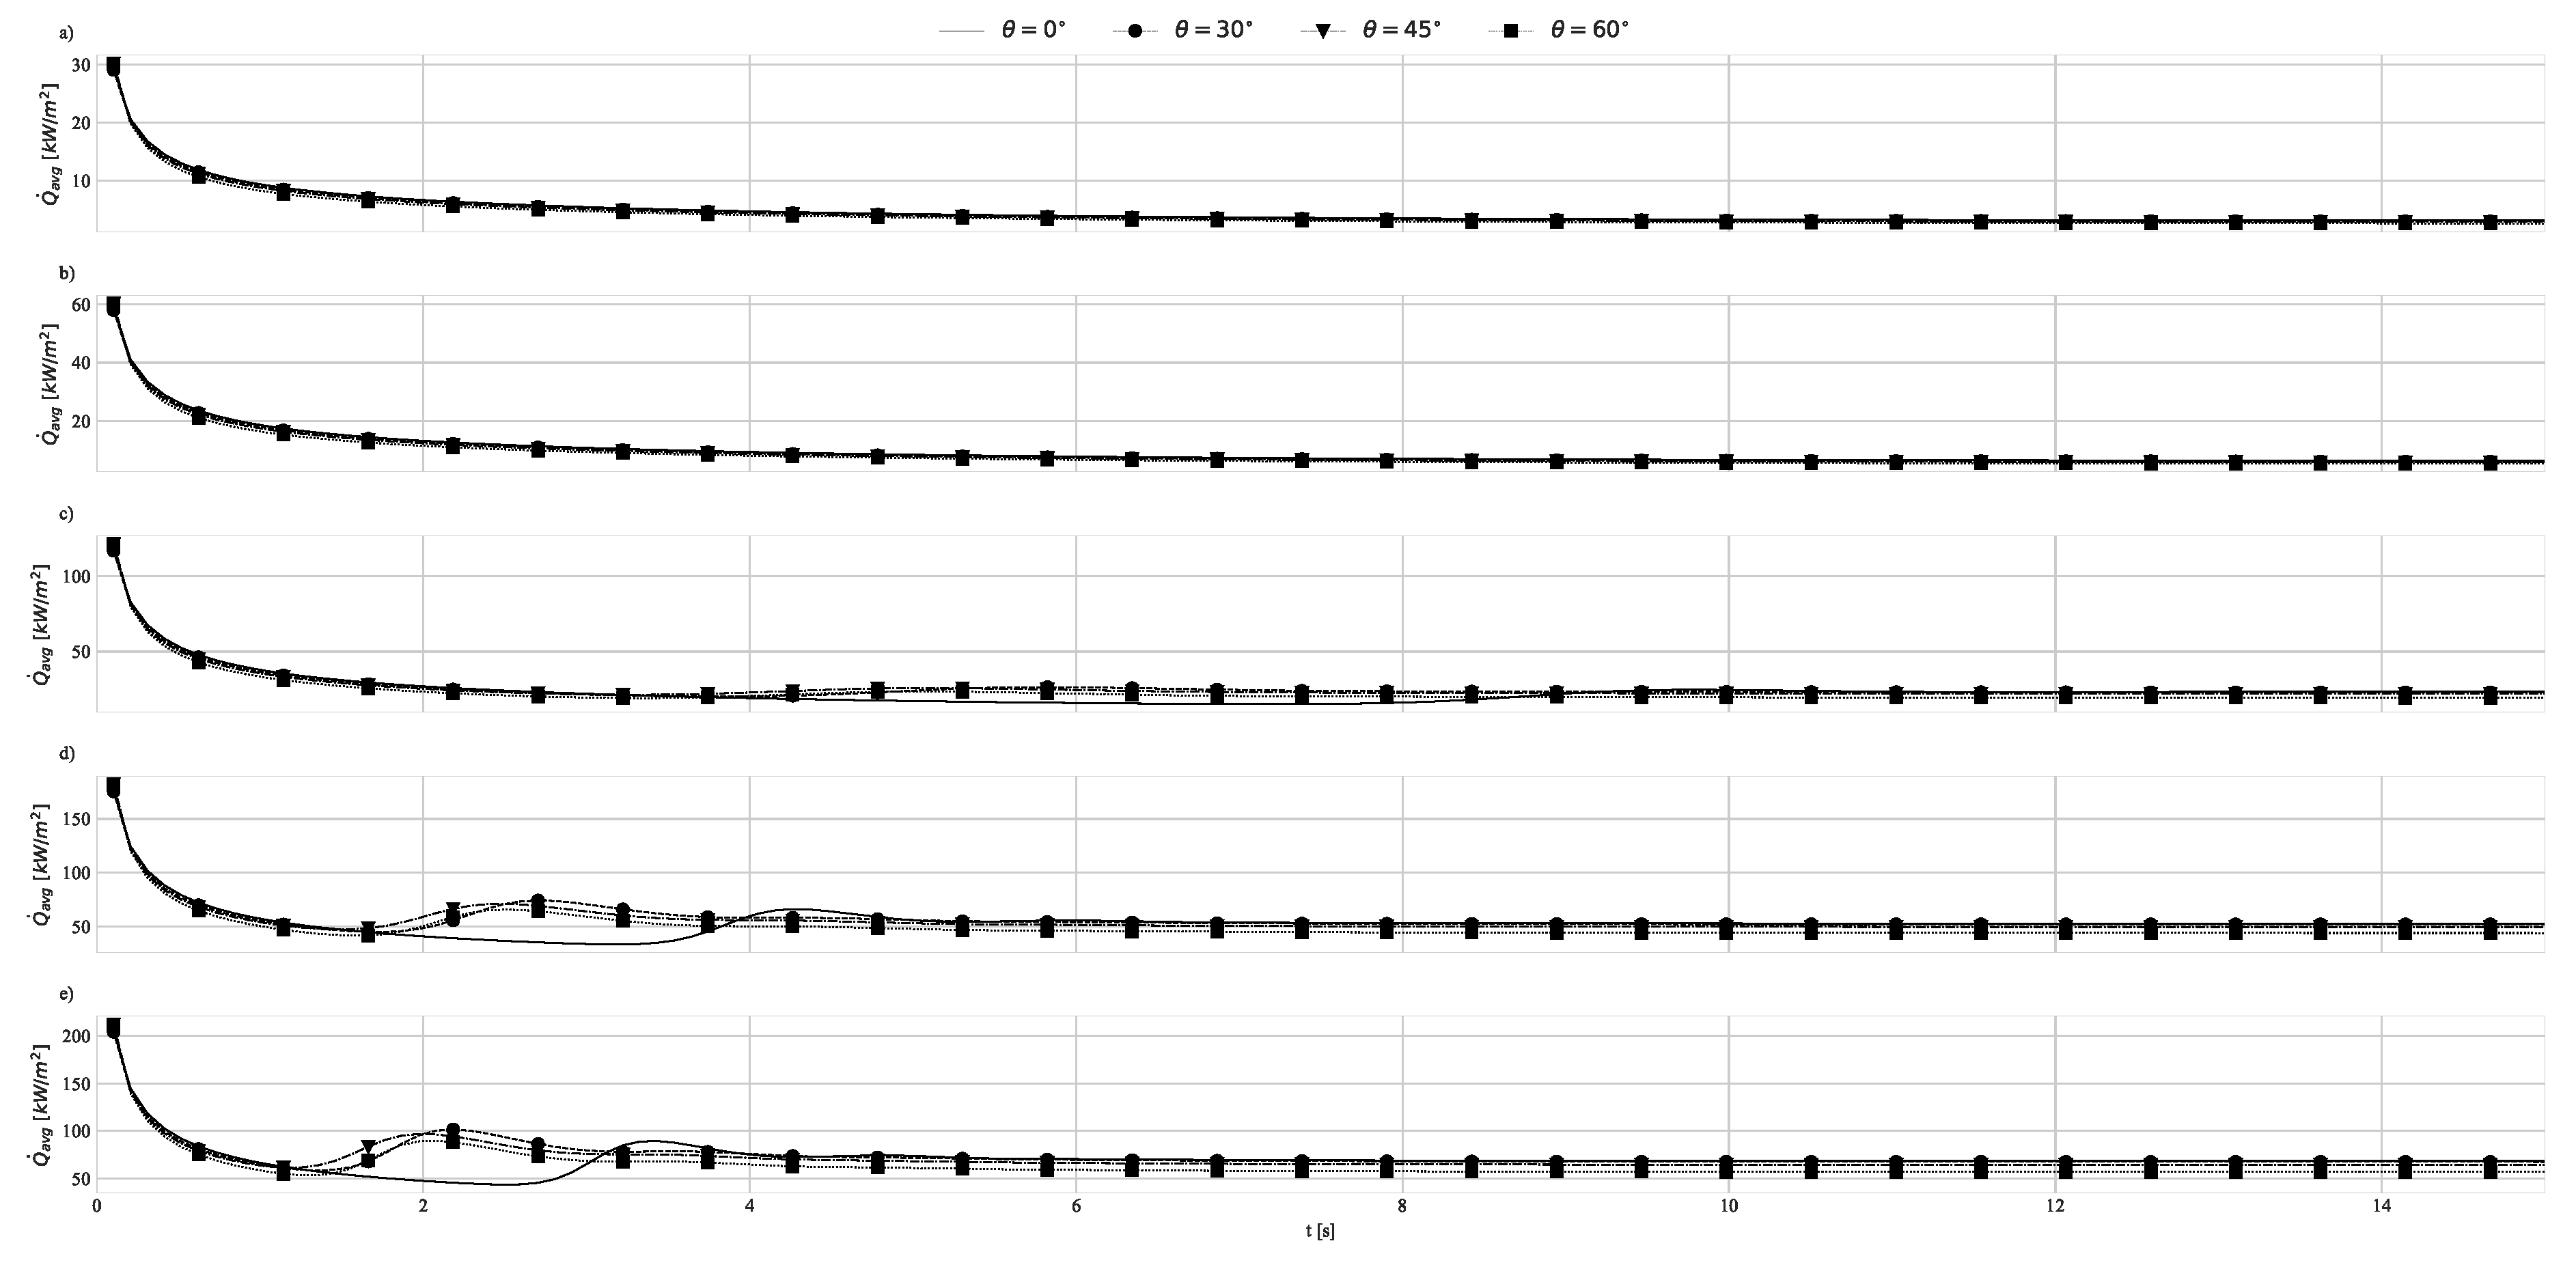
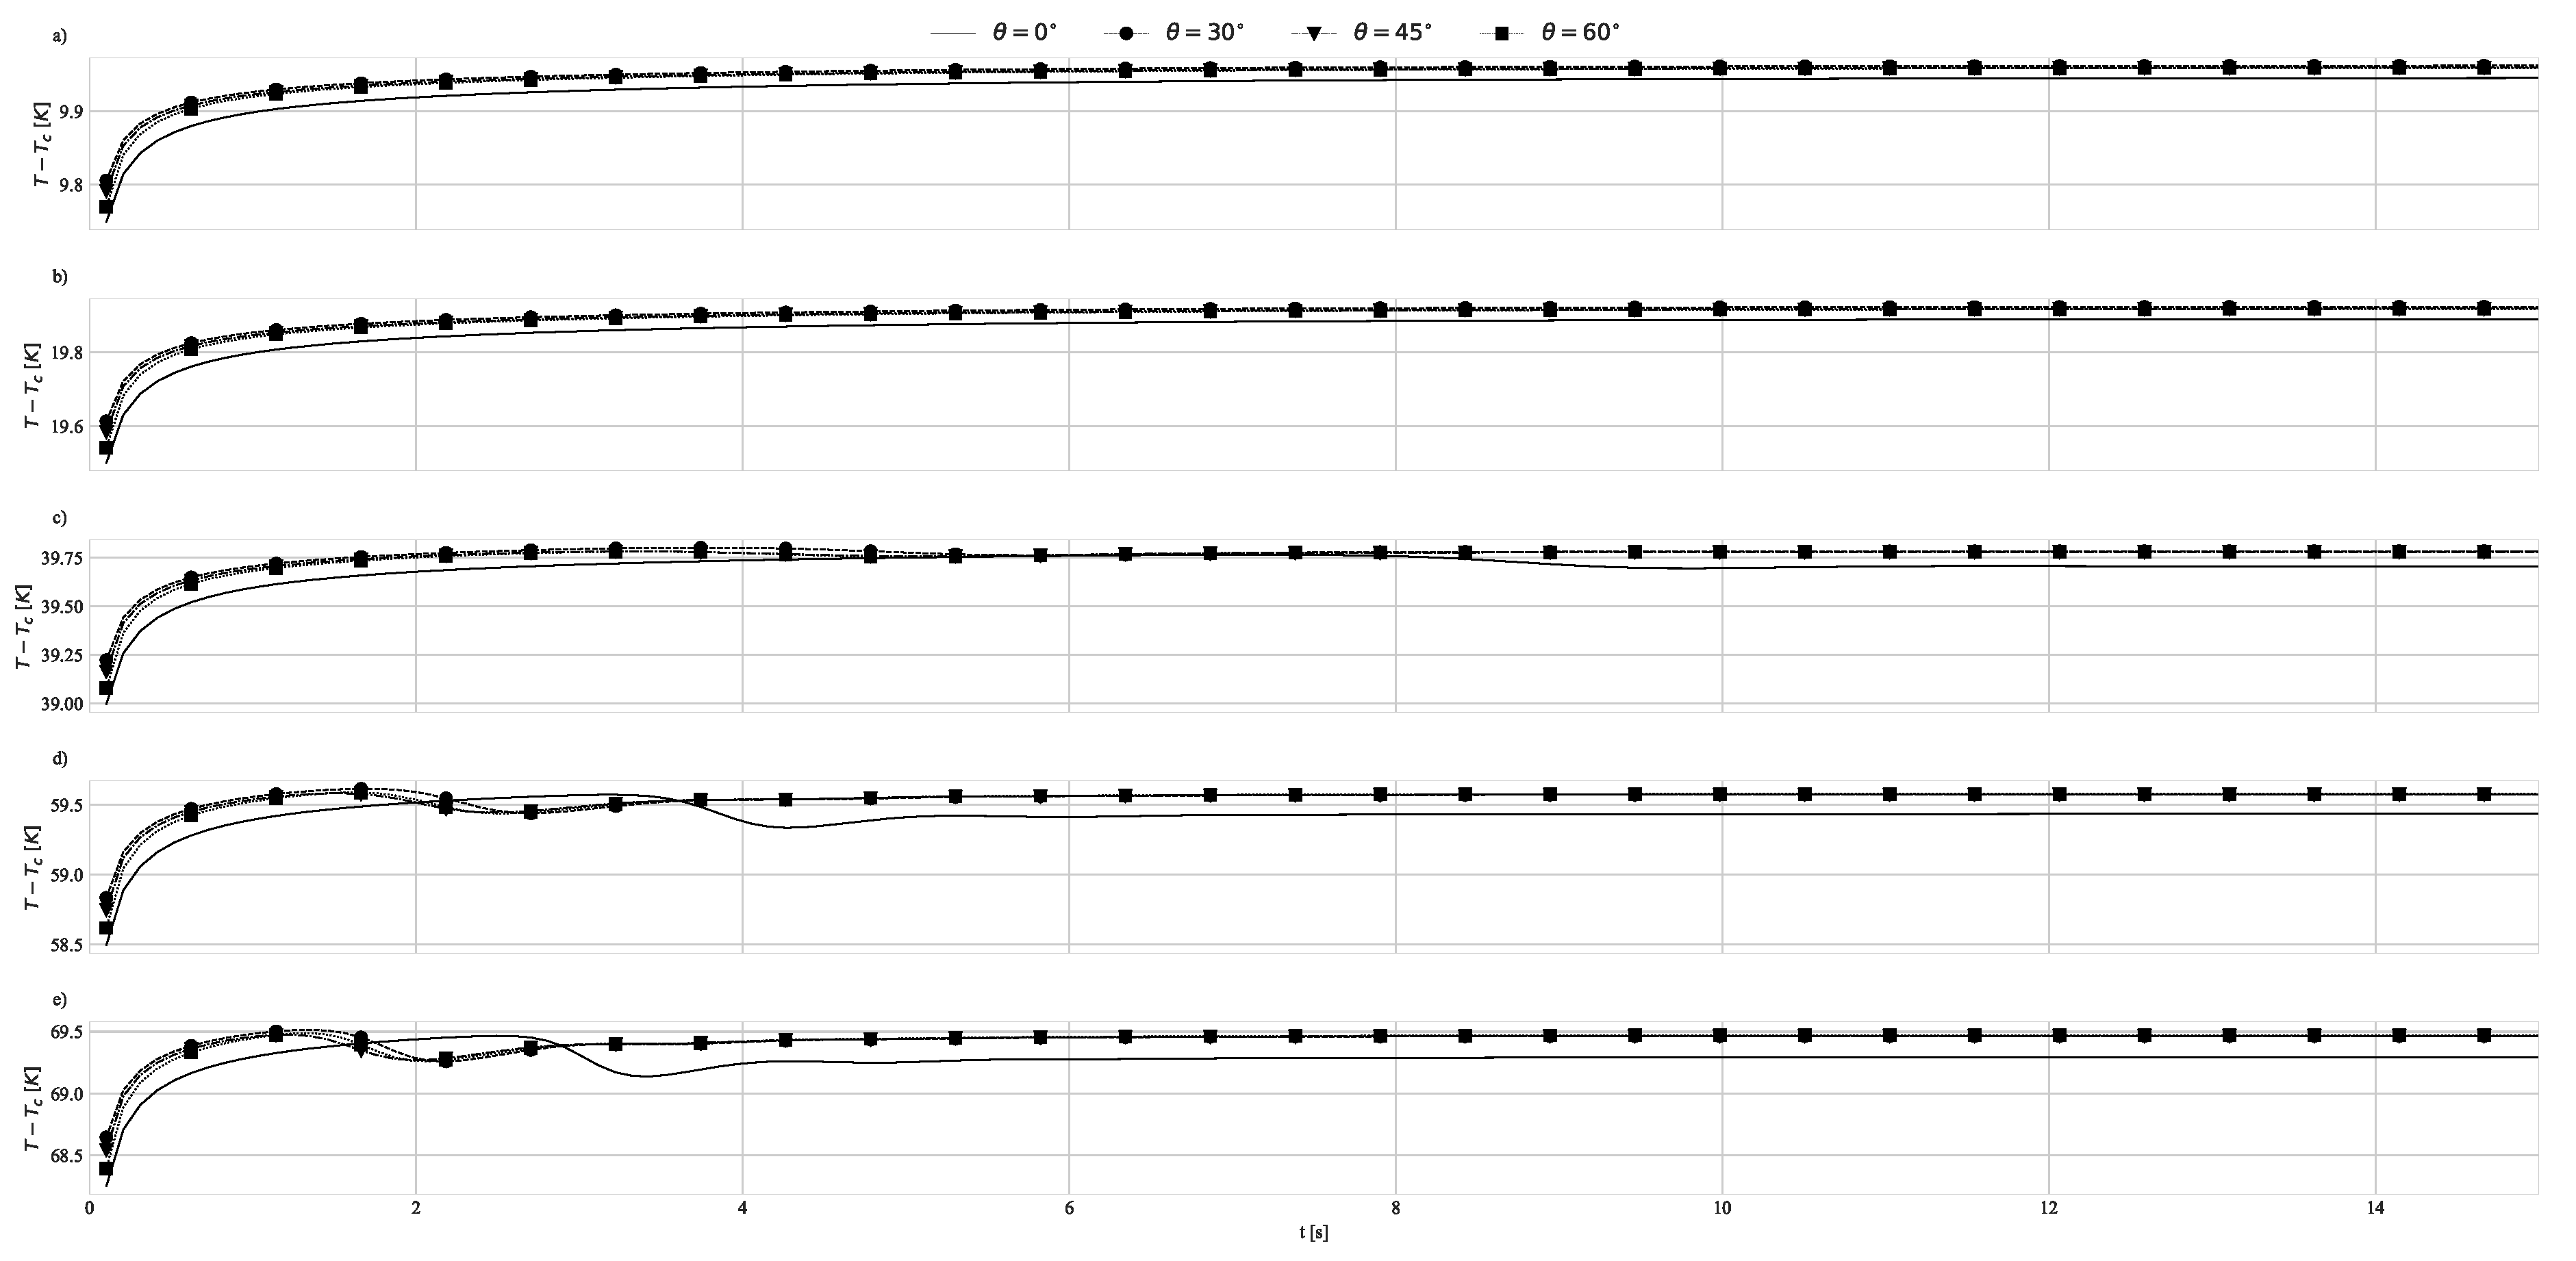
In addition to the previous results, we also conducted simulations of the natural convection process for five different base temperatures, T w a l l , effectively resulting in R a values ranging between 1.5 × 10 3 and 2.6 × 10 4 , considering each geometry configuration and a flat surface. The results primarily concern the average Nusselt number, N u ¯ , and the average heat flux at the solid-fluid interface, Q ˙ ¯ , throughout the transient regime. [r] N u Nusselt number [r] Q ˙ heat flux [ W m 2 ]
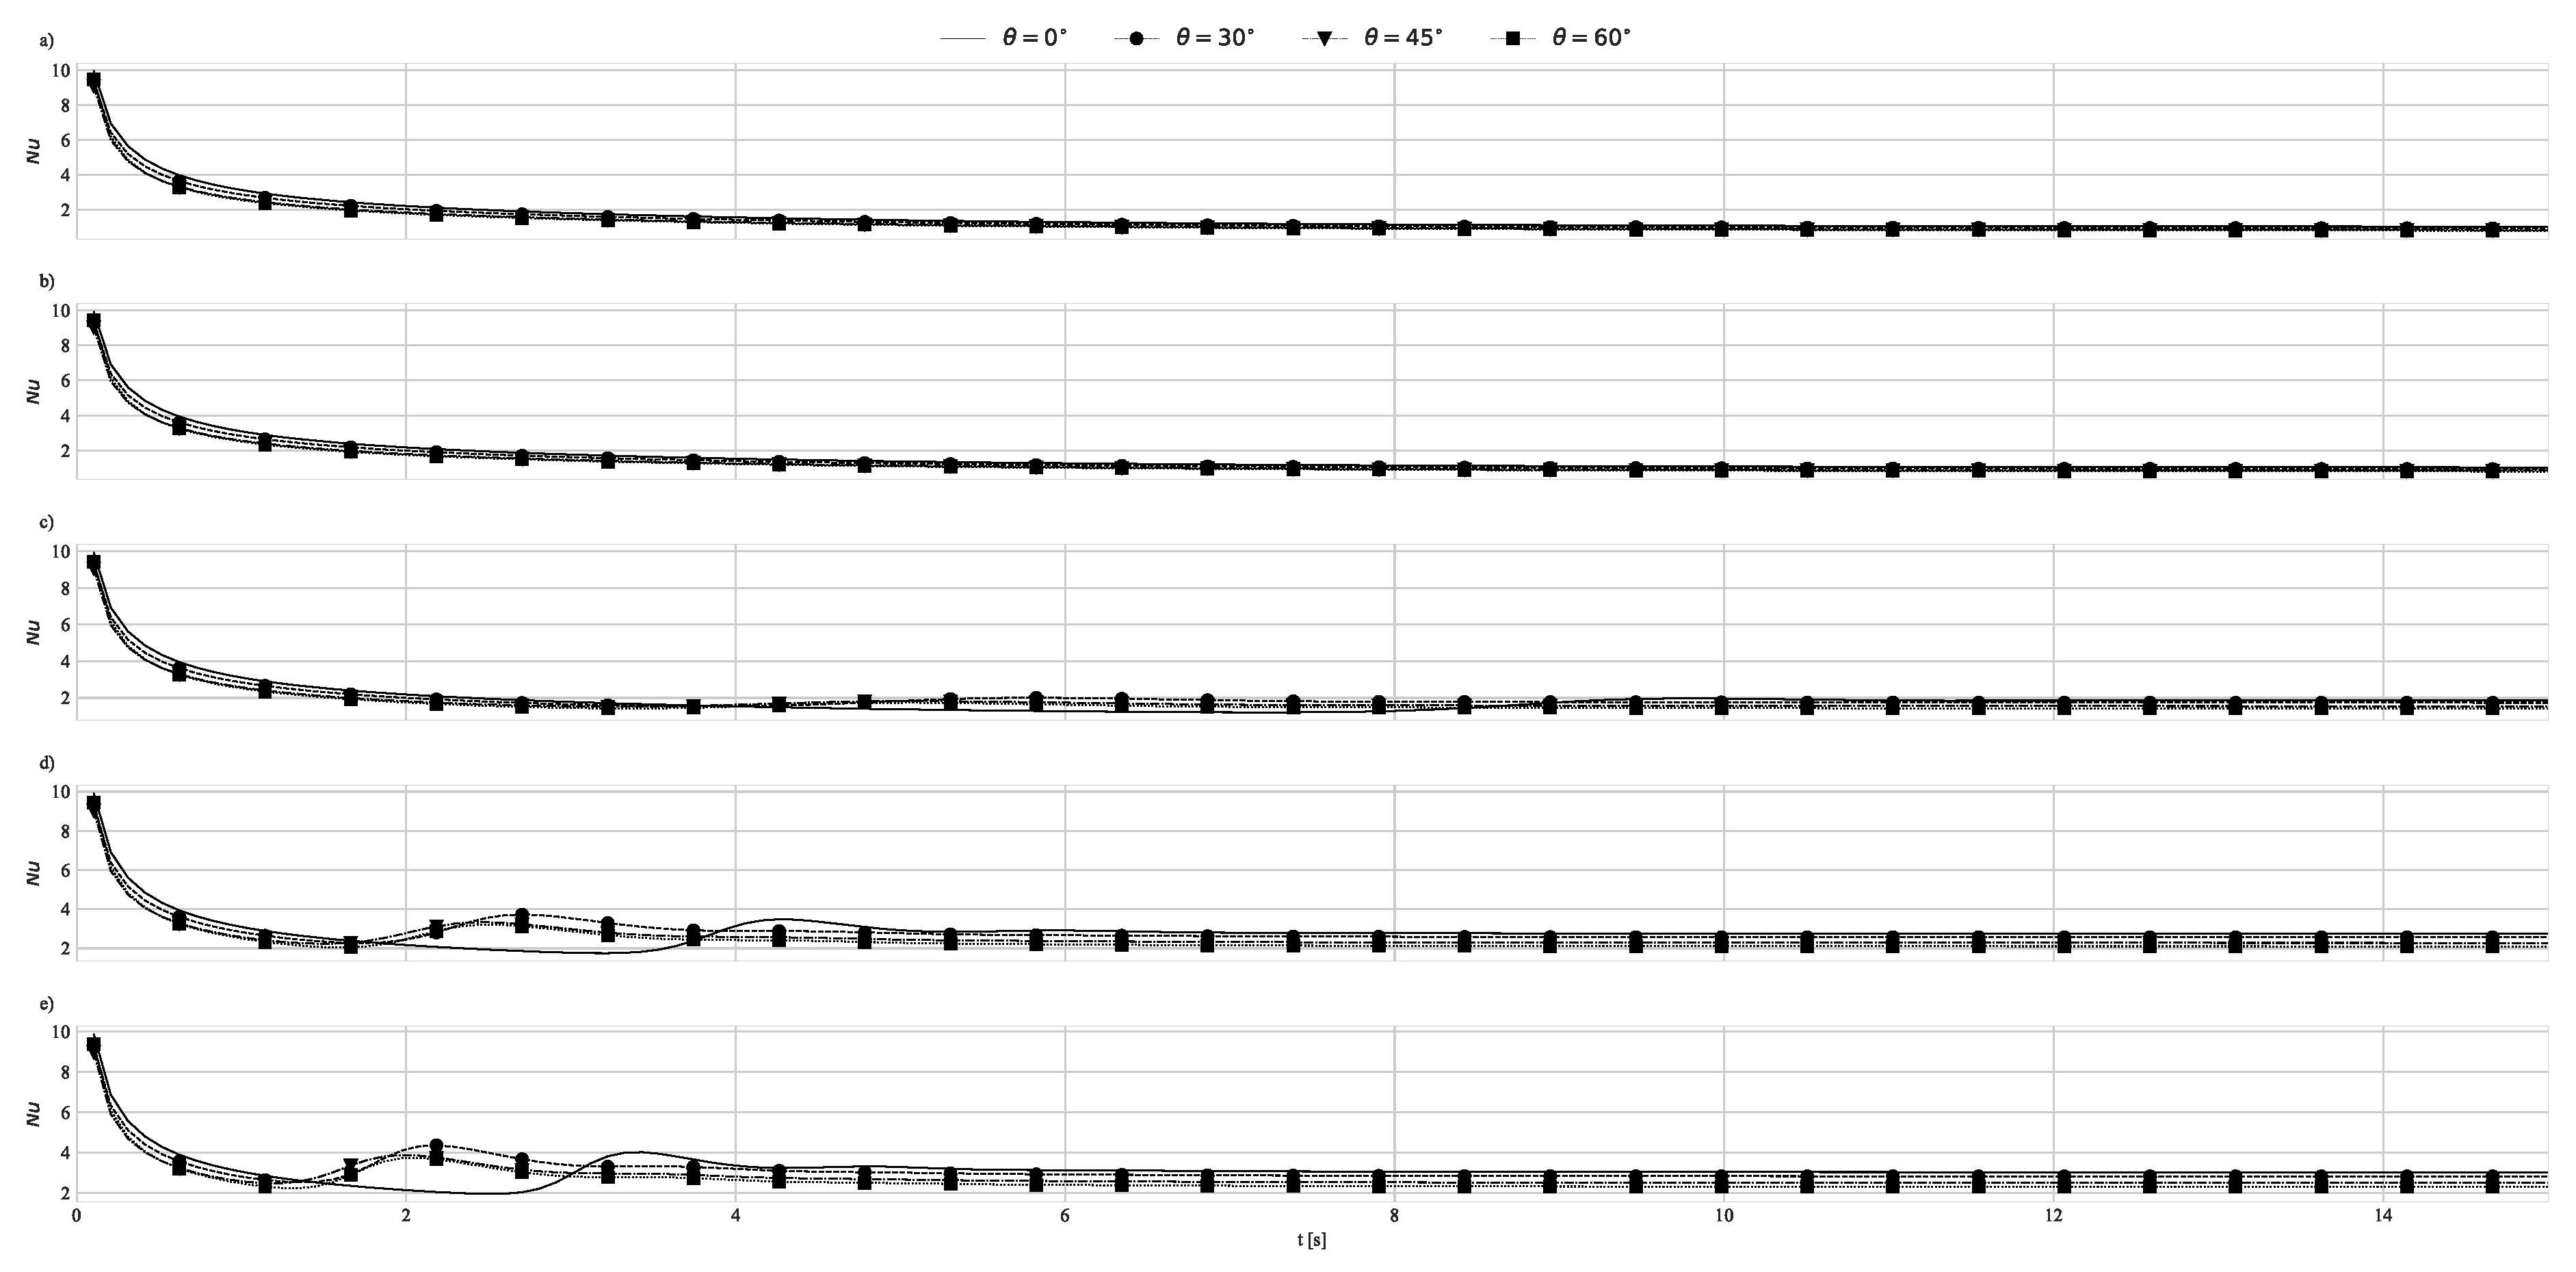
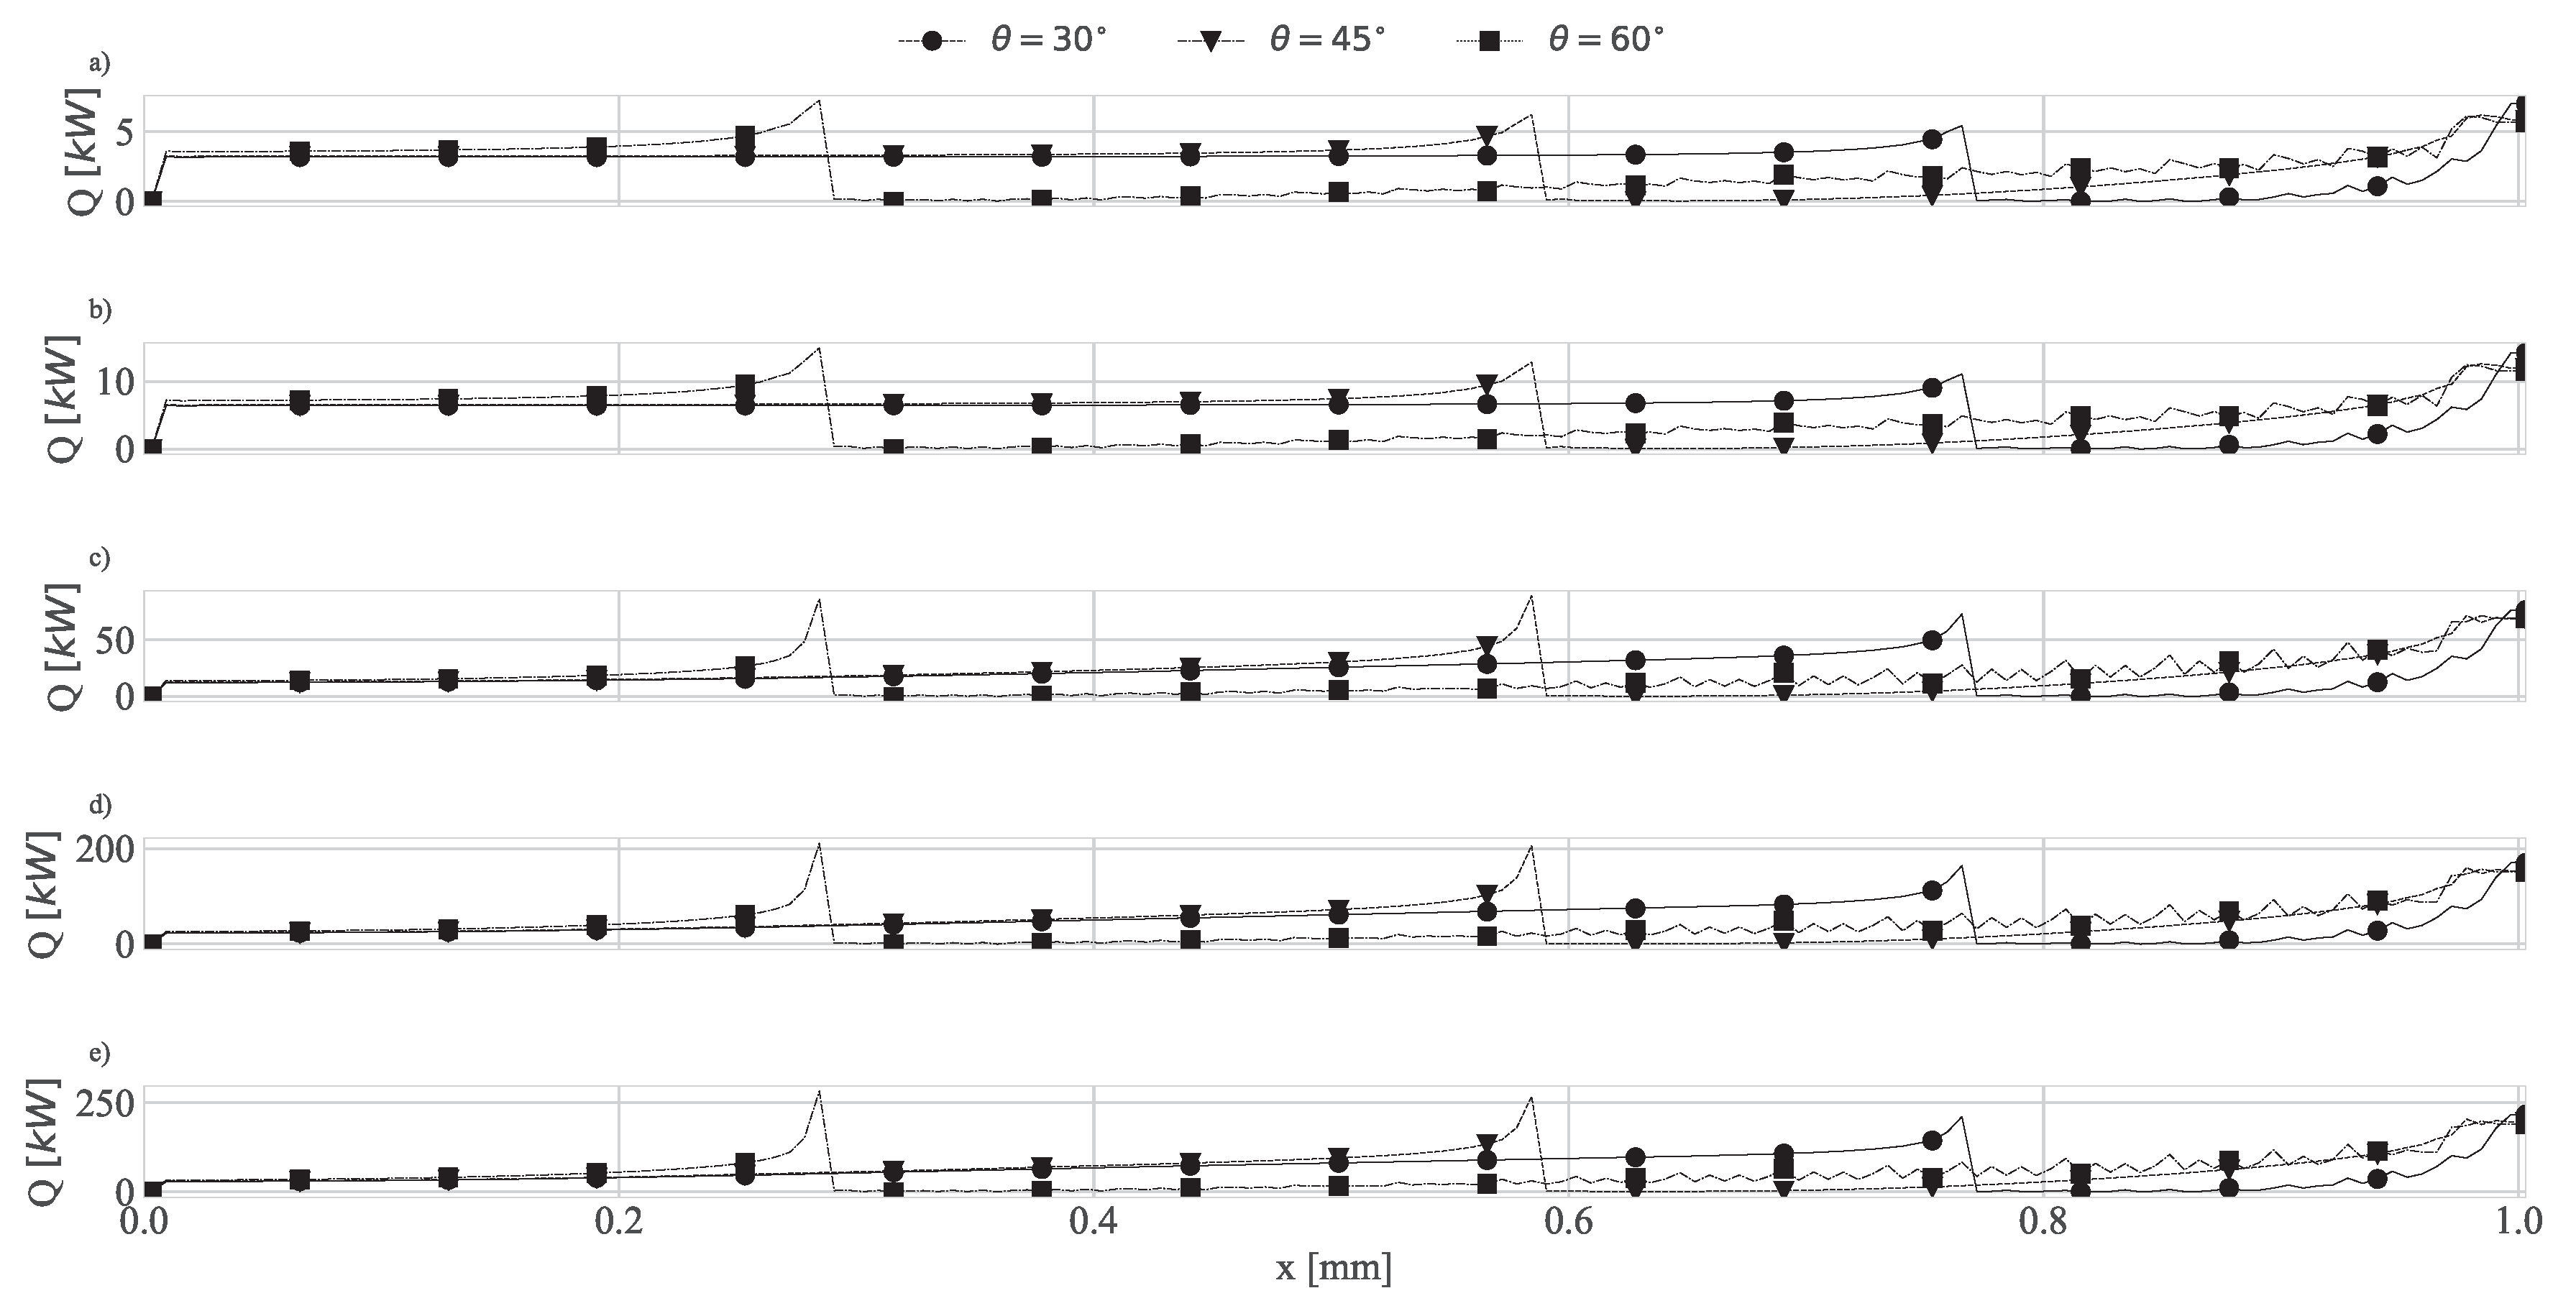
Figure 12, Figure 13, and Figure 14 illustrate the evolution of the average Nusselt number, heat transfer rate and temperature difference at the solid-fluid interface, respectively. The behavior observed for each condition drastically differs from one another. For T w a l l 40 C , all structured cavities are shown to have a negative impact on the heat transfer process. Conversely, when considering higher wall temperatures ( T w a l l 60 C ), the cavities begin to exhibit regions (typically at the beginning of the simulations) where the predicted Nusselt number surpasses those predicted for the plane surface. In other words, regions where an intensification of the heat transfer process is observed. This simulated behavior should be a direct consequence of R a values. For small R a the cavities increase the solid-fluid thermal resistance due to the low flow vorticiy, leading to low heat transfer rates. This behavior will be discussed further in this section.
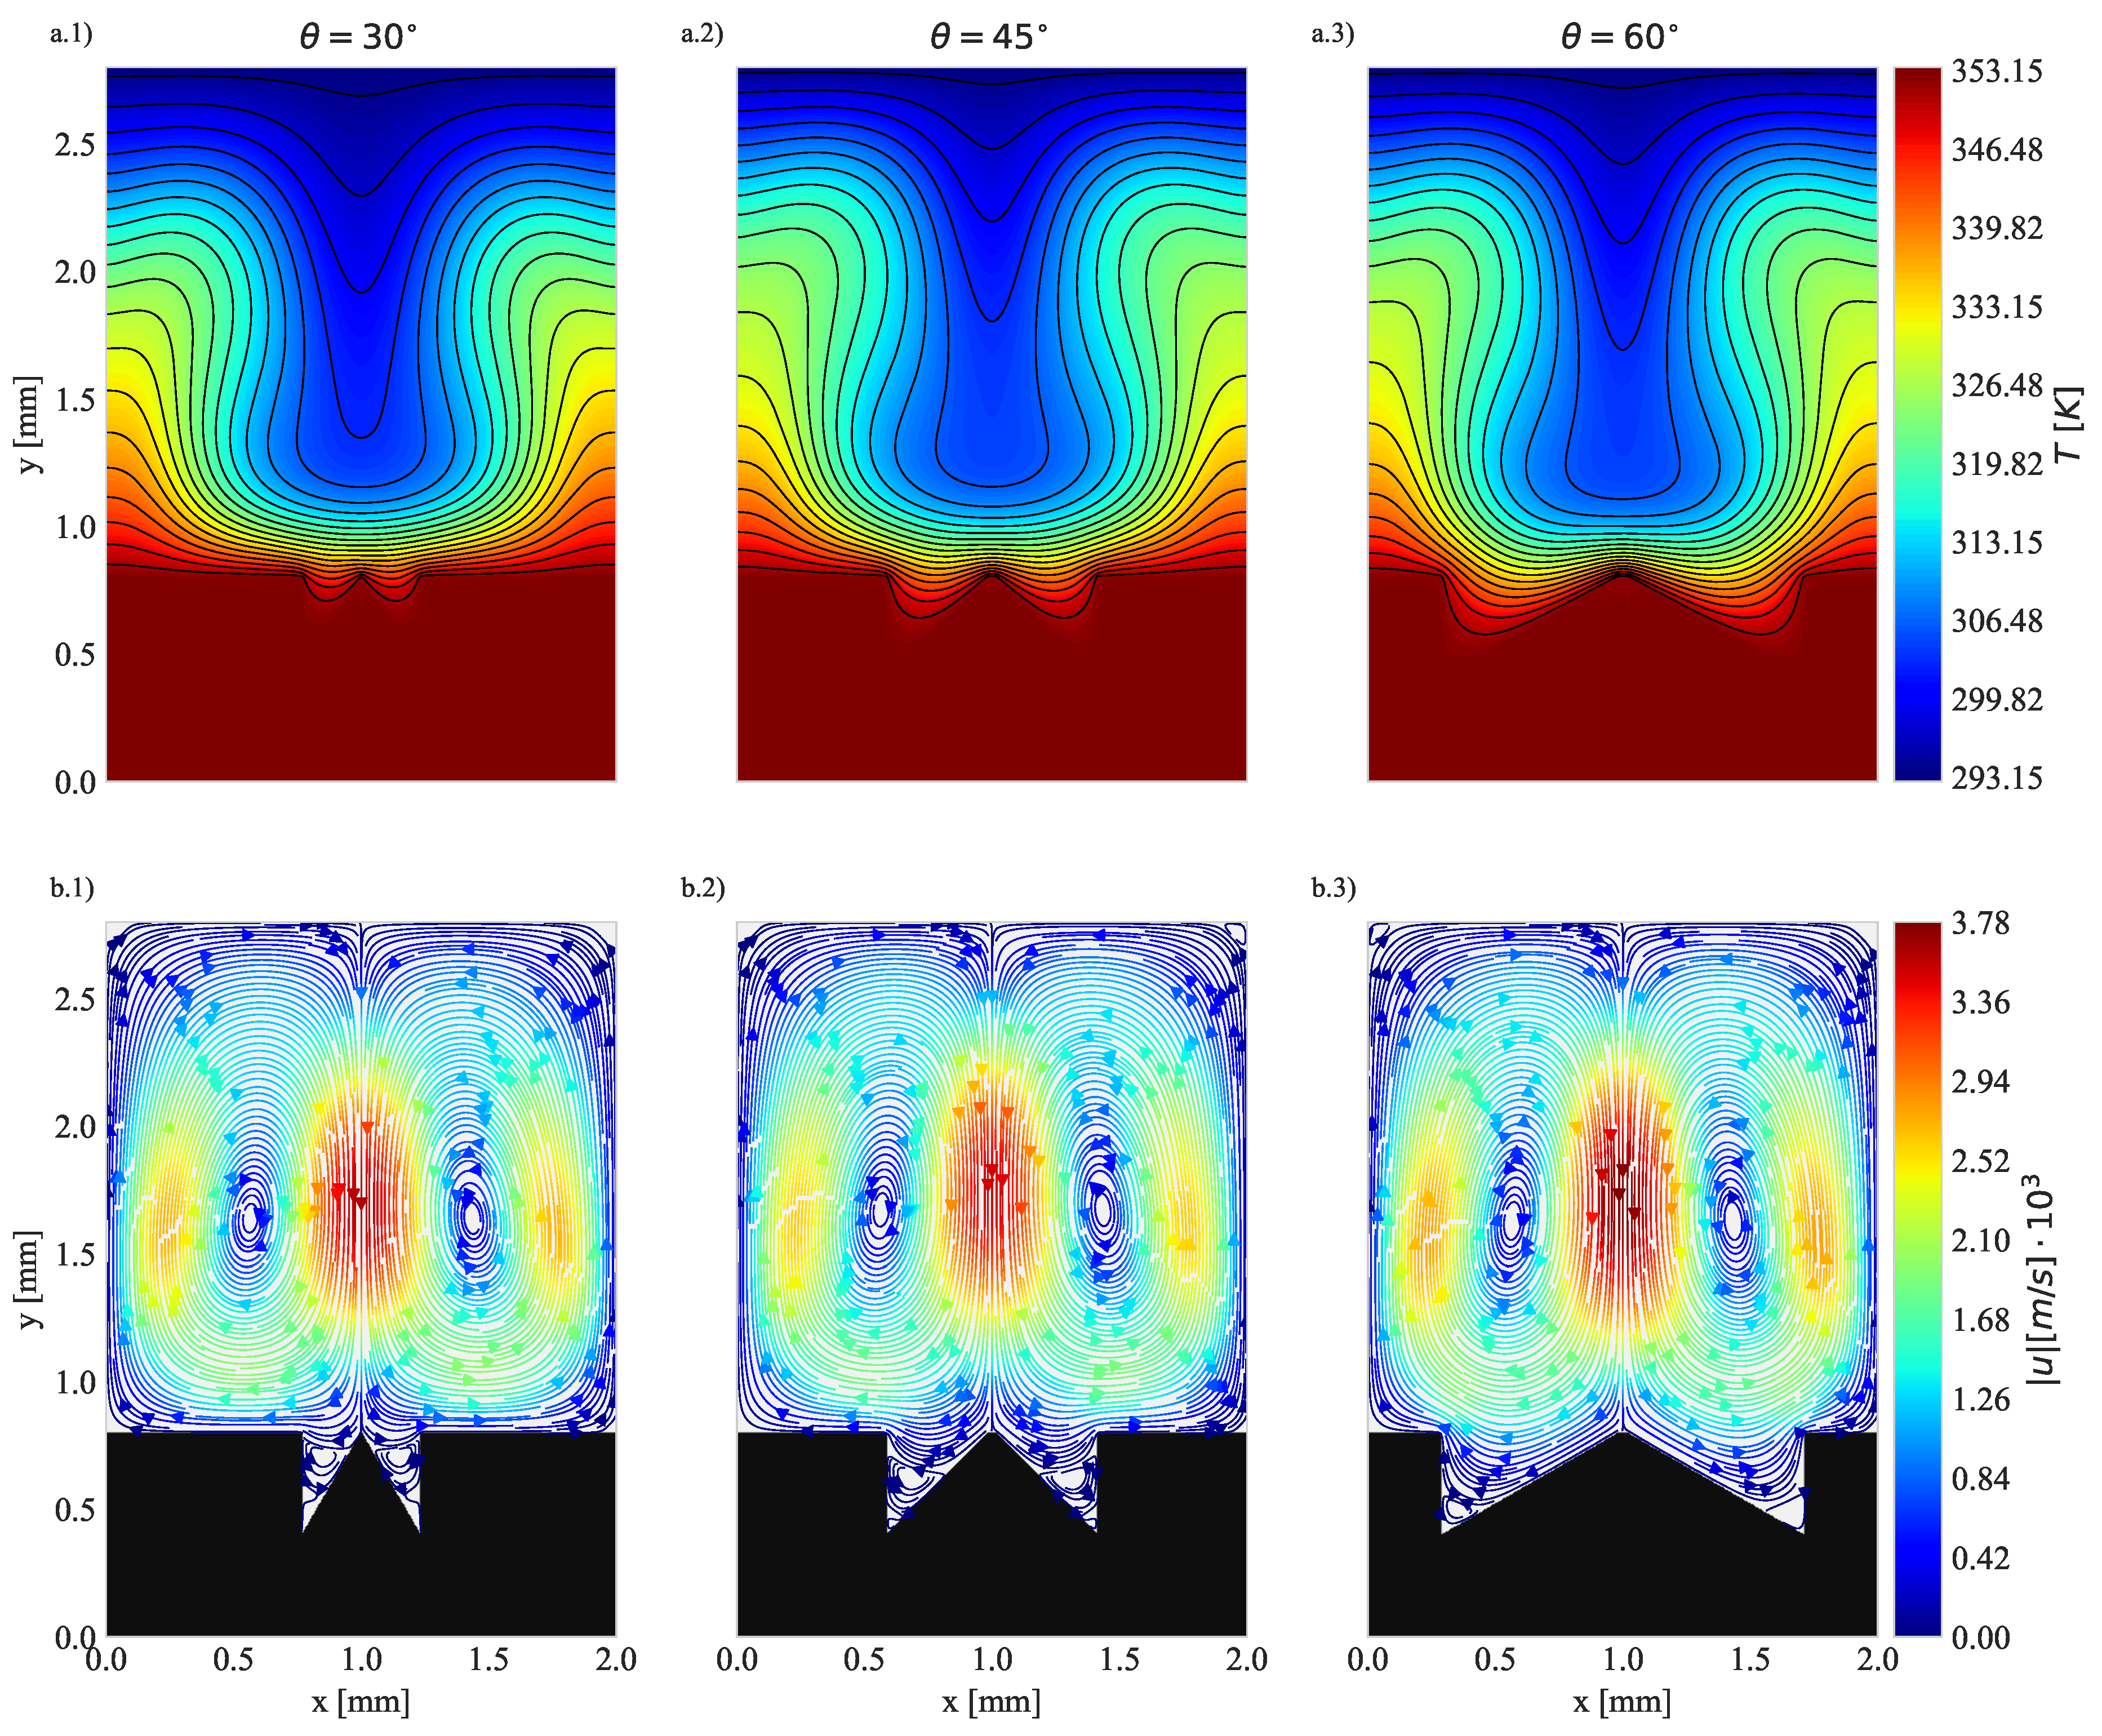
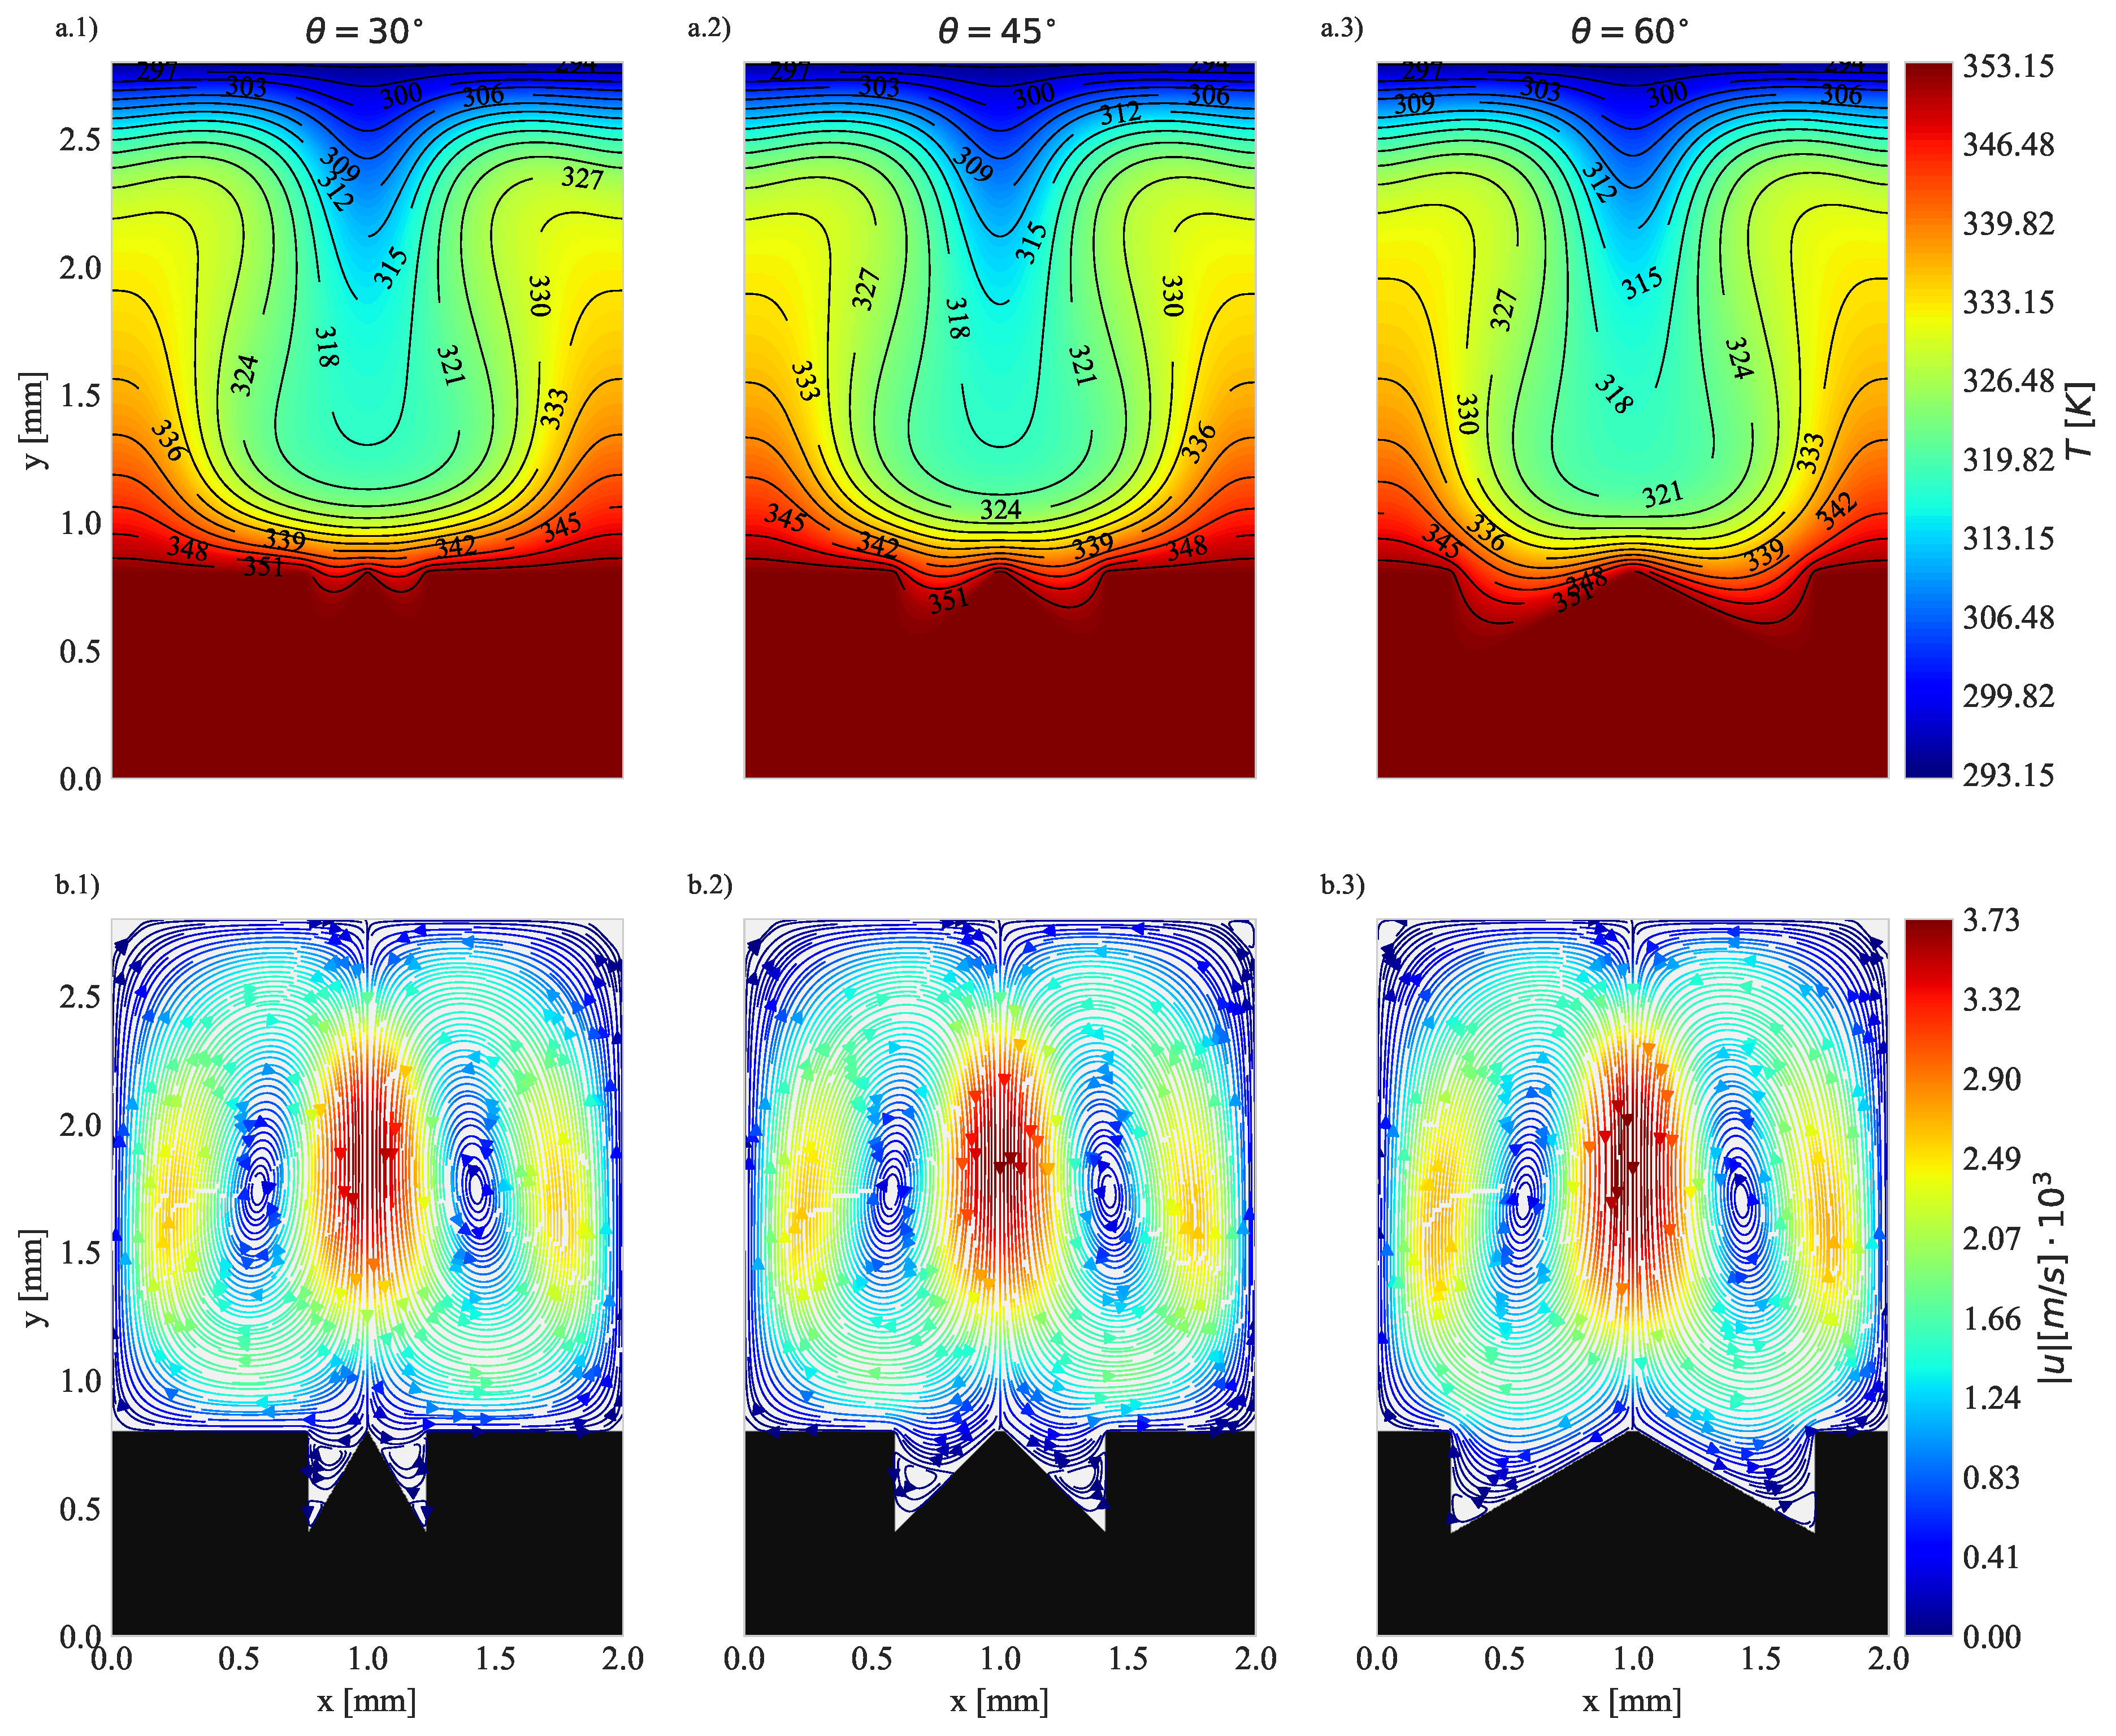
Figure 15 and Figure 16 depict both the temperature distributions and the streamlines for T w a l l = 80 C at t = 2.50 s and the steady-state regimes, respectively. Similar to the tests considering an imposed heat flux, the conditions of the problem favor the formation of counter-rotating symmetrical vortices. However, at the evaluated time steps, the vortices exhibit an opposite rotation compared to what was observed in the previous section, with the fluid descending at the middle section.
Despite their similarities, Figure 15 and Figure 16 show some major differences, which may help explain the behaviors observed during the transient regime. Looking solely at the temperature distributions, a clear difference is observed in the distribution of the isothermal lines. Figure 15 presents more closely packed lines, especially near the corners of the solid-fluid interface, indicating the presence of sharper temperature gradients. Physically, this behavior translates to higher heat transfer rates. From a hydrodynamic perspective, both conditions exhibit similar behaviors, with the exception of the observed absolute fluid velocity ( | u | ), which is higher when evaluated at t = 2.50 s compared to the stationary regime. This indicates a capability to advect more energy during the transient regime.
When evaluating the impact of structured cavities on the steady-state geometry performance, we observed a negative impact compared to a plane surface, as shown in Table 5, which leads to a decrease in the Nusselt number, in accordance with previous studies such as [5,10]. These results can be associated with the stagnation of the fluid within the cavities, as can be seen in Figure 16, where the fluid reaches temperatures as close to the solid as possible, creating regions with high thermal resistance.
Figure 17 presents the local heat transfer rate values at the solid-fluid interface. Due to the symmetry of the problem, the results are only shown until the middle section of the problem. Two distinct regions can be identified: Outside the cavities and within the cavities. In the first region the solid is in contact with fluid that exhibits relative motion to it. This motion increases the heat transferred from the solid to the fluid. In the second region the fluid tends to stagnate, and its temperature approaches that of the solid regions. As a result, the heat transferred in this region is reduced.
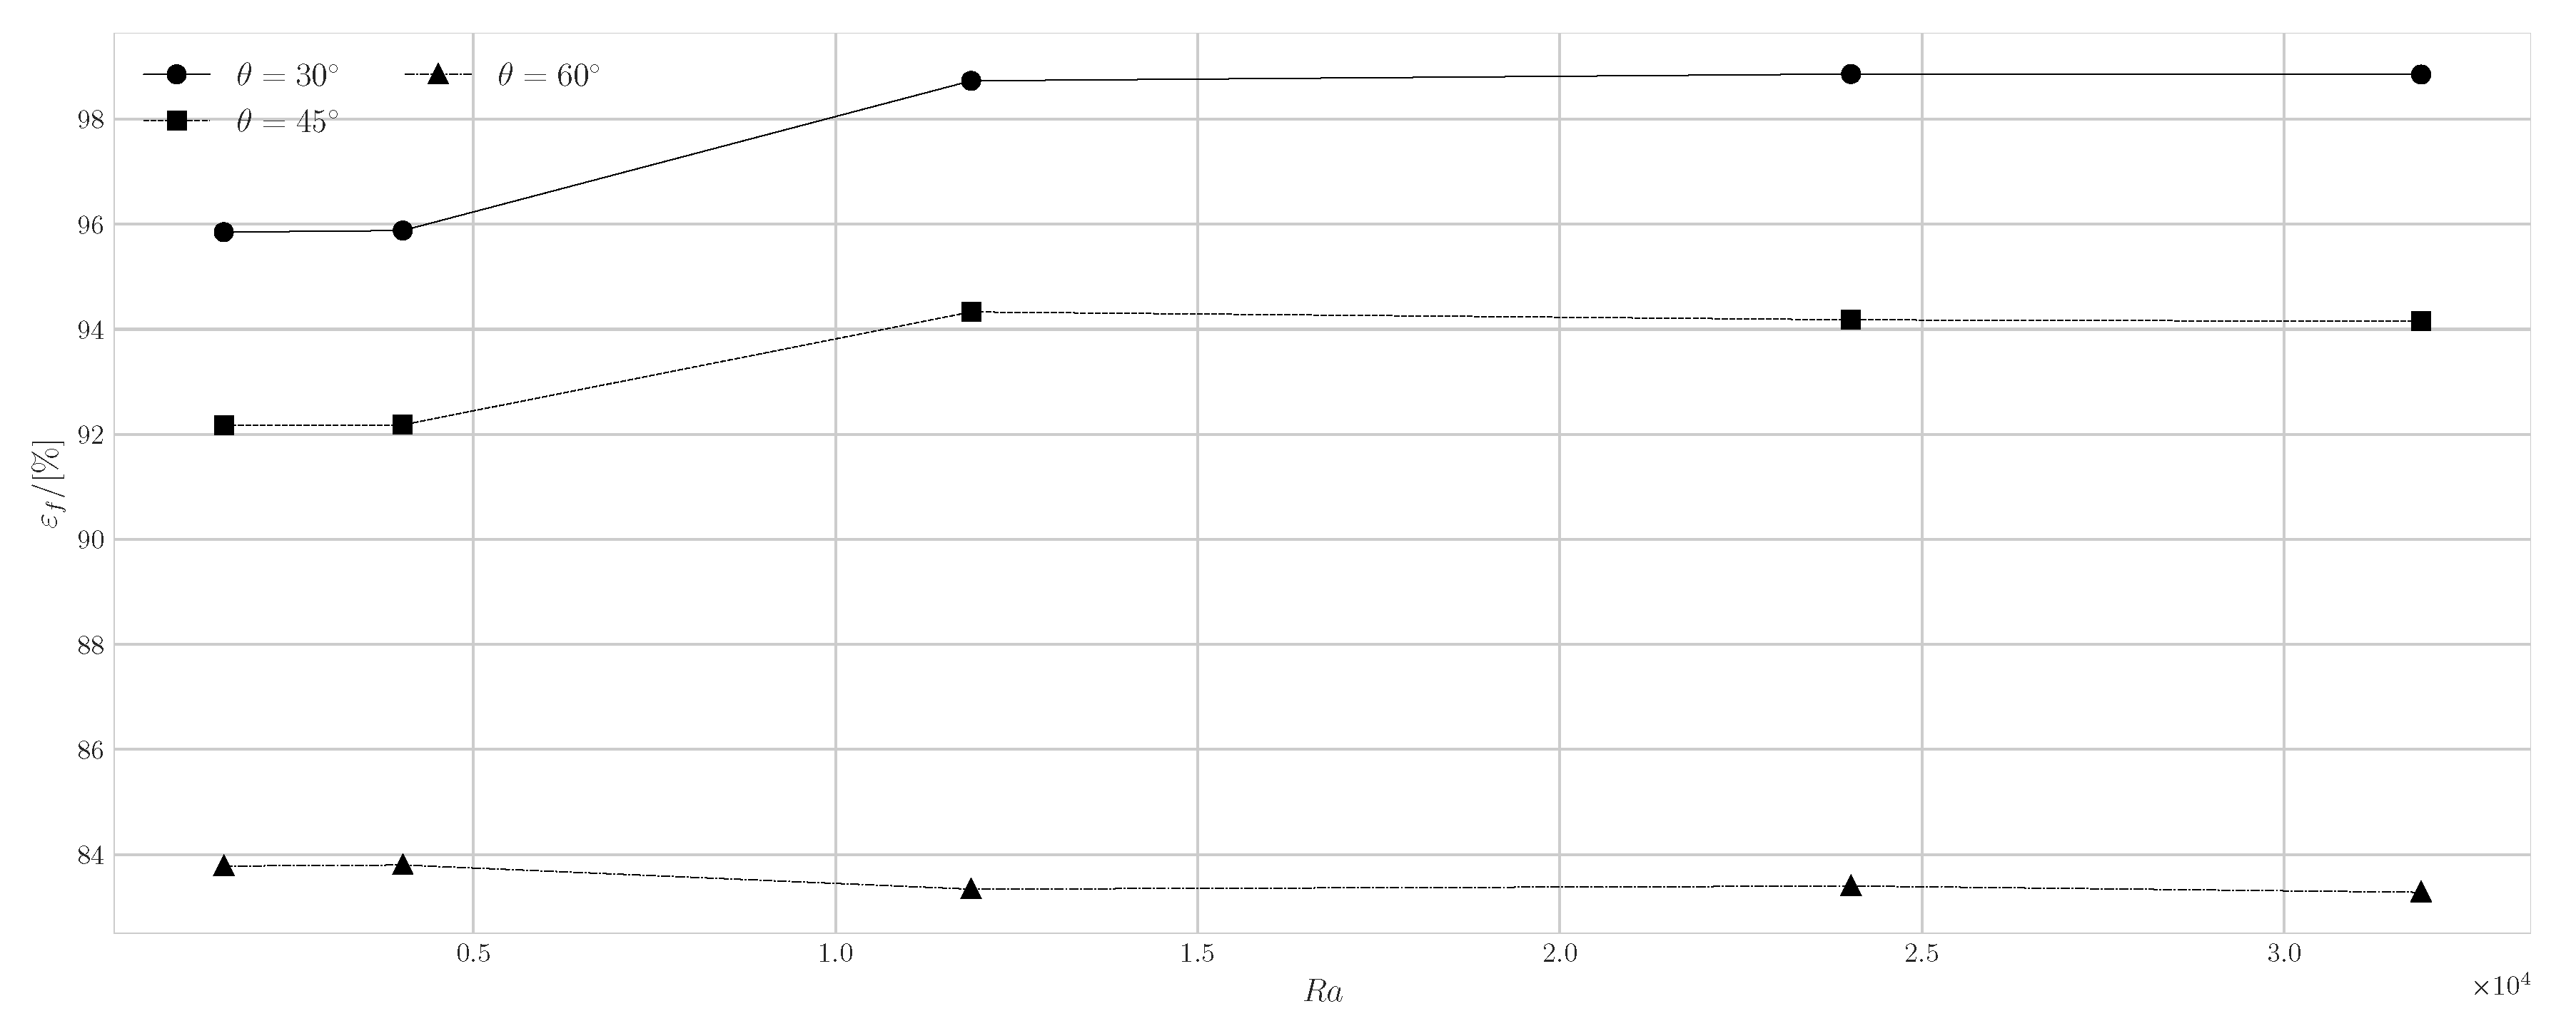
A brief examination of Figure 18 confirms that at steady state all the studied geometries indeed exhibited lower performance compared to the plane surface, resulting in reduced heat transfer rates. However, an interesting observation is noted: the elevation of the imposed base temperature, and consequently the Rayleigh number, enhances the effectiveness of the geometries. In particular, Geometry 1 nearly matches the performance of the plane surface for higher R a .

5. Conclusions

In this paper, a lattice Boltzmann method model designed for simulating conjugate heat transfer between non-heterogeneous mediums is introduced. The model incorporates a forcing term into the conventional advection-diffusion LBE, circumventing challenges associated with interface modeling. To validate the accuracy of the model, simulations of benckmark problems were conducted, demonstrating its robust performance across various conditions with consistently low relative errors compared to expected solutions.
Furthermore, the proposed LBM model was employed to investigate the natural convection phenomenon within structured cavities under the influence of conjugate heat transfer. Two principal simulations were undertaken: one involving a fixed heat flux at the domain base and another with fixed base temperature at this same domain base. Unlike previous works, emphasis was placed on the transient analysis of the problem, revealing interesting results. In both studied conditions, an augmentation in the natural convection process was perceived on the structured surfaces, mainly for higher Ra, indicating that the cavities enhance the conjugated heat transfer process in transient conditions. Specifically, regarding the simulation with a fixed heat flux, formation of secondary vortices close to the surfaces was observed. These vortices can be associated with the perceived augmentation of the Nusselt number, being responsible for enhanced advection of energy.
The results were also examined with consideration of stationary regimes. In these instances, the surface with cavities displayed lower Nusselt numbers and average heat transfer rates compared to a flat plane surface, thus supporting findings from prior research [5,10]. This occurrence is attributed to fluid stagnation between the structured cavities, which introduces an additional thermal resistance between the wall and the fluid, ultimately reducing heat transfer rates.
In summary, modifications were introduced to an existing thermal LBM model for simulating conjugate heat transfer processes [27], aimed at accounting for local and temporal variations of thermophysical properties. Subsequently, the natural convection process under conjugate heat transfer conditions on structured surfaces was investigated, revealing insights relevant to their application in heat exchangers for transient cooling of electronic devices.

Acknowledgments

The authors acknowledge the support received from the CAPES (Coordenação de Aperfeiçoamento de Pessoal de Nível Superior – Brasil – Finance Code 001, process 88887.805775/2023-00), FAPESP grants (2022/12257-5, 2022/15765-1 and 2023/02383-6) FAPEMIG and CNPq grants (305771/2023-0).
Preprints 103637 i001

Appendix A Chapman-Enskog Analysis

The Chapman-Enskog analysis for the proposed LBE with source term is performed in this section. First, we start by considering that the source term S g i = 1 Δ t 2 τ T w i S g , consequently h 0 = ( i g i + 0.5 δ t S g ) .
For sake of clarity the index notation will be used here, being α , β and γ the Cartesian’s coordinates, as well as the short notation of derivatives ( t , α , α β ,etc). Starting from the thermal lattice Boltzmann equation for discrete velocity directions, considering the BGK collision operator and the source term,
g i ( x α + c i α δ t , t + δ t ) g i ( x α , t ) = δ t τ T g i ( x α , t ) g i e q ( x α , t ) + δ t S g i .
Expanding g i ( x α + c i α δ t , t + δ t ) in Taylor series considering only at the second-order terms, the LBE becomes:
δ t t g i + c i α α g i + δ t 2 2 t t g i + 2 c i α t α g i + c i α 2 α α g i + O ( δ t ) 3 = δ t τ T g i g i e q + δ t S g i ,
Next, the temporal and spatial derivatives and the distribution functions are expanded in terms of the Knudsen number K n . Defining ϵ to indicate the Knudsen order terms (for example, ϵ n K n n ) and expanding g i as a perturbation series around g i e q :
ϵ t ( 1 ) + ϵ 2 t ( 2 ) + c i α ϵ α ( 1 ) g i ( 0 ) + ϵ g ( 1 ) + ϵ 2 g i ( 2 ) + . . . δ t 2 ϵ t ( 1 ) + ϵ 2 t ( 2 ) 2 + 2 c i α ϵ α ( 1 ) ϵ t ( 1 ) + ϵ 2 t ( 2 ) + c i α 2 ϵ α ( 1 ) 2 g i ( 0 ) + ϵ g ( 1 ) + ϵ 2 g i ( 2 ) + . . . O ( δ t ) 3 = 1 τ T g i ( 0 ) + ϵ g ( 1 ) + ϵ 2 g i ( 2 ) g i e q + ϵ ( 1 ) S g i ( 1 )
Neglecting terms with order superior than ϵ 3 , the final expression becomes:
ϵ 0 1 τ T g i ( 0 ) g i e q + ϵ 1 t ( 1 ) g i ( 0 ) + c i α α ( 1 ) g i ( 0 ) + g i ( 1 ) τ T S g i ( 1 ) + . . . ϵ 2 t ( 1 ) g i ( 1 ) + t ( 2 ) g i ( 0 ) + c i α α ( 1 ) g i ( 1 ) + δ t 2 t 2 ( 1 ) g i ( 0 ) + 2 c i α t α ( 1 ) g i ( 0 ) + c i α 2 α 2 ( 1 ) g i ( 0 ) + g i ( 2 ) τ T = 0
Splitting in relation to the order of ϵ and re-ordering the expressions, we have:
ϵ 0 : g i ( 0 ) = g i e q
ϵ 1 : t ( 1 ) + c i α α ( 1 ) g i ( 0 ) = g i ( 1 ) τ T + S g i ( 1 )
ϵ 2 : t ( 2 ) g i ( 0 ) + t ( 1 ) + c i α α ( 1 ) g i ( 1 ) + Δ t 2 t ( 1 ) + c i α α ( 1 ) 2 g i ( 0 ) = g i ( 2 ) τ T
Taking the zeroth and first moments of Eq. A6, and substituting the source term:
0 t h : t ( 1 ) h 0 + α ( 1 ) u α h 0 = S g ( 1 ) 1 s t : t ( 1 ) u α h 0 + c s 2 α ( 1 ) h 0 = 1 τ T g i ( 1 ) c i α
Substituting Eq. A6 in Eq. A7, taking the zeroth moment of the resultant equation and re-ordering:
α ( 2 ) h 0 + α ( 1 ) Δ t 2 τ T c s 2 α ( 1 ) h 0 + α ( 1 ) Δ t 2 τ T t ( 1 ) u α h 0 = 1 4 1 Δ t 2 τ T Δ t t ( 1 ) S g ( 1 )
Summing Eq. A9 with the 0th moment in Eq. A8 in their respective ϵ order,
ϵ t ( 1 ) + ϵ 2 t ( 2 ) h 0 + ϵ α ( 1 ) h 0 u α + ϵ α ( 1 ) Δ t 2 τ T c s 2 ϵ α ( 1 ) h 0 + E = . . . ϵ 2 1 4 1 Δ t 2 τ T Δ t t ( 1 ) S g ( 1 ) + ϵ S g ( 1 )
Where E = α ( 1 ) Δ t 2 τ T t ( 1 ) u α h 0 is the error term in the analysis. Recuperating the derivatives and macroscopic quantities from the expansion in ϵ :
t h 0 + · ( u h 0 ) = ( α h 0 ) + S g = ( α h 0 ) k ρ c P 0 h 0 1 σ
Thus, we can see that the proposed method indeed recover Eq. 16.

Appendix B Analytical Solution Heat Diffusion between Three Solids

The analytical solution for this problem is given in the form of Eq. A12, where Θ = ( T T w 2 ) / ( T w 1 T w 2 ) , ξ 1 = x / x 1 , ξ 2 = ( x d 1 ) / x 2 , ξ 3 = [ x ( d 1 + d 2 ) ] / x 3 , τ = t / t 0 , δ 1 = α C u t 0 / ( d 1 2 ) , δ 2 = α S i t 0 / ( d 2 2 ) , δ 3 = α A l t 0 / ( d 3 2 ) , κ 1 = K C u / d 1 , κ 2 = K S i / d 1 and κ 3 = K A l / d 1 . With t 0 being a reference time set as the total studied time, and d i the length of each layer.
Θ ( ξ i , τ ) = Φ ( ξ i ) ϕ ( ξ i , τ )
The term Φ ( ζ i ) is referent to the steady-state solution for the problem, and is given by Eq. A13.
Φ ( ξ 1 ) = 1 ( Δ Θ ) 1 ξ 1 , if   0 < ξ 1 1 ; Φ ( ξ 2 ) = 1 ( Δ Θ ) 1 ( Δ Θ ) 2 ξ 2 , if   0 < ξ 2 1 ; Φ ( ξ 3 ) = 1 ( Δ Θ ) 1 ( Δ Θ ) 2 ( Δ Θ ) 3 ξ 3 , if   0 < ξ 3 1 ;
where,
( Δ Θ ) i = ( 1 / κ i ) / ( 1 / κ 1 + 1 / κ 2 + 1 / κ 3 )
The term ϕ ( ξ i , τ ) is the unsteady-solution for the problem that satisfies the boundary conditions, and is given by Eq. A14.
ϕ ( ξ 1 , τ ) = n = 0 A n e λ n 2 δ 1 τ sin ( λ n ξ 1 ) , if   0 < ξ 1 1 ; ϕ ( ξ 2 , τ ) = Δ 1 n = 0 A n e λ n 2 δ 2 τ α n sin δ 1 δ 2 λ n ξ 2 + β n cos δ 1 δ 2 λ n ξ 2 , if   0 < ξ 2 1 ; ϕ ( ξ 3 , τ ) = Δ 2 n = 0 A n e λ n 2 δ 3 τ α ¯ n sin δ 1 δ 3 λ n ξ 3 + β ¯ n cos δ 1 δ 3 λ n ξ 3 , if   0 < ξ 3 1 ;
where,
Δ i = κ 1 κ i + 1 δ i + 1 δ 1 ; α n = cos ( λ n ) ; β n = sin ( λ n ) / Δ 1 ; α ¯ n = cos ( λ n ) cos δ 1 δ 2 λ n sin ( λ n ) sin δ 1 δ 2 λ n / Δ 1 ; β ¯ n = cos ( λ n ) sin δ 1 δ 2 λ n Δ 1 Δ 2 sin ( λ n ) cos δ 1 δ 2 λ n / Δ 2 ; M n = κ 1 κ 2 2 + κ 1 κ 3 cos 2 ( λ n ) + sin 2 ( λ n ) / Δ 1 2 2 + κ 1 κ 2 ( α ¯ n 2 + β ¯ n 2 ) 2 A n = κ 2 κ 3 λ n M n
Finally, λ n are the eigenvalues that satisfy the relation shown in Eq. A15
tan ( λ n ) = Δ 1 tan δ 1 δ 2 λ n + Δ 2 tan δ 1 δ 3 λ n 1 Δ 2 Δ 1 tan δ 1 δ 2 λ n tan δ 1 δ 3 λ n

Appendix C Analytical Solution Convection-Diffusion with a Flat Interface

The solution for this problem is given by Eq. A16, being 1 the lower fluid (water, in the case treated) and 2, the upper one (ethanol).
T ( x , y , t ) = T 0 + Δ T · R e e j ( K x + ω t ) γ 1 e λ 1 y + 1 γ 1 e λ 1 y , if   0 y h ; T ( x , y , t ) = T 0 + Δ T · R e e j ( K x + ω t ) γ 2 e λ 2 y + 1 γ 2 e λ 2 H e λ 2 ( H y ) , if   h < y H ;
With R e referring to the real part of the solution, and with the following coefficients:
σ = ( ρ c p ) 2 ( ρ c p ) 1 ; κ = α 2 α 1 ; λ 1 = K 1 + j ω + U 0 K K 2 α 1 ; λ 2 = K 1 + j ω + U 0 K K 2 α 2 a 1 = e λ 1 h ; a 2 = e λ 2 h ; a 3 = e λ 2 H γ 1 = λ 1 ( a 3 2 a 2 2 ) + κ σ λ 2 ( 2 a 1 a 2 a 3 a 2 2 a 3 2 ) ( λ 1 + κ σ λ 2 ) ( a 1 2 a 3 2 a 2 2 ) ( λ 1 κ σ λ 2 ) ( a 1 2 a 2 2 a 3 2 ) γ 2 = λ 1 ( a 1 2 a 3 + a 3 2 a 1 a 2 ) + κ σ λ 2 ( a 1 2 1 ) a 3 ( λ 1 + κ σ λ 2 ) ( a 1 2 a 3 2 a 2 2 ) ( λ 1 κ σ λ 2 ) ( a 1 2 a 2 2 a 3 2 )

Appendix D Nusselt Number Calculation

Two primary approaches for evaluating the Nusselt number can be employed. The first method estimates N u based on the projected length of the geometries, resulting in N u ¯ L . The second approach calculates N u using the actual length of the cavity, leading to N u ¯ L e q . Both methods yield similar outcomes in identifying the "better" surface. However, calculations based on the projected area consistently produce much lower values compared to those observed for the plane interface. Conversely, when considering the real interface length, the N u values are found to be closer to those of the plane interface. Nonetheless, the average Nusselt number can be estimated by integrating the non-dimensional temperature, Eq.A17, along the solid-fluid interface, resulting in Eq.A18, with both approaches differing with regard to the integration domain.
Θ ( x ) = T s ( x ) T c o l d Δ T ; Δ T = Q w a l l * L k f
N u ¯ = 0 L 1 Θ ( x ) d x

References

  1. Bejan, A.; Kraus, A. Heat Transfer Handbook; Number v. 1 in Heat Transfer Handbook, Wiley, 2003.
  2. Aneesh, A.; Sharma, A.; Srivastava, A.; Vyas, K.; Chaudhuri, P. Thermal-hydraulic characteristics and performance of 3D straight channel based printed circuit heat exchanger. Applied Thermal Engineering 2016, 98, 474–482. [Google Scholar] [CrossRef]
  3. Buchberg, H.; Catton, I.; Edwards, D.K. Natural Convection in Enclosed Spaces—A Review of Application to Solar Energy Collection. Journal of Heat Transfer 1976, 98, 182–188. [Google Scholar] [CrossRef]
  4. Baïri, A.; Zarco-Pernia, E.; De María, J.M.G. A review on natural convection in enclosures for engineering applications. The particular case of the parallelogrammic diode cavity. Applied Thermal Engineering 2014, 63, 304–322. [Google Scholar] [CrossRef]
  5. Pretot, S.; Zeghmati, B.; Caminat, P. Influence of surface roughness on natural convection above a horizontal plate. Advances in Engineering Software 2000, 31, 793–801. [Google Scholar] [CrossRef]
  6. Oosthuizen, P.H. A numerical study of laminar and turbulent natural convective heat transfer from an isothermal vertical plate with a wavy surface. ASME International Mechanical Engineering Congress and Exposition, 2010, Vol. 44441, pp. 1481–1486. [CrossRef]
  7. Oosthuizen, P. Natural convective heat transfer from an inclined isothermal plate with a wavy surface. 42nd AIAA Thermophysics Conference, 2011, p. 3943.
  8. Oosthuizen, P.H.; Kalendar, A. A numerical study of the effect of spaced triangular surface waves on natural convective heat transfer from an upward facing heated horizontal isothermal surface. ASTFE Digital Library. Begel House Inc., 2020.
  9. Hussain, S.; Kalendar, A.; Rafique, M.Z.; Oosthuizen, P.H. Assessment of thermal characteristics of square wavy plates. Heat Transfer 2020, 49, 3742–3757. [Google Scholar] [CrossRef]
  10. Hossain, M.; Rees, D.A.S. Combined heat and mass transfer in natural convection flow from a vertical wavy surface. Acta Mechanica 1999, 136, 133–141. [Google Scholar] [CrossRef]
  11. Siddiqa, S.; Hossain, M.; Saha, S.C. The effect of thermal radiation on the natural convection boundary layer flow over a wavy horizontal surface. International Journal of Thermal Sciences 2014, 84, 143–150. [Google Scholar] [CrossRef]
  12. Siddiqa, S.; Hossain, M.A.; Gorla, R.S.R. Natural convection flow of viscous fluid over triangular wavy horizontal surface. Computers & Fluids 2015, 106, 130–134. [Google Scholar]
  13. Oosthuizen, P.H.; Paul, J.T. A numerical study of natural convective heat transfer from an inclined isothermal plate having a square wave surface. ASME International Mechanical Engineering Congress and Exposition, 2011, Vol. 54969, pp. 445–450.
  14. Perelman, T. On conjugated problems of heat transfer. International Journal of Heat and Mass Transfer 1961, 3, 293–303. [Google Scholar] [CrossRef]
  15. Armero, F.; Simo, J. A new unconditionally stable fractional step method for non-linear coupled thermomechanical problems. International Journal for numerical methods in Engineering 1992, 35, 737–766. [Google Scholar] [CrossRef]
  16. Giles, M.B. Stability analysis of numerical interface conditions in fluid–structure thermal analysis. International journal for numerical methods in fluids 1997, 25, 421–436. [Google Scholar] [CrossRef]
  17. Roe, B.; Jaiman, R.; Haselbacher, A.; Geubelle, P. Combined interface boundary condition method for coupled thermal simulations. International journal for numerical methods in fluids 2008, 57, 329–354. [Google Scholar] [CrossRef]
  18. Zhang, J.; Yang, C.; Mao, Z.S. Unsteady conjugate mass transfer from a spherical drop in simple extensional creeping flow. Chemical engineering science 2012, 79, 29–40. [Google Scholar] [CrossRef]
  19. Succi, S. The lattice Boltzmann equation: for fluid dynamics and beyond; Oxford university press, 2001.
  20. Lee, T.; Liu, L. Lattice Boltzmann simulations of micron-scale drop impact on dry surfaces. Journal of Computational Physics 2010, 229, 8045–8063. [Google Scholar] [CrossRef]
  21. Fakhari, A.; Mitchell, T.; Leonardi, C.; Bolster, D. Improved locality of the phase-field lattice Boltzmann model for immiscible fluids at high density ratios. Physical Review E 2017, 96, 053301. [Google Scholar] [CrossRef]
  22. Liang, H.; Liu, H.; Chai, Z.; Shi, B. Lattice Boltzmann method for contact-line motion of binary fluids with high density ratio. Physical Review E 2019, 99, 063306. [Google Scholar] [CrossRef]
  23. Zhang, S.; Tang, J.; Wu, H. Phase-field lattice Boltzmann model for two-phase flows with large density ratio. Physical Review E 2022, 105, 015304. [Google Scholar] [CrossRef]
  24. Safari, H.; Rahimian, M.H.; Krafczyk, M. Extended lattice Boltzmann method for numerical simulation of thermal phase change in two-phase fluid flow. Physical Review E 2013, 88, 013304. [Google Scholar] [CrossRef]
  25. Korba, D.; Wang, N.; Li, L. Accuracy of interface schemes for conjugate heat and mass transfer in the lattice Boltzmann method. International Journal of Heat and Mass Transfer 2020, 156, 119694. [Google Scholar] [CrossRef]
  26. Li, L.; Chen, C.; Mei, R.; Klausner, J.F. Conjugate heat and mass transfer in the lattice Boltzmann equation method. Phys. Rev. E 2014, 89, 043308. [Google Scholar] [CrossRef]
  27. Chen, S.; Yan, Y.; Gong, W. A simple lattice Boltzmann model for conjugate heat transfer research. International Journal of Heat and Mass Transfer 2017, 107, 862–870. [Google Scholar] [CrossRef]
  28. Hosseini, S.; Darabiha, N.; Thévenin, D. Lattice Boltzmann advection-diffusion model for conjugate heat transfer in heterogeneous media. International Journal of Heat and Mass Transfer 2019, 132, 906–919. [Google Scholar] [CrossRef]
  29. Kiani-Oshtorjani, M.; Kiani-Oshtorjani, M.; Mikkola, A.; Jalali, P. Conjugate heat transfer in isolated granular clusters with interstitial fluid using lattice Boltzmann method. International Journal of Heat and Mass Transfer 2022, 187, 122539. [Google Scholar] [CrossRef]
  30. Krüger, T.; Kusumaatmaja, H.; Kuzmin, A.; Shardt, O.; Silva, G.; Viggen, E. The Lattice Boltzmann Method: Principles and Practice; Springer International Publishing, 2017.
  31. Martins, I.T.; Alvariño, P.F.; Cabezas-Gómez, L. Dimensional lattice Boltzmann method for transport phenomena simulation without conversion to lattice units. arXiv preprint arXiv:2302.04120, arXiv:2302.04120 2023.
  32. Bhatnagar, P.L.; Gross, E.P.; Krook, M. A Model for Collision Processes in Gases. I. Small Amplitude Processes in Charged and Neutral One-Component Systems. Physical Review 1954, 94, 511–525. [Google Scholar] [CrossRef]
  33. Qian, Y.H.; D’Humieres, D.; Lalleman, P. Lattice BGK Models for Navier-Stokes Equation. Europhysics Letters 1992, 17, 479–484. [Google Scholar] [CrossRef]
  34. Guo, Z.; Shu, C. Lattice Boltzmann Method and its Applications in Engineering; World Scientific Publishing Co. Pte. Ltd., 2013.
  35. Guo, Z.; Zheng, C.; Shi, B. Discrete lattice effects on the forcing term in the lattice Boltzmann method. Physical Review E 2002, 65, 046308. [Google Scholar] [CrossRef] [PubMed]
  36. Chapman, S.; Cowling, T.G. The Mathematical Theory of Non-uniform Gases, 2nd ed.; Cambridge University Press, 1952.
  37. Klein, S.A. EES – Engineering Equation Solver Version 11.444 (2022-09-29) 2022. Computer Software.
  38. Rihab, H.; Moudhaffar, N.; Sassi, B.N.; Patrick, P. Enthalpic lattice Boltzmann formulation for unsteady heat conduction in heterogeneous media. International Journal of Heat and Mass Transfer 2016, 100, 728–736. [Google Scholar] [CrossRef]
  39. Bird, R.B.; Stewart, W.E.; Lightfoot, E.N. Transport Phenomena, 2nd ed.; John Wiley & Sons, Inc, 2002.
  40. Seta, T. Implicit temperature correction-based immersed boundary-thermal lattice Boltzmannmethod for the simulation of natural convection. Physical Review E 2013, 87, 063304. [Google Scholar] [CrossRef]
  41. Karani, H.; Huber, C. Lattice Boltzmann formulation for conjugate heat transfer in heterogeneous media. Phys. Rev. E 2015, 91, 023304–10. [Google Scholar] [CrossRef]
  42. Chai, Z.; Zhao, T.S. Nonequilibrium scheme for computing the flux of the convection-diffusion equation in theframework of the lattice Boltzmann method. Phys. Rev. E 2014, 90, 013305. [Google Scholar] [CrossRef]
  43. Sun, Y.; Wichman, I.S. On transient heat conduction in a one-dimensional composite slab. International Journal of Heat and Mass Transfer 2004, 47, 1555–1559. [Google Scholar] [CrossRef]
  44. Cheikh, N.B.; Beya, B.B.; Lili, T. Influence of thermal boundary conditions on natural convection in a square enclosure partially heated from below. International communications in heat and mass transfer 2007, 34, 369–379. [Google Scholar] [CrossRef]
  45. Martins, I.T.; Matsuda, V.A.; Cabezas-Gómez, L. A new Neumann boundary condition scheme for the thermal lattice Boltzmann method. Preprint submited to the Journal: International Communications in Heat and Mass Transfer in 2023.
  46. Moreira, D.C.; Nascimento, V.; Ribatski, G.; Kandlikar, S. Combining liquid inertia and evaporation momentum forces to achieve flow boiling inversion and performance enhancement in asymmetric Dual V-groove microchannels. International Journal of Heat and Mass Transfer 2022, 194, 123009. [Google Scholar] [CrossRef]
  47. Kakac, S.; Bergles, A.; Mayinger, F.; Yuncu, H. Heat transfer enhancement of heat exchangers. Drying Technology 2000, 18, 837–838. [Google Scholar] [CrossRef]
  48. Lienhard, I.V.; Lienhard, V.J.H. A Heat Transfer Textbook, 5th ed.; Phlogiston Press: Cambridge, MA, 2020. [Google Scholar]
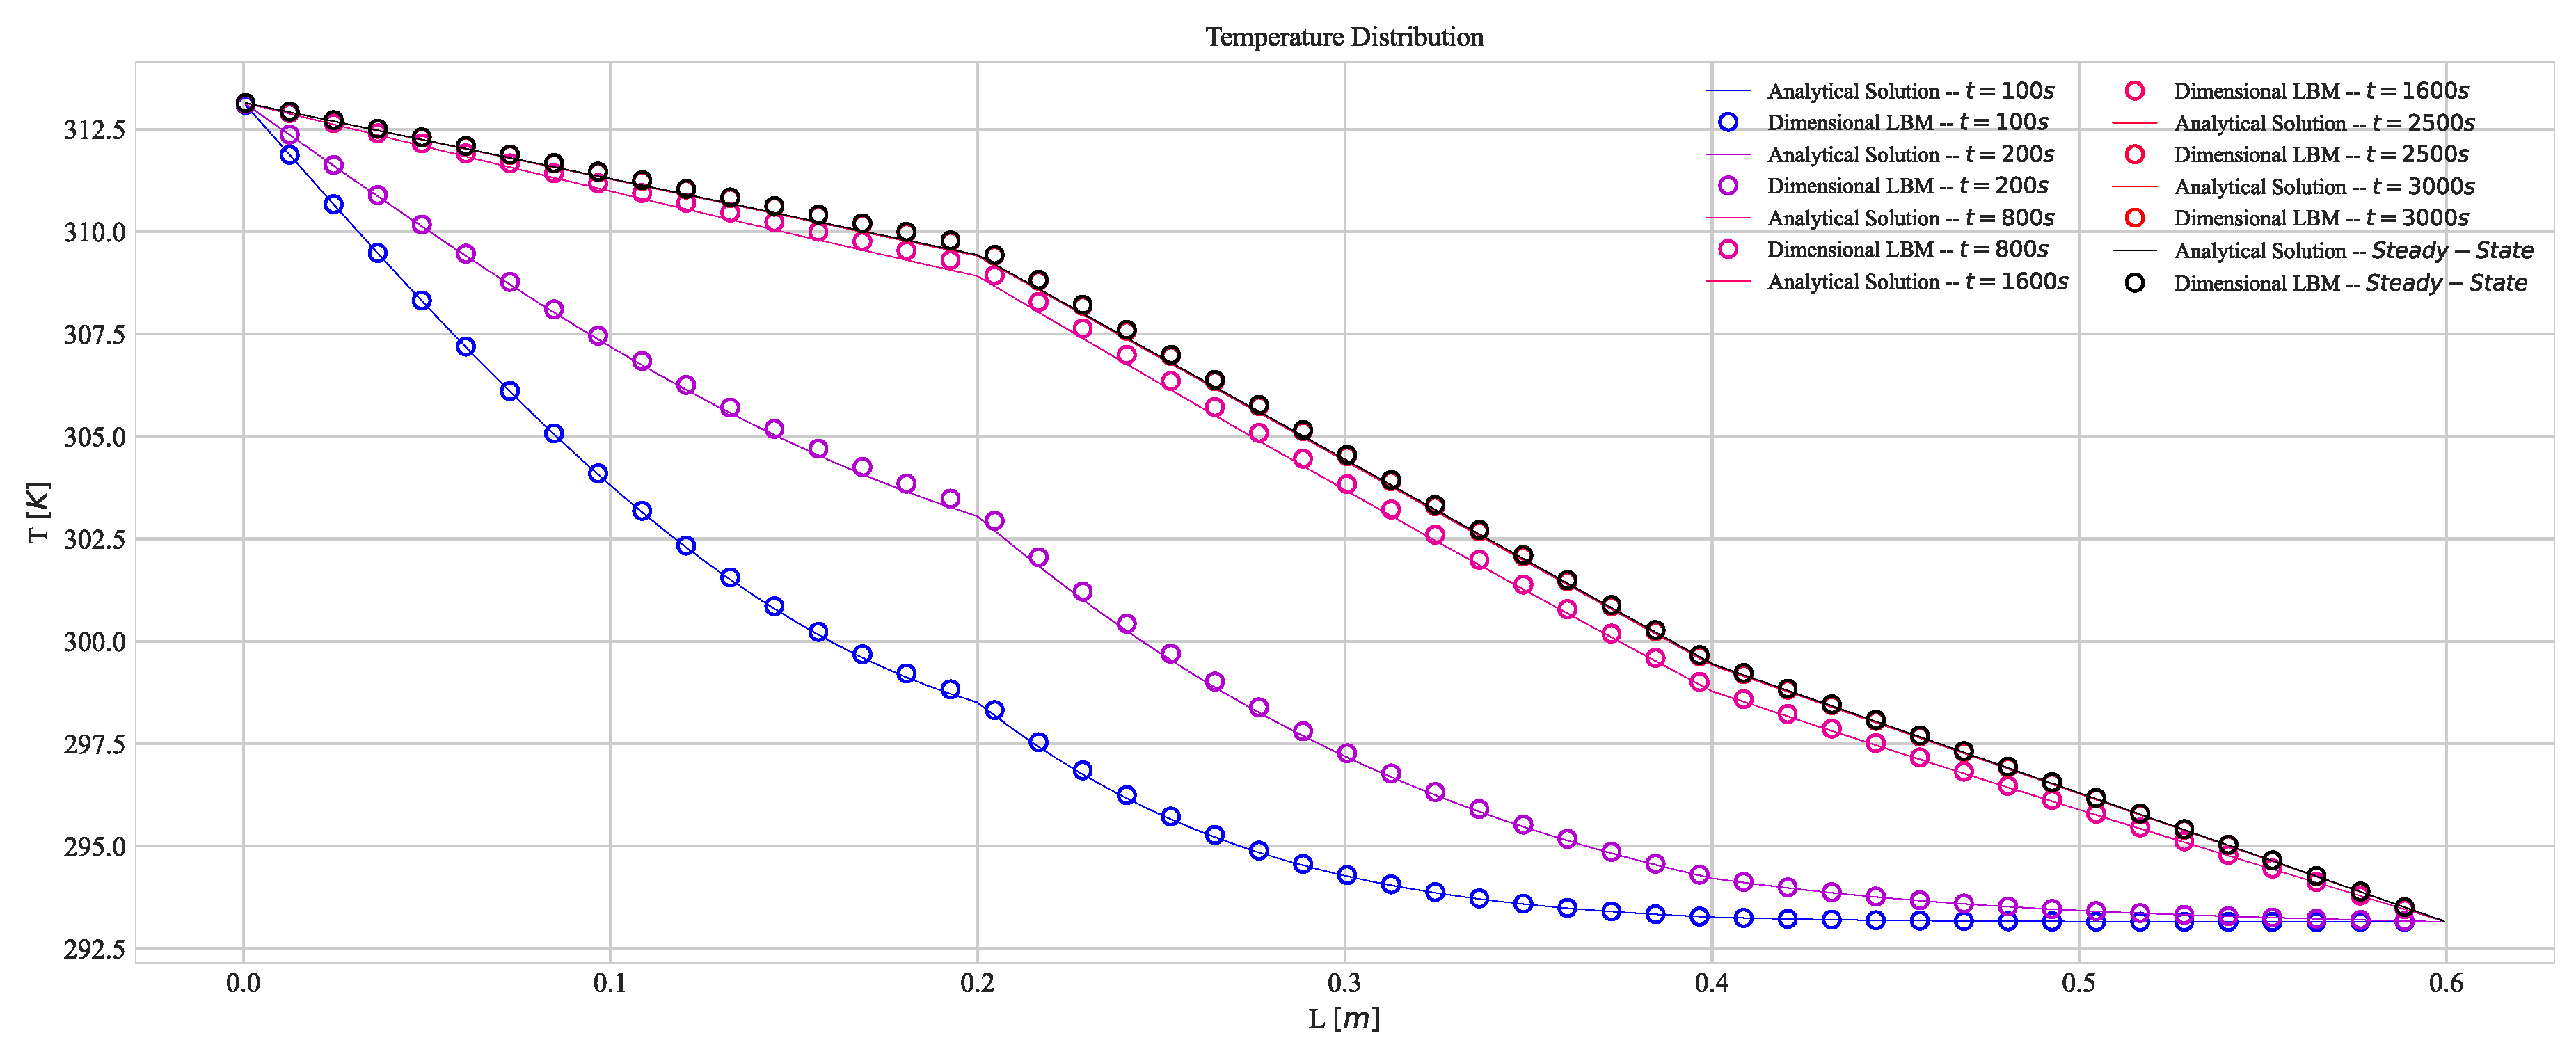
Figure 1. Transient Solid Heat Diffusion: Temperature distribution along the x-direction for various times.
Preprints 103637 g001
Figure 2. Transient results for heat convection-diffusion at t = 0.75 Γ : a) Temperature distribution; b) Temperature profiles along different x-axis cuts.
Preprints 103637 g002
Figure 3. Natural convection benchmark problem considering conjugate heat transfer.
Preprints 103637 g003
Figure 4. Results for the natural convection benchmark test: a) Temperature distribution; b) Streamlines.
Preprints 103637 g004
Figure 5. Geometry scheme and dimensions
Preprints 103637 g005
Figure 6. Q ˙ w a l l = 1 · 10 5 [ W / m 2 ] : a) N u L e q ¯ ; b) Q ˙ ¯ b a s e ; c) T a v g , b a s e T c .
Preprints 103637 g006
Figure 7. Q ˙ w a l l = 1 · 10 6 [ W / m 2 ] : a) N u L e q ¯ ; b) Q ˙ ¯ b a s e ; c) T a v g , b a s e T c .
Preprints 103637 g007
Figure 8. Results for Q w a l l = 1 · 10 5 at t = 0.25 s : a) Temperature distribution; b) Streamlines.
Preprints 103637 g008
Figure 9. Results for Q w a l l = 1 · 10 6 at t = 0.05 s : a) Temperature distribution; b) Streamlines.
Preprints 103637 g009
Figure 10. Vorticity for Q w a l l = 1 · 10 5 : a) t = 0.25 s ; b) t = 1.00 s ; c) t = 2.50 s .
Preprints 103637 g010
Figure 11. Surface effectiveness evolution: a) Q ˙ w a l l = 1 · 10 5 [ W / m 2 ] ; b) Q ˙ w a l l = 1 · 10 6 [ W / m 2 ] .
Preprints 103637 g011
Figure 12. Average Nusselt number time evolution: a) T w a l l = 30 C ; b) T w a l l = 40 C ; c) T w a l l = 60 C ; d) T w a l l = 80 C ; e) T w a l l = 90 C .
Preprints 103637 g012
Figure 13. Average heat transfer rate time evolution: a) T w a l l = 30 C ; b) T w a l l = 40 C ; c) T w a l l = 60 C ; d) T w a l l = 80 C ; e) T w a l l = 90 C .
Preprints 103637 g013
Figure 14. Average temperature difference at the base: a) T w a l l = 30 C ; b) T w a l l = 40 C ; c) T w a l l = 60 C ; d) T w a l l = 80 C ; e) T w a l l = 90 C .
Preprints 103637 g014
Figure 15. Results for T w a l l = 80 C at t = 2.50 s : a) Temperature distribution; b) Streamlines.
Preprints 103637 g015
Figure 16. Results for T w a l l = 80 C : a) Temperature distribution; b) Streamlines.
Preprints 103637 g016
Figure 17. Heat Transfer Rate at the fluid solid interface: a) T w a l l = 40 C ; b) T w a l l = 60 C ; c) T w a l l = 80 C .
Preprints 103637 g017
Figure 18. Geometry effectiveness.
Preprints 103637 g018
Table 1. Total Errors for the convection-diffusion problem in different times.
Preprints 103637 i002
Table 2. Global errors for the convection-diffusion problem in different times.
Preprints 103637 i003
Table 3. Nusselt Number errors for a natural convection problem.
Reference Nusselt Number :  N u = 3.80
Δ x · 10 5 [m] N u ¯ Errors N u ¯ [%]
2.500 3.72 2.17
1.250 3.75 1.39
0.625 3.80 0.07
Table 5. Geometry comparison.
T w a l l = 30   ° C R a L = 1.5 · 10 3 T w a l l = 40   ° C R a L = 4.1 · 10 3 T w a l l = 60   ° C R a L = 1.2 · 10 4 T w a l l = 80   ° C R a L = 2.4 · 10 4 T w a l l = 90   ° C R a L = 2.6 · 10 4
θ ° 0 30 45 60 0 30 45 60 0 30 45 60 0 30 45 60 0 30 45 60
N u ¯ L e q 1.03 0.94 0.84 0.8 1.03 0.94 0.84 0.8 1.86 1.74 1.55 1.43 2.75 2.56 2.28 2.1 3.04 2.84 2.52 2.32
Q ¯ [ k W m 2 ] 3.14 3.01 2.89 2.63 6.36 6.1 5.86 5.33 23.29 23.0 21.97 19.41 52.46 51.86 49.4 43.75 68.25 67.46 64.25 56.83
Disclaimer/Publisher’s Note: The statements, opinions and data contained in all publications are solely those of the individual author(s) and contributor(s) and not of MDPI and/or the editor(s). MDPI and/or the editor(s) disclaim responsibility for any injury to people or property resulting from any ideas, methods, instructions or products referred to in the content.
Copyright: This open access article is published under a Creative Commons CC BY 4.0 license, which permit the free download, distribution, and reuse, provided that the author and preprint are cited in any reuse.
Prerpints.org logo

Preprints.org is a free preprint server supported by MDPI in Basel, Switzerland.

Subscribe

© 2024 MDPI (Basel, Switzerland) unless otherwise stated