Preprint
Article

Quasi-solid Composite Electrolytes of Poly-(Dioxolane) & Garnet LLZO Nanofibers Enable High Energy Efficiency Lithium-Metal Batteries

Altmetrics

Downloads

167

Views

136

Comments

0

This version is not peer-reviewed

Submitted:

10 April 2024

Posted:

11 April 2024

You are already at the latest version

Alerts
Abstract
Quasi-solid composited electrolytes were produced by LiFSI initiated polymerized poly-(Dioxolane) (PDOL) with garnet-LLZO (Li7La2Zr3O12) nanofibers and used in lithium-metal batteries. Linear sweep voltammetry shows that the initial oxidation voltage of 4.6 V for Gel-10% (G10, 10% wt. LLZO in PDOL) vs Li/Li+. EIS test of stainless steel// stainless steel symmetric cells for Gel-1% (G1), Gel-5% (G5) and Gel-10% (G10) show ion conductivity (5*10-5 S/cm). Li/G10/Li symmetric cells have stable stripping-plating cycling performance over 1300 hours continuously with the current density of 0.1 mA/cm2 at 25 oC, indicating a good interface contact and stable lithium-ion transport pathway through the composite electrolytes. LFP/G10/Li batteries have stable charge-discharge plateau, low polarization voltage of 0.07-volt, energy efficiency of 95% and coulombic efficiency of ~99% at current density of 26.3 mA/g at 25 oC for over 100 cycles.
Keywords: 
Subject: Chemistry and Materials Science  -   Electrochemistry

1. Introduction

Li-ion batteries have powdered the whole mankind for decades. It enables portable devices, such as cellphones, tablets, laptops, and electrical vehicles to function. While the liquid electrolyte [1,2,3] lithium-ion batteries industry has been operated for a long time, the batteries related incidents happen frequently [4], such as EV fires [3,5] and batteries explosions [6,7], which cause imminent danger to the users and their property. The solid [3] and quasi-solid electrolytes [1,3,8,9] have the potential to solve this fire problem due to their non-volatile and fire-retardant nature [7], and limit electrolytes mass needed for each battery [7].
Energy density increasement has been another advantage of solid and quasi-solid electrolyte [3]. 100 mg quasi-solid or solid electrolyte is needed for 15 mm diameter coin cell to transport lithium-ion back and forth from cathodes to anodes. Li metal anode can further increase the battery discharge-charge voltage plateau. Putting these together, the energy density can be increased. Lithium metal is thought to be the next generations high-capacity anode and the holy-grail in lithium battery due to its -3.045-volt low potentials (vs SHE) and high theoretically capacity of 3861 mAh/g [4,10]. But lithium dendrites can penetrate through electrolytes and short the cell [5], which holds back their application [10]. High shear modulus (twice shear modulus of metallic Li ~3.4 to 4.2 GPa) solid electrolytes [4,11] have been suggested to be able to impress lithium dendrites growth [2,12]. However, inorganic cubic-LLZO [5,13] electrolyte pellet with a shear modulus of ~55 GPa was reported to have dendrite growth issues [4,11,13,14]. The mechanical method to impress lithium dendrites seems failed because of the surface defects on solid electrolytes [11], and more efforts should be put into the study of lithium-metal nucleation and growth-plating mechanism [10,15,16,17]. Special focus should be put onto the very surface of lithium metal [10]. Some report that the lithium metal surface strain has vital influence on dendrites growth. Current collectors of different morphologies have been designed for uniform lithium metal deposition and inhibition of dendrite growth [10,18,19,20]. In our case, quasi-solid composite electrolyte Gel-10 can glue Li-metal anode and cathode together, show great affinity to lithium metal, form intimate contact and low resistance interface [4,8], provide uniform Li ion flux and act as one homogeneous Li-ion conduction layer [10,21], which work as one artificial solid-electrolyte-interface (SEI) layer on Lithium metal anodes to prevent lithium dendrite growth.
Besides having high modulus, inorganic electrolytes [21,22], such as garnet-LLZO [23], have the advantage of high thermal-chemical-electrochemical stability [7,24], high Li-ion conductivity [25], and large electrochemical stability windows [6]. Polymeric electrolytes [21,23] are intensely researched because of their elastic properties [23], easily tunable chemical structures, easy processability, and most of all, low electron conductivity. Composite electrolytes [6,21,25,26] can exploit the strength of polymeric and inorganic electrolytes and have been the focus for the realization of lithium metal batteries. Quasi-solid composite [7,25,27] electrolytes can form conformal contact [7,27] with the cathode and anode, have the elasticity, high lithium-ion conductivity, and larger electrochemical window [7].
In this report, quasi-solid composite electrolytes of DOL-poly(dioxolane) with different cubic-LLZO [21,25] content are developed. The conductivity is tested to be 0.05 mS/cm at 25 oC for 10 % c-LLZO in PDOL composite (G10). Li/G10/Li symmetric cells can be plating and stripping stably for 1300 hours at 0.1 mAh/cm2 with charge-discharge capacity of 0.1 mAh/cm2. The LFP/G10/Li cell can be charged and discharged for over 100 cycles with coulombic efficiency of ~99% and a stabilized specific capacity of 144 mAh/g at current density of 26.3 mA/g at 25 oC.

2. Materials and Methods

Lithium bis(fluorosulfonyl)imide (LiFSI) is from Combic-Blocks (95%, CAS17611-11-3, Batch:B89243); Dioxolane (DOL, 99.5%) is from thermal scientific; Lithium nitrate (LiNO3, 99.99%), lanthanum nitrate hexahydrate (La(NO3)36H2O, 99.99%), Zirconium propoxide (Zr(OCH2CH2CH3)4, 70 wt % in 1-propanol), dimethylformamide (DMF) (HLPC grade, 99.9%), polyvinylpyrrolidone (PVP, Mw=1300000), acetic acid (99%), 1-methyl-2-pyrrolidinone (NMP, 99%) are purchased from the Sigma Aldrich; PVDF (99.6%), Copper foil (99.9%), Aluminum foil (99.5%), Aluminum tab, Aluminum-laminated-film for pouch cell case, Lithium iron phosphate (particle size 1.5 µm) and Super P conductive carbon black are from MSE Supplies. Celgard 2320 separator is from Cambridge Energy Solutions.
Sintering was done in OmegaLux LMF-3550 furnace placed in fume hood. Batteries test is performed on Arbin batteries tester at 25 oC unless notified otherwise. Linear sweep voltammetry (LSV) is carried out on Arbin batteries tester with voltage scanning rate of 1 mV/s; Li//Li 10 mV polarization and stripping-plating were performed at 25 oC and Li-ion transference number is calculated by tLi+1=Is/Io, where Is is steady-state current and Io is initial state current. Electrochemical impedance spectra (EIS) are collected with Solartron 1260 IMPEDANCE/gain-phase analyzer with a SI 1287 electrochemical interface; SEM image is recorded using DualBeam Helios 5 CX from ThermoFisher Scientific; Infrared spectra are collected using Shimadzu IRAffinity-1S FTIR and the data were collected from 650 cm-1 to 4000 cm-1 with a resolution of 4 cm-1 at 25 oC. XRD test is conducted on EMPYREAN X-ray diffractometer from Malvern PANalytical using Co Ka λ=1.78899 Å at 25 oC.

3. Experiment

3.1. Ceramic Cubic-LLZO Nanofiber Preparation [5,14,21,24,28]

Lithium nitrate (7.7 mmol, 530.9 mg), La(NO3)36H2O (3 mmol, 1.299 mg), Zr(OCH2CH2CH3)4 (2 mmol), 10 ml DMF and 2 ml acetic acid are mixed in one 25 ml glass vial. After stirring for 12 hours, 12 ml 15% PVP solution was added into the clear solution. Then the mixture was stirring for another 12 hours. The transparent solution was put into a syringe capped with a stainless-steel needle. After that, the electrospinning was conducted under the voltage of 15 kilovolt. The aluminum-foil covered drum was grounded and has 15 cm distance to the syringe needle. Drum rotation speed is 150 rpm and the solution feeding rate to the needle is set as 0.06 mL/h. The related humility and temperature in electrospinning room are controlled around 20% RH and 25 oC, respectively [29].
The as-spun nanofiber mat was peeled off from the drum aluminum-collector and dried under vacuum at 80 oC overnight. Then sintering process was done to as-spun nanofiber and set as 2 oC per minute temperature ramp from 25 oC to 700 oC. The temperature was hold at 700 oC for 3 hours. After that, the furnace is allowed to cool down to room temperature [30]. The c-LLZO is collected and stored in Argon glove box afterwards.

3.2. Poly(dioxolane) & c-LLZO Nanofiber Composite Preparation and Battery Assembly [21]

LiFSI (1 mmol, 187.1 mg) and DOL liquid (1 ml, 1.06 g) were put into one 8 ml glass vial and mixed together; then different masses of c-LLZO nanofibers (106 mg, 53 mg, 10.6 mg, 0 mg) were added into the liquid mixture and stirred to make well-mixed 10%, 5%, 1% and 0% c-LLZO composite electrolyte respectively based on DOL weight used (composite electrolytes noted as G10, G5, G1 and G0); For the assembly of Li/G1-G10/Li symmetric cells, Li/G1-G10/Stainless steel (SS) cells and SS/G1-G10/SS symmetric cells, 45 mg composite electrolyte was coated onto two pieces of lithium or stainless steel discs. Then the disc electrodes were glued together with one layer of Celgard 2320 separator in the middle to prevent direct contact and short circuit between electrodes. LFP/G1-G10/Li full-cells were assembled in similar way.
To cast cathodes, lithium iron phosphate (LFP, 800 mg), Super-P (100 mg), PVDF (2000 g, 5% wt in NMP solvent) and NMP solvent (1.0 g) were mixed to form uniform slurry. The slurry was coated onto aluminum foil using one doctor blade, and the cathode thickness (active material loading) could be tuned by solid-content, coating speed and doctor blade gap. LFP loading was 2.15 mg/cm2. The coated cathode was vacuum dried under 80 oC for 24 hours and pouched into circular-cathode discs of 15 mm in diameter.

3.3. Battery Test Schedules

The constant current (CC) method is used to charge and discharge LFP//Li full cell. The constant current density is controlled, and the charge-discharge limiting voltage range is set between 4.2 volt and 2.5 volt. For Li//Li symmetric cells, the constant current was used to plate and stripe lithium for one hour at current density of 0.1 mA/cm2. EIS spectra were recorded on SS//SS and Li//Li symmetric cells within the frequency range of 0.1 Hz to 30 MHz at 25 oC. LSV curves were tested on SS//Li asymmetric cells with stainless steel as the working electrode. All tests were performed at 25 oC except indicated otherwise. The cell capacity and energy density are calculated based on Lithium iron phosphate loading.

4. Results and Discussion

4.1. PDOL Preparation [8,31,32,33,34,35,36]
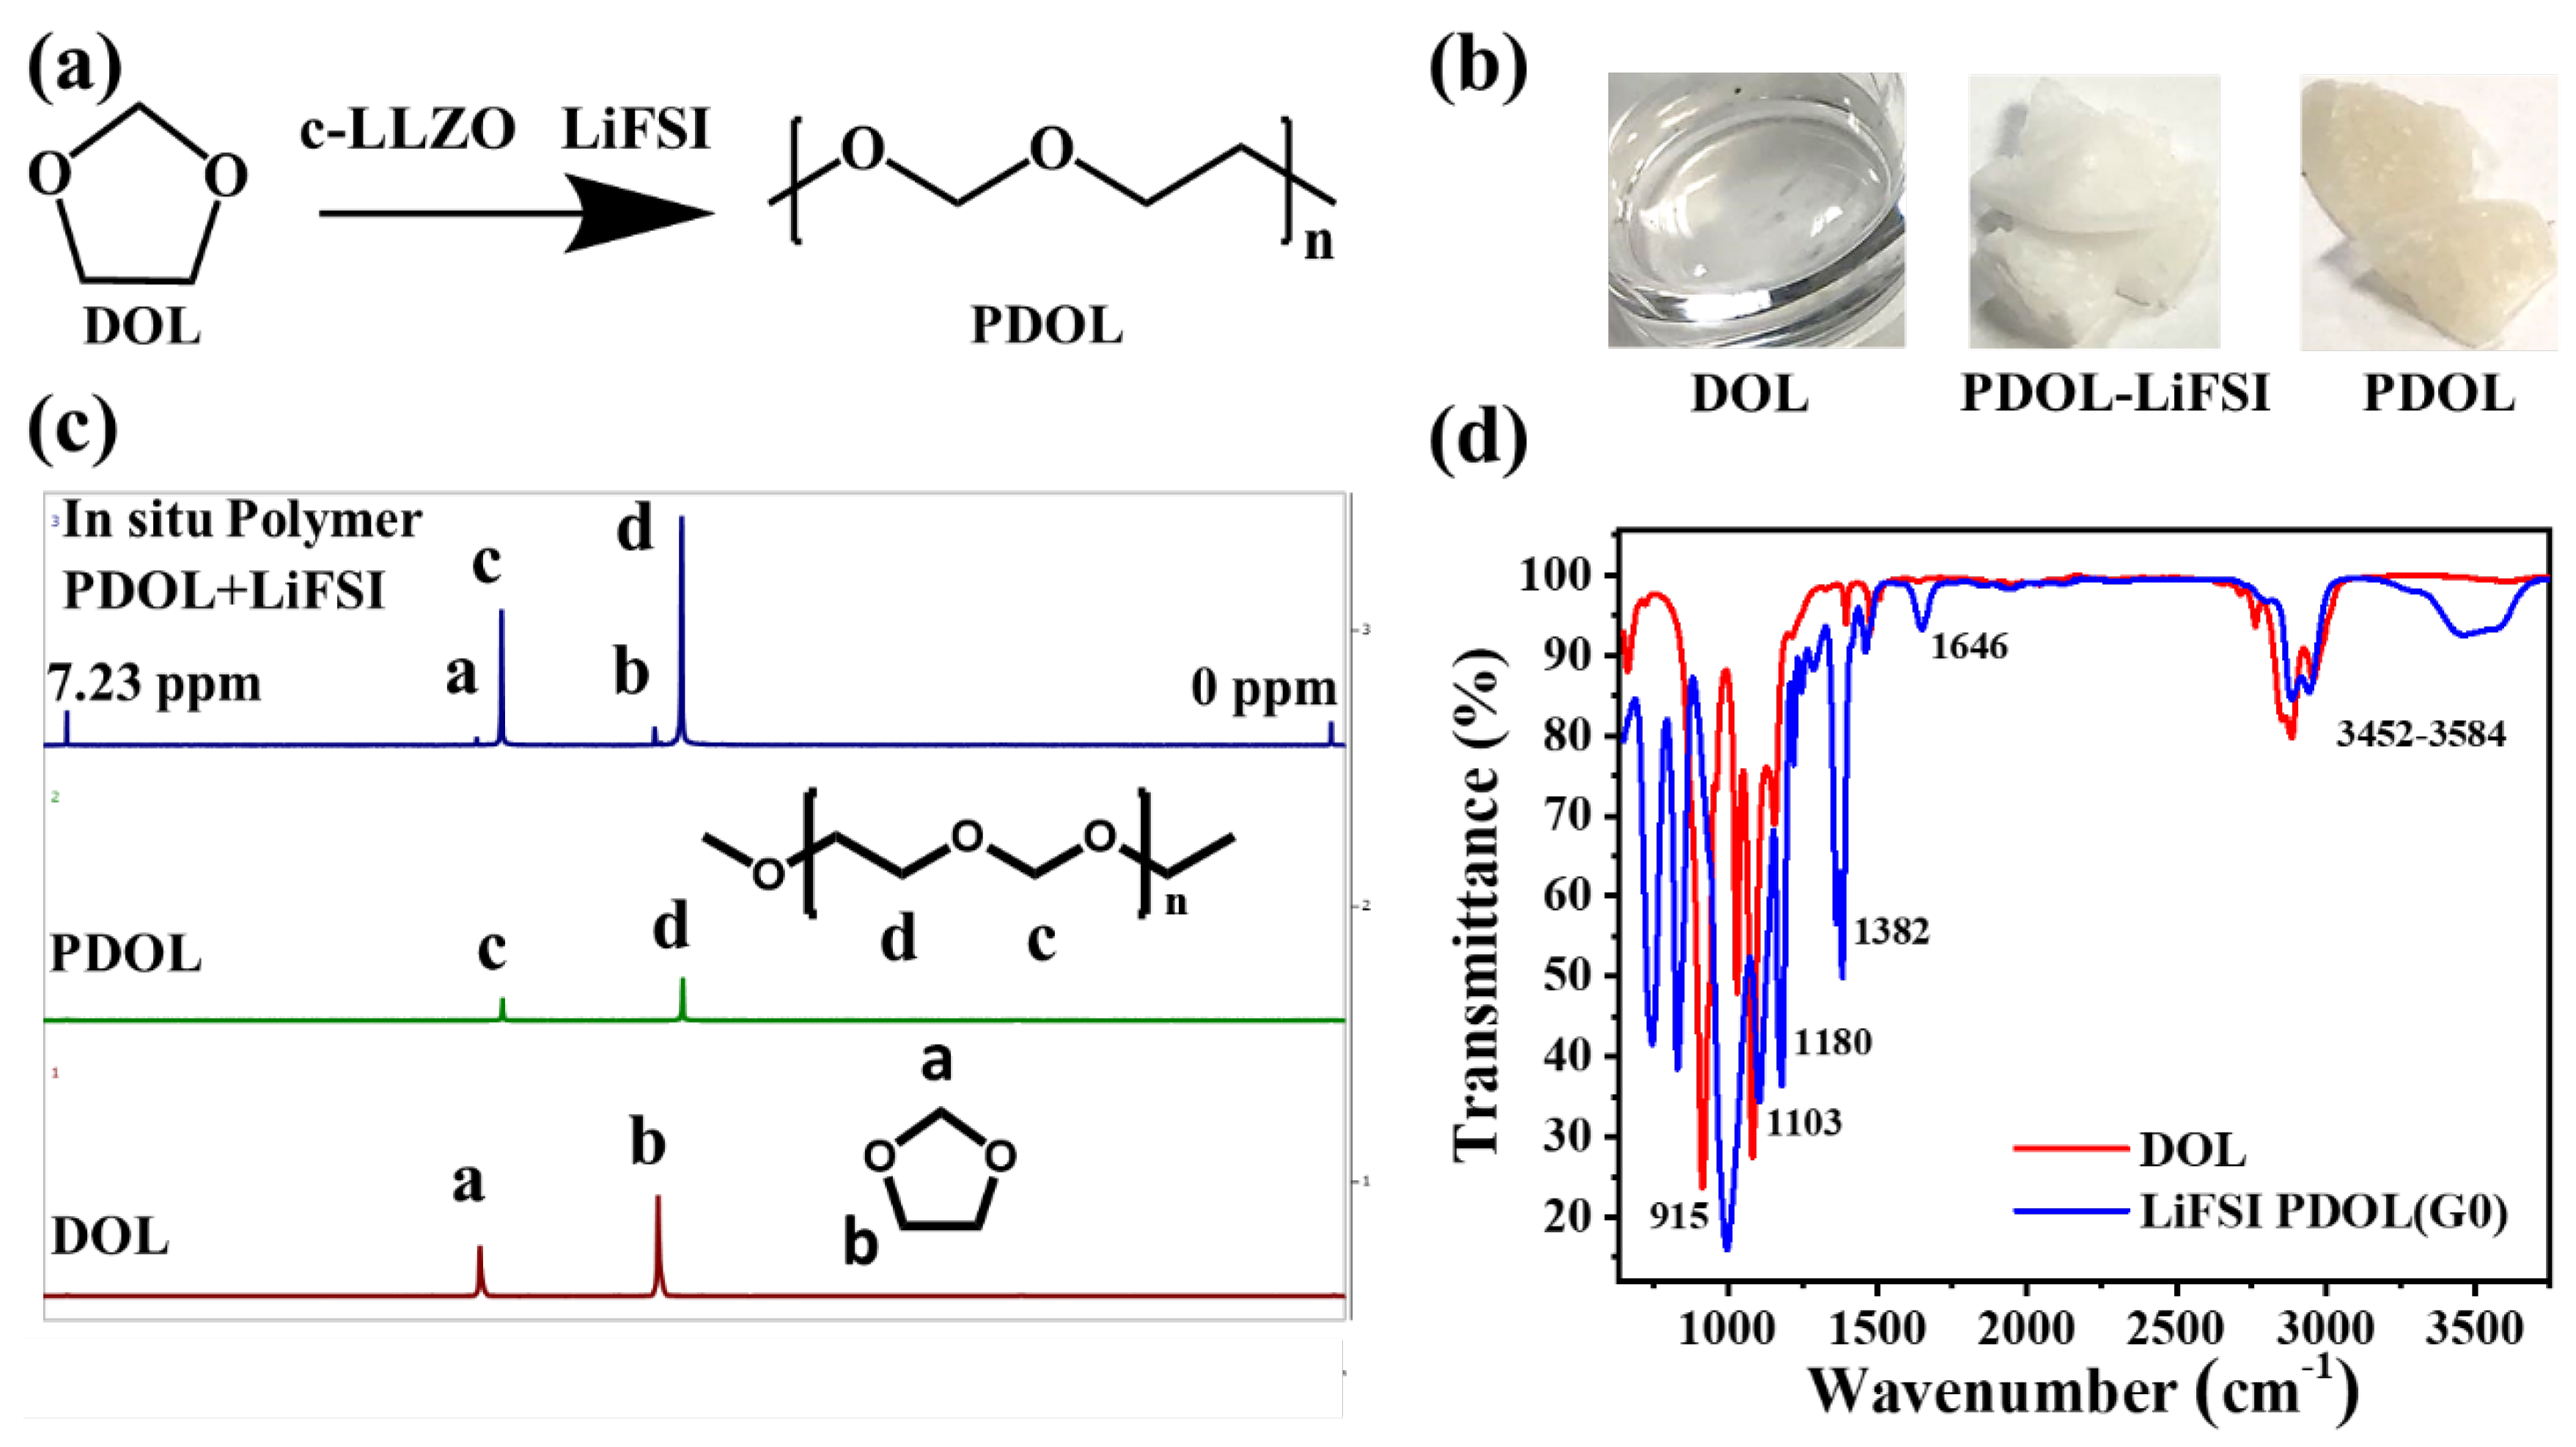
DOL was polymerized by adding 1 mmol of LiFSI salt into 1 ml DOL [8,37]. The chemical synthesis scheme is shown as in Figure 1a. Figure 1b is the optical pictures of DOL monomer liquid, PDOL-LiFSI mixture and purified PDOL polymer. The liquid monomer would polymerize in 1 hour after adding in 1mmol LiFSI salt and further change color from transparent-solid to white-solid in one week due to crystallization of PDOL, which is confirmed by XRD pattern of this sample (Figure 3d G0). Purified PDOL has the highest diffraction peak (Figure 3d PDOL). The purified PDOL shows a gray-white color (the right one of Figure 1b) due to higher crystallinity than that of PDOL-LiFSI sample (the middle one of Figure 1b). By adding c-LLZO before polymerization process ends, composite electrolytes (G1, G5, G10) can be produced as well. 1H-NMR spectra of different samples are shown in Figure 1c. DOL spectrum is at the bottom of Figure 1c, in which the singlet peak at 4.91 ppm is assigned to 2 hydrogen atoms of methylene group [36] between two oxygen atoms and the singlet peak at 3.88 ppm is assigned to 4 hydrogen atoms of ethylene group [36] in DOL [35]. The integral ratio of these two peaks should be 1/2 and calculate to be 1/2.08. 1H-NMR spectrum of purifies PDOL [33] is in the middle of Figure 1c. Methylene hydrogens and ethylene hydrogens in PDOL have singlet peaks at chemical shift of 4.77 ppm and 3.73 ppm [35,36]. Again, the integrals ratio of these two peaks should be 1/2 as well and calculated to be 1 to 1.98, which confirm the successful polymerization of DOL (PDOL produced). Compared to the hydrogen chemical shifts in DOL monomer, these ones in PDOL show at lower ppm value and up-field shifts, which indicate a higher shielding effect and denser electron cloud around hydrogen atoms in PDOL than that in DOL. The top spectrum in Figure 1c is 1H NMR spectrum of as-polymerized sample of PDOL with LiFSI, which includes peaks of DOL and PDOL. By calculating the methylene hydrogen peaks integral ratio of PDOL to that of DOL in G0 1H NMR spectra, one can get conversion ratio of DOL to PDOL during this polymerization process, which is calculated to be 97%.
Figure 1. Composite electrolyte preparation scheme (a); optical image of DOL monomer, PDOL with LiFSI and purified PDOL polymer (b); 1H NMR spectra of DOL monomer, PDOL with LiFSI and purified PDOL polymer (c); InfraRed spectra of DOL monomer and PDOL-1M LiFSI (G0) (d).
Preprints 103640 g001
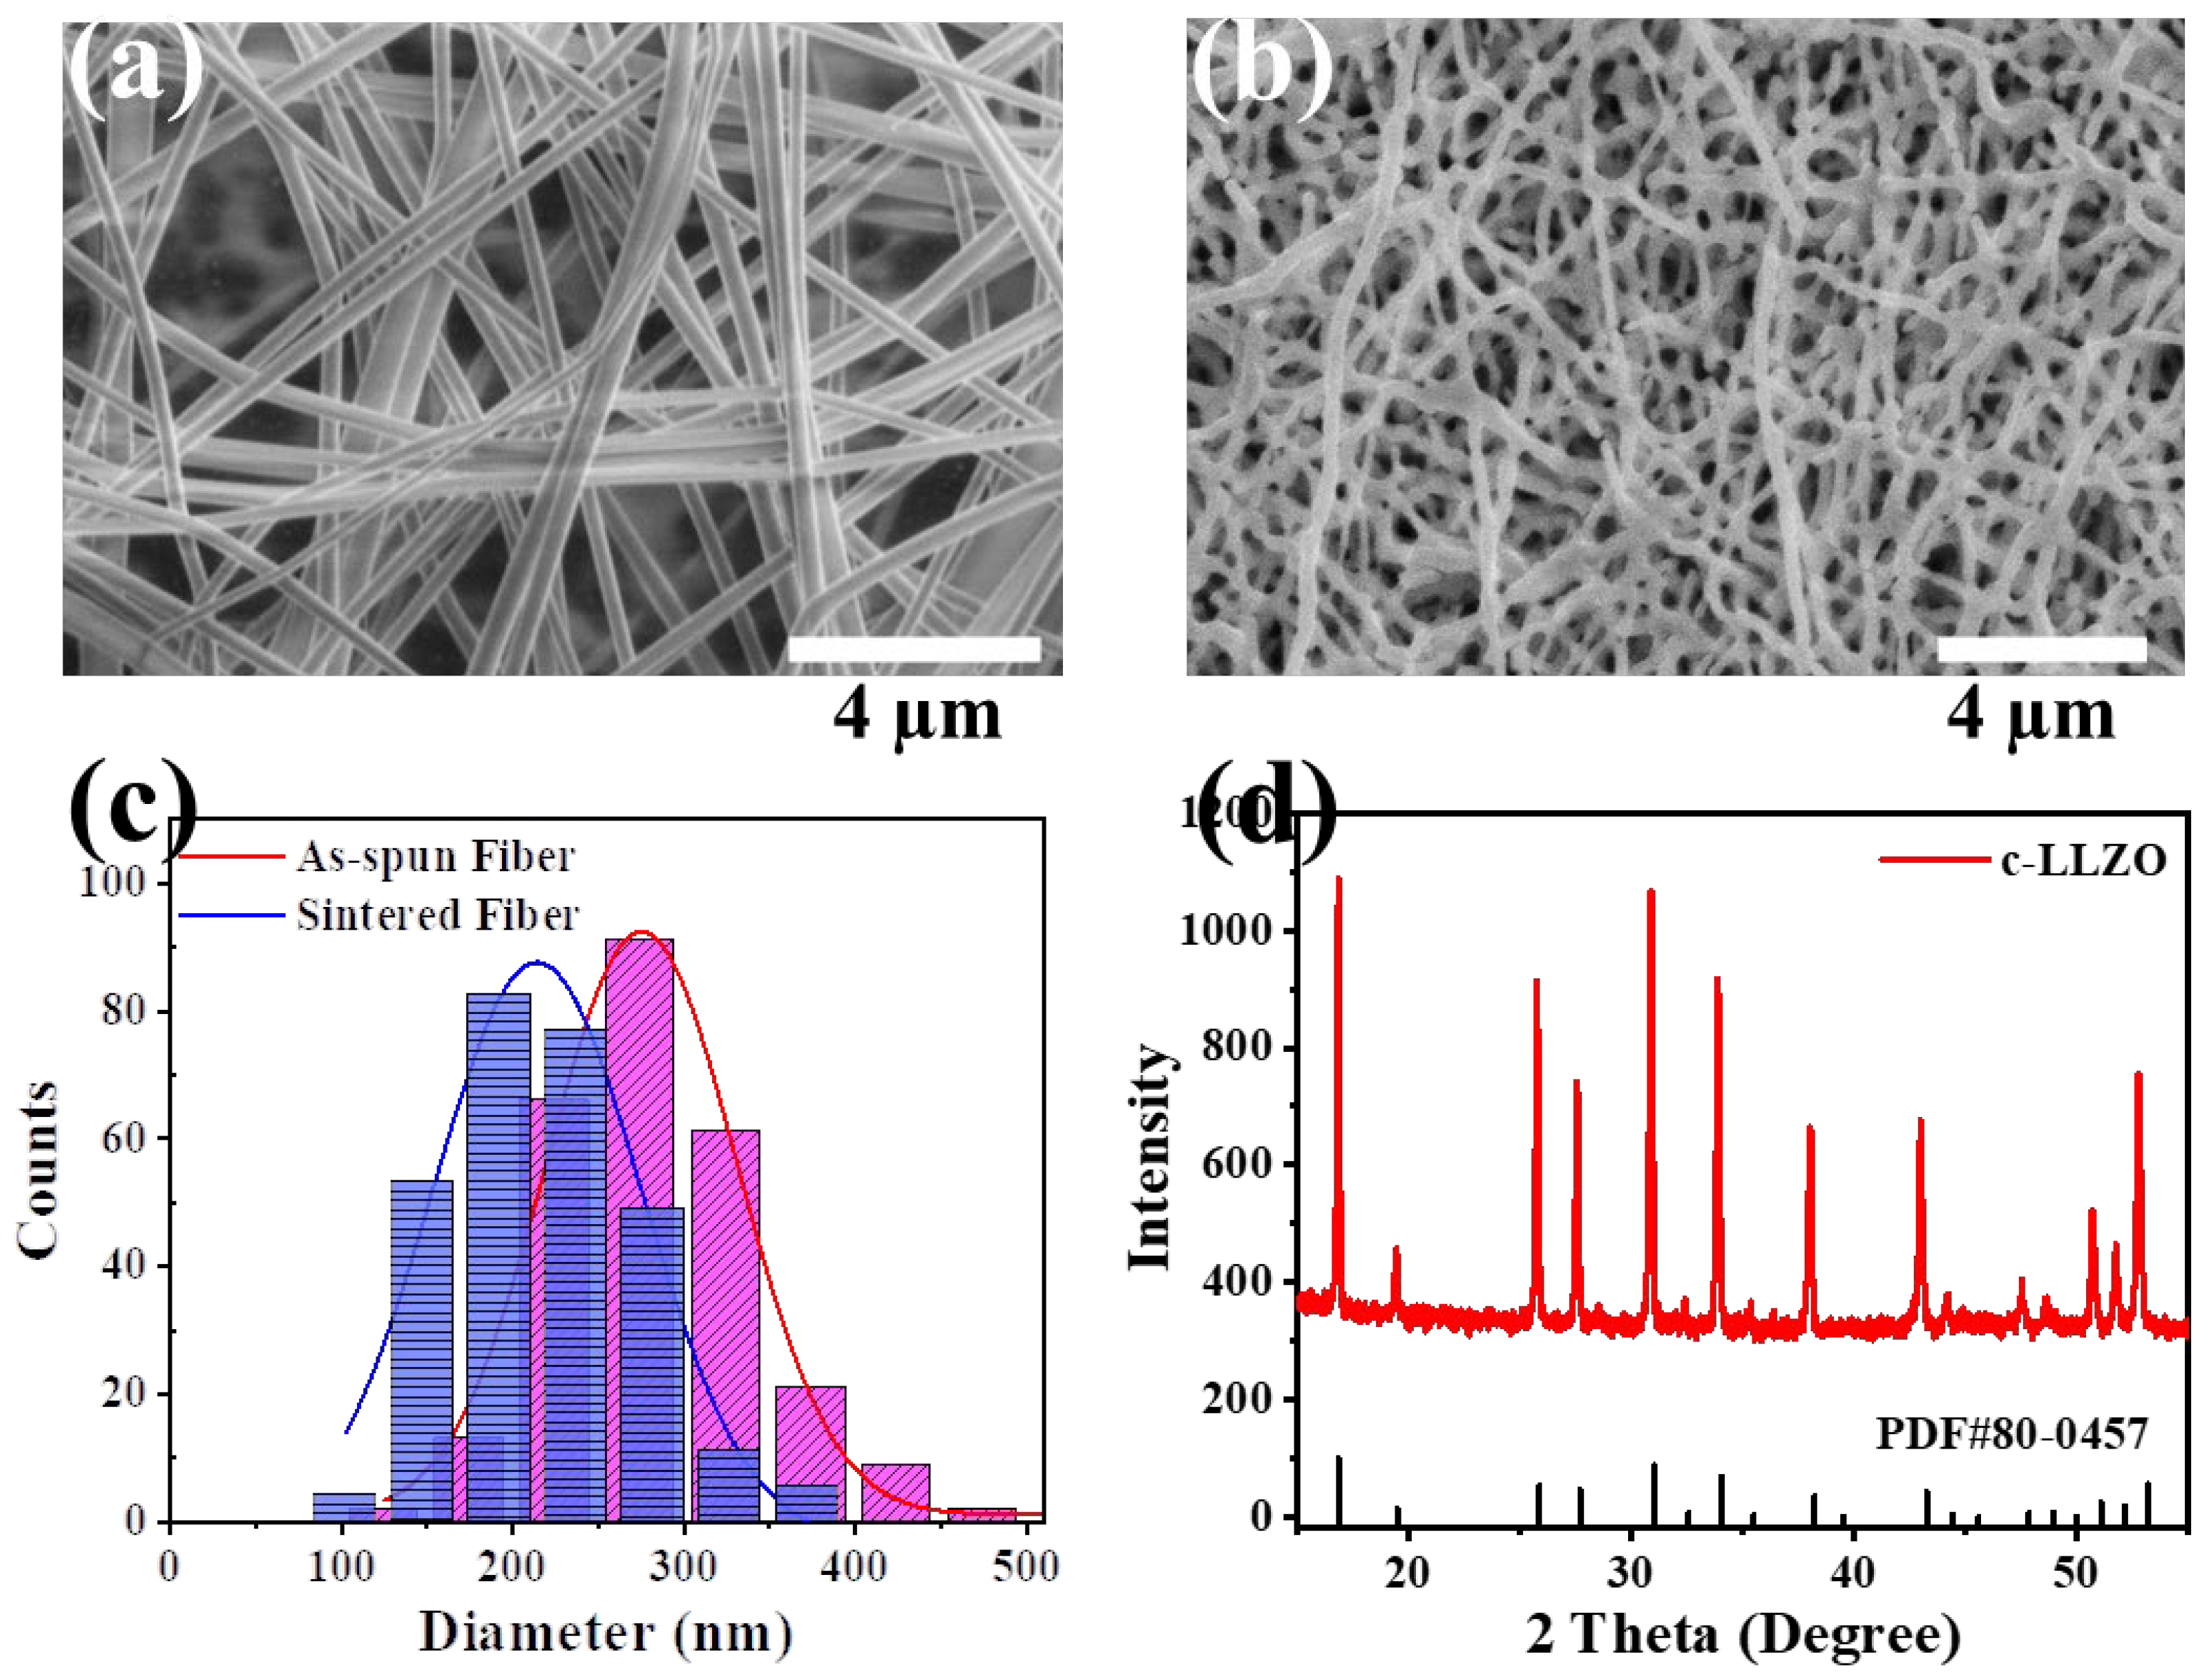
Figure 2. SEM images of as-spun c-LLZO nanofiber-precursor (a) and c-LLZO nanofiber after sintering (b); Diameter distribution of as-spun c-LLZO precursor-nanofiber and c-LLZO nanofiber after sintering (c); XRD diffraction pattern of PDF (#80-0457) standard card (d).
Preprints 103640 g002
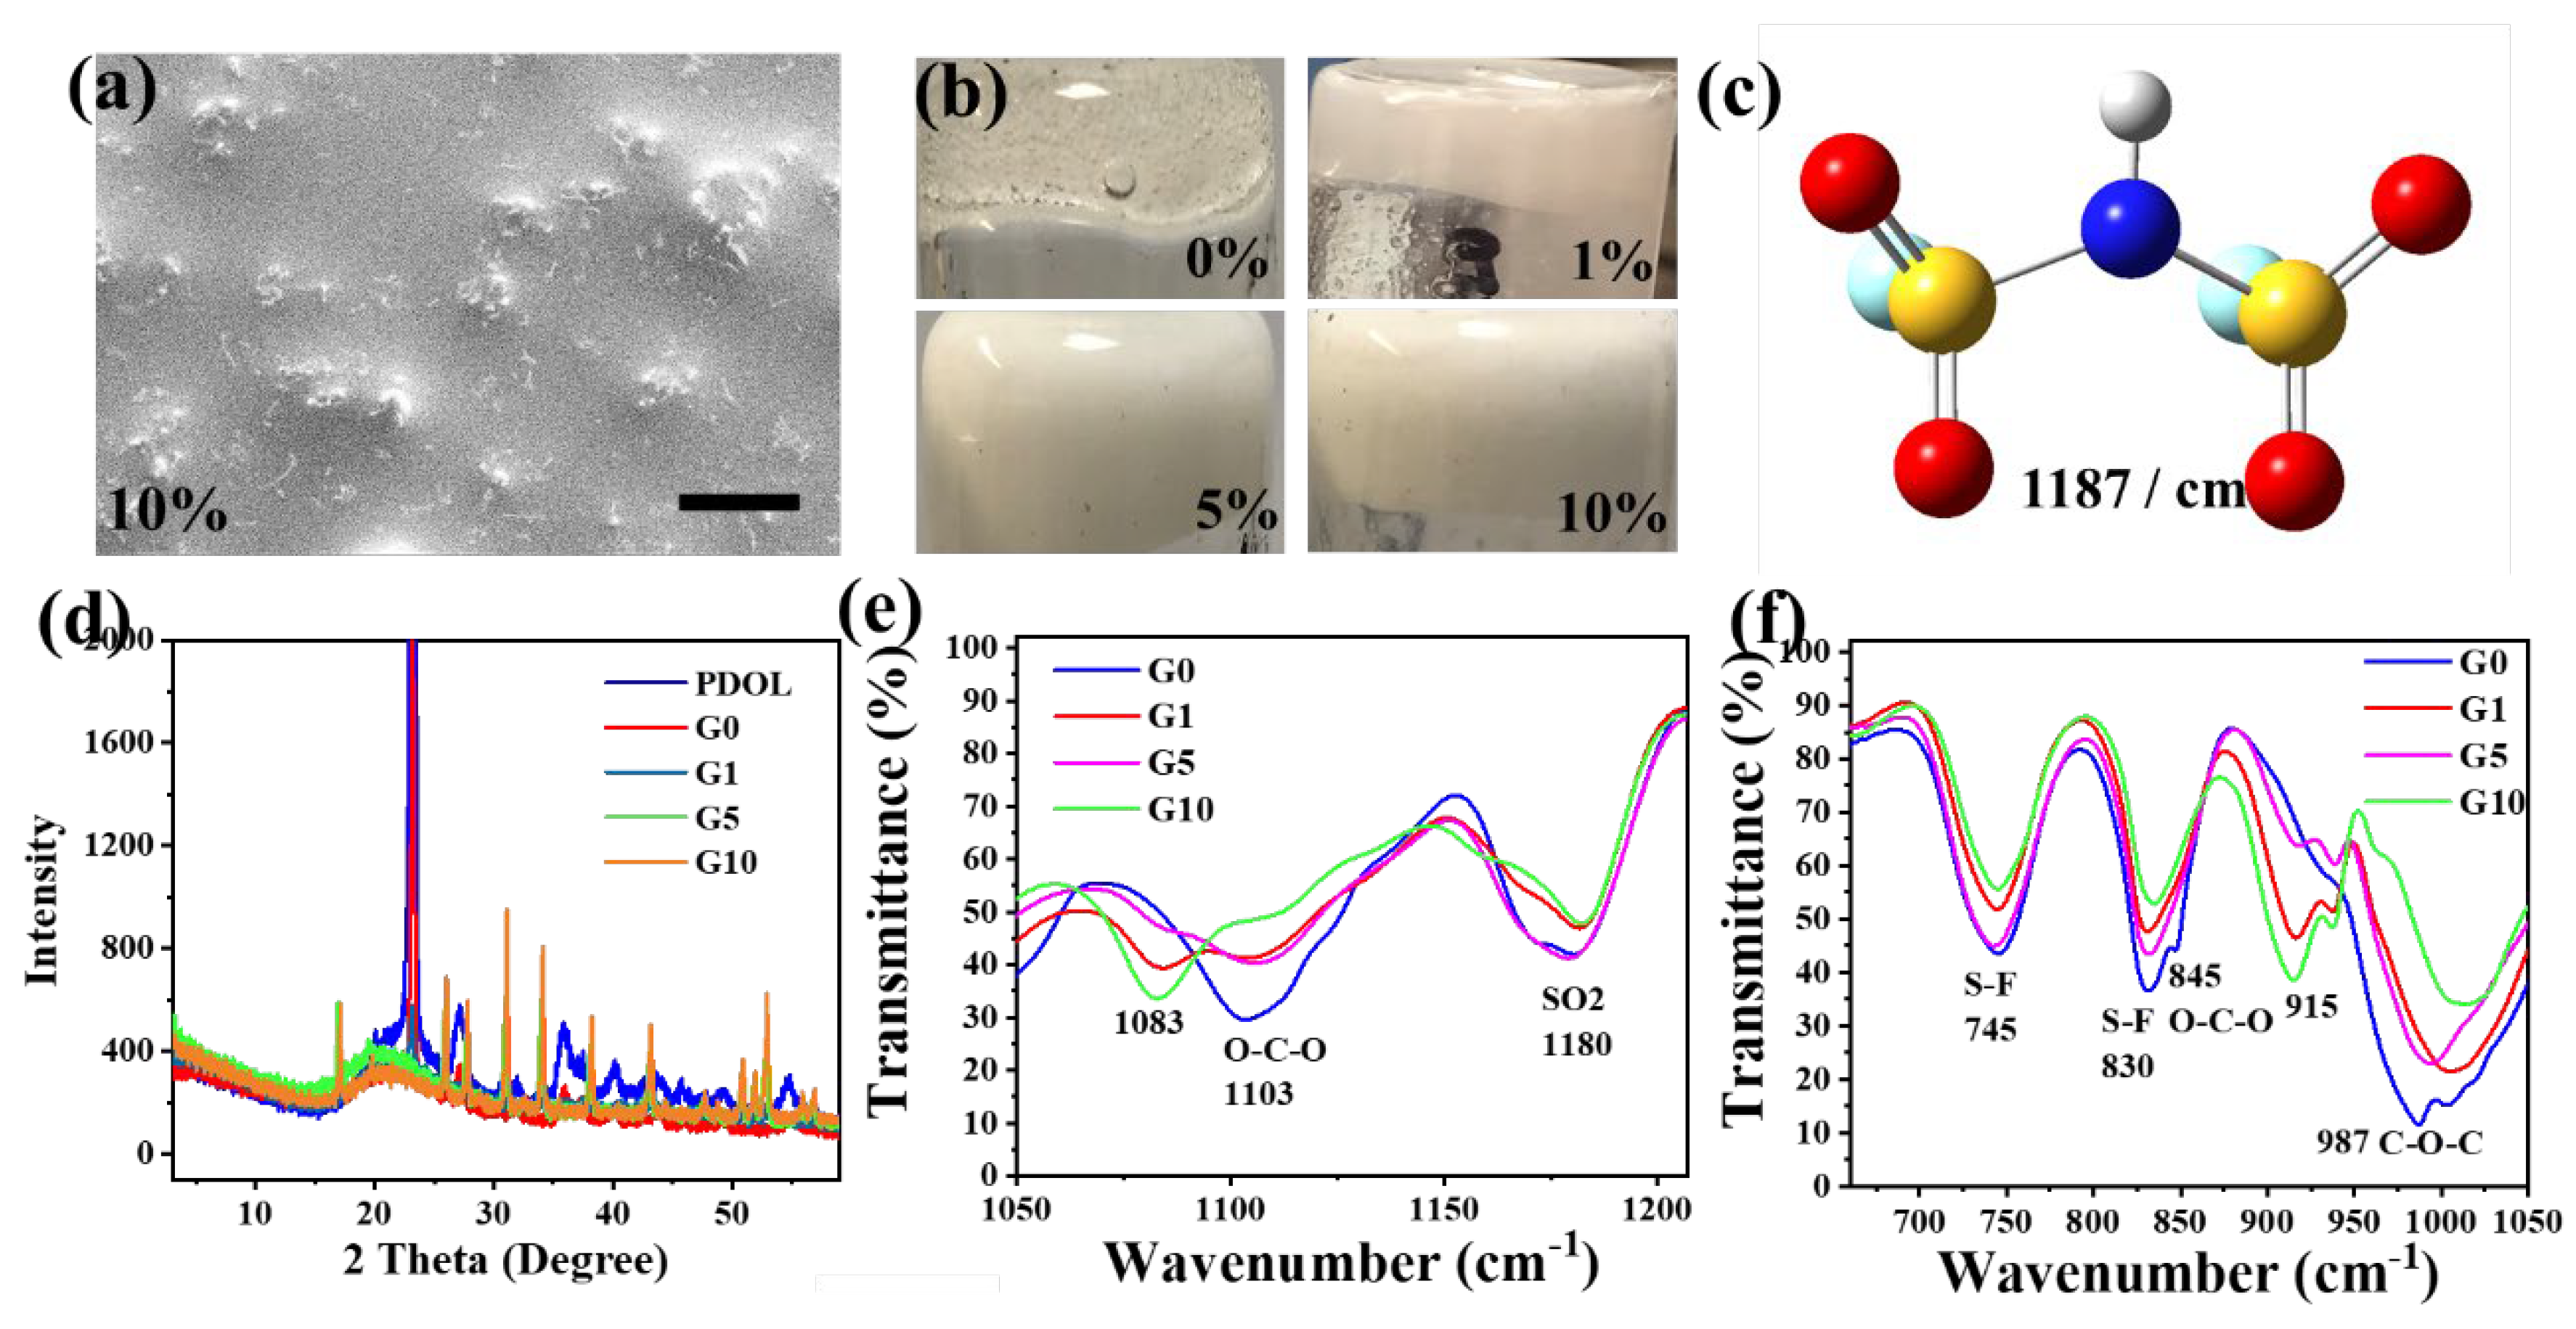
Figure 3. SEM images of 10% c-LLZO nanofiber in 1M-LiFSI-PDOL (G10) composite electrolyte (a) and optical images of composite-electrolytes G0, G1, G5 and G10 (0%, 1%, 5% and 10% c-LLZO nanofiber in 1M-LiFSI-PDOL) (b); -SO2- asymmetric vibration mode of HFSI molecules (Figure S15) at 1187 cm-1, calculated with DFT- B3LYP/6-311++G(d,p) (c); XRD diffraction patterns composite-electrolytes G0, G1, G5 and G10 (0%, 1%, 5% and 10% c-LLZO nanofiber in 1M-LiFSI-PDOL) (d); Infrared spectra of composite electrolytes G0, G1, G5 and G10 are in (e)-(f).
Preprints 103640 g003
Infrared spectra are used to detect different organic functional groups and confirm the reaction. Figure 1d shows DOL and 1M-LiFSI-PDOL (G0) IR spectra. DOL IR spectrum shows a characteristic DOL C-H out-of-plan bending [36] peak at 915 cm-1, which disappears in PDOL-1M LiFSI IR spectra, indicating the ring-opening process during DOL polymerization. While for IR spectrum of 1M-LiFSI-PDOL (G0), there are two new long-chain vibration peaks [36] at 745 cm-1 (Figure 1d and Figure S1) and 845 cm-1 (see shoulder peak in Figure 3f G0), next to which there is 831 cm-1 vibration belonging to S-N-S of FSI-1 ion [9] (see Figure 3f G0). A -O-C-O- vibration peak of PDOL appears at 1103 cm-1 (Figure 1d and Figure S1). -CHCH- double bond [9,27,35] vibration peak of PDOL shows around 1646 cm-1 (Figure 1d and Figure S1), which is produced by FSI-1 attacking to hydrogen in ethylene group of PDOL and formation of HFSI (Figure S15). -CH2- symmetric and asymmetric vibration peaks of PDOL show at 2885 cm-1 and 2940 cm-1, which appear at 2889 cm-1 and 2960 cm-1 for DOL ((Figure 1d), noticing that both symmetric and asymmetric -CH2- vibrations shift towards lower wavenumber about 4 cm-1 and 20 cm-1 for PDOL. The 4 cm-1 and 20 cm-1 left-shifts indicate that PDOL -CH2- groups has a lower energy and more stable status than that in DOL ring. -CH2- symmetric and asymmetric vibration peaks are 55 cm-1 away in PDOL comparing to 71 cm-1 away in DOL, which reveals symmetric and asymmetric vibration get evened out a little bit in PDOL. It should be noted that the 1382 cm-1 peaks of PDOL-1M LiFSI spectrum is from -SO2- vibrations of LiFSI. Also, there is one broadband vibration from 3452 cm-1 to 3584 cm-1 (Figure 1d), which are caused by hydroxy-group [35] and amine-group [35] in HFSI (Figure S15) and other by-product molecules due to side-reactions between LiFSI and PDOL.
To further explore the polymerization under different LiFSI concentration, 1 mmol, 2 mmol and 3.5 mmol LiFSI salt were added into 3 different glass vials containing 1 ml DOL liquid respectively. After mixing lithium salt and DOL together, 3.5 M LiFSI-DOL sample would polymerize and transform into one while-solid during mixing, while 2 M LiFSI-DOL sample would take 5 minutes to form a solid. 1 M LiFSI-DOL sample takes 1 h to become one solid. The related IR spectra are shown as Figure S2, which are similar among all the sample. The differences are two IR vibration bands around 1646 cm-1 and 3455-3593 cm-1 ((Figure S2), which increase along with the increasement of LiFSI concentration and, are from C=C double bond [9,35,38] in PDOL, and amine-group [35] and hydroxy group [35] vibration of HFSI and other by-products, respectively. This proves that when LiFSI increased from 1 mol, 2 mol to 3 mol, C=C double bond and HFSI by-product increased as well because FSI-1 would attack ethylene-hydrogen in PDOL main chain, producing more C=C double bonds in PDOL and HFSI-molecule by product at the same time. The facts that other vibration bands in IR spectra are the same indicates that 1 M, 2 M, and 3.5 M LiFSI salt concentration can produce similar PDOL polymer.

4.2. Cubic-LLZO Ceramic Nanofiber Characterization

Cubic-LLZO nanofiber is prepared according to literature procedure [5,24,32,39]. Figure 2a,b show SEM images of as-spun c-LLZO nanofiber precursor (Figure 2a) and c-LLZO ceramic nanofibers (Figure 2b). Apparent morphology differences exist between as-spun (Figure 2a) and after-sintered (Figure 2b) nanofibers. As-spun nanofibers have a smooth surface and an average diameter of 290 nm (diameter-distribution in Figure 2c), and each nanofiber is well separated with each other, forming nonwoven nanofiber mat. But after-sintering, c-LLZO nanofiber has rough surfaces and an average diameter of 188 nm (diameter-distribution in Figure 2c). Cross-linked knots and 3-dimensional crisscross network mat are formed due to polymer removal, ceramic-knot melt and adhesion of close-contact c-LLZO nanofibers. Optical images of as-spun mat over 20 inch2 large and after-sintered c-LLZO nanofiber in one vial can be found in Figure S3. Their diameter distribution statistics is in Figure 2c. These 3-dimensional c-LLZO lithium-ion conductor nanofibers will act as lithium-ion conduction channel and its 3-D interface with polymer matrix will provide another channel for lithium-ion conduction. In our case, these interface with polymer-lithium salt matrix seems playing a vital role to the composite stability and Li-ion conduction than the c-LLZO nanofiber itself, which is somewhat contrary to the popular idea [26]: c-LLZO > c-LLZO-polymer interface > polymer in c-LLZO-polymer composite. Figure 2d is XRD pattern of c-LLZO sample and PDF card #80-0457, which confirms that cubic-LLZO nanofiber is successfully synthesized.

4.3. Composite Electrolytes Characterization

PDOL polymer and c-LLZO nanofiber are composited by mixing DOL liquid, LiFSI and certain amounts of c-LLZO together. Figure 3a is SEM image of G10 composite electrolyte (10 % c-LLZO in 1M LiFSI-PDOL), which shows gray color and some nanofibers over the view, indicating mostly uniform distribution c-LLZO nanofiber in PDOL polymer matrix. Comparing to Figure 3a, Figure S4 is SEM of G5 composite electrolyte (5 % c-LLZO in 1M LiFSI-PDOL), which shows plaint composite. Optical images of PDOL-LLZO composite with different nanofibers concentration (wt. %) are in Figure 3b. PDOL polymer electrolyte without c-LLZO (noted as G0) is one transparent solid, which would change into white solid over one week because of further crystallization. 1%, 5% and 10% c-LLZO in PDOL composite electrolytes (noted as G1, G5 and G10 in Figure 3b) have white-color intensified with c-LLZO content increasing. Figure 3e,f are the zoom-in IR spectra of 0%, 1%, 5% and 10% c-LLZO-PDOL composite electrolytes (G0, G1, G5 and G10). We ascribe vibration band at 1180.4 cm-1 (Figure 3c and Figure S10), 1361.2 cm-1 and 1382 cm-1 to asymmetric -SO2- vibration [40,41,42] (noted as vas-SO2- in Table1), 1459.1 cm-1 to symmetric -SO2- vibration (noted as vs-SO2- in Table1, Figure S11–S12). -S-F asymmetric vibration is centered around 733 cm-1 (Figure S5), which is around or merged with PDOL long chain vibration at 745 cm-1 (Figure S1, Table 1). S-N-S asymmetric vibration [9,40,41] is centered around 838 cm-1 (Figure S13, noted as vas-S-N-S in Table1), which is very close to PDOL long chain vibration at 845 cm-1 (Figure S1). When c-LLZO weight concentration is increasing from 1%, to 5%, then to 10% (G1, G5 and G10), the respective vibration bands is around similar wavenumbers as PDOL-LiFSI sample (G0). One interesting finding to mention is that all -SO2- asymmetric vibration modes of FSI-1 in 5% c-LLZO sample have the lowest wavenumbers compared to that in other composite electrolytes (vas-SO2- in Table 1). In contrast, all vibration modes of -SO2- and S-N-S groups in 10 % c-LLZO composite sample have the highest wavenumber among all electrolytes (vas-SO2-, vs-SO2- and vas- S-N-S in Table 1). The electrolytes IR wavenumber details of -SO2-, PDOL long-chain, -S-N-S vibration [28] are enlisted in Table1. Comparing to vas-SO2- around 1180 cm-1 of 0% c-LLZO-PDOL (G0) (Figure 3e and Figure 6S), vas-SO2- of 5% c-LLZO PDOL sample (G5) shows this peak position at 1179.2 cm-1, while vas-SO2- of 1% and 10 % c-LLZO electrolytes (G1 and G10) show intensity decreasing and peak position shifting to 1181.7 cm-1 and 1182.1 cm-1 (Figure 3e, -SO2- vibration band at 1180 cm-1). From these experiment results and DFT IR calculation [43] results of HFSI vibration (Figure 3c, Figures S5 and S10–S14), we propose that FSI-1 anions are interacting with c-LLZO nanofibers sideway in 5% c-LLZO-PDOL (G5) samples as vas-SO2- vibration wavenumber decreased comparing to that in 0% c-LLZO LiFSI-PDOL (GO) sample. And there is limited interaction between c-LLZO nanofibers and FSI-1 anions in 1 % and 10% c-LLZO-PDOL samples, which would endow high ion concentration in polymer matrix in these electrolytes. O-C-O and C-O-C atoms groups in PDOL show vibration around 1103 and 987 cm-1 in all composite electrolyte (Figure 3e,f). For 1% and 10% c-LLZO samples (G1 and G10), another two-vibration band appeared at 1083 cm-1 and 915 cm-1, which are from DOL monomer vibration (Figure 1d and Figure S1, 1079 cm-1 and 911 cm-1) but at higher wavenumber. Compared to strong vibration band at 1103 cm-1 (O-C-O) of PDOL in G0 sample (Figure 3e,f), O-C-O atoms group vibration of PDOL in 10% c-LLZO sample shows only small shoulder-peak at 1110 cm-1 and another new lower vibration band at 1083 cm-1. Depending on this analysis, we predict that in these G10 samples, O-C-O of PDOL polymer chain and DOL would interact with c-LLZO nanofibers instead of LiFSI, leaving a high LiFSI concentration in polymer matrix. DOL monomer content increased as well, and further study is underway to get these relative ratio.
Figure 3c is one -SO2- asymmetric vibration mode in HFSI molecules at 1187 cm-1 (see also IR spectra in Figure 3e, 1180 cm-1), showing one -SO2- group stretching while the other one contraction, and Figure S5 is one -S-F asymmetric vibration mode in HFSI molecules at 733 cm-1, showing one -S-F group stretching while the other one contraction. IR vibration was calculated at DFT- b3lyp/6-311+g(d,p) using Gaussian 09W [43]. Different vibration modes of HFSI molecule and the calculated IR spectrum can be found in Figure S10–S14. In Table 1 are the asymmetric (νas) and symmetric (νs) vibration modes wavenumber of -SO2- molecules based on IR simulation [43] and composite-electrolytes IR spectra. While 5% wt. sample (G5) shows lower wavenumbers for asymmetric vibration of -SO2- among all composites, G10 -SO2- group vibrations in FSI-1 appear at highest wavenumbers among samples (Table 1, Figure 3e,f), as mentioned, indicating a higher strength of these bonds. In the meantime, -S-N-S- vibrations of FSI-1 in G10 show at highest vibration among all samples as well (Table 1, Figure 3e,f). Figure 4 mimics the proposed interactions and evolution trending between c-LLZO nanofibers and different species in gel-composite electrolytes from G5 to G10. In G5, FSI-1 anions and c-LLZO crystal interactions is stronger than that of G10. While in G10 sample, FSI-1 and ceramic c-LLZO nanofibers interaction is limited and is replaced with PDOL & c-LLZO and DOL & c-LLZO interactions instead.
Figure 3d shows XRD diffractions of pure PDOL, G0, G1, G5 and G10. Pure PDOL polymer have the highest intensity peak of 5760 cps at 2 theta degree of 23.18o and peaks at 20.05 o, 23.25 o, 27.06 o, 30.53 o, 31.94 o, 35.93 o, 37.62 o, 40.19 o, 42.51 o, 43.56 o, 37.53 o, 45.78 o, 47.91 o, 49.33 o and 54.75 o, which proves the high crystallinity of this polymer. 1 M LiFSI-PDOL (G0) composite sample has the same diffraction peaks respectively as pure PDOL does, but diffraction peaks intensity decreased into half of that in pure PDOL, such as the peak intensity at 23.18o decreased from 5760 cps to 2284 cps, indicating that introducing LiFSI can decrease the crystallinity of PDOL polymer. While for 1% c-LLZO in 1 M LiFSI-PDOL sample, XRD curve shows only one PDOL diffraction peaks at 2 theta degree of 23.11o and another 10 diffraction peaks of c-LLZO. Also, a big bump appeared at 21.26 o in G1 indicating the large contents of amorphous PDOL in G1. G5 sample did not have any PDOL diffraction peak at all, indicating c-LLZO nanofiber and LiFSI together can totally inhibiting the crystallization of PDOL. Also, all c-LLZO diffraction peaks intensity in G5 tripled, comparing G5 31.06o diffraction peaks intensity with that of G1. C-LLZO diffraction intensity of G10 (10% c-LLZO 1M LiFSI-PDOL sample) further doubled, comparing with the 31.06 peak intensity of G5, while amorphous bump of PDOL intensity decreased.

4.4. Thermal Stability

To explore thermal stability of PDOL polymer and c-LLZO & PDOL composite electrolytes, G0, G1, G5 and G10 samples vials containing air are placed on 80 oC hotplate overnight. The optical images before and after heating are in Figure S8. PDOL polymer initiated with 0.1 M, 0.3 M, and 1 M LiFSI salt melted into liquid at 80 degrees overnight, indicating these sample’s low melting point around 80 degree and air stability. While in stark contrast with G0, as shown in Figure S8, all composite electrolytes did not show notable melting, color change under 80 oC overnight in air, even for G1 sample, indicating the thermal stability and non-air sensibility of these gel composite electrolytes.

4.5. Electrochemical Performance

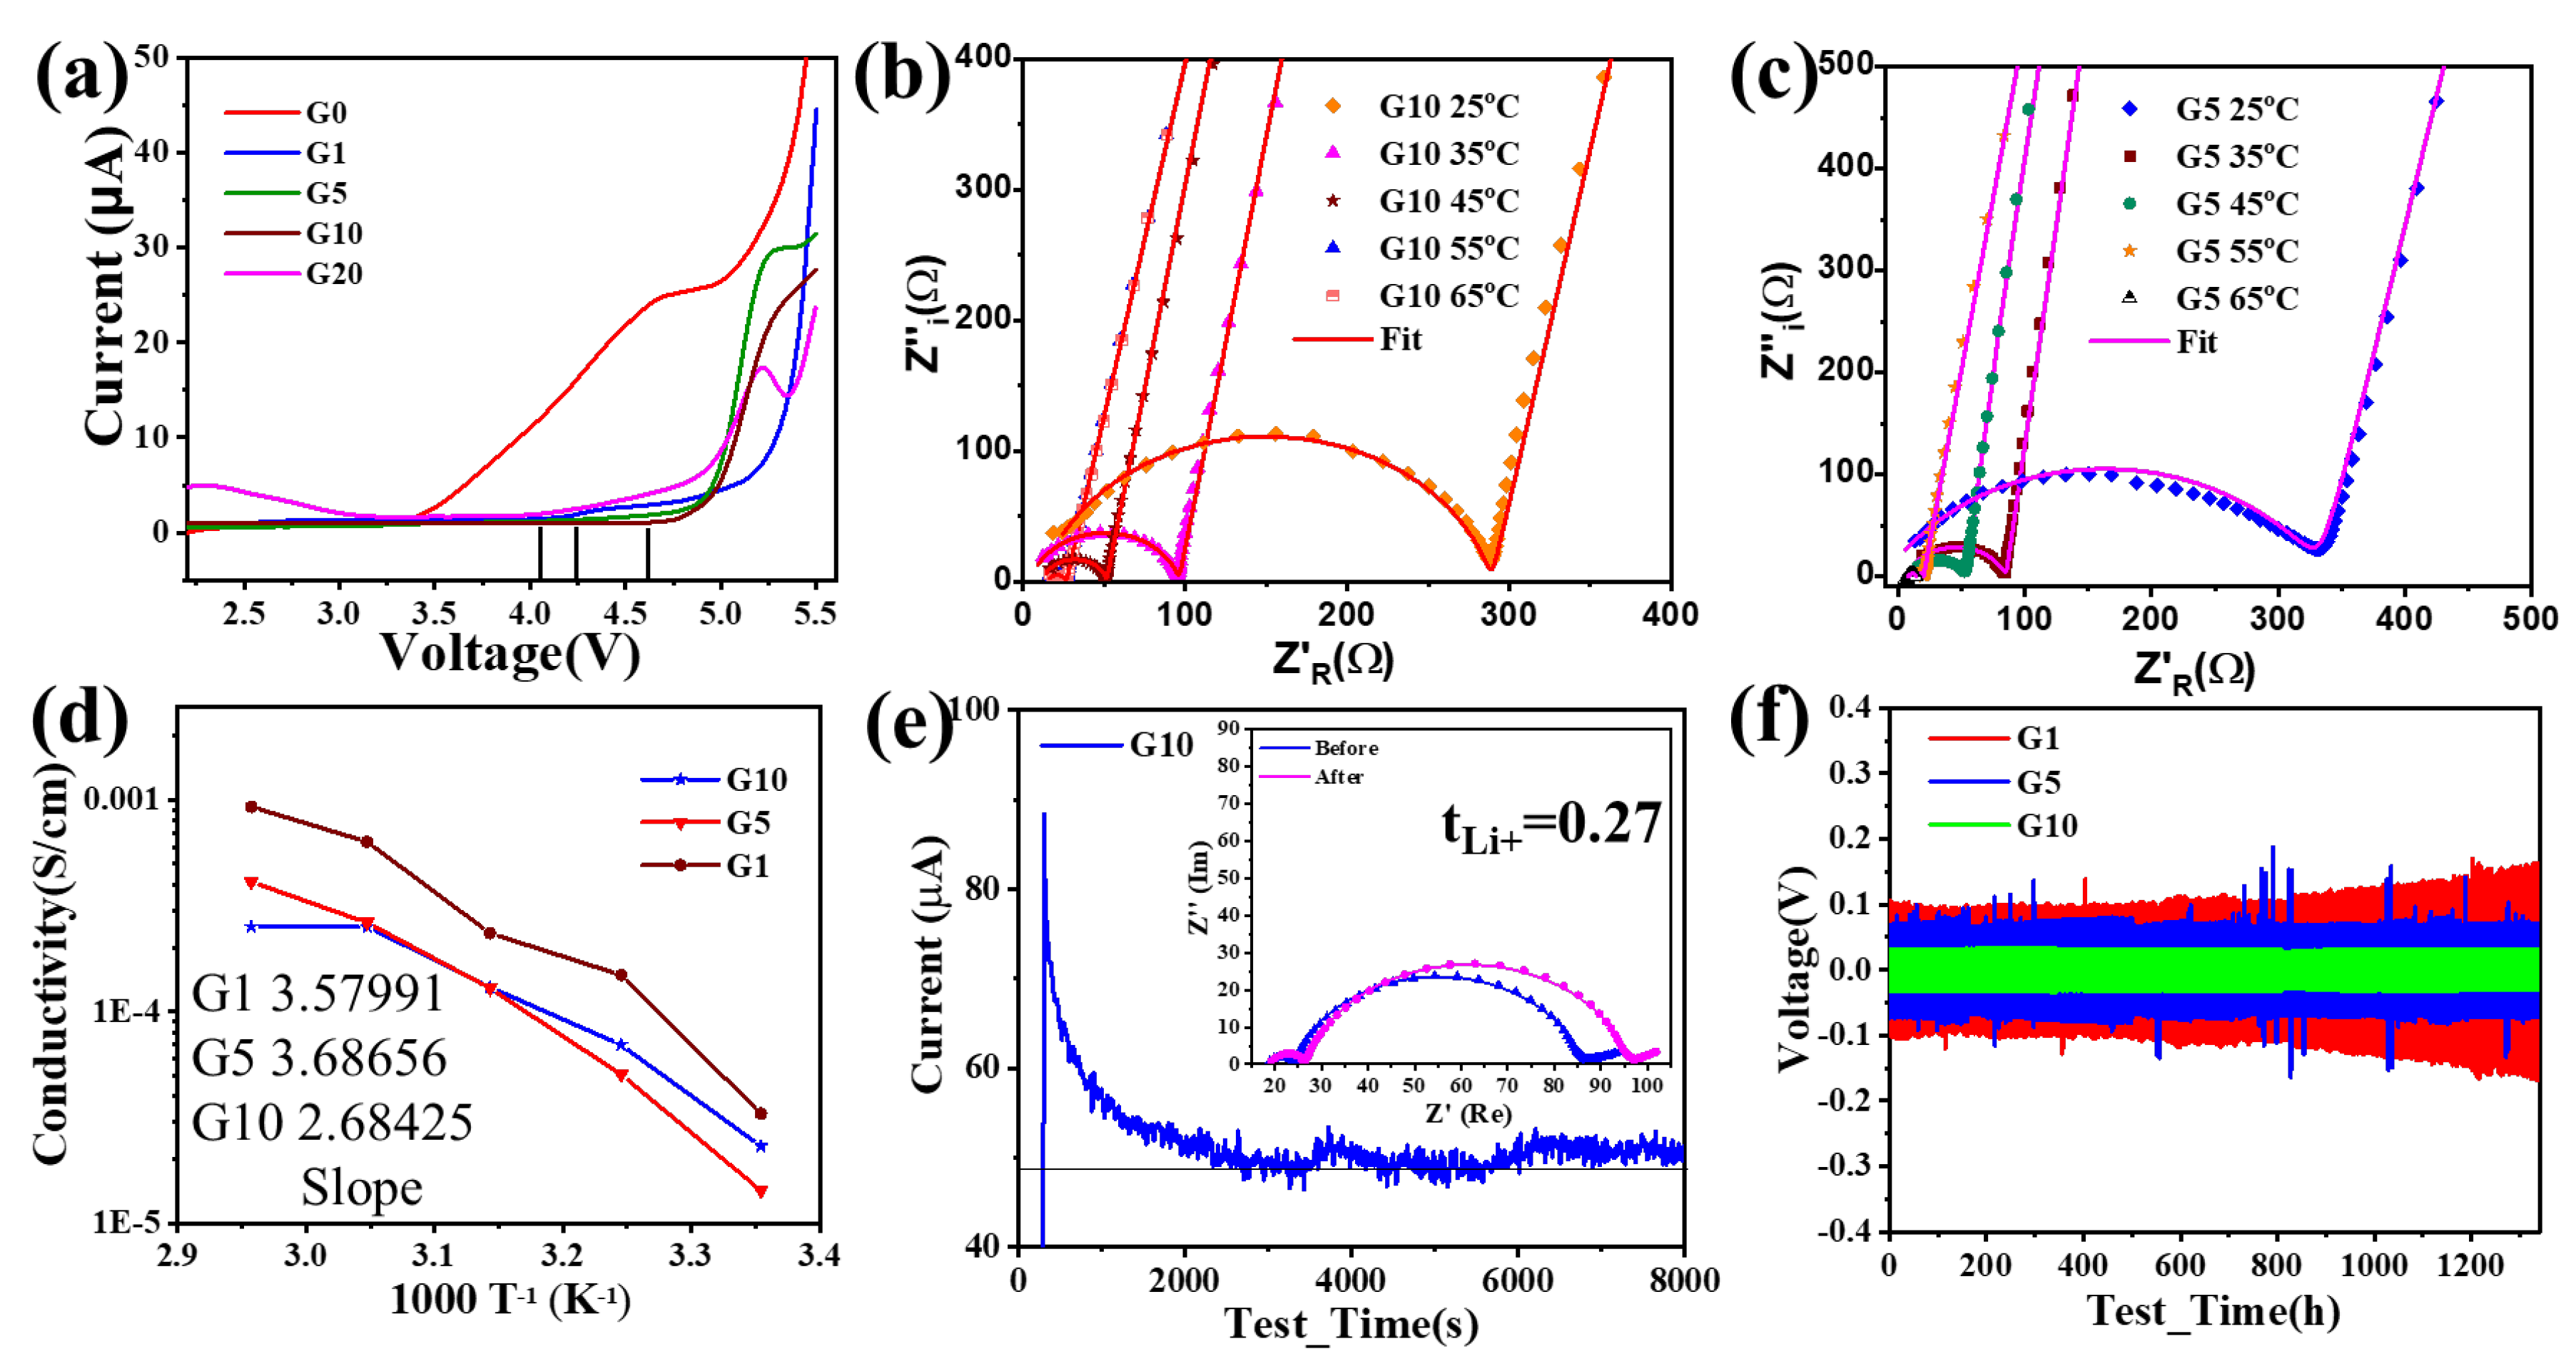
In Figure 5 is the electrochemical properties of gel electrolytes. LSV curves are in Figure 5a, and G10 has the highest oxidation potential of 4.6 volt versus Li/Li+1 in all composite electrolyte, comparing to 4.2 volt of G5, 4.0 volt of G1 sample, 3.4 volt of G0 and 4.0 volt of G20. Figure 5b,c is the Nyquist plot of SS/G10/SS and SS/G5/SS tested under different temperatures. As these curves in Figure 5b,c demonstrated, the interfacial resistance of G10 and G5 decreased as the temperature increasing, while bulk resistance did not change much. Figure 5d is temperature and conductivity fitting of SS/G1/SS, SS/G5/SS and SS/G10/SS using Arrhenius method, from which the activation energies can be calculated based on the slope. G10 sample has the lowest activation energy of 0.537 eV compared to G5 0.737 eV and G1 0.715 eV. Figure S9 is the conductivity of G0, G1, G5 and G10 at 25 degrees, in which G0 has the highest conductivity at first EIS test but decreased dramatically during further test. G10 Li+ transfer number is calculated to be 0.569 based on tLi+1= Is/Io (or 0.27 based on the EIS spectra and DC polarization) of Li/G10/Li sample in Figure 5e. Figure 5f is Li//Li symmetric cells plating and stripping performance of G1, G5 and G10 composite electrolytes under the current density of 100 µA/cm2. According to Figure 5f, Li/G10/Li composite electrolyte has low cycling polarization voltage of 32 mV and performs over 1300 hours continuously without fading. While Li/G5/Li cell has cycling polarization voltage around 80 mV and some abnormal polarization voltage of 187 mV under the same current density of 100 µA/cm2. Li/G1/Li cell starts with a cycle polarization-voltage of 106 mV and ends with 163 mV after 1300 h cycling under the same current density of 100 µA/cm2. These results are in line with the LSV tests results, proving the improvement of G10 stability again Li metal during long cycle life.
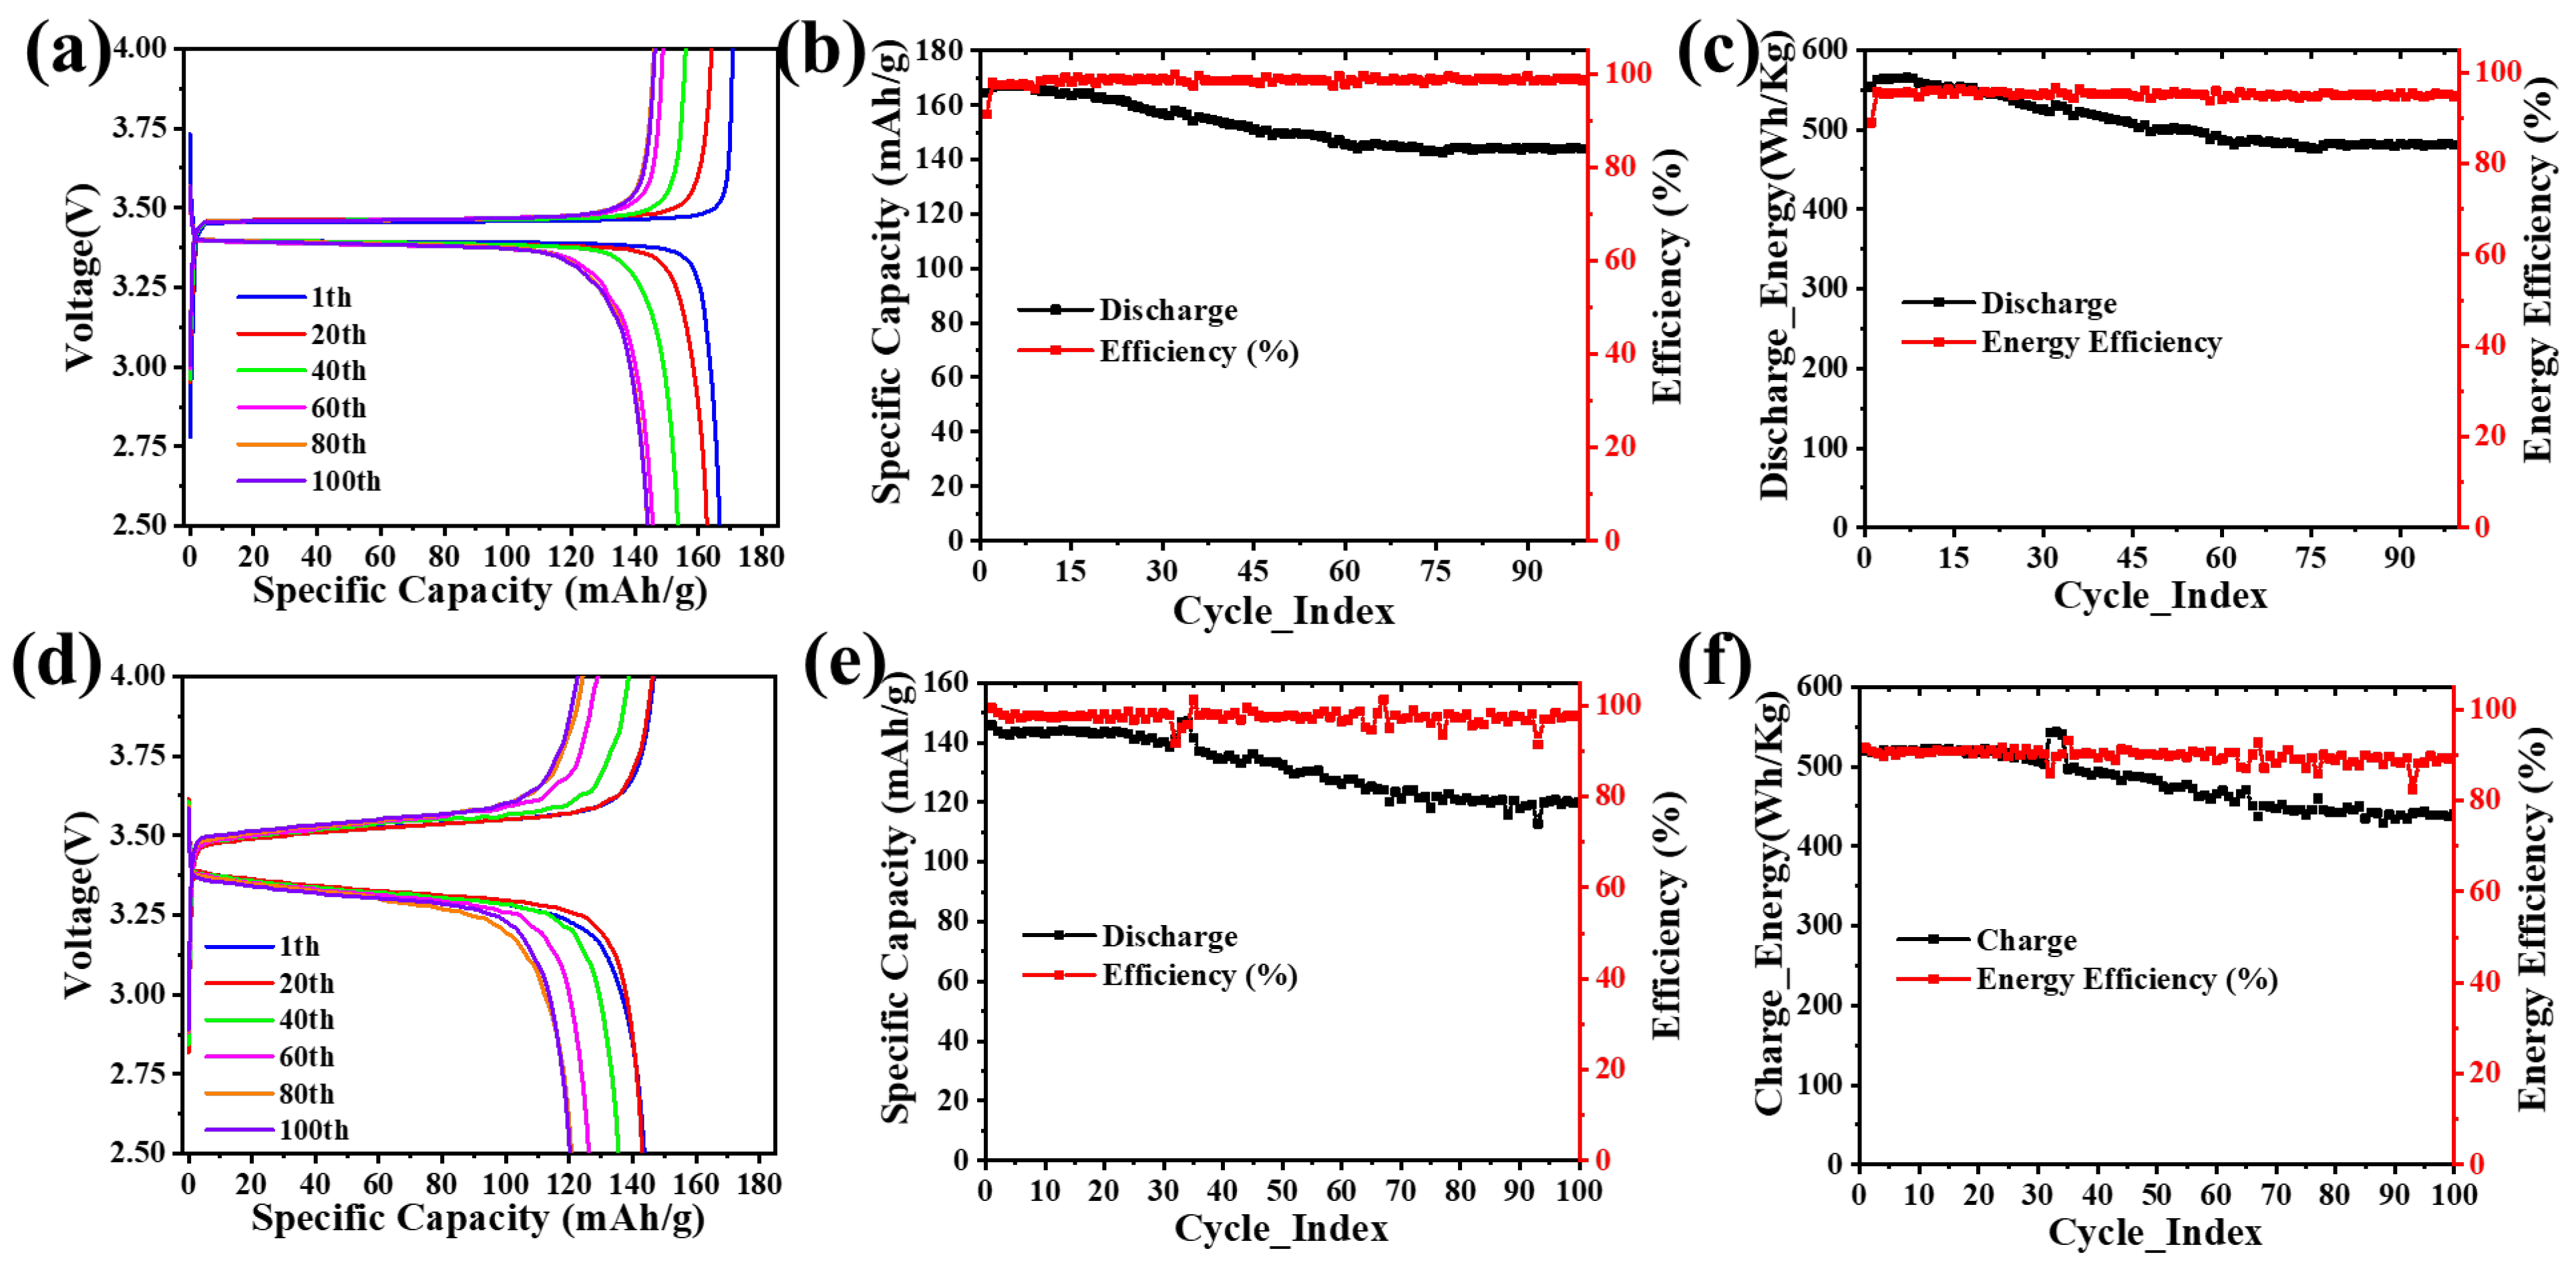
Figure 6 show LFP/G10/Li (a-c) and LFP/G5/Li (d-f) charge-discharge cycling performance, capacity retention and energy retention ability in related with the charge-discharge cycles. All the tests are performed at 25 oC. As in Figure 6a, 1st to 100th charge-discharge plots of LFP/G10/Li have flat and merged charge-discharge plateau at 3.46 volt and 3.39 volt respectively for different cycles, and a small stable polarization of 0.07 volt under the current density of 26.3 mA/g (56.6 µA/cm2). Figure 6b shows LFP/G10/Li capacity-retention and coulombic-efficiency relationship with charge-discharge cycle numbers. While for first 100 charge-discharge cycles, the cell capacity decayed from 166 mAh/g to 145 mAh/g, which is stabilized around 60th cycle, and the coulombic efficiency increased from 97.7 % to 98.7 % during the whole testing process, which is stable. Figure 6c is the energy-retention and energy-efficiency relationship with charge-discharge cycle numbers of LFP/G10/Li cells. The cell energy density decreased from 562.7 Wh/kg to 486.3 Wh/kg and stabilized after 60 cycles, while the cell energy efficiency is stable around 95.3%, which is reasonable because of the low 0.07-volt polarization voltage between charge-discharge plateau. Cycle performance of LFP/G5/Li batteries under the current density of 23.1 mA/g (45.5 µA/cm2) is in Figure 6d–f. In Figure 6d, LFP/G5/Li capacity-voltage curves of different cycles show slow polarization-voltage increasing along each charge or discharge process and an average polarization-voltage around 0.2 volt (calculated at 60 mAh/g capacity middle-point), which is around 3 times the value of LFP/G10/Li cells and in line with the results of Li/G5/Li and Li/G10/Li symmetric cell polarization-voltage results. Figure 6e shows the capacity evolution with the charge-discharge cycles. The capacity faded from 143 mAh/g to 120 mAh/g, which is stabilized after 80 cycles (Figure 6e), while the columbic efficiency is stable around 97 % with some abnormality dots along the cycle-process. Figure 6f is the energy retention property of the LFP/G5/Li cell, starting from 520 Wh/Kg then fading into 438 Wh/Kg but the energy efficiency evolved from 90.7 % to 89.2 % during first 100 cycles.

5. Discussion

Electro-spun ceramic c-LLZO nanofiber has high surface area, well defined diameter, and 3-dimensional crosslinked network after sintering. Dioxolane monomer, on the other hand, has small molecular weight and low viscosity. After polymerization, PDOL (poly(dioxolane)) can get filled into interstitial nano space of 3D garnet-LLZO mat, form conformal interface and intimate contact with rough ceramic garnet-LLZO nanofiber mat while preserving the original 3-dimensionalion lithium-ion conduction channels [21]. After the in-situ polymerization of dioxolane, the low viscosity dioxolane monomer is converted to higher viscosity poly-(dioxolane). The ceramic c-LLZO nanofiber is confined in this polymer-salt matrix with one concentration-specific organic interfacial layers after polymerization, which is beneficial to preserve the high interface area and prevent the coagulation of ceramic nanofibers [21] in later mixing, coating and cell-assembly process. This is hard to achieve by ceramic nano-fillers and polymer solution directly mixing. Directly mixing can easily cause nanoparticles coagulation, especially for ceramic nano-filler of concentration higher than 10 % wt. Also, by tuning LiFSI salt concentrations in the mixture, different primary organic composition layers on the ceramic surface are achieved. According to IR testing results and DFT calculation, 5% c-LLZO gel-electrolyte (G5) has more FSI- anion on ceramic surface sideway than that of G10. While for 10% c-LLZO gel-electrolyte (G10), DOL monomer and PDOL will attach to c-LLZO nanofibers instead of FSI-1 ion, which would leave DOL-PDOL organic matrix with a higher Lithium-ion concentration and higher electrochemical stability . This finding tells us that interface engineering should be considered when one aims to design a high performance organic-inorganic composite electrolyte. Higher lithium salt concentration can embed DOL-PDOL organic matrix a higher electrochemical stability (4.6 v versus Li/Li+). This G10 electrolyte turns out to have a higher stability both in LSV test, lower polarization voltage during Li/G10/Li symmetric cell cycling and lower polarization voltage during LFP/G10/Li full cell cycling. EIS spectra of Li/G10/Li cells also show lower total interfacial resistance 66 Ω comparing with 289 Ω of Li/G5/Li cells of the same structure (comparing Figure 3e and Figure S16–). With the semi-solid nature of this G10 electrolyte, it can have conformal contacts with both Li anodes and LFP cathodes, which provide uniform Li ion flux, help Li ions evenly plating on the surface Li metal anode and is critical to prevent the lithium dendrites formation during the cell charge-discharge cycles. The tight interface adhesion also helps uniform Li plating because of the high viscosity of G10. LFP/G10//Li in the end can perform well at 25 oC for over 100 cycles continuously with a stabilized capacity of 145 mAh/g after first 60 cycles, coulombic efficiency of ~98% and energy efficiency of 95%, which is a clear indication that there is no lithium dendrites growth during the cycle process. The intimate interface-contact8 between G10 quasi-solid electrolytes and Li metal helps uniform Li ion flux [44] and Li-metal plating [44]. The low electron conduction property of G10 may also play a vital role in stopping Li dendrites growth [10] during the cell cycling process. Further effort will be put into the polymerization mechanism and extreme temperature cycling performance of this gel electrolytes.

6. Conclusions

By compositing c-LLZO with 1M LiFSI-PDOL, which is initiated by LiFSI, thick and viscous gel-composite electrolytes were produced. 1M LiFSI and 10% c-LLZO PDOL gel electrolyte (G10) is able to provide the best performance. G10 is stable at 4.6 Volt versus Li/Li+, has a low interface resistance about 66 Ω with Li. The Li/G10/Li symmetric cell can stripe and plate for 1300 hour at capacity of 0.10 mAh/cm2. LFP//Li full cell can charge and discharge for over 100 cycles with capacity of 144 mAh/g, coulombic efficiency of ~98% and energy efficiency of 95% under the current density of 26.3 mA/g (56.6 µA/cm2), which proves the successful application of gel-composite electrolyte in Li-metal batteries.

Author Contributions

This work is done under the supervision of D.S. D.S. provided the primary idea and strategies. Z.L. worked on experiment design and testing, data collection and analysis and manuscripts writing. All authors have read and agreed to the published version of the manuscript.

Acknowledgments

This work was supported by the South Dakota “Governor’s Research Center for Electrochemical Energy Storage” from the South Dakota Board of Regents. Batteries testing was performed in CAPE @ SDSM&T. EIS, IR, H-NMR test are performed in CBHS@ SDSM&T. Thanks Dr. Smirnova Alevtina for sharing their equipment. XRD and SEM test are performed in EMES @ SDSM&T.

Conflicts of Interest

There is no conflict of interest to declare.

References

  1. Chen, S.; Wen, K.; Fan, J.; Bando, Y.; Golberg, D. Progress and future prospects of high-voltage and high-safety electrolytes in advanced lithium batteries: from liquid to solid electrolytes. J. Mater. Chem. A 2018, 6, 11631–11663. [Google Scholar] [CrossRef]
  2. Perea, A.; Dontigny, M.; Zaghib, K. Safety of solid-state Li metal battery: Solid polymer versus liquid electrolyte. J. Power Sources 2017, 359, 182–185. [Google Scholar] [CrossRef]
  3. Jaumaux, P.; Wu, J.; Shanmukaraj, D.; Wang, Y.; Zhou, D.; Sun, B.; Kang, F.; Li, B.; Armand, M.; Wang, G. , Non-flammable liquid and quasi-solid electrolytes toward highly-safe alkali metal-based batteries. Advanced Functional Materials 2021, 31(10), 2008644. [Google Scholar] [CrossRef]
  4. Matsuki, Y.; Noi, K.; Deguchi, M.; Sakuda, A.; Hayashi, A.; Tatsumisago, M. , Lithium dissolution/deposition behavior of Al-doped Li7La3Zr2O12 ceramics with different grain sizes. Journal of The Electrochemical Society 2019, 166(3), A5470. [Google Scholar] [CrossRef]
  5. Cha, J.H.; Didwal, P.N.; Kim, J.M.; Chang, D.R.; Park, C.-J. Poly(ethylene oxide)-based composite solid polymer electrolyte containing Li7La3Zr2O12 and poly(ethylene glycol) dimethyl ether. J. Membr. Sci. 2019, 595, 117538. [Google Scholar] [CrossRef]
  6. Wang, R.; Liu, F.; Duan, J.; Ren, Y.; Li, M.; Cao, J. Enhanced Electrochemical Performance of Al- and Nb-Codoped LLZO Ceramic Powder and Its Composite Solid Electrolyte. ACS Appl. Energy Mater. 2021, 4, 13912–13921. [Google Scholar] [CrossRef]
  7. Chang, Z.; Yang, H.; Zhu, X.; He, P.; Zhou, H. A stable quasi-solid electrolyte improves the safe operation of highly efficient lithium-metal pouch cells in harsh environments. Nat. Commun. 2022, 13, 1–12. [Google Scholar] [CrossRef] [PubMed]
  8. Deng, B.; Jing, M.-X.; Li, R.; Li, L.-X.; Yang, H.; Liu, M.-Q.; Xiang, J.; Yuan, W.-Y.; Shen, X.-Q. Integrating high ionic conductive PDOL solid/gel composite electrolyte for enhancement of interface combination and lithium dentrite inhibition of solid-state lithium battery. J. Colloid Interface Sci. 2022, 620, 199–208. [Google Scholar] [CrossRef]
  9. Oh, K.; Kim, J.; Kim, S.; Oh, D.; Han, S.; Jung, K.; Wang, Z.; Shi, L.; Su, Y.; Yim, T.; et al. Single-Ion Conducting Soft Electrolytes for Semi-Solid Lithium Metal Batteries Enabling Cell Fabrication and Operation under Ambient Conditions. Adv. Energy Mater. 2021, 11, 2101813. [Google Scholar] [CrossRef]
  10. Lin, D.; Liu, Y.; Cui, Y. Reviving the lithium metal anode for high-energy batteries. Nat. Nanotechnol. 2017, 12, 194–206. [Google Scholar] [CrossRef]
  11. Porz, L.; Swamy, T.; Sheldon, B.W.; Rettenwander, D.; Frömling, T.; Thaman, H.L.; Berendts, S.; Uecker, R.; Carter, W.C.; Chiang, Y. Mechanism of Lithium Metal Penetration through Inorganic Solid Electrolytes. Adv. Energy Mater. 2017, 7. [Google Scholar] [CrossRef]
  12. Wang, C.; Fu, K.; Kammampata, S.P.; McOwen, D.W.; Samson, A.J.; Zhang, L.; Hitz, G.T.; Nolan, A.M.; Wachsman, E.D.; Mo, Y.; et al. Garnet-Type Solid-State Electrolytes: Materials, Interfaces, and Batteries. Chem. Rev. 2020, 120, 4257–4300. [Google Scholar] [CrossRef] [PubMed]
  13. Biao, J.; Bai, C.; Ma, J.; Liu, M.; Kang, F.; Cao, Y.; He, Y. B. , Perspectives on Li Dendrite Penetration in Li7La3Zr2O12-Based Solid-State Electrolytes and Batteries: Materials, Interfaces, and Charge Transfer. Advanced Energy Materials 2024, 14(10), 2303128. [Google Scholar] [CrossRef]
  14. Tsai, C.-L.; Yu, S.; Tempel, H.; Kungl, H.; Eichel, R.-A. , All-ceramic Li batteries based on garnet structured Li7La3Zr2O12. Materials Technology 2020, 35 (9-10), 656-674.
  15. Sano, H.; Sakaebe, H.; Senoh, H.; Matsumoto, H. Effect of Current Density on Morphology of Lithium Electrodeposited in Ionic Liquid-Based Electrolytes. J. Electrochem. Soc. 2014, 161, A1236–A1240. [Google Scholar] [CrossRef]
  16. Sagane, F.; Ikeda, K.-I.; Okita, K.; Sano, H.; Sakaebe, H.; Iriyama, Y. Effects of current densities on the lithium plating morphology at a lithium phosphorus oxynitride glass electrolyte/copper thin film interface. J. Power Sources 2013, 233, 34–42. [Google Scholar] [CrossRef]
  17. Pei, A.; Zheng, G.; Shi, F.; Li, Y.; Cui, Y. Nanoscale Nucleation and Growth of Electrodeposited Lithium Metal. Nano Lett. 2017, 17, 1132–1139. [Google Scholar] [CrossRef] [PubMed]
  18. Zhu, P.; Gastol, D.; Marshall, J.; Sommerville, R.; Goodship, V.; Kendrick, E. A review of current collectors for lithium-ion batteries. J. Power Sources 2020, 485, 229321. [Google Scholar] [CrossRef]
  19. Fu, A.; Wang, C.; Peng, J.; Su, M.; Pei, F.; Cui, J.; Fang, X.; Li, J.; Zheng, N. Lithiophilic and Antioxidative Copper Current Collectors for Highly Stable Lithium Metal Batteries. Adv. Funct. Mater. 2021, 31, 2009805. [Google Scholar] [CrossRef]
  20. Liu, Y.; Gao, D.; Xiang, H.; Feng, X.; Yu, Y. Research Progress on Copper-Based Current Collector for Lithium Metal Batteries. Energy Fuels 2021, 35, 12921–12937. [Google Scholar] [CrossRef]
  21. Chen, L.-H.; Huang, Z.-Y.; Chen, S.-L.; Tong, R.-A.; Wang, H.-L.; Shao, G.; Wang, C.-A. In situ polymerization of 1,3-dioxolane infiltrating 3D garnet framework with high ionic conductivity and excellent interfacial stability for integrated solid-state Li metal battery. Rare Met. 2022, 41, 3694–3705. [Google Scholar] [CrossRef]
  22. Bahmani, F.; Rodmyre, C.; Ly, K.; Mack, P.; Smirnova, A.W. In Situ/Operando Techniques for Unraveling Mechanisms of Ionic Transport in Solid-State Lithium Indium Halide Electrolyte. Batteries 2024, 10, 21. [Google Scholar] [CrossRef]
  23. Zhai, Y.; Yang, G.; Zeng, Z.; Song, S.; Li, S.; Hu, N.; Tang, W.; Wen, Z.; Lu, L.; Molenda, J. Composite Hybrid Quasi-Solid Electrolyte for High-Energy Lithium Metal Batteries. ACS Appl. Energy Mater. 2021, 4, 7973–7982. [Google Scholar] [CrossRef]
  24. Li, Y.; Zhang, W.; Dou, Q.; Wong, K. W.; Ng, K. M. , Li 7 La 3 Zr 2 O 12 ceramic nanofiber-incorporated composite polymer electrolytes for lithium metal batteries. Journal of Materials Chemistry A 2019, 7(7), 3391–3398. [Google Scholar] [CrossRef]
  25. Chen, L.; Li, Y.; Li, S.-P.; Fan, L.-Z.; Nan, C.-W.; Goodenough, J. B. , PEO/garnet composite electrolytes for solid-state lithium batteries: From “ceramic-in-polymer” to “polymer-in-ceramic”. Nano Energy 2018, 46, 176–184. [Google Scholar] [CrossRef]
  26. Li, Z.; Huang, H.-M.; Zhu, J.-K.; Wu, J.-F.; Yang, H.; Wei, L.; Guo, X. Ionic Conduction in Composite Polymer Electrolytes: Case of PEO:Ga-LLZO Composites. ACS Appl. Mater. Interfaces 2018, 11, 784–791. [Google Scholar] [CrossRef]
  27. Li, Z.; Zhou, X.-Y.; Guo, X. High-performance lithium metal batteries with ultraconformal interfacial contacts of quasi-solid electrolyte to electrodes. Energy Storage Mater. 2020, 29, 149–155. [Google Scholar] [CrossRef]
  28. Zhang, H.; An, X.; Lu, Z.; Liu, L.; Cao, H.; Xu, Q.; Liu, H.; Ni, Y. A three dimensional interconnected Li7La3Zr2O12 framework composite solid electrolyte utilizing lignosulfonate/ cellulose nanofiber bio-template for high performance lithium ion batteries. J. Power Sources 2020, 477, 228752. [Google Scholar] [CrossRef]
  29. Xue, J.; Wu, T.; Dai, Y.; Xia, Y. Electrospinning and Electrospun Nanofibers: Methods, Materials, and Applications. Chem. Rev. 2019, 119, 5298–5415. [Google Scholar] [CrossRef]
  30. Mengesha, T.H.; Beshahwured, S.L.; Wu, S.-H.; Wu, Y.-S.; Jose, R.; Lue, S.J.; Yang, C.-C. Freestanding Trilayer Hybrid Solid Electrolyte with Electrospun Interconnected Al-LLZO Nanofibers for Solid-State Lithium-Metal Batteries. ACS Appl. Energy Mater. 2021, 4, 14554–14574. [Google Scholar] [CrossRef]
  31. Yang, H.; Jing, M.; Wang, L.; Xu, H.; Yan, X.; He, X. PDOL-Based Solid Electrolyte Toward Practical Application: Opportunities and Challenges. Nano-Micro Lett. 2024, 16, 1–33. [Google Scholar] [CrossRef]
  32. Yang, H.; Zhang, B.; Jing, M.; Shen, X.; Wang, L.; Xu, H.; Yan, X.; He, X. In Situ Catalytic Polymerization of a Highly Homogeneous PDOL Composite Electrolyte for Long-Cycle High-Voltage Solid-State Lithium Batteries. Adv. Energy Mater. 2022, 12. [Google Scholar] [CrossRef]
  33. Liu, F.-Q.; Wang, W.-P.; Yin, Y.-X.; Zhang, S.-F.; Shi, J.-L.; Wang, L.; Zhang, X.-D.; Zheng, Y.; Zhou, J.-J.; Li, L.; et al. Upgrading traditional liquid electrolyte via in situ gelation for future lithium metal batteries. Sci. Adv. 2018, 4, eaat5383. [Google Scholar] [CrossRef] [PubMed]
  34. Chen, T.; Wu, H.; Wan, J.; Li, M.; Zhang, Y.; Sun, L.; Liu, Y.; Chen, L.; Wen, R.; Wang, C. Synthetic poly-dioxolane as universal solid electrolyte interphase for stable lithium metal anodes. J. Energy Chem. 2021, 62, 172–178. [Google Scholar] [CrossRef]
  35. Chen, D.; Zhu, M.; Kang, P.; Zhu, T.; Yuan, H.; Lan, J.; Yang, X.; Sui, G. Self-Enhancing Gel Polymer Electrolyte by In Situ Construction for Enabling Safe Lithium Metal Battery. Adv. Sci. 2021, 9, 2103663. [Google Scholar] [CrossRef] [PubMed]
  36. Li, Z.; Tang, W.; Deng, Y.; Zhou, M.; Wang, X.; Liu, R.; Wang, C.-A. Enabling highly stable lithium metal batteries by using dual-function additive catalyzed in-built quasi-solid-state polymer electrolytes. J. Mater. Chem. A 2022, 10, 23047–23057. [Google Scholar] [CrossRef]
  37. Cheng, H.; Zhu, J.; Jin, H.; Gao, C.; Liu, H.; Cai, N.; Liu, Y.; Zhang, P.; Wang, M. , In situ initiator-free gelation of highly concentrated lithium bis (fluorosulfonyl) imide-1, 3-dioxolane solid polymer electrolyte for high performance lithium-metal batteries. Materials Today Energy 2021, 20, 100623. [Google Scholar] [CrossRef]
  38. Ma, J.; Wang, Z.; Wu, J.; Gu, Z.; Xin, X.; Yao, X. In Situ Solidified Gel Polymer Electrolytes for Stable Solid−State Lithium Batteries at High Temperatures. Batteries 2022, 9, 28. [Google Scholar] [CrossRef]
  39. Zhao, Y.; Yan, J.; Cai, W.; Lai, Y.; Song, J.; Yu, J.; Ding, B. Elastic and well-aligned ceramic LLZO nanofiber based electrolytes for solid-state lithium batteries. Energy Storage Mater. 2019, 23, 306–313. [Google Scholar] [CrossRef]
  40. Kerner, M.; Plylahan, N.; Scheers, J.; Johansson, P. Thermal stability and decomposition of lithium bis(fluorosulfonyl)imide (LiFSI) salts. RSC Adv. 2016, 6, 23327–23334. [Google Scholar] [CrossRef]
  41. Huang, J.; Hollenkamp, A.F. Thermal Behavior of Ionic Liquids Containing the FSI Anion and the Li+ Cation. J. Phys. Chem. C 2010, 114, 21840–21847. [Google Scholar] [CrossRef]
  42. Li, L.; Zhou, S.; Han, H.; Li, H.; Nie, J.; Armand, M.; Zhou, Z.; Huang, X. Transport and Electrochemical Properties and Spectral Features of Non-Aqueous Electrolytes Containing LiFSI in Linear Carbonate Solvents. J. Electrochem. Soc. 2011, 158, A74–A82. [Google Scholar] [CrossRef]
  43. Frisch, M. J.; Trucks, G. W.; Schlegel, H. B.; Scuseria, G. E.; Robb, M. A.; Cheeseman, J. R.; Scalmani, G.; Barone, V.; Petersson, G. A.; Nakatsuji, H.; Li, X.; Caricato, M.; Marenich, A. V.; Bloino, J.; Janesko, B. G.; Gomperts, R.; Mennucci, B.; Hratchian, H. P.; Ortiz, J. V.; Izmaylov, A. F.; Sonnenberg, J. L. ; Williams; Ding, F.; Lipparini, F.; Egidi, F.; Goings, J.; Peng, B.; Petrone, A.; Henderson, T.; Ranasinghe, D.; Zakrzewski, V. G.; Gao, J.; Rega, N.; Zheng, G.; Liang, W.; Hada, M.; Ehara, M.; Toyota, K.; Fukuda, R.; Hasegawa, J.; Ishida, M.; Nakajima, T.; Honda, Y.; Kitao, O.; Nakai, H.; Vreven, T.; Throssell, K.; Montgomery Jr., J. A.; Peralta, J. E.; Ogliaro, F.; Bearpark, M. J.; Heyd, J. J.; Brothers, E. N.; Kudin, K. N.; Staroverov, V. N.; Keith, T. A.; Kobayashi, R.; Normand, J.; Raghavachari, K.; Rendell, A. P.; Burant, J. C.; Iyengar, S. S.; Tomasi, J.; Cossi, M.; Millam, J. M.; Klene, M.; Adamo, C.; Cammi, R.; Ochterski, J. W.; Martin, R. L.; Morokuma, K.; Farkas, O.; Foresman, J. B.; Fox, D. J. Gaussian 16 Rev. C.01, Wallingford, CT, 2016.
  44. Li, G.; Liang, K.; Li, Y.; Duan, X.; Fu, L.; Cai, Z.; Zhang, Z.; Dai, J.; Sun, Y. Catalytic anode surface enabling in situ polymerization of gel polymer electrolyte for stable Li metal batteries. Nano Res. 2024, 1–8. [Google Scholar] [CrossRef]
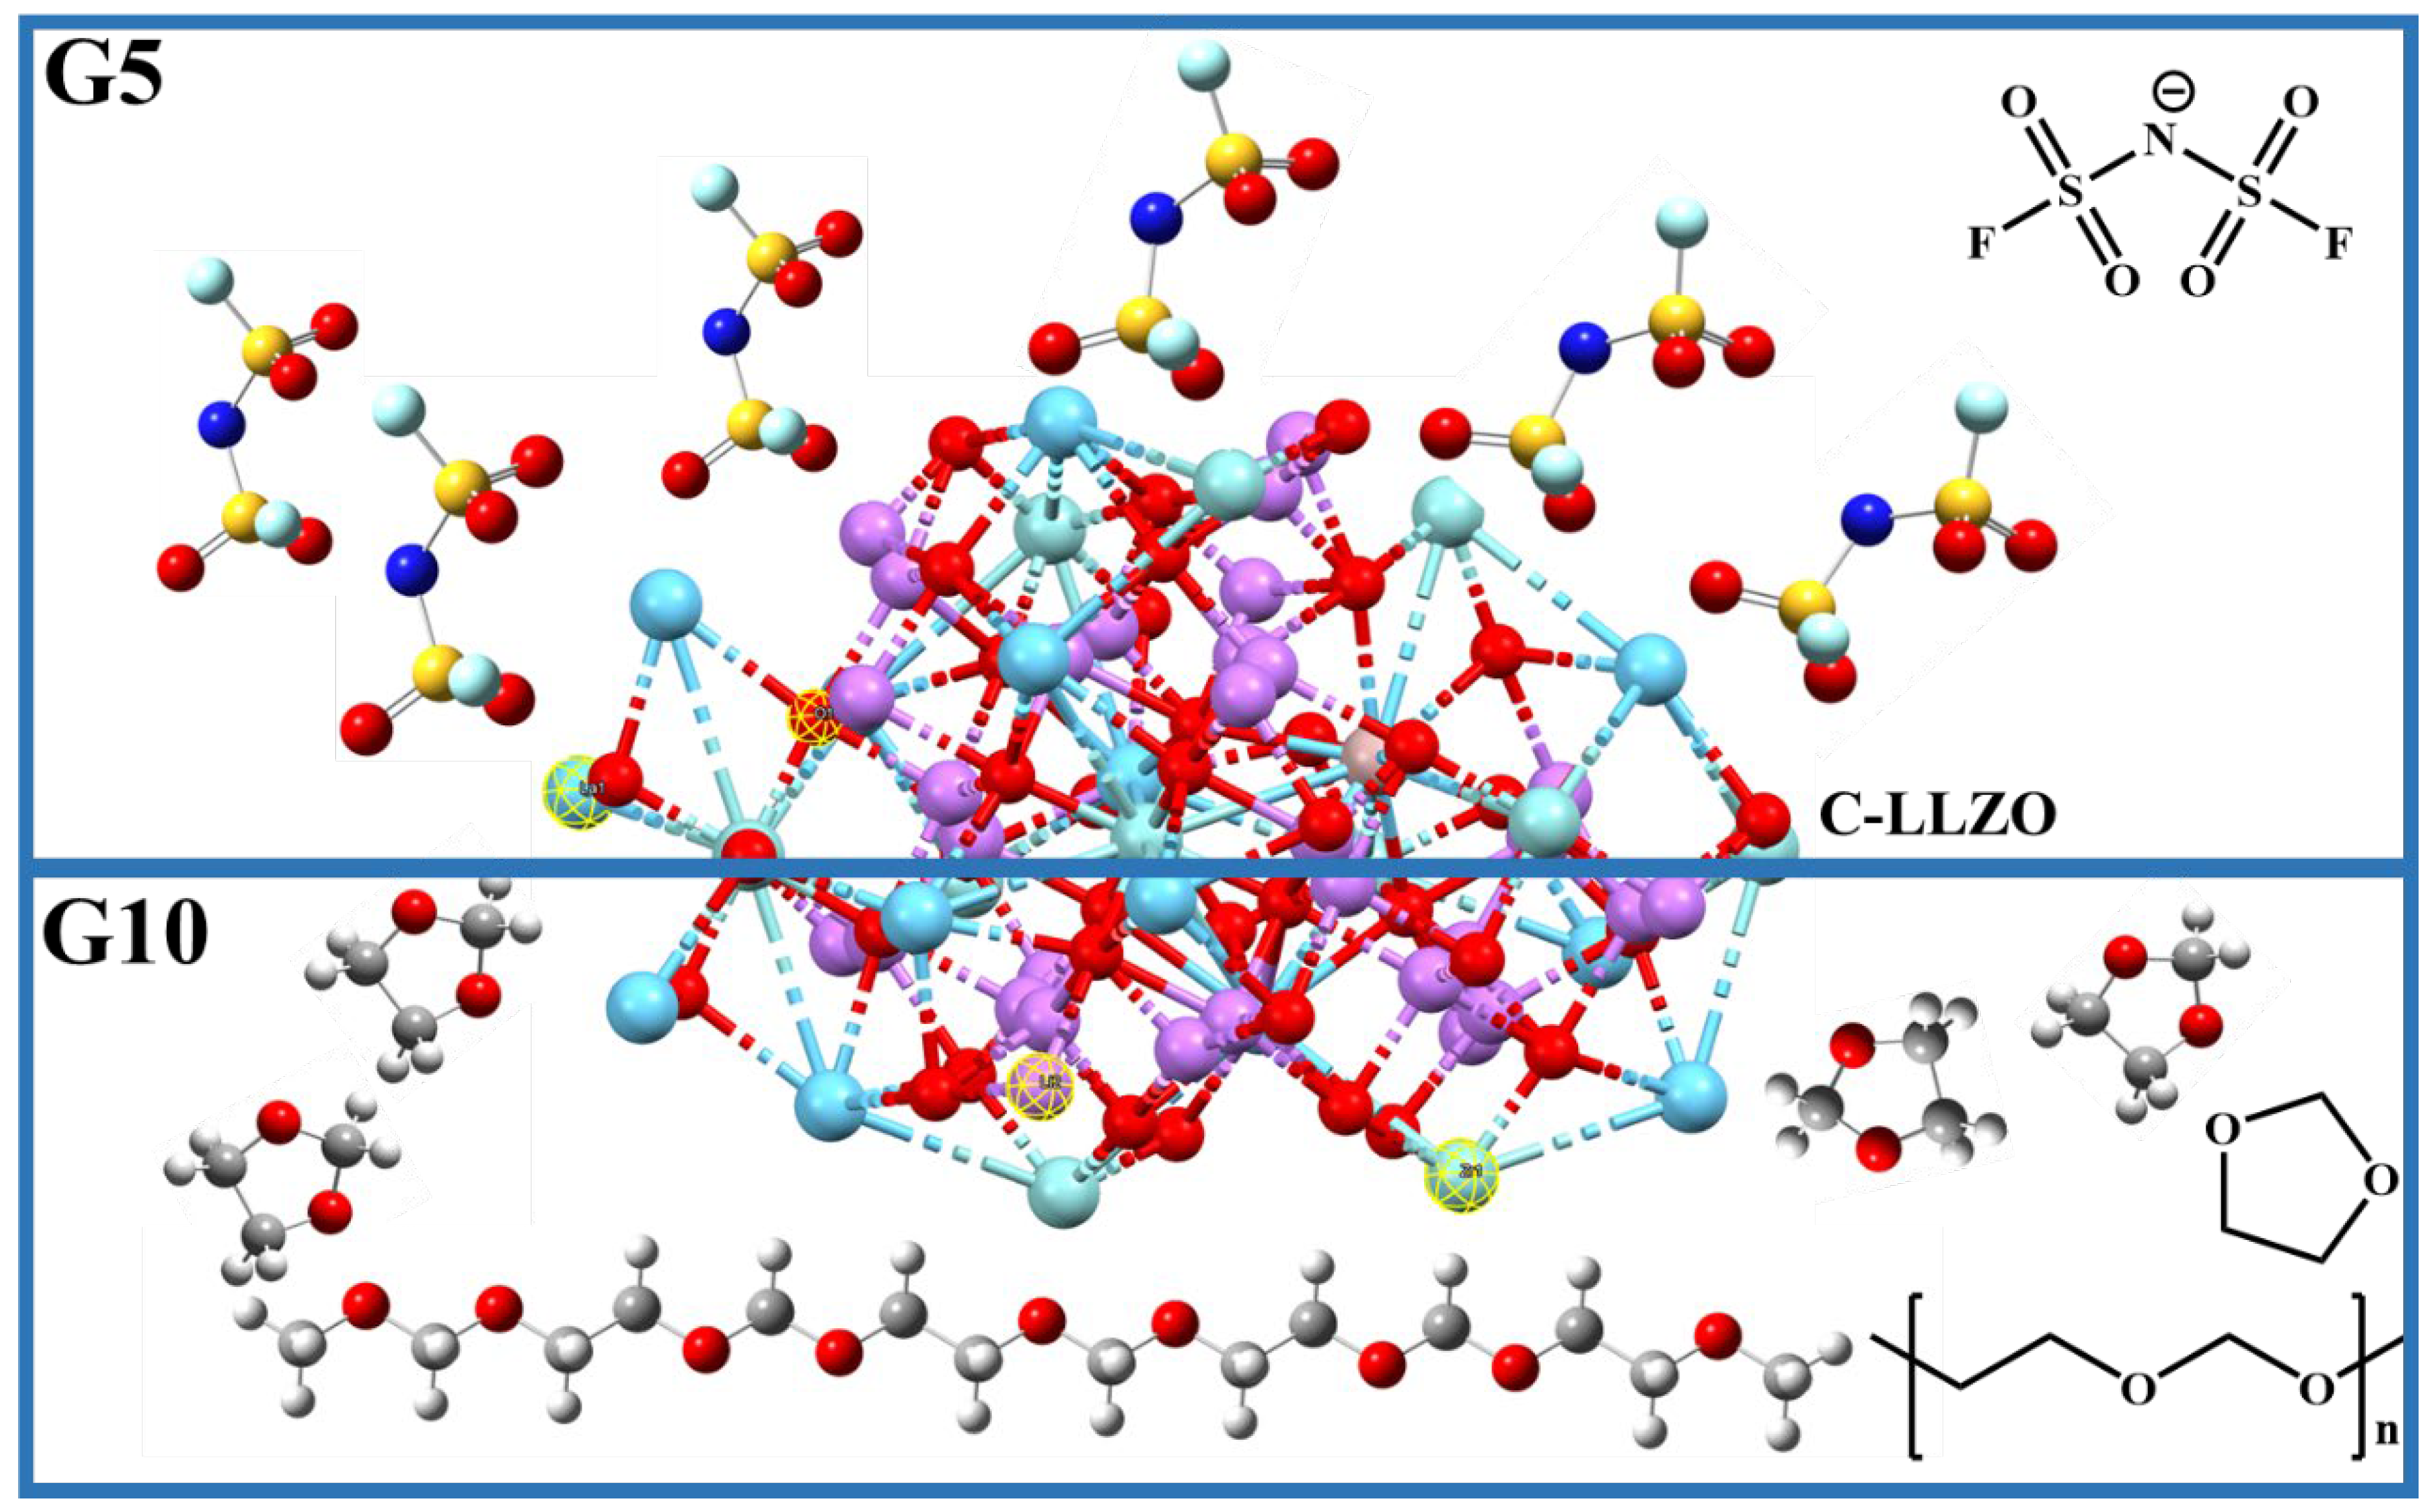
Figure 4. Cartoon mimics the proposed interactions and evolution trending between c-LLZO nanofibers and FSI-1 ion, DOL and PDOL in gel-composite electrolytes from G5 to G10. C-LLZO crystal structure CIF file is from https://www.crystallography.net/, visualized in Mercury software and put in the middle of this figure.
Preprints 103640 g004
Figure 5. LSV curves of Li//SS with G0, G1, G5, G10 and G20 composite electrolytes (a); Nyquist plots of SS/G10/SS (b) and SS/G5/SS (c) at different temperature; SS/G10/SS and SS/G5/SS conductivity under different temperature (d), fitting with Arrhenius equation ( б=Aexp(Ea/kT)). Li/G10/Li 10 mV polarization I-V curves and EIS spectra before and after polarization (e). Li/G10/Li, Li/G5/Li, and Li/G1/Li stripping-plating Voltage-time plots under current density of 0.1 mA/cm2, with plating-stripping capacity of 0.1 mAh/cm2 (f).Full cell performance.
Preprints 103640 g005
Figure 6. LFP/G10/Li battery cell (a-c) and LFP/G5/Li battery cell (d-f) charge-discharge voltage-capacity cycling performance (a,d), capacity retention (b,e), and energy retention (c,f) ability in related with the charge-discharge cycles.
Preprints 103640 g006
Table 1. -SO2- group symmetric (noted as vs-SO2-) and asymmetric (noted as vas-SO2-) vibration [40,41], and -F-S- group symmetric (noted as vs-S-F) and asymmetric (noted as vas-S-F) vibration wavenumber evolution along with c-LLZO weight concentration increasing.
Preprints 103640 i001
Disclaimer/Publisher’s Note: The statements, opinions and data contained in all publications are solely those of the individual author(s) and contributor(s) and not of MDPI and/or the editor(s). MDPI and/or the editor(s) disclaim responsibility for any injury to people or property resulting from any ideas, methods, instructions or products referred to in the content.
Copyright: This open access article is published under a Creative Commons CC BY 4.0 license, which permit the free download, distribution, and reuse, provided that the author and preprint are cited in any reuse.
Prerpints.org logo

Preprints.org is a free preprint server supported by MDPI in Basel, Switzerland.

Subscribe

© 2024 MDPI (Basel, Switzerland) unless otherwise stated