1. Introduction
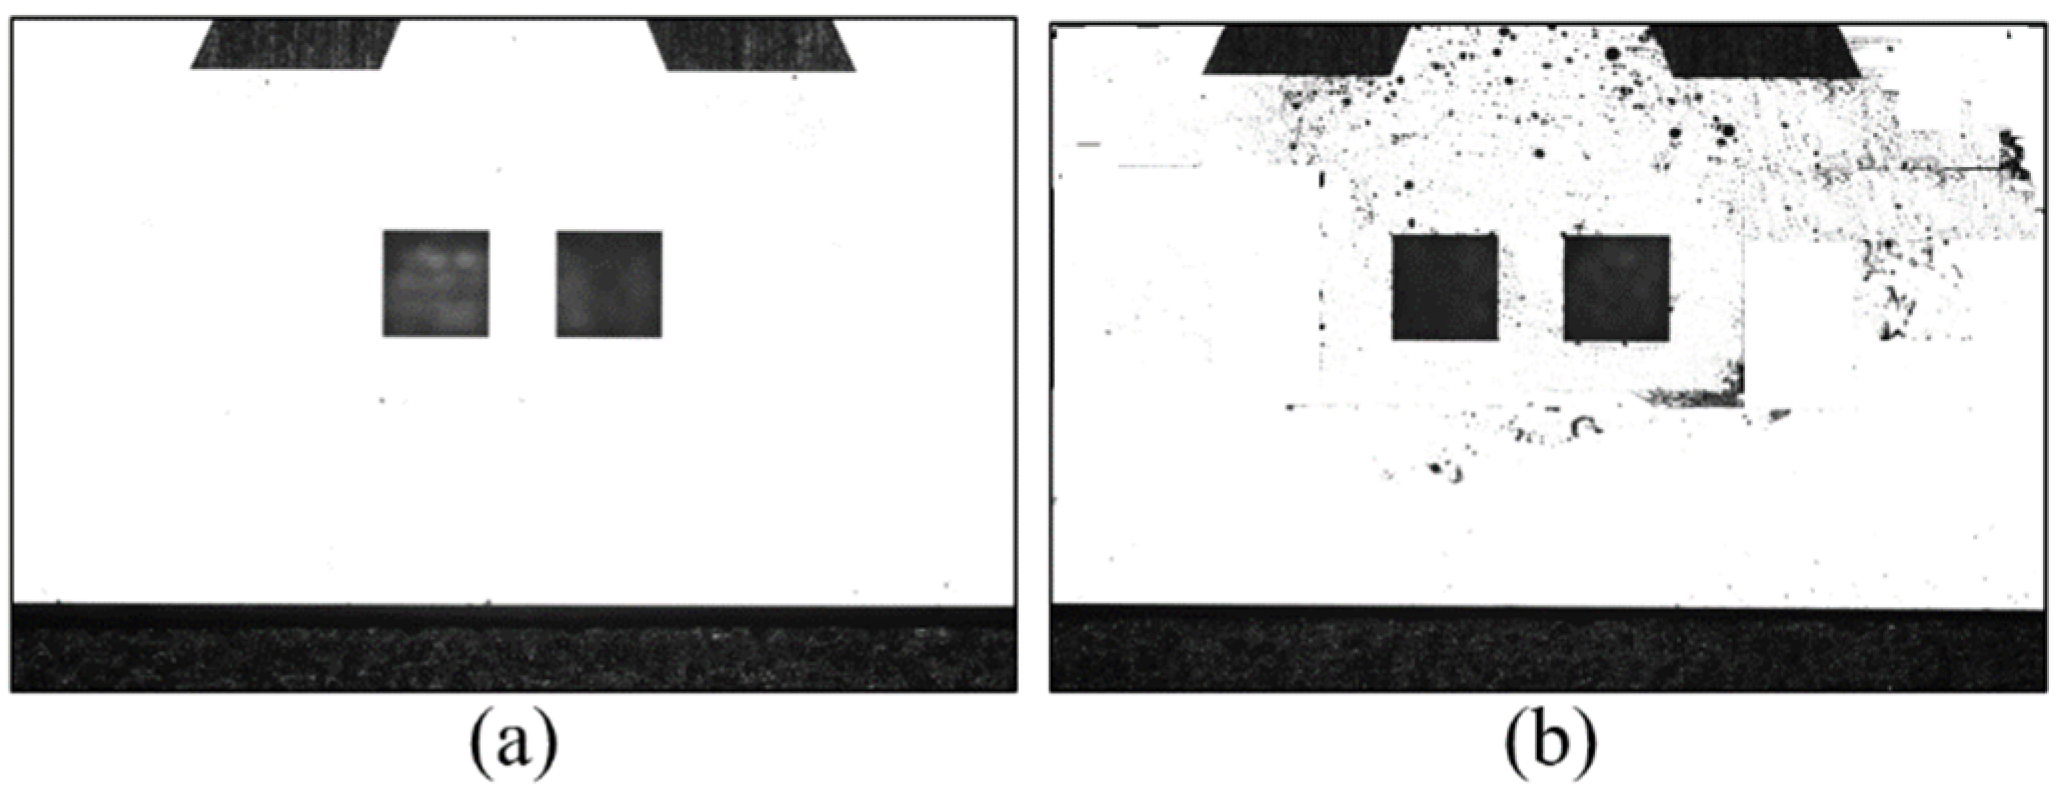
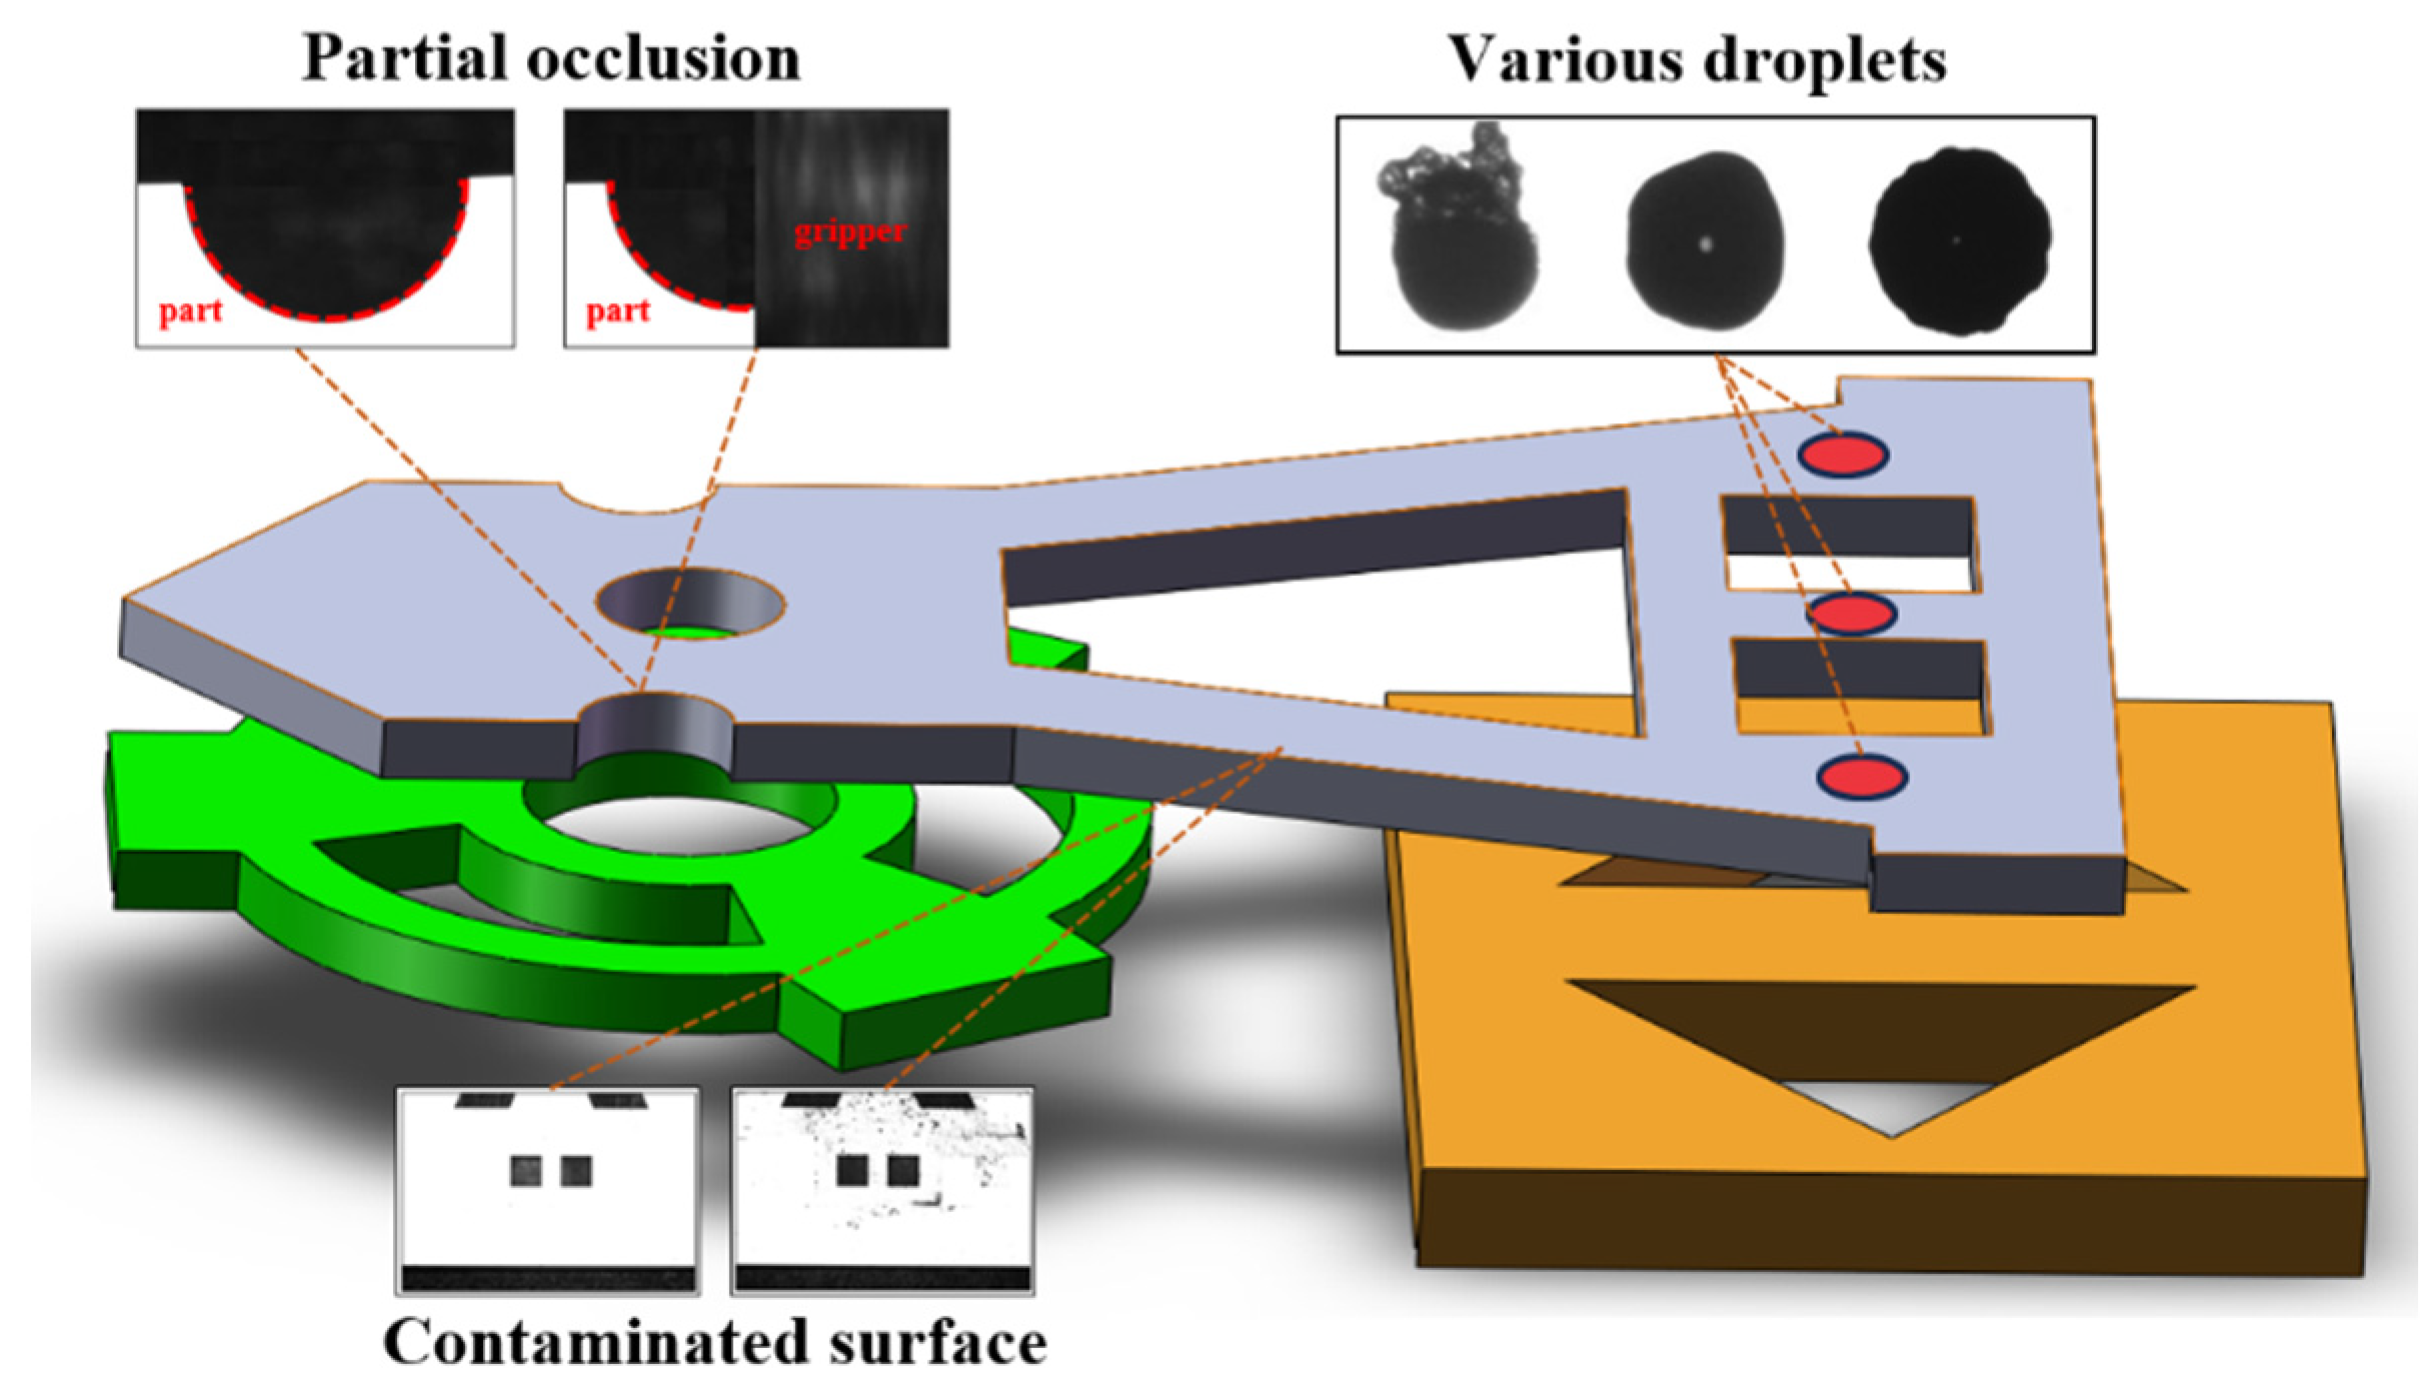
Automated micro-assembly is a crucial technology for cost-effective manufacturing of complex micro-products, in which microscopic vision is primarily utilized to guide mechanical units in picking up, placing, and connecting parts. Feature extraction methods in vision typically rely on feature points or contours via gradient calculation with a single fixed differential operator or a combination of operators. In fact, various uncertainties exist during the assembly process, including the surface contamination of microparts, the variations from pre-processing such as dispensing, and the partial occlusions between parts and grippers which affect the integrity and clarity of the feature points and contours, thereby leading to the mistakes of feature extraction, as shown in
Figure 1. To prevent further harmful actions with the mistakes, the auxiliary constraints to mechanisms or algorithms are commonly indispensable. However, if the assembly process requires changes, numerous adjustments may be necessary with these approaches. Therefore, there is an urgent need to improve both the universality and robustness of vision techniques in the micro-assembly field [
1,
2,
3,
4].
In recent decades, the rapid development of artificial intelligence, particularly deep learning (DL) and reinforcement learning, has presented new opportunities for advancing micro-assembly. Deep networks, being the most powerful and practical machine learning models, are commonly encountered and significantly enhance the performance of various recognition tasks [
5,
6,
7,
8].
In terms of feature detection, DL-based algorithms can be broadly categorized into single-stage algorithms and two-stage algorithms. Two-stage algorithms, such as the R-CNN series, firstly generate candidate regions and then perform classification and regression on these regions. While two-stage algorithms exhibit high detection accuracy, they involve a complex two-stage computation process. In contrast, single-stage algorithms, such as the YOLO series, merge region proposal, classification, and regression into a single stage, significantly enhancing detection efficiency. Currently, such algorithms had been successfully applied to the recognition of mechanical fasteners for aerospace assembly and rough positioning of target workpieces for gear assembly, resulting in significant improvements of both efficiency and accuracy [
9,
10,
11,
12,
13].
In practical tasks of micro-assembly, the detection aim is often to focus on key features that dominantly affect the assembly result, even if they only occupy a small area in scene. However, all parts in the scene are equally emphasized for primary deep neural network. Fortunately, the attention mechanism can provide a feasible solution, in which the system automatically chooses and emphasizes these significant regions or features based on the task requirements and image labels. Thus, the attention mechanism can obviously reduce the interference from irrelevant information and enhances the expression of important clues. Currently, there are several attention mechanisms available, including SENet, ECANet, and CBAM, all of which consist of either Channel Attention Module (CAM) or Spatial Attention Module (SAM). The CAM module learns global channel correlations, while the SAM module focuses on local structural positions [
14,
15]. Attention mechanisms have been utilized by Liu [
16], Wu [
17], Luan [
18], et al. to inspect component defects, weld seams. Their results show improvements in model detection mean Average Precision etc.
Another issue worth noting is the interpretability. For many applications in precision manufacturing field, the requirements for error compliance and process traceability are very rigorous. However, these machine learning methods are generally considered as black box containing billions of parameters that takes an input vector and returns an output vector. Unfortunately, no definitive answer exists for what exactly happen in the black box. Therefore, the existential risks could result in serious failures of assembly, and it is also difficult to exactly give out remedial tactics to ensure that it will not occur again. To solve the problem, the explainable AI had been presented to intrinsically assess the black box, in which the visualization plays a key role. Gradient-weighted Class Activation Mapping (Grad-CAM) generates a coarse localization map by using the gradients of the target concept in the last layer, thereby highlighting important areas of the image that are used to predict the target concept. Recently, it has been frequently used to produce “visual explanations” for decisions from class of CNN-based models [
19]. For example, Noh [
20] and Lin [
21] use the Grad-CAM visualization algorithm to evaluate the quality of anti-loosening coating on bolts and detect the bearing status of machine tools. The results show that this approach makes the decision results of their model more transparent and explainable.
Herein, in order to improve the performance of micro-assembly, we focus on the attention mechanism and visualizing CNNs for DL-based microscopic vision. The attention mechanism is combined with the single-stage detection algorithm to improve the sensitivity of detection algorithm to the target features. Visualization analysis of DL-based model is conducted using Grad-CAM to reveal the black box roperty and avoid potential risks during micro-assembly. The experiments about three typical assembly scenarios are performed to verify the learning effect and the detection accuracy.
2. Principle and Method
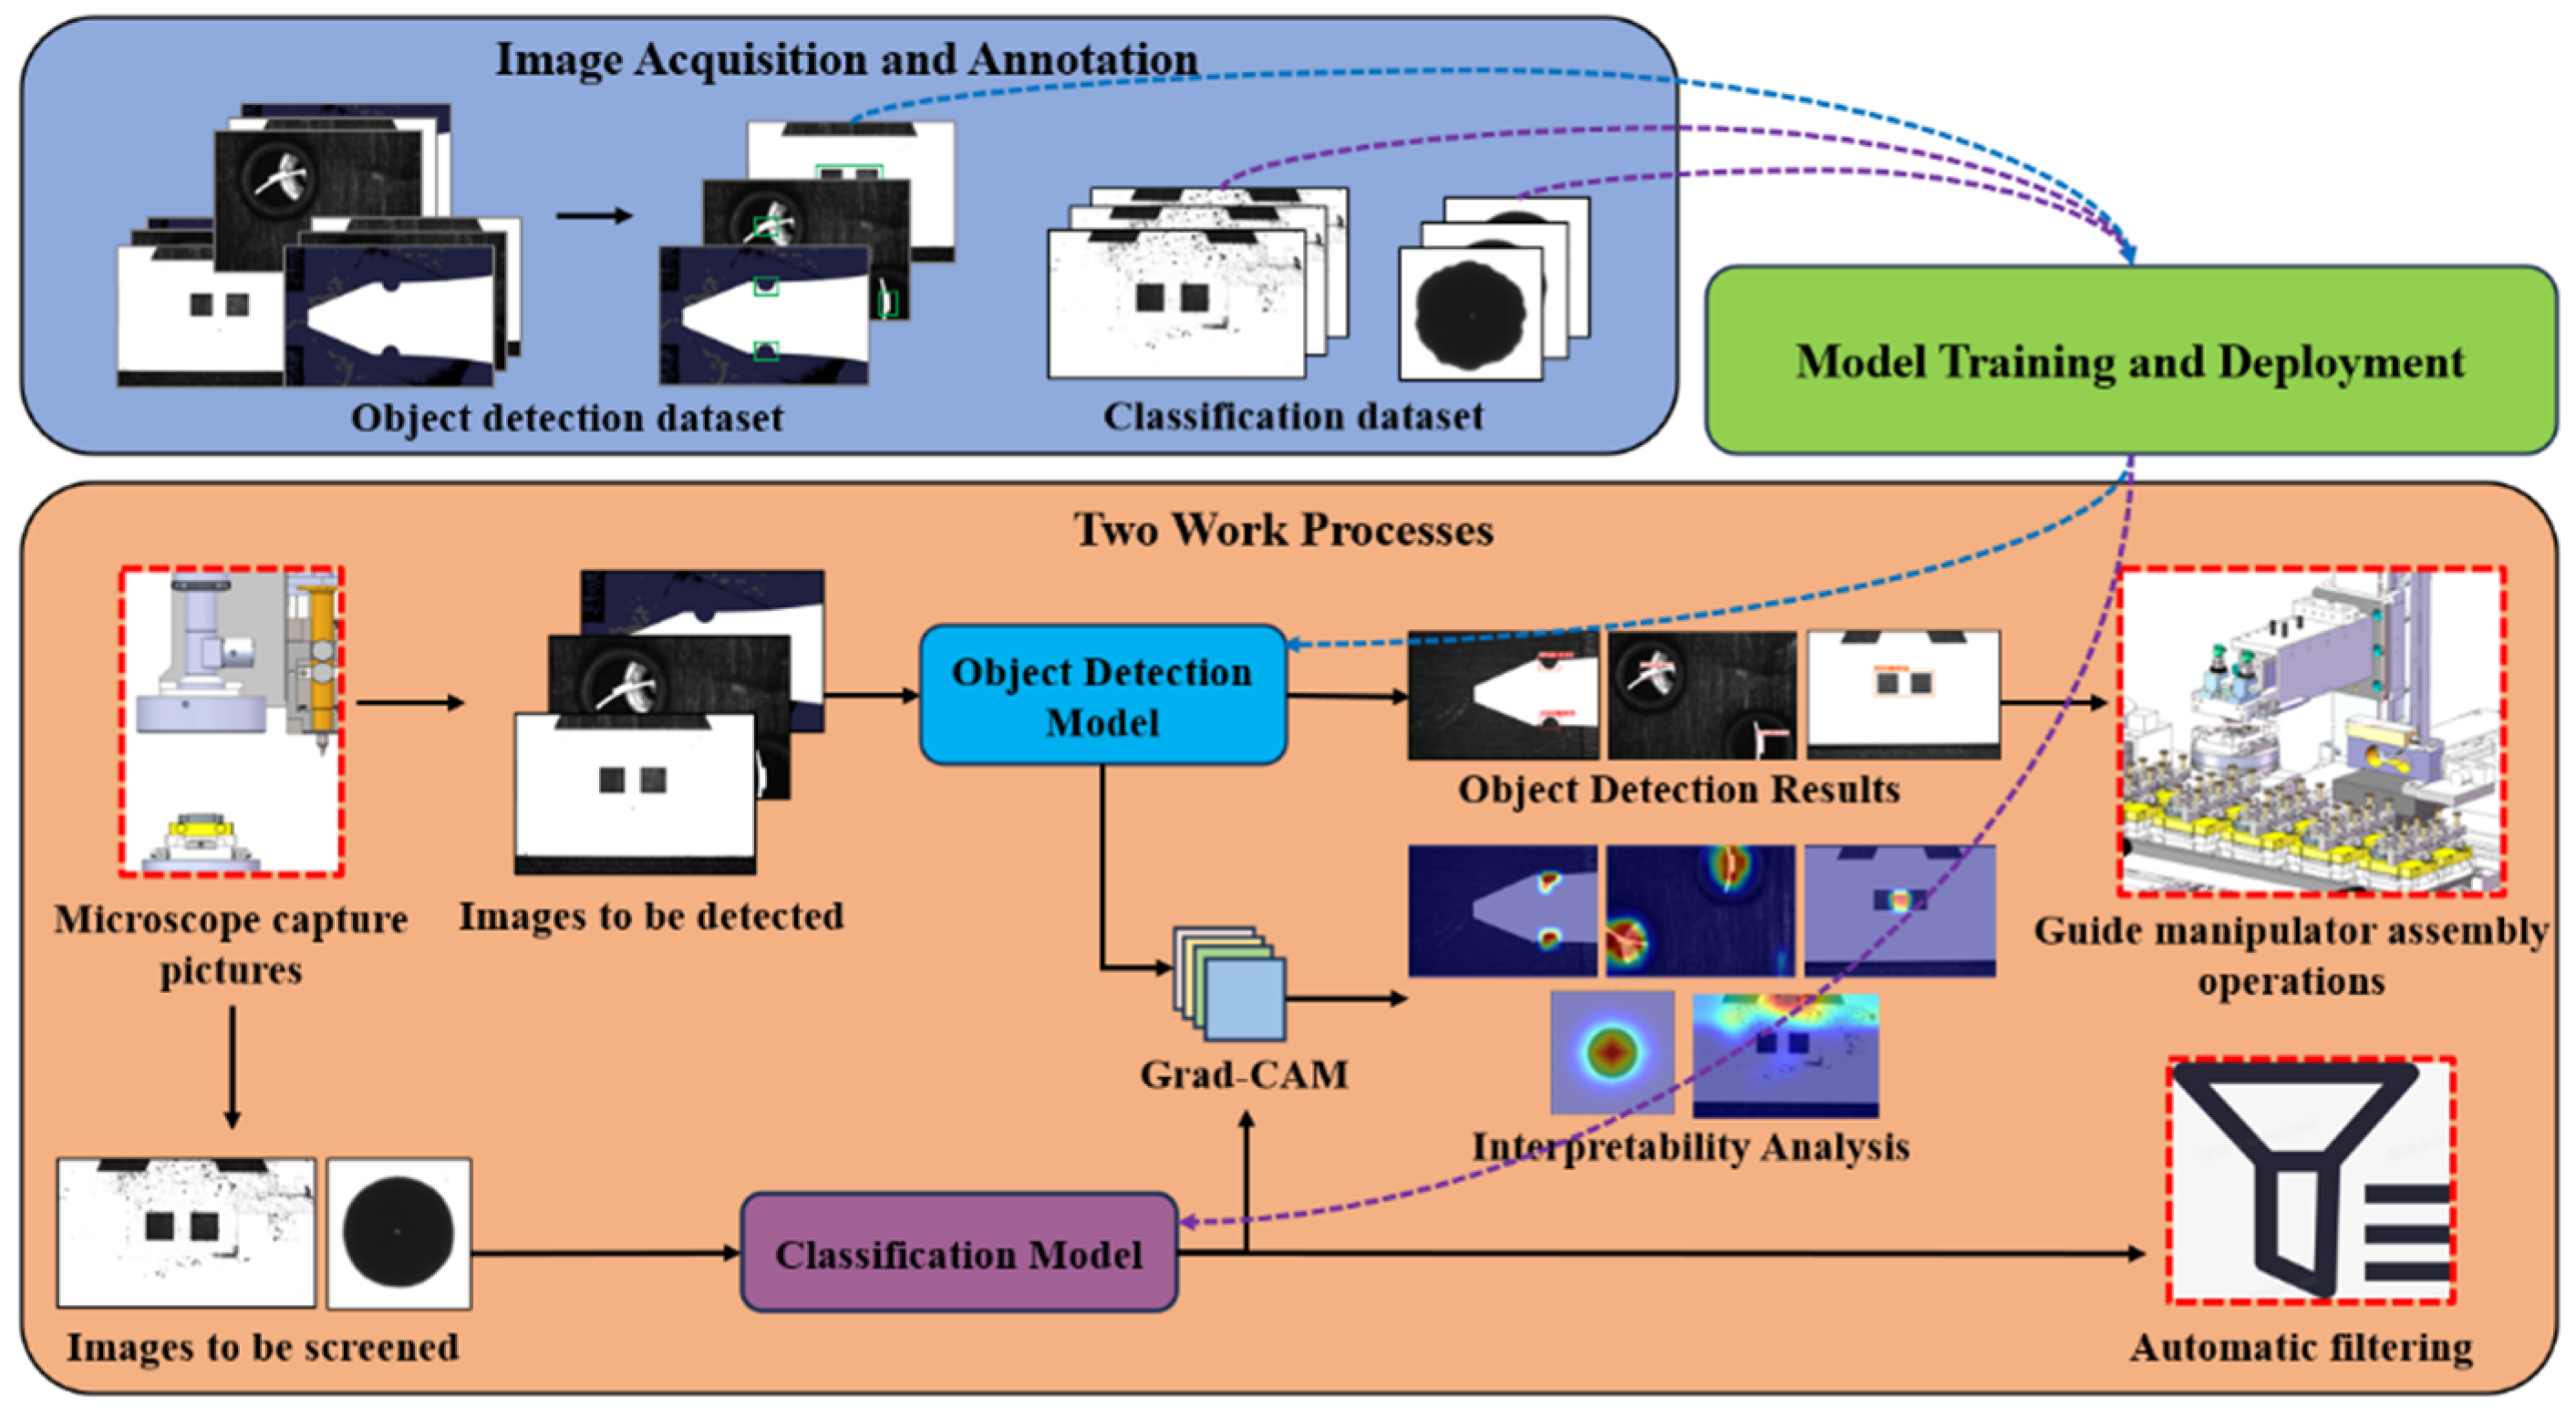
Figure 2 illustrates the overall framework and the work process.
Firstly, sample images are collected via the microscope installed on home-made device as shown in Figure 4 and annotated with the software of LabelImg. Then the constructed datasets are inputted into the object detection model and classification model for training.
Secondly, after model deployment, the home-made device performs visual detection tasks through two main processes. On one hand, it utilizes the microscope to capture images of microparts and inputs them into the object detection model to achieve feature recognition and localization, guiding the manipulator to carry out various operations. On the other hand, it captures images of micropart surfaces and droplets, feeding them into a Resnet50-based classification model for categorization.
Finally, the interpretability algorithms are utilized to generate heatmaps for visual analysis and to confirm whether there are potential visual detection risks during micro-assembly.
2.1. Enhanced YOLOv5s Model with Attention Mechanism
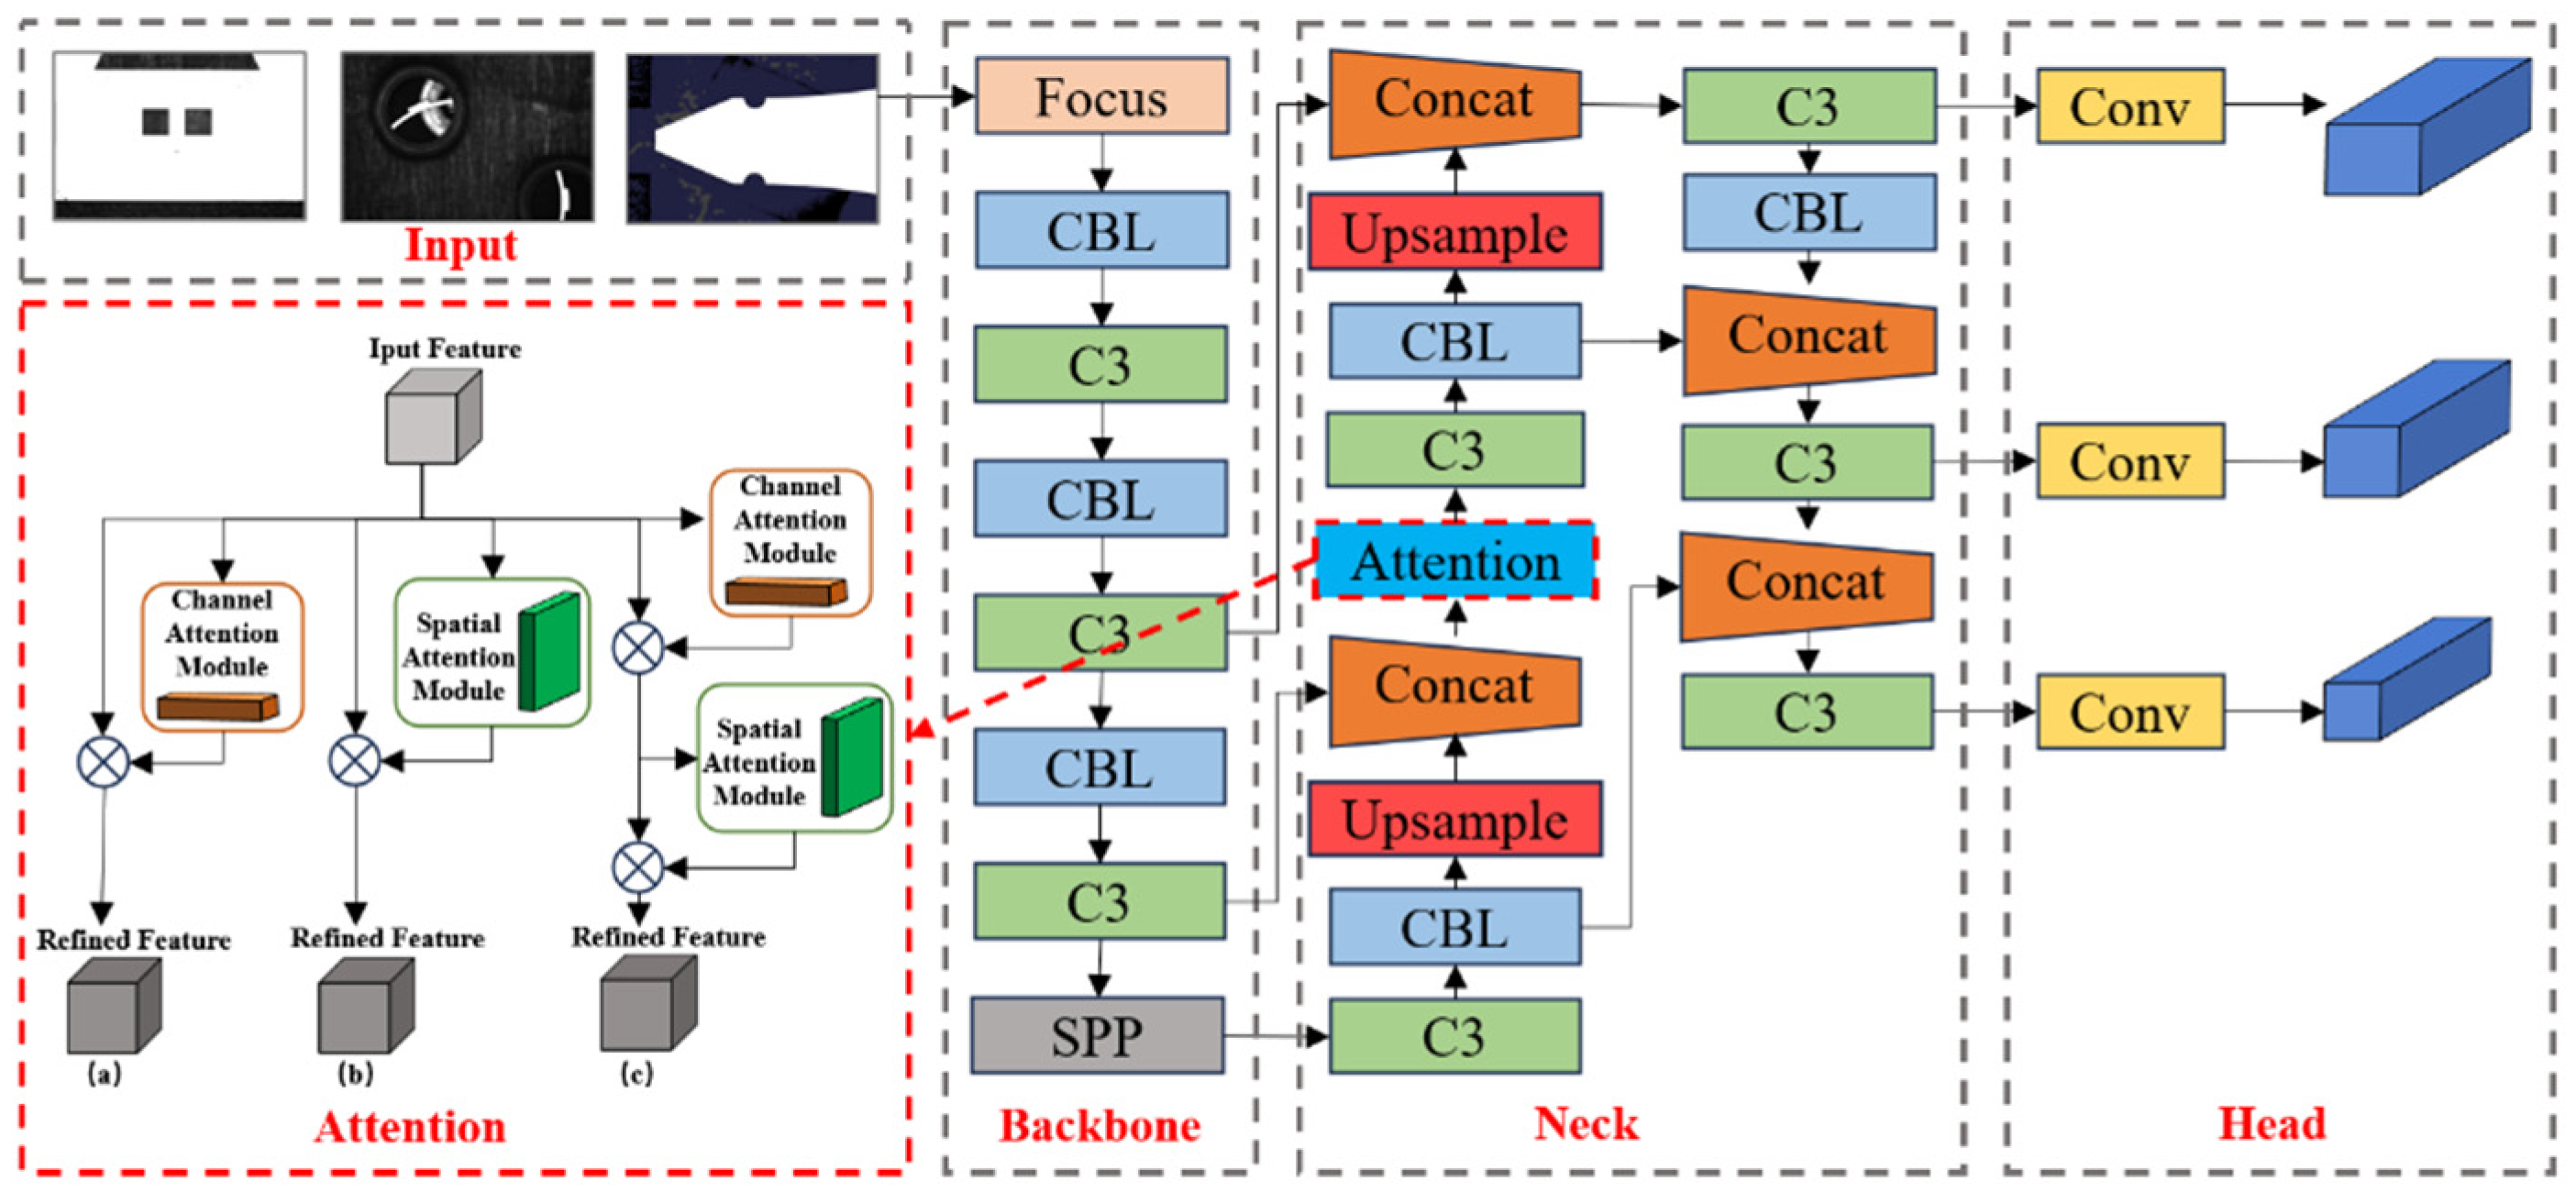
Here the single-stage YOLOv5s algorithm model as shown in
Figure 3 is adopted. This algorithm utilizes the CSPDarknet53 backbone network, incorporating FPN feature pyramids and its detection head structure. Furthermore, the introduction of Adaptive Anchor Boxes effectively enhances detection performance and training speed.
Attention mechanisms, as pluggable modules, can be integrated into neural networks, enhancing the model’s detection accuracy with minimal increase in computational complexity. Here we embed SENet, ECANet, CBAM, SimAM, and ShuffleAttention attention mechanisms into the neck of YOLOv5s model. This incorporation aims to enable the model to capture crucial features more accurately, thereby improving its generalization and accuracy. A comparative analysis will be conducted to select the optimal attention mechanism.
2.2. Implementation of Deep Learning Visualization Methods
Grad-CAM can evaluate the importance of each pixel in image for a specific class by computing the gradients of the model’s last convolutional layer. These gradients are treated as weights for feature maps, which are used to weight the sum of the last convolutional layer’s feature maps, resulting in a heatmap of class activations. The formula for Grad-CAM algorithm is described as Equations (1) and (2) [
17].
where
represents the predicted score by the network for class c,
represents the data at position
in channel k of feature layer A,
represents the weight for
, Z represents the width × height of the feature map.
Guided Grad-CAM is obtained by element-wise multiplication of the heat map generated by Grad-CAM and the gradient results (
) produced by Guided Backpropagation, resulting in a more detailed visualization effect. The calculation formula is described as Equation (3) [
19].
where ⊙ represents element-by-element multiplication operation.
In the heatmap, the red and highlighted areas indicate regions where the model has a significant impact on the classification prediction results, suggesting that the model relies more on the features extracted from these regions.
3. Experimental Setup
3.1. Experimental Platform
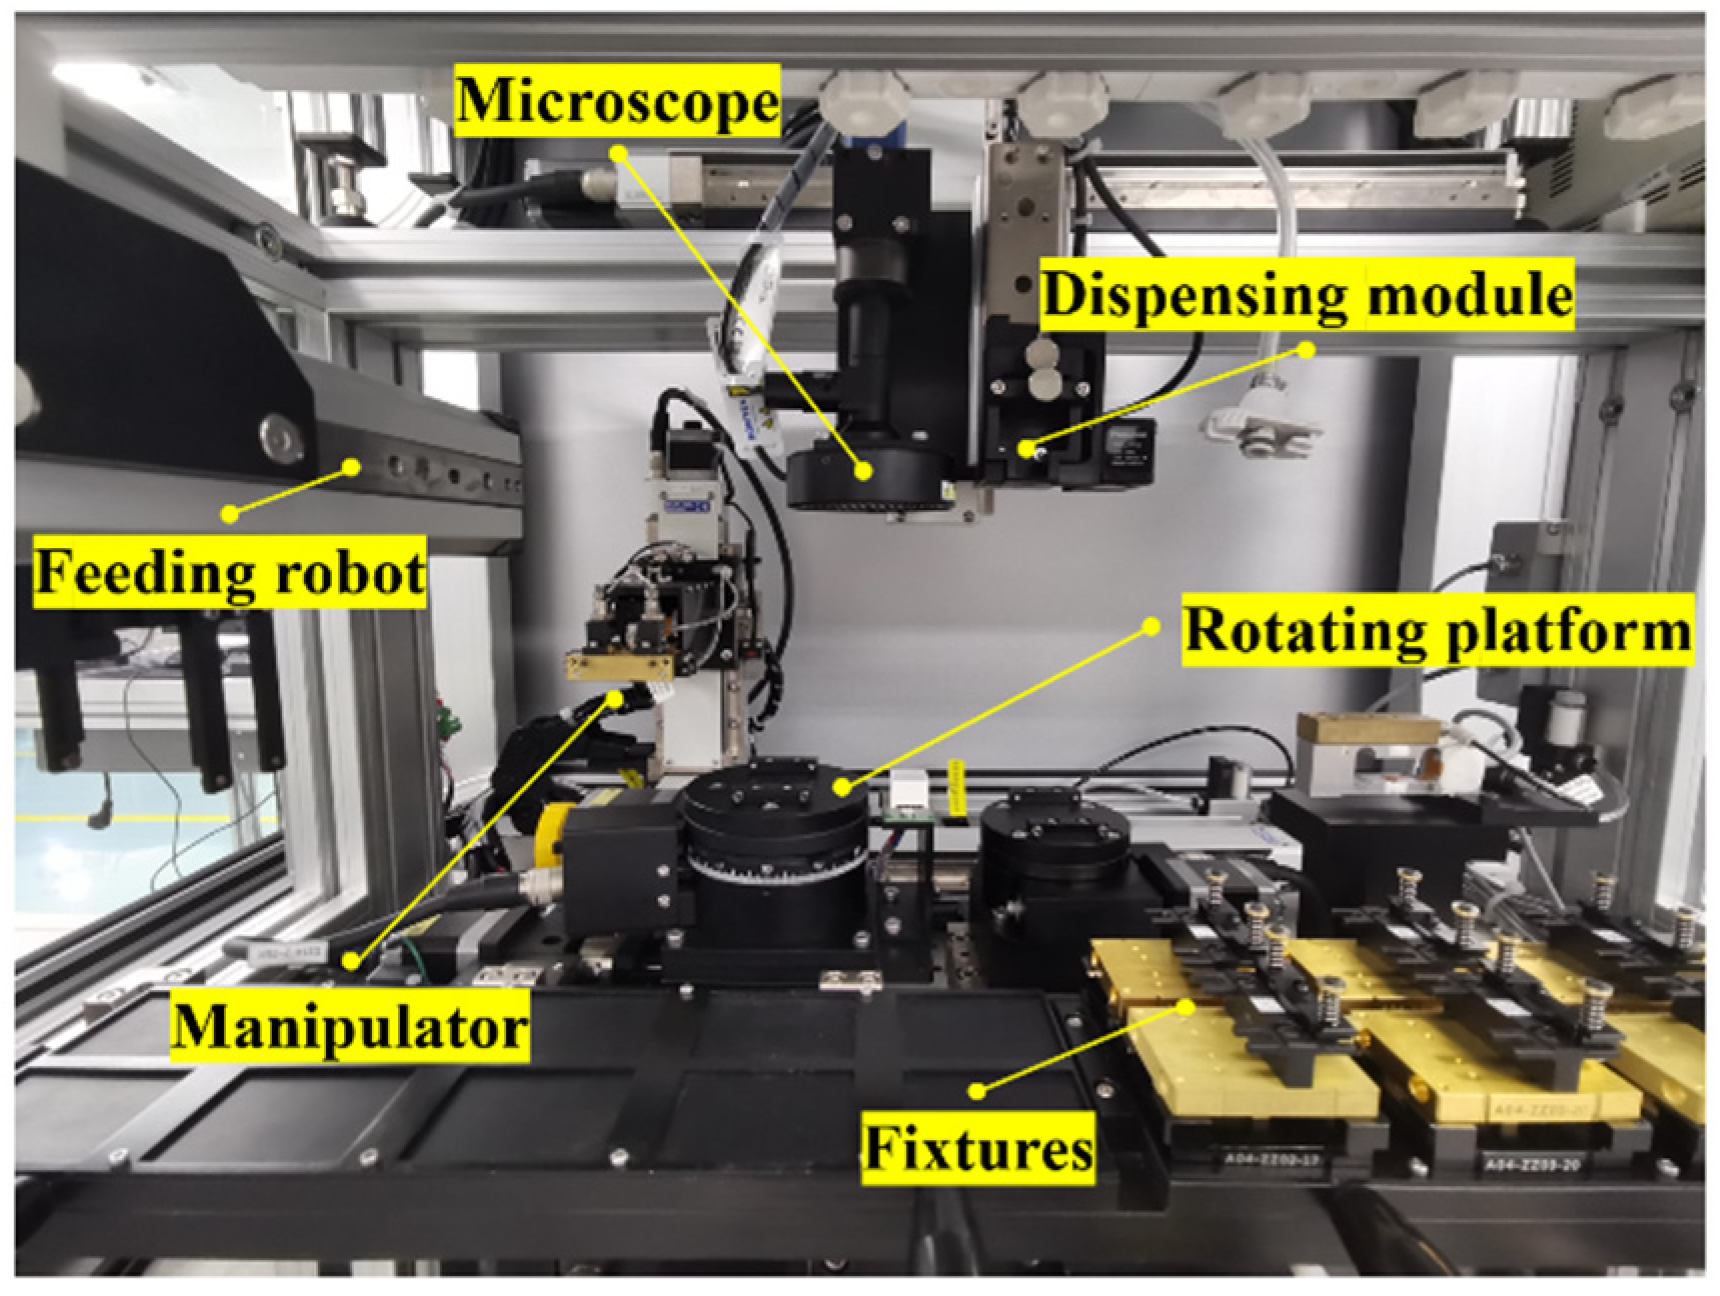
As shown in
Figure 4, the experimental platform consists of microscope, dispensing module, 3-DOF manipulator, feeding robot, rotating platform, etc. The microscope consists of one CCD (MER-630-60U3/C-L, Resolution: 3088 × 2064, Pixel size: 2.40 μm) and one sleeve lens. For the microscope, the working distance is 65 mm, and its maximum visual field is 7.5 mm. The dispensing module is composed of a dispenser and a pneumatic slide table. To adjust these observed microparts, the rotating platform is constructed with a rotary stage and two linear stages. The 3-DOF manipulator is utilized for tasks such as picking, aligning, and assembling microparts.
3.2. Dataset Preparation
Preparation of Object Detection Dataset. As shown in
Figure 5, three specific regions on microparts for MEMS sensor are selected as interest regions for target recognition based on the formulated automated assembly strategy. With the assistance of experimental platform, the datasets comprising a total of 1538 images are collected. There are 1123 images in the training set, 230 in the validation set and 185 in the testing set. Approximately 30% of the images exhibit varying degrees of occlusion in the feature region due to the involvement of the manipulator.
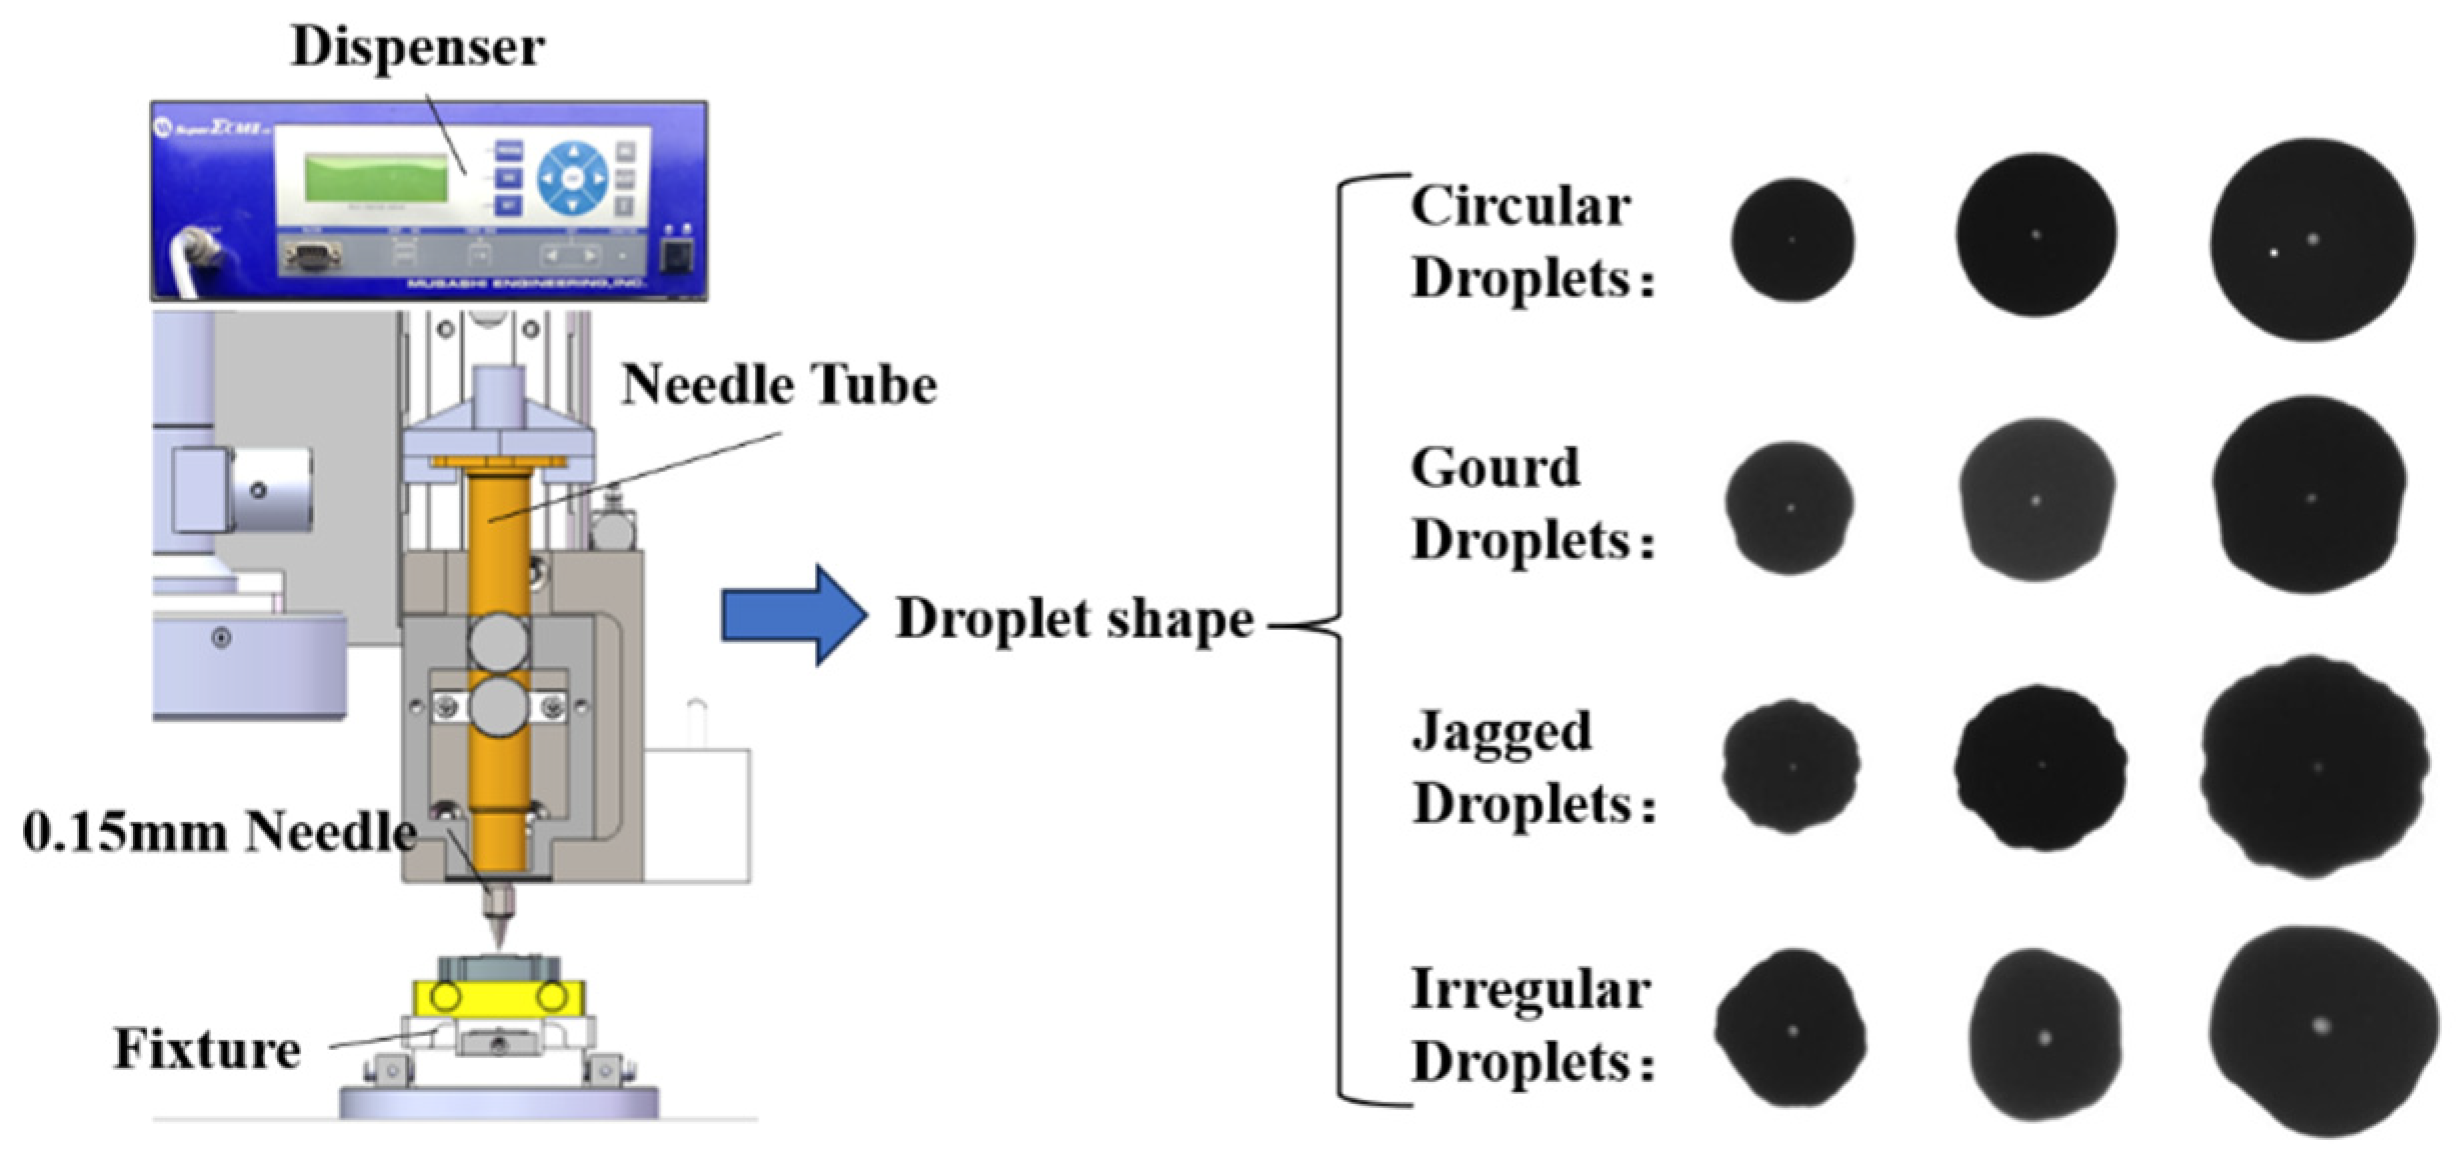
Preparation of Droplet Classification Dataset. Adhesive droplets are dispensed on the surface of 300 sets of microparts using needles with an inner diameter of 0.2 mm. The parameters of the dispenser are set to pressure 150 kPa and dispensing time 100~700 ms. A dataset, which comprises 2462 droplet images, is selected from a large number of droplet samples, including 817 images of circular droplets, 740 images of serrated droplets, 544 images of gourd-shaped droplets, and 361 images of irregular droplets. The four types of droplets are shown in
Figure 6.
Circular droplets exhibit good spreading properties, while gourd-shaped and Jagged droplets are caused by incomplete cleaning of the surfaces between microparts. Irregular-shaped droplets are often caused from bubbles and particles in adhesive. Generally, these imperfect droplets may lead to the poor connection strength or the additional stress. Thus, it is crucial to promptly identify and address those adhesive droplets before the contact connection of parts.
Preparation of Surface Classification Dataset. A total of 1286 images of micropart surfaces are collected for model training in this experiment. Among them, there are 655 images of contaminated micropart surfaces and 631 images of clean micropart surfaces.
Figure 7.
Images of micropart surface. (a) Clean surface. (b) Contaminated surface.
Figure 7.
Images of micropart surface. (a) Clean surface. (b) Contaminated surface.
3.3. Training Details
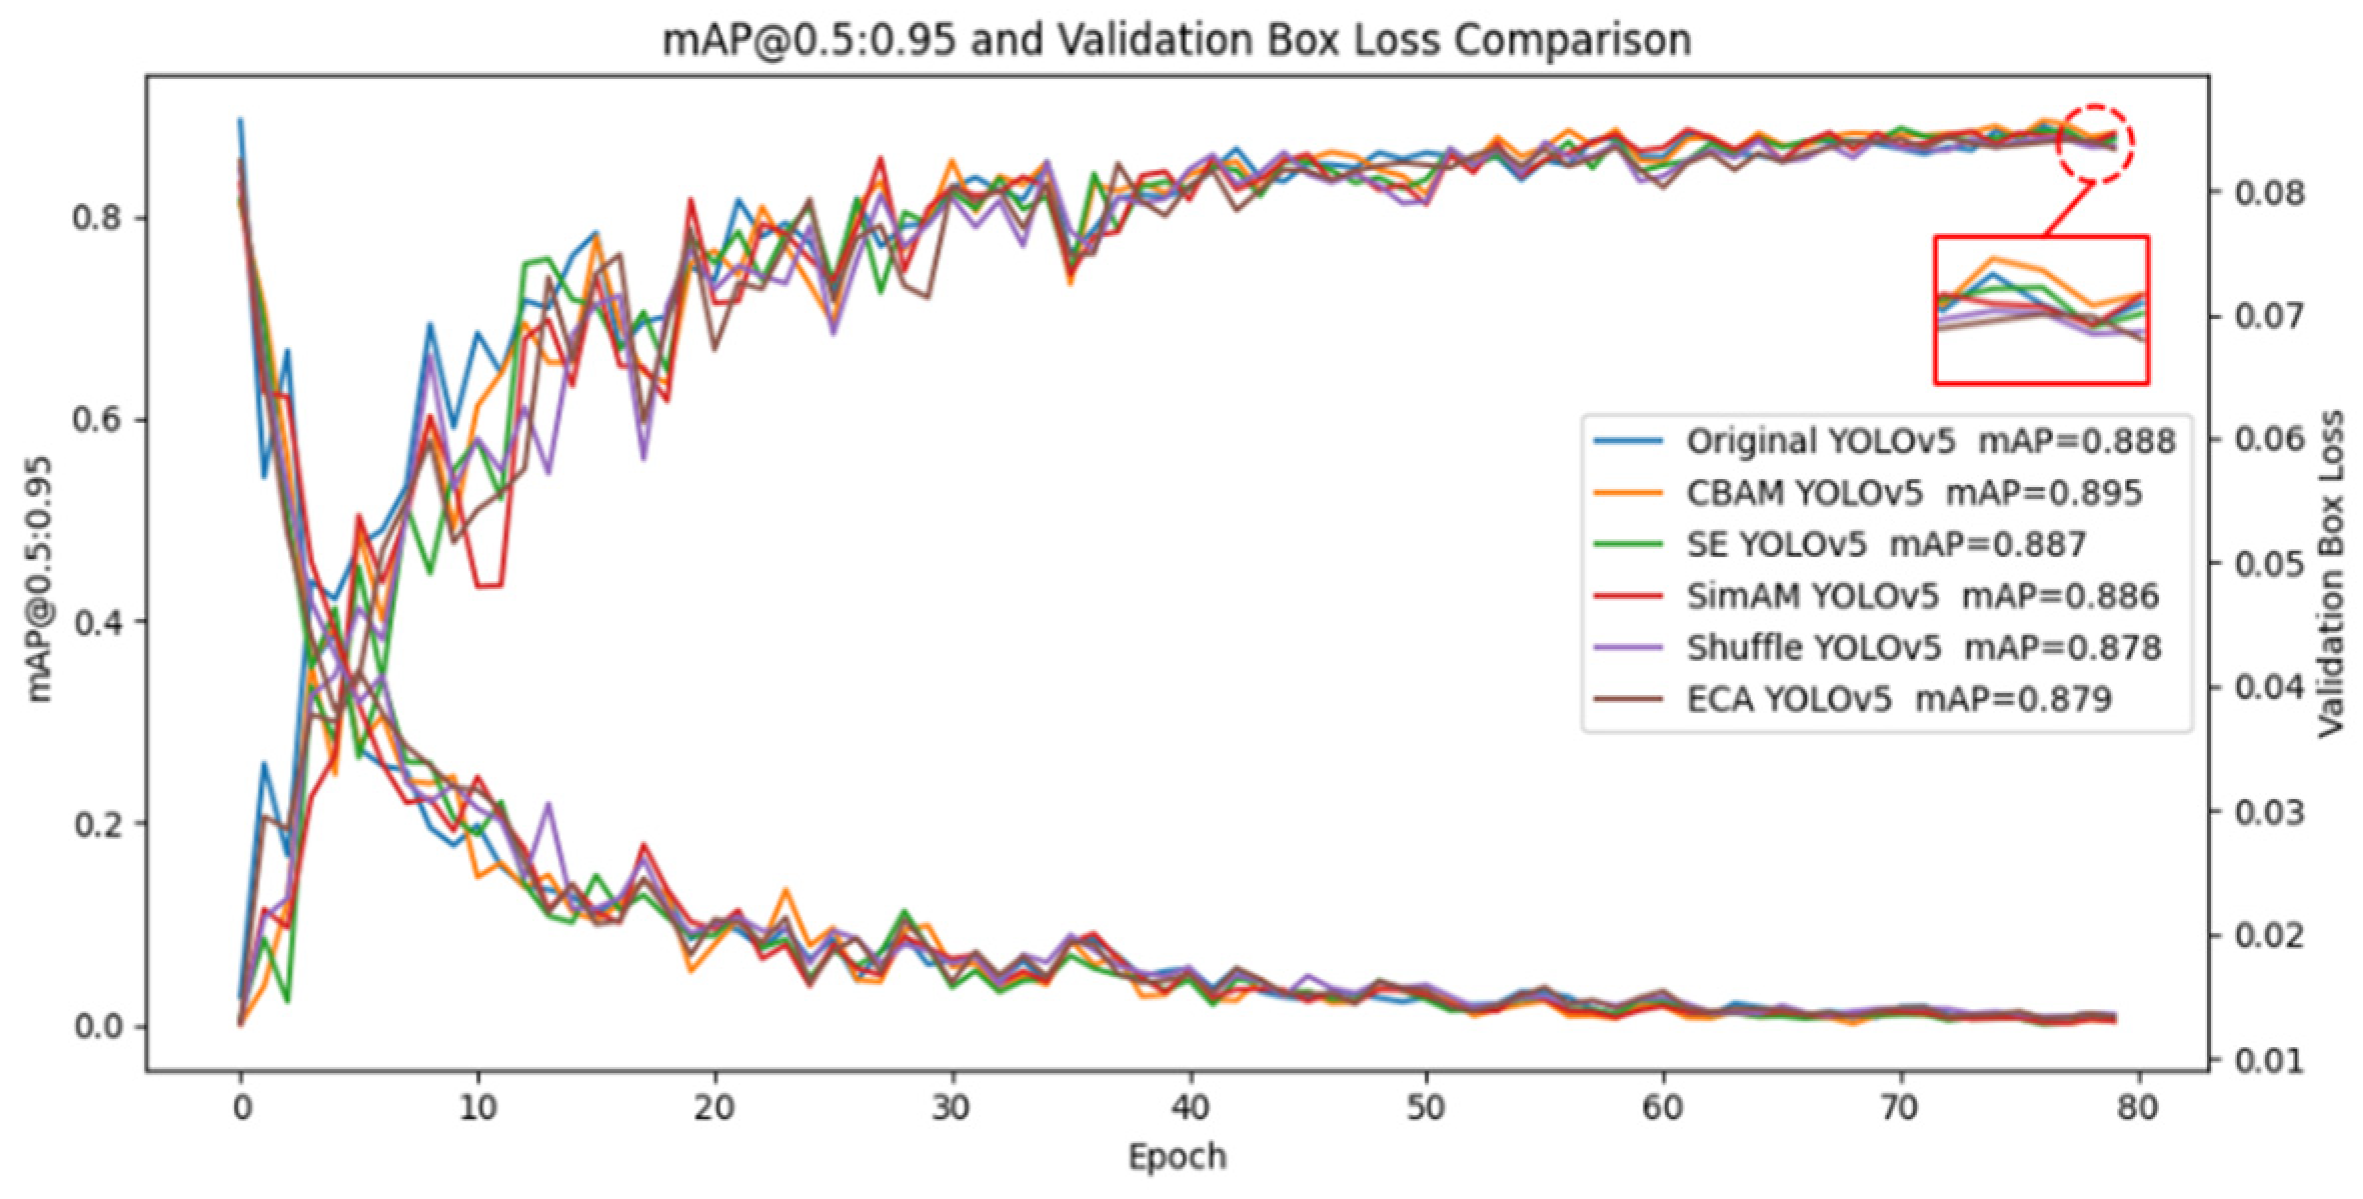
All experiments are conducted based on the Pytorch deep learning framework with Python. The hardware is configured with a NVIDIA GeForce GTX 3080Ti GPU and an Ubuntu operating system. A batch size of 16 is employed during training to expedite the process. Regarding the training epochs, all data are iterated over 80 times and the best model is saved.
For the object detection task, the training results of YOLOv5-SENet, YOLOv5-ECANet, YOLOv5-CBAM, YOLOv5-SimAM, and YOLOv5-ShuffleAttention models are shown in Figure 8.
Figure 8.
Training results of models.
Figure 8.
Training results of models.
By the 25th epoch, the loss gradually stabilizes, and after 30 epochs, the loss decreases to around 0.015. Comparing to other models, it is observed that the YOLOv5-CBAM method achieves an mAP@0.5:0.95 metric improvement of approximately 2%. Therefore, it is chosen for subsequent testing of micropart target feature occlusion.
Precision (
), Recall (
), Average Precision (
), and mean Average Precision (
) are used to comprehensively evaluate the models [
16].
Precision in Equation (4) refers to the percentage of correctly predicted targets, with high precision indicating a low false detection probability.
where
represents correctly predicted positive targets,
represents incorrectly predicted positive targets, and
represents incorrectly predicted negative targets.
Recall in Equation (5) represents the percentage of correctly predicted targets among all targets.
The average precision (
) value in Equation (6) is the area under the precision-recall curve.
And
in Equation (7) is the average of
values for all classes.
where
represents the average precision (
) when the IOU threshold is 0.5, and
calculates the
value by averaging the
values calculated for IOU thresholds from 0.5 to 0.95 with an interval of 0.05. This metric focuses more on the precision of target localization.
4. Results and Discussion
4.1. Visualization Analysis of YOLOv5-CBAM
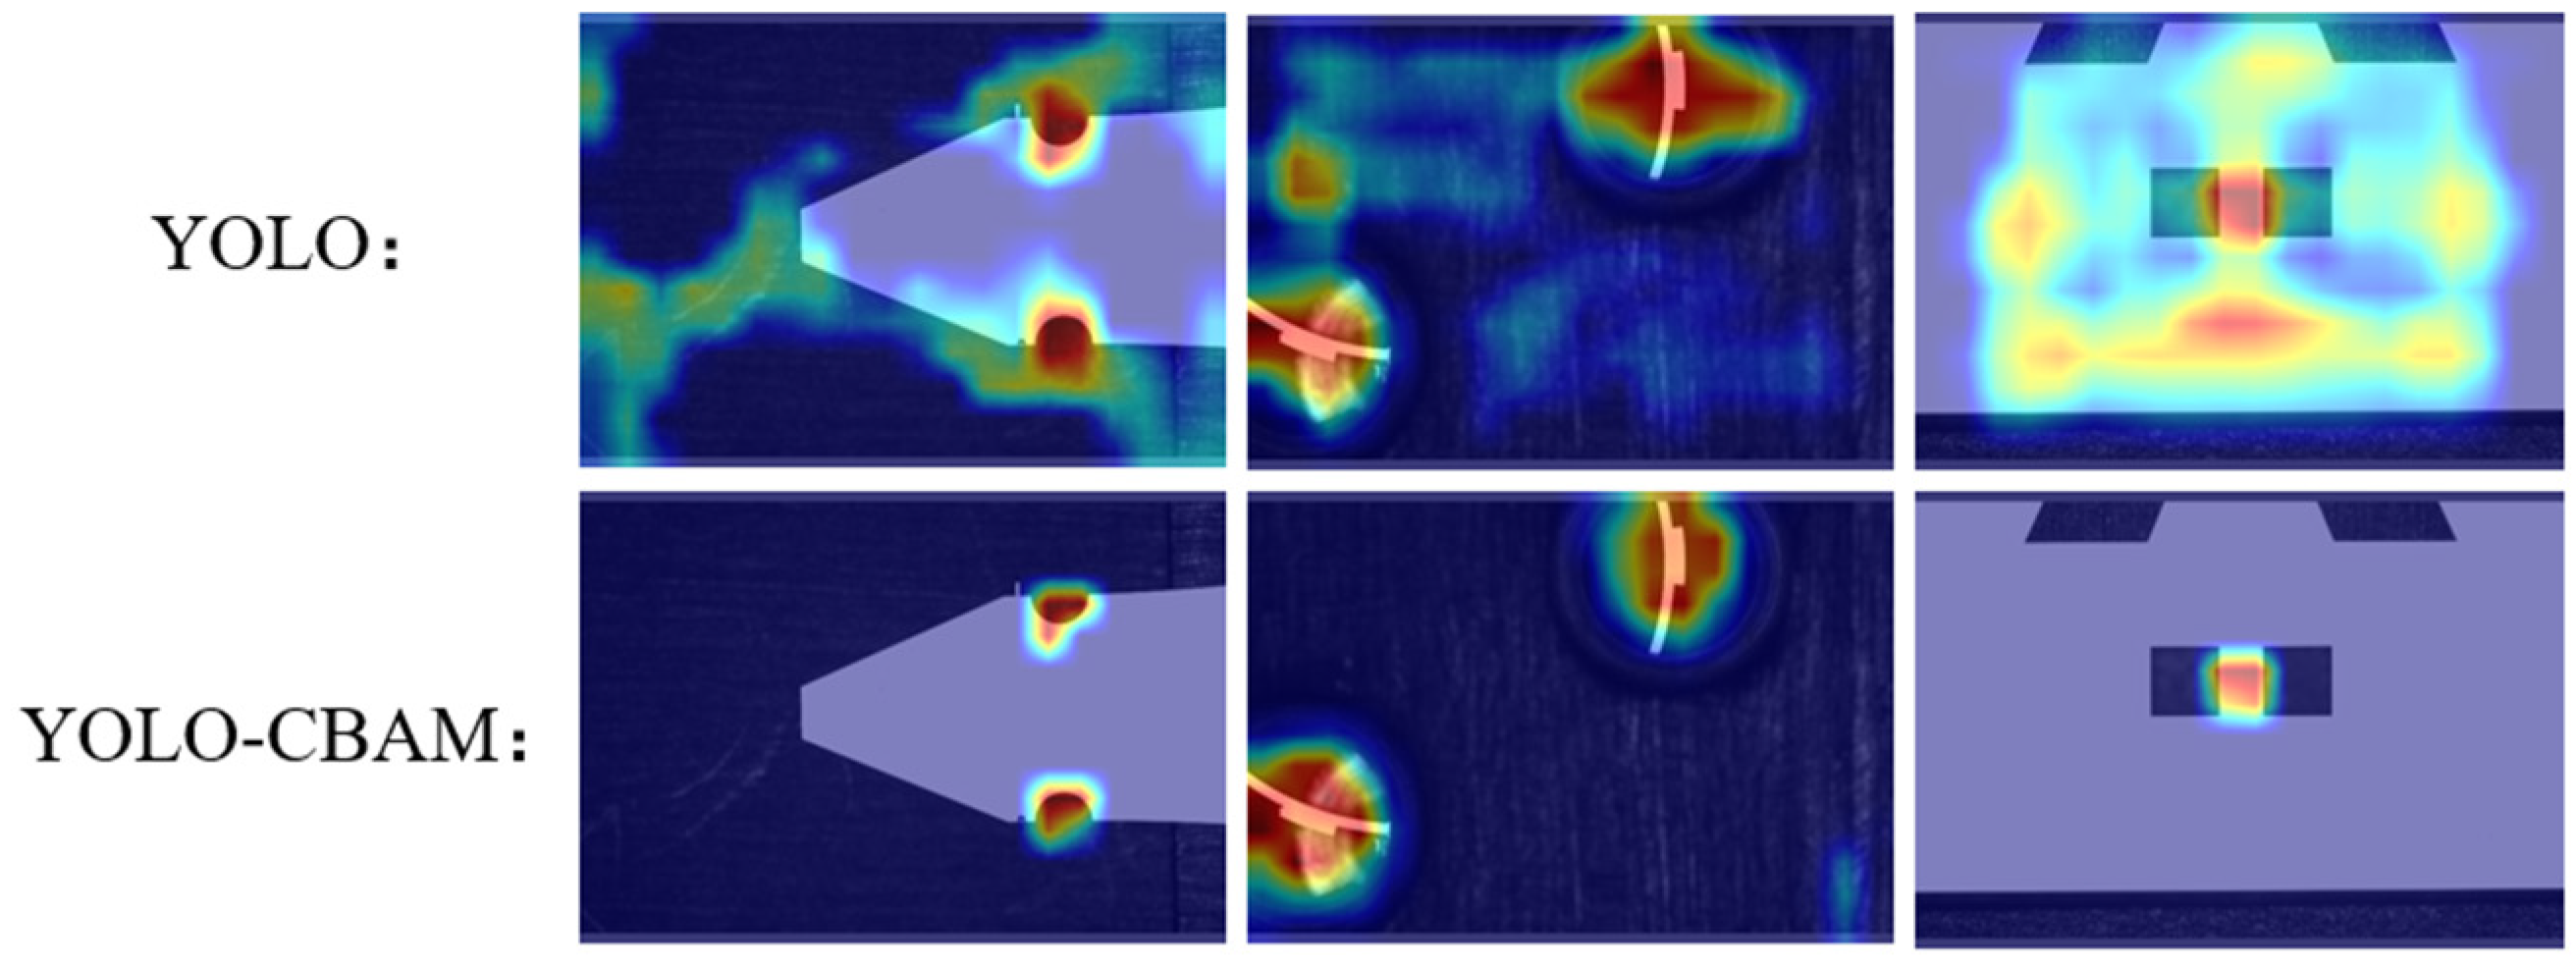
The visualization results of YOLOv5-CBAM and YOLOv5 model with Grad-CAM are shown in Figure 9. The original YOLOv5 model struggles to filter background information and tends to disperse attention across regions, resulting in poor visualization outcomes. In contrast, the YOLOv5-CBAM model can better focus attention on places around the target regions.
Figure 9.
Visualizations of models with Grad-CAM.
Figure 9.
Visualizations of models with Grad-CAM.
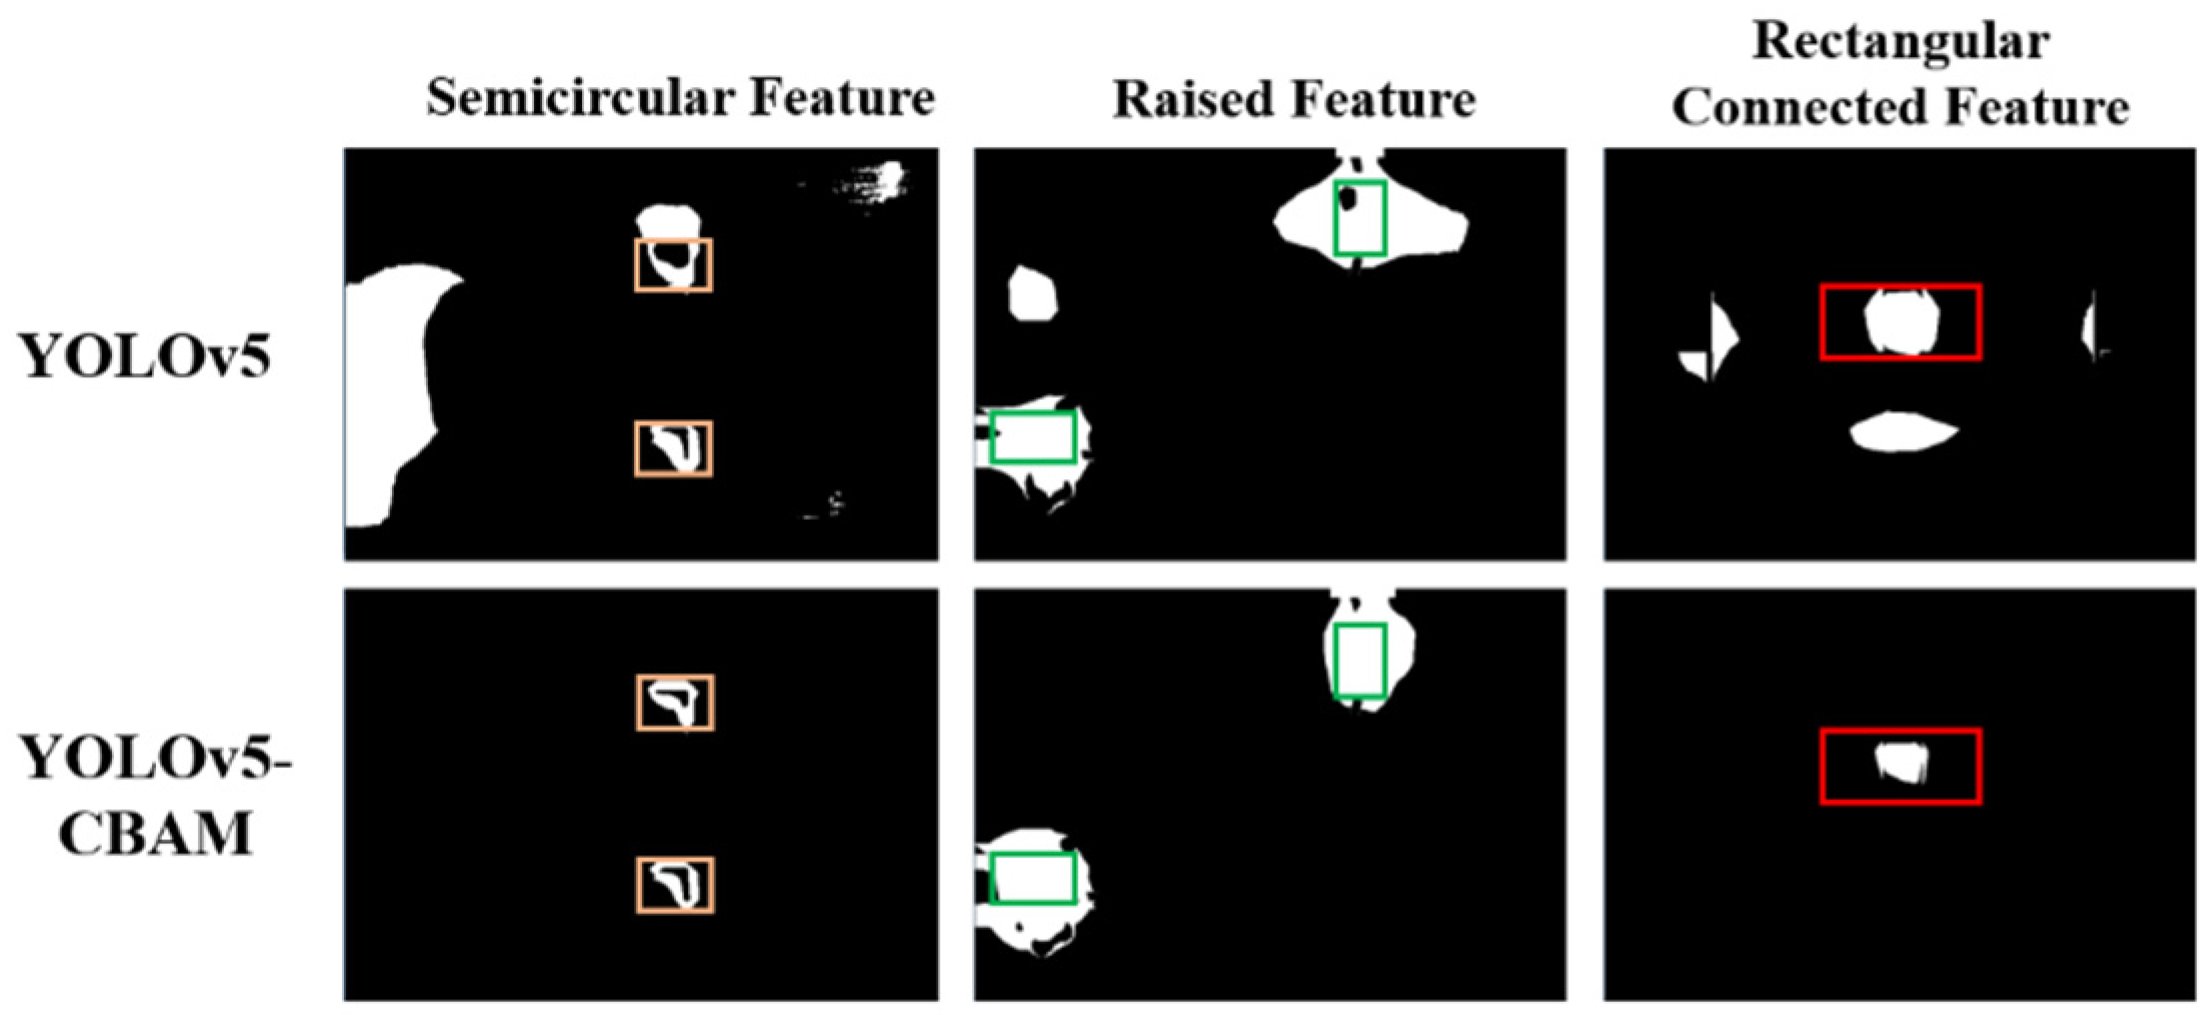
To quantitatively evaluate its effectiveness, we utilized the Intersection over Union (IOU) metric to assess the degree of alignment between the highlighted regions in the heatmap and the ground truth (GT) regions. A higher IOU value indicates a superior match. IOU is defined as the ratio of the number of intersecting pixels between the actual target region and the highlighted region to the total number of pixels in their union as shown in Figure 10. The formula is described as Equation (8).
Figure 10.
Segmentation images of highlighted regions.
Figure 10.
Segmentation images of highlighted regions.
From the results in
Table 1, the YOLOv5-CBAM model achieves significantly higher IOU values on all the three types of target features compared to the original model, with an average improvement of 27.81%. Therefore, the YOLOv5 model with integrated CBAM can more proficiently filter out the useless background and accurately reflect the location of the target regions when generating heatmaps.
4.2. Occlusion Experiment of YOLOv5-CBAM
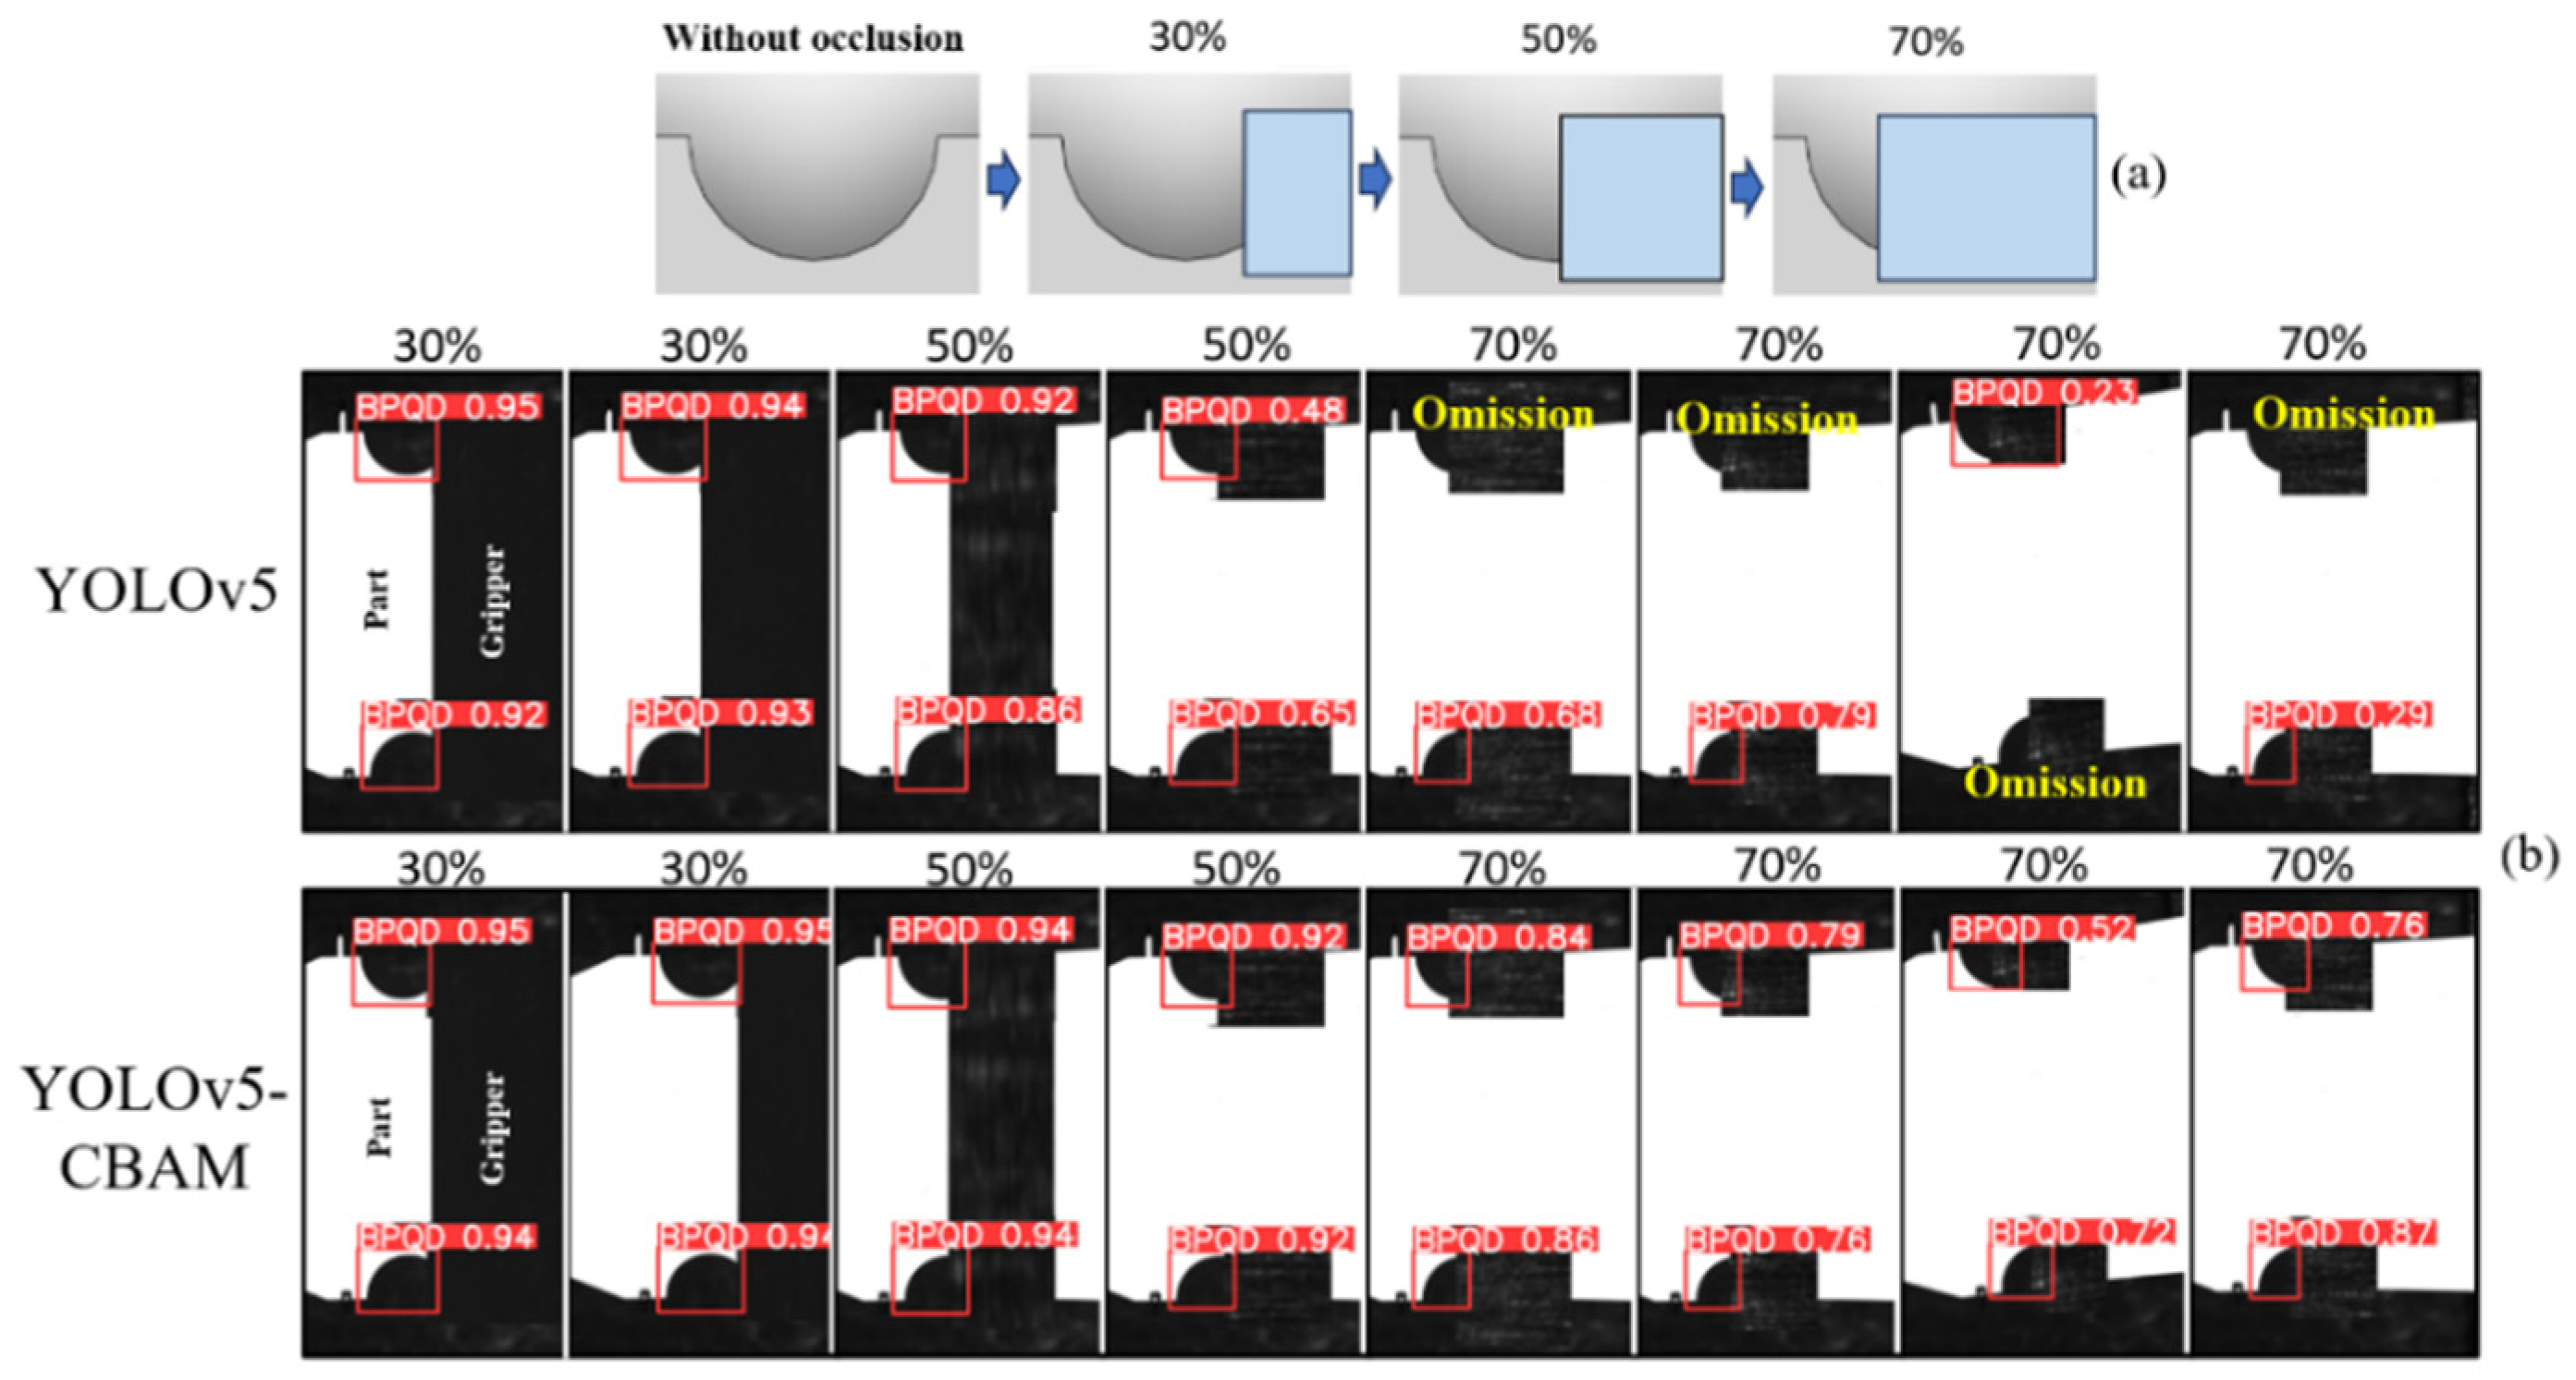
Firstly, the part features in the test set are subjected to four different degrees of occlusion processing, as illustrated in Figure 11a. Subsequently, the YOLO-CBAM model and YOLO model are selected to perform object detection on them. The respective detection performance metrics are presented in
Table 2. Some sample detection results are shown in Figure 11b.
Figure 11.
Object detection results of the model under various occlusions.
Figure 11.
Object detection results of the model under various occlusions.
At no occlusion and 30% occlusion levels, the YOLOv5-CBAM model exhibits performance comparable to or even better than YOLOv5 across various metrics. However, as the occlusion level increases to 50% and 70%, the YOLOv5-CBAM model outperforms the YOLOv5 model in all metrics. Moreover, it can still accurately identify and outline the target objects with high confidence even with increased occlusion. In contrast, the original YOLOv5 model has a missing detection phenomenon in most images, and the recall rate is only 0.751. This suggests that the performance of the original YOLOv5 model significantly deteriorates when facing visual occlusion pressure.
4.3. Visualization Analysis of Droplet Classification Model
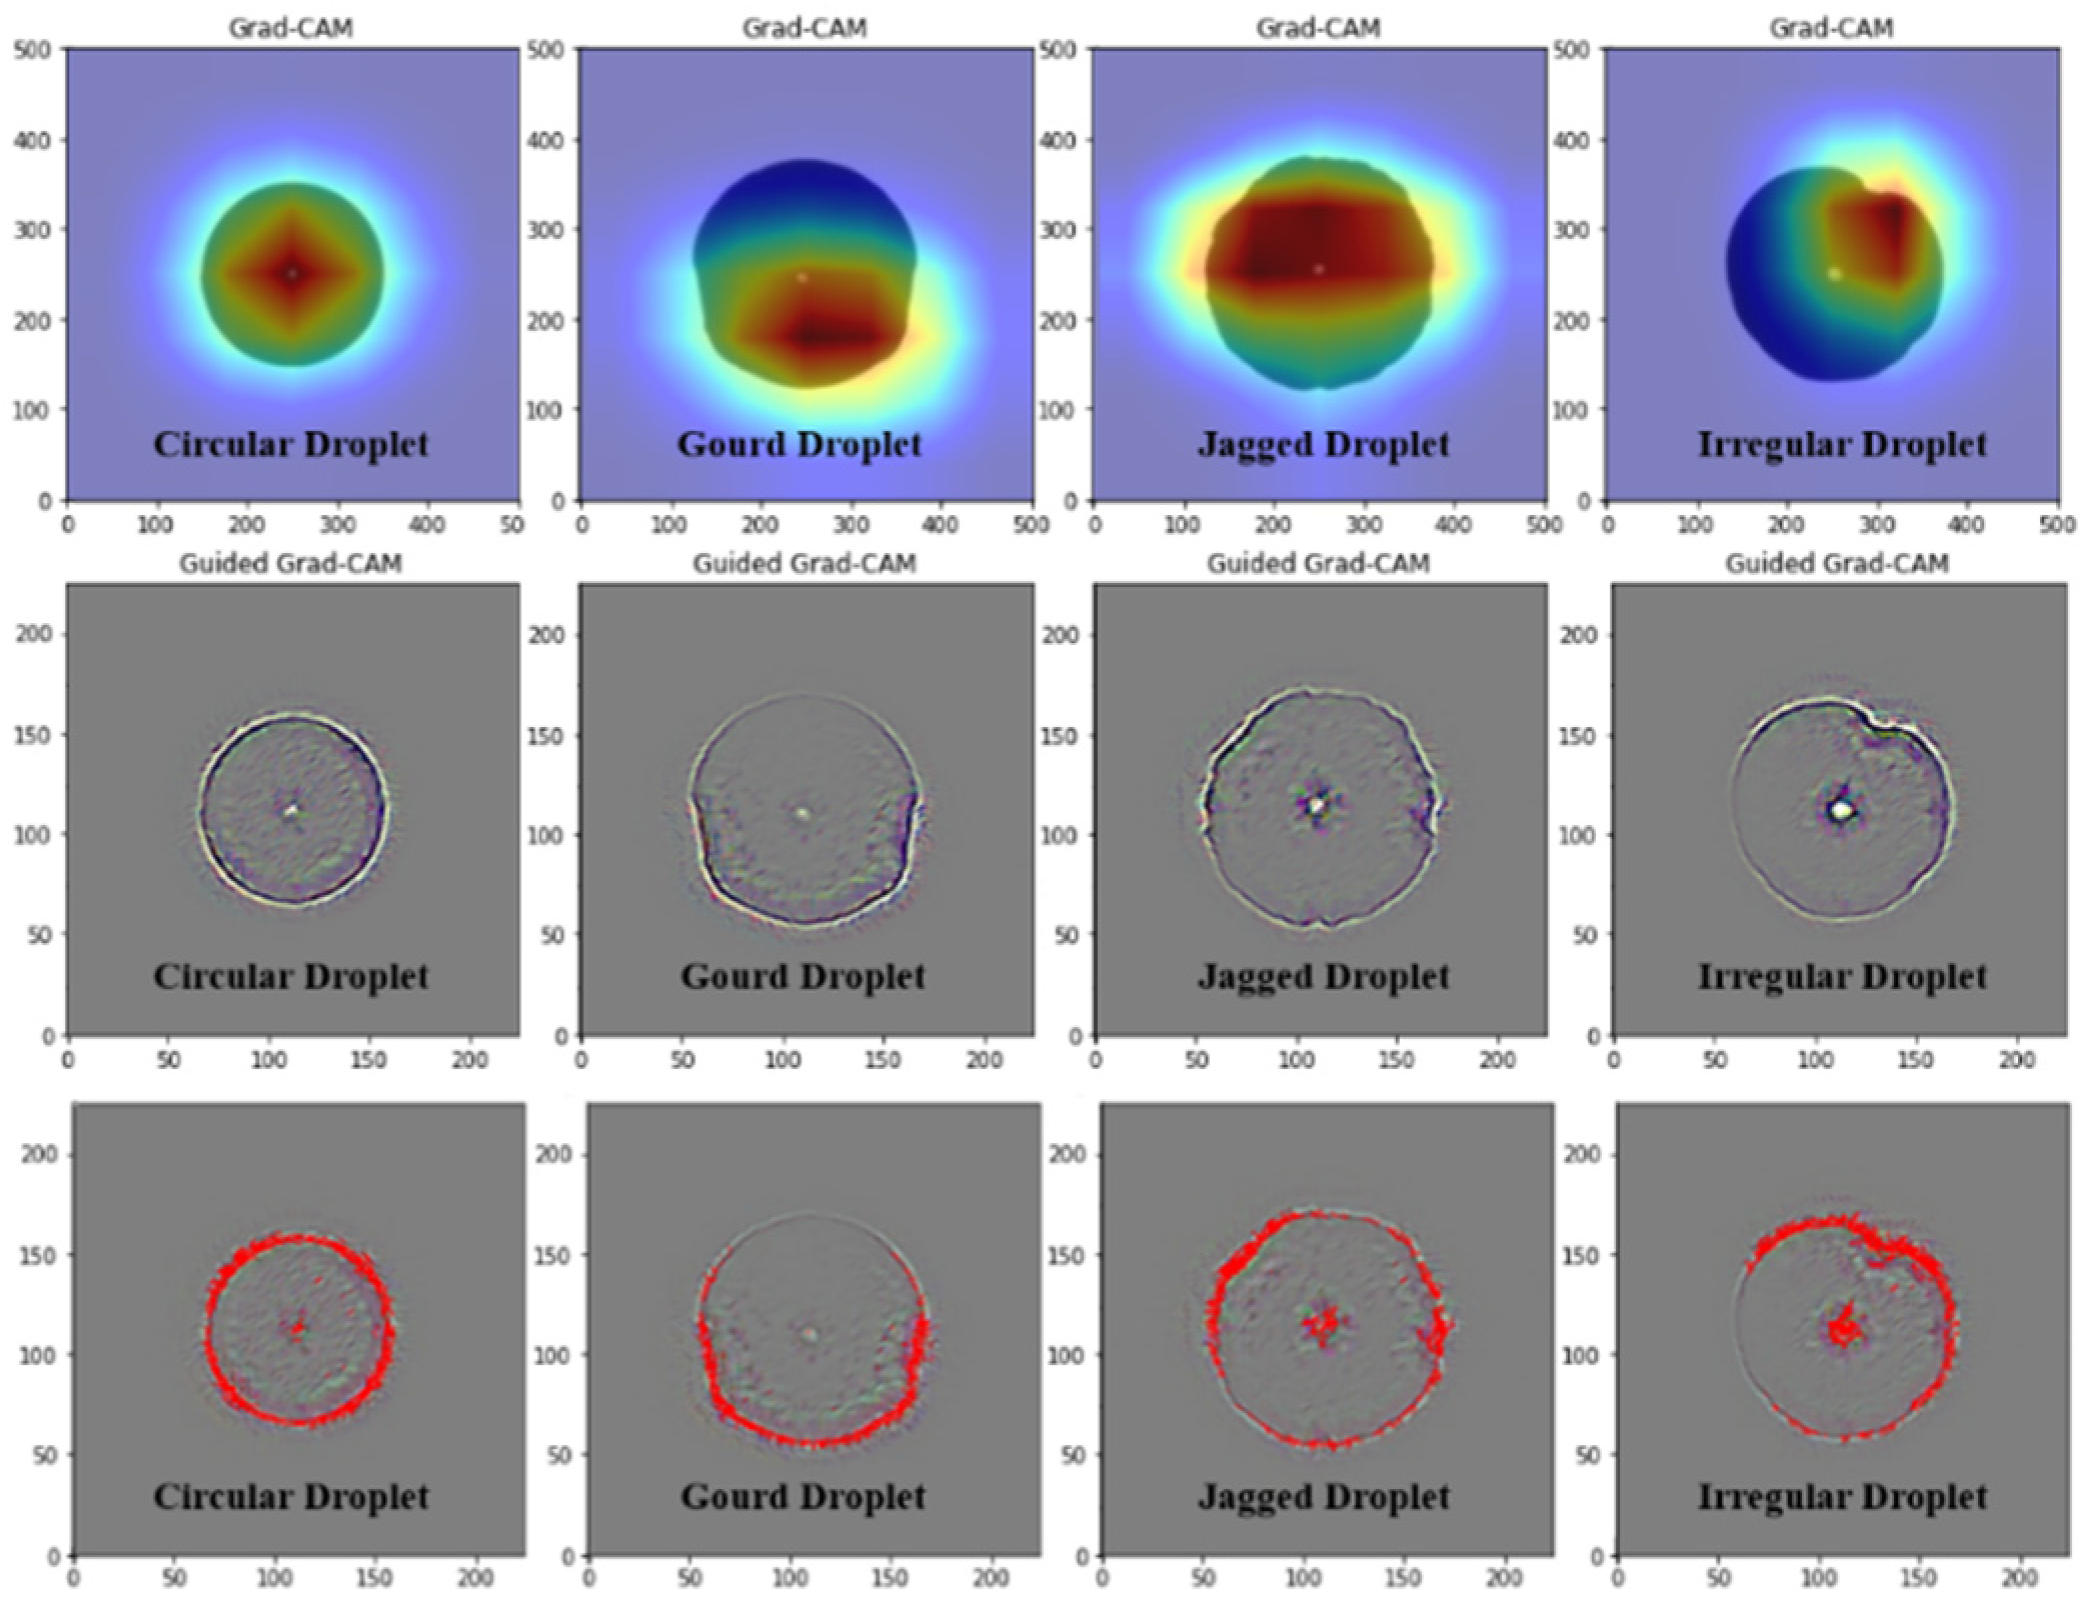
The classification accuracy of 91.43% on the test set is achieved by the trained droplet classification model. And the visualization results using Grad-CAM and Guided Grad-CAM are shown in Figure 12.
Figure 12.
Grad-CAM and Guided Grad-CAM images of adhesive droplets.
Figure 12.
Grad-CAM and Guided Grad-CAM images of adhesive droplets.
We collect the pixel coordinates of the highlighted and dark regions in all Guided Grad-CAM charts (225×225) by category and calculate the mean and standard deviation using the formulas Equations (9) and (10). The results are shown in
Table 3.
where
represents the coordinates of each pixel,
N is the total number of pixels, and
is the mean of the pixel coordinates.
Table 3.
Mean and standard deviation of the high-light pixels distribution.
Table 3.
Mean and standard deviation of the high-light pixels distribution.
| Type |
|
|
| Circular Droplet |
(113.19,110.69) |
(22.84, 22.38) |
| Gourd Droplet |
(113.25,137.66) |
(42.90, 24.35) |
| Jagged Droplet |
(108.37,104.25) |
(41.62, 33.16) |
| Irregular Droplet |
(126.11,92.33) |
(28.25,31.13) |
Obviously, the droplet quality classification model in this study tends to focus on the edge and central features of the droplets during the task. For the circular droplets, their smooth and regular edges are the main features, resulting in a regular distribution of attention areas in the heatmaps, with the mean of the highlighted areas close to the center of the image and minimal standard deviation. For the gourd-shaped and serrated droplets, the distinctive features lie in the waist depression and serrated patterns, leading to a sinking mean center for gourd-shaped droplets and the largest standard deviation for serrated droplets. As for irregular-shaped droplets, due to their variable morphology and lack of specific features, the model needs to analyze the droplets as a whole, with particular attention to their irregular edges.
Therefore, the droplet classification model trained in this study is a reliable model with high classification accuracy and it can effectively identify the prominent features of various-shaped droplets, which are consistent with human visual discernment and judgment.
4.4. Analysis of Surface Classification Model
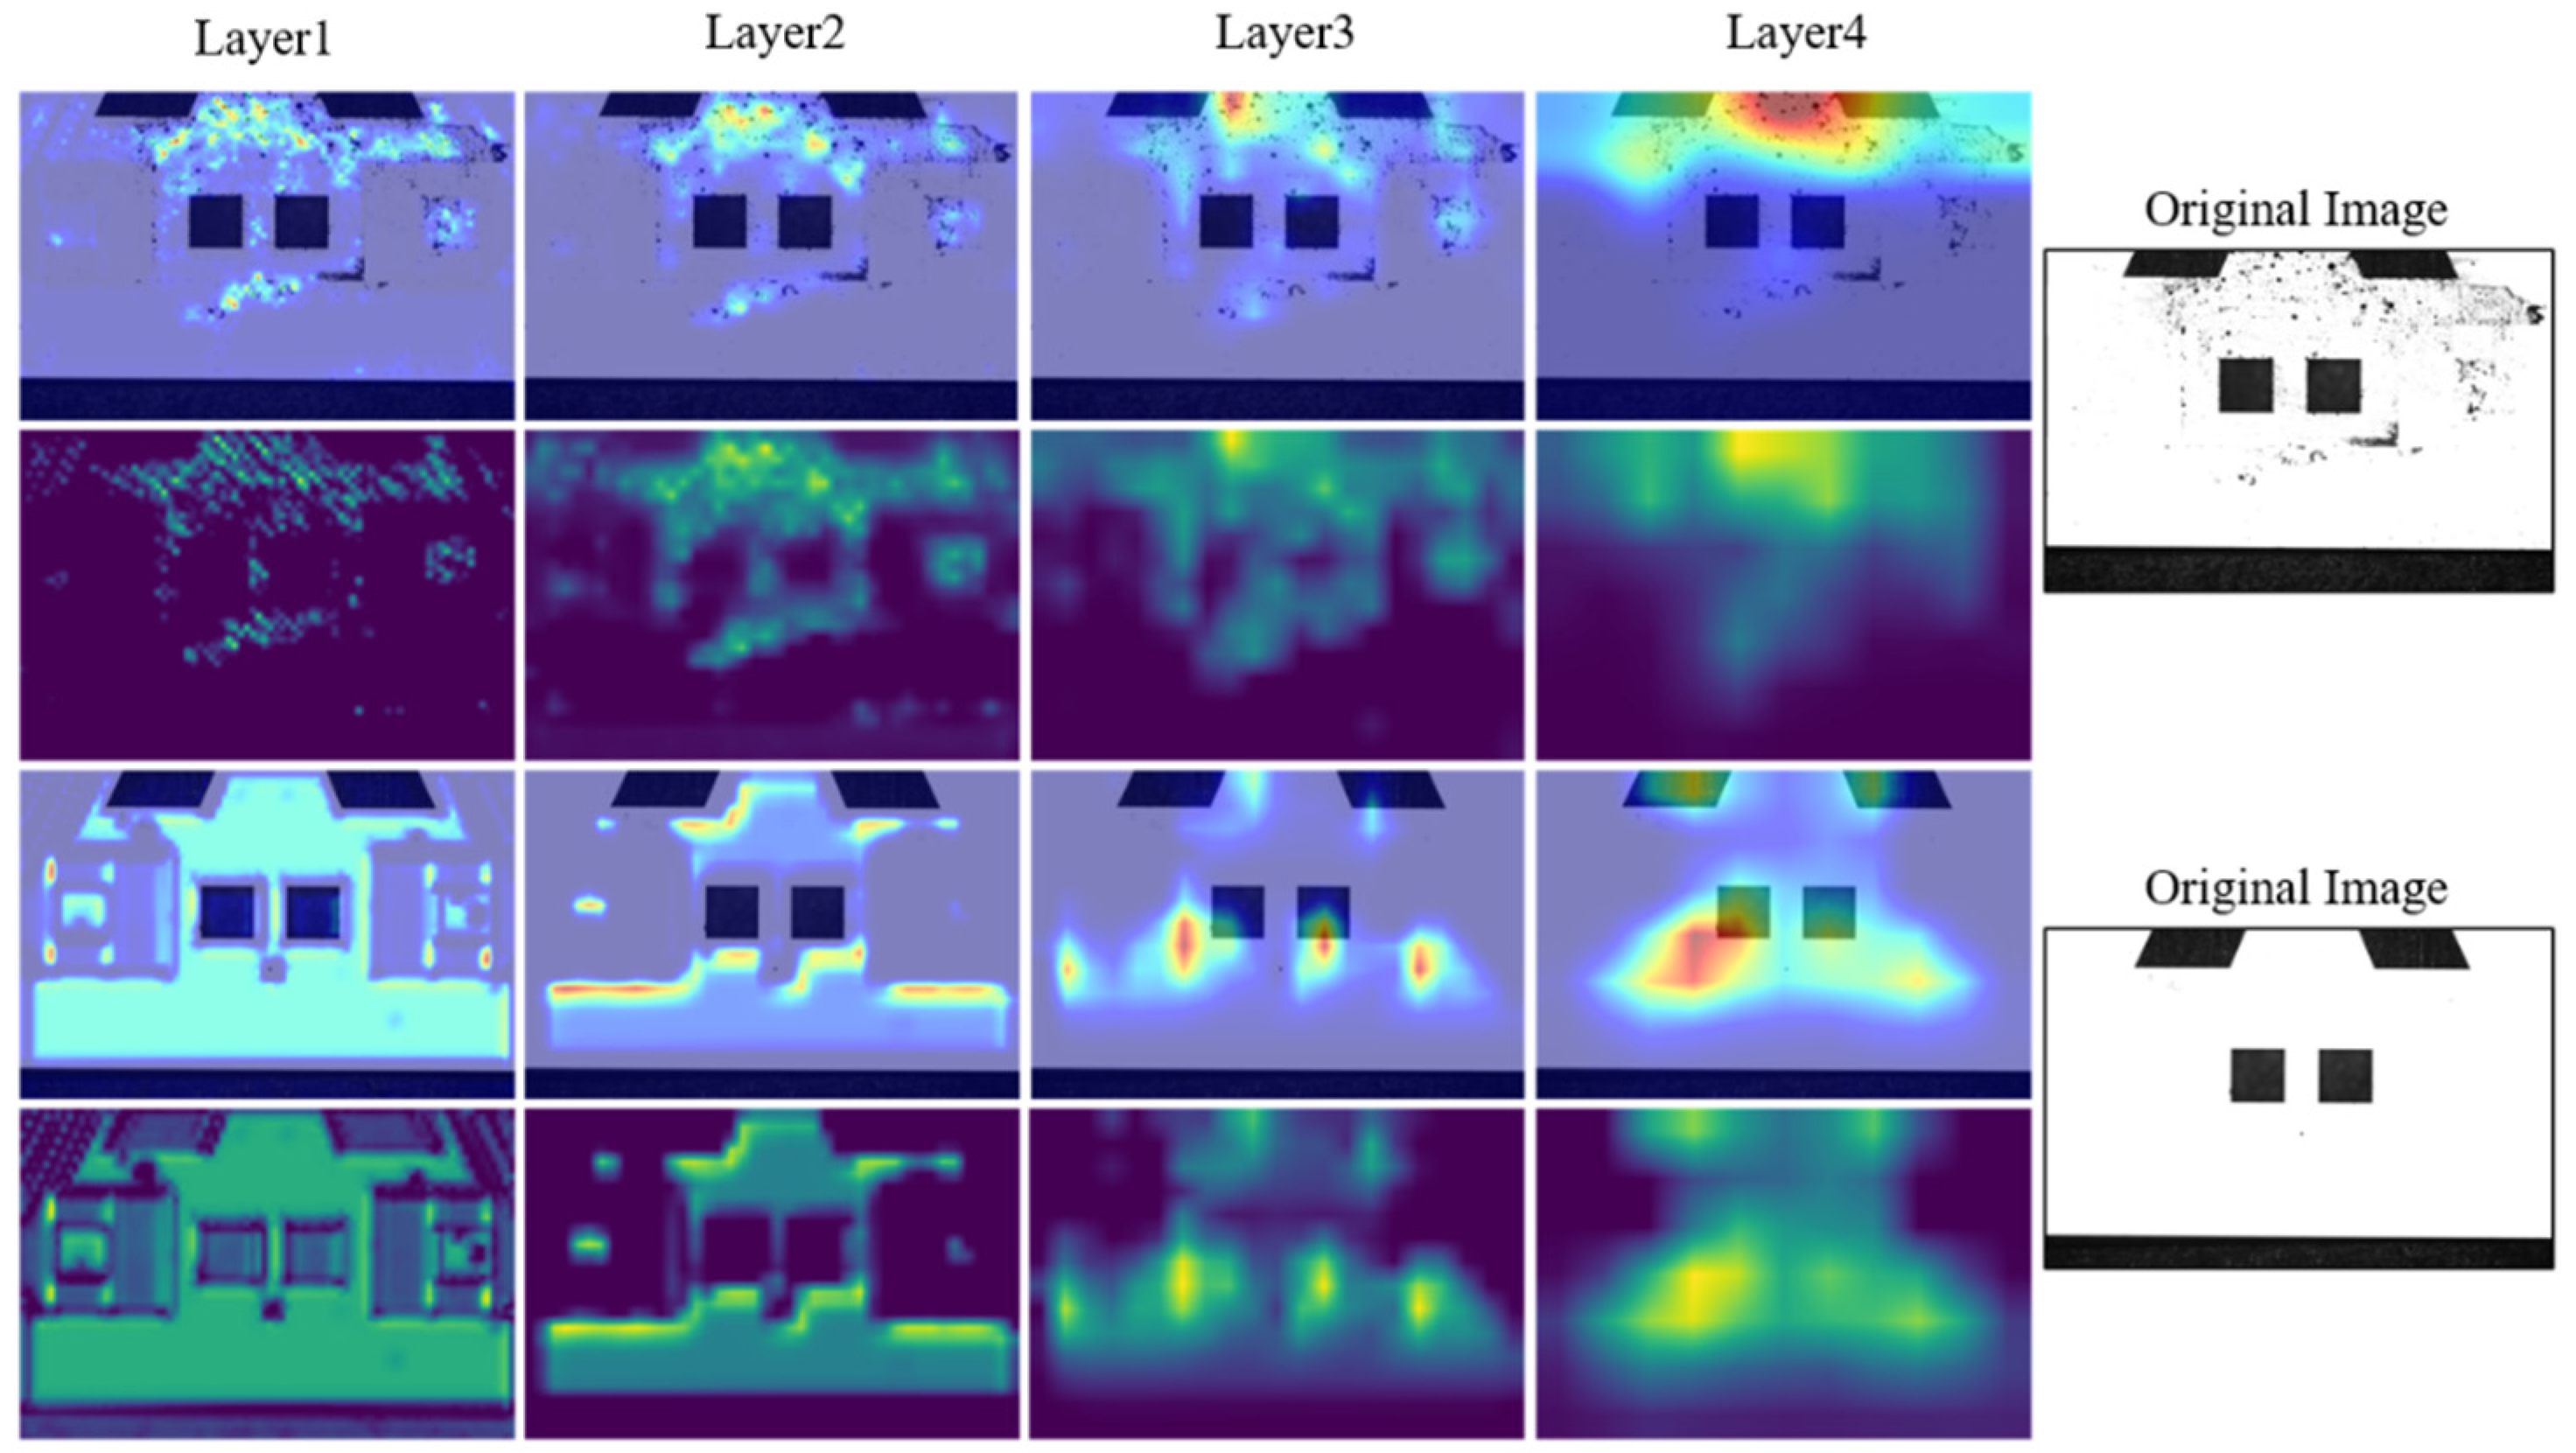
With the trained model, the classification accuracy of 98.45% is achieved on the test set. The Grad-CAM hierarchical visualization results are shown in Figure 13. In layer1, the heatmap is relatively scattered and blurry, without any obvious concentrated areas, indicating that the model does not have a clear judgment on stains or black spots. In layer2 and layer3, some distinct green and bright yellow areas start to appear, indicating localized attention areas and preliminary recognition of stain features. In layer4, the model’s attention scale reaches its maximum, accurately covering the appearance and potential locations of stains and black spots. This process demonstrates the gradual improvement of model in feature extraction, ultimately achieving precise localization and classification recognition of stains. It also validates the effectiveness and the interpretability of surface classification model.
Figure 13.
Visualization of different layers of the model.
Figure 13.
Visualization of different layers of the model.
5. Conclusions
To improve the microscopic-related tasks, we focus on the attention mechanism and visualizing CNNs for DL-based microscopic vision. The main results are as follows:
- (1)
The attention mechanism is combined with the YOLOv5 algorithm. With this hybrid algorithm, the robustness of the algorithm in scenes with occluded feature has been improved. The results demonstrate that even under 70% occlusion, the proposed algorithm has shown promising results with a mAP@0.5 of 97.9%, surpassing the original model by 4.6%.
- (2)
The visualization effect of YOLOv5-CBAM model is evaluated with Grad-CAM, which make the decision result more transparent, and the quantitative analysis results further verify the effectiveness of the attention mechanism in micropart feature localization.
- (3)
The trained micropart surface stain and droplet classification models both exhibit accuracies exceeding 90% in the experiments. And the results of the visual analysis align with human eye discrimination, validating the reliability of parts and droplets sorting.
Author Contributions
Conceptualization, Zheng Xu; Formal analysis, Yuchen Kong and Tongqun Ren; Investigation, Yanqi Wang; Methodology, Xinwei Zhao; Project administration, Xiaodong Wang; Software, Xinwei Zhao; Writing—original draft, Xinwei Zhao; Writing—review & editing, Zheng Xu and Xinwei Zhao. All authors have read and agreed to the published version of the manuscript.
Funding
This work was supported by the Defense Industrial Technology Development Program JCKY2022203B006.
Conflicts of Interest
All authors declare that there are no conflict of interests regarding the publication of this article.
References
- Cohn, M.B.; Bohringer, K.F.; Noworolski, J.M.; Singh, A.; Keller, C.G.; Goldberg, K.Y.; Howe, R.T. Microassembly technologies for MEMS. In Proceedings of the Micromachining and Microfabrication Process Technology IV, Santa Clara, CA, USA, 21–22 September 1998; Volume 3511, pp. 2–16. [Google Scholar] [CrossRef]
- Kudryavtsev, A.V.; Laurent, G.J.; Clevy, C.; Tamadazte, B.; Lutz, P. Stereovision-based Control for Automated MOEMS Assembly. In Proceedings of the 2015 IEEE/RSJ International Conference On Intelligent Robots and Systems (IROS), Hamburg, Germany, 28 September–2 October 2015; pp. 1391–1396. [Google Scholar]
- Liu, J.; Wang, Y. Assembly planning and assembly sequences combination using assembly feature interference. In Proceedings of the 2007 10th IEEE International Conference on Computer Aided Design and Computer Graphics, Beijing, China, 15–18 October 2007; pp. 545–548. [Google Scholar]
- Santochi, M.; Fantoni, G.; Fassi, I. Assembly of microproducts: State of the art and new solutions. In AMST’05: Advanced Manufacturing Systems and Technology, Proceedings; Springer: Vienna, Austria, 2005; pp. 99–115. [Google Scholar]
- He, K.; Zhang, X.; Ren, S.; Sun, J. Deep residual learning for image recognition. In Proceedings of the 2016 IEEE Computer Society Conference on Computer Vision and Pattern Recognition (CVPR), Las Vegas, NV, USA, 27–30 June 2016; pp. 770–778. [Google Scholar] [CrossRef]
- Szegedy, C.; Liu, W.; Jia, Y.; Sermanet, P.; Reed, S.; Anguelov, D.; Erhan, D.; Vanhoucke, V.; Rabinovich, A.; Liu, W.; et al. Going deeper with convolutions. In Proceedings of the 2015 IEEE Conference on Computer Vision and Pattern Recognition (CVPR), Boston, MA, USA, 7–12 June 2015; pp. 1–9. [Google Scholar] [CrossRef]
- Lei, S.; He, F.; Yuan, Y.; Tao, D. Understanding Deep Learning via Decision Boundary. IEEE Trans. Neural Netw. Learn. Syst. 2023. [CrossRef] [PubMed]
- Adnan, N.; Umer, F. Understanding deep learning—Challenges and prospects. J. Pak. Med Assoc. 2022, 72, S66–S70. [Google Scholar] [CrossRef]
- Liu, C.; Wu, Y.; Liu, J.; Sun, Z.; Xu, H. Insulator Faults Detection in Aerial Images from High-Voltage Transmission Lines Based on Deep Learning Model. Appl. Sci. 2021, 11, 4647. [Google Scholar] [CrossRef]
- Ming, J.; Bargmann, D.; Cao, H.; Caccamo, M. Flexible Gear Assembly with Visual Servoing and Force Feedback. In Proceedings of the 2023 IEEE/RSJ International Conference on Intelligent Robots and Systems (IROS), Detroit, MI, USA, 1–5 October 2023; pp. 8276–8282. [Google Scholar] [CrossRef]
- Mushtaq, F.; Ramesh, K.; Deshmukh, S.; Ray, T.; Parimi, C.; Tandon, P.; Jha, P.K. Nuts&bolts: YOLO-v5 and image processing based component identification system. Eng. Appl. Artif. Intell. 2023, 118, 105665. [Google Scholar] [CrossRef]
- Wang, Y.; Xu, Z.; Yang, Y.; Wang, X.; He, J.; Ren, T.; Liu, J. Deblurring microscopic image by integrated convolutional neural network. Precis. Eng. 2023, 82, 44–51. [Google Scholar] [CrossRef]
- Xu, Z.; Han, G.; Du, H.; Wang, X.; Wang, Y.; Liu, J.; Yang, Y. A Generic Algorithm for Position-Orientation Estimation with Microscopic Vision. IEEE Trans. Instrum. Meas. 2022, 71, 1–10. [Google Scholar] [CrossRef]
- Woo, S.; Park, J.; Lee, J.; Kweon, I.S. CBAM: Convolutional Block Attention Module. In Computer Vision—ECCV 2018, Pt VII; Springer: Cham, Switzerland, 2018; Volume 11211, pp. 3–19. [Google Scholar] [CrossRef]
- Ma, Y.; Zhi, M. Summary of fine-grained image recognition based on attention mechanism. In Proceedings of the Thirteenth International Conference on Graphics and Image Processing (ICGIP 2021), Kunming, China, 18–20 August 2021. [Google Scholar] [CrossRef]
- Liu, J.; Zhu, X.; Zhou, X.; Qian, S.; Yu, J. Defect Detection for Metal Base of TO-Can Packaged Laser Diode Based on Improved YOLO Algorithm. Electronics 2022, 11, 1561. [Google Scholar] [CrossRef]
- Wu, L.; Chen, L.; Zhou, Q.; Shi, J.; Wang, M. A Lightweight Assembly Part Identification and Positioning Method From a Robotic Arm Perspective. IEEE Access 2023, 11, 104866–104878. [Google Scholar] [CrossRef]
- Luan, S.; Li, C.; Xu, P.; Huang, Y.; Wang, X. MI-YOLO: More information based YOLO for insulator defect detection. J. Electron. Imaging 2023, 32, 043014. [Google Scholar] [CrossRef]
- Selvaraju, R.R.; Cogswell, M.; Das, A.; Vedantam, R.; Parikh, D.; Batra, D. Grad-CAM: Visual Explanations from Deep Networks via Gradient-Based Localization. In Proceedings of the 2017 IEEE International Conference on Computer Vision (ICCV), Venice, Italy, 22–29 October 2017; pp. 618–626. [Google Scholar] [CrossRef]
- Noh, E.; Hong, S. Automatic Screening of Bolts with Anti-Loosening Coating Using Grad-CAM and Transfer Learning with Deep Convolutional Neural Networks. Appl. Sci. 2022, 12, 2029. [Google Scholar] [CrossRef]
- Lin, C.-J.; Jhang, J.-Y. Bearing Fault Diagnosis Using a Grad-CAM-Based Convolutional Neuro-Fuzzy Network. Mathematics 2021, 9, 1502. [Google Scholar] [CrossRef]
|
Disclaimer/Publisher’s Note: The statements, opinions and data contained in all publications are solely those of the individual author(s) and contributor(s) and not of MDPI and/or the editor(s). MDPI and/or the editor(s) disclaim responsibility for any injury to people or property resulting from any ideas, methods, instructions or products referred to in the content. |
© 2024 by the authors. Licensee MDPI, Basel, Switzerland. This article is an open access article distributed under the terms and conditions of the Creative Commons Attribution (CC BY) license (https://creativecommons.org/licenses/by/4.0/).
