Preprint
Article

Towards a Refined Heuristic Evaluation: Incorporating Hierarchical Analysis for Weighted Usability Assessment

Altmetrics

Downloads

150

Views

89

Comments

0

A peer-reviewed article of this preprint also exists.

Submitted:

19 April 2024

Posted:

22 April 2024

You are already at the latest version

Alerts
Abstract
This study delves into the realm of heuristic evaluation within usability testing, focusing on refining and applying a tailored algorithm that simplifies the implementation of the Analytic Hierarchy Process for heuristic prioritization. Addressing the prevalent challenge of disparate evaluation methodologies and the absence of a standardized process in usability testing, our research introduces a novel method that leverages the Analytic Hierarchy Process alongside a bespoke algorithm. This algorithm utilizes transitive properties for pairwise comparisons, significantly reducing the evaluative workload. This innovative approach facilitates the estimation of heuristic relevance irrespective of the number of items per heuristic or the item scale and streamlines the overall evaluation process. In addition to rigorous simulation testing of the tailored algorithm, we applied our method in a practical scenario, engaging seven usability experts in evaluating a web interface. This empirical application underscored our method’s capacity to diminish the requisite comparison count and spotlight areas of improvement for critically weighted yet underperforming heuristics. The outcomes of this study underscore the efficacy of our approach in enhancing the efficiency and organization of heuristic evaluations, paving the way for more structured and effective usability testing methodologies in future research endeavors.
Keywords: 
Subject: Computer Science and Mathematics  -   Other

1. Introduction

Usability is critical in the design and development of technology and software. It refers to the ease with which users can effectively, efficiently, and satisfactorily interact with a system or product to achieve their goals [1]. This concept is paramount in determining the success or failure of software applications and technological products. Its importance is emphasized by Giacomin, who states that user-centric designs lead to higher productivity, reduced errors, and enhanced user engagement [2]. A focus on usability ensures that products are intuitive and accessible, meeting the diverse needs of users [3] and enhancing human performance [4]. Thus, integrating usability in technology fosters a positive user experience [5] and significantly influences user adoption and satisfaction [6,7]. Experts decompose the usability into components or guidelines called heuristics. Evaluating usability using this technique might be challenging because they are imprecise, not universally applicable, and may conflict with analyzing the relative importance of individual items for usability in any given conditions [8].
Experts often try to quantify the usability of systems despite the challenges [9]; they implement heuristic evaluations and quantification systems like the System Usability Scale (SUS) for usability testing [10], the Questionnaire for measuring user satisfaction of, the User Interaction Satisfaction (QUIS) for human-computer interface [11], the Software Usability Measurement Inventory (SUMI) for testing computer usability satisfaction [12], or the Post-study System Usability Questionnaire (PSSUQ) [13], among others. Heuristic evaluations involve experts examining an interface against established usability principles [14]. This qualitative method relies on the expertise of evaluators to identify usability issues. In contrast, these approaches quantify perceived ease of use from the end-user’s perspective [15]. It provides a numerical score, objectively measuring a product’s usability. While heuristic evaluations offer in-depth, expert analysis, the approaches such as SUS capture user feedback quantitatively [16], making these approaches collectively beneficial for a comprehensive understanding of usability [17].
Developing a unified usability strategy that combines qualitative (a.k.a. inquiry) and quantitative or so-called testing-based approaches presents several challenges [18]. The technology developers need to balance expert-driven insights from heuristic evaluations with user-centric data from tools like usability measurement estimations, requiring an intricate understanding of both approaches [19]. Qualitative methods, rich in contextual information, can be subjective. At the same time, quantitative approaches, though objective, might not capture nuanced user experiences [20]. It is necessary to devise a sophisticated strategy that integrates these methodologies to produce a comprehensive usability score. This strategy should respect the strengths and limitations of each method, ensuring that the usability score reflects the expert analysis and user experience [21].
This document comprehensively examines usability evaluation within human-computer Interaction, encapsulating its historical context, significance, advancements, and the challenges confronting this domain. Section 2 provides an in-depth analysis of the evolution and implications of expert approaches and methods for quantifying usability. The methodology proposed in this study is outlined in Section 3, which includes the creation of a heuristic instrument and a mathematical model for conducting a weighted survey. This section further discusses the application of the Analytic Hierarchy Process for determining weight estimations, provides a detailed description of the simulation approach, and discusses the practical application of the proposed model with actual data. The aggregation and interpretation of findings are presented in Section 4, with a subsequent discussion on their practical and theoretical significance in Section 5. Ultimately, Section 6 summarizes this research’s principal findings and contributions. This investigation seeks to enhance the discourse in HCI by presenting a methodologically rigorous and empirically validated approach to usability evaluation.

2. Background

Despite the term usability was defined by ISO 9241-11 1, heuristic evaluation was first introduced by J. Nielsen and R. Molich in 1990 in their seminal work "Heuristic Evaluation of User Interfaces" [14], which is a method for assessing usability. It involves expert evaluators scrutinizing an interactive system’s User Interface (UI) to gauge its quality of use. This assessment measures the extent to which the interface adheres to a predetermined set of usability guidelines or heuristics, hence the name. This technique relies on a curated list of guidelines drawn from the collective expertise of the evaluators. Their experience enables them to identify usability issues or areas for improvement effectively. The method typically entails the following steps: evaluators individually complete questionnaires, documenting encountered problems; subsequently, they convene to discuss and consolidate their findings into a cohesive list. Throughout these discussions, evaluators prioritize the identified problems based on severity, frequency, and criticality.
Nielsen and Molich proposed ten heuristics to guide evaluations in their original work. This structured approach ensures a systematic and thorough assessment of the interface’s usability, leading to actionable insights for optimization. Their findings about that method were various, and it opened multiple research lines in the following years. Among their conclusions, they highlight the following:
  • Heuristic set: The heuristic set originally contained 9 heuristics, extracted from the work by Molich and Nielsen [14]. It serves as a way to categorize usability problems, however they not provide information about how to solve them.
  • Number of evaluators: They noticed that the number of evaluators was a critical factor, determining that an optimal number of them might be around 3 and 5 and that more than 10 evaluators might be unnecessary.
  • Evaluators biases: The answers from the evaluators are subjected to their expertise, previous experience, and own judgment, providing potential limitations and biases of the results.
Several studies have been done updating and proposing different sets of heuristics regarding the heuristic set. Nielsen introduces another heuristic to the initial set of nine, proving what is commonly known as "The 10 Nielsen’s Heuristics". The initial set of heuristics created by Nielsen and Molich was considered too general [22], opening up new studies to improve the initial set to be more specific to the desired object of study. This led to the proposal of new sets of principles, such as Shneiderman’s Eight Golden Rules [23], which emphasize usability guidelines for user interface design, Norman’s Seven Principles [24], focusing on cognitive aspects of design, or Tognazzini’s First Principles of Interaction Design [25], providing foundational principles for crafting engaging user experience.
Performing heuristic evaluations offers numerous advantages beyond enhancing the technology acceptance [26], including cost-effectiveness, as it requires minimal time and fewer users compared to traditional user testing [27,28]. Additionally, it demands less extensive planning, less personnel, and a streamlined analysis process. Moreover, heuristic evaluation is versatile and applicable across various stages of software development, including planning, development, and post-release phases [29]. However, several disadvantages exist. Firstly, finding evaluators with sufficient expertise to provide high-quality feedback can be challenging [30,31]. Secondly, depending on the project stage, evaluators may struggle to grasp the full range of tasks applicable to the software [32,33]. Thirdly, the evaluation results may lack actionable suggestions for resolving identified usability issues, potentially necessitating additional data collection [34]. Finally, the original scoring system introduced by Nielsen and Molich [14] has often perplexed evaluators, with its differentiation among severity, frequency, and criticality attributes; thus, heuristic methods without a rigid framework poorly support problem discovery [35]. This confusion has led many experts to predominantly focus on one attribute, typically criticality, highlighting the need for subsequent proposals to refine this aspect [36,37].
Numerous authors have contributed to the evolution of usability heuristics by proposing tailored sets specific to their use cases [38], prompting further inquiry and the development of methodologies to compile such data. Quiñones et al. [39] conducted a comprehensive systematic review of various usability heuristic proposals in the literature, elucidating diverse approaches to their creation. Their findings reveal a spectrum of methodologies, including consideration of existing heuristics, literature reviews, analysis of usability problems, incorporation of design recommendations, interviews, and theoretical frameworks. From the analysis of over 70 papers, two main clusters emerged in heuristic research: one focused on developing domain-specific usability heuristics and the other on processes and methodologies for their creation. In exploring the process of heuristic development, researchers have investigated the existence of a consensus on the most effective approach [40,41,42,43,44,45]. Another approach was made by Hermawati and Lawson [46], where they analyzed more than 90 articles that used heuristic evaluation, and their findings were that less than 10 % showed acceptable and robustness. They justified this as most of the studies did not perform validation, did not conduct a comparative justification between heuristics, did not quantitatively analyze the comparison results, and relied only on detailed textual descriptions.
Extracting actionable insights from qualitative feedback without numeric measurements necessitated effort from researchers to quantify usability attributes such as effectiveness, efficiency, and satisfaction [47]. Mitta proposed a methodology for quantifying expert usability using a linear multivariate function, with user perceptions and performance as independent variables [48]. This approach, illustrated with a practical example, yielded a usability score through linear normalization of experimental data. Delice and Güngör explored the quantification of attributes like severity, as defined by Nielsen and Molich [14], using the Analytic Hierarchy Process in combination with heuristic evaluation for heuristic prioritization [49]. Their method involved expert website usability evaluation and ranking identified problems using pairwise comparisons based on Saaty’s scale [50]. Granollers investigated a combined approach for usability evaluation, integrating a 15-principle heuristic set with specific questions and a 4-option rating scale for quantification, resulting in Usability Percentage (UP) [51]. This method garnered attention as a notable proposal in the field [52]. Paz et al. proposed a specialist-oriented inspection technique for usability quantification, employing a 64-item checklist validated by Bonastre and Granollers [53,54]. Usability was quantified by averaging evaluators’ responses, establishing the reliability of the assessment methodology.
In enhancing the checklist approach for heuristic evaluation, Kemp et al. [55] introduced a detailed checklist for each heuristic with specific questions to assess the system, utilizing a 0 to 4 rating scale. This refinement aimed to improve the precision of evaluations. However, numerous sub-heuristics or topics raised concerns about evaluator fatigue, initially addressed by Nielsen [27] and later by Granollers [51] through limiting question quantity. Furthermore, the diversity in checklist formats—ranging from PDF and DOC to XLS—underscores the variation in support mechanisms employed across studies [56,57], reflecting the adaptability of heuristic evaluation methods to different technological contexts and evaluator preferences. While beneficial for tailored assessments, this adaptability necessitates careful consideration to maintain evaluator engagement and ensure the reliability of usability insights. Despite the diversity in instruments designed to quantify system usability, all approaches are intricately linked to the discipline of psychometrics [58]. This connection underscores the necessity of grounding heuristic evaluation and survey design within robust psychological principles in HCI.
However, ensuring the best instrument for measuring concepts or getting the ’gold standard’ in psychometric research (understood as the highest level of methodological quality for survey design) is a paramount activity [59]. Different strategies arise in literature to enhance the instrument’s consistency and effectiveness [60]. Maintaining a uniform scale, measurement level, or end-point scale across all analyzed items or constructs helps to unveil the similarities between latent variables [61], especially for multivariate and correlational models [62]. Using the same number of items ensures that different test versions are consistent and can be compared across different administrations or populations, helping the generalizability of the results [63]. Face validity indicates the extent to which a test appears effective regarding its stated aims [64]. Mathematically, aligning the number of items per construct enhances reliability [65] and reflects principles from item-response theory, emphasizing the significance of each question’s contribution to the overall construct [66].
Although it was described previously, some research does not maintain a uniform scale, and proper weight systems were designed to accomplish that task [67,68,69]. The study by Gulzar et al.  [70] presents multiple criteria weights used in the past, like mathematical programming, analytic network process, linear weighting, and analytic hierarchy process. Kamaldeep et healthcare10010004 followed the "CRiteria Importance Through the Inter-criteria Correlation" (henceforth CRITIC) methodology to establish and find objective weights related to the criteria of their evaluation. Although they do not use a heuristic evaluation, they compared the relationships between properties of the individual criteria. In the same way, Muhammad et.al. [68] used the "Fuzzy Analytic Hierarchy Process" (henceforth FAHP) to create their methodology to compute global weights for usability factors. In that study, they do not specify that followed a heuristic evaluation, but the methodology used refers to the range of usability factors that come from an expert evaluation. Another similar approach was used by Iryanti et al.  [69] who used the fuzzy preference programming method known as "Inverse Trigonometric Fuzzy Preference Programming" (henceforth ITFPP) to evaluate a specific domain like e-learning through the arc sin function.

3. Materials and Methods

This research introduces significant modifications to the Granollers heuristic evaluation method to enhance its adaptability and relevance to diverse HCI contexts. Traditionally, Granollers’ method evaluates usability across 15 items with uniform significance, irrespective of the interface, user, or technology involved [51]. Recognizing this limitation, our approach redefines the evaluation process by introducing variable weights to these items. This modification is predicated on the understanding that certain heuristics may bear more significance than others, depending on the specific objectives of the Usability Testing Leader. Considering the relevance of decomposing complex problems into a set of simple subproblems [71], we employed the Analytic Hierarchy Process to assign weights to the heuristic elements systematically. AHP, a structured technique for organizing and analyzing complex decisions, is based on mathematics and psychology. It involves decomposing a problem into a sub-problem hierarchy, which is then analyzed independently. In this study, we utilized AHP to quantify the relative importance of each heuristic item. This process involved creating pairwise comparisons and deriving weights through standardized equations, ensuring a rigorous and replicable methodology.

3.1. Heuristic Instrument

The heuristic evaluation framework by Toni Granollers is an extension and adaptation of principles from pioneers like Nielsen and Tognazzini [51], aiming to provide a comprehensive toolkit for usability assessment in HCI. The framework comprises 15 heuristics, each with specific questions designed to probe various aspects of user interaction and interface design. These heuristics cover areas from the visibility of system states and error management to aesthetic design and efficiency of use. The questions are quantified, and their answers are categorized to reflect the degree of a system’s alignment with these heuristics, ranging from full compliance to non-applicability. The number of questions per heuristic varies, reflecting the depth of investigation into each area. The usability value derived from these evaluations is expressed as a percentage, standardized between 0 % to 100 % , indicating the extent of adherence to usability standards. A color-coding system is employed to communicate this value visually: green represents high usability, yellow indicates moderate usability, red suggests poor usability, and white denotes non-applicability or non-issues. The full list of heuristics and the number of associated questions and descriptions can be meticulously detailed, ensuring a robust and well-rounded evaluation instrument.
  • Visibility and system state (five questions): Focuses on ensuring that users are always aware of what the system is doing and their position within it.
  • Connection with the real world (four questions): Prioritizes using familiar language, metaphors, and concepts, aligning the system with real-world analogs.
  • User control and freedom (three questions): Emphasizes the importance of allowing users to navigate freely and undo actions easily.
  • Consistency and standards (six questions): Ensures uniformity in the interface, with consistent actions and standards across different elements.
  • Recognition rather than memory (five questions): Aims to design systems that minimize the need for remembering information, enhancing user learning and anticipation.
  • Flexibility and efficiency (six questions): Focuses on providing shortcuts and efficient paths for experienced users while remaining accessible to novices.
  • Help users recognize, diagnose, and recover from errors (four questions): Focuses on designing systems that provide clear, understandable error messages, aiding users in recognizing and rectifying issues efficiently.
  • Error prevention (three questions): Involves designing systems to prevent errors before they occur.
  • Aesthetic and minimalist design (four questions): Encourages visually appealing designs and minimal in unnecessary elements.
  • Help and documentation (five questions): Stresses the importance of accessible, clear help and documentation for users.
  • Save the state and protect the work (three questions): Addresses the need to save user progress and protect against data loss.
  • Colour and readability (four questions): Ensures that text is readable with appropriate color contrast and size.
  • Autonomy (three questions): Allows users to make personal choices and customizations in the system.
  • Defaults (three questions): Focuses on providing sensible default settings while allowing users to revert to these defaults when needed.
  • Latency reduction (two questions): Aim to minimize delays and provide feedback during processes that require time.
The methodology we adopted in this study introduces a weighted heuristic evaluation approach for usability assessment. This approach refines the original method proposed by Granollers, which involves a quantitative usability assessment across fifteen different heuristics. The Granollers approach estimates a usability score or Usability Percentage (UP) considering the equation (1). Here n i is the number of questions in the ith heuristic, value i j is the value assigned to the jth question of the ith heuristic. The values are assigned based on a predefined response scale as follows: ’Yes’ = 1.0, ’Neither Yes, nor No’ = 0.5, and ’No’ = 0.0. N A i , N P i , and W R i are the counts of non-quantitative responses ’Not Applicable’, ’Not a Problem’, and ’Impossible to Check’ for the ith heuristic respectively.
U P = i = 1 15 j = 1 n i value i j i = 1 15 n i ( N A i + N P i + W R i )
We now calculate the Usability Percentage using the formula (2) to relate the Usability Percentage calculation with each heuristic relevance. In this case, we add the parameter w i as the weight or relevance of each heuristic during the assessment (3). Originally, this parameter represented the proportion of questions per heuristic to the total available questions, meaning that regardless of the systems or intention for assessment, all the heuristics had a predefined relevance based on the number of questions. In addition, analyzing each heuristic’s component individually requires guaranteeing at least one value in each heuristic (see equation (4)). In this sense, the original approach encounters challenges: it may not align with the relevance of heuristics in specific systems. For example, Table 1 shows the relative relevance of each heuristic based on the number of questions or analysis over the general software evaluation; the w i in this table corresponds with the number of questions in each heuristic divided by the total number of questions. Moreover, this approach can lead to indeterminate calculations when the number of non-applicable responses equals the total questions in a heuristic.
We propose a revised approach where w i is determined based on the heuristic’s relevance to the specific system under evaluation rather than the mere quantity of questions to address these issues. This adjustment ensures a more accurate usability score, recognizing the varied importance of heuristics and preventing misleading evaluations. For instance, a low value in a low-weighted heuristic does not generate an alarm. Still, a low value in a high-weighted heuristic encourages the software development team to prioritize improvements.
U P = i = 1 15 w i H e u r i s t i c i
i = 1 15 w i = 1
H e u r i s t i c i = j = 1 n i v a l u e i j n i ( N A i + N P i + W R i ) , if n i ( N A i + N P i + W R i ) 0 0 , otherwise

3.2. Analytical Hierarchical Process

In the domain of heuristic usability evaluation, usability experts can use the Analytic Hierarchy Process to determine the relative importance of different usability heuristics. This method excels when experts apply it to grade and prioritize criteria based on their professional judgment. AHP’s structured approach breaks down the evaluation into a hierarchy, from the overarching goal of obtaining a usability score to the application contexts such as apps, websites, or software. Experts must construct a pairwise comparison matrix for each heuristic criterion, with each element a i j indicating the relative importance of the i th heuristic over the j using the Saaty scale [50]. This matrix is reciprocal, where a i j = 1 a j i , generating the matrix A that relates the relative weight w i or relevance of i th characteristic as see in equation (5). The principal eigenvector w corresponding to the largest eigenvalue λ m a x is computed to calculate the weights, which determine the priorities. A consistency check ensures the reliability of these comparisons, using a consistency ratio (henceforth CR) to compare the matrix’s consistency index (henceforth CI) against an ideal index derived from a random matrix (see (7)). If CR is below 0.1, the weights are considered consistent. The resulting eigenvector provides the weighted priorities for the usability heuristics, reflecting the aggregated expert opinion on the importance of each usability heuristic.
A = 1 a 12 a 1 n 1 a 12 1 a 2 n 1 a 1 n 1 a 2 n 1 = 1 w 1 w 2 w 1 w n w 2 w 1 1 w 2 w n w n w 1 w n w 2 1 , w = w 1 w 2 w n
A × w = λ m a x × w
C R = C I R I , C I = λ m a x n n 1 , R I = 1.98 × ( n 2 ) n
We seamlessly integrated the Hierarchical Analysis process into our modified heuristic evaluation method (Appendix A). The Usability Testing Leader, an expert in usability testing, determined the relevance of each heuristic through a systematic pair-wise analysis. This process occurred independently of the evaluators tasked with assessing the software, thus maintaining an unbiased approach. Unaware of the Usability Testing Leader’s weighting decisions, the evaluators focused solely on their usability assessment tasks. This dual-process approach ensured the evaluations were objective and reflected the software’s inherent usability features. To implement this modified evaluation method, we chose Python for its versatility and robustness, particularly for the computation of the heuristic weights. The evaluators, on the other hand, conducted their assessments using tools that are universally accessible and user-friendly, such as Excel or online forms. This choice of software facilitated ease of use and widespread applicability. The evaluators’ scores were then multiplied by the respective weights in Python. This allowed for a nuanced analysis that considered the individual scores and the adjusted significance of each heuristic element.
  • Input: Pairwise comparison matrices for criteria and alternatives.
  • Output: Priority vector (weights) for criteria and alternatives.
  • For each pairwise comparison matrix:
    -
    Normalize the matrix by column.
    -
    Compute the principal eigenvector to determine weights.
    -
    Calculate the consistency ratio.
    -
    If CR is less than 0.1:
    • Accept the weights.
    -
    Else:
    • Re-evaluate comparisons.
  • Aggregate the weights for final decision-making.

3.3. Simulation

We designed a simulation framework to evaluate the performance of our modified AHP algorithm over 10,000 iterations. The aim was to analyze the algorithm’s ability to enhance consistency and reduce the number of comparisons using the transitivity property. In each simulation, a virtual decision-maker initiates the process with the first criterion and randomly selects a value from the Saaty scale. The decision-maker then chooses a set of criteria for comparison, ranging from one to the entire remaining set. Upon selecting multiple criteria, the algorithm applies the transitivity property to reduce the number of direct comparisons needed, thereby excluding those criteria from future selections. The simulation repeats this process until all necessary comparisons are completed. This methodology aims to understand the algorithm’s efficiency in reducing comparisons and improving consistency in decision-making scenarios. Additionally, the experiment records the computing time, the number of comparisons made, and the consistency index for each simulation. The primary objectives are to assess the algorithm’s impact on reducing the number of necessary comparisons and improving the consistency of the pairwise comparison matrix.

3.4. Data Acquisition

Data for this study were meticulously gathered through a series of structured usability evaluations, this time within the controlled environment of a European usability research center in 2021 [blind review]. The evaluators, seven engineers with doctoral studies in engineering and informatics and extensive experience in usability evaluation, have previously worked with the Granollers test. These evaluators offered their services voluntarily by an academic agreement and respecting good research practices through a consent form. Their expertise brought depth to the analysis, providing a professional perspective on the usability of a sophisticated web application under examination [blind review].
Significantly, the Usability Testing Leader, who took part in the analytical assessment, directed the process while setting weights according to their expert understanding of the software’s usability needs. As a result of this pragmatic approach, the evaluations offered theoretical insights and practical implications for software development. Regarding data transparency, our research subscribes to an open-data policy, with all related materials, methodologies, and datasets available for replication and further investigation. Researchers and practitioners interested in this data can access the RUXAILAB2, a remote usability lab based on artificial intelligence to perform usability testing and experiments, where the datasets are hosted. It is worth noting that the activities of the Usability Testing Leader and evaluators were confined to the scope typical of an educational environment. Since the research was centered around the evaluation process and not on the participants, and the evaluators were also researchers benefiting from the activity in their corresponding research, there was no need for ethical approval, aligning with established ethical research standards when there is no investigation with human beings.

4. Results

4.1. Algorithm for Pairwise Comparison

The Python script introduces a tailored algorithm for decision-making using the AHP, which excels in evaluating complex scenarios with multiple criteria, like selecting heuristics. Despite its apparent quadratic worst-case complexity, the algorithm significantly aims to streamline the decision-making process. This efficiency stems from a strategic approach to collecting user inputs for pairwise comparisons. Traditional AHP requires N * ( N 1 ) / 2 comparisons (with N as the number of criteria), but this algorithm cleverly reduces this number. It directs the decision-maker to evaluate the relative importance of one criterion against others. For example, it might ask, "Select an option for comparisons involving Heuristic one (Cost) against the remaining criteria." When a user chooses a value from Saaty’s scale, like ’Equal Importance,’ the algorithm then asks which criteria are of this importance level compared to Cost.
The brilliance of this method is in its use of the transitive nature of comparisons [72]. When a user categorizes multiple criteria equally important to a specific criterion, the algorithm automatically applies the same level to those grouped criteria, thus increasing the matrix’s consistency. This smart approach can significantly reduce the necessary number of comparisons. In a practical scenario, for a set like Granollers’ heuristics with 105 pairwise comparisons, this reduction could bring the number down to as low as one if all heuristics are considered equally important. This decrease transforms what could be a cumbersome and lengthy task into a far more manageable one, enhancing the algorithm’s effectiveness in situations with a large set of criteria.

4.1.1. Algorithm Performance

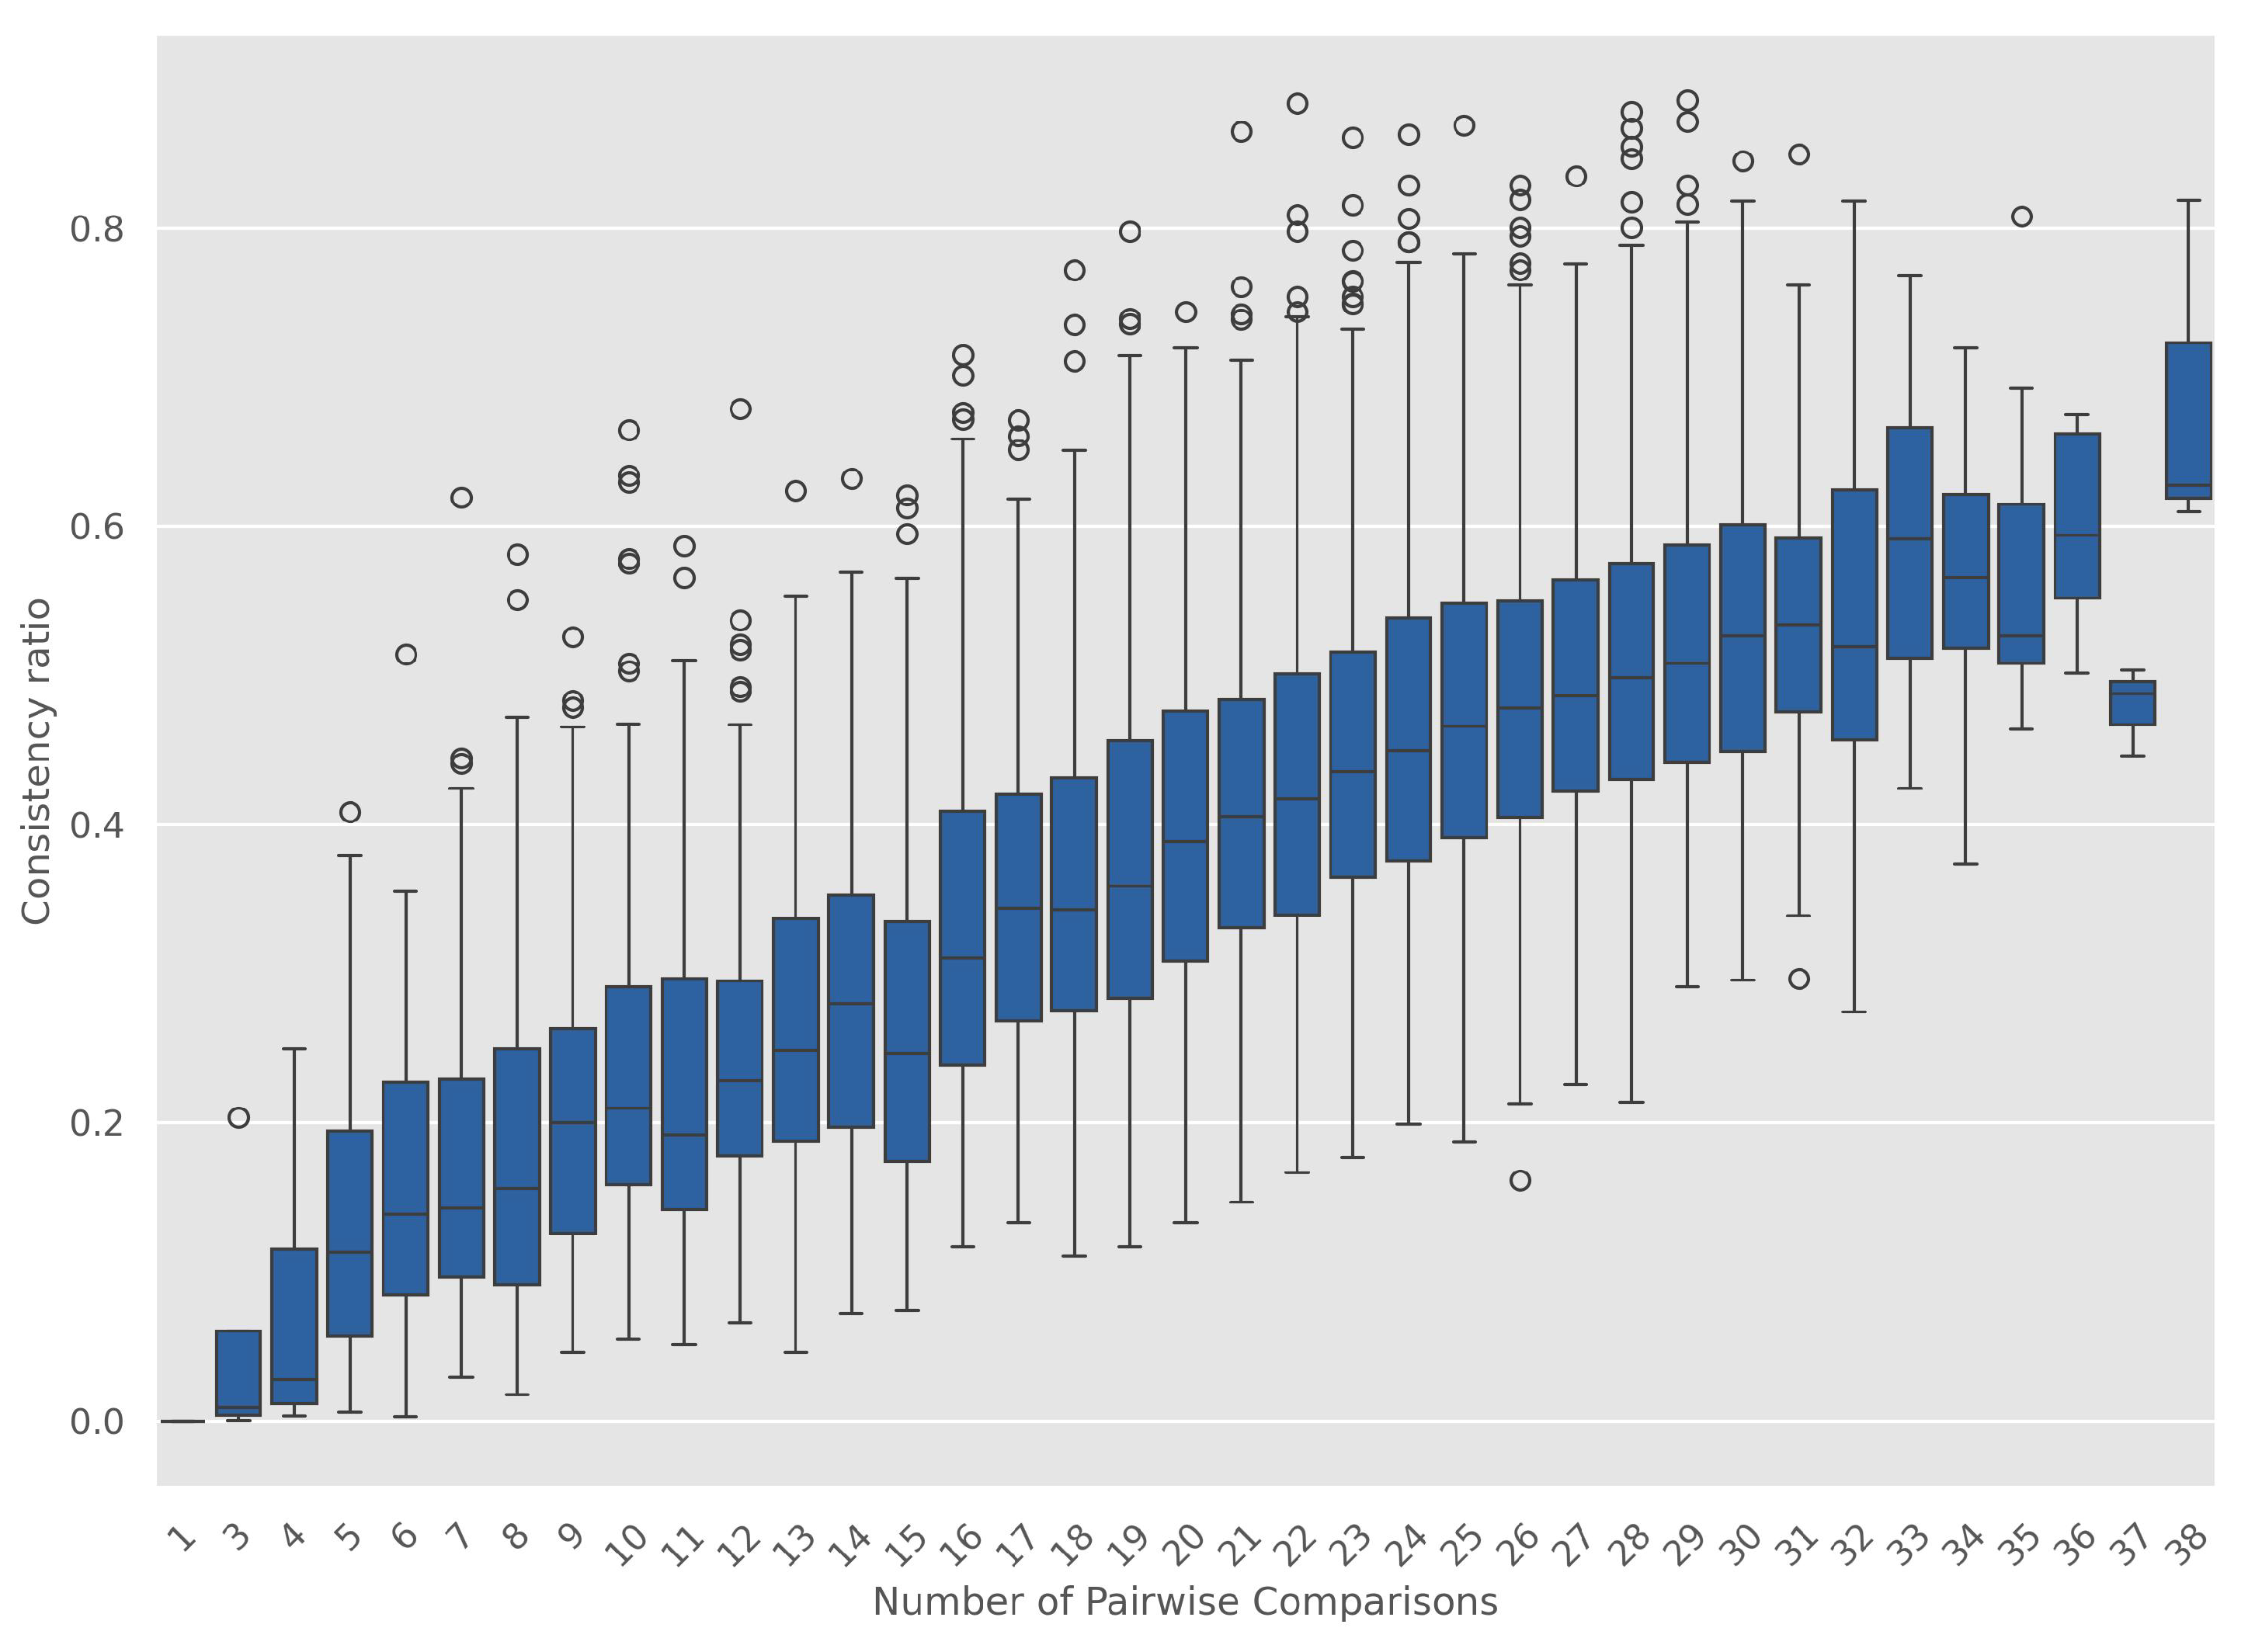
In this study, we ran 10 , 000 simulations using our algorithm with randomly assigned comparison values. We focused on evaluating our assignation method’s consistency ratio compared to theoretical expectations of random assignment. Our results in Figure 1 reveal a notable and expected trend: the consistency ratio improves with fewer assignments. This pattern underscores the robustness of our approach, especially considering a random assignment methodology. Furthermore, our algorithm’s efficiency is evident in its requirement of only a maximum of 38 comparisons, a significant reduction from the 105 comparisons necessary for a complete pairwise evaluation. This performance is also clear in computation time, with a maximum of 0.14 seconds, an average of 0.022 seconds, and a standard deviation of 0.005 seconds. This improved efficiency does not compromise the accuracy of the evaluations but assists the decision-maker in creating a safe comparison, avoiding a long and cumbersome experience. This is evidenced by generating 858 cases that achieved satisfactory consistency (values below the threshold of 0.1 ).
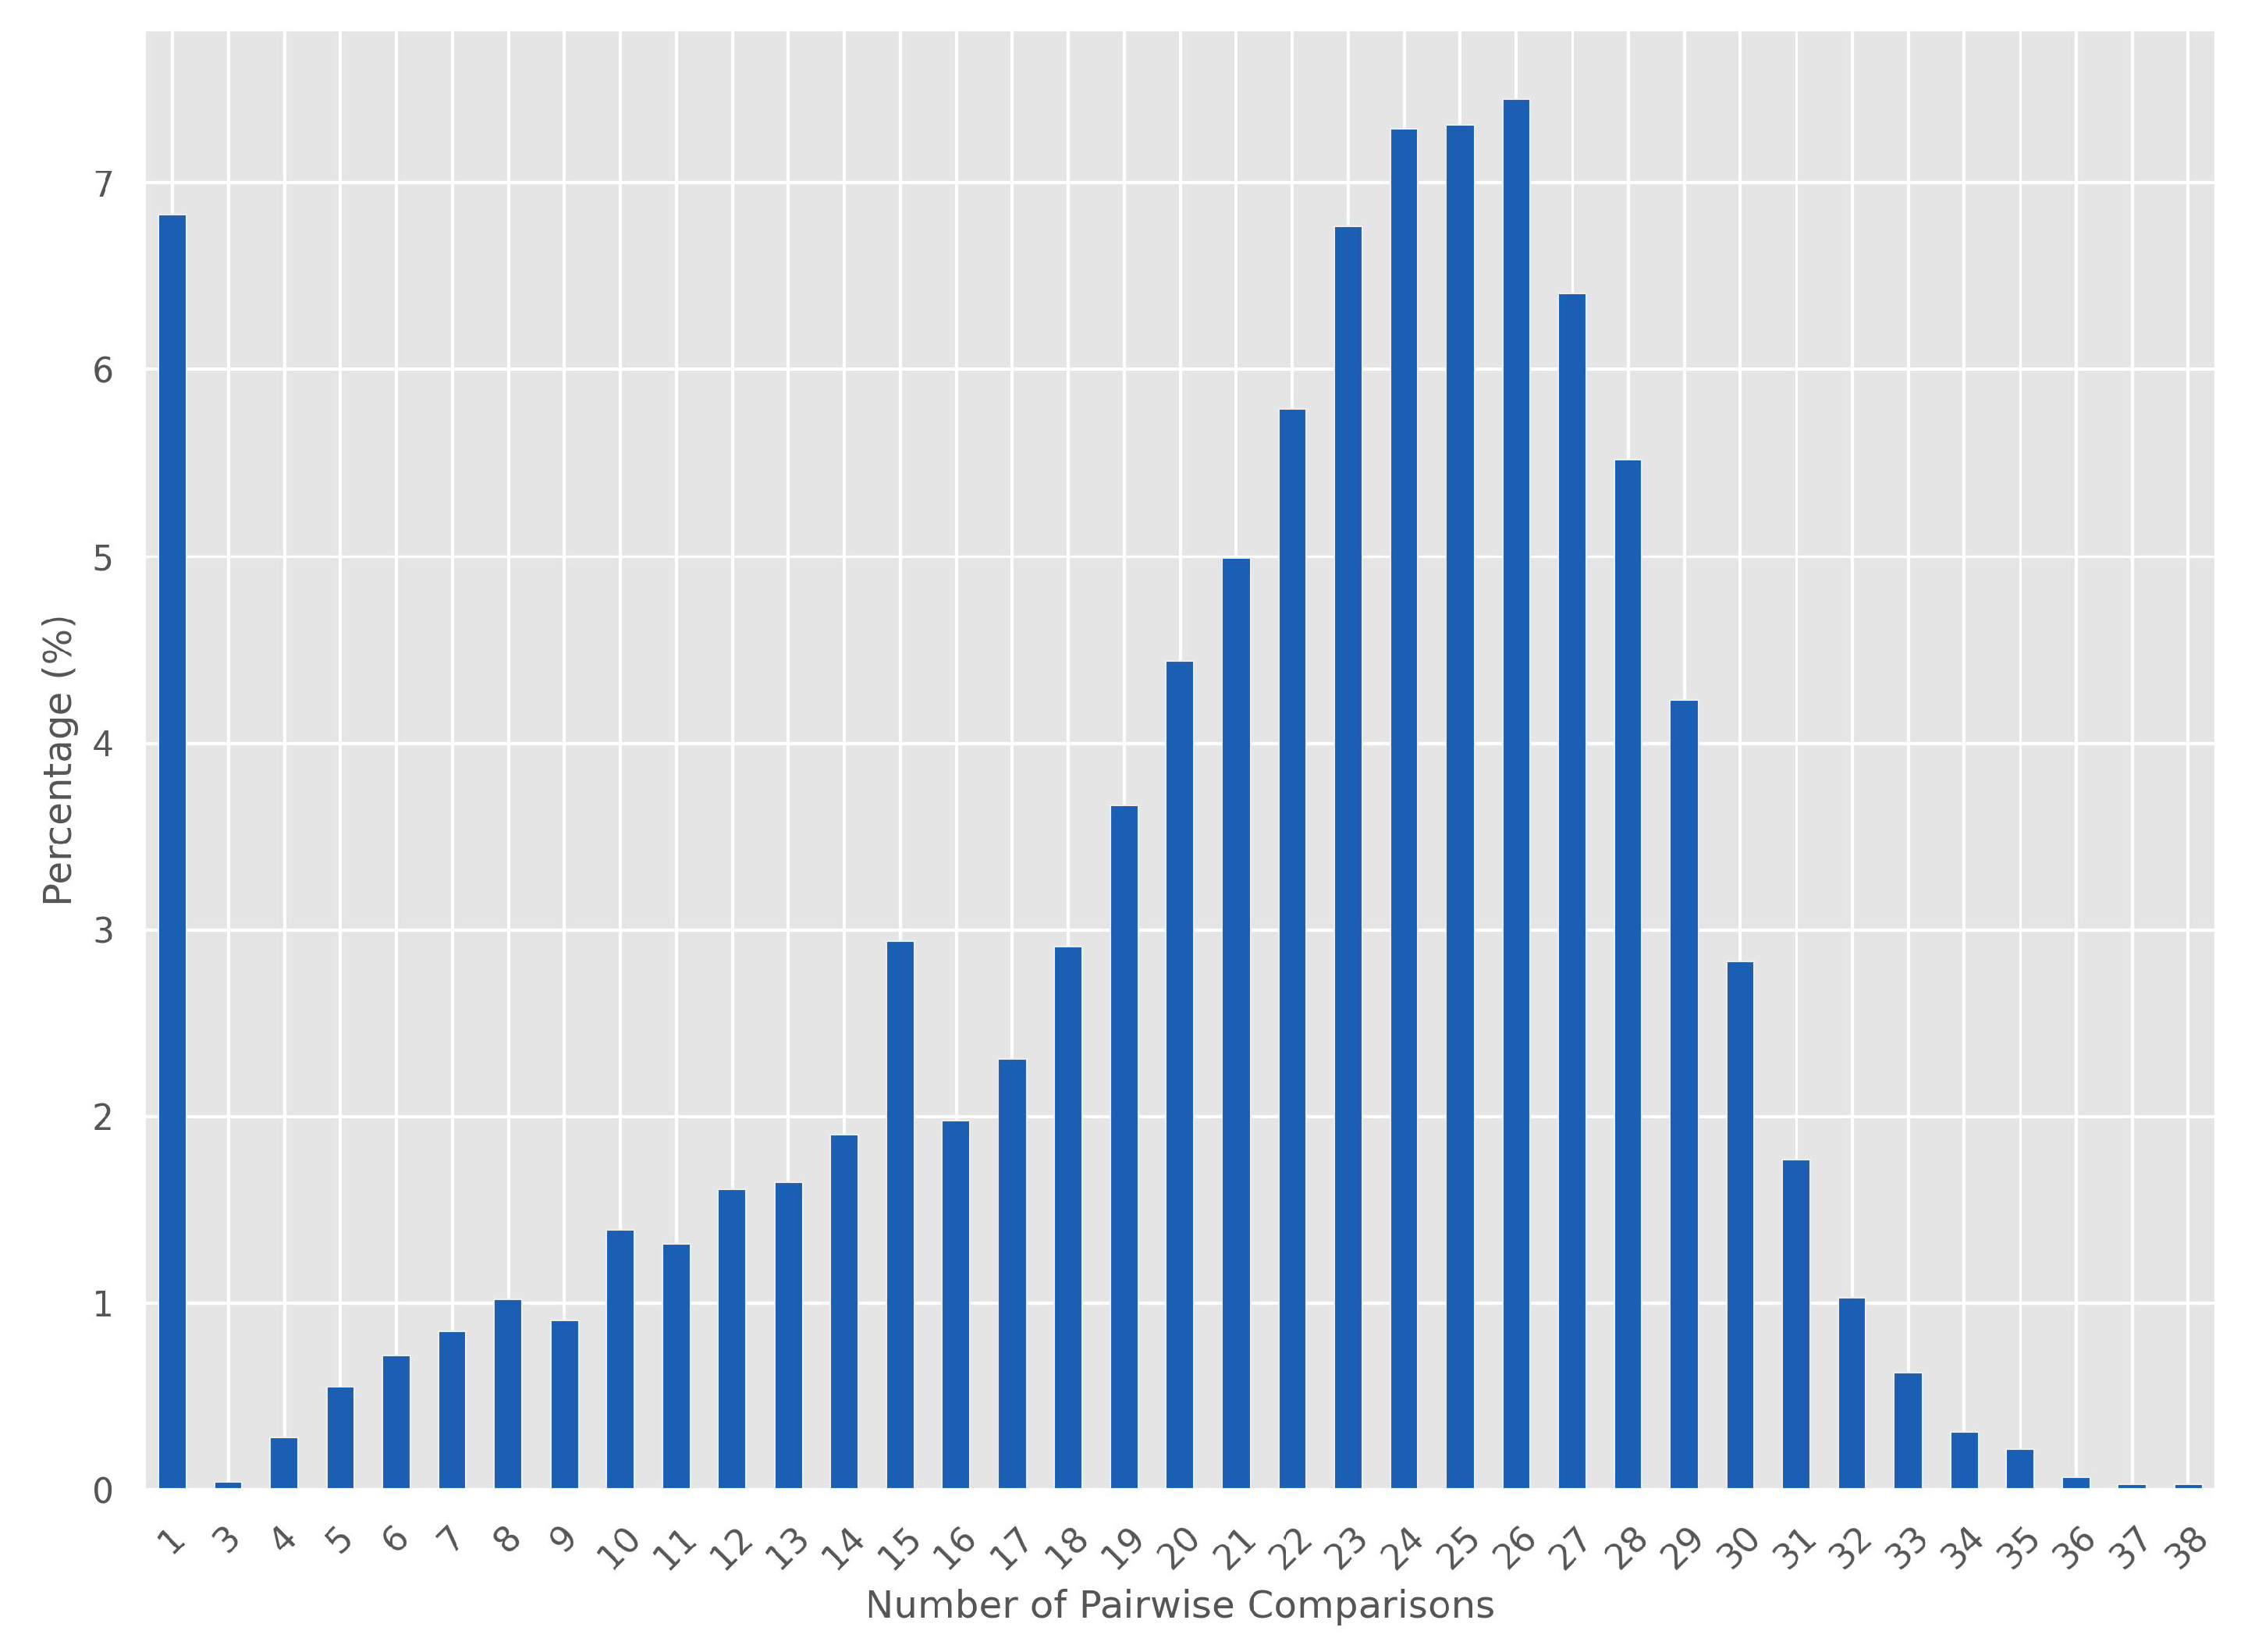
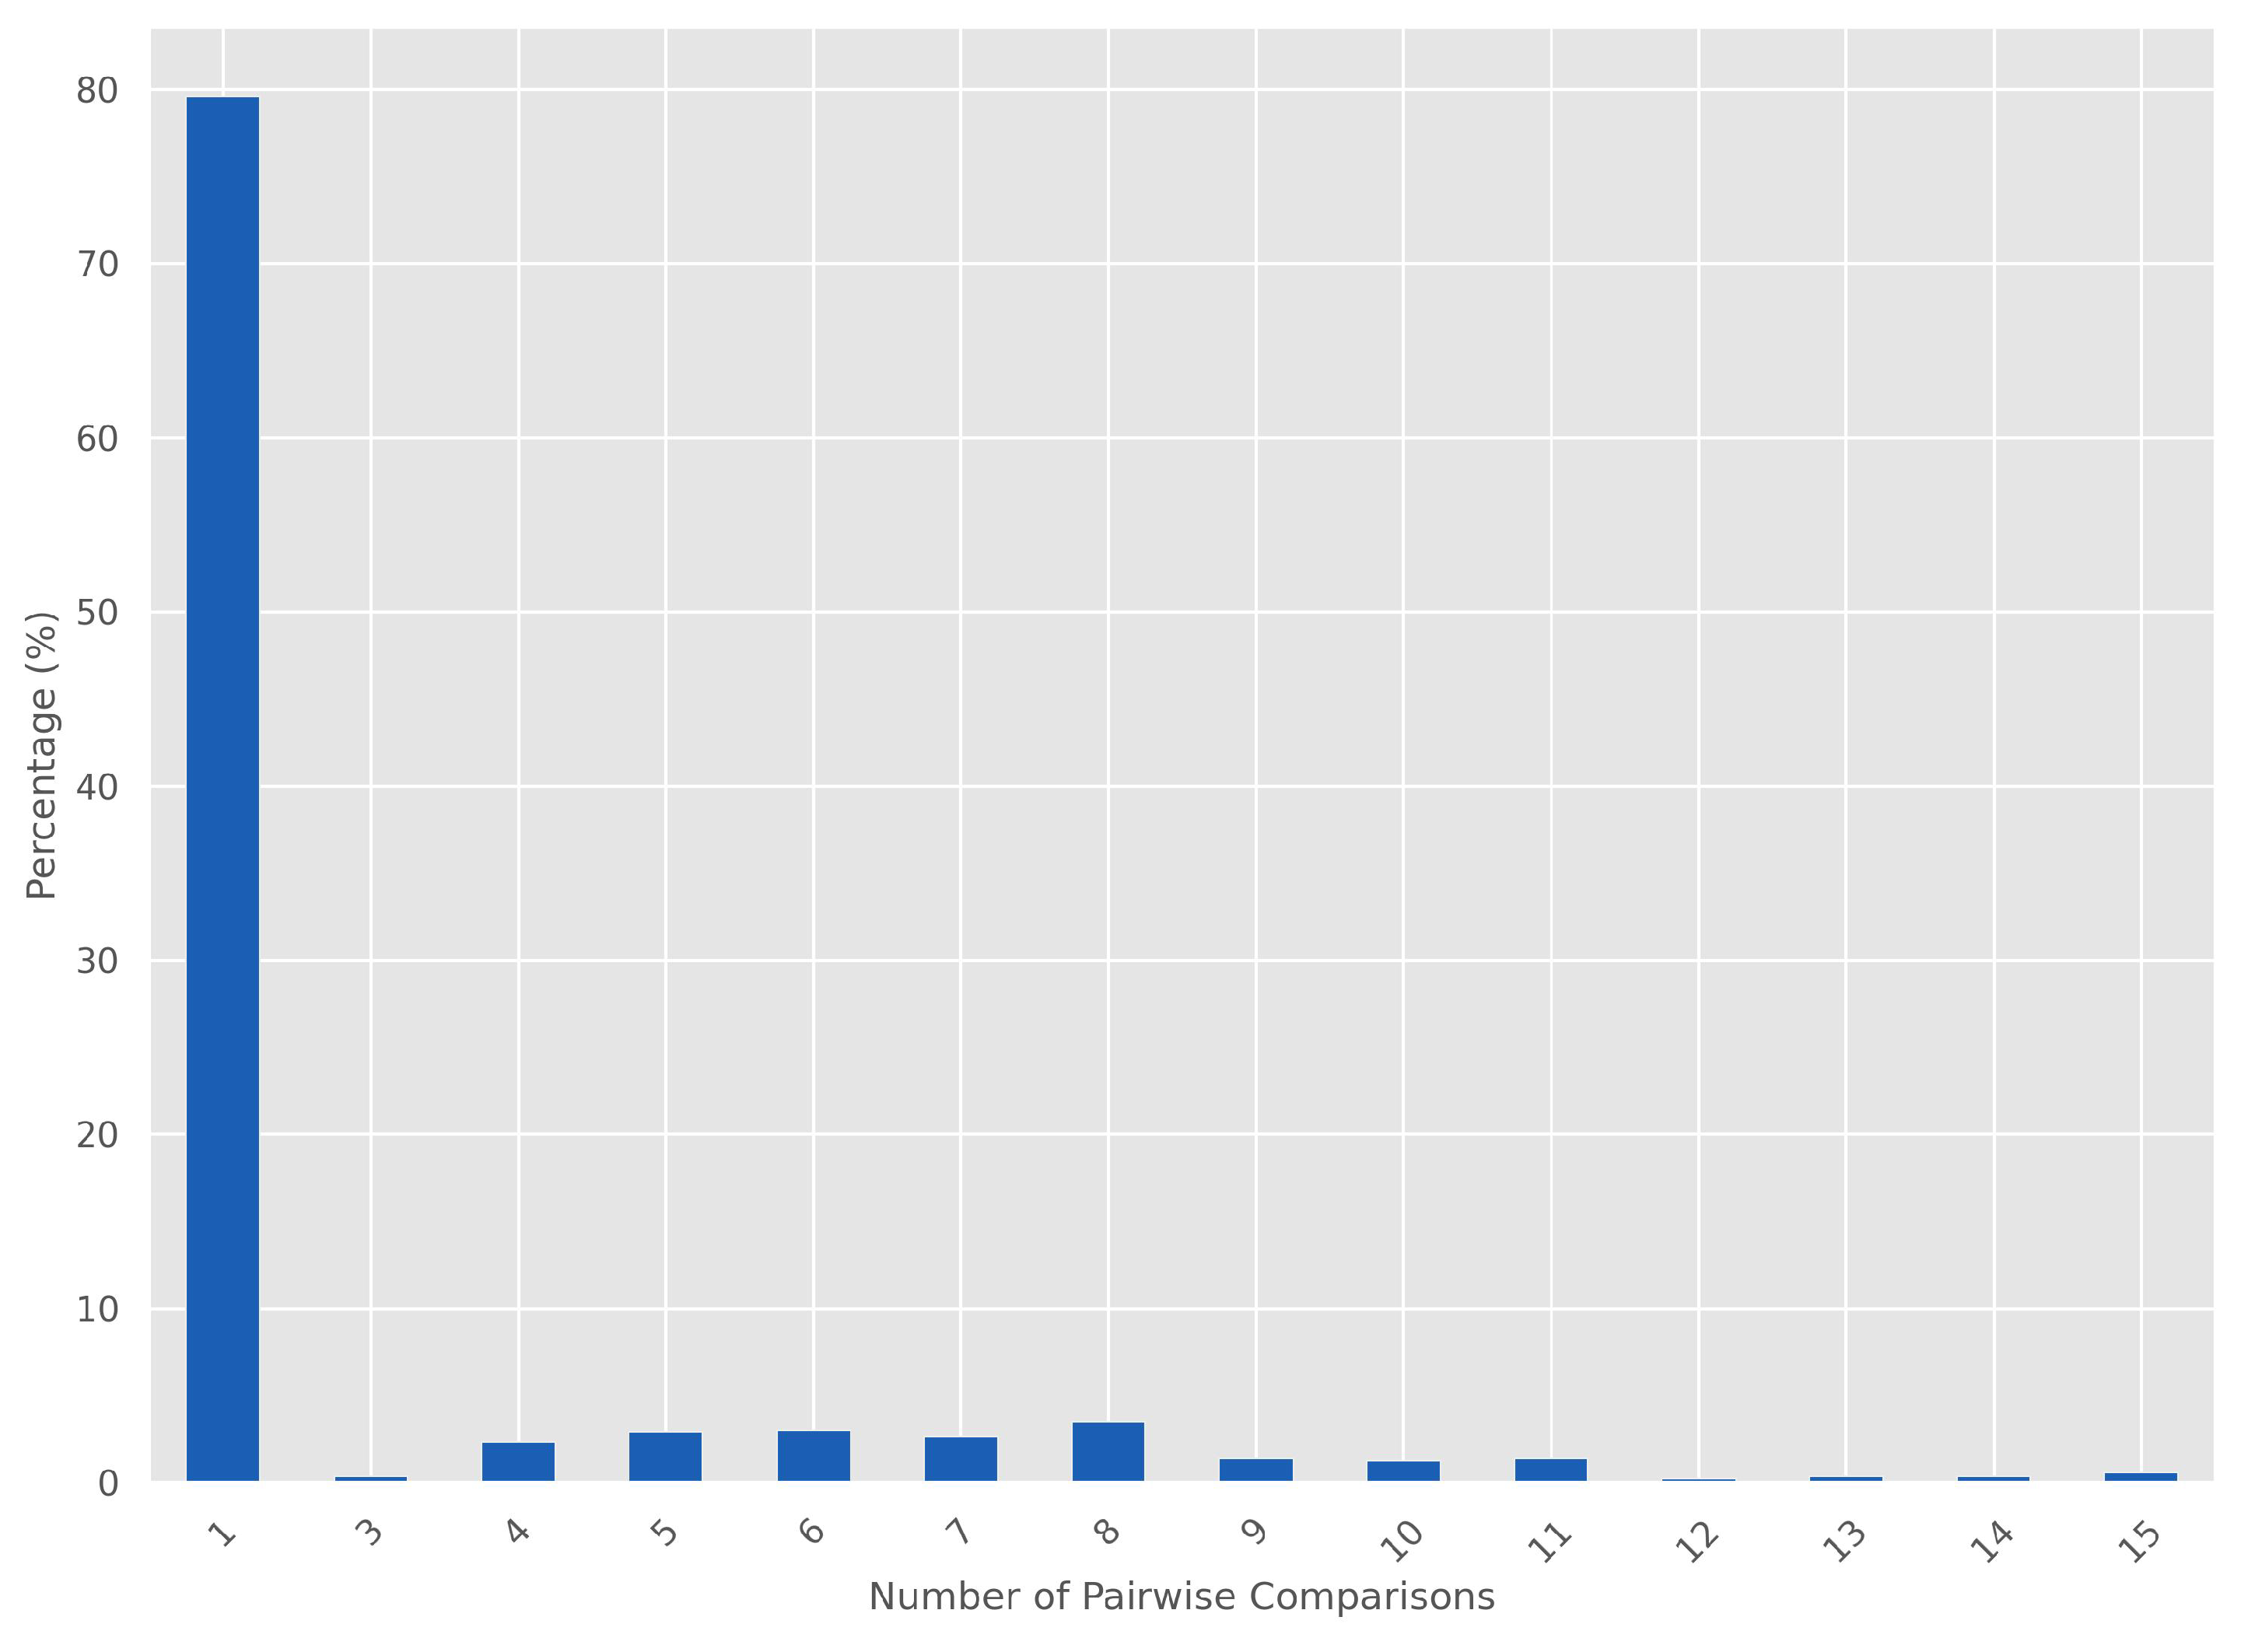
An intriguing aspect of our findings is the role of single comparisons in achieving higher consistency. The algorithm’s effectiveness is most pronounced when it employs just one comparison, using the transitivity property to infer additional comparisons. Figure 2 depicts instances with only a comparison accounting for 6.83 % of all cases. Our analysis, detailed in Figure 3, also shows that the algorithm maintains consistency in scenarios with up to 15 comparisons. Despite the lower overall consistency rate (under 9 % of the 10 , 000 simulations), our method significantly outperforms random assignment, with a maximum consistency ratio of approximately 1.59 . In comparison, our approach achieved a maximum consistency ratio of 0.88 and an average of 0.39 , highlighting its reliability and potential application in heuristic usability evaluation within the HCI field with a high-dimension set of criteria. The comparison in the Saaty scale used for weight calculations was as follows:

4.2. Weightened Heuristic Application

After testing the algorithm, we applied the AHP to the Usability Testing Leader (UTL) to simplify the application of the Analytic Hierarchy Process. The findings show a streamlined and enhanced consistency in the weighting process. The UTL set weights adeptly based on a discerning evaluation of each heuristic’s comparative relevance for a specific website [blind review]. The algorithm application reveals a significant reduction in the required comparisons—from the exhaustive 105 to a more manageable 29—thereby simplifying the evaluative experience of getting the comparison matrix in Table 2. The AHP analysis produced promising results, indicating a Max Eigenvalue of 15.97 and a set of Normalized Weights spanning a diverse range (see Table 3). The Usability Testing Leader’s expert judgment determined the weights, which indicate varying degrees of importance for each heuristic, ranging from approximately 18.06 % for the most significant to 1.45 % for the least. This methodology provides a nuanced view of heuristic relevance. The Consistency Ratio, which measures the reliability of pairwise comparisons, is at 0.044 , well within the acceptable threshold, thus confirming the assessment’s consistency.
  • H1 Comparisons
    -
    H1 vs H5: H1 and H5 are considered to have equal importance.
    -
    H1 vs H2, H4, H9, H12, H13: H1 is moderately more important than H2, H4, H9, H12, and H13.
    -
    H1 vs H3, H6, H7, H8: H1 is strongly more important than H3, H6, H7, and H8.
    -
    H1 vs H10, H11, H14, H15: H1 is very strongly more important than H10, H11, H14, and H15.
  • H2 Comparisons
    -
    H2 vs H5: H2 is moderately less important than H5.
    -
    H2 vs H9, H12, H13: H2 has equal importance compared to H9, H12, and H13.
    -
    H2 vs H3, H4, H6, H7, H8: H2 is moderately more important than H3, H4, H6, H7, and H8.
    -
    H2 vs H10, H11, H14, H15: H2 is strongly more important than H10, H11, H14, and H15.
  • H3 Comparisons
    -
    H3 vs H5: H3 is very strongly less important than H5.
    -
    H3 vs H4, H9, H12, H13: H3 has equal importance compared to H4, H9, H12, and H13.
    -
    H3 vs H6, H7, H8: H3 is moderately more important than H6, H7, and H8.
    -
    H3 vs H10, H11, H14, H15: H3 is strongly more important than H10, H11, H14, and H15.
  • H4 Comparisons
    -
    H4 vs H5: H4 is moderately less important than H5.
    -
    H4 vs H6, H7, H8: H4 has equal importance compared to H6, H7, and H8.
    -
    H4 vs H10, H11, H14, H15: H4 is moderately more important than H10, H11, H14, and H15.
  • H5 Comparisons
    -
    H5 vs H9, H12, H13: H5 is moderately more important than H9, H12, and H13.
    -
    H5 vs H6, H7, H8: H5 is strongly more important than H6, H7, and H8.
    -
    H5 vs H10, H11, H14, H15: H5 is very strongly more important than H10, H11, H14, and H15.
  • H6 Comparisons
    -
    H6 vs H9, H12, H13: H6 is moderately less important than H9, H12, and H13.
    -
    H6 vs H10, H11, H14, H15: H6 is strongly more important than H10, H11, H14, and H15.
  • H7 Comparisons
    -
    H7 vs H9, H12, H13: H7 is moderately less important than H9, H12, and H13.
    -
    H7 vs H10, H11, H14, H15: H7 is strongly more important than H10, H11, H14, and H15.
  • H8 Comparisons
    -
    H8 vs H9, H12, H13: H8 is moderately less important than H9, H12, and H13.
    -
    H8 vs H10, H11, H14, H15: H8 is strongly more important than H10, H11, H14, and H15.
  • H9 Comparisons
    -
    H9 vs H10, H11, H14, H15: H9 is strongly more important than H10, H11, H14, and H15.
  • H10 Comparisons
    -
    H10 vs H11, H14, H15: H10 has equal importance compared to H11, H14, and H15.
    -
    H10 vs H12, H13: H10 is strongly less important than H12 and H13.
  • H11 Comparisons
    -
    H11 vs H12, H13: H11 is strongly less important than H12 and H13.
  • H12 Comparisons
    -
    H12 vs H14, H15: H12 is strongly more important than H14 and H15.
  • H13 Comparisons
    -
    H13 vs H14, H15: H13 is strongly more important than H14 and H15.
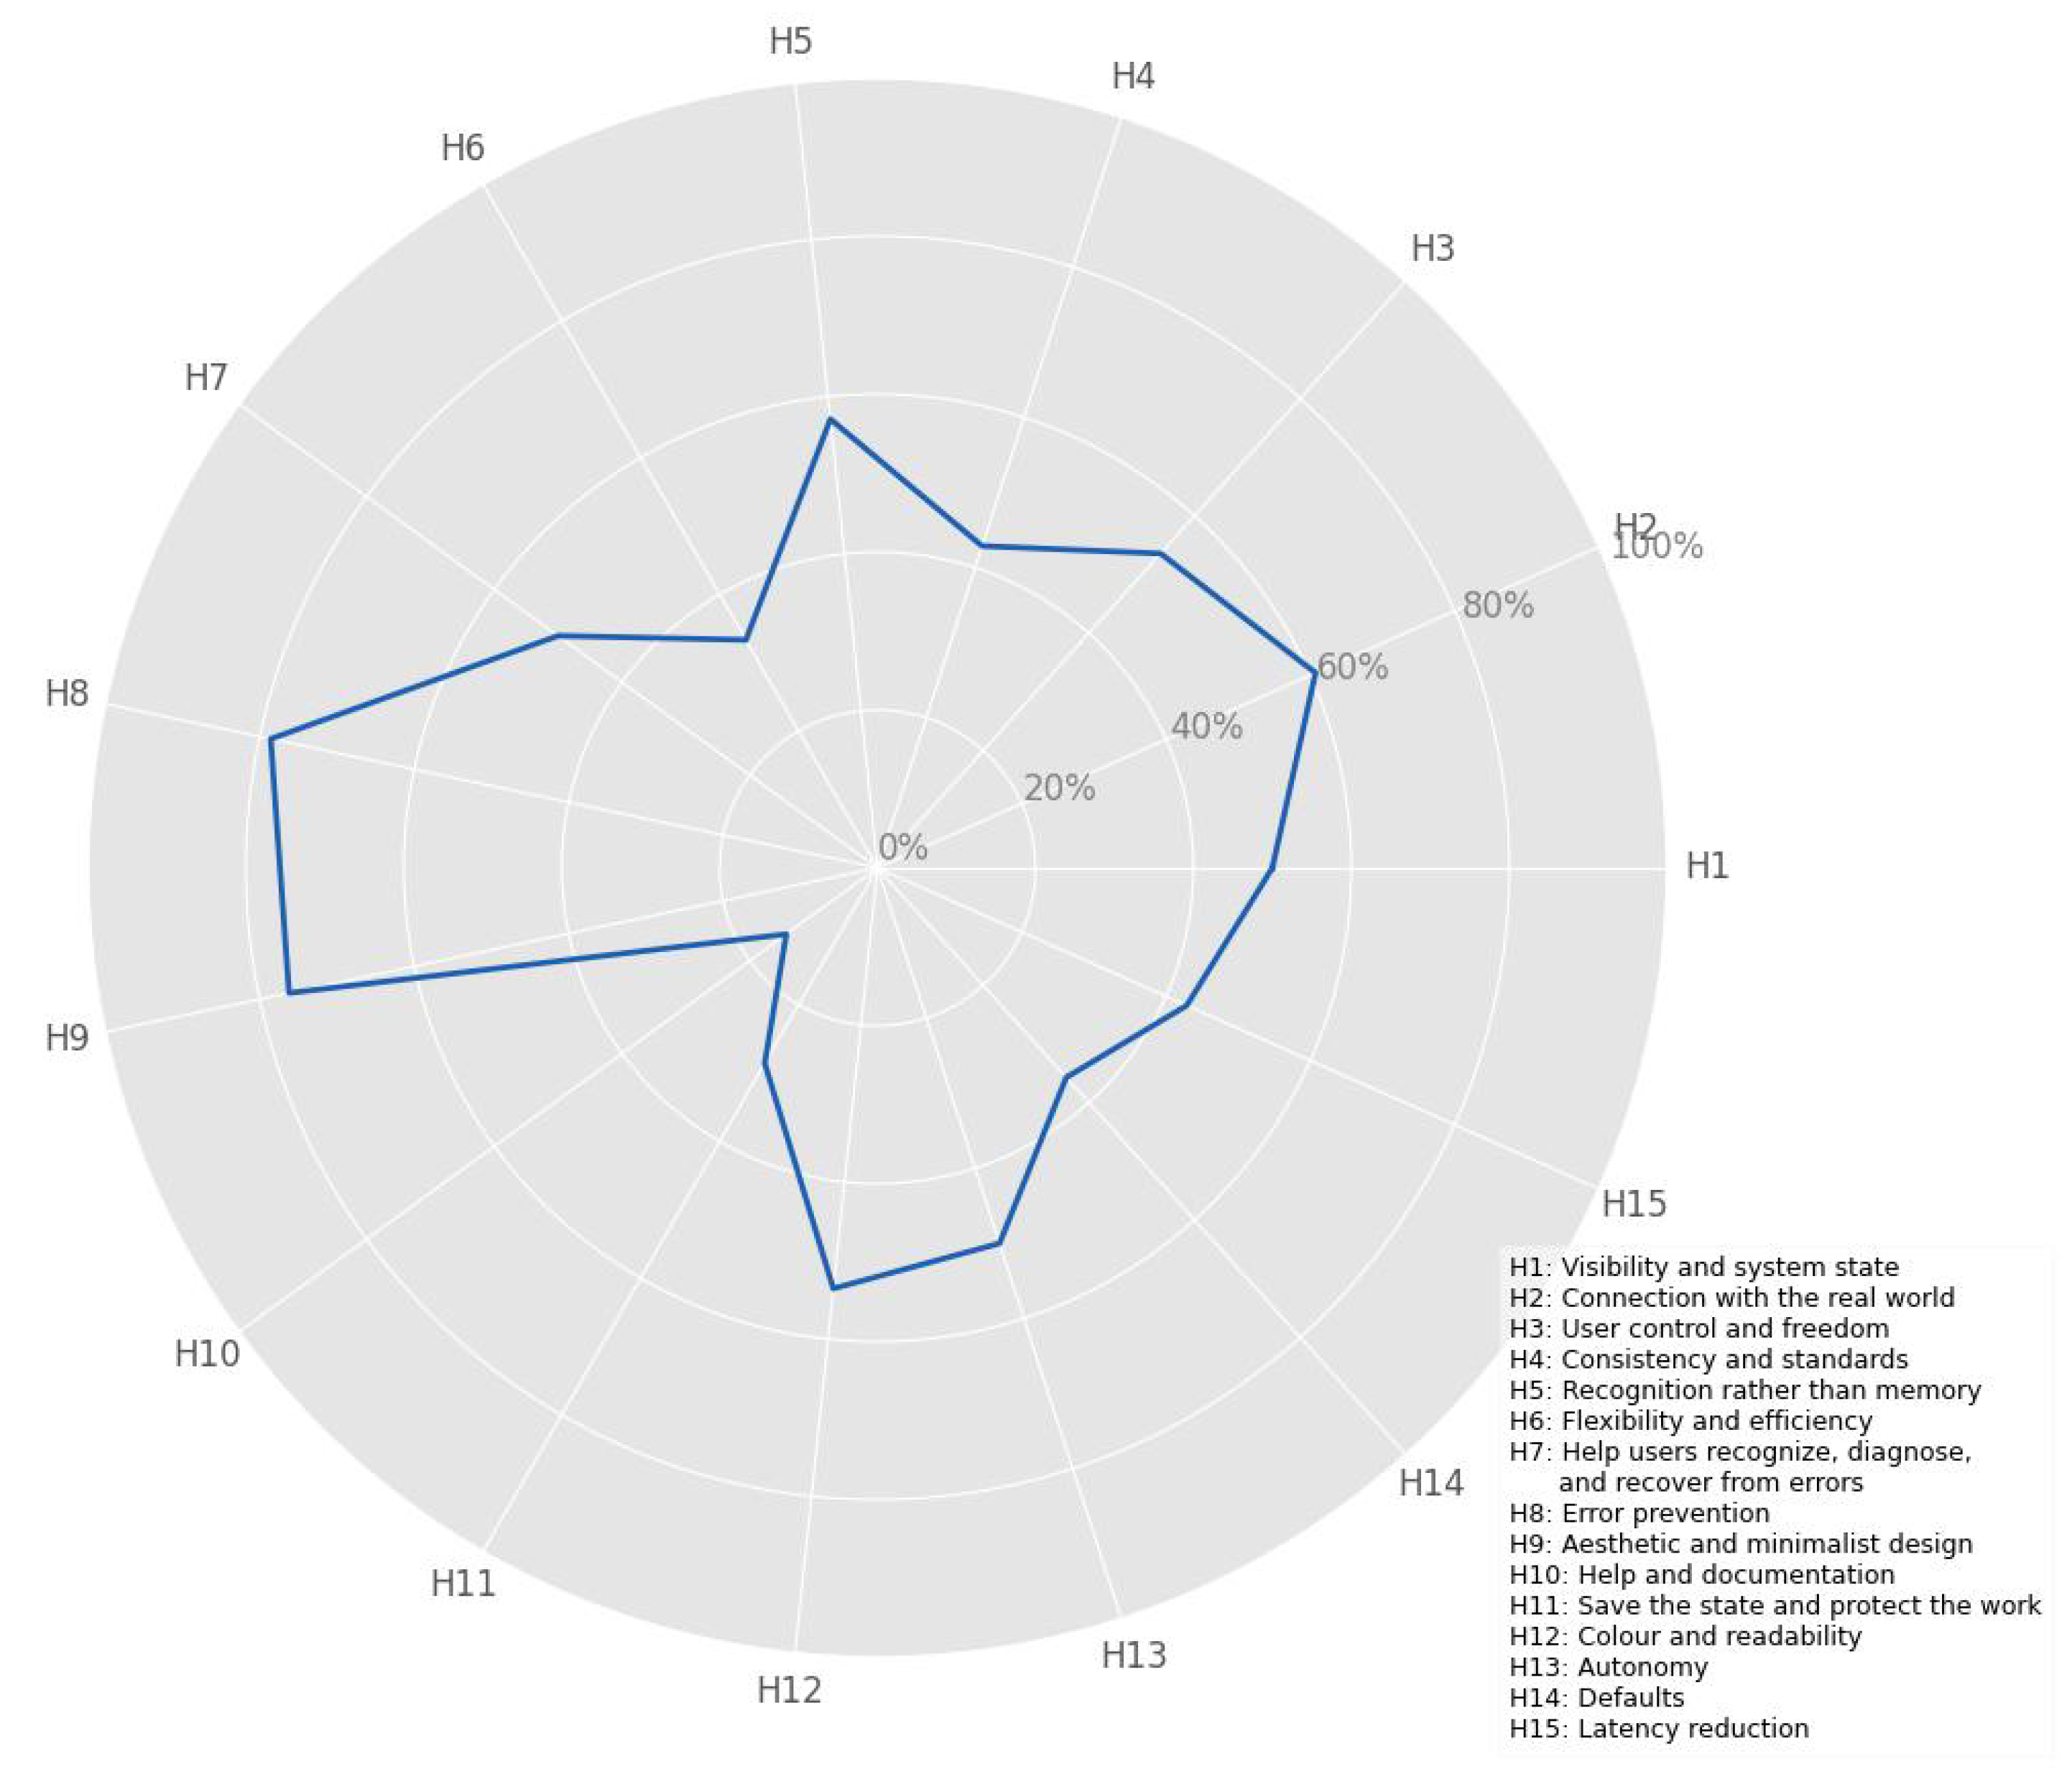
In parallel, experts analyze the heuristics and value them using the Granollers instrument [51]. Table 4 details the evaluators’ scores, illuminating the practical application of these heuristics (Figure 4 presents a summary for each heuristic). The presence of zeros in the scores indicates instances where evaluators deemed certain heuristics inapplicable, reflecting their professional judgment. Such agreements and differences are crucial as they affirm the heuristic evaluation process’s robustness, ensuring alignment in the overall system usability assessment even when subjective judgments vary. A key point to highlight is that the value in each heuristic depends on the number of questions in that evaluation component, necessitating standardization to make a clearer and more in-depth comparison between heuristic values.
The normalized results in Figure 4 facilitate an overview of the software performance. The software delivers commendable performance in several key usability domains, which could indicate a user-centric design philosophy. The high Visibility and System State and Connection with the Real World scores demonstrate the software’s robustness in providing users with clear feedback and employing user-friendly language that aligns with real-world conventions. This alignment likely enhances user engagement and reduces the cognitive load required to interact with the software. The moderate to high User Control and Freedom and Consistency and Standards scores reflect a system that respects user agency, offering control through undo/redo functionalities and maintaining a consistent interface that adheres to recognized standards. These aspects foster user confidence and facilitate a smooth learning curve. However, the software’s usability suffers from its moderate score in Recognition Rather than Memory, where there is room for improvement to reduce reliance on user memory. Integrating a more intuitive design that leverages recognition will further streamline user interactions. In Flexibility and Efficiency, the software excels, suggesting it allows expert users to operate more efficiently, possibly through customizable shortcuts or adaptive interfaces.
This flexibility marks mature software design, catering to a broad user base with varied expertise. The lower scores in Help Users Recognize, Diagnose, and Recover from Errors and Error Prevention underscore critical areas of concern. Clarifying error messages and incorporating preventative measures could reduce user frustration and boost productivity. Addressing these issues should be a priority to enhance error management and build a more resilient system. While not alarming, the moderate score in Aesthetic and Minimalist Design indicates that the software’s design could be further refined to eliminate superfluous elements, thereby adhering to minimalist design principles to create a more focused user experience. A significant usability shortcoming emerges from the low score in Help and Documentation, indicating that the help resources may be inadequate. Improving help systems is crucial for user support, especially when users face challenges or learn new features. The low scores in Save the State and Protect the Work through Latency Reduction signify systemic usability challenges that demand immediate attention. The software’s evident deficiencies in preserving user states, optimizing readability through color usage, enabling user autonomy, setting effective defaults, and minimizing latency could substantially improve the overall user experience.
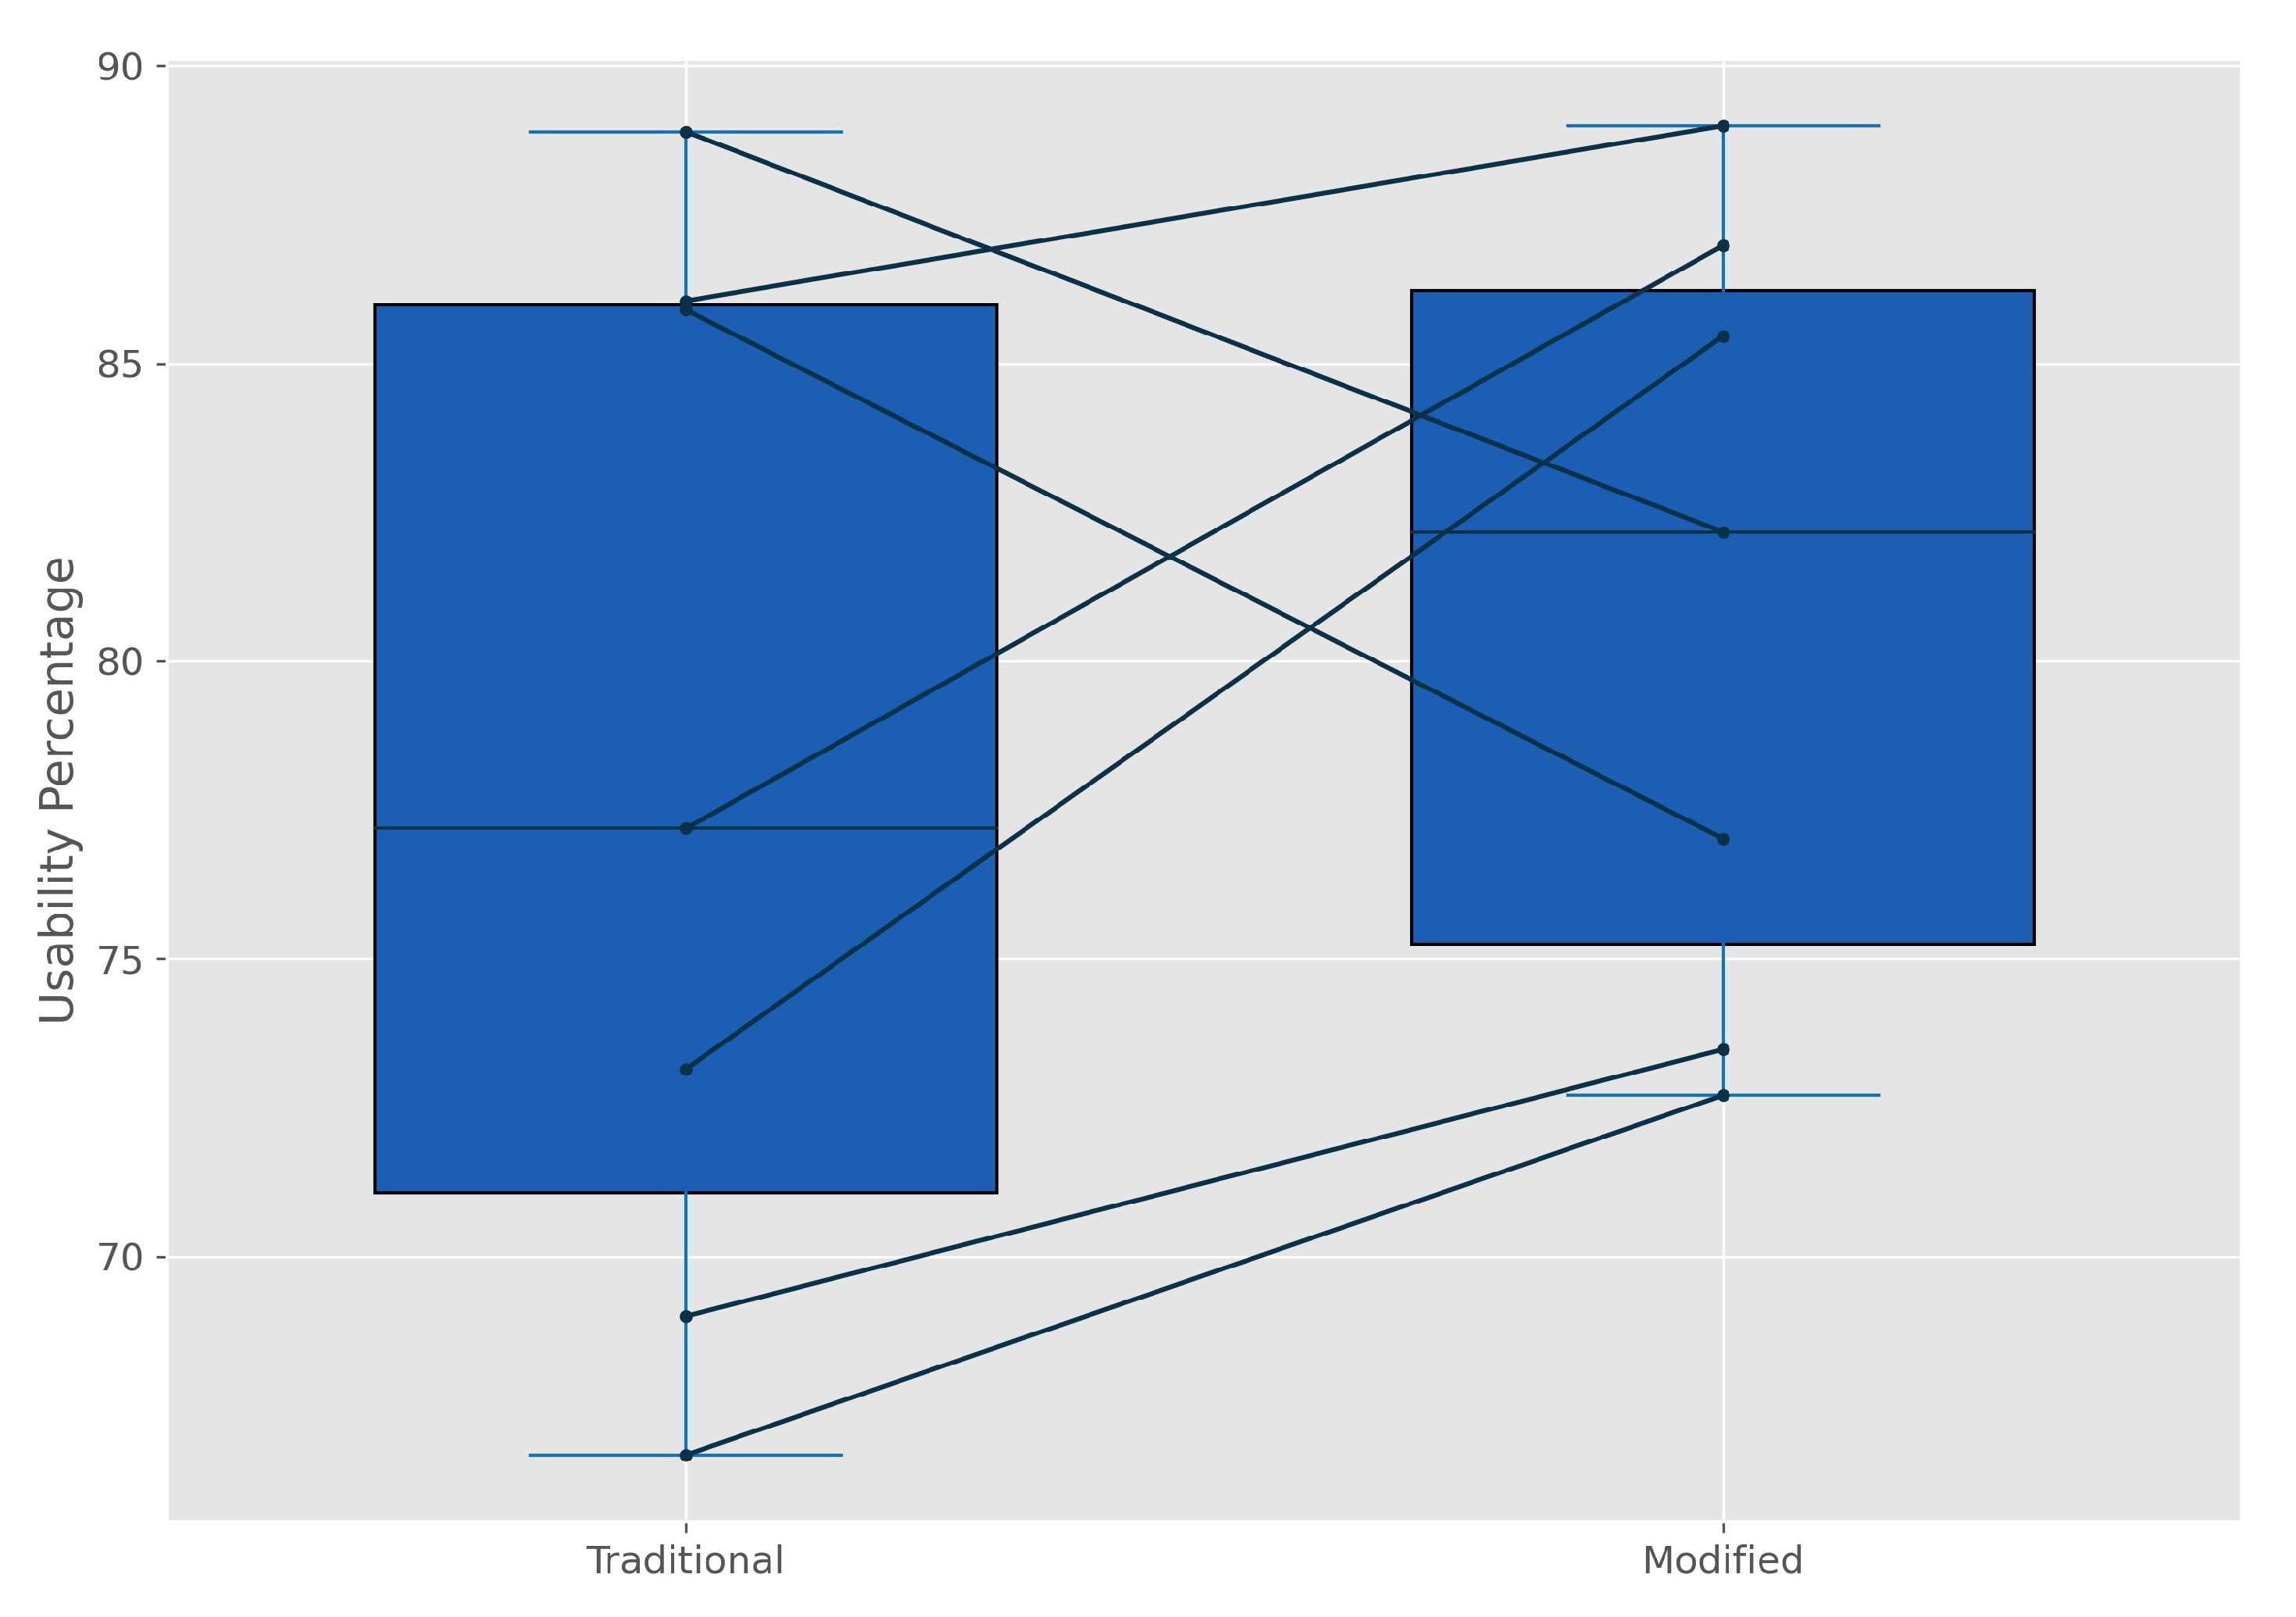
We calculated the usability percentage after establishing the weights. Using Granollers’ traditional method, we marked these initial results as "Traditional." Then, applying our modified algorithm, we labeled the outcome "Modified." Figure 5 displays these final results, showing the paired usability scores from seven evaluators. Although the usability percentage decreases in a few cases after the new calculation, it generally increases with our modified calculation, increasing the usability score from 78.12 % to 80.97 % . Another notable observation is that variability decreases from a standard deviation of 8.94 % to 6.61 % after implementing our approach. This phenomenon occurs because those heuristics with higher differences among expert evaluators are those that the UTL deemed less relevant.
Considering the modified approach, an overview of the relevance of each heuristic appears in Figure 6. As a result of the UTL analysis, the modified set prioritizes "Visibility and System State" and "Connection with the Real World," as evidenced by their substantial positive differences. This finding highlights that these heuristics have high standardized values and low deviations, indicating a consensus among evaluators. These heuristics are crucial for an intuitive user interface, suggesting the new system effectively communicates with users and aligns with their expectations. The high standardized scores for the first heuristics, while having relatively low deviations, confirm their successful implementation and the system’s enhanced usability. Conversely, heuristics like "Help and Documentation" and "Latency Reduction" have low standardized scores and negative differences, indicating they are de-emphasized in the new evaluation system. Without prior prioritization by the UTL, the low values with low deviations could fail to indicate areas needing development to meet user needs comprehensively. However, the significant negative deviation suggests that those areas are not a priority for improvement. "Autonomy," despite a high standardized score and low deviation among evaluators, is considered less critical in the new system’s weight set. This suggests a shift in focus or a different usability strategy adopted by the developers, implying no need for improvements. However, this component is not as relevant as other heuristics. Heuristics with low values and negative differences—such as "Error Prevention," "Aesthetic and Minimalist Design," and others—indicate these areas are less relevant in the new approach. This shift calls for careful consideration to ensure it aligns with the overall goals of the software and user expectations; that is, those components should be prioritized for future enhancements to increase the overall system’s usability.

5. Discussion

The pursuit of standardization in usability testing methodologies considering the diversity of heuristic evaluation reported in literature [5,8,25,27,30,40,51,56,73,74,75,76,77,78], particularly in the context of diverse questions and dimensions, underscores a pivotal aim of this research. This research aims to standardize the evaluation process, especially for emerging mixed-method scenarios, by focusing on a core set of heuristics [51] applicable across various usability tests. This strategy aims to mitigate the inconsistencies and gaps in current practices, providing a more structured framework for usability assessment. By pinpointing significant areas for improvement in our case study, we have identified heuristics that scored low in evaluations despite their high importance. This discrepancy signals a critical need for targeted enhancements to elevate the system’s overall usability under scrutiny. Such an analytical approach is crucial for refining usability aspects directly impacting user experience and satisfaction [36,49].
The comparison between user perception-based methods like the SUS [48] and technology acceptance model [26] and expert-driven heuristic evaluations [14,25,27] reveals a comprehensive understanding of usability. Expert evaluations offer a broader perspective by incorporating detailed analysis and guiding questions about the system, surpassing the subjective beliefs often captured by user-centric surveys [18]. This depth of insight is instrumental in addressing nuanced usability components that non-expert assessments might overlook. Addressing the complexity of the evaluation process, our proposed method prioritizes heuristics to manage the exhaustive nature of assessments involving a higher number of heuristics. By organizing the evaluation sequence based on heuristic relevance, as determined by the Usability Testing Leader, we enhance the efficiency and focus of the assessment process [9,19]. This prioritization ensures that evaluators concentrate on the most critical aspects early on, reducing the risk of fatigue and potential bias towards the end of the evaluation.
Our approach’s resilience against the variability in the number of items, heuristics, or the scale of items marks a significant advancement in usability testing methodologies. By leveraging tailored algorithms that employ transitive properties for pairwise comparison, we substantially decrease the necessary comparisons, streamlining the evaluation process. Developing a pre-configured set of weights for various software families or technologies will further facilitate usability testing. This innovation will facilitate the adoption of mixed-methods approaches, expanding the applicability and relevance of heuristic evaluations in the evolving landscape of human-computer interaction. This study advances the theoretical foundations of usability testing and offers practical methodologies that can be adapted and implemented across diverse technological domains.

6. Conclusions

This study advances the field of human-computer interaction by introducing a standardized approach to heuristic evaluation in usability testing. We significantly streamline the evaluation process by integrating the Analytic Hierarchy Process and a tailored algorithm that employs transitive properties for pairwise comparison. This method not only simplifies the complexity and workload associated with the traditional prioritization process but also improves the accuracy and relevance of the usability heuristic testing results. By prioritizing heuristics based on their importance as determined by the Usability Testing Leader rather than merely depending on the number of items, scale, or heuristics, our approach ensures evaluations focus on the most critical usability aspects from the start. The findings from this study highlight the importance of expert-driven evaluations in gaining a thorough understanding of usability, offering a wider perspective than user perception-based methods like the questionary approach.

Author Contributions

For this research article, the contributions of each author were distinctly defined and pivotal to the study’s success. Conceptualization was collaboratively handled by L.T., T.G., and H.L., laying the groundwork for the research’s thematic and theoretical foundation. The methodology was developed by L.T., T.G., and H.L., ensuring a robust framework for the study. L.T. was solely responsible for software development and providing the technical tools necessary for the research. The study’s findings were validated by T.G., H.L., and M.C., ensuring the results’ reliability and accuracy. Formal analysis was conducted by H.L. and M.C., contributing to the rigorous examination of the data. The investigation process was led by L.T. K.P. and M.C., driving the research’s empirical inquiry. Resources were procured by L.T. and T.G., supporting the study’s logistical needs. Data curation was managed by L.T. and H.L., who organized and maintained the study’s data integrity. L.T., M.C., and K.P. were crafting the initial manuscript and undertook the writing- original draft preparation. Writing—review and editing were conducted by L.T. and K.P., refining the manuscript’s content. L.T. also took on the visualization tasks, enhancing the presentation of the study’s findings. Supervision was overseen by T.G. and H.L., guiding the research’s strategic direction. Finally, project administration was a collective effort by all authors (L.T., T.G., H.L., M.C., and K.P.), coordinating the study’s operational aspects. All authors have read and agreed to the published version of the manuscript.

Funding

Please add: This research was funded by the Colombian Bureau of Science (Minciencias,

Institutional Review Board Statement

Not applicable.

Informed Consent Statement

Not applicable.

Data Availability Statement

Not applicable.

Acknowledgments

Not applicable.

Conflicts of Interest

The authors declare no conflicts of interest.

Abbreviations

    The following abbreviations are used in this manuscript:
AHP Analytic Hierarchy Process
CI Consistency Index
CR Consistency Ratio
DOC Document (Microsoft Word Format)
HCI Human-Computer Interaction
ISO International Organization for Standardization
PDF Portable Document Format
PSSUQS Post-Study System Usability Questionnaire Software
QUIS User Interaction Satisfaction
SUS System Usability Scale
SUMI Usability Measurement Inventory
UI User Interface
UP Usability Percentage
UTL Usability Testing Leader
XLS Excel Spreadsheet (Microsoft Excel Format)

Appendix A Tailored algorithm for AHP

def calculate_eigen(matrix):
    eigenvalues, eigenvectors = np.linalg.eig(matrix)
    max_eigenvalue = np.max(eigenvalues)
    max_eigenvector = eigenvectors[:, np.argmax(eigenvalues)]
    # Normalize the eigenvector to get the weights
    normalized_weights = max_eigenvector / np.sum(max_eigenvector)
    # Calculate the Consistency Index (CI)
    n = matrix.shape[0]
    CI = (max_eigenvalue - n) / (n - 1)
    # Random Consistency Index (RI), values depend on matrix size
    RI_dict = {1: 0, 2: 0, 3: 0.58, 4: 0.90, 5: 1.12, 6: 1.24, 7: 1.32,
               8: 1.41, 9: 1.45, 10: 1.49, 11: 1.52, 12: 1.54, 13: 1.56,
               14: 1.58, 15: 1.59, 16: 1.60, 17: 1.61,18: 1.62, 19: 1.63,
               20: 1.64, 21: 1.65, 22: 1.66, 23: 1.67, 24: 1.68, 25: 1.69,
               26: 1.70, 27: 1.71, 28: 1.72, 29: 1.73, 30: 1.74}
    RI = RI_dict.get(n, 1.49)  # 1.49 is an average fallback value
    # Calculate the Consistency Ratio (CR)
    CR = CI / RI
    consistency_interpretation =
    ("Consistent because CR is lower than 0.1") if CR <= 0.1 ...
    else "Inconsistent because CR is greater than CR"
    return max_eigenvalue, normalized_weights.real, ...
    CR, consistency_interpretation
def initialize_ahp_matrix(df, column_name):
    categories = df[column_name].tolist()
    n = len(categories)
    # Initialize a zero matrix of dimensions n x n
    ahp_matrix = np.zeros((n, n))
    # Create a labeled DataFrame to hold the AHP matrix
    ahp_df = pd.DataFrame(ahp_matrix, index=categories, columns=categories)
    return ahp_df
def generate_saaty_scale_with_explanations():
    return {
        ’Equal Importance’: 1,
        ’Moderate Importance’: 3,
        ’Strong Importance’: 5,
        ’Very Strong Importance’: 7,
        ’Extreme Importance’: 9,
        ’Moderately Less Important’: 1/3,
        ’Strongly Less Important’: 1/5,
        ’Very Strongly Less Important’: 1/7,
        ’Extremely Less Important’: 1/9
    }
def fill_ahp_matrix(ahp_df, row_name, col_names, comparison):
    saaty_scale = generate_saaty_scale_with_explanations()
    if comparison in saaty_scale:
        value = saaty_scale[comparison]
        for col_name in col_names:
            ahp_df.loc[row_name, col_name] = value
            ahp_df.loc[col_name, row_name] = 1 / value
    else:
        print("Invalid comparison description. ...
        Please select one from Saaty’s scale.")
    return ahp_df
def populate_ahp_matrix(ahp_df):
    saaty_scale_dict = {i+1: option for I, ...
    option in enumerate(generate_saaty_scale_with_explanations().keys())}
    for row in ahp_df.index:
        temp_saaty_scale_dict = saaty_scale_dict.copy()
        criteria_dict = {i+1: col for i, col in enumerate(ahp_df.columns) ...
        if col != row and ahp_df.loc[row, col] == 0}
        temp_criteria_dict = criteria_dict.copy()
        while temp_criteria_dict:
            print(f"\nSelect an option for comparisons involving {row} ...
            against remaining criteria:")
            # Show available Saaty’s scale options
            for num, option in temp_saaty_scale_dict.items():
                print(f"Saaty {num}. {option}")
            # Show remaining criteria mapped to numbers
            for num, criteria in temp_criteria_dict.items():
                print(f"Criteria {num}. {criteria}")
            saaty_selection = int(input("Enter the number of your Saaty ...
            scale selection: "))
            selected_comparison = temp_saaty_scale_dict[saaty_selection]
            print(f"Indicate all criteria from the list above that have ...
            ’{selected_comparison}’ when compared to {row}. ...
            Separate multiple criteria by comma.")
            relevant_cols_numbers = input().split(’,’)
            relevant_cols = [temp_criteria_dict[int(num.strip())] ...
            for num in relevant_cols_numbers]
            ahp_df = fill_ahp_matrix(ahp_df, row, relevant_cols, ...
            selected_comparison)
            # Pre-fill for transitive relations, i.e., if A = B and ...
            A = C, then B = C
            if selected_comparison == ’Equal Importance’:
                for i in range(len(relevant_cols)):
                    for j in range(i+1, len(relevant_cols)):
                        ahp_df.loc[relevant_cols[i], relevant_cols[j]] = 1
                        ahp_df.loc[relevant_cols[j], relevant_cols[i]] = 1
            # Update temp_criteria_dict to remove selected items
            temp_criteria_dict = {num: col for num, col in ...
            temp_criteria_dict.items() if col not in relevant_cols}
            # Update temp_saaty_scale_dict to exclude the selected comparison
            del temp_saaty_scale_dict[saaty_selection]
    # Set diagonal elements to 1
    np.fill_diagonal(ahp_df.values, 1)
    return ahp_df

References

  1. Vlachogianni, P.; Tselios, N. Perceived usability evaluation of educational technology using the System Usability Scale (SUS): A systematic review. Journal of Research on Technology in Education 2022, 54. [Google Scholar] [CrossRef]
  2. Giacomin, J. What is human centred design? Design Journal 2014, 17. [Google Scholar] [CrossRef]
  3. Holeman, I.; Kane, D. Human-centered design for global health equity. Information Technology for Development 2020, 26. [Google Scholar] [CrossRef] [PubMed]
  4. Peruzzini, M.; Carassai, S.; Pellicciari, M. The Benefits of Human-centred Design in Industrial Practices: Re-design of Workstations in Pipe Industry. Procedia Manufacturing 2017, 11. [Google Scholar] [CrossRef]
  5. Ng, J.; Arness, D.; Gronowski, A.; Qu, Z.; Lau, C.W.; Catchpoole, D.; Nguyen, Q.V. Exocentric and Egocentric Views for Biomedical Data Analytics in Virtual Environments—A Usability Study. Journal of Imaging 2024, 10. [Google Scholar] [CrossRef] [PubMed]
  6. Harrison, R.; Flood, D.; Duce, D. Usability of mobile applications: literature review and rationale for a new usability model. Journal of Interaction Science 2013, 1. [Google Scholar] [CrossRef]
  7. Sari, I.; Tj, H.W. ; ., F.; Wahyoedi, S.; Widjaja, B.T. The Effect of Usability, Information Quality, and Service Interaction on E-Loyalty Mediated by E-Satisfaction on Hallobumil Application Users. KnE Social Sciences. [CrossRef]
  8. Bevan, N. Measuring usability as quality of use. Software Quality Journal 1995, 4. [Google Scholar] [CrossRef]
  9. Tullis, T.; Albert, W. Measuring the User Experience, Second Edition: Collecting, Analyzing, and Presenting Usability Metrics, 2nd ed.; Morgan Kaufmann Publishers Inc.: San Francisco, CA, USA, 2013. [Google Scholar]
  10. Brooke, J. , SUS: A ’Quick and Dirty’ Usability Scale; CRC Press, 1996. [CrossRef]
  11. Chin, J.P.; Diehl, V.A.; Norman, K.L. Development of an instrument measuring user satisfaction of the human-computer interface. 1988, Vol. Part F130202. [CrossRef]
  12. Kirakowski, J.; Cierlik, B. Measuring the Usability of Web Sites. Proceedings of the Human Factors and Ergonomics Society Annual Meeting 1998, 42, 424–428. [Google Scholar] [CrossRef]
  13. Lewis, J.R. Psychometric evaluation of the post-study system usability questionnaire: the PSSUQ. 1992, Vol. 2. [CrossRef]
  14. Nielsen, J.; Molich, R. Heuristic evaluation of user interfaces. ACM Press, 1990, pp. 249–256. [CrossRef]
  15. Bangor, A.; Kortum, P.T.; Miller, J.T. An empirical evaluation of the system usability scale. International Journal of Human-Computer Interaction 2008, 24. [Google Scholar] [CrossRef]
  16. Păsărelu, C.R.; Kertesz, R.; Dobrean, A. The Development and Usability of a Mobile App for Parents of Children with ADHD. Children 2023, 10. [Google Scholar] [CrossRef]
  17. Weichbroth, P. Usability Testing of Mobile Applications: A Methodological Framework. Applied Sciences 2024, 14, 1792. [Google Scholar] [CrossRef]
  18. Rosenzweig, E. , Usability Inspection Methods; Elsevier, 2015; pp. 115–130. [CrossRef]
  19. Maqbool, B.; Herold, S. Potential effectiveness and efficiency issues in usability evaluation within digital health: A systematic literature review. Journal of Systems and Software 2024, 208, 111881. [Google Scholar] [CrossRef]
  20. Generosi, A.; Villafan, J.Y.; Giraldi, L.; Ceccacci, S.; Mengoni, M. A Test Management System to Support Remote Usability Assessment of Web Applications. Information 2022, 13, 505. [Google Scholar] [CrossRef]
  21. Veral, R.; Macías, J.A. Supporting user-perceived usability benchmarking through a developed quantitative metric. International Journal of Human Computer Studies 2019, 122. [Google Scholar] [CrossRef]
  22. Paz, F.; Pow-Sang, J.A. A systematic mapping review of usability evaluation methods for software development process. International Journal of Software Engineering and its Applications 2016, 10. [Google Scholar] [CrossRef]
  23. Shneiderman, B. Designing the user interface strategies for effective human-computer interaction. ACM SIGBIO Newsletter 1987, 9. [Google Scholar] [CrossRef]
  24. Norman, D. The Design of Everyday Things; Vahlen, 2016. [CrossRef]
  25. Tognazzini, B. First Principles, HCI Design, Human Computer Interaction (HCI), Principles of HCI Design, Usability Testing. http://www.asktog.com/basics/firstPrinciples.html, 2014. Online; accessed 2024-01-01.
  26. Shyr, W.J.; Wei, B.L.; Liang, Y.C. Evaluating Students’ Acceptance Intention of Augmented Reality in Automation Systems Using the Technology Acceptance Model. Sustainability 2024, 16. [Google Scholar] [CrossRef]
  27. Nielsen, J.; Molich, R. Heuristic evaluation of user interfaces. In Proceedings of the Proceedings of the SIGCHI conference on Human factors in computing systems, 1990, pp.; pp. 249–256.
  28. Scholtz, J. Beyond Usability: Evaluation Aspects of Visual Analytic Environments. IEEE, 10 2006, pp. 145–150. [CrossRef]
  29. Lewis, C.; Poison, P.; Wharton, C.; Rieman, J. Testing a walkthrough methodology for theory-based design of walk-up-and-use interfaces. 1990. [CrossRef]
  30. Thomas, C.; Bevan, N. Usability Context Analysis: A Practical Guide. Serco Usability Services 1996. [Google Scholar]
  31. Jaspers, M.W. A comparison of usability methods for testing interactive health technologies: Methodological aspects and empirical evidence. International Journal of Medical Informatics 2009, 78, 340–353. [Google Scholar] [CrossRef]
  32. Rubin, J.; Chisnell, D.; Spool, J. Handbook of Usability Testing: How to Plan, Design, and Conduct Effective Tests, 2 ed.; Wiley, 2008; p. 384. Foreword by Jared Spool.
  33. Law, E.L.C.; Hvannberg, E.T. Analysis of combinatorial user effect in international usability tests. ACM, 4 2004, pp. 9–16. [CrossRef]
  34. Molich, R.; Nielsen, J. Improving a Human-Computer Dialogue. Communications of the ACM 1990, 33. [Google Scholar] [CrossRef]
  35. Hartson, R.; Pyla, P.S. , Rapid Evaluation Methods; Elsevier, 2012; pp. 467–501. [CrossRef]
  36. Delice, E.K.; Güngör, Z. The usability analysis with heuristic evaluation and analytic hierarchy process. International Journal of Industrial Ergonomics 2009, 39. [Google Scholar] [CrossRef]
  37. Virzi, R.A.; Sorce, J.F.; Herbert, L.B. Comparison of three usability evaluation methods: Heuristic, think-aloud, and performance testing. 1993, Vol. 1. [CrossRef]
  38. Lazar, J.; Feng, J.H.; Hochheiser, H. , Usability testing; Elsevier, 2017; pp. 263–298. [CrossRef]
  39. Quiñones, D.; Rusu, C. How to develop usability heuristics: A systematic literature review. Computer Standards and Interfaces 2017, 53. [Google Scholar] [CrossRef]
  40. Jaferian, P.; Hawkey, K.; Sotirakopoulos, A.; Velez-Rojas, M.; Beznosov, K. Heuristics for evaluating IT security management tools. 2014, Vol. 29. [CrossRef]
  41. Lechner, B.; Fruhling, A.L.; Petter, S.; Siy, H.P. The Chicken and the Pig: User Involvement in Developing Usability Heuristics. In Proceedings of the AMCIS; 2013. [Google Scholar]
  42. Sim, G.; Read, J.C.; Cockton, G. Evidence based design of heuristics for computer assisted assessment. 2009, Vol. 5726 LNCS. [CrossRef]
  43. Ling, C.; Salvendy, G. Extension of heuristic evaluation method: a review and reappraisal. Ergonomia IJE & HF 2005, 27, 179–197. [Google Scholar]
  44. Paddison, C.; Englefield, P. Applying heuristics to accessibility inspections. Interacting with Computers 2004, 16, 507–521. [Google Scholar] [CrossRef]
  45. Inostroza, R.; Rusu, C.; Roncagliolo, S.; Rusu, V.; Collazos, C.A. Developing SMASH: A set of SMArtphone’s uSability Heuristics. Computer Standards and Interfaces 2016, 43. [Google Scholar] [CrossRef]
  46. Hermawati, S.; Lawson, G. Establishing usability heuristics for heuristics evaluation in a specific domain: Is there a consensus?, 2016. [CrossRef]
  47. Bailey, R.W.; Wolfson, C.A.; Nall, J.; Koyani, S. Performance-Based Usability Testing: Metrics That Have the Greatest Impact for Improving a System’s Usability. In Proceedings of the Human Centered Design. Springer; 2009; pp. 3–12. [Google Scholar] [CrossRef]
  48. Mitta, D.A. A Methodology for Quantifying Expert System Usability. Human Factors: The Journal of the Human Factors and Ergonomics Society 1991, 33, 233–245. [Google Scholar] [CrossRef]
  49. Benaida, M. Developing and extending usability heuristics evaluation for user interface design via AHP. Soft Computing 2023, 27. [Google Scholar] [CrossRef]
  50. Saaty, R.W. The analytic hierarchy process-what it is and how it is used. Mathematical Modelling 1987, 9. [Google Scholar] [CrossRef]
  51. Granollers, T. Usability Evaluation with Heuristics, Beyond Nielsen ’ s List. ThinkMind Digital Library, 3 2018, pp. 60–65.
  52. Sharp, H.; Preece, J.; Rogers, Y. Interaction Design: Beyond Human-Computer Interaction, 5 ed.; John Wilei & Sons Inc., 2019; p. 656.
  53. Bonastre, L.; Granollers, T. A set of heuristics for user experience evaluation in E-commerce websites. 2014.
  54. Paz, F.; Paz, F.A.; Sánchez, M.; Moquillaza, A.; Collantes, L. Quantifying the usability through a variant of the traditional heuristic evaluation process. 2018, Vol. 10918 LNCS. [CrossRef]
  55. Kemp, E.A.; Thompson, A.J.; Johnson, R.S. Interface evaluation for invisibility and ubiquity - An example from E-learning. 2008. [CrossRef]
  56. Pierotti, D. Heuristic evaluation-a system checklist. Xerox Corporation 1995, 12. [Google Scholar]
  57. Khowaja, K.; Al-Thani, D. New Checklist for the Heuristic Evaluation of mHealth Apps (HE4EH): Development and Usability Study. JMIR mHealth and uHealth 2020, 8, e20353. [Google Scholar] [CrossRef]
  58. Holey, R.H. Handbook of Structural Equation Modeling, 1 ed.; The Guilford Press, 2012; pp. 3–16.
  59. Brodsky, S.L.; Lichtenstein, B. The Gold Standard and the Pyrite Principle: Toward a Supplemental Frame of Reference. Frontiers in Psychology 2020, 11. [Google Scholar] [CrossRef]
  60. Williamson, K. , Questionnaires, individual interviews and focus group interviews; Elsevier, 2018; pp. 379–403. [CrossRef]
  61. Thiem, A.; Duşa, A. Qualitative Comparative Analysis with R; Vol. 5, Springer New York, 2013; p. 99. [CrossRef]
  62. Contreras-Pacheco, O.E.; Talero-Sarmiento, L.H.; Camacho-Pinto, J.C. Effects of Corporate Social Responsibility on Employee Organizational Identification: Authenticity or Fallacy. Contaduría y Administración 2019, 64, 1–22. [Google Scholar] [CrossRef]
  63. Leventhal, B.C.; Ames, A.J.; Thompson, K.N. , Simulation Studies for Psychometrics. In International Encyclopedia of Education: Fourth Edition; Elsevier, 2022. [CrossRef]
  64. Tanner, K. , Survey Designs. In Research Methods: Information, Systems, and Contexts: Second Edition; Elsevier, 2018. [CrossRef]
  65. Bubaš, G.; Čižmešija, A.; Kovačić, A. Development of an Assessment Scale for Measurement of Usability and User Experience Characteristics of Bing Chat Conversational AI. Future Internet 2024, 16. [Google Scholar] [CrossRef]
  66. van der Linden, W.J. Item Response Theory. In Encyclopedia of Social Measurement; Elsevier, 2004. [CrossRef]
  67. Gupta, K.; Roy, S.; Poonia, R.C.; Nayak, S.R.; Kumar, R.; Alzahrani, K.J.; Alnfiai, M.M.; Al-Wesabi, F.N. Evaluating the Usability of mHealth Applications on Type 2 Diabetes Mellitus Using Various MCDM Methods. Healthcare 2022, 10. [Google Scholar] [CrossRef]
  68. Muhammad, A.; Siddique, A.; Naveed, Q.N.; Khaliq, U.; Aseere, A.M.; Hasan, M.A.; Qureshi, M.R.N.; Shahzad, B. Evaluating Usability of Academic Websites through a Fuzzy Analytical Hierarchical Process. Sustainability 2021, 13. [Google Scholar] [CrossRef]
  69. Iryanti, E.; Santosa, P.I.; Kusumawardani, S.S.; Hidayah, I. Inverse Trigonometric Fuzzy Preference Programming to Generate Weights with Optimal Solutions Implemented on Evaluation Criteria in E-Learning. Computers 2024, 13. [Google Scholar] [CrossRef]
  70. Gulzar, K.; Tariq, O.; Mustafa, S.; Mohsin, S.M.; Kazmi, S.N.; Akber, S.M.A.; Abazeed, M.; Ali, M. A Fuzzy Analytic Hierarchy Process for Usability Requirements of Online Education Systems. IEEE Access 2023, 11, 146076–146089. [Google Scholar] [CrossRef]
  71. Sakulin, S.; Alfimtsev, A. Multicriteria Decision Making in Tourism Industry Based on Visualization of Aggregation Operators. Applied System Innovation 2023, 6. [Google Scholar] [CrossRef]
  72. Wu, Z.; Tu, J. Managing transitivity and consistency of preferences in AHP group decision making based on minimum modifications. Information Fusion 2021, 67, 125–135. [Google Scholar] [CrossRef]
  73. Omar, K.; Rapp, B.; Gómez, J.M. Heuristic evaluation checklist for mobile ERP user interfaces. In Proceedings of the 2016 7th International Conference on Information and Communication Systems (ICICS). IEEE; 2016; pp. 180–185. [Google Scholar]
  74. Aballay, L.; Lund, M.I.; Gonzalez Capdevila, M.; Granollers, T. Heurísticas de Usabilidad utilizando una Plataforma Abierta y Colaborativa Práctica Áulica Aplicada a Sitios e-commerce. In Proceedings of the V Congreso Internacional de Ciencias de la Computación y Sistemas de Información 2021 – CICCSI 2021, CICCSI, Mendoza - San Juan, Argentina, November 2021. [Google Scholar]
  75. Yáñez Gómez, R.; Cascado Caballero, D.; Sevillano, J.L.; et al. Heuristic evaluation on mobile interfaces: A new checklist. The scientific world journal 2014, 2014. [Google Scholar] [CrossRef]
  76. Lund, M.I. Heurísticas de Usabilidad utilizando una Plataforma Abierta y Colaborativa: Práctica Aulica Aplicada a Sitios e-commerce. In Proceedings of the CICCSI 2021, 2021. [Google Scholar]
  77. Komarkova, J.; Visek, O.; Novak, M. Heuristic evaluation of usability of GeoWeb sites. In Proceedings of the Web and Wireless Geographical Information Systems: 7th International Symposium, Cardiff, UK, November 28-29, 2007. Proceedings 7. Springer, 2007, W2GIS 2007; pp. 264–278. [Google Scholar]
  78. Almenara, A.P.; Humanes, J.; Granollers, T. MPIu+aX, User-Centered Design methodology that empathizes with the user and generates a better accessible experience. (From theory to practice). ACM, 9 2023, pp. 1–3. [CrossRef]
1
ISO/CD 9241-11: Ergonomics of human-system interaction - Part 11: Guidance on usability (1998). Available at: https://www.iso.org/standard/63500.html. Accessed date: 2024/04/25 15:41:28.
2
Remote User eXperience Artificial Intelligence LAB. https://github.com/ruxailab. Last access: 2024/04/25 15:41:28
Figure 1. Consistency ratio boxplot by number of pairwise comparisons
Preprints 104368 g001
Figure 2. Frequency of pairwise comparisons
Preprints 104368 g002
Figure 3. Frequency distribution of the number of pairwise comparisons with acceptable consistency
Preprints 104368 g003
Figure 4. Radar plot with the normalized average in each heuristic
Preprints 104368 g004
Figure 5. Paired Boxplot of usability percentages
Preprints 104368 g005
Figure 6. Barplot assorted for the major difference between Traditional and Modified weights. a) Difference between both methods, b) Standardized average score in each heuristic, and c) Standardized deviation standard
Preprints 104368 g006
Table 1. Equivalent weight in the Granollers approach
Heuristic
1 2 3 4 5 6 7 8 9 10 11 12 13 14 15
w i [ % ] 8.33 6.67 5.00 10.00 8.33 10.00 6.67 5.00 6.67 8.33 5.00 6.67 5.00 5.00 3.33
Table 2. Comparison matrix using the algorithm to enhance consistency
Heuristic
1 2 3 4 5 6 7 8 9 10 11 12 13 14 15
1 1.00 3.00 5.00 3.00 1.00 5.00 5.00 5.00 3.00 7.00 7.00 3.00 3.00 7.00 7.00
2 0.33 1.00 3.00 3.00 0.33 3.00 3.00 3.00 1.00 5.00 5.00 1.00 1.00 5.00 5.00
3 0.2 0.33 1.00 1.00 0.14 3.00 3.00 3.00 1.00 5.00 5.00 1.00 1.00 5.00 5.00
4 0.33 0.33 1.00 1.00 0.33 1.00 1.00 1.00 1.00 3.00 3.00 1.00 1.00 3.00 3.00
5 1.00 3.00 7.00 3.00 1.00 5.00 5.00 5.00 3.00 7.00 7.00 3.00 3.00 7.00 7.00
6 0.2 0.33 0.33 1.00 0.20 1.00 1.00 1.00 0.33 5.00 5.00 0.33 0.33 5.00 5.00
7 0.2 0.33 0.33 1.00 0.20 1.00 1.00 1.00 0.33 5.00 5.00 0.33 0.33 5.00 5.00
8 0.2 0.33 0.33 1.00 0.20 1.00 1.00 1.00 0.33 5.00 5.00 0.33 0.33 5.00 5.00
9 0.33 1.00 1.00 1.00 0.33 3.00 3.00 3.00 1.00 5.00 5.00 1.00 1.00 5.00 5.00
10 0.14 0.20 0.20 0.33 0.14 0.20 0.20 0.20 0.20 1.00 1.00 0.20 0.20 1.00 1.00
11 0.14 0.20 0.20 0.33 0.14 0.20 0.20 0.20 0.20 1.00 1.00 0.20 0.20 1.00 1.00
12 0.33 1.00 1.00 1.00 0.33 3.00 3.00 3.00 1.00 5.00 5.00 1.00 1.00 5.00 5.00
13 0.33 1.00 1.00 1.00 0.33 3.00 3.00 3.00 1.00 5.00 5.00 1.00 1.00 5.00 5.00
14 0.14 0.20 0.20 0.33 0.14 0.20 0.20 0.20 0.20 1.00 1.00 0.20 0.20 1.00 1.00
15 0.14 0.20 0.20 0.33 0.14 0.20 0.20 0.20 0.20 1.00 1.00 0.20 0.20 1.00 1.00
Table 3. Weight obtained by the UTL using the algorithm to enhance comparison consistency
Heuristic   i
1 2 3 4 5 6 7 8 9 10 11 12 13 14 15
w i [ % ] 18.06 9.26 6.99 5.06 18.96 4.21 4.21 4.21 7.74 1.45 1.45 7.75 7.75 1.45 1.45
Table 4. Evaluation results: Score by heuristic
Evaluator
Heuristic 1 2 3 4 5 6 7
H   1 5.0 5.0 4.0 4.5 4.0 5.0 4.0
H   2 3.0 2.0 4.0 4.0 3.5 4.0 2.0
H   3 3.0 2.0 3.0 2.0 2.0 1.0 1.5
H   4 5.0 4.0 5.0 5.5 3.5 4.0 3.5
H   5 5.0 4.0 4.0 5.0 5.0 5.0 4.0
H   6 5.0 3.0 3.0 6.0 3.0 5.0 3.0
H   7 3.0 3.0 0.0 0.0 2.0 2.0 4.0
H   8 2.0 2.0 2.0 0.0 2.0 2.0 1.0
H   9 4.0 3.0 4.0 3.0 4.0 4.0 1.0
H   10 0.0 0.0 0.0 0.0 0.5 0.0 0.0
H   11 2.0 0.0 0.0 1.0 1.0 0.0 0.0
H   12 4.0 3.0 2.5 4.0 4.0 2.0 2.0
H   13 2.0 2.5 2.0 3.0 3.0 3.0 2.0
H   14 0.0 0.0 0.0 2.0 1.0 0.0 2.0
H   15 1.0 1.0 0.0 0.0 1.0 0.0 0.0
Disclaimer/Publisher’s Note: The statements, opinions and data contained in all publications are solely those of the individual author(s) and contributor(s) and not of MDPI and/or the editor(s). MDPI and/or the editor(s) disclaim responsibility for any injury to people or property resulting from any ideas, methods, instructions or products referred to in the content.
Copyright: This open access article is published under a Creative Commons CC BY 4.0 license, which permit the free download, distribution, and reuse, provided that the author and preprint are cited in any reuse.
Prerpints.org logo

Preprints.org is a free preprint server supported by MDPI in Basel, Switzerland.

Subscribe

© 2024 MDPI (Basel, Switzerland) unless otherwise stated