
Submitted:
12 April 2024
Posted:
12 April 2024
You are already at the latest version
Abstract
Both grape pomace and whey are waste products from the food industry that are rich in valuable ingredients. The utilisation of these two by-products is becoming increasingly possible as consumer awareness of upcycling increases. The biological activities of grape pomace extract (GPE) are diverse and depend on its bioavailability, which is influenced by processes in the digestive system. In this work, goat whey protein (GW) was used as the primary coating to protect the phenolic compounds of GPE during the spray drying process. In addition, trehalose (T), sucrose (S), xylose (X) and maltodextrin (MD) were added to the goat whey proteins as co-coatings and protein stabilisers. All spray drying experiments resulted in microcapsules (MC) with high encapsulation efficiency (77.6—95.5%) and yield (91.5—99.0%) and almost 100% recovery of phenolic compounds during the release test. For o-coumaric acid, the GW-coated microcapsules (MC) showed a bioavailability index of up to 731.23%. A semi-crystalline structure and hydrophilicity are characteristics of the MC coated with 10% T, S, X or 5% MD. GW alone or in combination with T, S, MD or X has proven to be a promising carrier for polyphenols from grape pomace extract and ensures good bioavailability of these natural antioxidants.
Keywords:
grape pomace
; encapsulation
; spray drying
; goat whey protein
; trehalose
; sucrose
; xylose
; maltodextrin
; microcapsule characterization
; phenolic compounds
1. Introduction
Grapes are one of the most cultivated crops worldwide [1,2,3]. The majority of grapes planted are meant to be used for wine production [4]. Twenty to thirty percent of the grapes used to produce wine are classified as grape pomace, which includes leftover pulp, seeds, stems, and grape skins [2]. Owing to its high content of phenolic compounds, lipids, proteins, and dietary fibres a variety of biological activities, such as antioxidant [5], antiproliferative [6], anti-inflammatory [7], cardioprotective [8,9] and antimicrobial activity [10], grape pomace has been the subject of numerous studies. The great interest in researching the beneficial effects of phenolic compounds derived from grapes, i.e. contained in wine, was triggered by the discovery of the French paradox thirty years ago [11]. On the other hand, the realisation that only about 30% of these phenols from grapes pass into the wine, while the rest of the phenolic substances remain behind in the waste, has also brought grape pomace into the focus of scientific research. The growing awareness of the importance of upcycling and the great potential of utilising by-products rich in phenolic compounds for the production of fortified products is a major contributing factor. By isolating the phenolic substances from the original source, they are additionally exposed to the negative effects of oxygen, heat and light, which can compromise the positive effects on human health that can be achieved through their consumption. Therefore, the importance of encapsulation is also recognised as a technique that can be used to improve the shelf life and stability of various extracts rich in phenolic substances obtained from different natural sources. One of the most popular methods of encapsulating phenolic compounds is spray drying, which uses various coating materials to convert a liquid phenolic extract directly into a product in the form of microcapsules (MC) [12]. The main advantages of the spray drying process are simple scalability, flexibility, low processing costs, low water content in the product, ensuring the controlled release of trapped bioactive substances [13]. As proven in numerous studies, the characteristics of MC are influenced by spray drying conditions such as inlet air temperature, feed flow, air flow, the configuration of the drying chamber and cyclone itself, the diameter of the nozzle, but also the composition of the feed, more precisely the liquid feed concentration. The use of a carrier material enables better flowability, compressibility, and compatibility of the MC [14]. The most widely utilized coatings, either separately or in combination, for protecting phenolic compounds are gum arabic [15,16,17], maltodextrin [12,16,18,19,20], and whey proteins [20,21].
Whey is the yellow-green liquid fraction that remains after cheese and casein production. It was deemed useless, disposed of in nature without any prior treatment, and ignored for many years. Studies a few years ago unearthed the wealth concealed by this dairy industry by-product. Actually, the composition of whey includes a wide variety of proteins, the presence of which has been linked to a wide range of biological activities and, consequently, a wide range of beneficial effects on human health [22]. Whey protein can be used as a texture modifier, thickener, carrier/vehicle, gelling agent, surfactant, foaming agent and water binder, as well as effective encapsulation systems for active food and drug components, improving their solubility, transport, dispersibility and bioaccessibility [23]. Whey can therefore be used for the development of new products such as edible films, hydrogels, various coatings as well as micro- and nanoparticles.
What makes goat's milk preferable to cow's milk is its better digestibility, alkalinity, buffer capacity [24], better anti-inflammatory effect on the intestines [25], and reduced allergenic potential [26]. Goat's milk and whey are already showing a successful role as the coating material in the spray drying process for the protection of various bacteria [27,28]. What has been concluded so far is that the use of this coating creates smaller microparticles with a pronounced ability to retain the active component and that due to the absence of agglutinin in the resulting MC, agglomeration, and formation of lumps do not occur [28].
Disaccharide sugars are often used as protein stabilizers during the spray drying process of whey or whey protein, where their presence can prevent denaturation of the protein, preserving the original structure and functionality of the protein as much as possible. When sugar is added as a protective component, its presence causes spray-dried MC to become amorphous and spherical with wrinkled or folded surface [29]. According to reports by Cui et al. [30], trehalose and sucrose can use their hydrogen bonding connections to shield protein molecules from dehydration during the spray drying process. A similar protective effect against protein dehydration stress was also observed during freeze drying. When a protein solution is freeze-dried in the presence of sugar, amorphous sugar matrices are formed into which protein molecules can be embedded. It has been proposed that the interactions between protein and sugar molecules during dehydration and storage are prevented by the protein molecules' embedding in the amorphous sugar matrix [31]. The potential functional and health benefits of interactions between whey protein and polysaccharides, particularly the formation of food-grade soluble complexes, are captivating. Some of the potential applications of protein-polysaccharide complexes are fat mimesis, encapsulation, protection, and delivery of bioactive compounds during diges-tion and modification of colloidal structures in food [32].
To our knowledge, this is the first paper that investigates the properties of spray-dried grape pomace extract with the addition of goat whey protein (GW) as coating material and the addition of protein stabilizers, i.e. trehalose (T), sucrose (S), xylose (X) and maltodextrin (MD) as co-coating material. The aim of this study was to encapsulate the Cabernet Sauvignon grape pomace extract (GPE) using the spray drying technique and the mentioned coating materials. The additional objective was to investigate the influence of the coating materials on the structure and properties of the MC as well as the release and bioaccessibility index (BI) of phenolic compounds from the MC of grape pomace extract.
2. Materials and Methods
2.1. Chemicals and Reagents
The coatings used were 78.6% goat whey protein (GW) from Carrington Farms, (Closter, New Jersey, USA), D(+)-Sucrose 99+% (S) from Acros Organics, D(+)-Xylose (X) from AppliChem GmbH (Darmstadt, Germany), trehalose (T) from Hayashibara doo (Nagase group, Tokyo, Japan), and maltodextrin (dextrose equivalent 4-7) (MD) from Sigma Aldrich (Saint Louis, USA). Folin-Ciocalteu’s phenol reagent was purchased from CPAchem (Bogomilovo, Bulgaria), 96% ethanol (p.a.) from Lab Expert (Shenzhen, Guangdong, China). Glacial acetic acid (99.5%) and methanol HPLC grade were purchased from Macron Fine Chemicals (Gliwice, Poland). Sodium carbonate (anhydrous, p.a.) was purchased from T.T.T. (Sveta Nedjelja, Croatia). Standards for UHPLC analysis of phenolic compounds were obtained from Sigma Aldrich (Saint Louis, MO, USA), Extrasynthese (Genay, France), Acros Organics (Geel, Belgium), and Applihem (Darmstadt, Germany). Chemicals for simulated digestion (enzymes, bile extract) were obtained from Sigma Aldrich (Saint Louis, MO, USA). Salts for preparations of solutions and buffers were obtained from Acros Organics (Geel, Belgium), Gram Mol (Zagreb, Croatia), and Kemika (Zagreb, Croatia).
2.2. Grape Pomace
The winery Erdut (Erdut, Croatia, 2017 harvest) provided the grape pomace of Cabernet Sauvignon (Vitis vinifera L.) variety grape (GP) that was left over after vinification. The grape pomace was air-dried to a dry matter content greater than 90% and ground to a particle size of ≤ 1 mm using an ultracentrifugal mill (Retsch ZM 200, Haan, Germany) immediately before extraction.
2.3. Grape Pomace Extract Preparation
Phenolic compound extraction from GP was performed in a shaking water bath (Julabo SW-23, Seelbach, Germany) at 80 °C and 200 rpm for 2 h. The ratio of the prepared grape pomace sample and 50% aqueous ethanol solution was 1 g : 40 mL. After extraction, samples were centrifuged at 11,000 rcf for 10 min (Z 326 K, Hermle Labortechnik GmbH, Wehingen, Germany). The resulting liquid phenol-rich extract was evaporated in rotary evaporator (Büchi, R-210, Flawil, Germany) at 48 mbar and 50 °C to half of the initial volume in order to reduce the ethanol content in the extract due to the limitation of the spray drying device. The volume of ethanol removed was replaced by an equal volume of redistilled water and this extract (GPE) was used to prepare the encapsulation solution (spray drying feed).
2.4. Encapsulation by Spray Drying
After the preparation of GPE, a feed mixture for encapsulation was prepared by mixing of GPE and GW in the ratio (mass of dry matter of the extract) : (mass of dry matter of the coating) = 1 : 2.5 (w/w). When a carbohydrate co-coating (protein stabiliser) is added, part of the GW is replaced by the corresponding mass of the co-coating, which is between 2.5% and 30% depending on the stabiliser used (Table 1). Feed homogenization was carried out on a magnetic stirrer (SMHS-6, Witeg, Germany) at 50 °C and 600 rpm for 10 min. Spray drying was performed using a Büchi B-290 mini spray dryer (Flawil, Switzerland). The feed was spray-dried under the following conditions: inlet temperature 173 °C, feed flow 7 mL/min, nozzle diameter 15 µm.
2.5. Total Phenolic Content Determination
First, the sample was prepared according to the instructions of Tolun et al. [33]. In brief, 3 mL of a solution of ethanol : glacial acetic acid : water (50 : 8 : 42, v/v/v) was added to 15 mg of the MC, mixed on a vortex mixer and then filtered through a 0.45 μm PTFE filter. Total phenolic content (TPC) was determined using the Folin-Ciocalteu method described by Waterhouse, with modifications. Briefly, 3160 µL of distilled water was mixed with 40 µL of prepared sample and 200 µL of Folin–Ciocalteu reagent. After an 8 min incubation period, 600 µL of 20% (w/v) sodium carbonate was added, and the mixture was further incubated at 40 °C. After 30 min absorbance was measured at 765 nm against a blank containing distilled water instead of the sample. The results were expressed as mass of gallic acid equivalents per mass of MC dry matter (mgGAE/gdb).
2.6. Surface Phenolic Content Determination
For the determination of surface phenolic compounds (SPC), the sample was prepared according to Tolun et al. [33], as follows 3 mL of ethanol : methanol (1 : 1, v/v) solution was added to 24 mg of MC, and after 5 min the sample was filtered through a 0.45 μm PTFE filter. This was followed by the determination of the content of phenolic compounds according to the Folin-Ciocalteu method described in subsection 2.5. The results were expressed as mass of gallic acid equivalents per mass of MC dry matter (mgGAE/gdb).
2.7. Encapsulation Efficiency
The encapsulation efficiency (EE) was calculated according to Vu et al. [18] using Equation (1):
where CTPC is mass fraction of total phenolic content in MC (mgGAE/gdb) and CSPC is mass fraction of surface phenolic content in MC (mgGAE/gdb).
2.8. Moisture and Dry Matter Content
As per Kelly et al. [34], the moisture and dry matter content of the MC and coating materials were ascertained by employing the thermogravimetric method on a halogen moisture analyser (Mettler Toledo HR73, Columbus Ohio, USA). A sample of 0.15 g was weighed on an aluminium plate. The standard method of drying at 105 °C with switch-off criteria 5 (that is, until the mass loss was less than 1 mg for 140 seconds) was then applied. The moisture and dry matter values of the MC were calculated according to Equations (2) and (3).
where mA is mass of the sample after drying and mB is mass of the sample before drying.
2.9. Encapsulation Yield
Encapsulation yield (Y) was determined using Equation (4) in accordance with Vu et al. [18].
2.10. Bulk Density and Tapped Density
With some modifications, bulk density (BD) for microcapsules and coating materials was calculated using Boyano-Orozco et al. [35]. 1 g of the sample was put into a 25 mL beaker, and using the Equation (5), bulk density was determined as the mass of the MC divided by the volume of the MC read on the beaker.
Tapped density (TD) was determined using the AutoTap device (Anton Paar, Graz, Austria), according to Boyano-Orozco et al. [35] with modification. Using the Equation (6), the value for tapped density was determined as the ratio of MC mass to MC volume following 1250 taps of the MC beaker.
2.11. Hausner Ratio and Carr Index
The compressibility properties of the powder are expressed using the Hausner ratio (HR) and the Carr index (CI), which were calculated according to Kalušević et al. [16], with the application of Equations (7) and (8).
2.12. Particle Size Distribution
The particle size of the produced MC was measured by dynamic light scattering using a Malvern Mastersizer 2000 (Malvern Instrument, Malvern, UK), with water used as dispersing agent and the refractive index set to 1.62.
2.13. Determination of the Solubility of Microcapsules
MC solubility was determined according to Lee et al. [36] with minor modifications. Petri dishes were washed, then dried in a dryer (Memmert UFE 500, Schwabachu, Germany) at 105 °C for 1 h, and after cooling, they were weighed together with the lid. The 0.1 g MC was weighed into a previously weighed 50 mL Falcon test tube and 10 mL redistilled water was added. The contents of the test tube were mixed on a vortex mixer (DLAB SCIENTIFIC MX-S, Beijing, China) and the test tube was placed in a water bath (Witeg WSB-30, Wertheim am Main, Germany) at 60 °C for 30 min. At the end of the incubation, Falcon test tubes with samples were cooled in cold water and then centrifuged (Hermle Z 326 K, Gosheim, Germany) for 10 min at 11,000 rcf. The supernatant was decanted into a Petri dish, where it was dried for 3 hours at 105 °C in an electric dryer (Memmert UFE 500, Schwabachu, Germany). After drying, the Petri dishes with the samples were placed in a desiccator for cool for 1 h and then weighed to determine the mass of the dissolved MC. In addition, the Falkon test tube with sediment was weighed to determine the mass of remaining (swollen) sediment. Based on the obtained results, the values of water solubility index (WSI), water adsorption index (WAI) and swelling capacity (SP) were calculated according to the Equations (9), (10) and (11).
2.14. Contact Angle and Polarity
Wu's harmonic mean equation (2007) was utilized to calculate the contact angle (θ) of the MC pressed into a disk using an OCA 20 Optical Contact Angle Measuring System (Dataphysics, Filderstadt, Germany). A Specac hydraulic press (Specac Inc. Orpington, UK) was used for the pressing, and it had a pressing diameter of 13 mm and a pressing force of 1 t for 60 seconds. Using the sessile drop method, the contact angle between water and diiodomethane was measured in the system. This allowed for the determination of the interfacial tension between the polar (γPs) and dispersive (γds) components of polymers. According to Equation (12) MC surface free energy (γ*) was calculated as sum of these quantities.
In accordance with the ratio of polar surface energy to MC surface free energy, the polarity of the MC was determined according to Equation (13).
2.15. X-ray Powder Diffraction
An X-ray powder diffraction system (XPRD) (BRUKER D8 Advance diffractometer, Karlsruhe, Germany) was used to examine the crystalline structure of coatings and MC. The samples were exposed to Cu K~ radiation (~ = 1.5406 Å) and were scanned with a VÅNTEC-1 detector at 40 kV and 40 mA at intervals of 3–40 2~. DIFFRAC plus EVA software (Karlsruhe, Germany) was used for smoothing, K2-stripping, and background removal as part of the results evaluation process.
2.16. Differential Scanning Calorimetry
Using differential scanning calorimetry (DSC) (Mettler Toledo 821e DSC; Mettler Inc., Schwerzenbach, Switzerland), the thermal behaviour of MC and coating material samples was examined. About 3 – 5 mg of MC was accurately weighed into DSC sample pans, which were hermetically sealed and lid pierced. An empty pan was used as a reference in an inert atmosphere under constant argon purge of 150 ml/min. The samples were examined in the temperature interval of 25 – 300 °C at a heating rate of 10 °C/min.
2.17. Scanning Electron Microscopy
Scanning electron microscopy (SEM) (Hitachi S4700, Hitachi Scientific Ltd., Tokyo, Japan) was used to look into MC morphology. Using a sputter coater (Bio-Rad SC 502, VG Microtech, Uckfield, UK), MC were coated with a thin layer of gold-palladium film, which was then analysed at 10 kV using a SEM.
2.18. In Vitro Release of Phenolic Compounds
2.19. In Vitro Simulated Digestion and Bioaccessibility Index
In vitro simulated digestion of the prepared MC was performed according to the INFOGEST protocol [39] with modifications. Initially, stock solutions representing conditions in the mouth (SSF - Simulated Salivary Fluid), stomach (SGF - Simulated Gastric Fluid), and intestines (SIF - Simulated Intestinal Fluid) were prepared in accordance with Minekus et al. [40]. In vitro simulation of digestion was carried out in 5 test tubes, and each test tube represented a specific time interval (3, 63, 123, 183 and 243 min). 0.1 g of MC was weighed into each test tube. After the addition of simulated digestion solutions, the test tubes are placed on a vertical multipurpose rotator (PTR-60, Grant-bio Instruments, UK) placed in a thermostat (TC 135 S, Lovibond, Dortmund, Germany) preheated to 37 °C. After completion of certain phases, the test tube representing that phase is taken out of the rotator and centrifuged. The samples were centrifuged at 16,000g and 4 °C for 30 minutes immediately after the test tube was taken out of the rotator at the given time interval. After removing the supernatant, a 0.45 mm membrane filter (Syringe filters Spheros Nylon, Agilent Technologies, USA) was used. The following describes what is added at each stage of digestion:
Oral Phase (OP). 4 mL of SSF + 25 μL of CaCl2(H2O)2 and the pH was adjusted to 7 with 1 M HCl or 1 M NaOH (as appropriate). After that, redistilled water was added to a total volume of 10 ml.
Gastric Phase (GP). 8 ml of SGF solution + 5 μL of CaCl2(H2O)2. The pH was adjusted to 3, and then 500 μL of pepsin was added, which was dissolved in redistilled water and then added so that its activity in the final solution was 2000 U/mL. Redistilled water was added to a total volume of 20 ml.
Intestinal Phase (IP). 8.5 mL of SIF + 40 μL of CaCl2(H2O)2. The pH was adjusted to 7, then 5 ml of pancreatic solution (dissolved in the SIF solution so that its activity in the final volume was 100 U trypsin/mL) was added together with the 2.5 mL of bile extract solution (prepared in SIF so that the concentration of bile extract in the final solution was 1 mM). Redistilled water was added to a total volume of 40 mL.
Solid phase extraction was used to remove impurities from the filtrate, which included salts, bile extract and enzyme residues. This procedure was done before the chromatographic analysis. A modified procedure, as described by Martinović et al. [38], was used for sample purification.
The bioaccessibility index (BI) was calculated using the following Equation (14):
where: CA is concentration of individual phenolic compound after in vitro digestion; CB represents the concentration of individual phenolic compound before in vitro digestion.
2.20. Determination of Individual Phenolic Compounds
The study employed ultra-high performance liquid chromatography (UHPLC Nexera XR, Shimadzu, Japan) with a photodiode detector to analyse the individual phenolic compounds in CSE in both qualitative and quantitative ways. A reversed-phase Kinetex® C18 core-shell column (100 4.6 mm, 2.6 m, Phenomenex, Torrance, CA, USA) was used for the separation process. MC samples were prepared according to Tolun et al. [41] with minor modificatios, in such a way that 0.1 g of MC was dissolved in 1.5 ml of a water : methanol : HCl mixture (89 : 10 : 1 v/v/v) and then centrifuged (Z 326 K, Hermle Labortechnik GmbH, Wehingen, Germany) at 14 000 rcf for 3 min. Prior to UHPLC analysis, supernatants were filtered using 0.45 μm membranes (Chromafil Xtra PTFE, Macherey-Nagel GmbH & Co. KG, Dueren, Germany). Software LabSolutions 5.87 was used to process the data. By comparing the retention durations and UV-Vis spectra of the individual phenolic compounds with those of genuine standards that were examined under the same chromatographic conditions, the compounds were identified. The calibration curves created with the external standards were used for the quantification process. Individual phenolic compounds were determined by the UHPLC method described in Bucić-Kojić et al. [42].
2.21. Accelerated Stability Test
The accelerated stability tests of the MC, which proved their amorphous structure were carried out in Binder KBF 240 equipment (Binder GmbH, Tuttlingen, Germany), with a constant climate chamber. Within the temperature range of 10 to 70 °C and RH of 10 to 80%, temperature accuracy and reproducibility of results were guaranteed by the electronically controlled APT.lineTM in-line preheating chamber and cooling system. The stability test was conducted at 40 ± 2 °C and 75 ± 2% RH in accordance with the authors Cassol and Noreña [43]. Glass vials were used to store the samples for a period of three months. Sampling was done after 0 days, 2 weeks, 1 and 3 months.
2.22. Statistical Analysis
TIBCO Statistica software (TIBCO Software Inc., Palo Alto, CA, USA) was used to conduct a one-way analysis of variance (ANOVA) in order to determine the significance level of the difference between the arithmetic means of samples that represent populations. Following an ANOVA that revealed statistically significant differences between the observed populations, a post hoc test (i.e., Duncan's test for multiple ranges) was used to identify the populations between which a significant difference (p < 0.05) existed. In the figures or tables, samples that belonged to the same population were identified by the same alphabetic letter.
3. Results and Discussion
3.1. Encapsulation Efficiency and Encapsulation Yield
A total of 17 encapsulation sets were carried out using GW as the main coating and selected carbohydrate co-coatings (T, S, MD, X) in varying proportions according to the experimental design described in subsection 2.4. To determine the efficiency of used coatings, the content of total phenolic compounds (TPC) and surface phenolic compounds (SPC) was determined with the prepared MC as described in subsections 2.5. and 2.6., and the results are shown in Table 2.
The highest concentration of TPC (124.09 mgGAE/gdb) was found in the MC coated with GW (GW1), while in the other MC coated with GW and co-coating the concentration of TPC varied between 94.12 and 117.34 mgGAE/gdb. It can be observed that the increase in the amount of co-coating influences the decrease in the amount of TPC regardless of the type of co-coating. On the other hand, SPC values increased with the increase in the proportion of individual co-caoting and varied from 4.54 mgGAE/gdb (MD5) to 22.15 mgGAE/gdb (T30). In general, MD proved to be the co-coater that had the lowest concentration of non-encapsulated i.e. surface phenolic compounds and the MD-samples differed least in SPC content from the GW-sample. A statistically significant difference in the content of TPC and SPC was recorded both within a particular group of co-coatings and in general between MC.
The encapsulation efficiency (EE) of GPE with GW and GW in combination with four different co-coatings was evaluated based on the TPC and SPC values. The values for EE, moisture content of MC and encapsulation yield (Y) were determined according to subsections 2.7. – 2.9. and the results obtained are shown in Figure 1.
When GW was used as a coating material for GPE spray drying, the EE reached 95.47% (Figure 1a). In MCs encapsulated with a combination of GW and T coatings or MD, the amount of co-coating added had no effect on EE, whereas in the other two groups of MCs, the lowest EE was achieved with the application of 20% S and 15% X. In general, the inclusion of MD as a co-coating in conjunction with GW results in very high spray drying EE rates (91.1 – 92.5%).
As seen in Figure 1b, moisture content in the produced MC varied from 4.98% (GW1) to 5.98% (MD10) and visually no agglomerate formation was noticed. The reduction of the total proportion of GW and the addition of co-coating resulted in an increase in moisture in all MC samples. Low moisture content, in the amount of 3 – 4%, was also reported by the authors Navarro-Flores et al. [44] who attribute this to a high drying inlet temperature that contributed to a higher rate of heat transfer to the particle causing rapid water evaporation. A moisture level of less than 10% is thought to be adequate to ensure that the fruit powder produced by spray draying is microbiologically safe [45].
The Y can be seen as an indicator of the value of a product for manufacturers. In encapsulation processes, Y can be defined as the output of the physical and chemical properties of MC. With the help of the calculated Y values it is possible to compare different encapsulation processes [46]. According to Tontul and Topuz [47], any spray drying with Y greater than 50% can be characterized as successful. The Y for all encapsulations in this investigation was extremely high, higher than the 91.18% recorded for T5 (Figure 1c). We attribute the high Y to the use of GW protein as the main coating material, which improved the MC properties and minimised stickiness, ensuring a very high product yield (91.18 – 99.77 %) in all test series. Within the groups of MC, it was observed that with the addition of a higher concentration of co-coating, the Y also increased slightly. The samples with the addition of T had the lowest Y values on average.
3.2. Microcapsule Characteristics
Density (bulk density, BD and tap density, TD), flowability and cohesiveness are important properties of powders. The high BD of MC is favourable for lowering transportation and packaging costs [47]. Lower product BD are undesirable since they necessitate more container space. Furthermore, as the bulk density decreases, more air is trapped inside the MC and the product is more likely to oxidize, resulting in decreased storage stability [48]. The specified properties of MC in this paper were determined as stated in subsections 4.10 and 4.11, and the results are shown in Figure 2.
All experiments showed low density values (Figure 2a), which according to Braga et al. [49] may be a consequence of high inlet temperature. Within the groups of S, X and MD, the value of BD and TD decreases with increasing concentration of added co-coating. According to the classification of the European Pharmacopoeia [50] and the calculated values for CI (Figure 2b) and HR (Figure 2c), the flowability and cohesion of the MC for the samples GW1, T5, T10, MD10 and MD15 can be characterised as poor with CI between 26 – 31% and HR 1.35 – 1.45. Samples T20, S5, X10 and X30 have very poor flowability (CI = 32 – 37 %, HR = 1.46 – 1.59), and all other samples have very, very poor fluidity (CI > 38 %, HR > 1.60). The bad flowability of all produced MC can be attributed to the large proportion of whey proteins, which have a significant proportion of fat in their composition and are therefore poorly flowable. The size of the MC also has an effect on the flowability of the MC. As the particle size decreases, the specific surface area increases and this leads to reduced flowability. A larger contact area became available especially for cohesive forces and resisting flow frictional forces. In addition, the reduced flowability of the MC can also be caused by an increase in humidity, as this results in an increase in the effect of capillary forces between the MC particles [51]. Furthermore, according to Tontul and Topuz [47], the surface of the particles affects the bulk density of the MC, i.e. the smoother and more uniform the particles are, the higher the bulk density value.
Particle size, shape, and size distribution also play essential roles in MCed food processing, handling, and shelf life, with particle microstructure influencing various MC qualities such as stability and fluidity. The drying technique and parameters have a significant impact on particle size, shape and distribution [52]. Table 3 shows that the average particle size of the produced MC varied from 3.31 μm (S30) to 4.61 μm (MD2.5). However, within the MD group of MC, it was noticed that with an increase in the concentration of added MD from 2.5 to 10%, the particle size decreases. According to Medina-Torres et al. [53], a particle qualifies as fine if its average diameter is less than 5 μm. Accordingly, every coating material combination we have used produces a fine powder. After contrasting our findings with those of other authors, we came to the conclusion that our particles are more uniform and smaller than those of other spray-dried fruit whit carrier. The average particle size of acai MC ranged from 9.33 μm to 13.67 μm [54], while the particle size of ripe mango fruit MC was 88.879 μm [55], whereas the particle size of baobab fruit MC was 953 μm [56]. During the production of whey protein isolate particles with trehalose as a stabilizer, the particle size varied from 100 to 1000 nm [29]. Nonetheless, small particle size of our samples is consistent with the claims made by Verruck et al. [28] and Čujić-Nikolić et al. [57]. Table 3 shows that sample GW1 had the highest span value (2.20), which means that it was the least homogeneous sample, i.e. the one with the widest particle size distribution, indicating the uniformity of the sample. As a result, it also had the highest bulk density of 0.11 g/cm3. Sample X30 was the most homogenous sample, i.e. the sample with the smallest span value of 1.73. In general, the entire group of samples with X as co-coating had the lowest span values of 1.73 - 1.97.
Solubility parameters: WSI, WAI and SP are important indicators of the functional properties of the product and indicators in the application and storage of MC. WSI represents the ability of the MC to dissolve in water. The desirability of a higher WSI value depends on the final application of the MC product. If the MC is intended to be used in the food or pharmaceutical industry, a high WSI is especially important so that the MC are easily incorporated and evenly distributed within the final product. WAI values are related to the degree of gelatinization and microbial stability. The higher the WAI values, the greater the possibility of microbiological instability of the MCed product [58]. The solubility properties of MC determined in this study are listed in Table 4.
MC with X as co-coating showed the highest water solubility (WSI). Within that group, WSI values varied from 51.80 to 63.15%. In addition, the MC from the group show the highest WAI values (4.60–5.18) as well as highest SP values (10.75 ̶ 13.93). The small size and uniformity of the capsules certainly contribute to the good solubility of X-microcapsules. In contrast to X, the use of MD as a co-coating material resulted in MC with the lowest WSI and SP values. Within that group, the WSI ranged from 43.91 to 51.17% and SP ranged from 8.11 to 9.64. The reason for this may be cross-linking of MD with other compounds, which results in lower values of solubility and swelling ability compared to other samples. During encapsulation by spray drying the phenolic mango extract, a MC with lower WSI (8.62% to 24.28%) and WAI (2.58% to 3.91%) values were obtained [58]. Unlike them Sidlagatta et al. [59] reports a WSI value of 77.9 to 89.8% as well as WAI values of 6.7 to 12.3% for a spray-dried sweet orange MC.
Based on the value of the contact angle of water and diiodomethane, the polarity of the samples was calculated as described in subsection 2.14, which ranged from 36.46% (MD2.5) to 48.39% (S20), as shown in Table 4. It can be concluded that all the prepared MCs are hydrophilic, which indicates their good solubility in water. According to Chang et al. [60], many spray-dried plant extracts contain a considerable amount of hydrophilic substances in their composition, which makes them hygroscopic.
X-ray powder diffraction (XRPD) and differential scanning calorimetry (DSC) analyses were used to investigate the crystallinity and amorphousness of the MC samples. The XRPD patterns and the DSC thermograms of the MC samples are shown in Figure 3. As stated by numerous authors, spray drying produces mostly amorphous MC. The Figure 3a shows that the co-coating materials S (S0), T (T0) and X (X0) have a crystalline structure. Spray-dried MC containing 10% T (T10), S (S10), X (X10), 5% MD (MD5) and MC containing only GW (GW1) have a partially crystalline structure, while all other MC have an amorphous structure according to the XRPD results, as do the GW (GW0) and MD (MD0) coatings. Spray drying of fruit juices, according to Cano-Chauca et al. [65] results in MC with a high proportion of sugars present in an amorphous state due to the drying process used.
Because these sugars are exceedingly hygroscopic, they can crystallize by absorbing only a little amount of water. Because the ordered system of the crystalline structure promotes product stability, this type of structure in final products is constantly sought. By investigating the effects of various conditions on water-induced crystallization across different amorphous materials obtained by spray drying, authors Chiou and Langrish [61] came to similar conclusions. They verified that products require longer times to crystallize when their molecular weight and glass transition temperature are higher. Since grape pomace extract is also rich in numerous sugars, it is possible that water adsorption is precisely the reason for the partially crystalline structure of the mentioned samples. During the crystallinity test, in contrast to our research, the addition of sugar by authors Haque et al. [29] did not cause the appearance of peaks on the X-ray diffractograms, and thus the structures of these MC were characterized as amorphous. The use of cellulose or waxy starch in combination with MD caused a partially crystalline structure of the soy sauce MC [66].
The DSC thermograms (Figure 3b) of MC samples GW1, T10, S10, MD5 and X10 show endothermic peaks at a temperature of around 240 °C, which confirms the partially crystalline structure proven by XRPD analysis. It is also visible from the DSC curves of spray-dried MC samples slightly broad peaks, indicating water loss. Endothermic peaks are visible in the DSC curves of the samples of pure co-coatings with crystalline structure (T0, S0 and X0), indicating their melting points.
The scanning electron microscope (SEM) images of coatings and MC samples are shown in Figure 4 (GW and MC coated with GW) and Figure 5 (T, S, MD, X and MC coated with GW and co-coating in different ratios). It can be seen that the all MC particles have an approximately spherical shape, their surface is not smooth and the particles are not uniform in size and morphology. This is one of the explanations for the low density of our MCs and confirms the results of the size distribution parameters (Table 3).
It can be clearly seen (Figure 4 and Figure 5) that the coating particles (GW0, T0, S0, MD and X0) are larger than the MCs produced by spray drying. The MD0 particles are closer to the spherical form, while the rest coatings are irregular particles. Also very noticeable is the hollow structure of the GW itself, which is not visible in the spray-dried, GW-coated MC (Figure 4a).
In all the SEM micrographs shown in Figure 5, it is visible that the combination of GW coating with co-coatings creates a MC whose particles are of different irregularly shapes and sizes, some of them are in agglomerates. The size and surface appearance of each group of MC created by spray drying are observed to differ significantly from the coating and co-coating materials. The shriveling of the MC is explained as a consequence of fast water evaporation due to spray drying. In the work of Navarro-Flores et al. [31] stated that the rapid evaporation of water can result in the hardening of the capsule, which leads to retention of the original shape, or the evaporation of water and the formation of shriveled microcapsules.
According to Haque et al. [29], the wrinkles on the surface of whey protein MC are the result of the formation of a "skin", which is characteristic of all protein-rich substances. This property, combined with the rapid evaporation of water during spray drying, results in particles that exhibit protrusions. These deviations from the regular spherical shape of all MCs are the result of poor flow properties detected by CI and HR (Figure 2) and good solubility properties (Table 4) at the same time. According to Oliveira et al. [67], such protrusions can have a negative influence on the flow properties of the MC, but have no influence on the stability of the MC. It is also noted that the addition of sugar as a protein stabiliser of GW has an influence on the morphology of the particles, i.e. MC with the addition of T, S and X have smoother surfaces compared to GW1 MC. In the case of MC with the addition of X, the smooth pits are most pronounced. A hollow structure can also be seen in the image for the MD particles. In their study, the authors Wijiani et al. [68] report the same effect of the addition of S on the morphology of the particles. In this study, particles with added S have a smoother surface than particles without sucrose in their composition.
Based on the results of the above analyses, one representative with good properties (GW1, T10, S10, MD5 and X10) was selected from each MC group to perform in vitro release and in vitro digestion simulation experiments.
3.3. In Vitro Release of Phenolic Compounds from MC
The encapsulation technique allows the matrix to remain isolated from the external environment and offers stability in unfavourable circumstances until the compound needs to be released. Matrix release can be caused by a variety of factors, some of which include diffusion, degradation, solvents, pH, temperature, and pressure [69]. The release of phenolic compounds from spray-dried MC took place in the oral, gastric, and intestinal phases using solutions without enzymes that simulate conditions in a particular phase of the gastrointestinal tract. The use of the coating material enables the protection of phenolic compounds from adverse environmental conditions such as low pH values in the gastric phase and ensures safe transport and release in the intestinal phase [38]. Phenolic compounds are adsorbed in the intestinal phase, about 46% in the small intestine and 42% in the large intestine [70]. Adsorption of phenolic compounds in the intestinal phase enables the manifestation of their numerous biological activities, such as antioxidant, antimicrobial or antiproliferative activity [71].
The in vitro release of phenolic compounds test was performed according to the protocol described in subsection 2.18. and the results are shown in Figure 6 as cumulative release of TPC from MC.
The cumulative release rate in the oral phase ranged from 34.13% (MD5) to 40.03% (T10) of the total TPC released at the end of the test (Figure 6). Diffusion of phenolic compounds then continues in the gastric phase. During the release in the gastric phase due to the pH change to acidic, the colour of the electrolyte solution containing the MC changed to red pink, which is due to the presence of anthocyanins in the grape pomace extract. Cumulative release rate in the gastric phase ranged from 48.56% (GW1) to 100.84% (MD5). Within the last phase of simulated gastrointestinal digestion, the values of cumulative released TPC ranged from 76.10% (GW1) to 111.92% (S10). It is important to note that samples X10 and MD5 also had high values of released cumulative TPC in the amount of 110.42 and 110.75%. Our findings, which show a higher release of phenolic compounds during the intestinal phase of digestion as opposed to the gastric phase, are consistent with the results reported by Dag et al. [72], who evaluated the release of phenolic compounds from freeze-dried goldenberry juice MC. Recent studies on delivery system engineering show that protein-polysaccharide blend systems hold great promise for improving the release, retention, and protection of bioactive compounds [73]. As stated by Belščak-Cvitanović et al. [74], the hydrophilic character of the used polysaccharide and protein coatings as well as their water sorption properties cause high and rapid release of bioactive compounds in digestive fluids. The strong resistance of β-lactoglobulin to pepsin [75] is another factor in favour of this. When using these combinations of coating materials, the high value of TPC cumulative release could be attributed to all of the aforementioned factors. The values of TPC released from the MC in which T was used as a co-coating are lower compared to all other co-coatings and are closer to the values of TPC released from the MC in which only GW was used as a coating (GW1). A potential reason for reduced phenolic release may be that T is less soluble in simulated gastric and intestinal fluids than the rest of co-coating materials, which makes T-MC less effective in releasing phenolic compounds.
3.4. In Vitro Simulated Digestion
In vitro simulated digestion is an accepted approach for estimating target molecule bioaccessibility. It can provide further information regarding the metabolism of phenolic compounds, their availability for further absorption in the body, and their potential health benefits. Phenolic compounds must be liberated from the microparticle matrix during gastrointestinal digestion in order to become bioavailable. Therefore, in this study, the influence of different coatings on the bioaccessibility index (BI) of individual phenolic components from GPE was investigated using the in vitro simulated digestion test according to the protocol described in subsection 2.19 for 243 minutes, comprising 3 digestion phases: 3 minutes of the oral phase (OP), 120 minutes of the gastric phase (GP) and a further 120 minutes of the intestinal phase (IP). The content of individual phenolic substances was determined before and after a certain period of digestion and the results of the UHPLC analysis (according to subsection 2.20) are listed in Table 5.
Before digestion, a total of 21 individual phenolic components were quantified in the dissolved microcapsules (Table 4). After 243 minutes of simulated digestion in vitro, 10 of the previously quantified phenolic components were not detected in the digestate of any type of MC, namely: procyanidin B1, caffeic acid, chlogenic acid, syringic acid, p-coumaric acid, ellagic acid, rutin, resveratrol, kaempferol and guercetin. After digestion, the content of 5 phenolic compounds decreased: gallic acid, catechin, vanillic acid, procyanidin B2 and epicatechin, compared to the amount in MC before digestion, resulting in a BI < 55% (Figure 7a). It is possible that these compounds were hydrolysed by intestinal enzymes and therefore their content was reduced after digestion [76]. However, it is important to point out that gallic acid, 3,4-dihydrohibenzoic acid, catechin, vanillic acid and ferulic acid as well as epicatechin gallate were detected during the intestinal digestion phase, while they were not present in the oral or gastric digestion phase. High concentrations of individual compounds in the digestate after the intestinal digestion phase were found for: 3,4-dihydrohibenzoic acid, p-hydroxybenzoic acid, galocatechin gallate and o-coumaric acid, more specifically, their higher concentrations were quantified in the digestate than in the MC of the same type before digestion, resulting in a BI > 100% (Figure 7b).
3.5. Accelerated Stability of MC
Amorphous materials are thermodynamically in a non-equilibrium state, and therefore tend to convert to crystalline (thermodynamically stable) structure during storage. The rate of this transformation depends primarily on temperature and relative humidity (RH) [77]. When stored in a high RH environment, they absorb moisture and subsequently recrystallize [78].
To check the stability of the powders, samples of the pure protein coating (GW0) and samples of microcapsules whose X-ray powder diffractograms (Figure 3) indicated an amorphous structure (T5, T20, T30; S5, S20, S30; MD2.5, MD10, MD15; X5, X15 and X30) were subjected to the accelerated ageing test as described in subsection 2.21. The X-ray powder diffractograms of the samples after the accelerated ageing test over 2 weeks, 1 month and 3 months are shown in Figure 8 and Figure 9.
The amorphous structure and stability of the GW powder was maintained even after three months of accelerated aging (Figure 8).
After a two-week acceleration stability test (Figure 9a), only the structure of sample X30 (X302w) changed from an amorphous to a partially crystalline structure. All other samples remained amorphous. The MC samples with xylose co-coating, X5 and X15 (X51m and X151m), also changed their structure from amorphous to semi-crystalline after one month of accelerated ageing (Figure 9b). After three months, sample S30 (S303m) and two samples with MD addition (MD153m and MD103m) showed a change in structure from an amorphous to a semi-crystalline form. At the same time, samples S53m, S203m, T53m, T203m, T303m and MD2.53m proved their stability, as no structural changes were detected even after three months under the conditions of the accelerated stability test (Figure 9c).
In addition, SEM analyses of the MC samples were made after three months under the conditions of the accelerated stability test. For the majority of samples, no appreciable alterations in the microcapsule’s appearance were noticed (Figure 10). For sample X153m, there is an apparent cavity. We can infer that trehalose addition, even in the smallest amounts is necessary to stabilize the main coating material, because no change in the crystallographic structure of the particles were observed in the samples T53m, T203m, T303m. Furthermore, the same results were seen in samples (MD2.53m) that had the least amount of MD added.
4. Conclusions
Spray drying of grape pomace extract with GW and the addition of T, X, S or MD as a protein stabilizer produces MC of high Y (91.49 – 99.77%), with a small proportion of surface phenolic compounds (4.54 - 22.15 mgGAE/gdb). MC analysis revealed that they are hydrophilic MC with a mostly amorphous structure, which was determined by XRPD and DSC analysis. MC with the addition of 10% xylose, trehalose or sucrose and the MC with the addition of 5% MD have a partially crystalline structure that can be attributed to naturally occurring sugars in a sample of grape pomace extract and their water-induced crystallization. The average size of the particles varied from 3.31 to 4.61 μm, and the recorded span values were low, which suggests the uniformity of the particles. Bulk and tapped density are low compared to the results of other authors, and the flowability of the MC is characterized as poor or very, very poor. The high spray drying temperature can be the cause of the MC's low density, and the high proportion of protein coating material whose fluidity is compromised by the amount of fat in its composition is what causes its poor fluidity. Additionally, specific surface area has an impact on fluidity; the smaller the particle, the larger the contact area that becomes available, particularly for cohesive forces and frictional forces that resist flow. By conducting an in vitro release assay, the values of cumulative released TPC increased from phase to phase, reaching values as high as 111.92% in the intestinal phase. In comparison to MC containing MD, X, and S, MC containing T achieves lower values of cumulatively released TPC. Performing in vitro simulated digestion had a positive effect on the bioavailability of specific individual phenolic compounds. The bioavailability index for o-coumaric acid varied between 255.67% and 731.23% depending on the coating used. The use of T as a co-coating material gave MC with exceptional stability even after 3 months. Conversely, the final MC were less stable when X was used as a coating material in any of the tested concentrations.
The results of this research show that the use of GW as the main coating material resulted in highly successful encapsulation processes and high-quality MC with the capacity to maintain and enhance the bioaccessibility of phenolic compounds during in vitro simulated digestion. All of the above points to the possibility of using GW as a coating material through the spray drying process, with the end product finding application in the food, pharmaceutical, and nutraceutical industries.
Author Contributions
Conceptualization, M.P. and R.A.; formal analysis, G.P., J.M. and G.S; investigation, G.P., J.M. and G.S; re-sources, A.B-K, M.P and R.A.; data curation, G.P., M.P. and R.A.; writing—original draft preparation, G.P.; writing—review and editing, M.P. and A.B-K.; visualization, M.P.; supervision, R.A.; funding acquisition, A.B-K., R.A. All authors have read and agreed to the published version of the manuscript.
Funding
This research was funded by the CROATIAN SCIENCE FOUNDATION, grant number: IP-2018-01-1227 (“Development of a sustainable integrated process for the production of bioactive isolates from food industry residues”, POPI-WinCEco); BILATERAL PROJECT CROATIA–HUNGARY, grant number: HR-HUN_2020_011 and 2019-2.1.11-TÉT-2020-00146 (“Encapsulation of polyphenol-rich extracts from food industry residues and characterization of encapsulated particles”); and by the MINISTRY OF HUMAN CAPACITIES, HUNGARY, grant number: TKP2021-EGA-32.
Data Availability Statement
The data presented in this study are openly available in article.
Acknowledgments
Special thanks to Prof. PhD Mirela Kopjar from Faculty of Food Technology Osijek, for providing the trehalose sample.
Conflicts of Interest
The authors declare no conflicts of interest. The funders had no role in the design of the study; in the collection, analyses, or interpretation of data; in the writing of the manuscript; or in the decision to publish the results.
References
- Ilyas, T.; Chowdhary, P.; Chaurasia, D.; Gnansounou, E.; Pandey, A.; Chaturvedi, P. Sustainable Green Processing of Grape Pomace for the Production of Value-Added Products: An Overview. Environmental Technology & Innovation 2021, 23, 101592. [Google Scholar] [CrossRef]
- Antonić, B.; Jančíková, S.; Dordević, D.; Tremlová, B. Grape Pomace Valorization: A Systematic Review and Meta-Analysis. Foods 2020, 9, 1627. [Google Scholar] [CrossRef]
- Koutelidakis, A. Grape Pomace: A Challenging Renewable Resource of Bioactive Phenolic Compounds with Diversified Health Benefits. MOJFPT 2016, 3, 00065. [Google Scholar] [CrossRef]
- Beres, C.; Costa, G.N.S.; Cabezudo, I.; Da Silva-James, N.K.; Teles, A.S.C.; Cruz, A.P.G.; Mellinger-Silva, C.; Tonon, R.V.; Cabral, L.M.C.; Freitas, S.P. Towards Integral Utilization of Grape Pomace from Winemaking Process: A Review. Waste Management 2017, 68, 581–594. [Google Scholar] [CrossRef]
- Iora, S.R.F.; Maciel, G.M.; Zielinski, A.A.F.; Da Silva, M.V.; Pontes, P.V.D.A.; Haminiuk, C.W.I.; Granato, D. Evaluation of the Bioactive Compounds and the Antioxidant Capacity of Grape Pomace. Int J of Food Sci Tech 2015, 50, 62–69. [Google Scholar] [CrossRef]
- Mišković Špoljarić, K.; Šelo, G.; Pešut, E.; Martinović, J.; Planinić, M.; Tišma, M.; Bucić-Kojić, A. Antioxidant and Antiproliferative Potentials of Phenolic-Rich Extracts from Biotransformed Grape Pomace in Colorectal Cancer. BMC Complement Med Ther 2023, 23, 29. [Google Scholar] [CrossRef]
- Rodríguez-Morgado, B.; Candiracci, M.; Santa-María, C.; Revilla, E.; Gordillo, B.; Parrado, J.; Castaño, A. Obtaining from Grape Pomace an Enzymatic Extract with Anti-Inflammatory Properties. Plant Foods Hum Nutr 2015, 70, 42–49. [Google Scholar] [CrossRef]
- Zhu, F.; Du, B.; Zheng, L.; Li, J. Advance on the Bioactivity and Potential Applications of Dietary Fibre from Grape Pomace. Food Chemistry 2015, 186, 207–212. [Google Scholar] [CrossRef]
- Muñoz-Bernal, Ó.A.; Coria-Oliveros, A.J.; de la Rosa, L.A.; Rodrigo-García, J.; del Rocío Martínez-Ruiz, N.; Sayago-Ayerdi, S.G.; Alvarez-Parrilla, E. Cardioprotective Effect of Red Wine and Grape Pomace. Food Research International 2021, 140, 110069. [Google Scholar] [CrossRef]
- Luchian, C.E.; Cotea, V.V.; Vlase, L.; Toiu, A.M.; Colibaba, L.C.; Răschip, I.E.; Nadăş, G.; Gheldiu, A.M.; Tuchiluş, C.; Rotaru, L. Antioxidant and Antimicrobial Effects of Grape Pomace Extracts. BIO Web Conf. 2019, 15, 04006. [Google Scholar] [CrossRef]
- Fragopoulou, E.; Antonopoulou, S. The French Paradox Three Decades Later: Role of Inflammation and Thrombosis. Clinica Chimica Acta 2020, 510, 160–169. [Google Scholar] [CrossRef]
- Tsali, A.; Goula, A.M. Valorization of Grape Pomace: Encapsulation and Storage Stability of Its Phenolic Extract. Powder Technology 2018, 340, 194–207. [Google Scholar] [CrossRef]
- Bassani, A.; Carullo, D.; Rossi, F.; Fiorentini, C.; Garrido, G.D.; Reklaitis, G.V.R.; Bonadies, I.; Spigno, G. Modeling of a Spray-Drying Process for the Encapsulation of High-Added Value Extracts from Food by-Products. Computers & Chemical Engineering 2022, 161, 107772. [Google Scholar] [CrossRef]
- Banožić, M.; Vladić, J.; Banjari, I.; Velić, D.; Aladić, K.; Jokić, S. Spray Drying as a Method of Choice for Obtaining High Quality Products from Food Wastes– A Review. Food Reviews International 2021, 39, 1953–1985. [Google Scholar] [CrossRef]
- Kuck, L.S.; Noreña, C.P.Z. Microencapsulation of Grape (Vitis Labrusca Var. Bordo) Skin Phenolic Extract Using Gum Arabic, Polydextrose, and Partially Hydrolyzed Guar Gum as Encapsulating Agents. Food Chemistry 2016, 194, 569–576. [Google Scholar] [CrossRef]
- Kalušević, A.M.; Lević, S.M.; Čalija, B.R.; Milić, J.R.; Pavlović, V.B.; Bugarski, B.M.; Nedović, V.A. Effects of Different Carrier Materials on Physicochemical Properties of Microencapsulated Grape Skin Extract. J Food Sci Technol 2017, 54, 3411–3420. [Google Scholar] [CrossRef]
- Cujic Nikolic, N.; Stanisavljević, N.; Katarina, Š.; Kalušević, A.; Nedovic, V.; Samardzic, J.; Janković, T. Application of Gum Arabic in the Production of Spray-Dried Chokeberry Polyphenols, Microparticles Characterisation and in Vitro Digestion Method. Lekovite sirovine 2018, 38, 10–18. [Google Scholar]
- Vu, H.T.; Scarlett, C.J.; Vuong, Q.V. Encapsulation of Phenolic-Rich Extract from Banana (Musa Cavendish) Peel. J Food Sci Technol 2020, 57, 2089–2098. [Google Scholar] [CrossRef]
- Siacor, F.D.C.; Lim, K.J.A.; Cabajar, A.A.; Lobarbio, C.F.Y.; Lacks, D.J.; Taboada, E.B. Physicochemical Properties of Spray-Dried Mango Phenolic Compounds Extracts. Journal of Agriculture and Food Research 2020, 2, 100048. [Google Scholar] [CrossRef]
- Alonso-Moreno, C.; García-Yuste, S. Environmental Potential of the Use of CO2 from Alcoholic Fermentation Processes. The CO-AFP Strategy. Science of The Total Environment 2016, 568, 319–326. [Google Scholar] [CrossRef]
- Da Rocha, C.B.; Noreña, C.P.Z. Microencapsulation and Controlled Release of Bioactive Compounds from Grape Pomace. Drying Technology 2021, 39, 1018–1032. [Google Scholar] [CrossRef]
- Macwan, S.R.; Dabhi, B.K.; Parmar, S.C.; Aparnathi, K.D. Whey and Its Utilization. Int.J.Curr.Microbiol.App.Sci. 2016, 5, 134–155. [Google Scholar] [CrossRef]
- de Castro, R.J.S.; Domingues, M.A.F.; Ohara, A.; Okuro, P.K.; dos Santos, J.G.; Brexó, R.P.; Sato, H.H. Whey Protein as a Key Component in Food Systems: Physicochemical Properties, Production Technologies and Applications. Food Structure 2017, 14, 17–29. [Google Scholar] [CrossRef]
- El-Hatmi, H.E.-H. Comparison of Composition and Whey Protein Fractions of Human, Camel, Donkey, Goat and Cow Milk. Mljekarstvo 2015, 65, 159–167. [Google Scholar] [CrossRef]
- Araújo, D.F.S.; Guerra, G.C.B.; Pintado, M.M.E.; Sousa, Y.R.F.; Algieri, F.; Rodriguez-Nogales, A.; Araújo, R.F.; Gálvez, J.; Queiroga, R.D.C.R.E.; Rodriguez-Cabezas, M.E. Intestinal Anti-Inflammatory Effects of Goat Whey on DNBS-Induced Colitis in Mice. PLoS ONE 2017, 12, e0185382. [Google Scholar] [CrossRef]
- De Oliveira, A.H.; Mata, M.E.R.M.C.; Fortes, M.; Duarte, M.E.M.; Pasquali, M.; Lisboa, H.M. Influence of Spray Drying Conditions on the Properties of Whole Goat Milk. Drying Technology 2021, 39, 726–737. [Google Scholar] [CrossRef]
- Pradeep Prasanna, P.H.; Charalampopoulos, D. Encapsulation in an Alginate–Goats’ Milk–Inulin Matrix Improves Survival of Probiotic Bifidobacterium in Simulated Gastrointestinal Conditions and Goats’ Milk Yoghurt. Int J of Dairy Tech 2019, 72, 132–141. [Google Scholar] [CrossRef]
- Verruck, S.; De Liz, G.R.; Dias, C.O.; De Mello Castanho Amboni, R.D.; Prudencio, E.S. Effect of Full-Fat Goat’s Milk and Prebiotics Use on Bifidobacterium BB-12 Survival and on the Physical Properties of Spray-Dried Powders under Storage Conditions. Food Research International 2019, 119, 643–652. [Google Scholar] [CrossRef]
- Haque, M.A.; Chen, J.; Aldred, P.; Adhikari, B. Denaturation and Physical Characteristics of Spray-Dried Whey Protein Isolate Powders Produced in the Presence and Absence of Lactose, Trehalose, and Polysorbate-80. Drying Technology 2015, 33, 1243–1254. [Google Scholar] [CrossRef]
- Cui, L.; Kimmel, J.; Zhou, L.; Chen, B.; Rao, J. Improving the Functionality of Pea Protein Isolate through Co-Spray Drying with Emulsifying Salt or Disaccharide. Food Hydrocolloids 2021, 113, 106534. [Google Scholar] [CrossRef]
- Imamura, K.; Ogawa, T.; Sakiyama, T.; Nakanishi, K. Effects of Types of Sugar on the Stabilization of Protein in the Dried State. Journal of Pharmaceutical Sciences 2003, 92, 266–274. [Google Scholar] [CrossRef]
- Wagoner, T.; Vardhanabhuti, B.; Foegeding, E.A. Designing Whey Protein-Polysaccharide Particles for Colloidal Stability. Annu Rev Food Sci Technol 2016, 7, 93–116. [Google Scholar] [CrossRef]
- Tolun, A.; Altintas, Z.; Artik, N. Microencapsulation of Grape Polyphenols Using Maltodextrin and Gum Arabic as Two Alternative Coating Materials: Development and Characterization. Journal of Biotechnology 2016, 239, 23–33. [Google Scholar] [CrossRef]
- Kelly, G.M.; O’Mahony, J.A.; Kelly, A.L.; O’Callaghan, D.J. Effect of Hydrolyzed Whey Protein on Surface Morphology, Water Sorption, and Glass Transition Temperature of a Model Infant Formula. Journal of Dairy Science 2016, 99, 6961–6972. [Google Scholar] [CrossRef]
- Boyano-Orozco, L.; Gallardo-Velázquez, T.; Meza-Márquez, O.G.; Osorio-Revilla, G. Microencapsulation of Rambutan Peel Extract by Spray Drying. Foods 2020, 9, 899. [Google Scholar] [CrossRef]
- Lee, C.-W.; Oh, H.-J.; Han, S.-H.; Lim, S. Effects of Hot Air and Freeze Drying Methods on Physicochemical Properties of Citrus “Hallabong” Powders. Food Science and Biotechnology 2012, 21, 1633–1639. [Google Scholar] [CrossRef]
- Minekus, M.; Alminger, M.; Alvito, P.; Ballance, S.; Bohn, T.; Bourlieu, C.; Carrière, F.; Boutrou, R.; Corredig, M.; Dupont, D.; et al. A Standardised Static in Vitro Digestion Method Suitable for Food—An International Consensus. Food Funct. 2014, 5, 1113–1124. [Google Scholar] [CrossRef]
- Martinović, J.; Lukinac, J.; Jukić, M.; Ambrus, R.; Planinić, M.; Šelo, G.; Klarić, A.-M.; Perković, G.; Bucić-Kojić, A. Physicochemical Characterization and Evaluation of Gastrointestinal In Vitro Behavior of Alginate-Based Microbeads with Encapsulated Grape Pomace Extracts. Pharmaceutics 2023, 15, 980. [Google Scholar] [CrossRef]
- Brodkorb, A.; Egger, L.; Alminger, M.; Alvito, P.; Assunção, R.; Ballance, S.; Bohn, T.; Bourlieu-Lacanal, C.; Boutrou, R.; Carrière, F.; et al. INFOGEST Static in Vitro Simulation of Gastrointestinal Food Digestion. Nat Protoc 2019, 14, 991–1014. [Google Scholar] [CrossRef]
- Minekus, M.; Alminger, M.; Alvito, P.; Ballance, S.; Bohn, T.; Bourlieu, C.; Carrière, F.; Boutrou, R.; Corredig, M.; Dupont, D.; et al. A Standardised Static in Vitro Digestion Method Suitable for Food – an International Consensus. Food Funct. 2014, 5, 1113–1124. [Google Scholar] [CrossRef]
- Tolun, A.; Altintas, Z.; Artik, N. Microencapsulation of Grape Polyphenols Using Maltodextrin and Gum Arabic as Two Alternative Coating Materials: Development and Characterization. Journal of Biotechnology 2016, 239, 23–33. [Google Scholar] [CrossRef]
- Bucić-Kojić, A.; Šelo, G.; Zelić, B.; Planinić, M.; Tišma, M. Recovery of Phenolic Acid and Enzyme Production from Corn Silage Biologically Treated by Trametes Versicolor. Appl. Biochem. Biotechnol. 2017, 181, 948–960. [Google Scholar] [CrossRef]
- Cassol, L.; Noreña, C.P.Z. Microencapsulation and Accelerated Stability Testing of Bioactive Compounds of Hibiscus Sabdariffa. Food Measure 2021, 15, 1599–1610. [Google Scholar] [CrossRef]
- Navarro-Flores, M.J.; Ventura-Canseco, L.M.C.; Meza-Gordillo, R.; Ayora-Talavera, T.d.R.; Abud-Archila, M. Spray Drying Encapsulation of a Native Plant Extract Rich in Phenolic Compounds with Combinations of Maltodextrin and Non-Conventional Wall Materials. J Food Sci Technol 2020, 57, 4111–4122. [Google Scholar] [CrossRef]
- Wong, C.W.; Lim, W.T. Storage Stability of Spray-Dried Papaya (Carica Papaya L.) Powder Packaged in Aluminium Laminated Polyethylene (ALP) and Polyethylene Terephthalate (PET). International Food Research Journal 2016, 23, 1887–1894. [Google Scholar]
- Baysan, U.; Zungur Bastıoğlu, A.; Coşkun, N.Ö.; Konuk Takma, D.; Ülkeryıldız Balçık, E.; Sahin-Nadeem, H.; Koç, M. The Effect of Coating Material Combination and Encapsulation Method on Propolis Powder Properties. Powder Technology 2021, 384, 332–341. [Google Scholar] [CrossRef]
- Tontul, I.; Topuz, A. Spray-Drying of Fruit and Vegetable Juices: Effect of Drying Conditions on the Product Yield and Physical Properties. Trends in Food Science & Technology 2017, 63, 91–102. [Google Scholar] [CrossRef]
- Kurozawa, L.; Morassi, A.; Vanzo, A.; Park, K.; Hubinger, M. Influence of Spray Drying Conditions on Physicochemical Properties of Chicken Meat Powder. Drying Technology 2009, 27, 1248–1257. [Google Scholar] [CrossRef]
- Braga, M.B.; Rocha, S.C.D.S.; Hubinger, M.D. Spray-Drying of Milk–Blackberry Pulp Mixture: Effect of Carrier Agent on the Physical Properties of Powder, Water Sorption, and Glass Transition Temperature. Journal of Food Science 2018, 83, 1650–1659. [Google Scholar] [CrossRef]
- European Pharmacopoeia, 7th ed.; European treaty series; Council Of Europe : European Directorate for the Quality of Medicines and Healthcare: Strasbourg, 2010; ISBN 978-92-871-6700-2.
- Kim, E.H.-J.; Chen, X.D.; Pearce, D. Effect of Surface Composition on the Flowability of Industrial Spray-Dried Dairy Powders. Colloids and Surfaces B: Biointerfaces 2005, 46, 182–187. [Google Scholar] [CrossRef]
- Aziz, M.G.; Yusof, Y.A.; Blanchard, C.; Saifullah, M.; Farahnaky, A.; Scheiling, G. Material Properties and Tableting of Fruit Powders. Food Eng Rev 2018, 10, 66–80. [Google Scholar] [CrossRef]
- Medina-Torres, L.; García-Cruz, E.E.; Calderas, F.; González Laredo, R.F.; Sánchez-Olivares, G.; Gallegos-Infante, J.A.; Rocha-Guzmán, N.E.; Rodríguez-Ramírez, J. Microencapsulation by Spray Drying of Gallic Acid with Nopal Mucilage (Opuntia Ficus Indica). LWT - Food Science and Technology 2013, 50, 642–650. [Google Scholar] [CrossRef]
- Tonon, R.V.; Brabet, C.; Pallet, D.; Brat, P.; Hubinger, M.D. Physicochemical and Morphological Characterisation of Açai (Euterpe Oleraceae Mart.) Powder Produced with Different Carrier Agents. International Journal of Food Science & Technology 2009, 44, 1950–1958. [Google Scholar] [CrossRef]
- Ong, M.Y.; Yusof, Y.A.; Aziz, M.G.; Chin, N.L.; Amin, N.A.M. Characterisation of Fast Dispersible Fruit Tablets Made from Green and Ripe Mango Fruit Powders. Journal of Food Engineering 2014, 125, 17–23. [Google Scholar] [CrossRef]
- Adekunle, A.; Shittu, T.; Abioye, A.O.; Adeyanju, J.; Osanaiye, F.G. Physical and Thermal Properties of Baobab Fruit Pulp Powder; 2013.
- Ćujić-Nikolić, N.; Stanisavljević, N.; Šavikin, K.; Kalušević, A.; Nedović, V.; Samardžić, J.; Janković, T. Chokeberry Polyphenols Preservation Using Spray Drying: Effect of Encapsulation Using Maltodextrin and Skimmed Milk on Their Recovery Following in Vitro Digestion. Journal of Microencapsulation 2019, 36, 693–703. [Google Scholar] [CrossRef]
- Siacor, F.D.C.; Lim, K.J.A.; Cabajar, A.A.; Lobarbio, C.F.Y.; Lacks, D.J.; Taboada, E.B. Physicochemical Properties of Spray-Dried Mango Phenolic Compounds Extracts. Journal of Agriculture and Food Research 2020, 2, 100048. [Google Scholar] [CrossRef]
- Sidlagatta, V.; Chilukuri, S.V.V.; Devana, B.R.; Dasi, S.D.; Rangaswamy, L. Effect of Maltodextrin Concentration and Inlet Air Temperature on Properties of Spray Dried Powder from Reverse Osmosis Concentrated Sweet Orange Juice. Braz. arch. biol. technol. 2020, 63, e20190538. [Google Scholar] [CrossRef]
- Chang, Y.-X.; Yang, J.-J.; Pan, R.-L.; Chang, Q.; Liao, Y.-H. Anti-Hygroscopic Effect of Leucine on Spray-Dried Herbal Extract Powders. Powder Technology 2014, 266, 388–395. [Google Scholar] [CrossRef]
- Chiou, D.; Langrish, T.A.G. Crystallization of Amorphous Components in Spray-Dried Powders. Drying Technology 2007, 25, 1427–1435. [Google Scholar] [CrossRef]
- Niazi, M.B.K.; Broekhuis, A.A. Production of Amorphous Starch Powders by Solution Spray Drying. J of Applied Polymer Sci 2012, 126, E143–E153. [Google Scholar] [CrossRef]
- Nežić, I.; Sander, A.; Meštrović, E.; Čavužić, D. Production of Stable Amorphous Form by Means of Spray Drying. Particulate Science and Technology 2019, 37, 632–642. [Google Scholar] [CrossRef]
- Li, R.; Lin, D.; Roos, Y.H.; Miao, S. Glass Transition, Structural Relaxation and Stability of Spray-Dried Amorphous Food Solids: A Review. Drying Technology 2019, 37, 287–300. [Google Scholar] [CrossRef]
- Cano-Chauca, M.; Stringheta, P.C.; Ramos, A.M.; Cal-Vidal, J. Effect of the Carriers on the Microstructure of Mango Powder Obtained by Spray Drying and Its Functional Characterization. Innovative Food Science & Emerging Technologies 2005, 6, 420–428. [Google Scholar] [CrossRef]
- Wang, W.; Zhou, W. Characterisation of Spray Dried Soy Sauce Powders Made by Adding Crystalline Carbohydrates to Drying Carrier. Food Chemistry 2015, 168, 417–422. [Google Scholar] [CrossRef]
- Oliveira, B.E.; Junior, P.C.G.; Cilli, L.P.; Contini, L.R.F.; Venturini, A.C.; Yoshida, C.M.P.; Braga, M.B. Spray-Drying of Grape Skin-Whey Protein Concentrate Mixture. J Food Sci Technol 2018, 55, 3693–3702. [Google Scholar] [CrossRef]
- Wijiani, N.; Isadiartuti, D.; Rijal, M.A.S.; Yusuf, H. Characterization and Dissolution Study of Micellar Curcumin-Spray Dried Powder for Oral Delivery. IJN 2020, 15, 1787–1796. [Google Scholar] [CrossRef]
- da Rosa, C.G.; Borges, C.D.; Zambiazi, R.C.; Rutz, J.K.; da Luz, S.R.; Krumreich, F.D.; Benvenutti, E.V.; Nunes, M.R. Encapsulation of the Phenolic Compounds of the Blackberry (Rubus Fruticosus). LWT - Food Science and Technology 2014, 58, 527–533. [Google Scholar] [CrossRef]
- Tarko, T.; Duda-Chodak, A.; Zajac, N. Digestion and Absorption of Phenolic Compounds Assessed by in Vitro Simulation Methods. A Review. Roczniki Państwowego Zakładu Higieny 2013, 64. [Google Scholar]
- R. Albuquerque, B.; A. Heleno, S.; P. Oliveira, M.B.P.; Barros, L.; R. Ferreira, I.C.F. Phenolic Compounds: Current Industrial Applications, Limitations and Future Challenges. Food & Function 2021, 12, 14–29. [Google Scholar] [CrossRef]
- Dag, D.; Kilercioglu, M.; Oztop, M.H. Physical and Chemical Characteristics of Encapsulated Goldenberry (Physalis Peruviana L.) Juice Powder. LWT - Food Science and Technology 2017, 83, 86–94. [Google Scholar] [CrossRef]
- Hosseini, S.M.H.; Emam-Djomeh, Z.; Sabatino, P.; Van Der Meeren, P. Nanocomplexes Arising from Protein-Polysaccharide Electrostatic Interaction as a Promising Carrier for Nutraceutical Compounds. Food Hydrocolloids 2015, 50, 16–26. [Google Scholar] [CrossRef]
- Belščak-Cvitanović, A.; Lević, S.; Kalušević, A.; Špoljarić, I.; Đorđević, V.; Komes, D.; Mršić, G.; Nedović, V. Efficiency Assessment of Natural Biopolymers as Encapsulants of Green Tea (Camellia Sinensis L.) Bioactive Compounds by Spray Drying. Food Bioprocess Technol 2015, 8, 2444–2460. [Google Scholar] [CrossRef]
- Liao, M.; Ma, L.; Miao, S.; Hu, X.; Liao, X.; Chen, F.; Ji, J. The In-Vitro Digestion Behaviors of Milk Proteins Acting as Wall Materials in Spray-Dried Microparticles: Effects on the Release of Loaded Blueberry Anthocyanins. Food Hydrocolloids 2021, 115, 106620. [Google Scholar] [CrossRef]
- Xie, X.; Chen, C.; Fu, X. Study on the Bioaccessibility of Phenolic Compounds and Bioactivities of Passion Fruit Juices from Different Regions in Vitro Digestion. J Food Process Preserv 2021, 45, e15056. [Google Scholar] [CrossRef]
- Cujic Nikolic, N.; Stanisavljević, N.; Katarina, Š.; Kalušević, A.; Nedovic, V.; Samardzic, J.; Janković, T. Application of Gum Arabic in the Production of Spray-Dried Chokeberry Polyphenols, Microparticles Characterisation and in Vitro Digestion Method. Lekovite sirovine, 2018; 38, 10–18. [Google Scholar]
- Shetty, N.; Cipolla, D.; Park, H.; Zhou, Q.T. Physical Stability of Dry Powder Inhaler Formulations. Expert Opin Drug Deliv 2020, 17, 77–96. [Google Scholar] [CrossRef]
Figure 1.
(a) Encapsulation efficiency (EE, %), (b) moisture content (%) and (c) encapsulation yield (Y, %) of microcapsules (MC) prepared by spray draying with various coatings (Coatings: GW – goat whey protein, T – trehalose, S – sucrose, X – xylose, MD – maltodextrin (DE 4-7); The proportion of a single (co-)coating in relation to the total mass of the coating: 1 - 100%; 2.5 - 2.5%; 5 - 5%; 10 – 10%; 15 – 15%; 20 – 20%; 30 – 30 %).
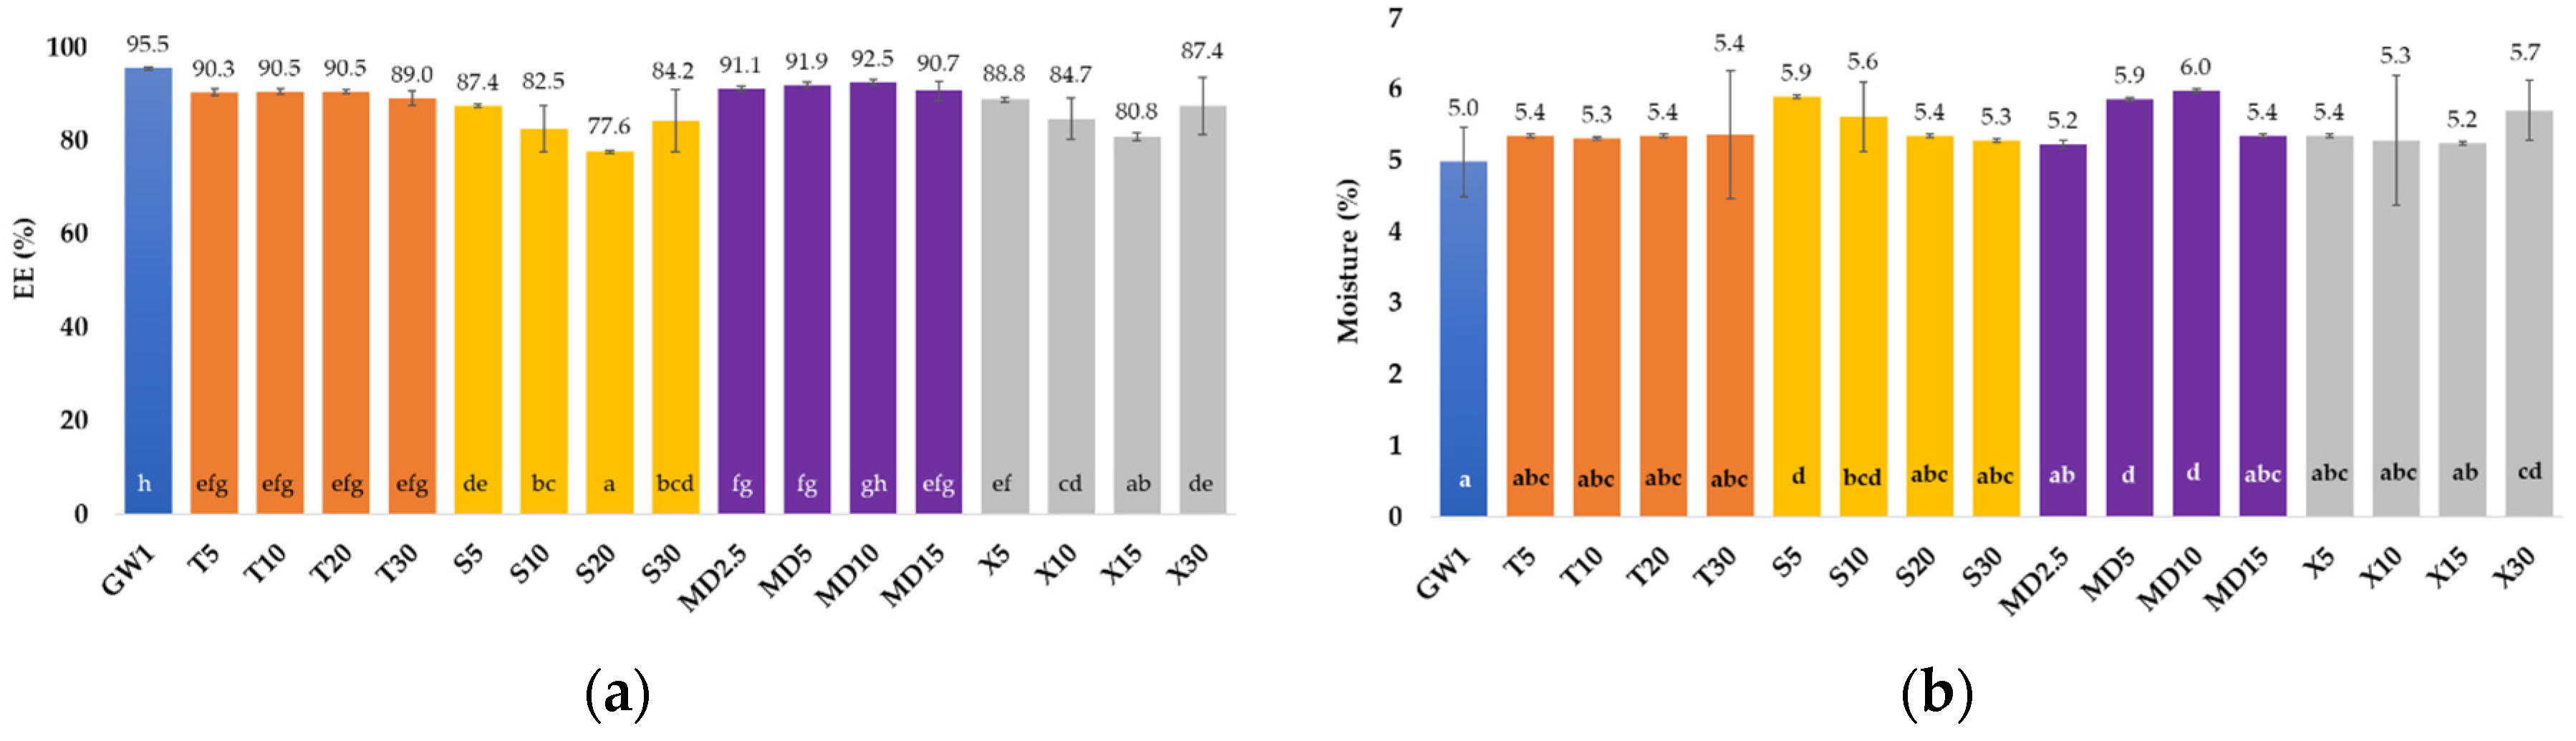
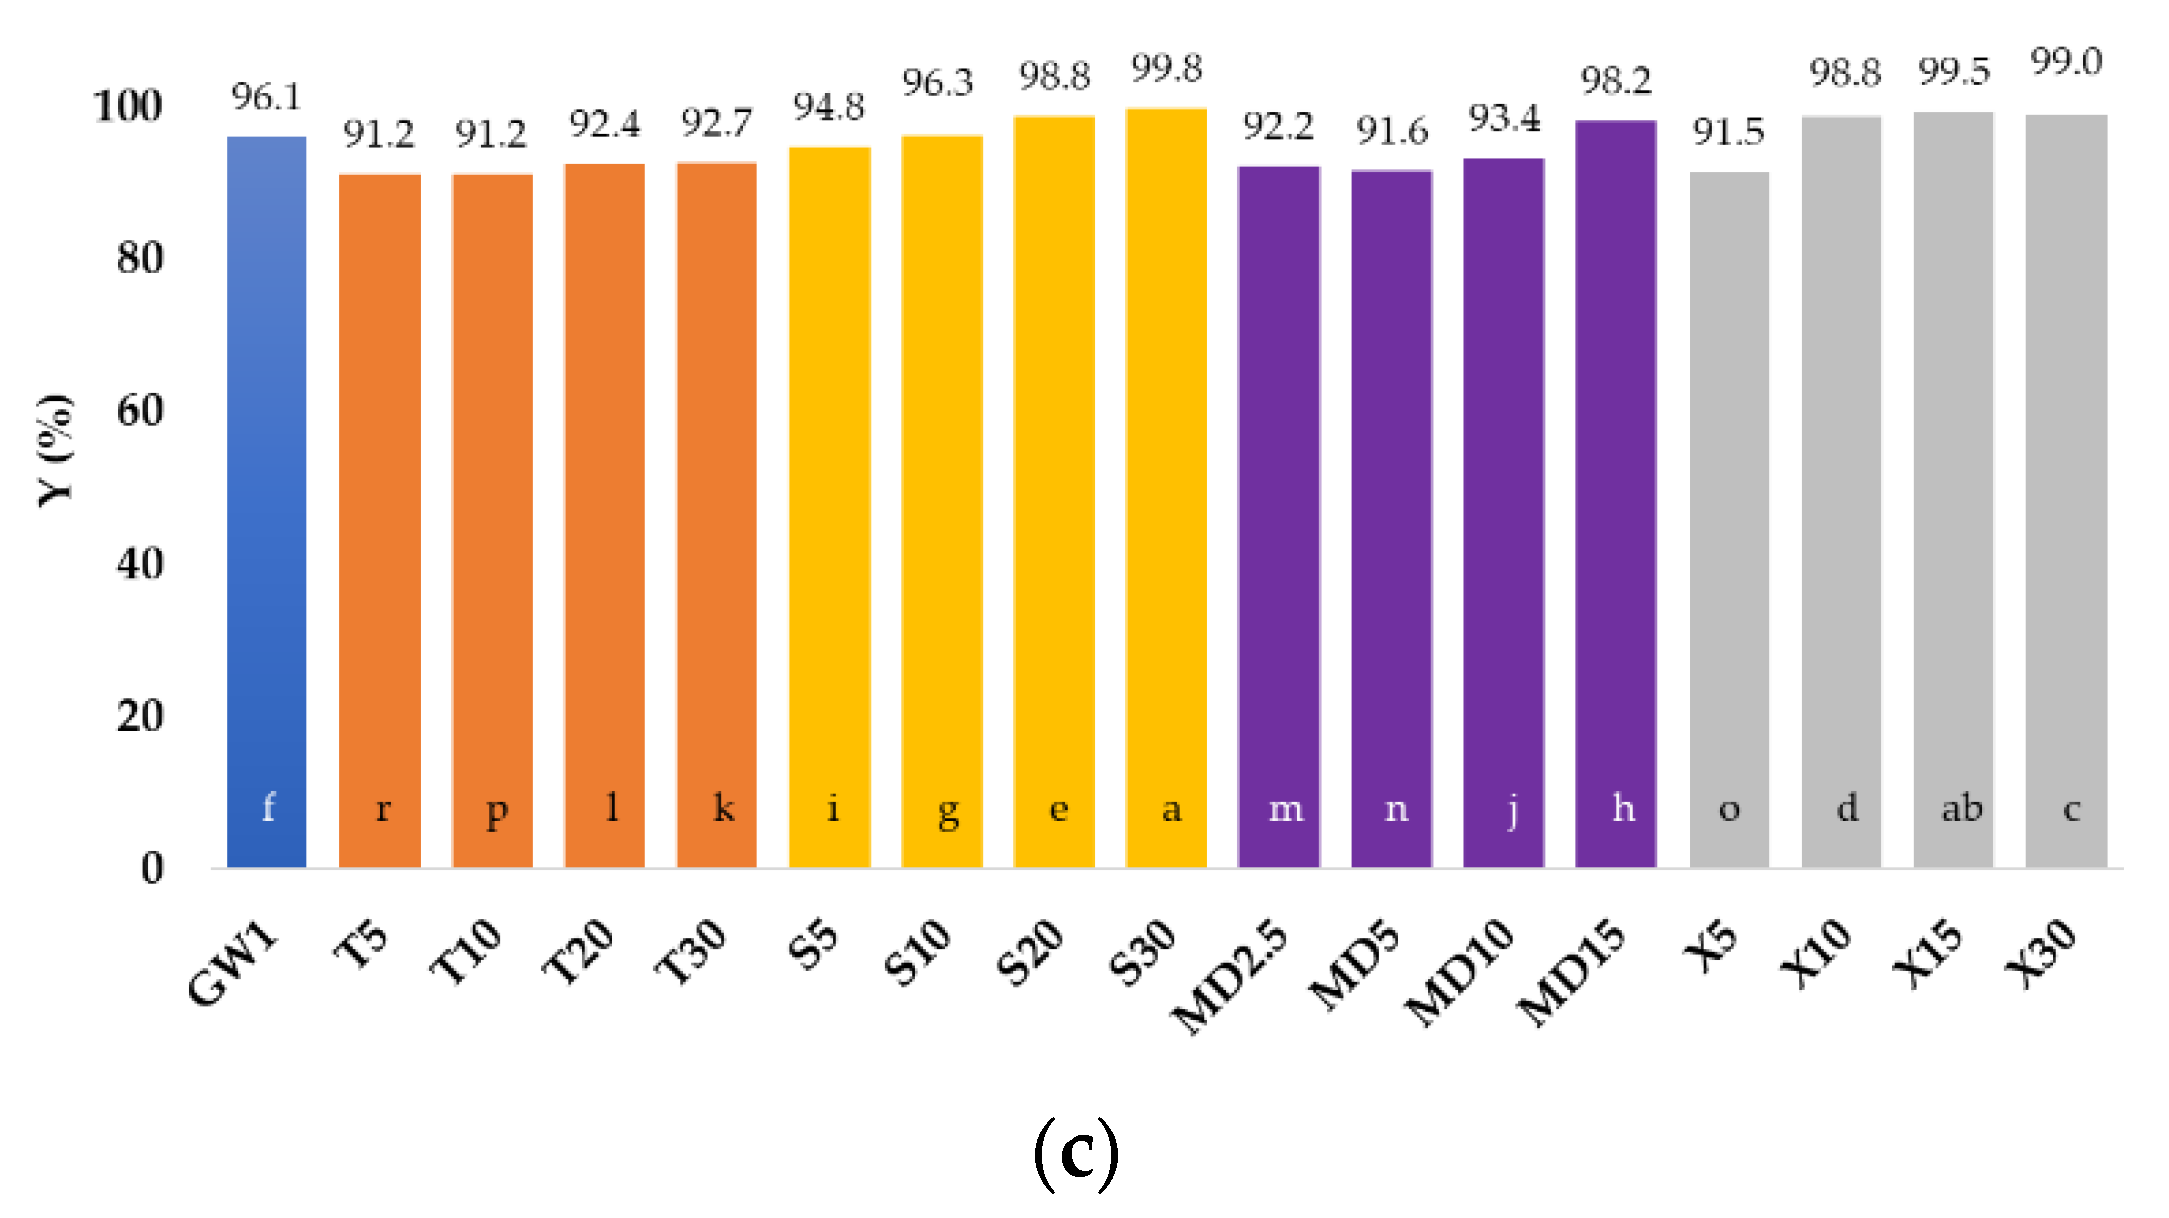
Figure 2.
Density, flowability and cohesiveness of spray-dried MC: (a) bulk density (BD) and tap density (TD), (b) Carr index (CI) and (c) Hausner ratio (HR).
Figure 2.
Density, flowability and cohesiveness of spray-dried MC: (a) bulk density (BD) and tap density (TD), (b) Carr index (CI) and (c) Hausner ratio (HR).
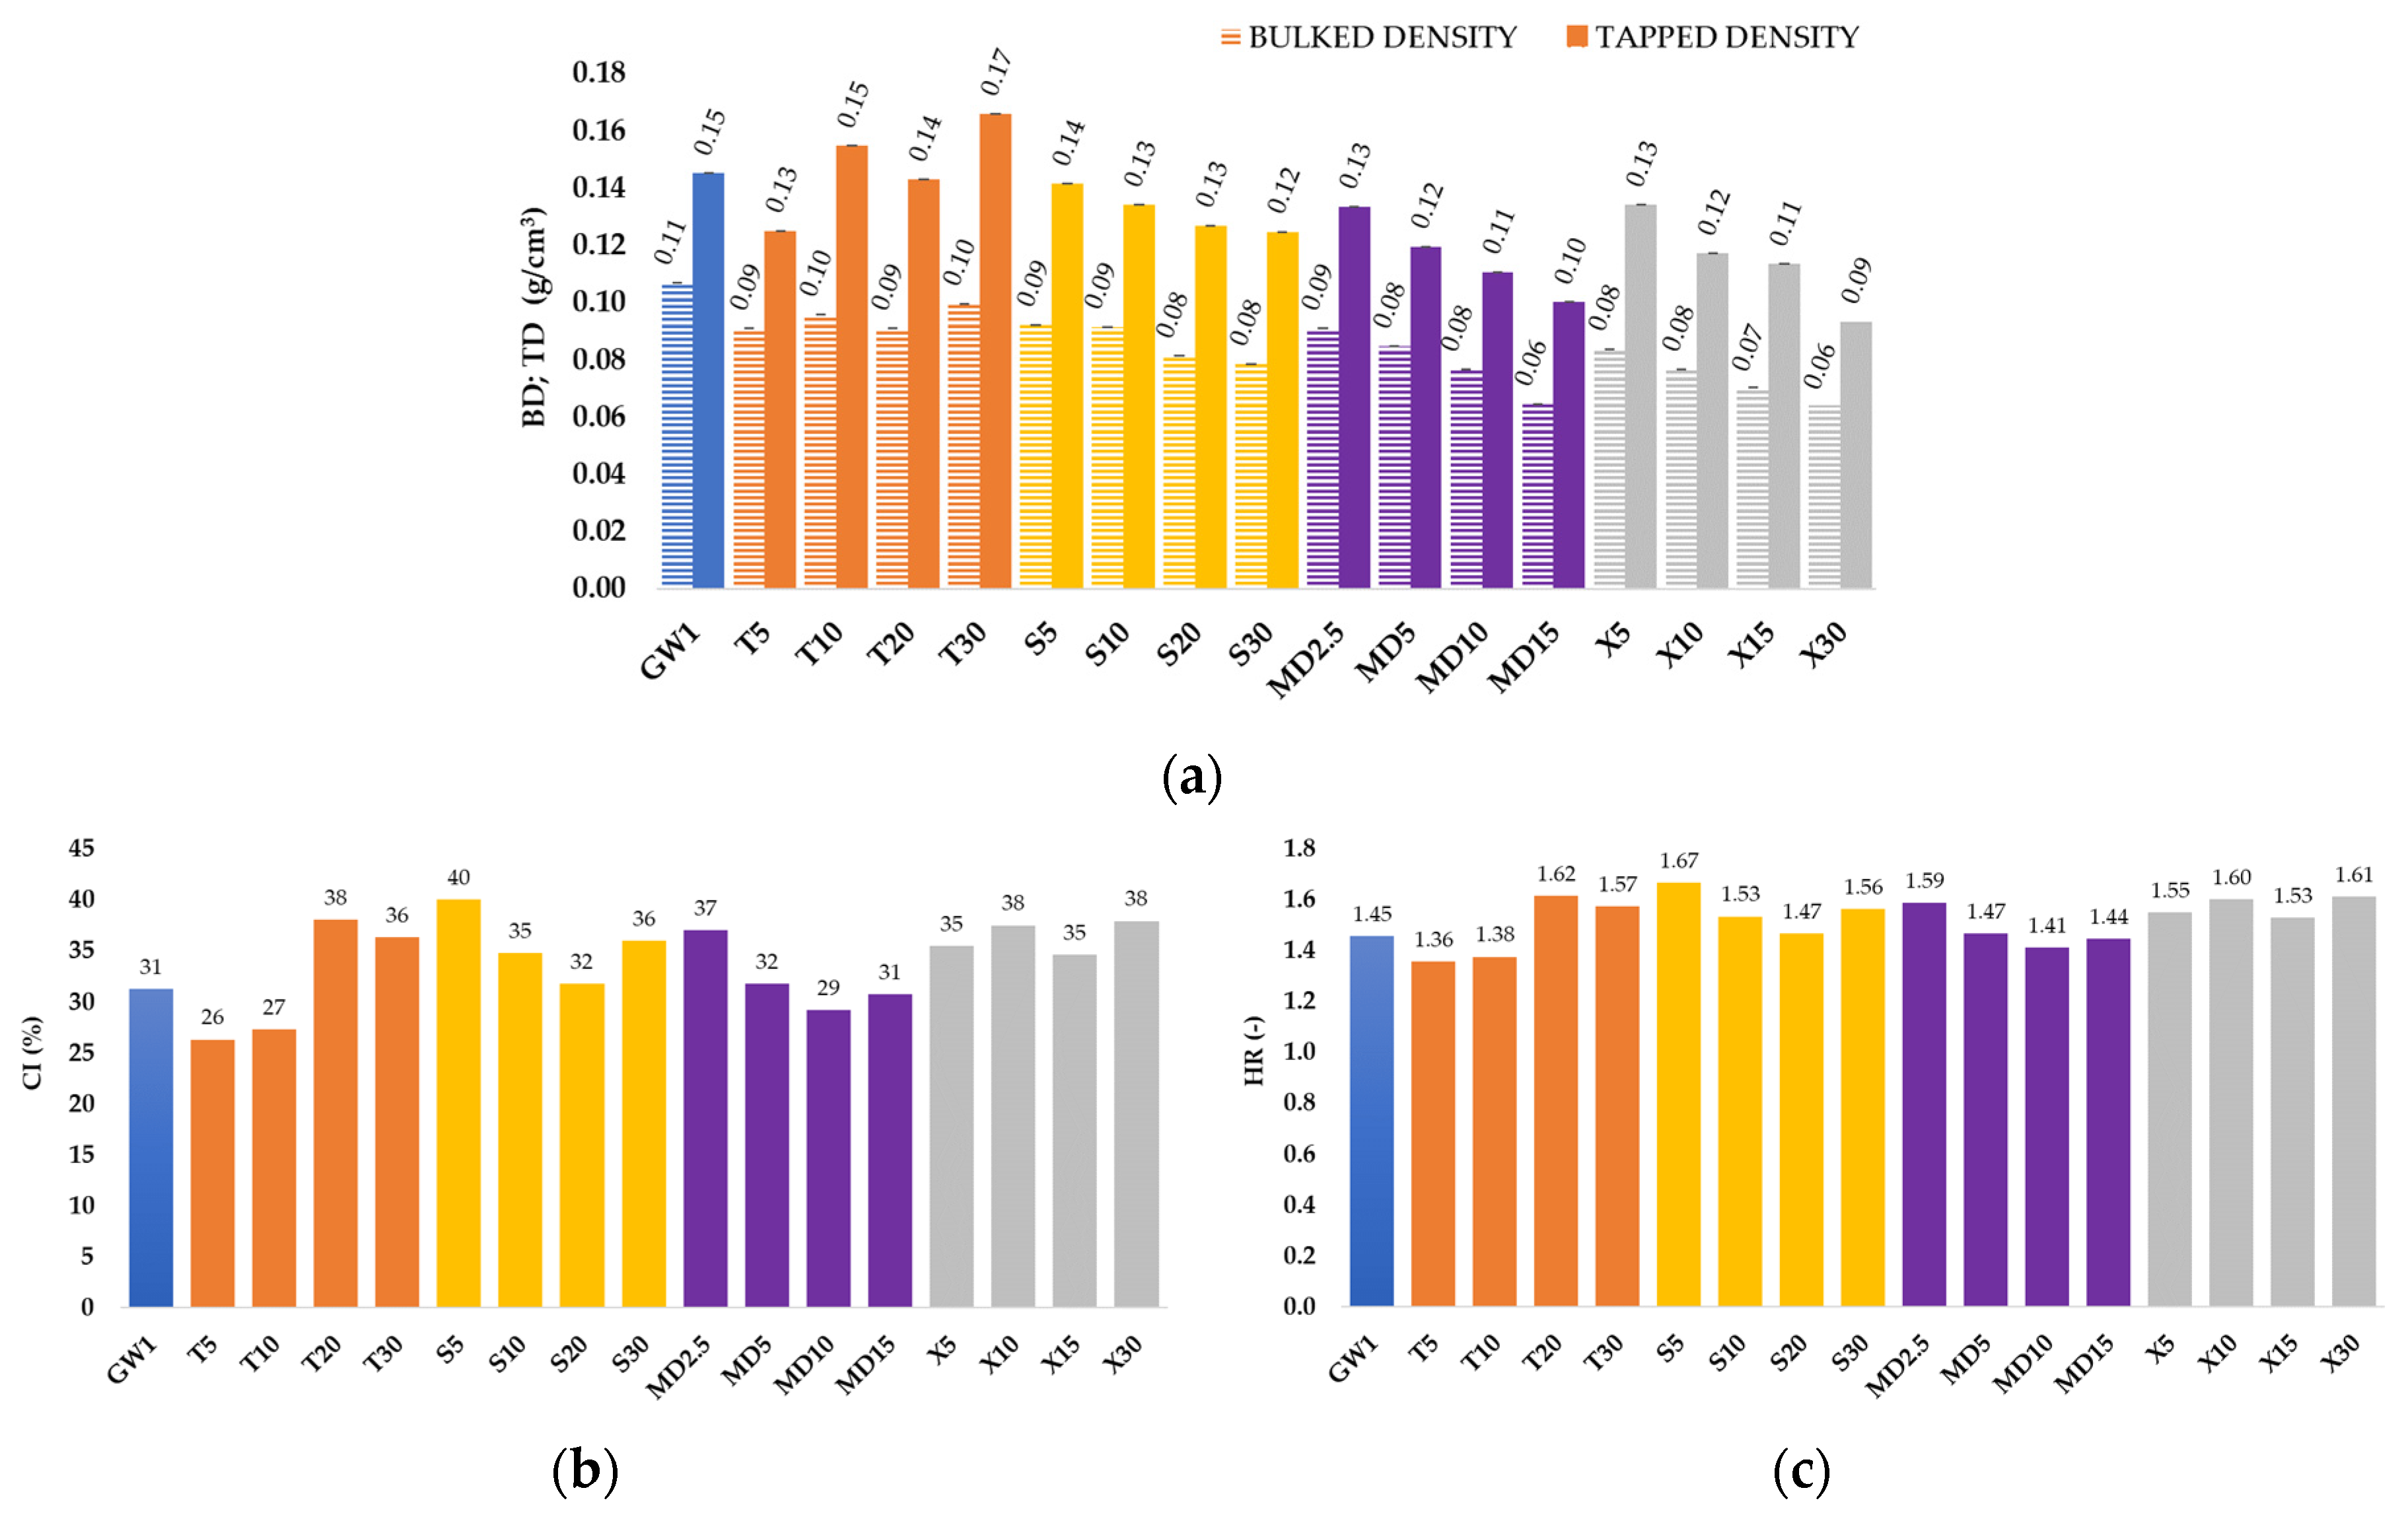
Figure 3.
Crystallinity and amorphousness of MC samples with various coatings: (a) X-ray powder diffractograms and (b) DSC thermograms.
Figure 3.
Crystallinity and amorphousness of MC samples with various coatings: (a) X-ray powder diffractograms and (b) DSC thermograms.
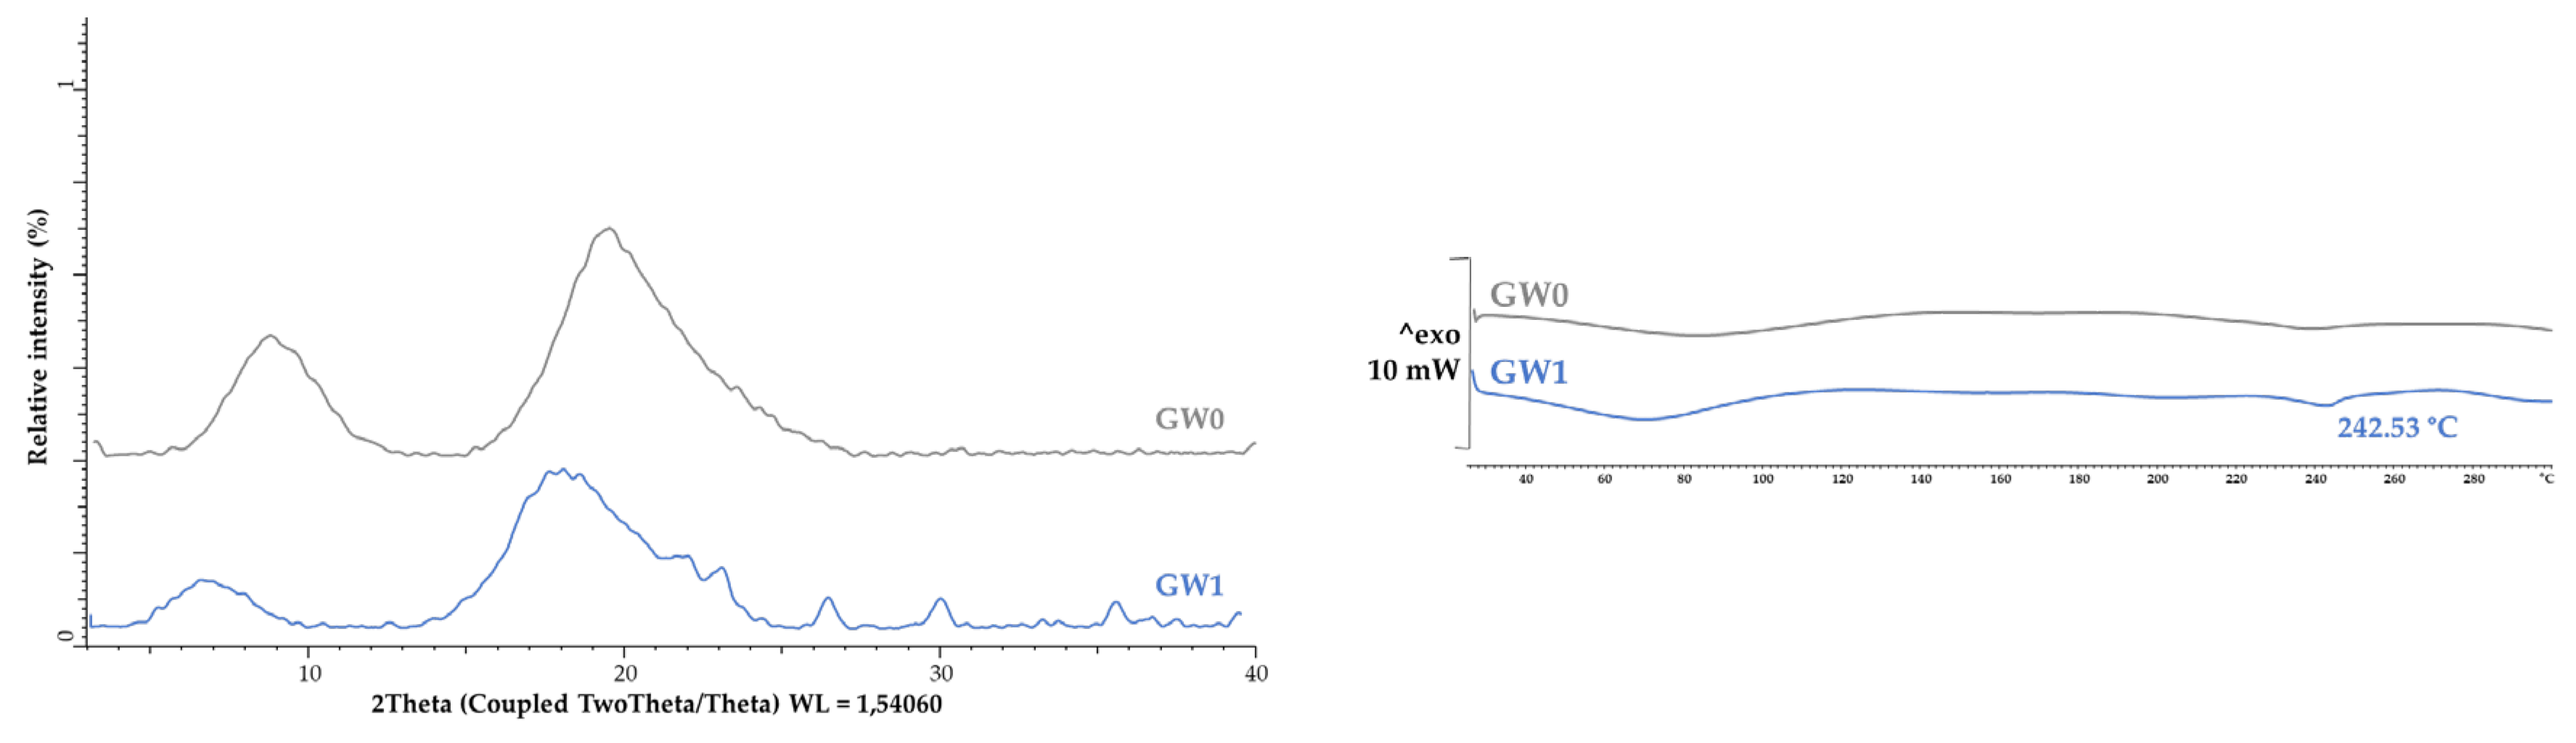
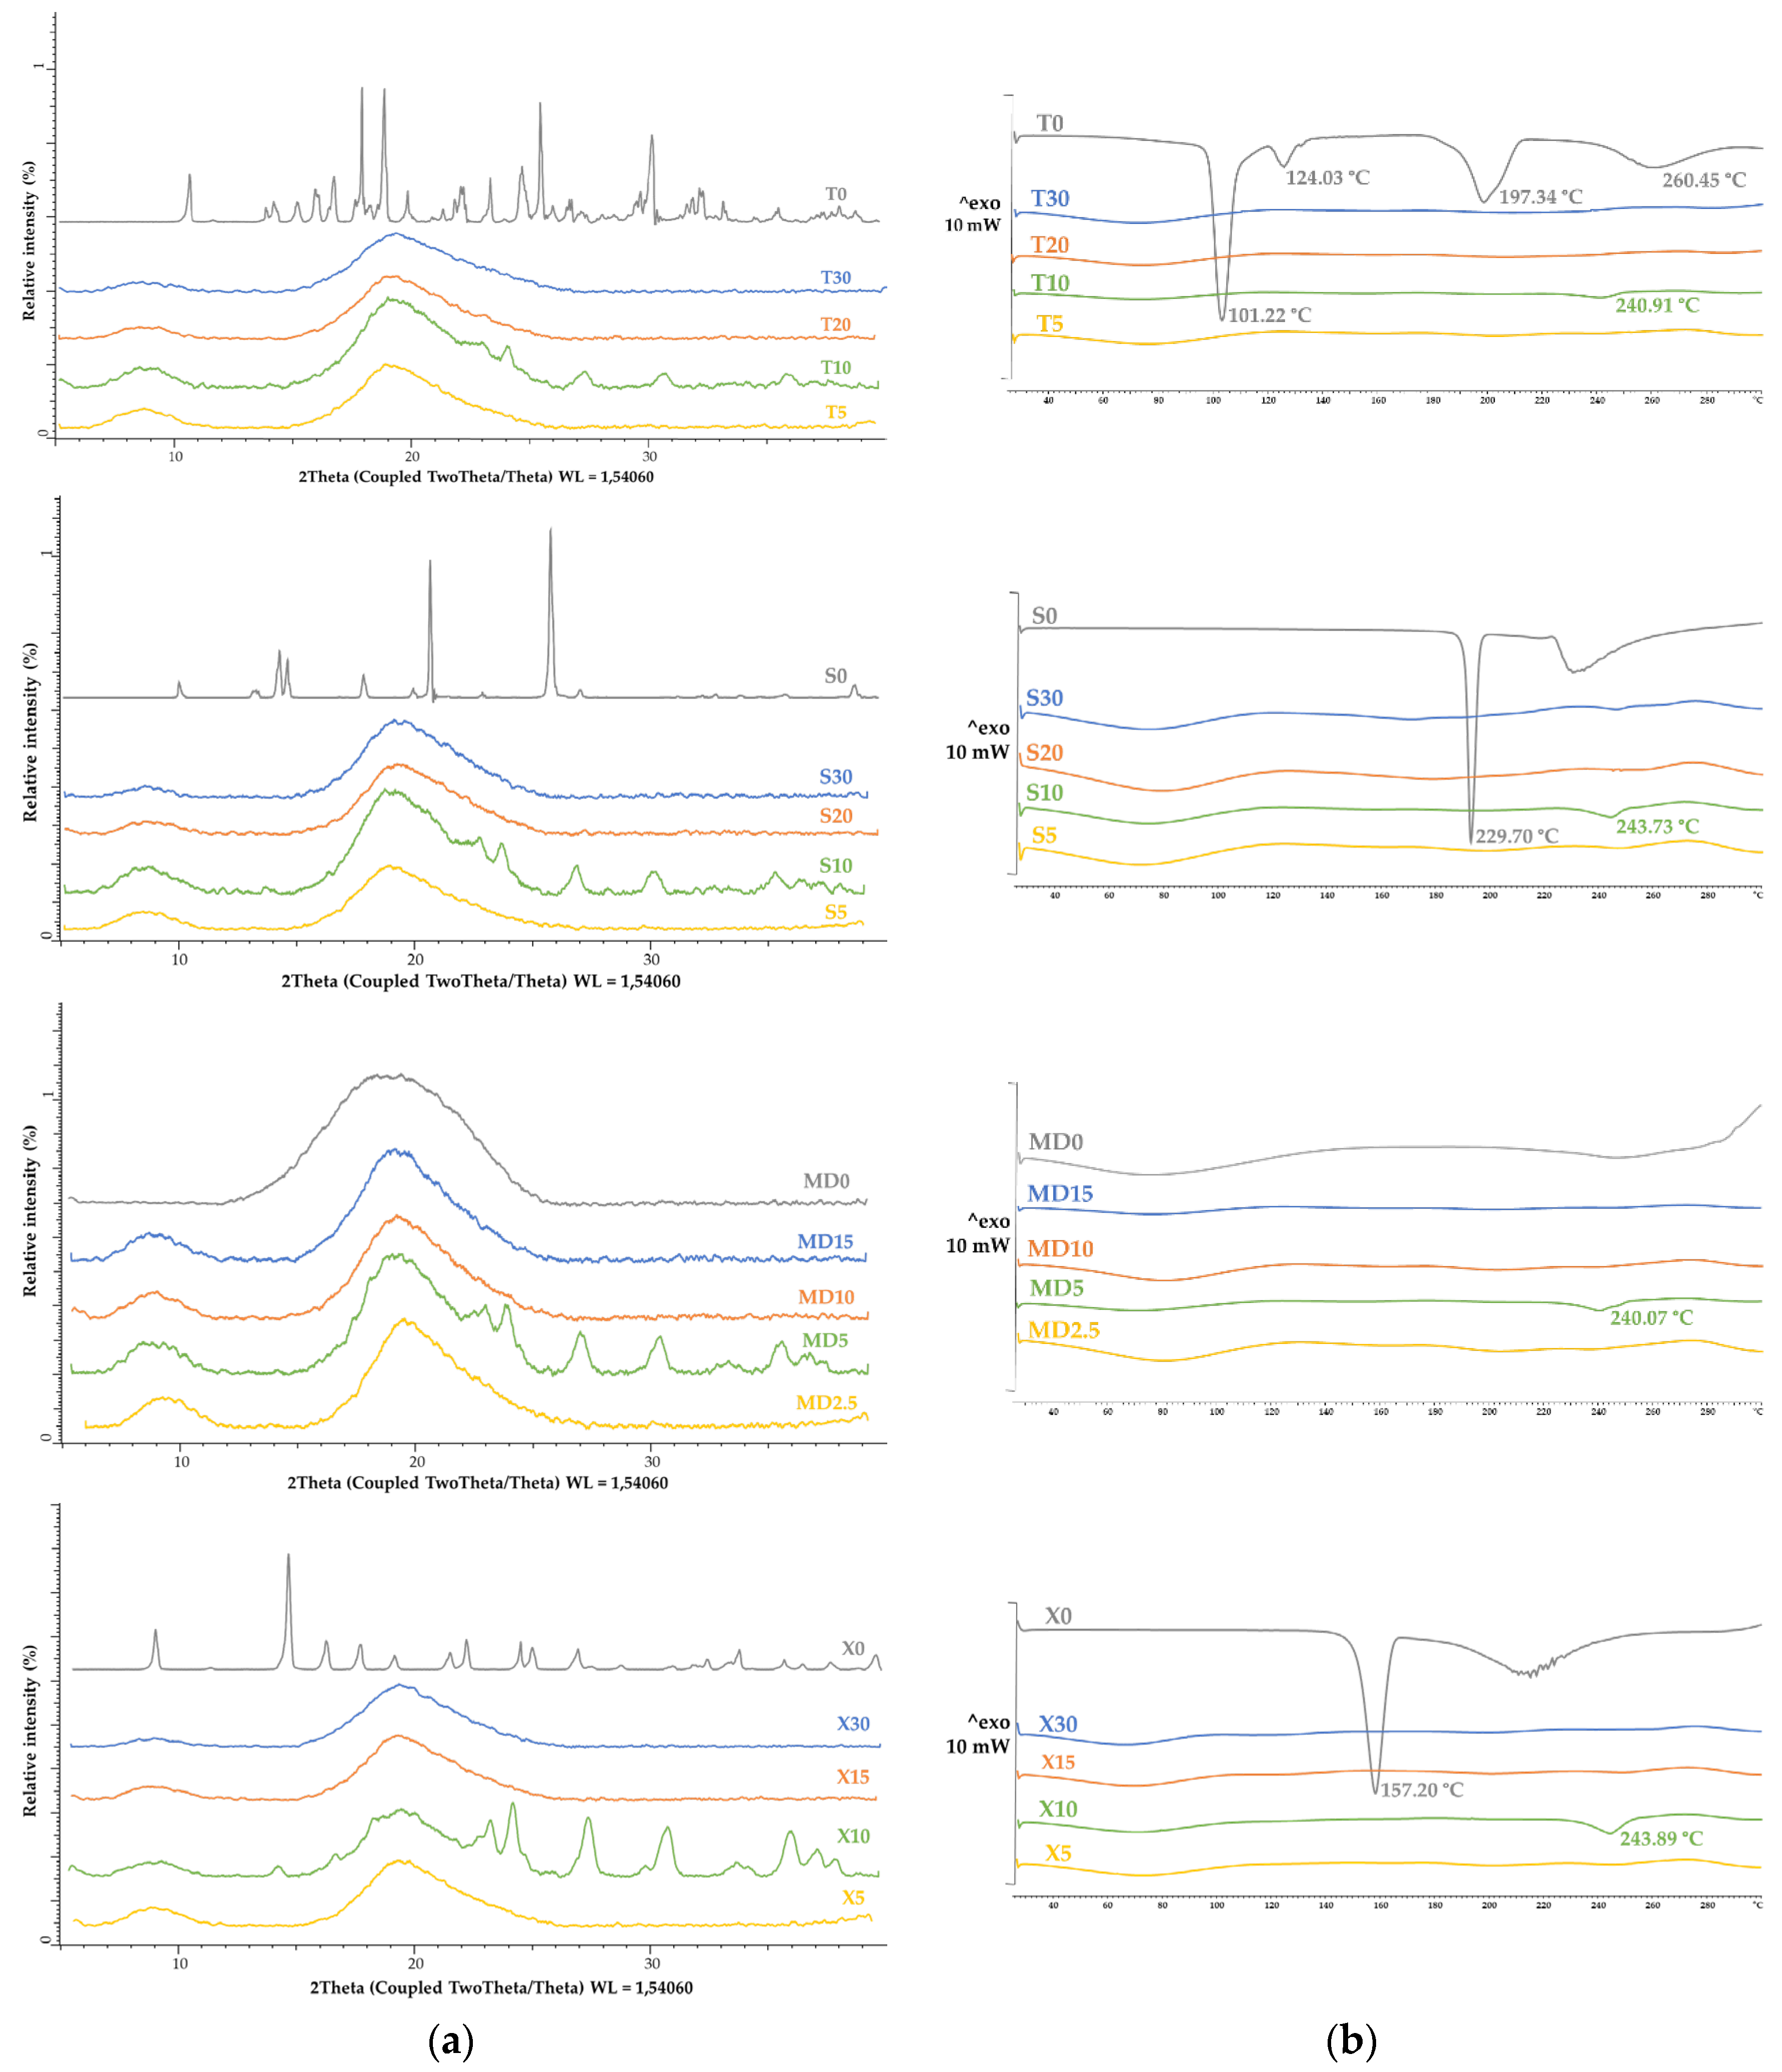
Figure 4.
Scanning electron micrographs for: (a) goat whey protein particles (GW0, (b) MC coated with GW (GW1).
Figure 4.
Scanning electron micrographs for: (a) goat whey protein particles (GW0, (b) MC coated with GW (GW1).
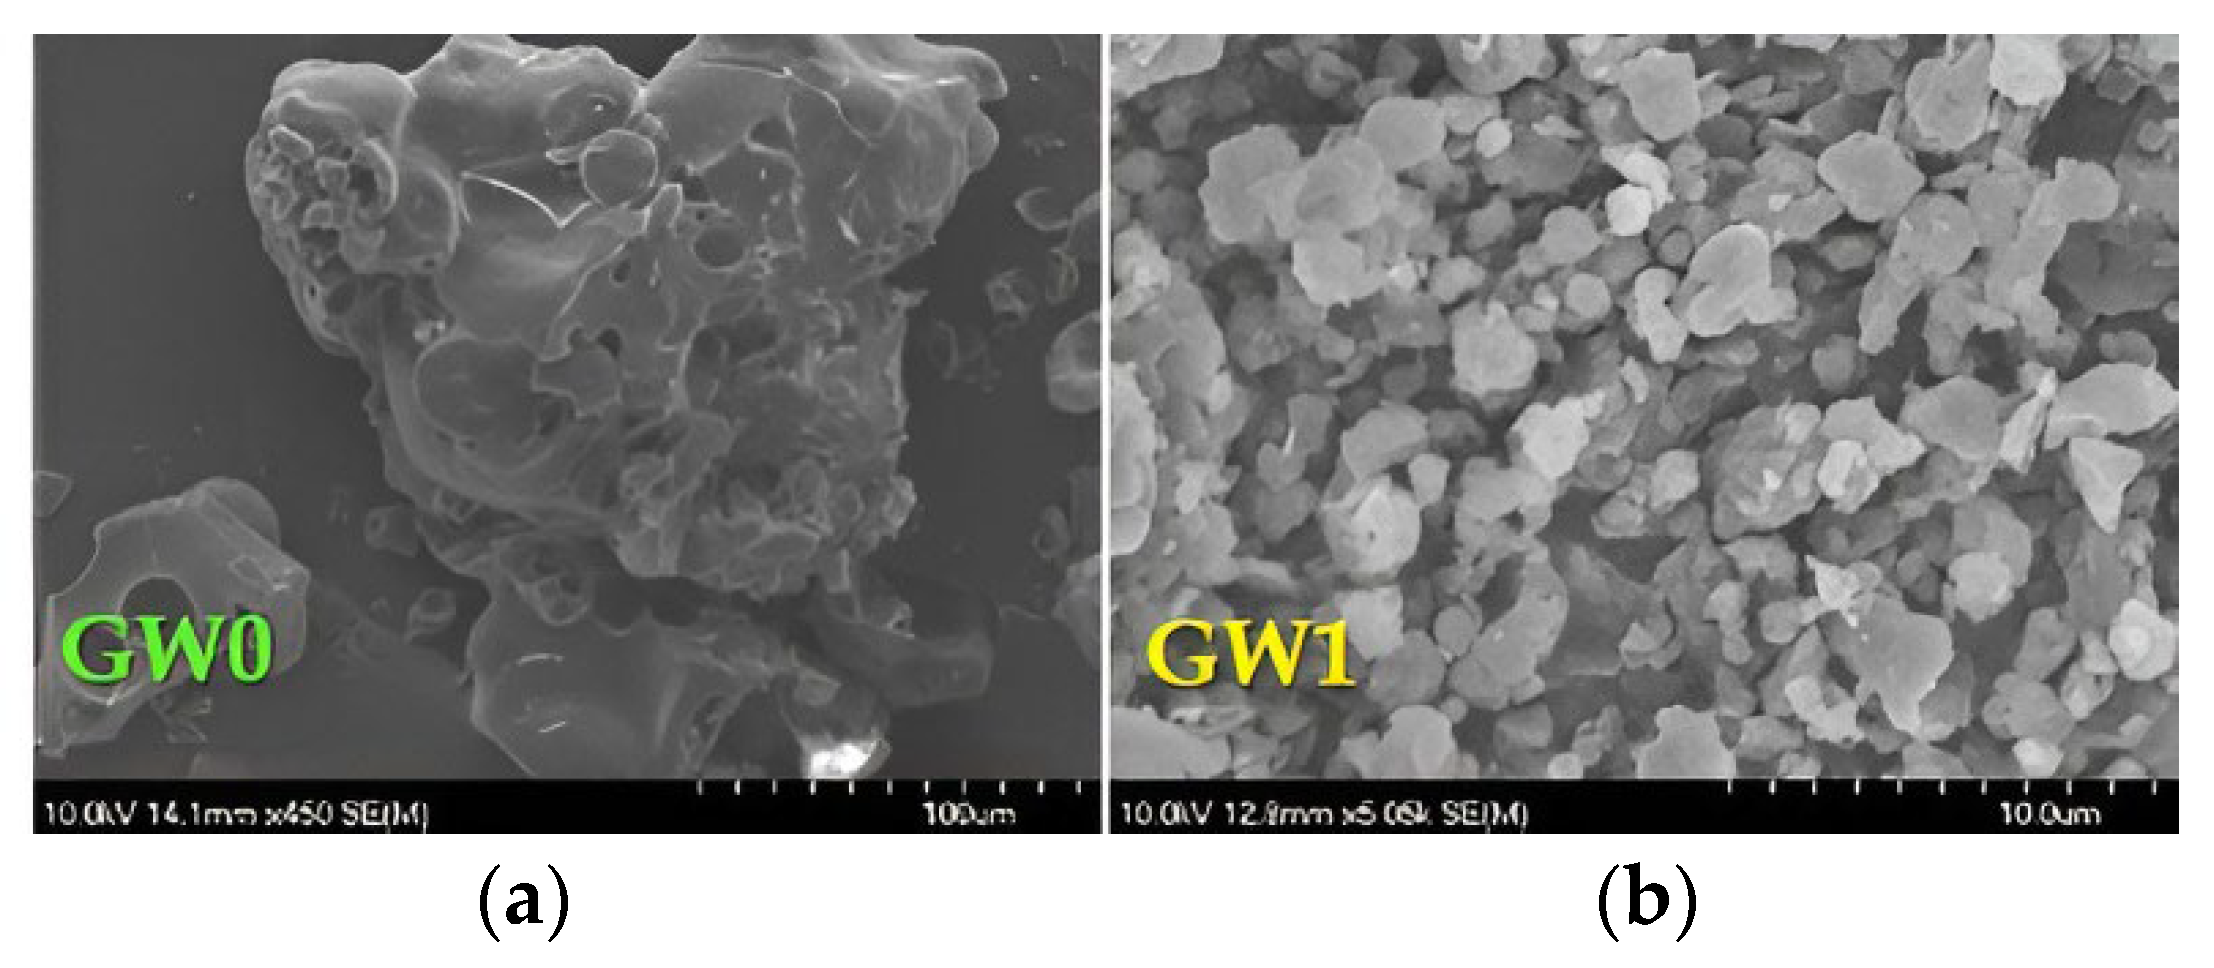
Figure 5.
Scanning electron micrographs for: (a) terhalose particles (T0) and MC coated with combination of GW and T (T5, T10, T20, T30); (b) sucrose particles and MC coated with combination of GW and S (S5, S10, S20, S30); (c) maltodextrin (DE 4-7) particles and MC coated with combination of GW and MD (MD2.5, MD5, MD10, MD15); xylose particles (X0) and MC coated with combination of GW and X (X5, X10, X15, X30).
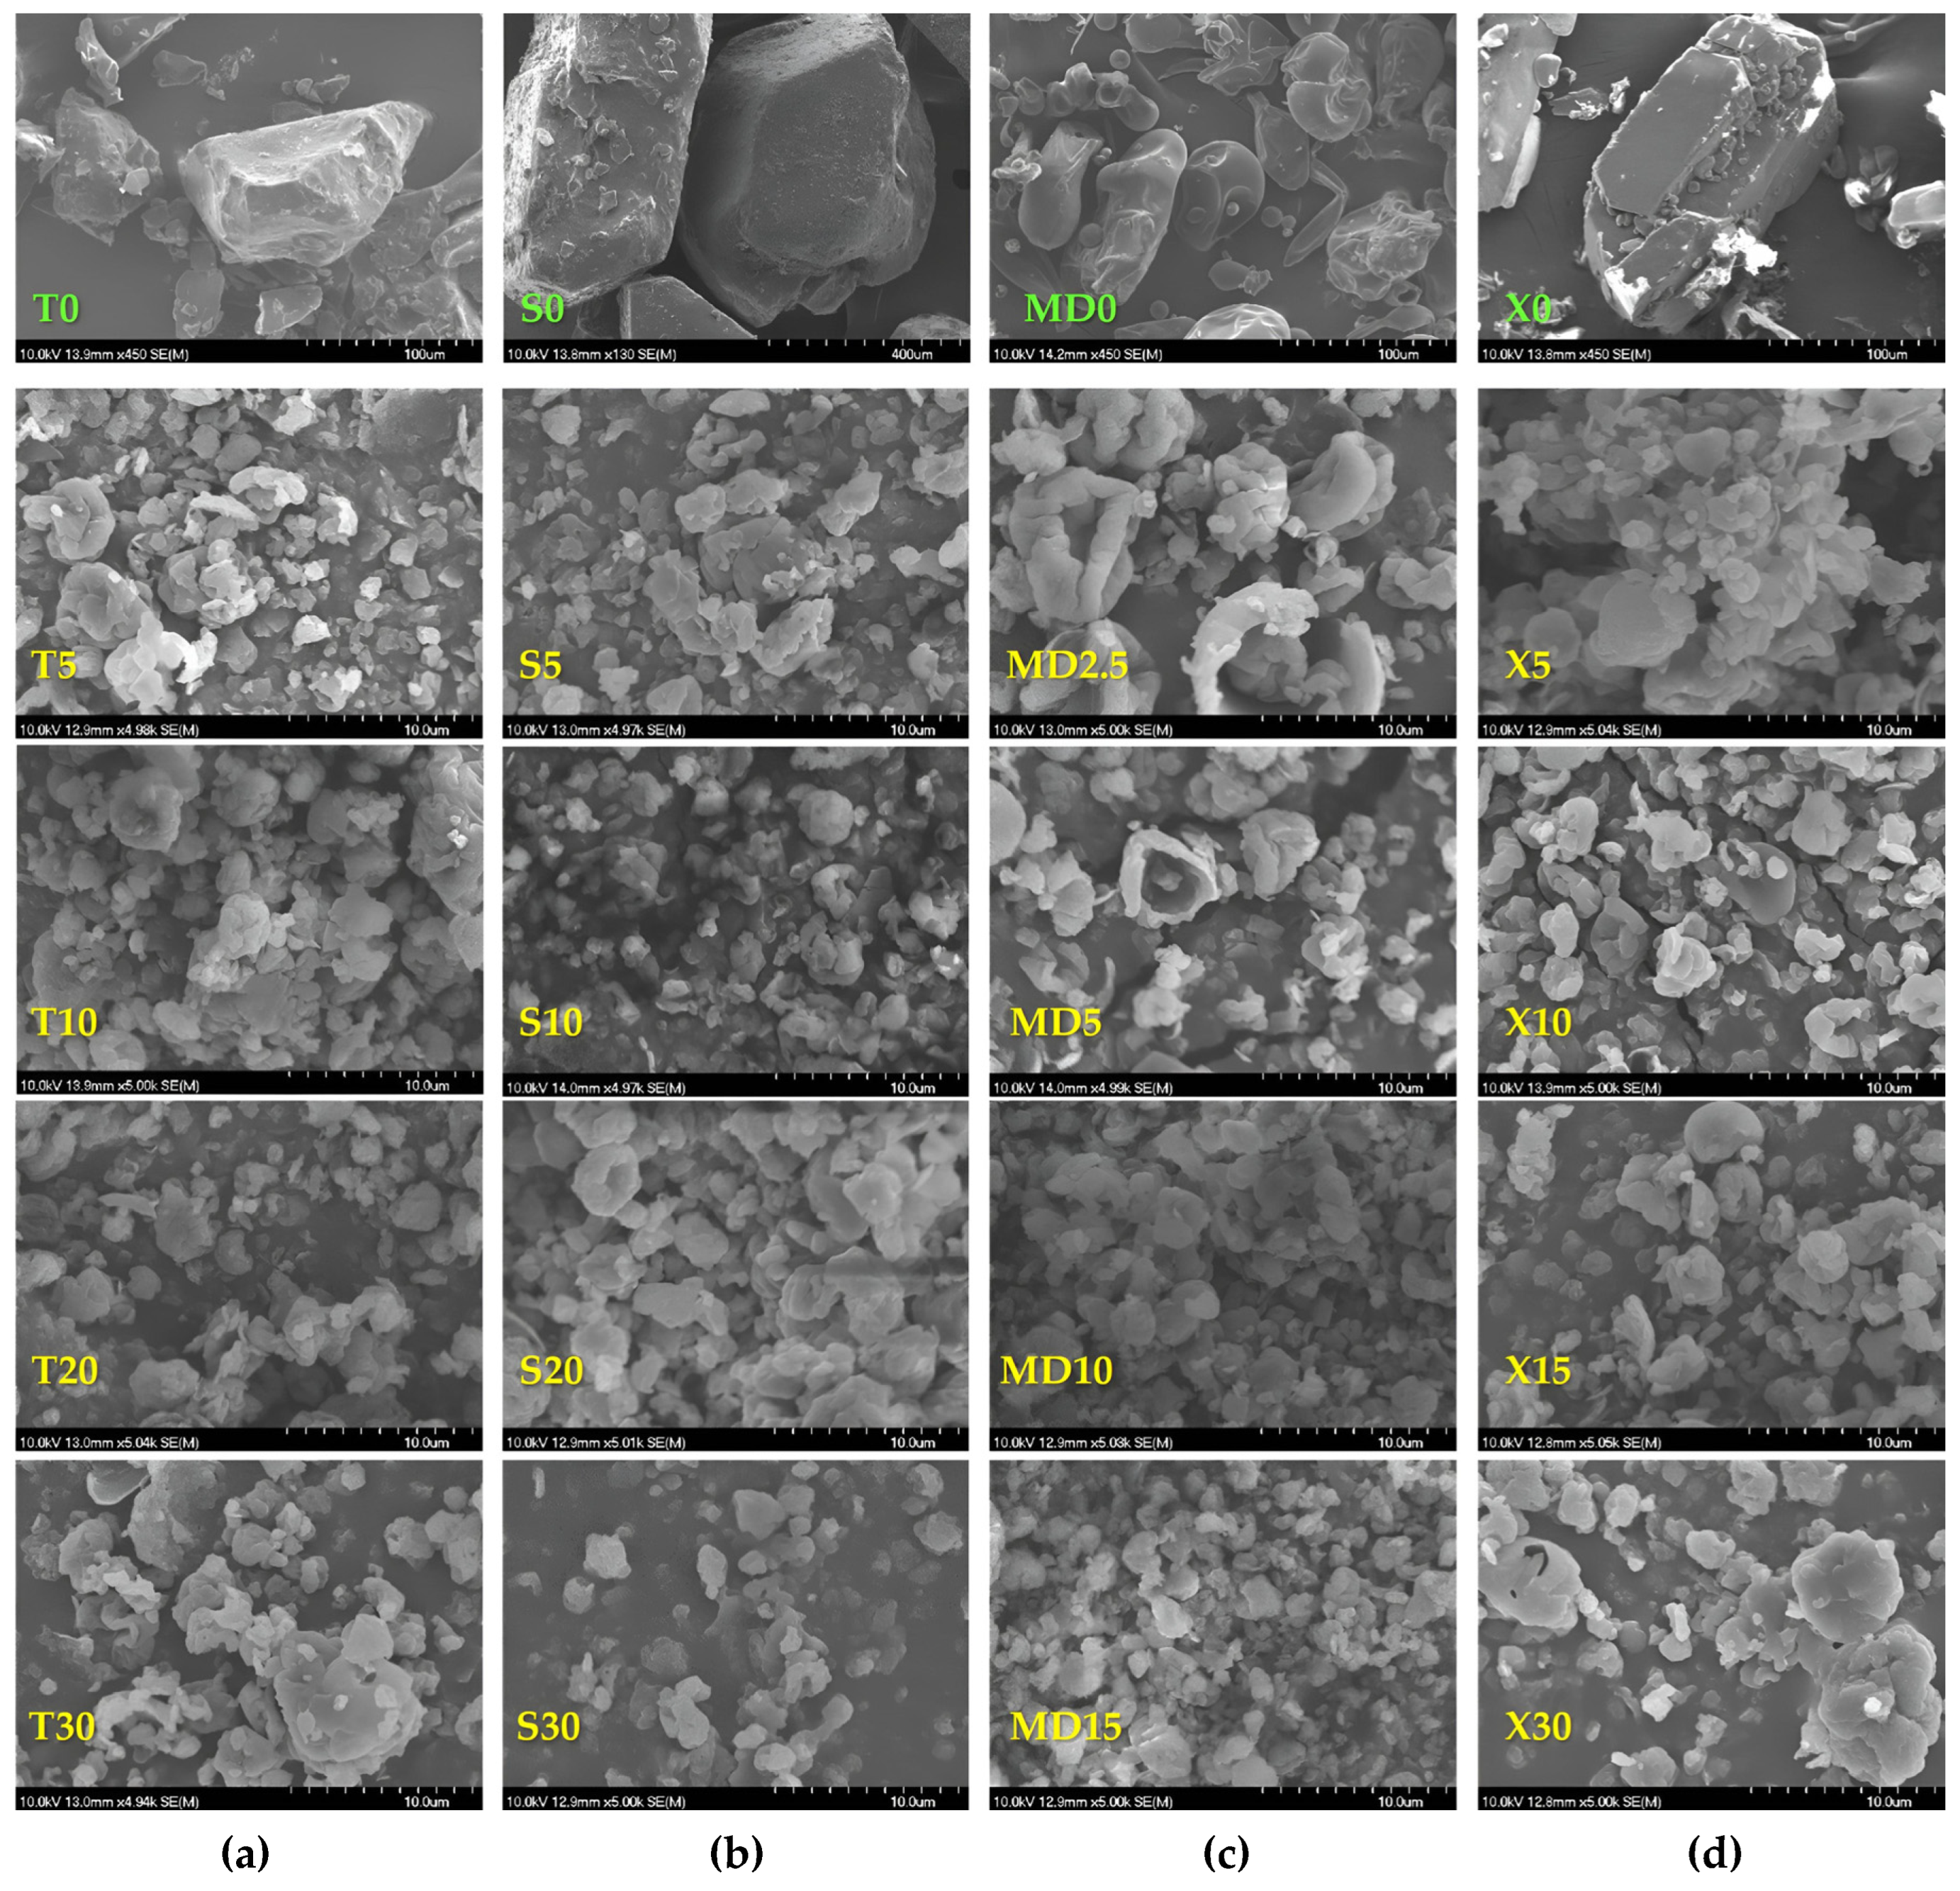
Figure 6.
Cumulative release of TPC (mgGAE/gdb) from selected spray-dried MC (GW1, T10, S10, MD5 and X10) in three digestive phases.
Figure 6.
Cumulative release of TPC (mgGAE/gdb) from selected spray-dried MC (GW1, T10, S10, MD5 and X10) in three digestive phases.
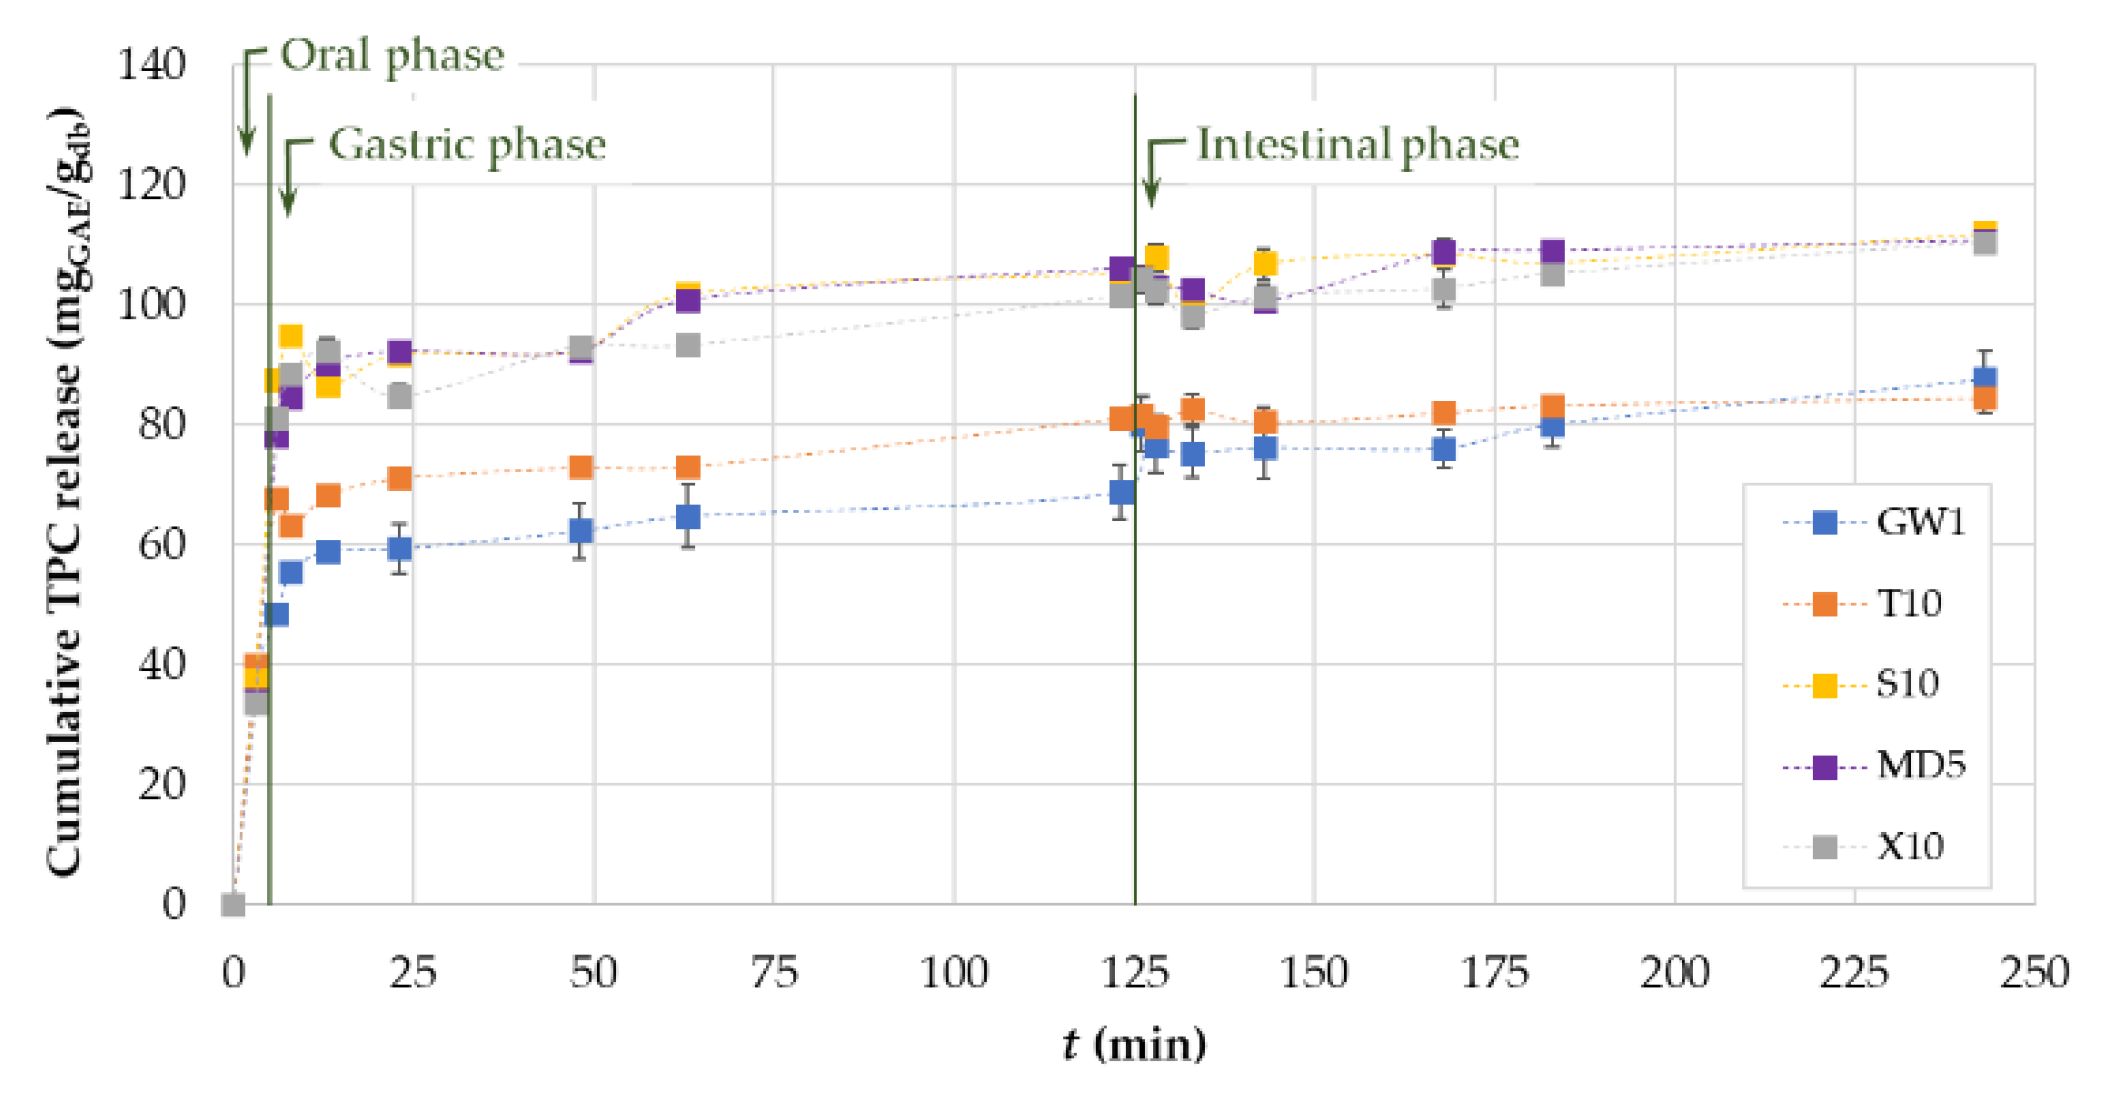
Figure 7.
Bioaccessibility index (BI, %) of the individual phenolic substances of MC depending on the coatings used: (a) BI < 100%, (b) BI > 100%.
Figure 7.
Bioaccessibility index (BI, %) of the individual phenolic substances of MC depending on the coatings used: (a) BI < 100%, (b) BI > 100%.
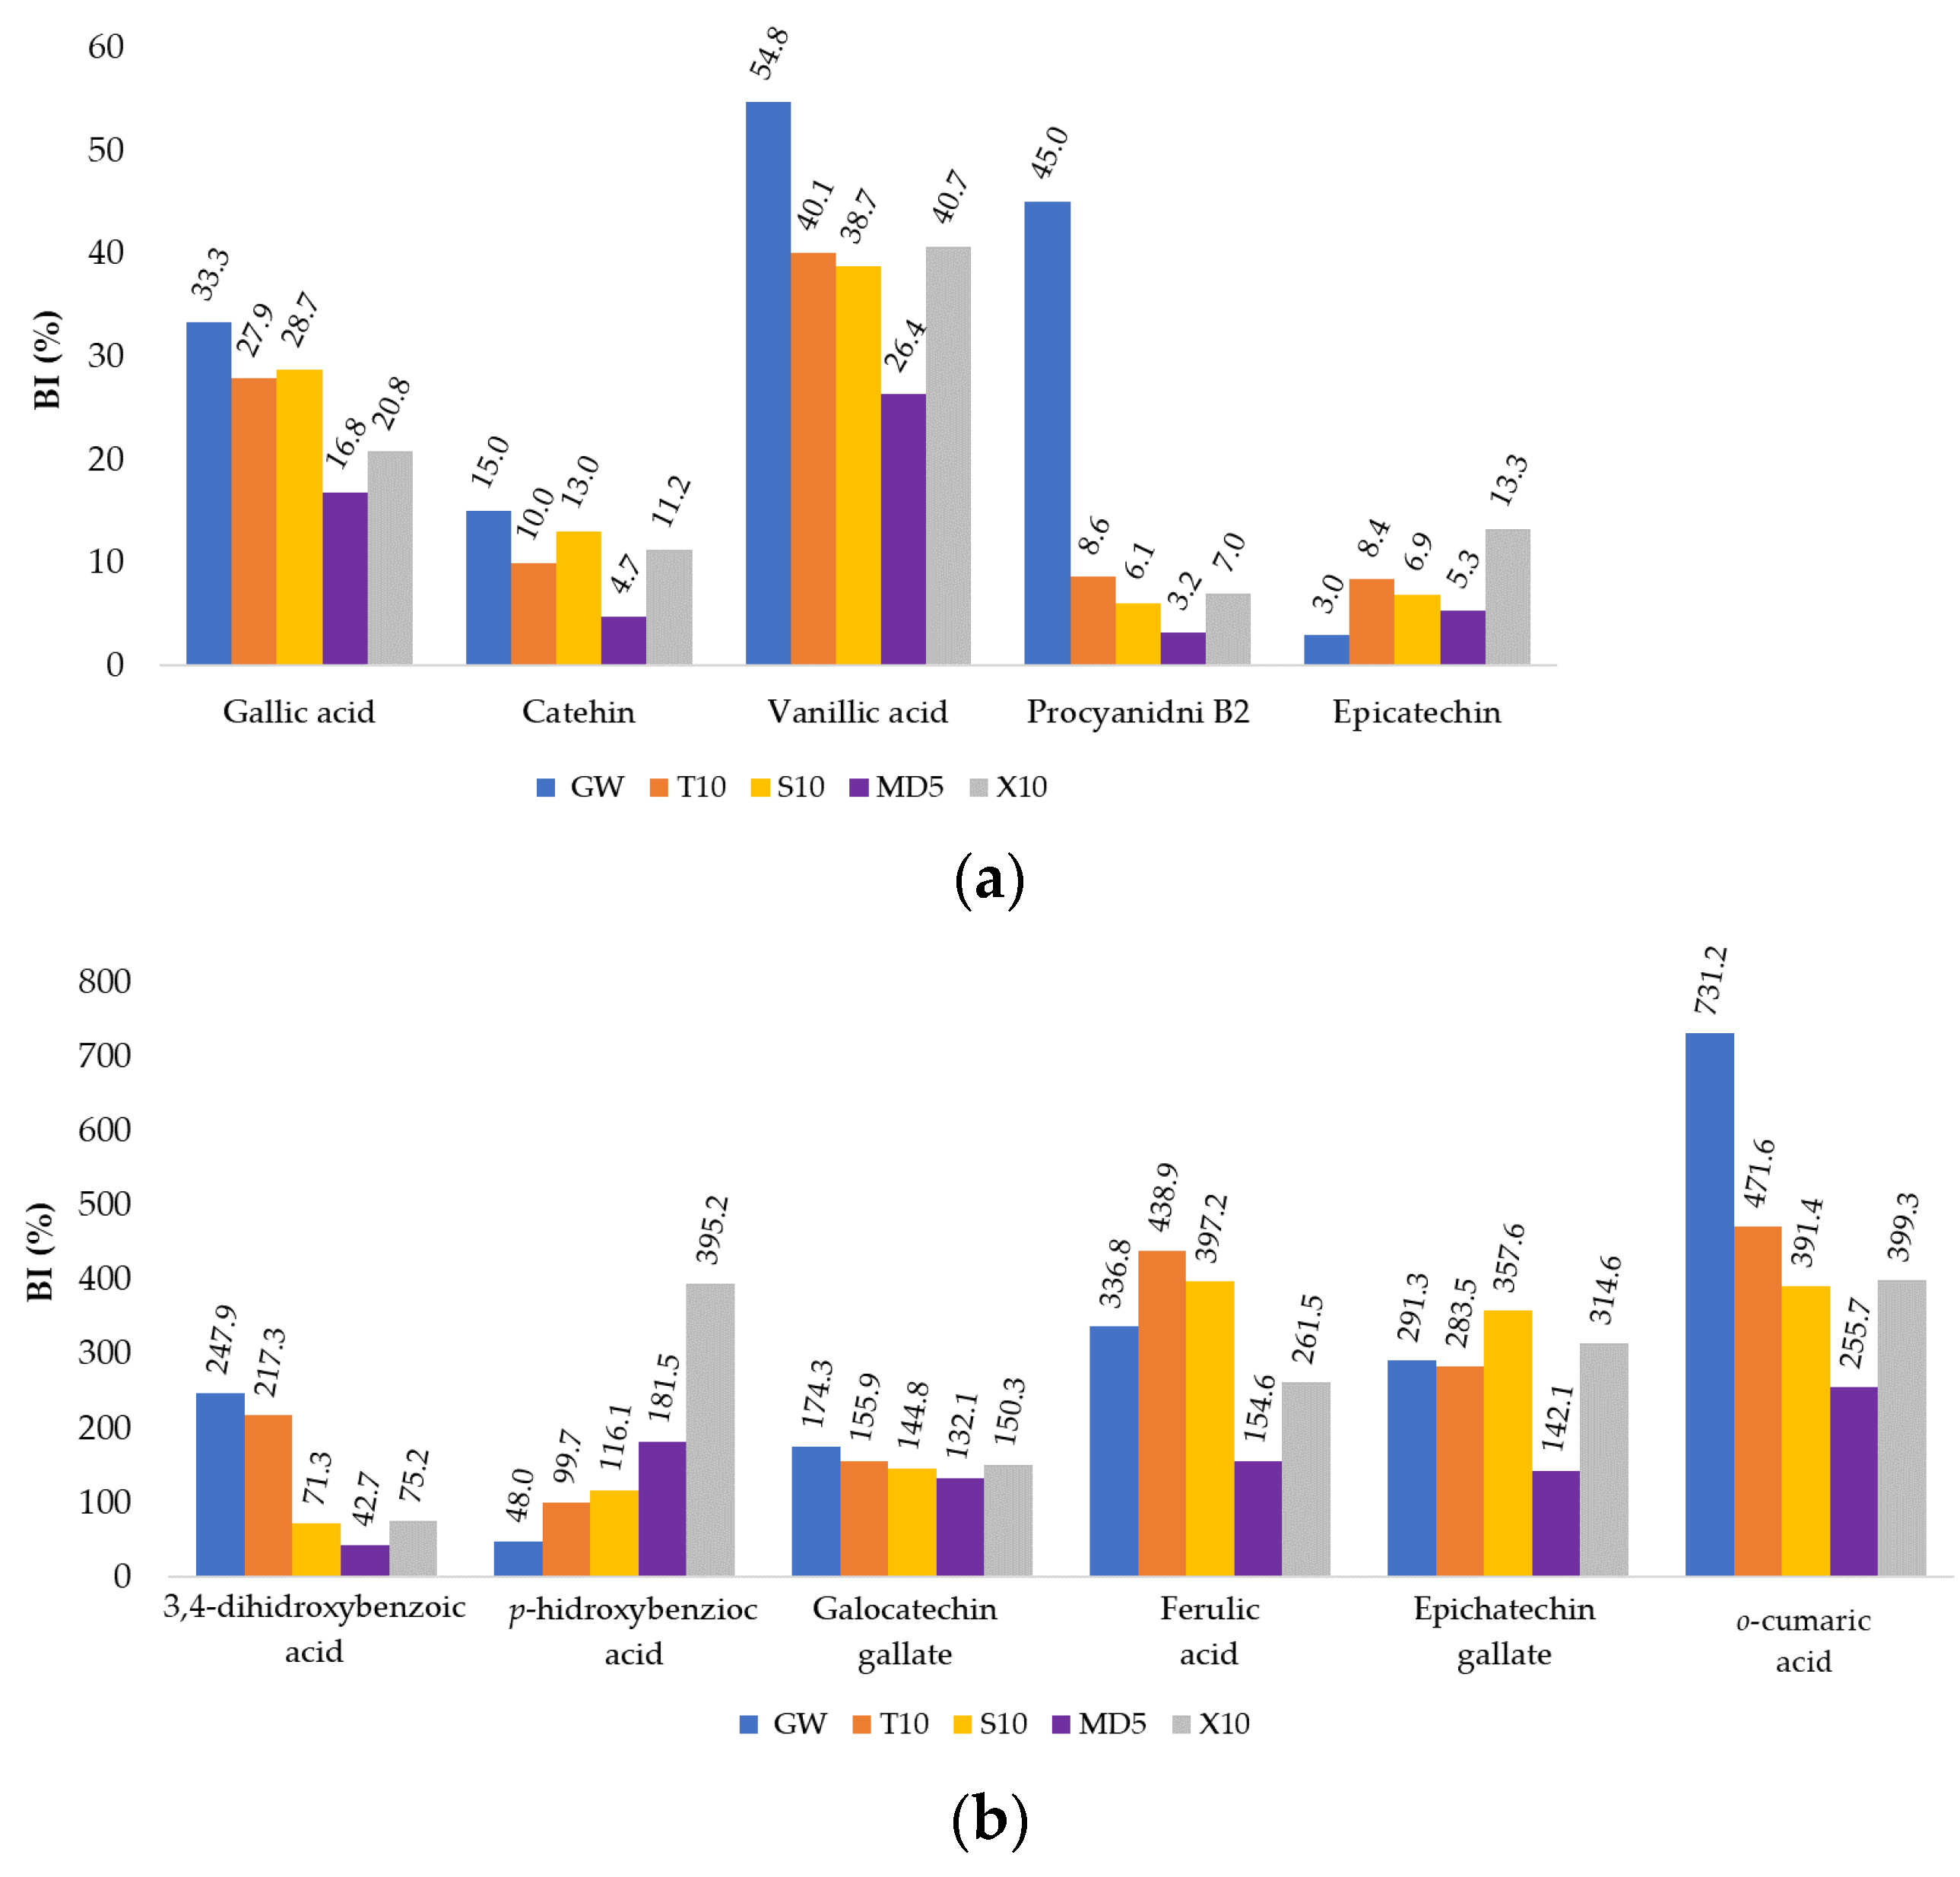
Figure 8.
XRPD pattern of GW powder (GW0) after accelerated ageing during: 2 weeks (GW12w), 1 month (GW11m) and 3 months (GW13m).
Figure 8.
XRPD pattern of GW powder (GW0) after accelerated ageing during: 2 weeks (GW12w), 1 month (GW11m) and 3 months (GW13m).
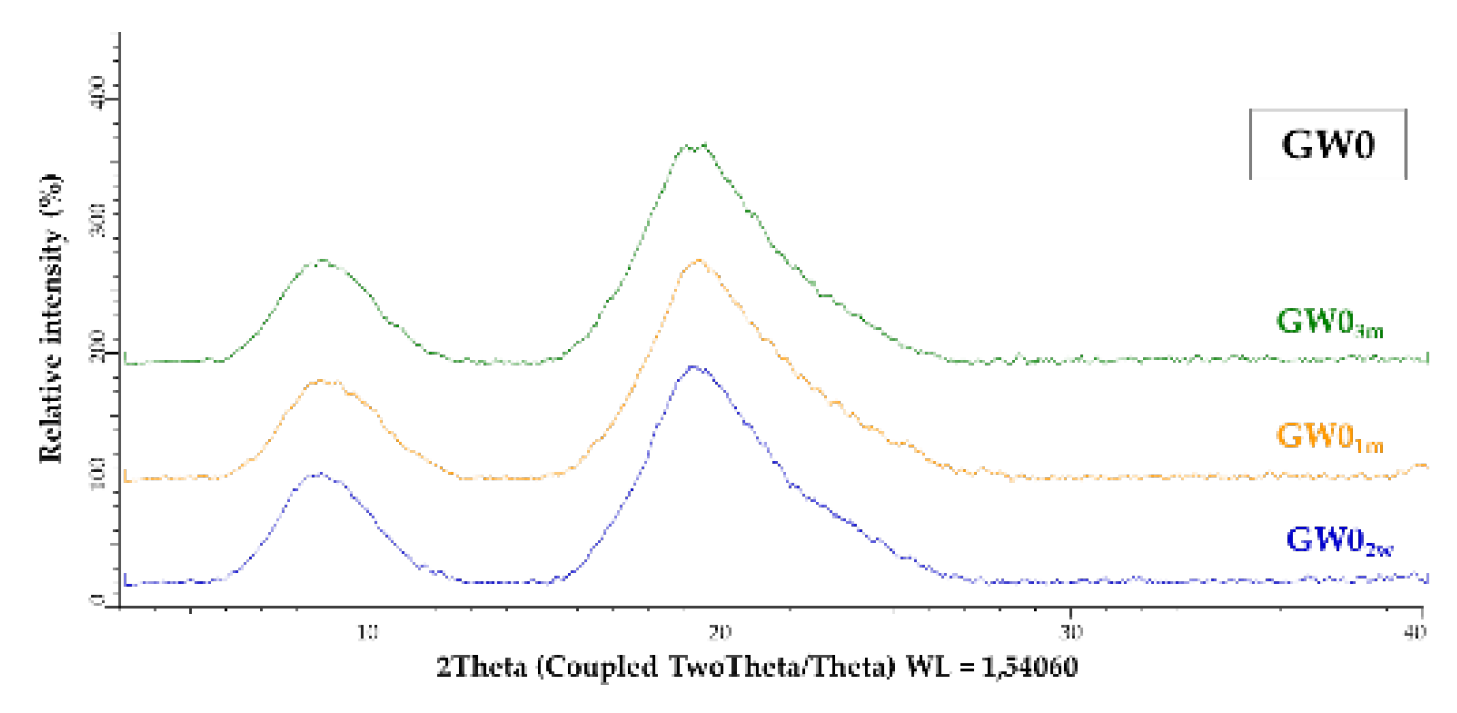
Figure 9.
XRPD pattern of MC coated with a combination of GW and T, S, MD and X after accelerated ageing during: (a) 2 weeks, (b) 1 month, and (c) 3 months.
Figure 9.
XRPD pattern of MC coated with a combination of GW and T, S, MD and X after accelerated ageing during: (a) 2 weeks, (b) 1 month, and (c) 3 months.
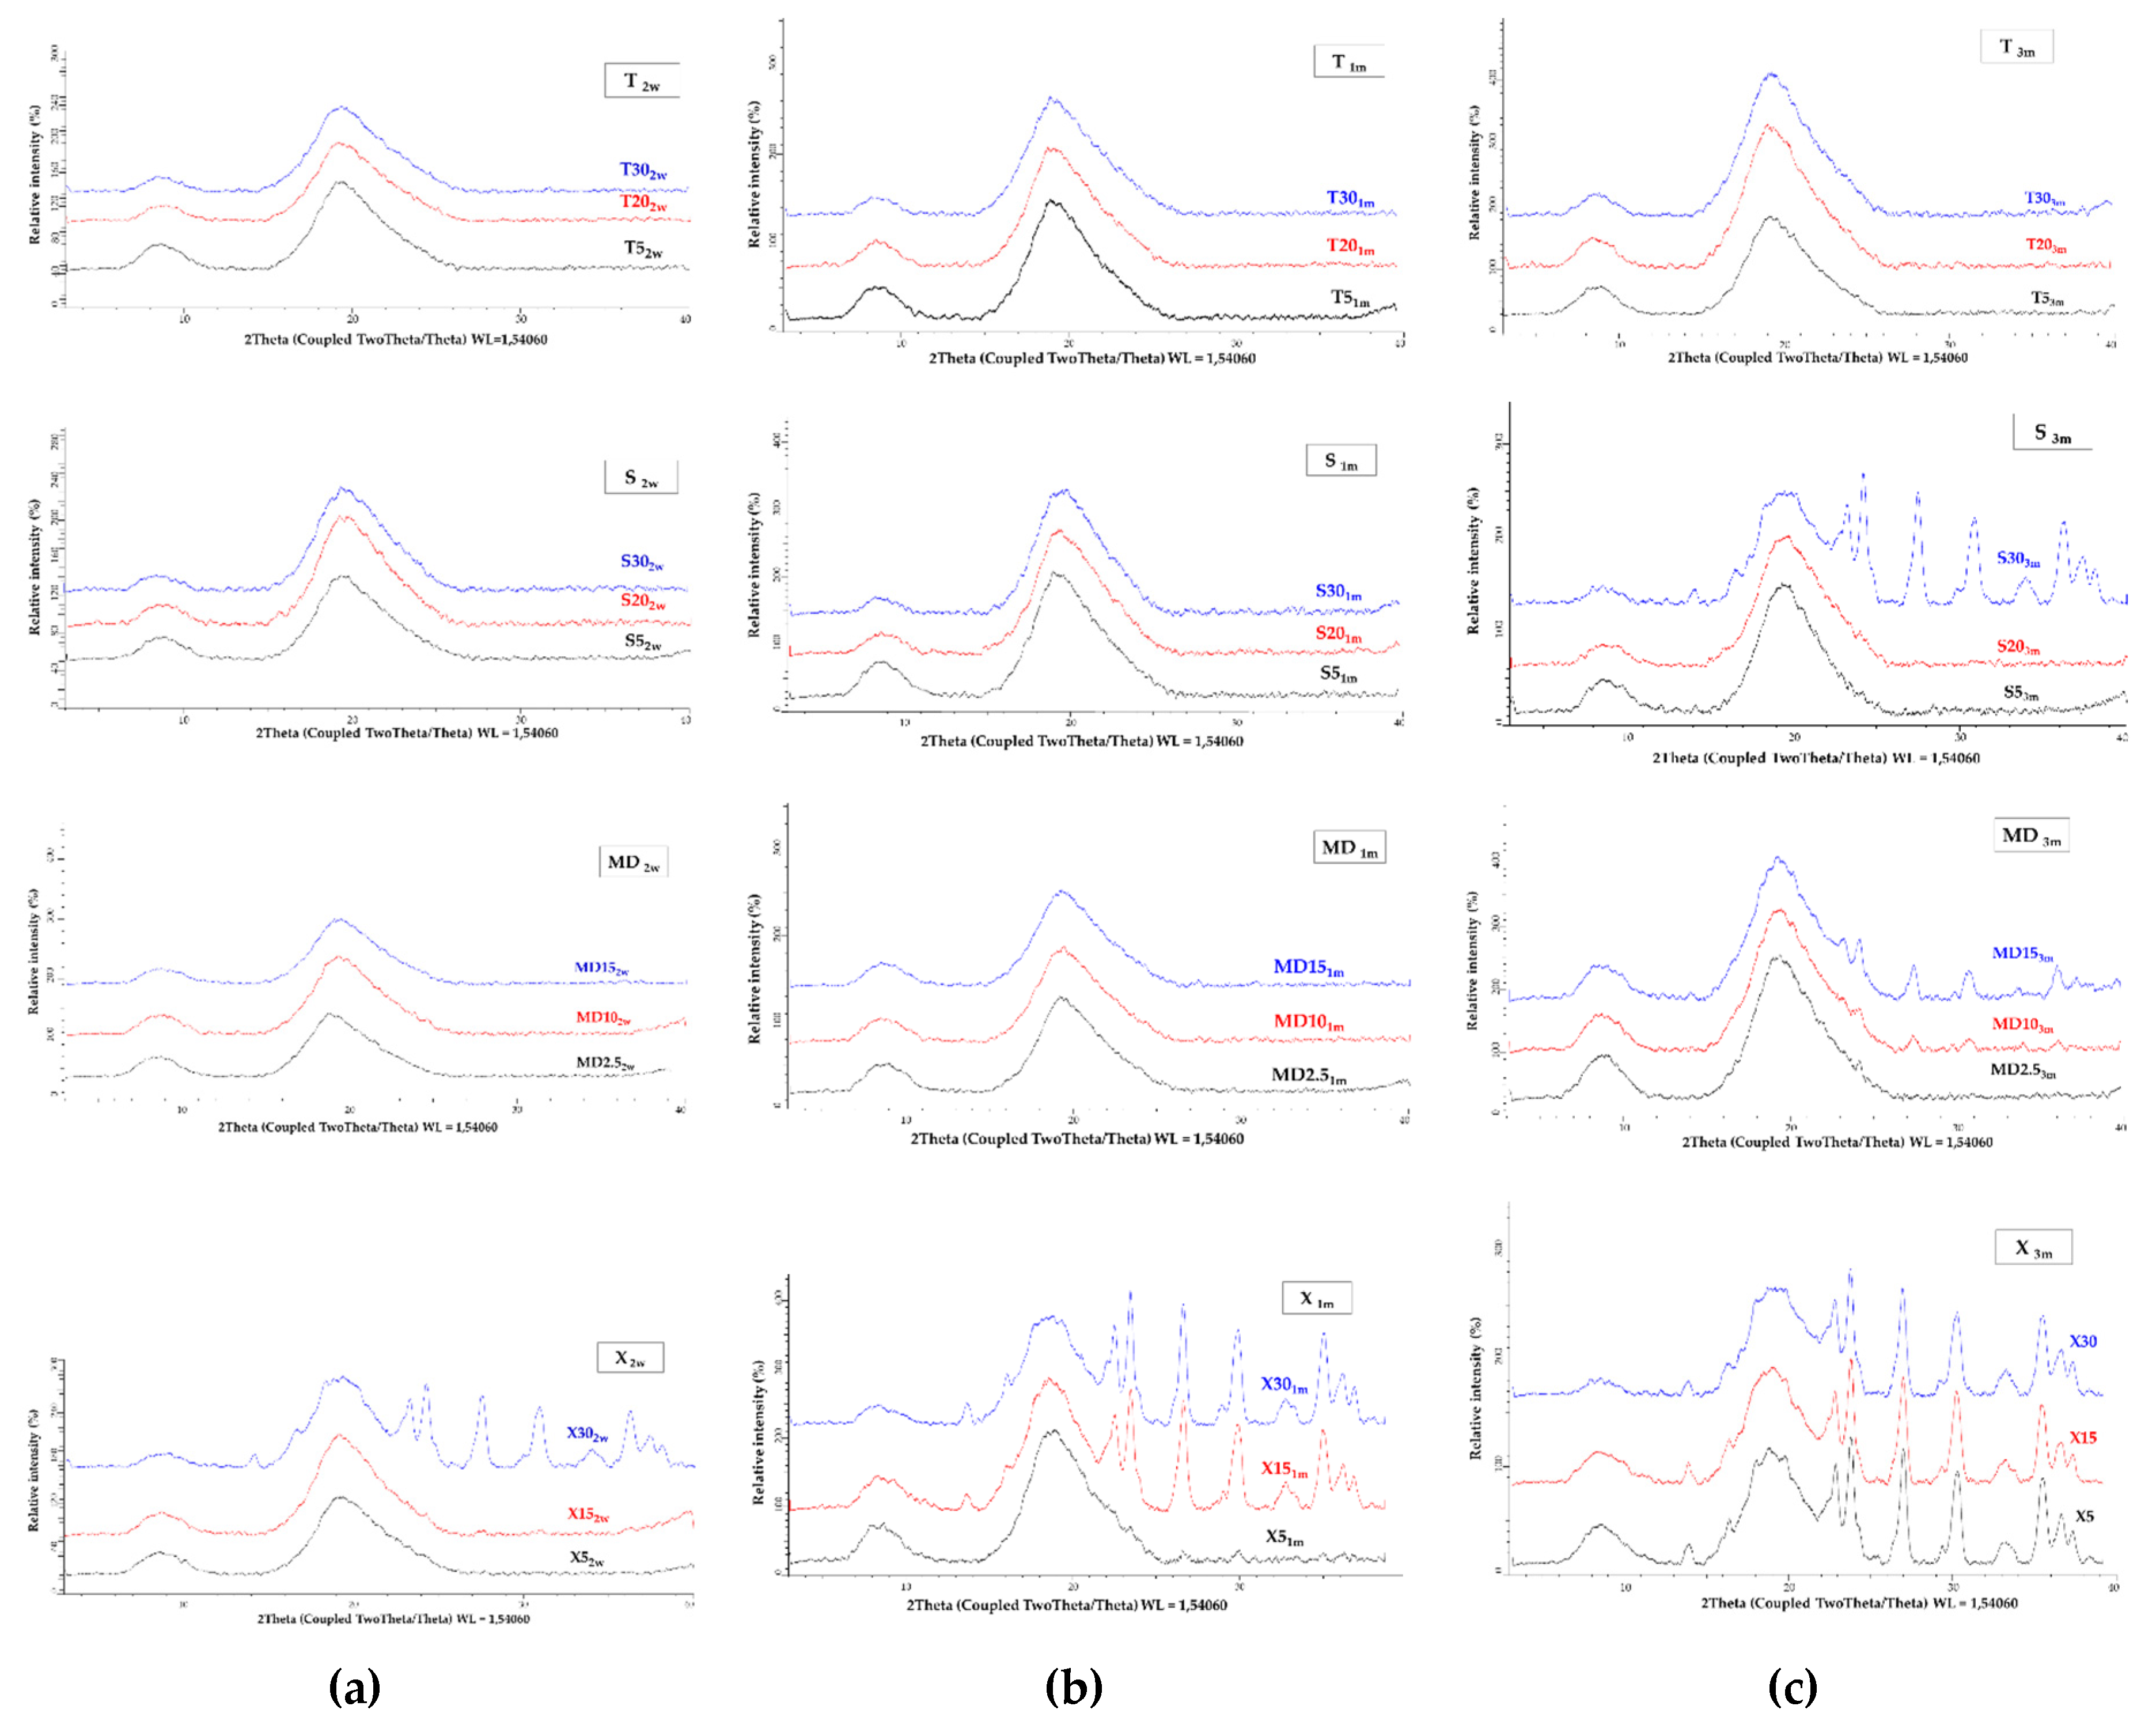
Figure 10.
Scanning electron micrographs for powders / MC after the 3 months of accelerated stability test: (a) GW03m; (b) T53m, T203m, T303m; (c) S53m, S203m, S303m; (d) MD2.53m, MD103m, MD153m; and (e) X53m, X153m, X303m.
Figure 10.
Scanning electron micrographs for powders / MC after the 3 months of accelerated stability test: (a) GW03m; (b) T53m, T203m, T303m; (c) S53m, S203m, S303m; (d) MD2.53m, MD103m, MD153m; and (e) X53m, X153m, X303m.
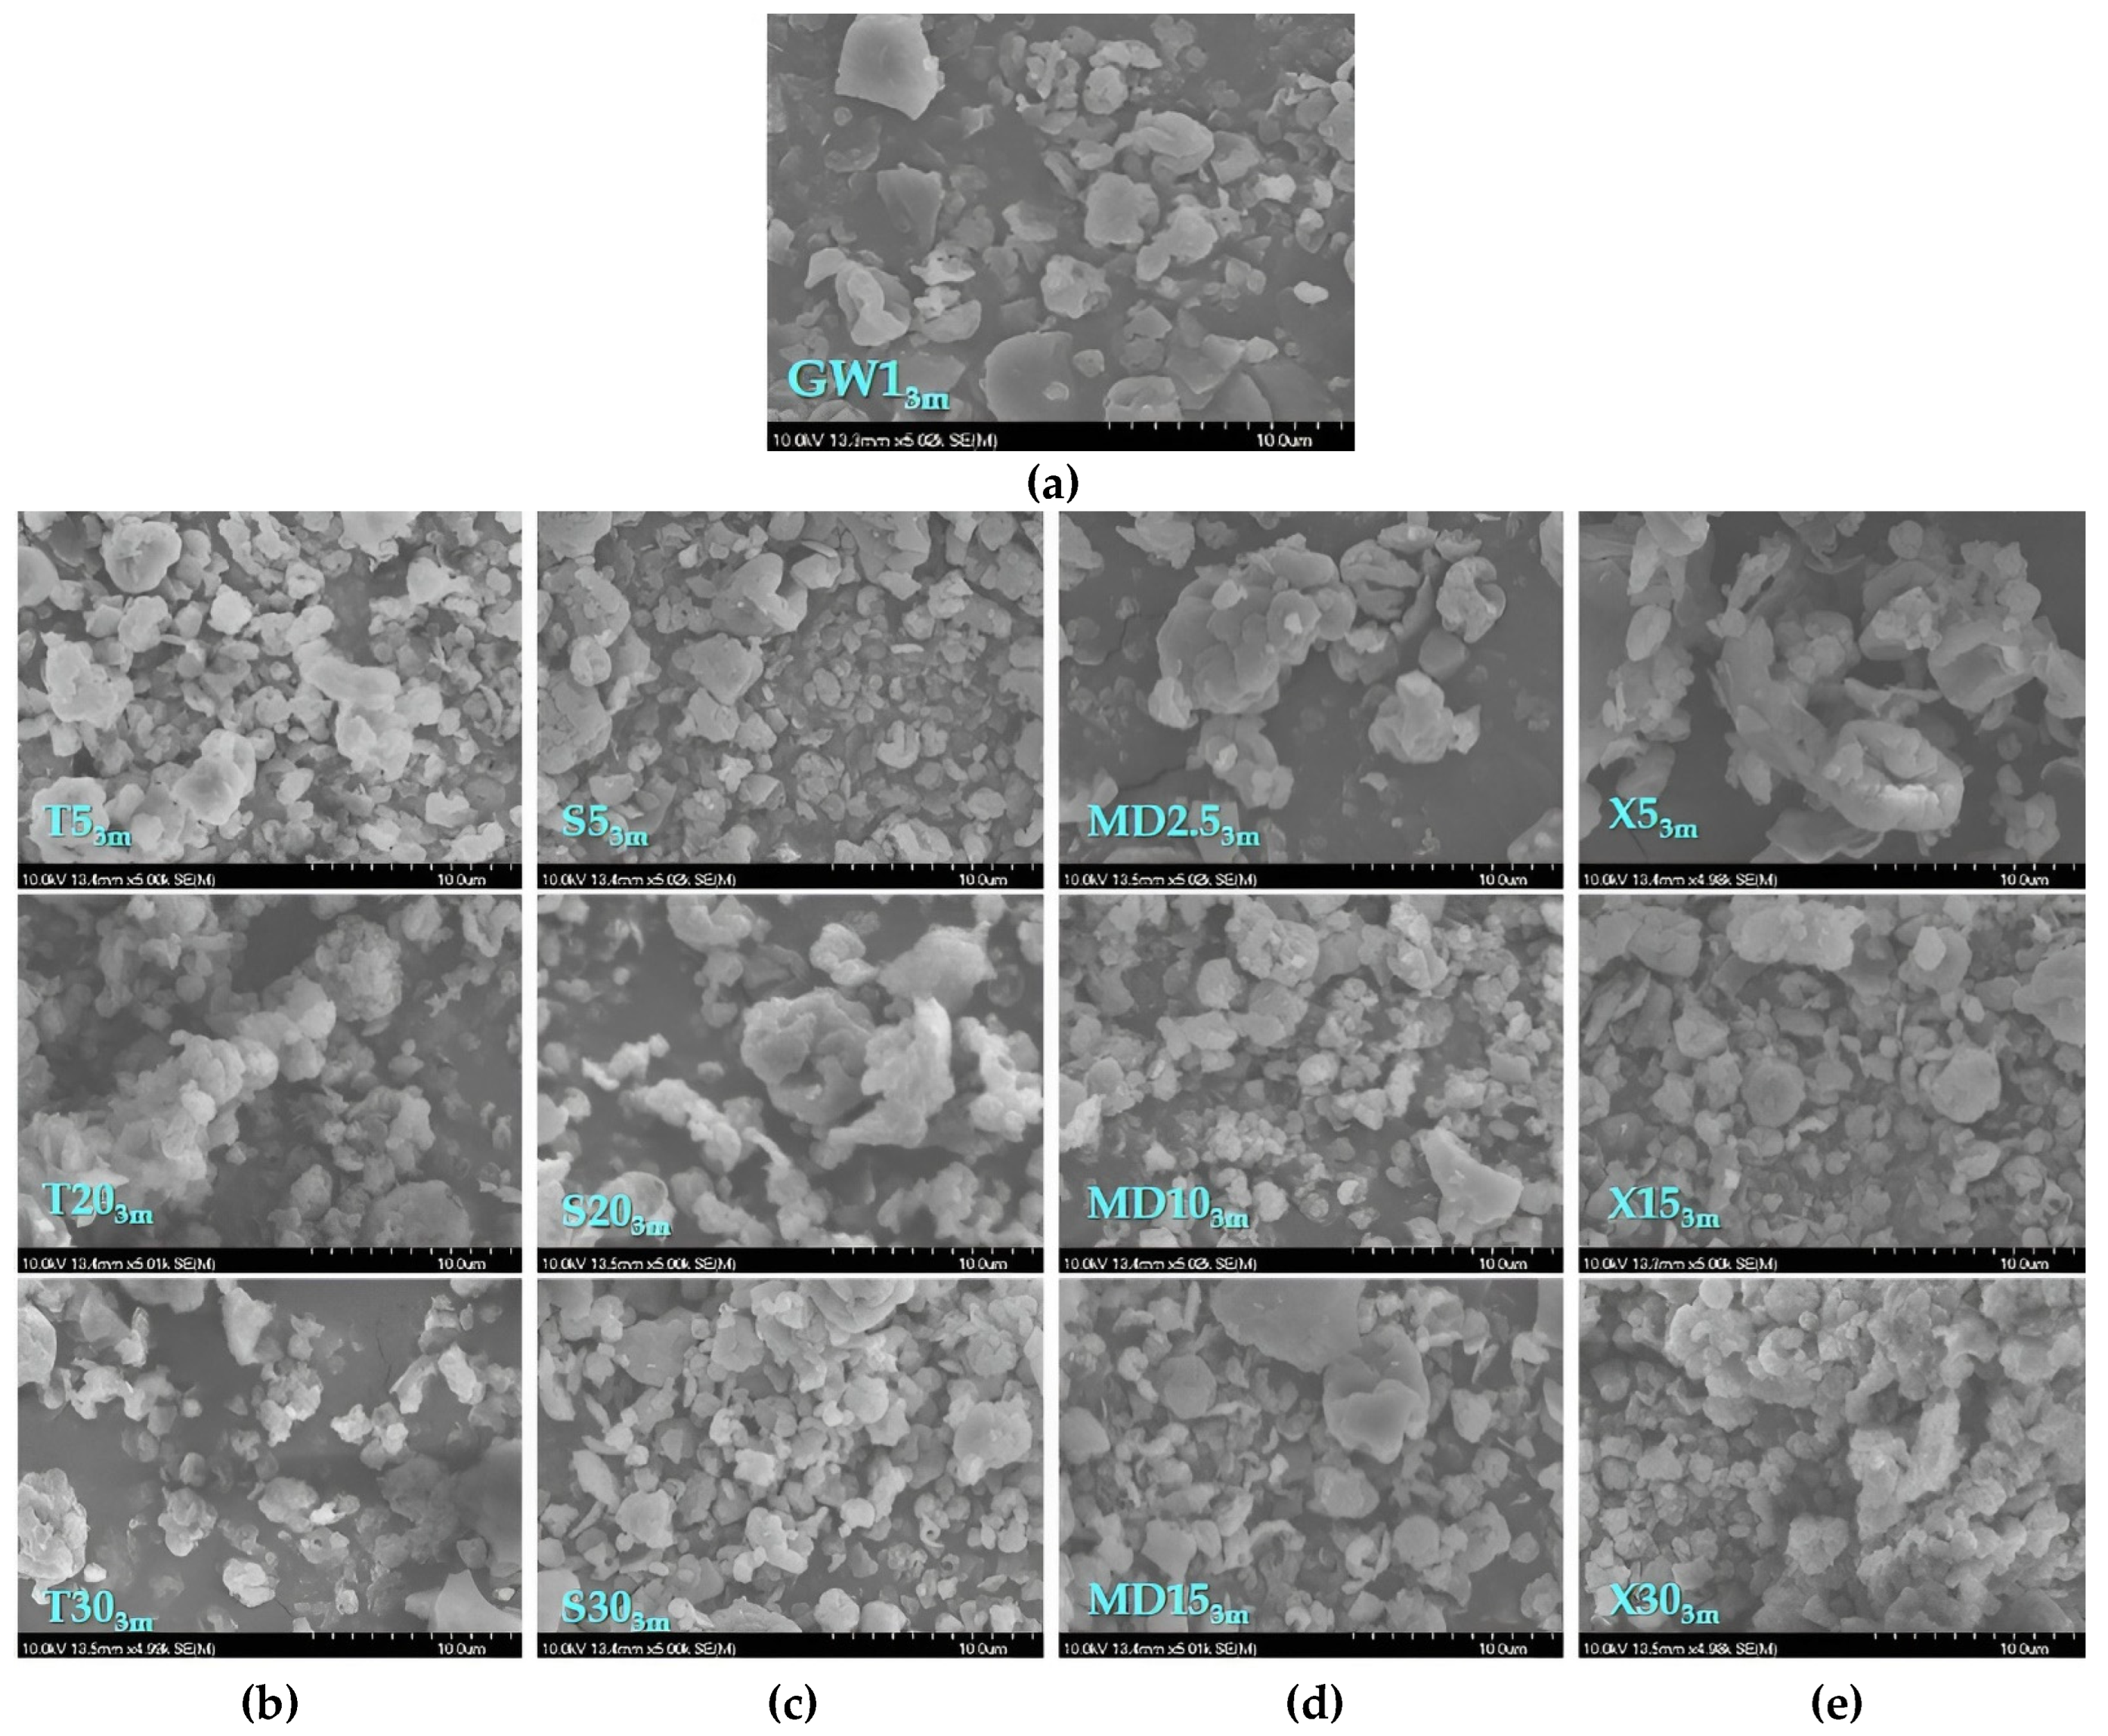

Table 1.
Percentage ratio of coating and co-coating in various encapsulation sets of encapsulations of GPE.
Table 1.
Percentage ratio of coating and co-coating in various encapsulation sets of encapsulations of GPE.
| Sample Label | Coating | (%) | Co-coating | (%) |
|---|---|---|---|---|
| GW1 | goat whey protein | 100 | - | - |
| T5 | goat whey protein | 95 | trehalose | 5 |
| T10 | goat whey protein | 90 | trehalose | 10 |
| T20 | goat whey protein | 80 | trehalose | 20 |
| T30 | goat whey protein | 70 | trehalose | 30 |
| S5 | goat whey protein | 95 | sucrose | 5 |
| S10 | goat whey protein | 95 | sucrose | 10 |
| S20 | goat whey protein | 90 | sucrose | 20 |
| S30 | goat whey protein | 80 | sucrose | 30 |
| MD2.5 | goat whey protein | 97.5 | maltodextrin (DE 4-7) | 2.5 |
| MD5 | goat whey protein | 95 | maltodextrin (DE 4-7) | 5 |
| MD10 | goat whey protein | 90 | maltodextrin (DE 4-7) | 10 |
| MD15 | goat whey protein | 85 | maltodextrin (DE 4-7) | 15 |
| X5 | goat whey protein | 95 | xylose | 5 |
| X10 | goat whey protein | 90 | xylose | 10 |
| X15 | goat whey protein | 85 | xylose | 15 |
| X30 | goat whey protein | 70 | xylose | 30 |
Table 2.
Total phenolic content (TPC) and surface phenolic content (SPC) of microcapsules (MC) prepared by spray draying with various coating(s).
Table 2.
Total phenolic content (TPC) and surface phenolic content (SPC) of microcapsules (MC) prepared by spray draying with various coating(s).
| Sample 1 | TPC (mgGAE/gdb) 2 | SPC (mgGAE/gdb) 2 |
|---|---|---|
| GW1 | 124.09 ± 1.63 i | 5.62 ± 0.34 bc |
| T5 | 102.63 ± 1.19 e | 9.9 ± 0.61 f |
| T10 | 114.37 ± 0.68 g | 10.89 ± 0.54 g |
| T20 | 113.15 ± 0.66 g | 14.21 ± 0.52 i |
| T30 | 98.84 ± 0.85 d | 22.15 ± 0.15 l |
| S5 | 101.47 ± 1.52 e | 8.98 ± 0.53 e |
| S10 | 102.63 ± 0.85 e | 7.70 ± 0.62 d |
| S20 | 97.50 ± 0.81cd | 10.92 ± 0.27 g |
| S30 | 86.81 ± 1.54 a | 16.66 ± 0.67 k |
| MD2.5 | 113.12 ± 1.18 g | 7.12 ± 0,20 d |
| MD5 | 97.38 ± 0.82 c | 4.54 ± 0.27 a |
| MD10 | 96.89 ± 1.33 c | 5.05 ± 0.59 ab |
| MD15 | 93.30 ± 1.38 b | 5.71 ± 0.26 c |
| X5 | 96.78 ± 1.60 c | 8.93 ± 0.49 e |
| X10 | 117.34 ± 1.28 h | 9.89 ± 0.39 f |
| X15 | 104.10 ± 0.95 f | 12.89 ± 0.46 h |
| X30 | 94.12 ± 1.56 b | 15.78 ± 0.34 j |
1 Coatings: GW – goat whey protein, T – trehalose, S – sucrose, X – xylose, MD – maltodextrin (DE 4-7); The proportion of a single (co-)coating in relation to the total mass of the coating: 1 - 100%; 2.5 - 2.5%; 5 - 5%; 10 – 10%; 15 – 15%; 20 – 20%; 30 – 30 %. 2 All data are expressed as mean value of replication ± SD. Different letters (a, b, c…) represent statistically significant differences between the samples (ANOVA, post-hoc Duncan test at p < 0.05).
Table 3.
Size distribution parameters of MC.
| Sample | Mean diameter, d (0.5) (μm) | Specific surface area (m2/g) | Span (-) |
|---|---|---|---|
| GW1 | 3.76 | 2.00 | 2.20 |
| T5 | 3.78 | 2.04 | 2.09 |
| T10 | 3.36 | 2.22 | 2.18 |
| T20 | 3.61 | 2.07 | 2.08 |
| T30 | 3.38 | 2.19 | 2.03 |
| S5 | 3.76 | 2.01 | 1.93 |
| S10 | 3.50 | 2.13 | 2.12 |
| S20 | 3.51 | 2.12 | 1.90 |
| S30 | 3.31 | 2.21 | 1.80 |
| MD2.5 | 4.61 | 1.68 | 2.05 |
| MD5 | 3.88 | 1.97 | 2.02 |
| MD10 | 3.37 | 2.21 | 1.99 |
| MD15 | 3.45 | 2.16 | 2.16 |
| X5 | 3.53 | 2.11 | 1.97 |
| X10 | 3.88 | 1.94 | 1.84 |
| X15 | 3.32 | 2.21 | 1.94 |
| X30 | 3.81 | 1.93 | 1.73 |
Table 4.
Solubility properties of MC: water solubility index (WSI), water adsorption index (WAI), swelling capacity (SP) and polarity.
Table 4.
Solubility properties of MC: water solubility index (WSI), water adsorption index (WAI), swelling capacity (SP) and polarity.
| Sample | WSI (%) | WAI (-) | SP (-) | Polarity (%) |
|---|---|---|---|---|
| GW1 | 57.47 ± 0.54 f | 4.37 ± 0.01 ab | 10.28 ± 0.10 fghi | 46.47 ± 0.32 |
| T5 | 51.40 ± 0.97 cd | 4.82 ± 0.24 efg | 9.92 ± 0.28 defg | 43,93 ± 2,71 |
| T10 | 55.25 ± 0.26 e | 4.68 ± 0.01cde | 10.45 ± 0.03 ghi | 45.99 ± 0.89 |
| T20 | 56.46 ± 0.69 ef | 4.67 ± 0.13 cde | 10.74 ± 0.14 hi | 44.80 ± 1.23 |
| T30 | 55.63 ± 0.22 e | 4.24 ± 0.07 a | 9.56 ± 0.10 cdef | 44.78 ± 1.17 |
| S5 | 50.78 ± 0.80 bcd | 4.64 ± 0.37 bcde | 9.44 ± 0.90 bcde | 40.06 ± 1.19 |
| S10 | 50.83 ± 1.46 bcd | 4.96 ± 0.44 fgh | 10.07 ± 0.59 efgh | 44.01 ± 0.36 |
| S20 | 49.55 ± 1.36 b | 4.62 ± 0.01 bcde | 9.15 ± 0.23 bc | 48.39 ± 1.25 |
| S30 | 57.68 ± 2.48 f | 4.57 ± 0.13 bcde | 10.80 ± 0.33 i | 48.25 ± 0.93 |
| MD2.5 | 49.63 ± 2.21bc | 4.41 ± 0.04 abc | 8.77 ± 0.46 ab | 36.46 ± 1.74 |
| MD5 | 51.17 ± 1.86 bcd | 4.7 ± 0.04 def | 9.64 ± 0.46 cdef | 47.82 ± 1.62 |
| MD10 | 50.79 ± 0.15 bcd | 4.55 ± 0.12 bcde | 9.25 ± 0.28 bcd | 41.50 ± 1.72 |
| MD15 | 43.91 ± 0.21 a | 4.55 ± 0.04 bcd | 8.11 ± 0.04 a | 41.24 ± 0.28 |
| X5 | 51.80 ± 0.19 d | 5.18 ± 0.63 h | 10.75 ± 1.27 hi | 40.65 ± 0.18 |
| X10 | 62.62 ± 4.20 g | 5.08 ± 0.00 gh | 13.68 ± 1.52 k | 43.85 ± 0.51 |
| X15 | 62.59 ± 0.40 g | 4.60 ± 0.13 bcde | 12.31 ± 0.49 j | 43.42 ± 0.63 |
| X30 | 63.15 ± 0.07 g | 5.13 ± 0.22 h | 13.93 ± 0.58 k | 47.42 ± 2.36 |
All data are expressed as mean value of replication ± SD. Different letters (a, b, c…) represent statistically significant differences between the samples (ANOVA, post-hoc Duncan test at p < 0.05).
Table 5.
Individual phenolic compounds before digestion and during different stages of in vitro simulated digestion.
Table 5.
Individual phenolic compounds before digestion and during different stages of in vitro simulated digestion.
| Phenols / Sample | Before Digestion | Oral Phase | Gastric Phase | Intestinal Phase | ||
|---|---|---|---|---|---|---|
| OP3 | GP63 | GP123 | IP183 | IP243 | ||
| Gallic acid (μg/gdb) | ||||||
| GW1 | 732.71 ± 0.41 | nd | nd | nd | 229.21 ± 39.59 | 244.16 ± 29.77 |
| T10 | 827.66 ± 8.45 | 5.28 ± 0.15 | 9.19 ± 0.15 | 9.72 ± 0.30 | 268.69 ± 7.17 | 230.88 ± 7.47 |
| S10 | 754.16 ± 4.09 | 4.93 ± 0.22 | 9.11 ± 0.90 | 8.37 ± 0.15 | 371.44 ± 3.90 | 216.55 ± 3.00 |
| MD5 | 959.15 ± 3.04 | 5.36 ± 0.23 | 10.41 ± 0.30 | 11.15 ± 0.15 | 288.51 ± 1.80 | 161.04 ± 2.40 |
| X10 | 854.20 ± 10.44 | 6.33 ± 0.60 | 7.60 ± 0.30 | 7.81 ± 0.00 | 301.31 ± 8.06 | 177.58 ± 5.08 |
| 3,4-dihidroxybenzoic acid (μg/gdb) | ||||||
| GW1 | 60.22 ± 0.21 | nd | nd | nd | 136.60 ± 5.66 | 149.23 ± 9.23 |
| T10 | 66.10 ± 9.22 | nd | nd | nd | 106.89 ± 1.79 | 143.64 ± 2.99 |
| S10 | 71.63 ± 0.48 | nd | nd | nd | 65.90 ± 7.49 | 51.06 ± 0.90 |
| MD5 | 79.60 ± 0.29 | nd | nd | nd | 61.82 ± 3.30 | 33.99 ± 3.00 |
| X10 | 69.38 ± 2.24 | nd | nd | nd | 53.21 ± 4.18 | 52.15 ± 3.28 |
| p-hidroxybenzoic acid (μg/gdb) | ||||||
| GW1 | 18.39 ± 1.23 | 5.00 ± 7.07 | 6.42 ± 9.08 | 3.89 ± 5.51 | 10.73 ± 15.18 | 8.84 ± 12.50 |
| T10 | 27.76 ± 2.99 | 18.75 ± 3.51 | 25.45 ± 2.54 | 20.91 ± 2.09 | 31.47 ± 3.29 | 27.67 ± 0.30 |
| S10 | 32.50 ± 0.72 | 18.86 ± 0.15 | 24.05 ± 1.35 | 16.32 ± 0.90 | 46.40 ± 1.50 | 37.72 ± 5.99 |
| MD5 | 28.67 ± 1.25 | 22.15 ± 2.03 | 16.68 ± 3.46 | 15.51 ± 0.60 | 55.66 ± 3.61 | 52.05 ± 3.91 |
| X10 | 14.80 ± 0.32 | 19.74 ± 2.09 | 27.13 ± 0.75 | 22.59 ± 0.30 | 61.23 ± 4.18 | 58.49 ± 4.48 |
| Procyanidin B1 (μg/gdb) | ||||||
| GW1 | 1121.04 ± 48.47 | 271.00 ± 15.93 | nd | nd | nd | nd |
| T10 | 1054.90 ± 26.64 | 173.06 ± 6.20 | 113.75 ± 25.84 | nd | nd | nd |
| S10 | 923.51 ± 40.55 | 203.04 ± 10.11 | 39.52 ± 8.24 | nd | nd | nd |
| MD5 | 1329.88 ± 61.03 | 270.93 ± 7.29 | nd | nd | nd | nd |
| X10 | 987.87 ± 90.96 | 167.97 ± 8.06 | 163.53 ± 4.93 | nd | nd | nd |
| Catehin (μg/gdb) | ||||||
| GW1 | 4675.02 ± 99.35 | nd | nd | nd | 601.56 ± 35.72 | 701.54 ± 29.47 |
| T10 | 5928.03 ± 65.47 | nd | nd | nd | 495.78 ± 1.49 | 591.47 ± 22.11 |
| S10 | 4861.45 ± 80.73 | nd | nd | nd | 593.28 ± 47.35 | 630.58 ± 47.35 |
| MD5 | 5325.62 ± 14.85 | nd | nd | nd | 496.92 ± 12.32 | 249.84 ± 2.40 |
| X10 | 4359.75 ± 12.53 | nd | nd | nd | 459.25 ± 2.09 | 488.60 ± 37.62 |
| Vanillic acid (μg/gdb) | ||||||
| GW1 | 41.55 ± 0.54 | nd | nd | nd | 18.94 ± 2.38 | 22.73 ± 0.00 |
| T10 | 45.35 ± 0.41 | nd | nd | nd | 18.80 ± 0.30 | 18.17 ± 0.60 |
| S10 | 42.66 ± 0.66 | nd | nd | nd | 15.26 ± 2.40 | 16.53 ± 0.00 |
| MD5 | 47.55 ± 0.24 | nd | nd | nd | 16.57± 0.00 | 12.53 ± 0.30 |
| X10 | 35.28 ± 0.66 | nd | nd | nd | 17.53 ± 0.30 | 14.36 ± 0.00 |
| Caffeic acid (μg/gdb) | ||||||
| GW1 | 23.97 ± 0.28 | 3.16 ± 0.15 | nd | nd | nd | nd |
| T10 | 21.89 ± 0.13 | 3.64 ± 0.67 | nd | nd | nd | nd |
| S10 | 19.78 ± 0.29 | 4.45 ± 0.75 | nd | nd | nd | nd |
| MD5 | 21.49 ± 0.25 | 3.93 ± 0.00 | nd | nd | nd | nd |
| X10 | 17.21 ± 0.50 | 3.17 ± 0.75 | nd | nd | nd | nd |
| Chlorogenic acid (μg/gdb) | ||||||
| GW1 | 81.32 ± 1.73 | nd | nd | nd | nd | nd |
| T10 | 67.99 ± 4.58 | nd | nd | nd | nd | nd |
| S10 | 77.79 ± 1.30 | nd | nd | nd | nd | nd |
| MD5 | 89.30 ± 2.33 | nd | nd | nd | nd | nd |
| X10 | 70.14 ± 1.01 | nd | nd | nd | nd | nd |
| Syringic acid (μg/gdb) | ||||||
| GW1 | 122.55 ± 1.83 | 1.47 ± 0.45 | nd | nd | nd | nd |
| T10 | 204.17 ± 4.07 | nd | nd | nd | nd | nd |
| S10 | 182.78 ± 0.80 | nd | nd | nd | nd | nd |
| MD5 | 199.24 ± 1.55 | nd | nd | nd | nd | nd |
| X10 | 158.92 ± 1.30 | nd | nd | nd | nd | nd |
| Procyanindin B2 (μg/gdb) | ||||||
| GW1 | 1034.65 ± 105.81 | 117.08 ± 1.71 | nd | 24.31 ± 0.74 | 348.77 ± 2.08 | 466.01 ± 45.84 |
| T10 | 1060.26 ± 49.77 | 110.95 ± 5.60 | 135.51 ± 2.54 | 30.84 ± 1.79 | 57.03 ± 13.74 | 91.47 ± 8.66 |
| S10 | 1401.46 ± 31.99 | 172.48 ± 4.49 | 130.73 ± 7.19 | 73.84 ± 12.44 | 83.91 ± 8.99 | 85.39 ± 3.90 |
| MD5 | 1158.63 ± 54.88 | 131.82 ± 6.16 | 55.66 ± 12.62 | nd | 58.85 ± 14.12 | 37.18 ± 2.70 |
| X10 | 883.58 ± 41.05 | 186.97 ± 13.44 | 119.72 ± 9.26 | 50.68 ± 3.88 | 82.98 ± 10.45 | 61.87 ± 11.05 |
| Epicatechin (μg/gdb) | ||||||
| GW1 | 3284.86 ± 10.78 | 1228.00 ± 28.58 | 335.93 ± 5.66 | 360.35 ± 3.57 | 152.39 ± 0.60 | 97.03 ± 4.46 |
| T10 | 4001.84 ± 38.51 | 1122.73 ± 107.10 | 1074.57 ± 44.21 | 572.88 ± 16.13 | 336.92 ± 2.09 | 335.87 ± 27.48 |
| S10 | 3238.02 ± 50.81 | 1361.43 ± 23.60 | 824.03 ± 27.57 | 570.72 ± 11.84 | 263.59 ± 10.19 | 223.96 ± 11.69 |
| MD5 | 3650.18 ± 5.68 | 1092.79 ± 74.44 | 504.14 ± 36.65 | 334.93 ± 9.16 | 215.42 ± 14.42 | 193.97 ± 2.10 |
| X10 | 2012.11 ± 49.61 | 1154.77 ± 8.96 | 657.73 ± 5.37 | 467.91 ± 0.00 | 255.70 ± 8.06 | 266.89 ± 1.79 |
| p-coumaric acid (μg/gdb) | ||||||
| GW1 | 11.55 ± 0.08 | nd | nd | nd | nd | nd |
| T10 | 10.61 ± 0.17 | nd | nd | nd | nd | nd |
| S10 | 9.82 ± 0.09 | nd | nd | nd | nd | nd |
| MD5 | 14.13 ± 0.11 | nd | nd | nd | nd | nd |
| X10 | 6.61 ± 0.59 | nd | nd | nd | nd | nd |
| Galocatechin gallate (μg/gdb) | ||||||
| GW1 | 1229.93 ± 25.65 | nd | 680.38 ± 16.52 | 659.44 ± 3.57 | 2117.66 ± 24.11 | 2144.18 ± 10.42 |
| T10 | 1403.32 ± 57.59 | nd | 812.21 ± 22.11 | nd | 2050.27 ± 1.79 | 2188.42 ± 23.90 |
| S10 | 1475.91 ± 9.08 | nd | 781.33 ± 10.04 | 766.82 ± 26.97 | 2095.56 ± 40.15 | 2137.09 ± 14.98 |
| MD5 | 1393.36 ± 7.50 | nd | 735.29 ± 3.00 | 779.80 ± 23.28 | 1951.14 ± 20.43 | 1840.88 ± 19.53 |
| X10 | 1259.73 ± 12.22 | nd | nd | 768.79 ± 24.78 | 1969.17 ± 53.15 | 1893.16 ± 38.82 |
| Ferulic acid (μg/gdb) | ||||||
| GW1 | 3.47 ± 0.06 | nd | nd | nd | 4.21 ± 1.79 | 11.79 ± 0.00 |
| T10 | 3.80 ± 0.11 | nd | nd | nd | 12.04 ± 2.09 | 16.69 ± 2.09 |
| S10 | 3.73 ± 0.04 | nd | nd | nd | 11.23 ± 0.30 | 14.83 ± 2.40 |
| MD5 | 4.95 ± 0.15 | nd | nd | nd | 11.90 ± 0.00 | 7.65 ± 0.00 |
| X10 | 4.12 ± 0.58 | nd | nd | nd | 15.84 ± 0.30 | 10.77 ± 0.30 |
| Epicatechin gallate (μg/gdb) | ||||||
| GW1 | 168.75 ± 3.24 | nd | nd | nd | 384.76 ± 4.17 | 491.69 ± 16.07 |
| T10 | 221.77 ± 16.62 | nd | nd | nd | 566.12 ± 2.99 | 628.64 ± 5.38 |
| S10 | 184.63 ± 7.28 | nd | nd | nd | 380.97 ± 28.77 | 660.24 ± 32.96 |
| MD5 | 260.80 ± 10.43 | nd | nd | nd | 217.55 ± 13.82 | 370.51 ± 12.62 |
| X10 | 181.83 ± 0.81 | nd | nd | nd | 553.63 ± 33.44 | 572.00 ± 19.41 |
| o-coumaric acid (μg/gdb) | ||||||
| GW1 | 13.49 ± 0.17 | 58.62 ± 2.68 | 15.05 ± 0.74 | 21.36 ± 0.15 | 49.67 ± 1.19 | 98.72 ± 6.85 |
| T10 | 15.19 ± 0.89 | 93.42 ± 4.85 | 161.70 ± 2.54 | 88.61 ± 1.05 | 48.16 ± 4.78 | 71.61 ± 2.69 |
| S10 | 12.78 ± 0.58 | 116.91 ± 0.22 | 102.77 ± 0.30 | 34.54 ± 2.70 | 63.14 ± 0.60 | 50.01 ± 4.79 |
| MD5 | 14.87 ± 0.39 | 75.69 ± 4.73 | 18.91 ± 3.00 | 7.75 ± 1.95 | 42.28 ± 0.30 | 38.03 ± 0.30 |
| X10 | 12.64 ± 1.57 | 80.82 ± 3.06 | 44.76 ± 3.88 | 36.95 ± 0.00 | 59.12 ± 2.99 | 50.46 ± 2.09 |
| Ellagic acid (μg/gdb) | ||||||
| GW1 | 84.07 ± 0.86 | nd | nd | nd | nd | nd |
| T10 | 100.32 ± 2.25 | nd | nd | nd | nd | nd |
| S10 | 90.88 ± 2.30 | nd | nd | nd | nd | nd |
| MD5 | 87.67 ± 2.97 | nd | nd | nd | nd | nd |
| X10 | 83.06 ± 1.90 | nd | nd | nd | nd | nd |
| Rutin (μg/gdb) | ||||||
| GW1 | 159.54 ± 2.11 | nd | nd | nd | nd | nd |
| T10 | 189.07 ± 5.20 | nd | nd | nd | nd | nd |
| S10 | 152.52 ± 0.73 | nd | nd | nd | nd | nd |
| MD5 | 196.83 ± 0.92 | nd | nd | nd | nd | nd |
| X10 | 218.63 ± 9.55 | nd | nd | nd | nd | nd |
| Resveratrol (μg/gdb) | ||||||
| GW1 | 19.93 ± 0.03 | nd | nd | nd | nd | nd |
| T10 | 26.89 ± 0.49 | nd | nd | nd | nd | nd |
| S10 | 23.54 ± 0.29 | nd | nd | nd | nd | nd |
| MD5 | 26.02 ± 0.70 | nd | nd | nd | nd | nd |
| X10 | 20.26 ± 1.38 | nd | nd | nd | nd | nd |
| Kaempferol (μg/gdb) | ||||||
| GW1 | 21.13 ± 0.55 | nd | nd | nd | nd | nd |
| T10 | 20.98 ± 0.20 | nd | nd | nd | nd | nd |
| S10 | 23.69 ± 0.42 | nd | nd | nd | nd | nd |
| MD5 | 25.44 ± 0.15 | nd | nd | nd | nd | nd |
| X10 | 20.21 ± 0.38 | nd | nd | nd | nd | nd |
| Quercetin (μg/gdb) | ||||||
| GW1 | 317.88 ± 2.76 | nd | nd | nd | nd | nd |
| T10 | 395.91 ± 0.58 | nd | nd | nd | nd | nd |
| S10 | 351.92 ± 4.97 | nd | nd | nd | nd | nd |
| MD5 | 359.10 ± 0.23 | nd | nd | nd | nd | nd |
| X10 | 303.78 ± 2.72 | nd | nd | nd | nd | nd |
OP — oral phase, GP — gastric phase, IP — intestinal phase, nd—not detected. Index numbers associated with abbreviations indicate the time interval when a certain sample was taken (i.e., OP3 — 3rd minute of the oral phase). Phenolic contents are expressed as mean value (mg/gdb) ± SD.
Disclaimer/Publisher’s Note: The statements, opinions and data contained in all publications are solely those of the individual author(s) and contributor(s) and not of MDPI and/or the editor(s). MDPI and/or the editor(s) disclaim responsibility for any injury to people or property resulting from any ideas, methods, instructions or products referred to in the content. |
© 2024 by the authors. Licensee MDPI, Basel, Switzerland. This article is an open access article distributed under the terms and conditions of the Creative Commons Attribution (CC BY) license (http://creativecommons.org/licenses/by/4.0/).
Copyright: This open access article is published under a Creative Commons CC BY 4.0 license, which permit the free download, distribution, and reuse, provided that the author and preprint are cited in any reuse.


