Preprint
Article

Typification of Green Coffee and Selected Spices Based on the Analysis of Volatile Compounds and Supervised Learning

Altmetrics

Downloads

123

Views

123

Comments

0

A peer-reviewed article of this preprint also exists.

Submitted:

10 April 2024

Posted:

15 April 2024

You are already at the latest version

Alerts
Abstract
The present study comprises the second part of our previous work that dealt mainly with the phytochemical and physicochemical characterization of green coffee, clove, cinnamon/clove and nutmeg ethanolic extracts of grape origin. In the present study, we focused on producing a discriminating model concerning green coffee, clove, cinnamon, cinnamon and clove, and nutmeg fine powders based on multivariate analysis of variance and supervised learning on data of volatile compounds analysis, carried out with solid phase dynamic extraction in combination with gas chromatography/mass spectrometry. Results showed that 7 volatile compounds namely ethylene, methanol, 3-methylpentane, ethyl acetate, 9-hexadecen-1-ol, toluene, and methyl acetate could differentiate the investigated samples resulting in a 100% classification rate using the cross-validation method of linear discriminant analysis. Results were further confirmed using partial least squares regression analysis. The study contributes to the typification of green coffee, cinnamon, clove, cinnamon and clove and nutmeg, based on selected volatile compounds, and provides further support to the literature by means of possible adulteration given the statistical models developed.
Keywords: 
Subject: Chemistry and Materials Science  -   Food Chemistry

1. Introduction

Spices were used by ancient Egyptians and during the Middle Ages, for flavoring and medicinal purposes, but also for food preservation [1]. Spices have a considerable antioxidant activity that is attributed to the high content of polyphenols, terpenoids and flavonoids [2] and nowadays, some spices are higher in value than others, given their special flavoring, aromatic or coloring properties these have [3]. Muzolf-Panek and Struper-Szablewska [2] reported that the high antioxidant activity of clove (Syzygium aromaticum), is associated with flavonoids, and in general with the total phenolic content. Numerous research studies in the recent literature, have highlighted the importance of phytochemicals to human health. Cinnamon, which has around 250 species (Cinnamomum genus), is one of the most known and used spices around the world [4]. The most important health benefits of cinnamon are its antioxidant activity, antimicrobial properties, and anti-inflammatory effects [5], attributed mainly to its high content of cinnamaldehyde in addition to the considerable eugenol content [6]. Furthermore, a spice that is of great importance in cuisines around the world is nutmeg (Myristica fragrans). Nutmeg consists mainly of essential oils (10%) and lipids (30-40%) and has a distinctive odor due to the presence of terpenoids contained in essential oils [7]. Recent studies proved that nutmeg not only has antioxidant activity, but also a lot of health benefits such as antidysentery, nerve stimulant and anti-inflammatory properties [8]. Regarding beverages, coffee is probably the most famous beverage in the world as well as tea. The main species cultivated is Arabica (Coffea arabica L.) and can be easily adulterated with a different kind of coffee beans, with a lower value, named Robusta coffee (Coffea canephora) [9]. Coffee beans before roasting process contain a high amount of polyphenols and chlorogenic acids like caffeic acid [10,11] which are responsible for their high antioxidant activity [1]. Food typification is a recent and important topic concerning the numerous food scandals that happen nowadays [12]. Among foods of plant origin, spices and beverages, such as coffee, are often subjected to adulteration for many reasons, mostly for their economic value, health-beneficial properties, and their origin [3,12]. Therefore, there is a growing demand by the Food authorities and industry for genuine products. In this context, numerous analytical techniques have been developed to determine food authentication and food fraud, including biological methods, such as polymerase chain reaction (PCR), DNA methods and gel electrophoresis. In addition, chromatographic and spectrometric techniques, are commonly used to identify any food adulteration, like isotope ratio mass spectrometry (IRMS), gas chromatography coupled to mass spectrometry (GC-MS) in combination with solid phase extraction techniques, nuclear magnetic resonance (NMR), inductively coupled plasma optical emission spectrometry (ICP-OES) and others, in combination with chemometrics [13]. Considering the recent literature and motivated by our previous study [1], the main scope of the present work was to identify any key volatile markers of green coffee, clove, cinnamon, cinnamon and clove, and nutmeg powders using supervised learning such as linear discriminant analysis (LDA) and partial least squares regression (PLS) on the data of volatile compounds determined with solid phase dynamic extraction in combination with gas chromatography/mass spectrometry (SPDE/GC-MS), and developing for this purpose, differential equations. The results obtained in the present study might be of interest for the typification and adulteration control of green coffee, clove, cinnamon, cinnamon and clove, and nutmeg. To our knowledge, there is not any recent study with this hypothesis driven herein, this constituting the novelty of the present work.

2. Materials and Methods

2.1. Preparation of Green Coffee, Clove, Cinnamon, Cinnamon and Clove, and Nutmeg Fine Powders

Green coffee (Coffea arabica, Guatemala Jasmin SHB EP), Clove (Syzygium aromaticum, Greece), cinnamon (Cinnamomum burmanni, Indonesia), and nutmeg (Myristica fragrans, Indonesia) were shattered into a fine powder using a blender (Rohnson, Heavy duty, Republic of Korea) prior to the determination of volatile compounds. The mixture of cinnamon and clove samples was prepared by blending equal proportions of the materials (1:1, w/w). All samples were purchased from local stores in Agrinio (Aitoloakarnania, Greece).

2.2. Determination of Volatile Compounds

The volatile compounds of green coffee, clove, cinnamon, cinnamon and clove, and nutmeg powders were identified using solid phase dynamic extraction (SPDE) coupled to gas chromatography/mass spectrometry (GC-MS).

2.3. Extraction of Volatile Compounds

For the extraction of volatile compounds of clove, cinnamon, nutmeg, cinnamon clove and green coffee powders was used an NCT-SPNDL-01/AC-50-74 SPDE Needle 74 mm, 50 μm PDMS/AC coated fiber (BGB Analytik, Germany). Each sample was placed in a 20 mL volume screw- cap vial equipped with PTFE/silicone septa. For the solid phase dynamic extraction (SPDE), those vials were placed in the chamber of an autosampler at incubation temperature of 45 °C. The syringe temperature was 35 °C. The pre-incubation time was 3 minutes, and the condition time was 5 minutes. Between the analysis of each sample, there was 1 minute delay, to avoid any contamination [1].

2.4. Conditions of Analysis and Instrumentation

The samples of green coffee, clove, cinnamon, cinnamon clove, and nutmeg fine powders were subjected to analysis using a Thermos Scientific gas chromatograph (TRACE GC Ultra) connected to an DSQ II mass spectrometer. An Agilent DB-624 UI capillary column was used for the isolation of volatile compounds. The capillary column had the following characteristics: 20 m length × i.d 0.18 mm, × 1 μm film thickness. The temperature program within the oven was as takes after: 40 °C for 5 minutes, expanded to 90 °C at a rate of 15 °C/min (0 min hold), and at last expanded to 220 °C at a rate of 30 °C/min (3 min hold).The temperature in the oven was 250 °C and the ion source temperature was 200 °C. Mass spectra were recorded in the electron impact mode at the ionization voltage of 70 eV. The mass range of the identified compounds was 45–260 (m/z) and the analysis was carried out at the positive mode [1]. Helium served as the carrier gas. Each sample was run in duplicate (n = 2).

2.5. Volatile Compounds Verification

The volatile compounds in the analyzed samples were verified using the mass spectral library (NIST MS Search 2.0) packed in the GC-MS software. For the percentage estimation of the volatile compounds area, the spectral areas of each individual compounds were considered, divided by the total area of the verified volatile compounds:
%Volatile compounds = (Area of the verified compound) ∕ (Total area) × 100

2.6. Statistical Analysis

The average values of the area percent of the verified volatile compounds were treated with multivariate statistical analysis. The average values were compared using multivariate analysis of variance (MANOVA) to indicate any statistically significant (p<0.05) differences in the volatile compounds’ occurrence among the studied samples. The basic rule of MANOVA is to generate any new dependent variables, considering the linear combination of all the dependent variables (i.e., volatile compounds) in the multivariate linear model, which could increase as much as possible the differences in the average values, among the groups of the independent variables (i.e., green coffee, clove, cinnamon, cinnamon and clove, and nutmeg fine powders). Normally, in MANOVA the basic tests of the multivariate testing are computed (Wilks' Lambda and Pillai's Trace test statistics) to indicate and record the main effects and interaction of the independent variables at the multidimensional level [14]. Another important information that is shown during MANOVA is the effectiveness of the sample size used in the analysis. The effectiveness of the sample size is monitored by the observed power. Regarding power, this is the probability of rejecting the hypothesis that the means are equal when these are in fact not equal. Many parameters in MANOVA affect the power: i) sample size, ii) the magnitudes of the variances, iii) the level of significance (alpha level), and iv) the actual difference among the population means in each group of objects. However, the concept of this analysis is the high power. The high-power indicates that there is a high probability of rejecting the null hypothesis when the null hypothesis is false [15].
LDA is a supervised statistical technique that aims to find a linear combination of the statistically significant objects of interest (i.e., volatile compounds indicated during MANOVA, parameter X) that separate two or more groups of objects (i.e., green coffee, clove, cinnamon, cinnamon and clove, and nutmeg, parameter Y):
Y = a1X1 + a2X2 +……anXn
where
a1, a2, ……….an are the discriminant function coefficients.
The suitability of the prediction ability of the LDA models was evaluated by the cross-validation method during which each case is classified by the functions derived from all cases other than that particular case [15]. Regarding the LDA analysis, the green coffee, and spices groups (studied samples) were considered as the factor variable (grouping variable), while the data of the volatile compounds as the independent variables. Data were further evaluated using partial least squares (PLS) regression analysis, commonly known as projection to latent structure. The Variables Importance in Projection (VIP) scores were calculated for each volatile compound (component) and those having values greater than 1 were considered in the analysis as potential volatile indicators of the studied matrices [16]. The statistical treatment of data was accomplished using the SPSS statistics software (version 28.0, IBM Inc., 2021).

3. Results

3.1. Volatile Compounds in Green Coffee and Selected Spices

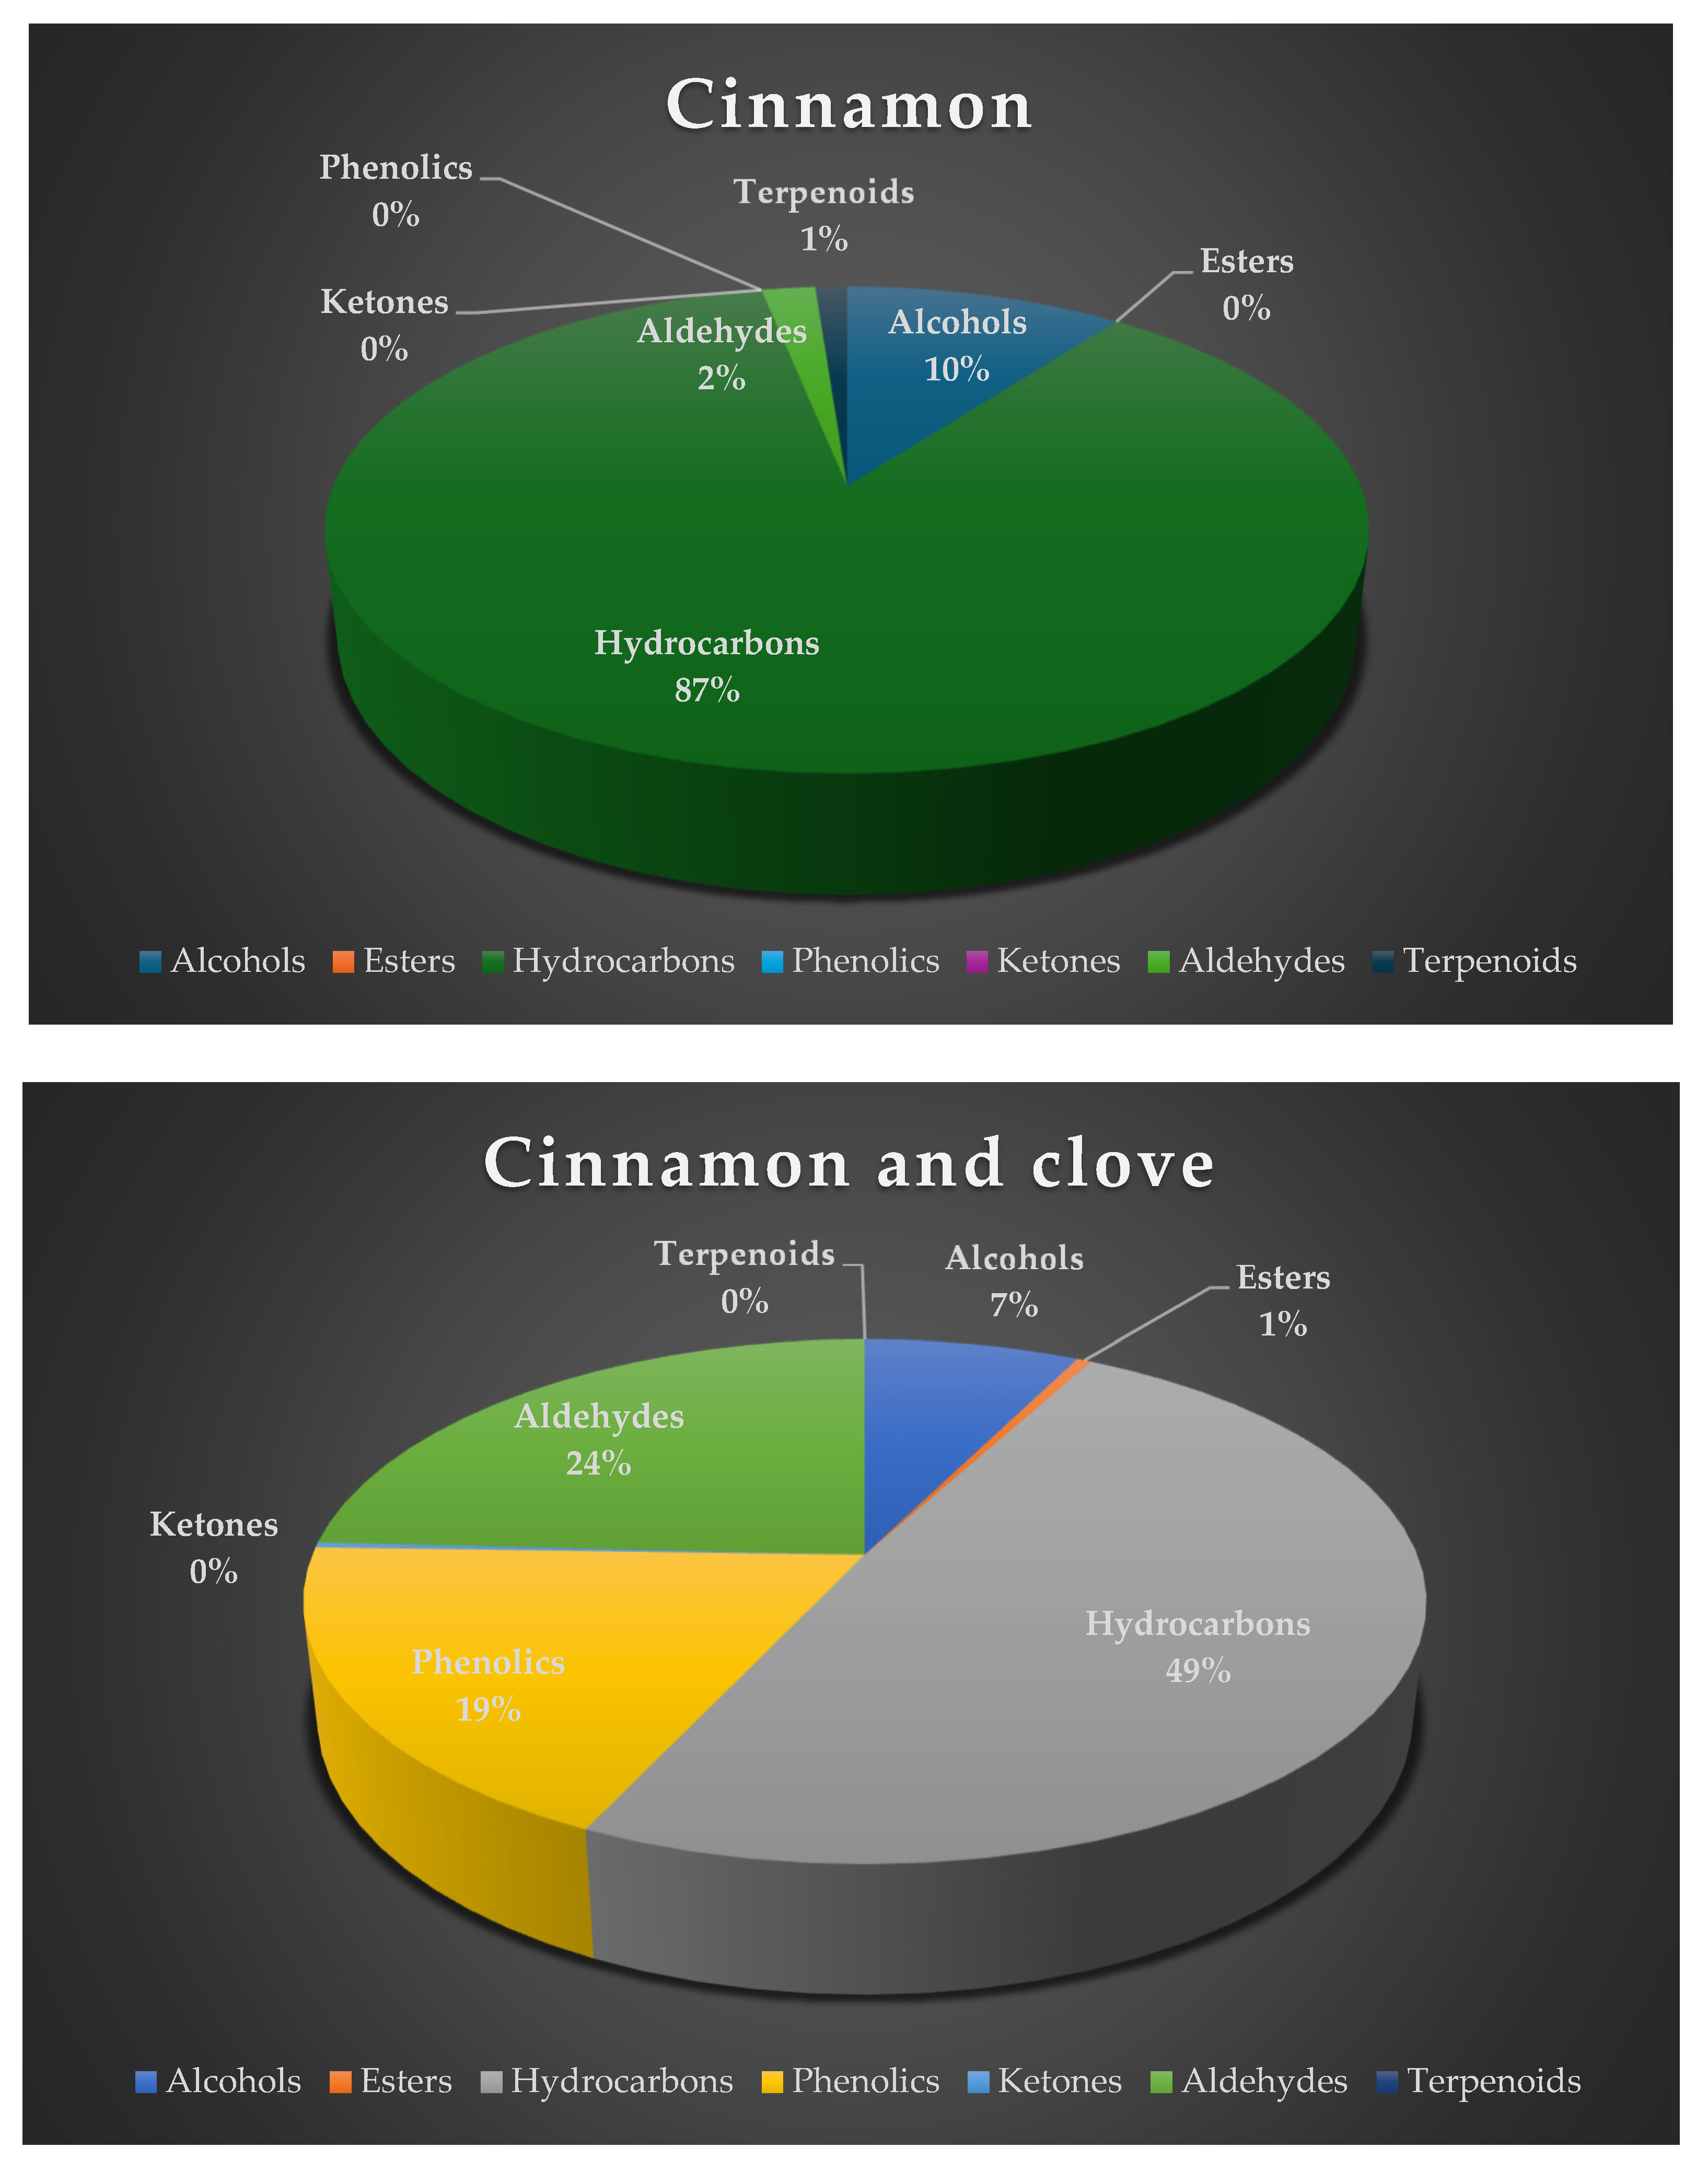
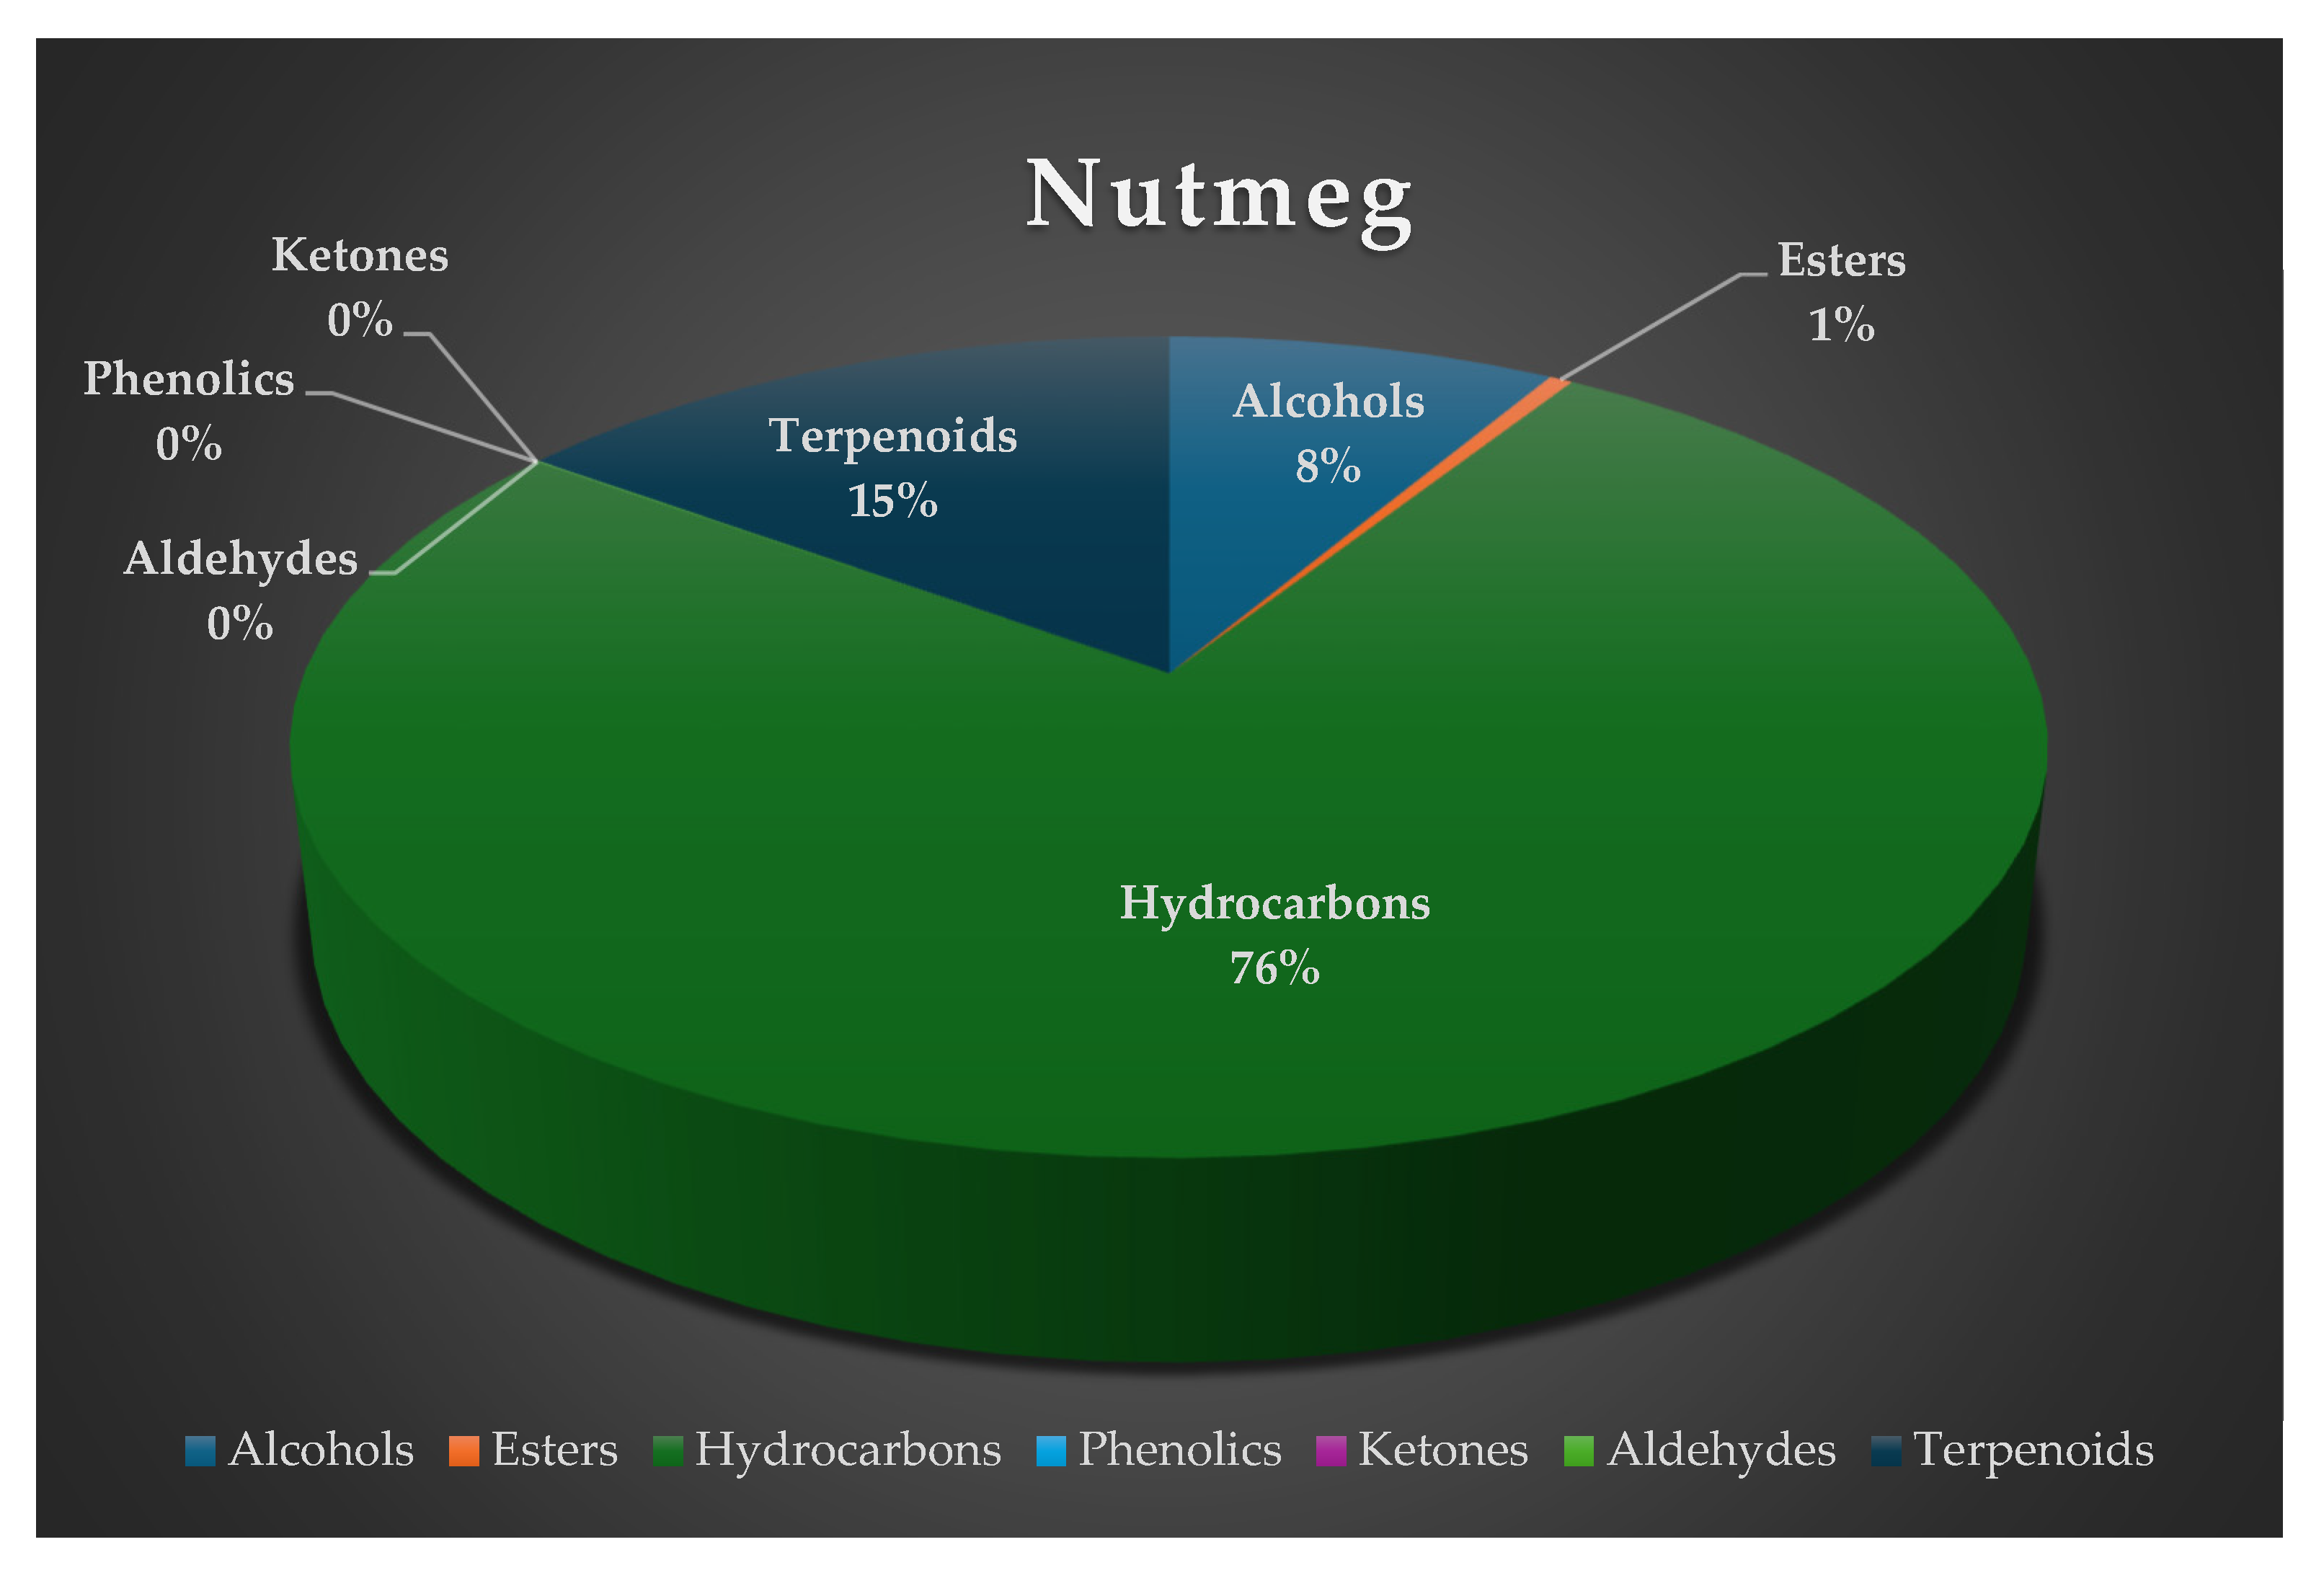
The number of the identified volatile compounds using SPDE-GC/MS in green coffee, clove, cinnamon, cinnamon and clove and nutmeg was 60. In our previous study [1] we classified the identified compounds in those with higher and lower probability level according to NIST mass spectral library and non- supervised statistical methods such as factor analysis showed the impact of these compounds on the purity control of the studied samples (green coffee, cinnamon and clove, and nutmeg). In addition, not any volatile compounds’ data were reported previously [1], until now, for the individual samples of cinnamon and clove. Meta-data analysis on the collected results carried out more recently, showed that 16 volatile compounds could be used for the classification of samples. As it can be seen in Table 1 the volatile compounds belong to different classes such as alcohols, esters, hydrocarbons, ketones, phenolic compounds, terpenoids, and vitamin derivatives. What is worth noting is that the proportions of these volatile compounds are associated to the origin of the studied samples given the significant (p<0.05) differences that were observed during MANOVA (Table 1). In addition, significant (p<0.05) differences were also observed for the specific classes of the identified compounds (Figure 1a-e).
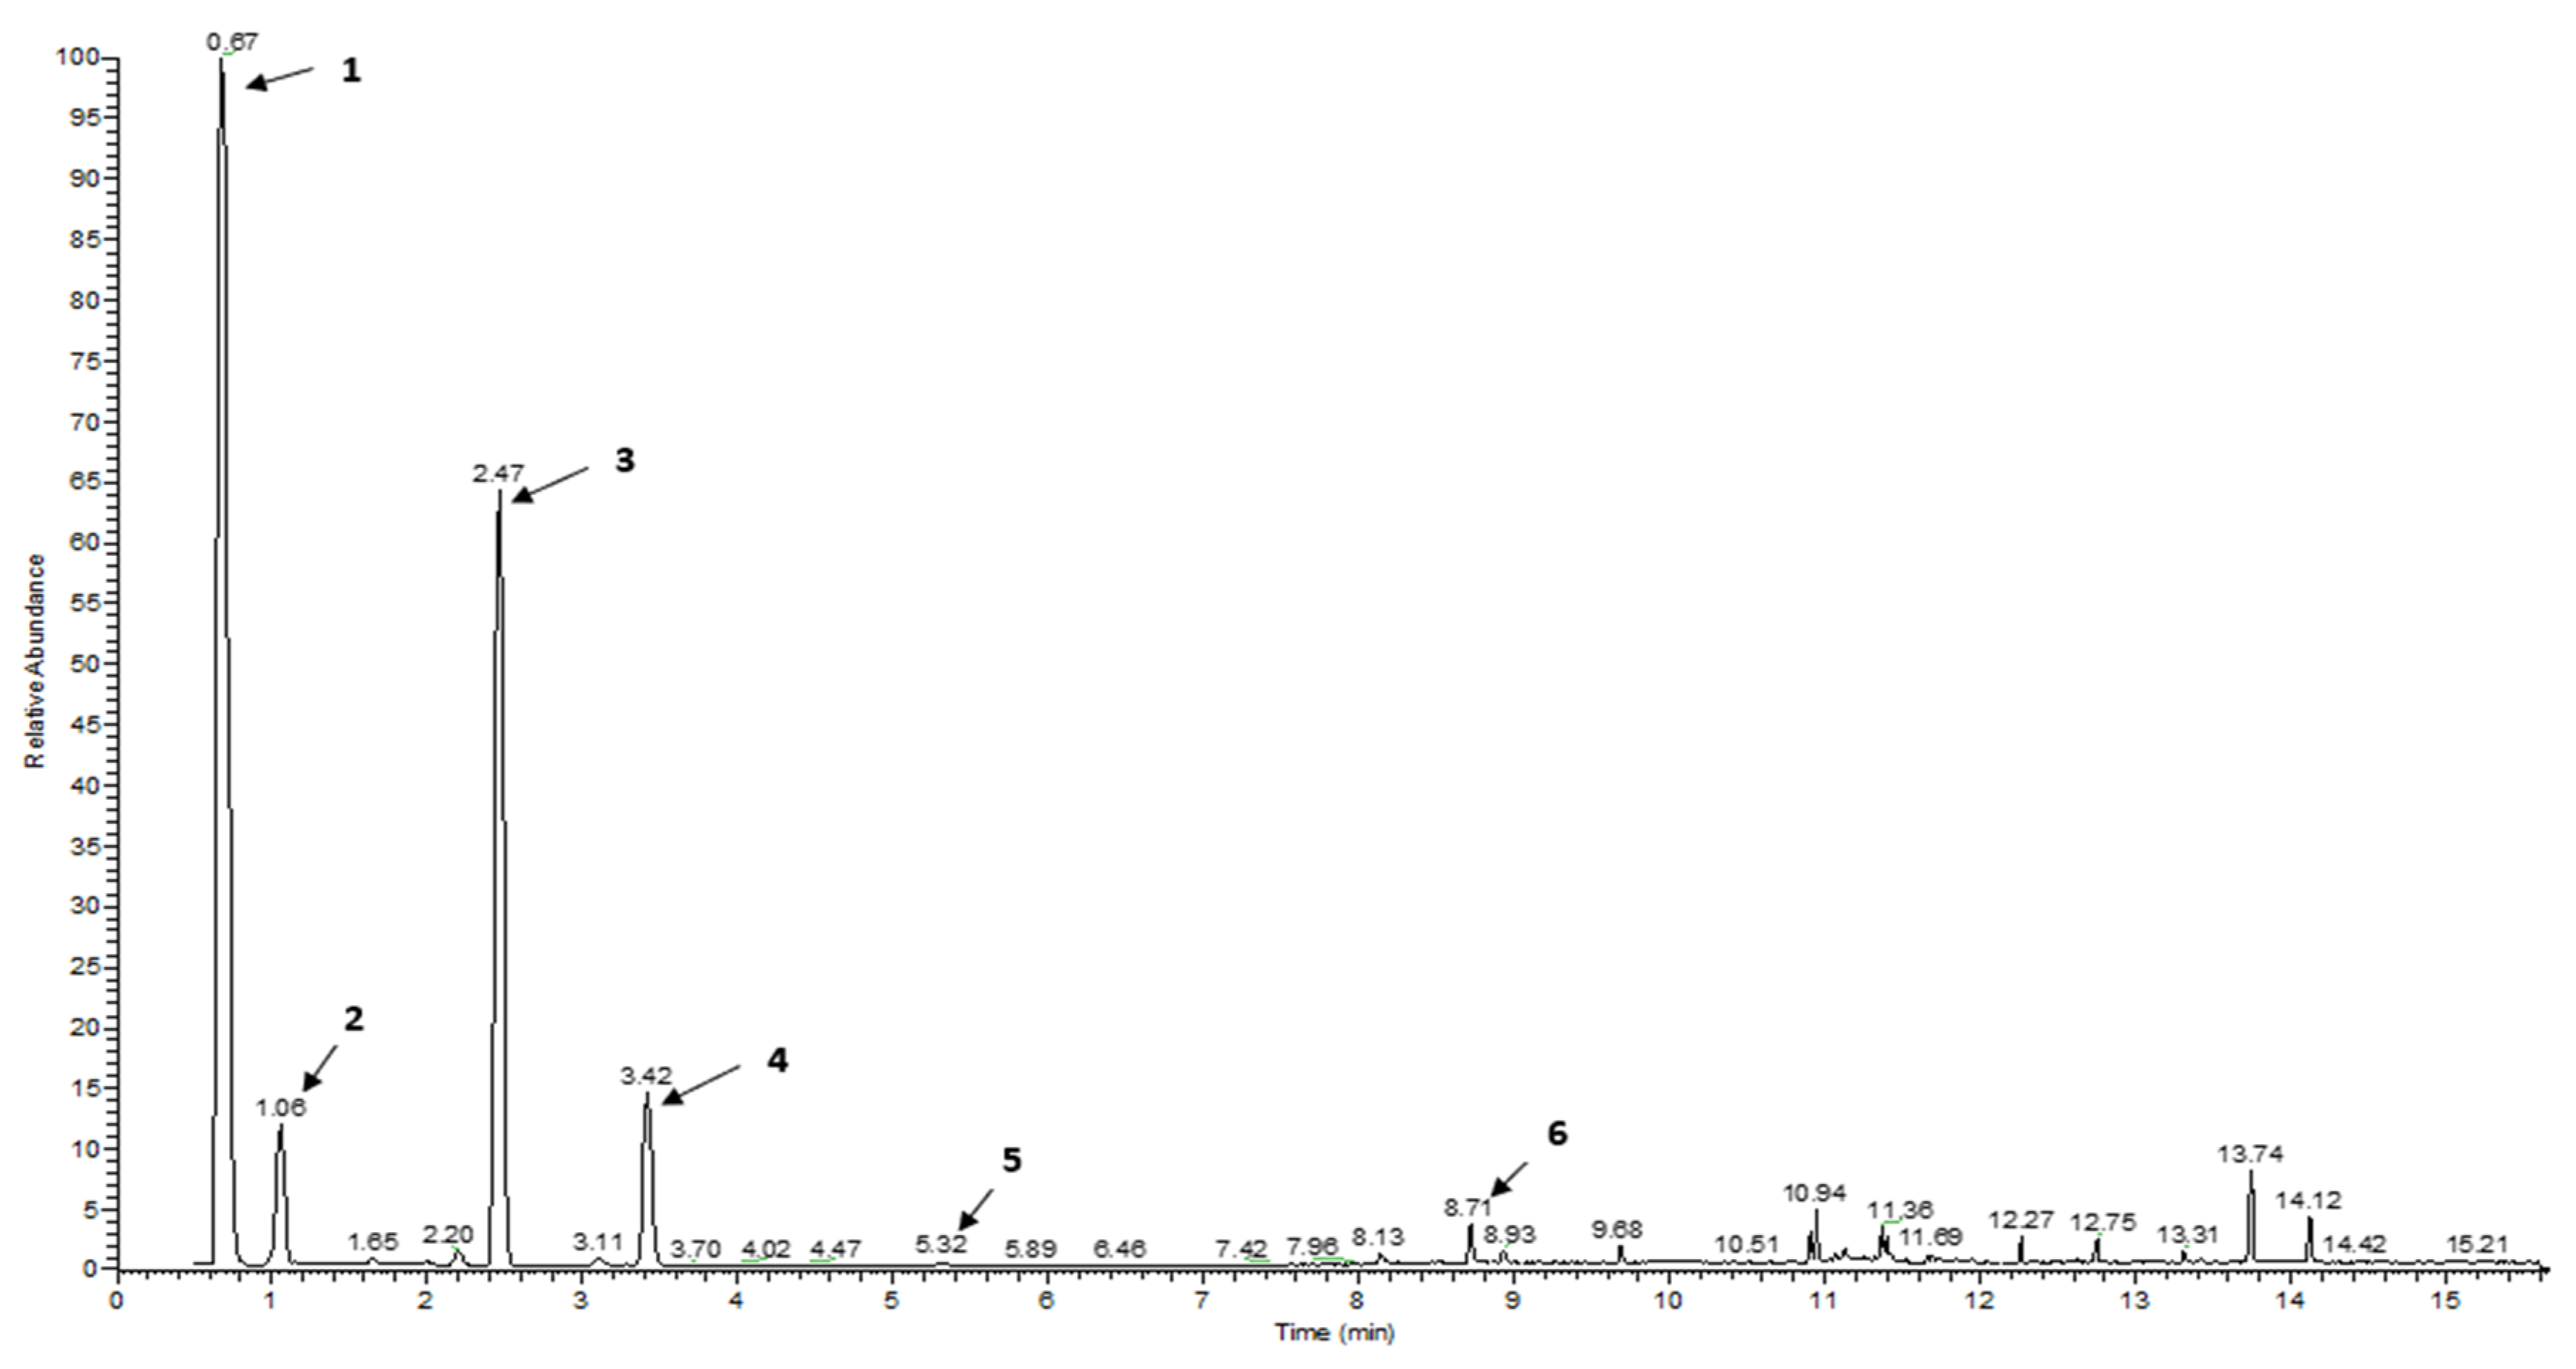
Another critical point to discuss is that specific volatile compounds were not identified in all the studied samples (Table 1), providing the feasibility for the typification of the individual samples (green coffee, cinnamon, clove, cinnamon and clove, and nutmeg). A representative gas chromatogram of green coffee samples is shown in Figure 2.

3.2. Typification of green coffee and selected spices using volatile compounds and supervised learning

3.2.1. MANOVA

The multivariate hypothesis testing, considering the Pillai's Trace = 3.965 (F-value=50.566, df=36, p = 0.000), and Wilks' Lambda = 0.000 (F-value=241753.506, df=36, p = 0.000) indices, both having an observed power of 1.000, showed that there was a significant impact of the studied matrices (green coffee, clove, cinnamon, cinnamon and clove and nutmeg) on their volatile composition. The multivariate effect of the analyzed samples on the volatile compounds is shown by the F-value tests. These tests are based on the linearly independent pairwise comparisons among the estimated marginal means. Among the 16 identified volatile compounds, all showed significant differences (p < 0.05) in their composition according to the studied matrices.

3.2.2. LDA

Prior the final LDA, pre-processing of data showed that 9 volatile compounds did not pass the tolerance test and were not used in the LDA model (Table 1). Therefore, LDA analysis was conducted using 7 volatile compounds, namely ethylene, methyl alcohol, 3-methylpentane, ethyl acetate, 9-hexadecen-1-ol, toluene, and methyl acetate. Both prior probabilities i) all groups are equal, and ii) compute from group sizes were evaluated indicating the same classification results. Therefore, we proceeded to the final step of LDA.
Four discriminant functions were formed that had the following metrics: i) Wilks' Lambda = 0.000 (X2=259.073, df=28, p=0.000) for the first function, ii) Wilks' Lambda = 0.000 (X2=119.618, df=18, p=0.000) for the second function, iii) Wilks' Lambda = 0.001 (X2=58.699, df=10, p=0.000) for the third function, and iv) Wilks' Lambda=0.053 (X2=23.535, df=4, p = 0.000) for the fourth function. The total variance explained by the four discriminant functions was 100%.
Another critical point to discuss is the eigenvalues the discriminant functions that must have during LDA. The eigenvalue of the discriminant function is an essential parameter, since it provides information on how well the function differentiates the initial groups (i.e., green coffee, clove, cinnamon, cinnamon and clove, and nutmeg). Therefore, the higher the eigenvalue in LDA, the higher the classification rate. In our case the respective eigenvalues were 37202734.888, 2027.145, 80.080, and 17.952 for discriminant function 1, discriminant function 2, discriminant function 3, and discriminant function 4.
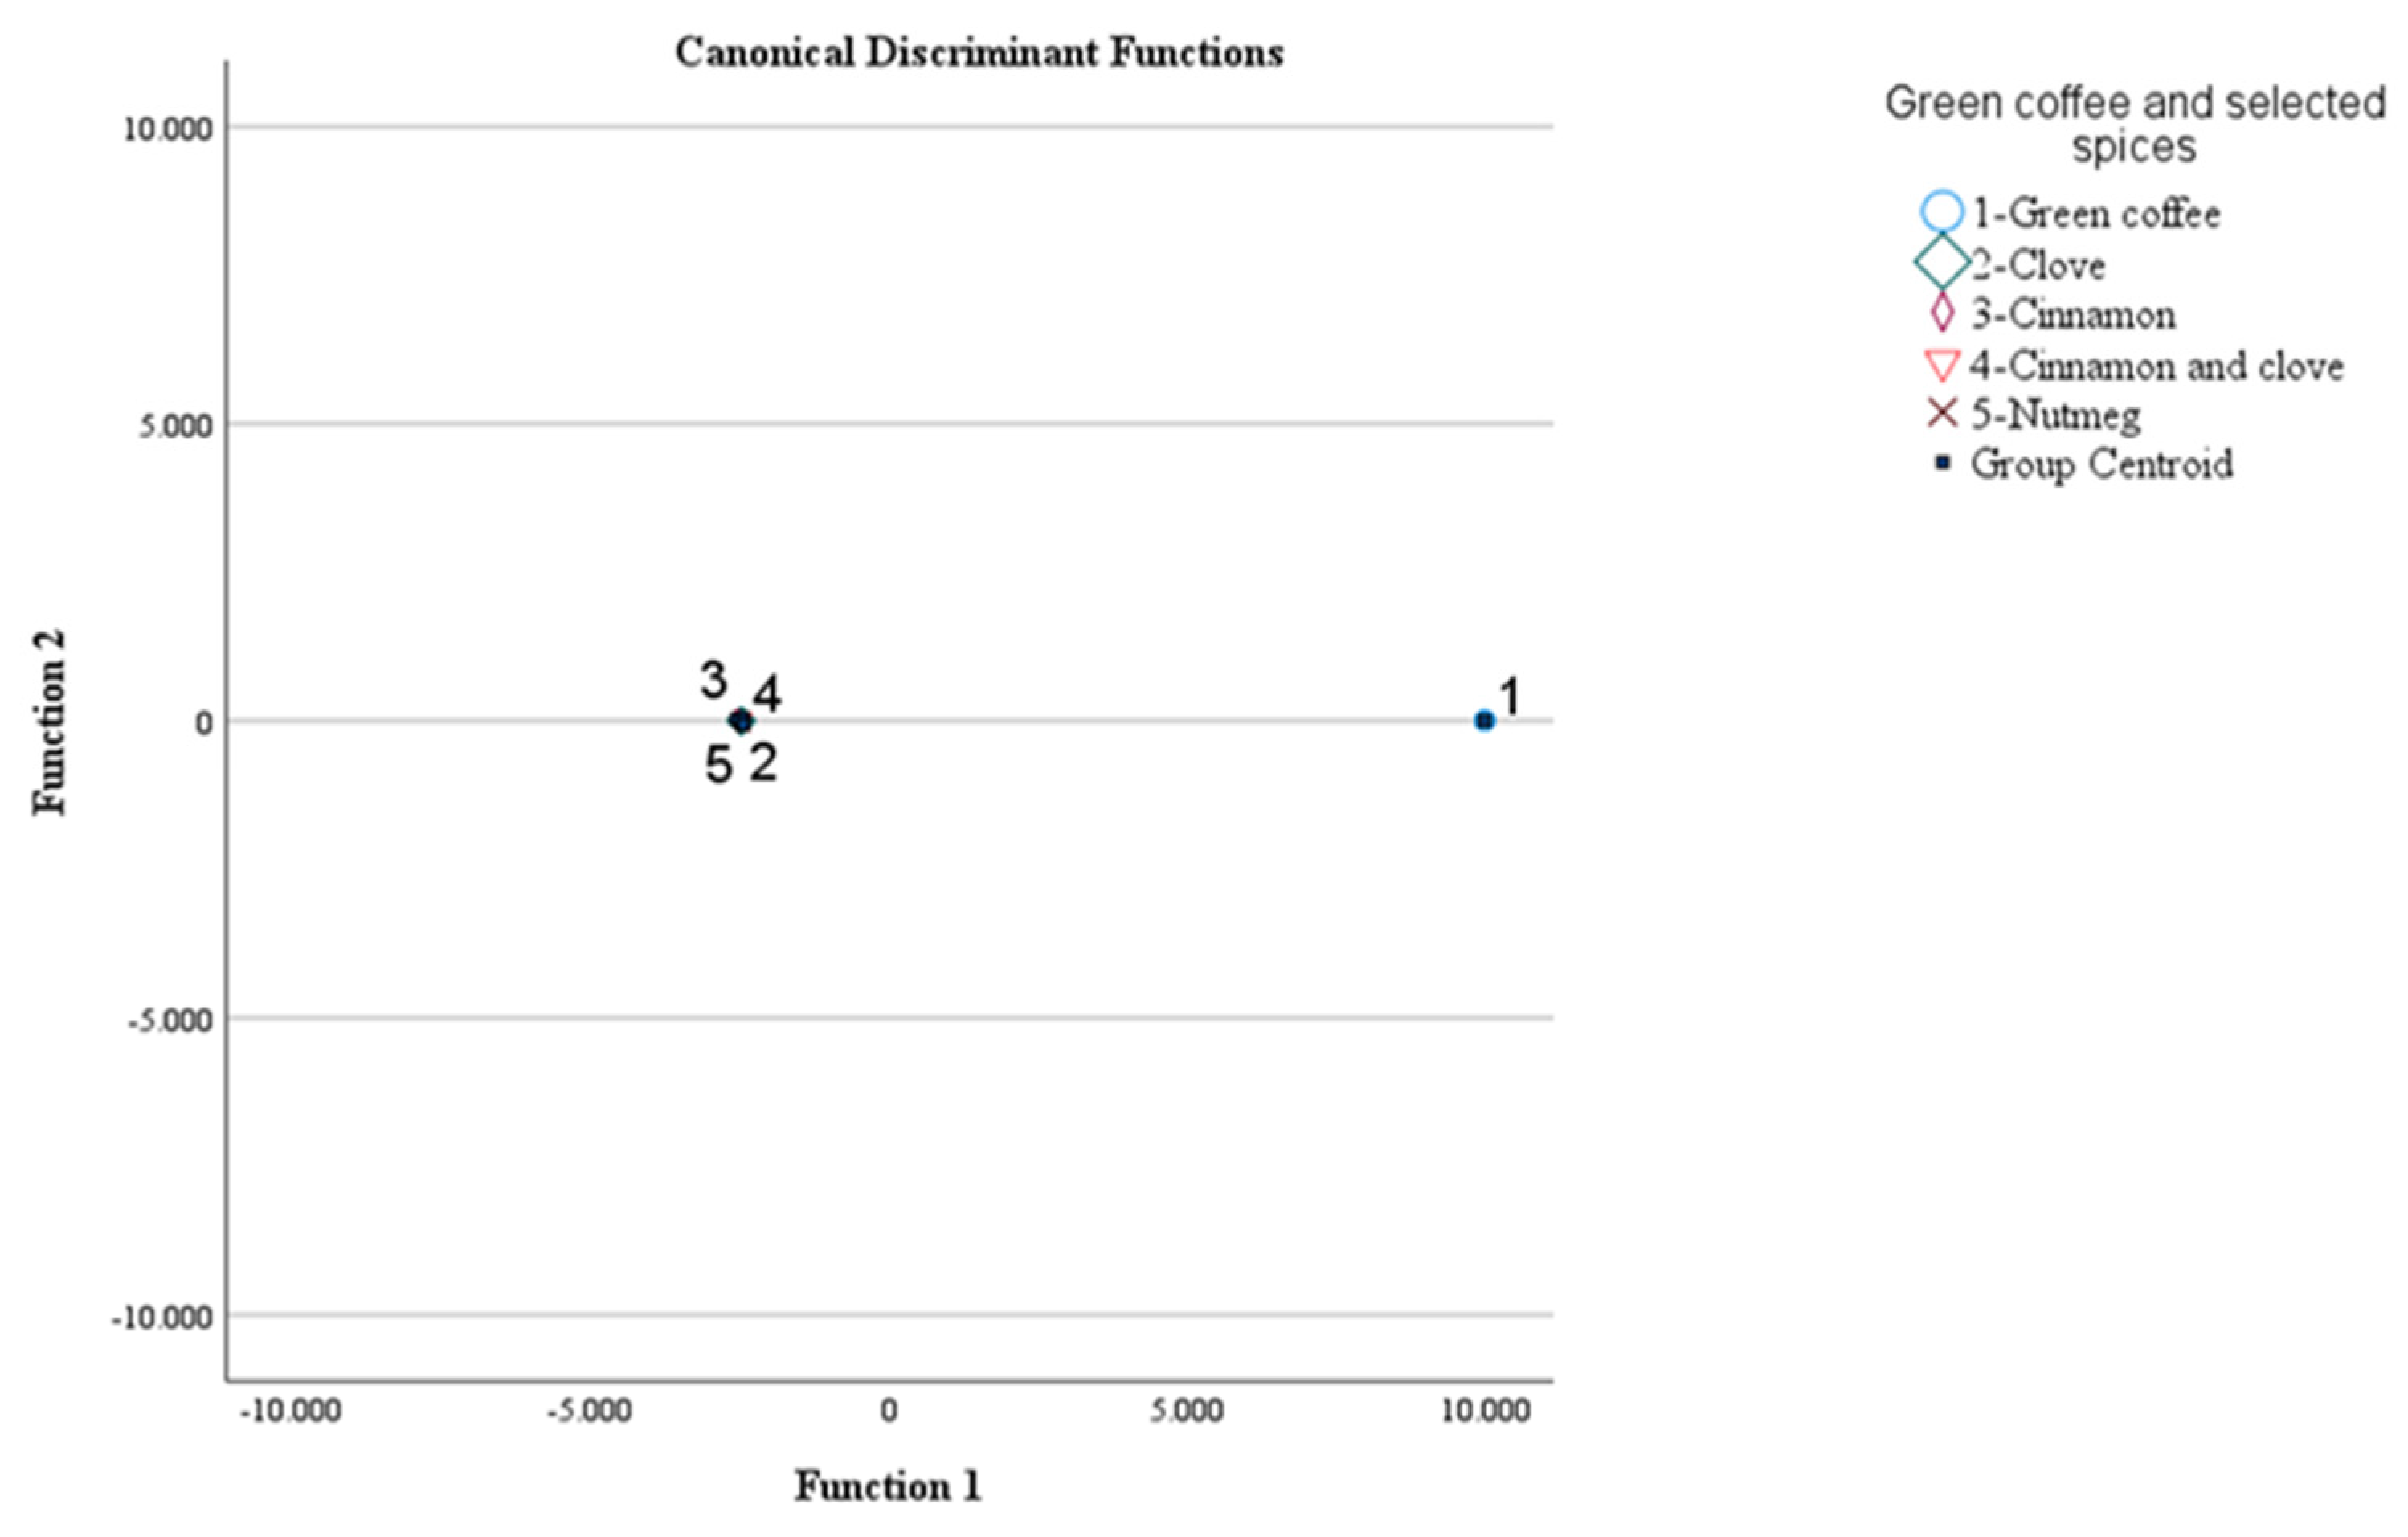
At the same time, the analyst must evaluate the group centroid values during LDA. The group centroid values are mandatory informative data that show the classification ability of the LDA model. The group centroid values indicate the unstandardized canonical discriminant functions at the mean values of the groups of objects subjected to analysis. The centroid values physically show the coordinates in the multidimensional level. In this context, the abscissa is the first discriminant function and the ordinate is the second discriminant function [15]. The group centroid values were: (9960.019, 0.226), (-2488.112, -3.677), (-2557.181, 29.060), (-2457.509, 39.974), and (-2457.218, -65.583) for green coffee, clove, cinnamon, cinnamon and clove, and nutmeg, respectively (Figure 3). The total classification rate was 100% for the original and 100% for the cross-validation method.
The volatile compounds that mostly contributed to the discrimination of green coffee, clove, cinnamon, cinnamon and clove, and nutmeg fine powders, were those pooled with the highest absolute correlation value within the discriminant functions (Table 4). These were 3-methylpentane for discriminant function 1, ethylene for discriminant function 2, methyl acetate for discriminant function 3, and ethyl acetate for discriminant function 4. Therefore, these volatile compounds are most strongly correlated to the purpose of the study.
Table 2. Correlation of volatile compounds to the structure matrix of the discriminant functions in LDA.
Volatile compounds Discriminant functions
1 2 3 4
Ethylene 0.002 0.265* -0.077 0.073
Methyl acetate 0.000 0.054 -0.578* -0.028
9-Hexadecen-1-ol 0.002 0.161 0.570* -0.358
3-Methylpentane 0.128* 0.100 0.274* 0.187
Ethyl acetate 0.023 -0.003 -0.321 0.602*
Methyl alcohol 0.001 0.177 -0.146 -0.384*
Toluene 0.000 -0.002 -0.160 0.339*
Pooled within-groups correlations between discriminating variables and standardized canonical discriminant functions. Variables are ordered by absolute size of correlation within function. *. Largest absolute correlation between each variable and any discriminant function.
The Fisher’s linear discriminant functions obtained through LDA are as follows:
Green coffee = -76828510.393 -25925.195[Ethylene]-87239.835[Methyl alcohol]+6152734.034[3-Methylpentane]-41884.736[Ethyl acetate]-393365.598[Toluene]-3104593.774[9-Hexadecen-1-ol]+2538901.897[Methyl acetate]
Clove=-4794.670+274.110[Ethylene]+622.728[Methyl alcohol]-27047.271[3-Methylpentane]+3163.913[Ethyl acetate]+2140.377[Toluene]+46354.631[9-Hexadecen-1-ol ]-9259.880[Methyl acetate]
Cinnamon=-13856.420+482.030[Ethylene]+1164.866[Methyl alcohol]-61616.074[3-Methylpentane]+4036.593[Ethyl acetate]+4601.945[Toluene]+84219.025[9-Hexadecen-1-ol]-23429.457[Methyl acetate]
Cinnamon and clove=-7997.418+291.364[Ethylene]+550.046[Methyl alcohol]-12184.637[3-Methylpentane]+3816.842[Ethyl acetate]+1413.124[Toluene]+59269.392[9-Hexadecen-1-ol]-2259.834[Methyl acetate]
Nutmeg=-421.755+83.780[Ethylene]+211.978[Methyl alcohol]-10998.205[3-Methylpentane]+837.301[Ethyl acetate]+793.658[Toluene]+13050.793[9-Hexadecen-1-ol]-4194.067[Methyl acetate]

3.2.3. PLS

The results of PLS regression analysis showed that among five latent factors (for the different samples studied) the best results were obtained for latent factors 4 and 5. The cumulative X variance explained was 0.996 resulting in a cumulative Y variance of R2= 0.915 and adjusted R2= 0.881 for latent factor 4. Similarly, cumulative X variance explained was 0.999 resulting in a cumulative Y variance of R2=0.952 and adjusted R2= 0.925 for latent factor 5. In this context, the variance importance in projection (VIP) scores >1 obtained for the independent variables (i.e., volatile compounds) were VIP = 1.333 (latent factor 4) and 1.309 (latent factor 5) for toluene, and VIP = 1.230 (latent factor 4) and 1.211 (latent factor 5) for methyl acetate.

4. Discussion

Concerning the analysis of volatile compounds in coffee, most of the recent studies in the literature deal with roasted and brewed coffee [17]. What is remarkable, is that the volatile compounds identified in thermally processed coffee is almost 1000, indicating the complexity of its composition. Indeed, during thermal processing of coffee beans there is a considerable number of reactions that occur including thermal degradation, pyrolysis, Maillard reaction, Strecker degradation, oxidative degradation, direct degradation, interaction with reduced sugars, other degradation, autooxidation, preservation and condensation [18]. As a result, there are numerous classes of volatile compounds including pyridines, pyrroles, organosulfur compounds, oxazoles, pyrazines, aldehydes, thiazoles, furans, carboxylic acids, ketones, alcohols, esters, carotenoids, phenols, and unsaturated lactones [18]. Headspace analysis in combination with gas chromatography mass spectrometry is the most widely used technique for the analysis of volatile compounds in coffee and other foodstuffs [17,19]. Dynamic headspace extraction has been characterized by high sensitivity, and thus, in the analysis of complex matrices like coffee can provide greater flexibility and compound coverage [20].
Among the volatile compounds of interest, green coffee samples showed the highest proportions in ethyl acetate, ethylene, 3-methylpentane, and 2-chloro-2 nitropropane compared to clove, cinnamon, cinnamon and clove, and nutmeg samples. Regarding clove samples the highest proportions were observed in decane, eugenol, 2-nonanone, and retinal (Vitamin A aldehyde). Clove samples had the highest proportions in methyl acetate. For cinnamon and clove samples the highest proportions were observed in methyl alcohol. What is remarkable is that the mixture of cinnamon and clove had different proportions in the respective volatile compounds compared to the individual samples. This finding indicates the transformation, regeneration and compositional differentiation of volatile compounds during the mixing of certain spices. A finding that can be solely considered in authenticity and quality control studies. Finally, nutmeg samples had the highest proportions in terpinen-4-ol [4-methyl-1-(1-methylethyl)-3-cyclohexen-1-ol]. Most of these volatile compounds have a special aroma note (Table 1).
Previous studies in the literature concerning the authentication or adulteration control of coffee have reported high classification (88%-100%) results based on DNA or 1H NMR data (triacylglycerides, diterpenes, acetic acid, formic acid, caffeine, trigonelline, N-methylpyridine, furfuryl alcohol, 5-hydroxymethylfurfural, hydroxycinnamic acids, furans, esters, N-heterocyclic and sulfur compounds) in combination with supervised (PLS and LDA) statistical techniques [21,22,23] in agreement with the results of the present study that showed a clear separation of coffee samples from the selected spices. In addition, unsupervised statistical techniques such as principal component analysis (PCA) have also provided high explained variance (>90%) in coffee samples roasted in different degrees based on volatile compounds [24].
Regarding spices previous studies in the literature showed that was able the geographical origin differentiation of samples from different regions based on volatile compounds (aldehydes, phenolics, terpenoids, etc.) in combination with bioactivity parameters and LDA. The classification rate was >95% [19]. Karabagias and Badeka [25] using volatile compounds (aldehydes, terpenoids/terpene ketones, hydrocarbons, esters, and furans) in combination with physicochemical parameters and by implementation of LDA reported a perfect classification (100%) of beverages such as herbal teas (anti-stress, mountain, sage, and chamomile).
Similarly, Pages-Rebull et al. [26] developed statistical models for the characterization, identification and authentication of cinnamon, oregano, thyme, sesame, bay leaf, clove, cumin, and vanilla samples based on sesamol, eugenol, thymol, carvacrol, salicylaldehyde and vanillin along with multivariate statistics such as PCA, PLS-DA, and soft independent modelling of class analogy (SIMCA). PLS-DA classified samples with a high prediction rate (>99%) in agreement with present results.
More recently, de Matos et al. [27] classified commercial samples of Brazilian Equisetum tea using phenolic compounds (glycoside derivatives of kaempferol, derivatives of stirilpirone, derivatives of chrysin, glycosides of quercetin, cinnamic acids, etc.) and chemometrics such as PCA, hierarchical cluster analysis (HCA) and PLS-DA. The supervised learning technique (PLS-DA) provided the most robust classification of samples.
Finally, it is quite evident from the literature that metrics data of foods (foodometrics) [12] along with the most recent advances/trends in the analytical methodologies can comprise a decisive tool for the authentication and quality/adulteration control of beverages, herbs and spices [25,26,27,28].

5. Conclusions and Future Directions

Results of the present study showed that the volatile fingerprint of green coffee and selected spices such as clove, cinnamon, cinnamon and clove and nutmeg is characteristic and the volatile compounds data could be further used for the development of a machine learning algorithm based on supervised statistical learning such as linear discriminant analysis and partial least squares regression. Both prior probabilities during LDA, such as considering the groups equal or compare the group sizes gave the same results, indicating that the LDA model presented herein combined with PLS could be further exploited in authenticity and adulteration control of beverages, spices or herbs in rapid analysis tests, considering specific volatile compounds. To our knowledge, limited data is available with this hypothesis this constituting the novelty of the current study, and at the same time support to the relevant literature. Future directions may comprise the purchase of standard compounds concerning the key volatile compounds that contributed to the absolute classification of samples providing at the same time quantitative statistical models and the use of a larger number of samples from different countries.

Author Contributions

Conceptualization, I.K.K.; methodology, D.G.L., N.D.A.; software, N.D.A.; validation, I.K.K.; formal analysis, D.G.L., E.K.K., E.N.M., V.K.K.; investigation, D.G.L., I.K.K., E.K.K., E.N.M., V.K.K.; resources, N.D.A., I.K.K.; data curation, D.G.L., E.K.K., E.N.M., V.K.K.; writing—original draft preparation, I.K.K., D.G.L.; writing—review and editing, I.K.K.; visualization, I.K.K.; supervision, I.K.K.; project administration, I.K.K.; funding acquisition, I.K.K. All authors have read and agreed to the published version of the manuscript.

Funding

This research received no external funding.

Institutional Review Board Statement

Not applicable.

Informed Consent Statement

Not applicable.

Data Availability Statement

The study has used all relevant data.

Acknowledgments

The authors are grateful to Eurofins Athens Analysis Laboratories S.A., Nafpliou 29, Metamorfosi, 14452 Athens., for the analysis of volatile compounds.

Conflicts of Interest

The authors declare no conflicts of interest.

References

  1. Lazaridis, D.G. Physicochemical and Phytochemical Characterization of Green Coffee, Cinnamon Clove, and Nutmeg EEGO, and Aroma Evaluation of the Raw Powders. Eur. Food Res. Technol. 2023, 250, 83–96. [CrossRef]
  2. Muzolf-Panek, M.; Stuper-Szablewska, K. Comprehensive Study on the Antioxidant Capacity and Phenolic Profiles of Black Seed and Other Spices and Herbs: Effect of Solvent and Time of Extraction. Food Measure. 2021, 15, 5, 4561–4574. [CrossRef]
  3. Velázquez, R. Spice and Herb Frauds: Types, Incidence, and Detection: The State of the Art. Foods 2023 12, 18, 3373. [CrossRef]
  4. Willis, S. Chemopreventive and Anti-Inflammatory Potential of Select Herbal Teas and Cinnamon in an In-Vitro Cell Model. Food and Nutr. Sci. 2019, 10, 9, 1142. [CrossRef]
  5. Rao, Y.K. Evaluation of the Anti-Inflammatory and Anti-Proliferation Tumoral Cells Activities of Antrodia Camphorata, Cordyceps Sinensis, and Cinnamomum Osmophloeum Bark Extracts. J. Ethnopharmacol. 2007, 114, 1, 78-85. [CrossRef]
  6. Hossain, M. Antioxidant Activity of Spice Extracts and Phenolics in Comparsion to Synthetic Antioxidants. Rasayan J. Chem. 2008, 1, 751-756. [CrossRef]
  7. Naeem, N. Nutmeg: A Review on Uses and Biological Properties. IJCBS 2016.
  8. Khanam, M.; Dar, A.M.; Beg, F.; Khan, S.A.; Nayik, G.A.; Karabagias, I.K. Nutmeg Essential oil. Essential Oils 2023, Chapter 15, 391-399. [CrossRef]
  9. de Carvalho Couto, C.; dos Santos, D.G.; Oliveira, E.M.M; Freitas-Silva, O. Global Situation of Reference Materials to Assure Coffee, Cocoa, and Tea Quality and Safety. TrAC Trends Anal. Chem. 2021, 143, 116381. [CrossRef]
  10. Sualeh, A.; Tolessa, K.; Mohammed, A. Biochemical Composition of Green and Roasted Coffee Beans and Their Association with Coffee Quality from Different Districts of Southwest Ethiopia. Heliyon 2020, 6, 12, E05812. [CrossRef]
  11. Clifford, N.M.; Kerimi, A.; Williamsom G. Bioavailabity and Metabolism of Chlorogenic Acids (Acyl-Quinic Acids) in Humans. Compr. Rev. Food Res. Food Sci. Food Saf. 2020, 19, 4, 1299-1352. [CrossRef]
  12. Karabagias, I.K. Food Authentication and Adulteration Control Based on Metrics Data of Foods and Chemometrics. Eur. Food Res. Technol. 2024, 250, 1269-1283. [CrossRef]
  13. Karabagias, I.K. Advances of Spectometric Techniques in Food Analysis and Food Authentication Implemented with Chemometrics. Foods 2020, 9, 11, 1550. [CrossRef]
  14. Field, A. Discovering statistics using SPSS, 3rd ed.; Sage Publications Ltd, London, UK, 2009.
  15. Huberty, C.J.; Olejnik, S. Applied MANOVA and Discriminant analysis, 2nd ed.; John Wiley and Sons, New Jersey, USA, 2006.
  16. Karabagias, I.K.; Karabagias, V.K.; Badeka, A.V. Volatilome of white wines as an indicator of authenticity and adulteration control using statistical analysis. Aust. J. Grape and Wine Res. 2021, 27, 269-279. [CrossRef]
  17. Pua, A.; Goh, R.M.V.; Huang, Y.; Tang, V.C.Y.; Ee, K-H.; Cornuz, M.; Liu, S.Q.; Lassabliere, B.; Yu, B. Recent advances in analytical strategies for coffee volatile studies: Opportunities and challenges. Food Chem. 2022, 388, 132971. [CrossRef]
  18. Ribeiro, J. S.; Augusto, F.; Salva, T. J.G.; Thomaziello, R. A.; Ferreira, M. M. C. Prediction of sensory properties of Brazilian Arabica roasted coffees by headspace solid phase microextraction-gas chromatography and partial least squares. Anal. Chim. Acta 2009, 634, 172–179. [CrossRef]
  19. Karabagias, I.K.; Koutsoumpou, M.; Liakou, V. Characterization and geographical discrimination of saffron from Greece, Spain, Iran, and Morocco based on volatile and bioactivity markers, using chemometrics. Eur Food Res Technol. 2017, 243, 1577–1591. [CrossRef]
  20. Jeleń, H. H. Sample preparation for the study of flavor compounds in food. Hand-book of Sample Preparation. Pawliszyn, J.; Lord, H. L., Eds.; John Wiley & Sons, New Jersey, USA, 2010; 267–284. [CrossRef]
  21. Ferreira, T.; Farah, A.; Oliveira, T.C.; Lima I.S.; Vitório, F.; Oliveira, E.M.M. Using Real-Time PCR as a tool for monitoring the authenticity of commercial coffees. Food Chem. 2016, 199, 433-438. [CrossRef]
  22. Gottstein, V.; Lachenmeier, D.W.; Kuballa, T.; Bunzel, M. 1H NMR-based approach to determine the geographical origin and cultivation method of roasted coffee. Food Chem. 2023, 137278. [CrossRef]
  23. De Vivo, A.; Balivo, A.; Sarghini, F. Volatile Compound Analysis to Authenticate the Geographical Origin of Arabica and Robusta Espresso Coffee. Appl. Sci. 2023, 13, 5615. [CrossRef]
  24. Kim, S.Y.; Ko, J.A.; Kang, B.S.; Park, H.J. Prediction of key aroma development in coffees roasted to different degrees by colorimetric sensor array. Food Chem. 2018, 240, 808-816. [CrossRef]
  25. Karabagias, I.K.; Badeka, A.V. Physicochemical parameters and volatile compounds of herbal teas as indicators of products’ brand name using chemometrics. Eur Food Res Technol. 2021, 247, 961–974. [CrossRef]
  26. Pages-Rebull, J.; Pérez-Ràfols, C.; Serrano, N.; Manel del Valle; Díaz-Cruz, J.M. Classification and authentication of spices and aronmatic herbs by means of HPLC-UV and chemometrics. Food Biosci 2023, 52, 102401. [CrossRef]
  27. de Matos, R.C.; de Souza, T.J.T.; Scopel, M. Chemometrics as a Tool for Quality Control of Commercial Samples of Equisetum Teas in Brazil. Rev. Bras. Farmacogn. 2024. [CrossRef]
  28. Xu, Y.; Zhang, J.; Wang, Y. Recent trends of multi-source and non-destructive information for quality authentication of herbs and spices. Food Chem. 2023, 398, 133939. [CrossRef]
  29. Alberta Energy Regulator. Hydrocarbon Odour Management Protocol for Upstream Oil and Gas Point Source Venting and Fugitive Emissions, 2014. https://static.aer.ca/prd/documents/directives/D060_OdourManagementProtocol.pdf.
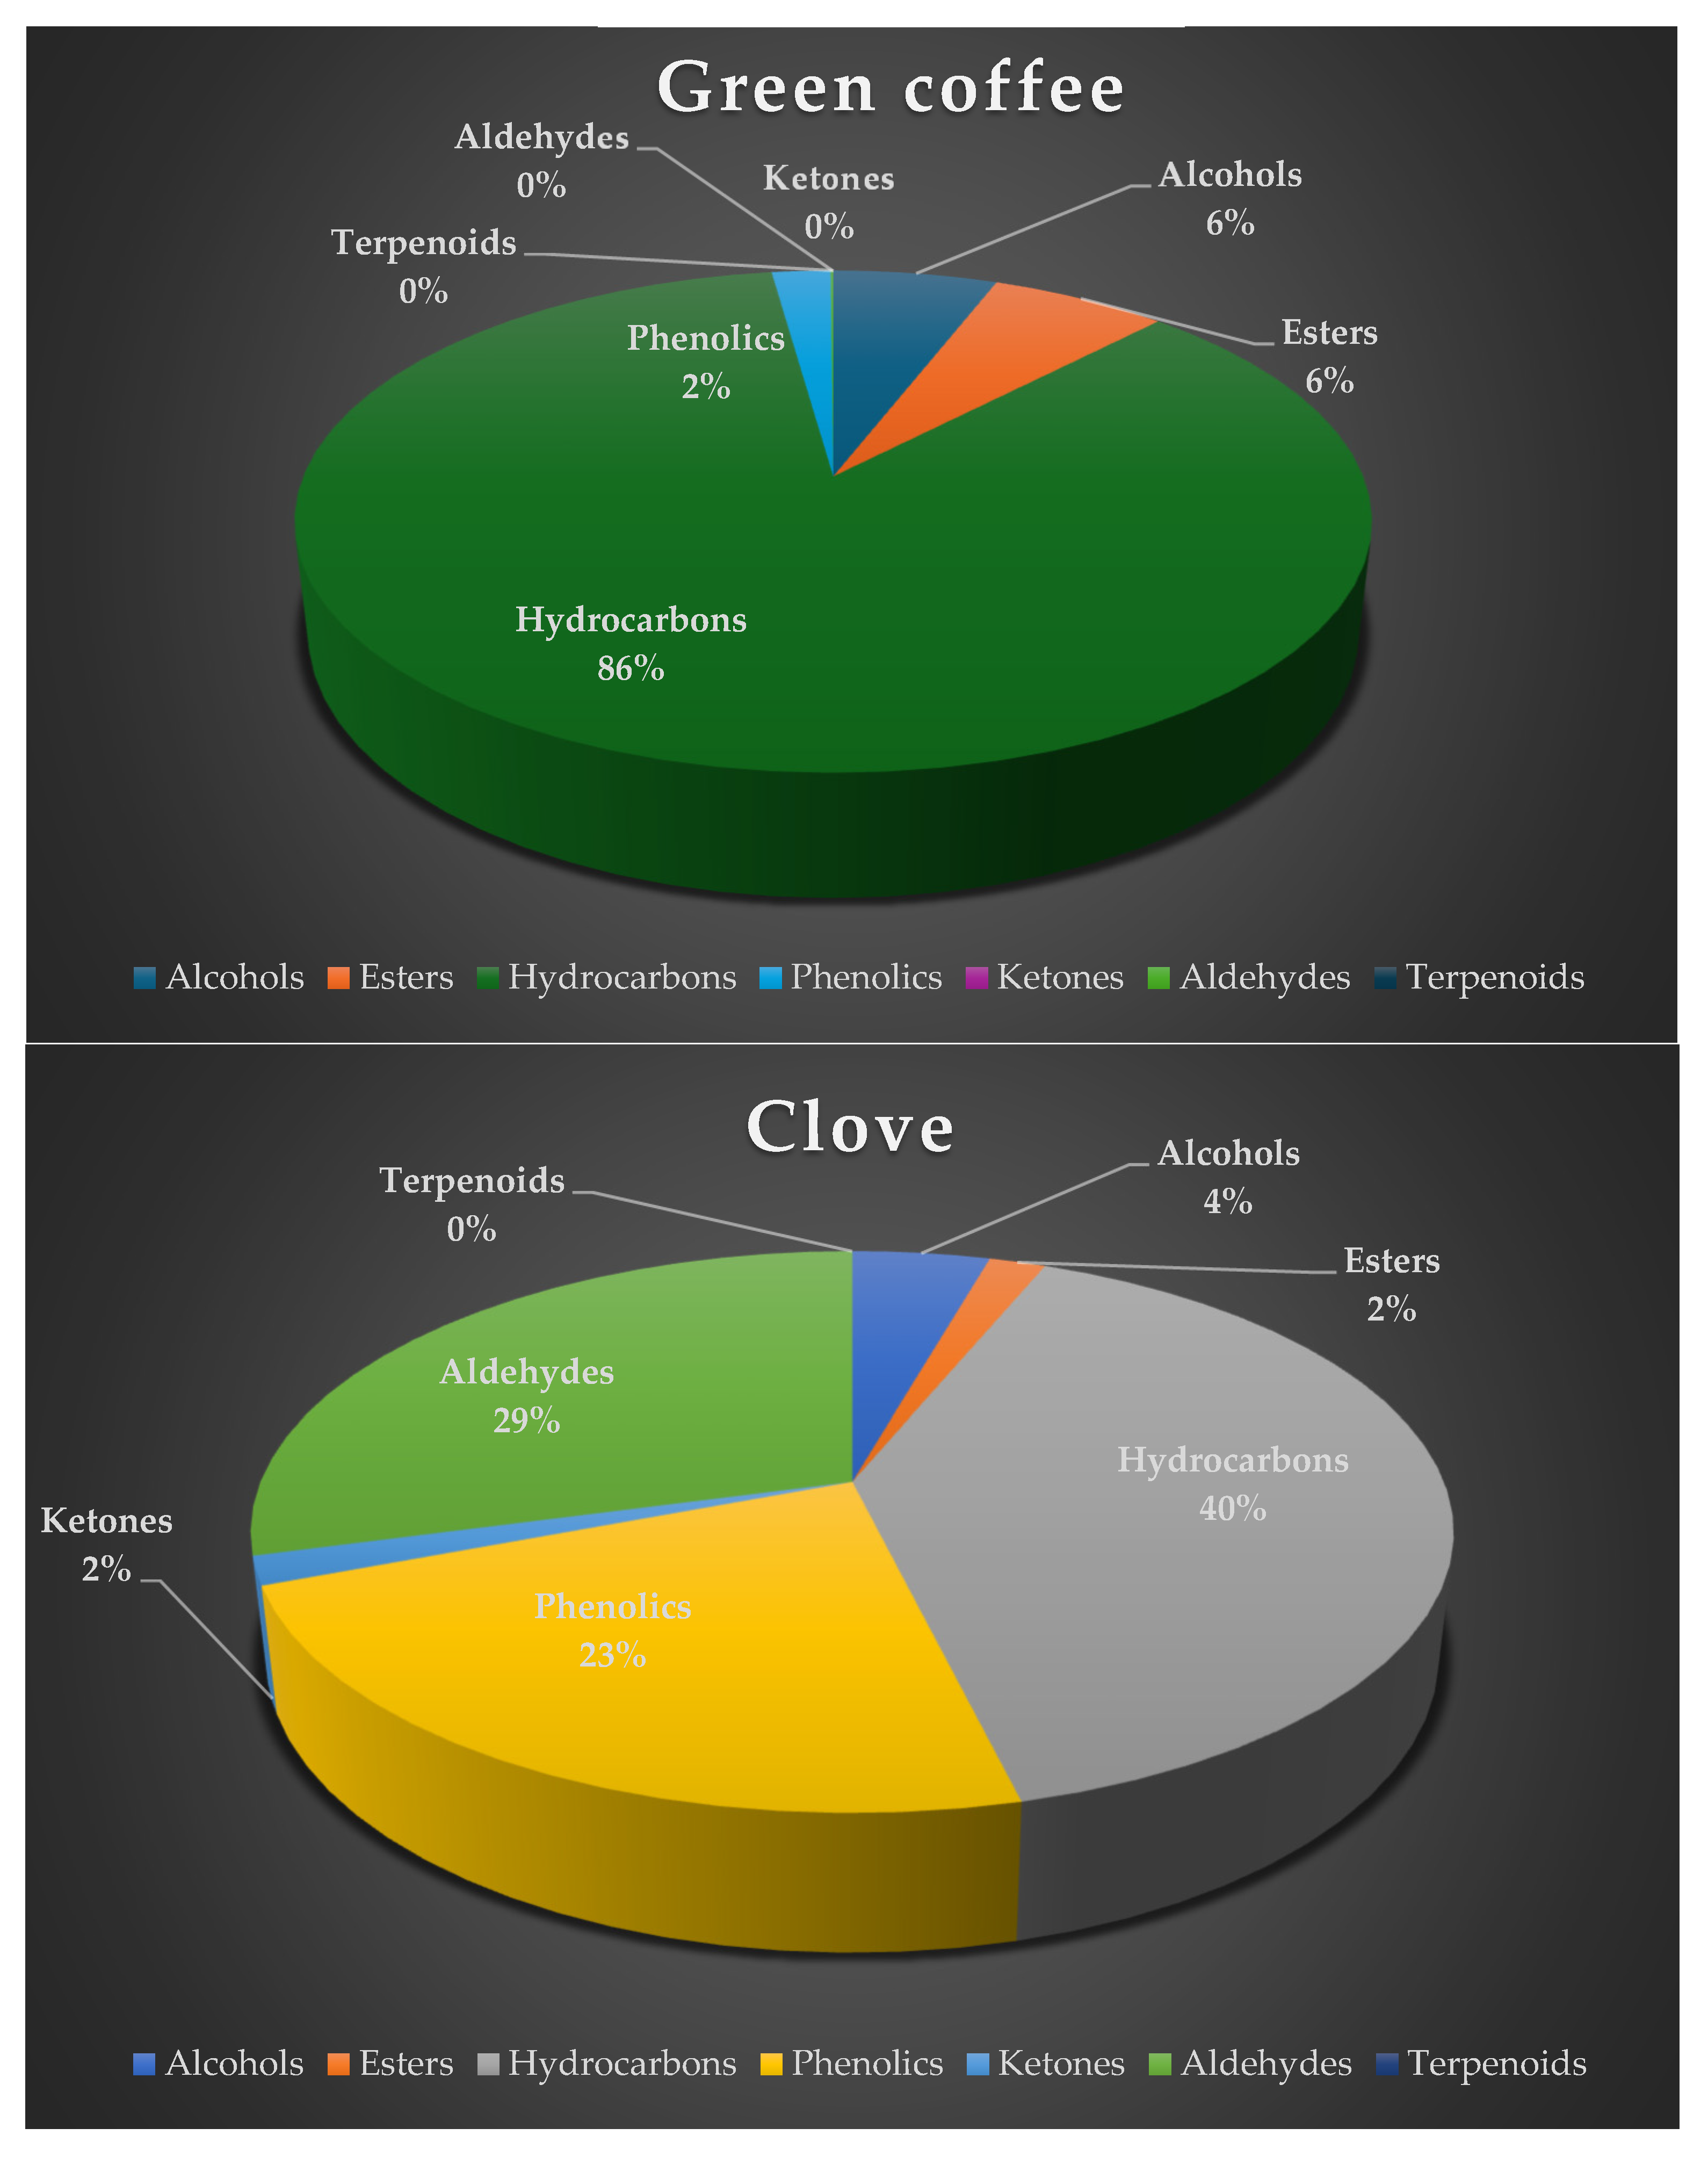
Figure 1. (a-e). Classes of volatile compounds (% average values) in a) green coffee, b) clove, c) cinnamon, d) cinnamon and clove, and e) nutmeg fine powders.
Preprints 103623 g001aPreprints 103623 g001bPreprints 103623 g001c
Figure 2. A representative gas chromatogram of green coffee powder indicating some key volatile compounds. 1: Ethylene. 2: Methyl alcohol. 3: 3-Methylpentane. 4: Ethyl acetate. 5: 9-Hexadecen-1-ol. 6: Toluene.
Preprints 103623 g002
Figure 3. Classification of green coffee and selected spices using 7 volatile compounds and LDA.
Preprints 103623 g003
Table 1. Volatile compounds in green coffee and selected spices.
RT Volatile compounds Green coffee (%Area ± SD) Clove
(%Area ±SD)
Cinnamon (%Area ±SD) Cinnamon and clove
(%Area ±SD)
Nutmeg (%Area ±SD) Molecular formula Odor descripion
Alcohols
1.06 Methyl alcohol 5.19 ± 0.33 3.35 ± 0.11 4.19 ± 0.39 6.00 ± 0.04 0.83 ± 0.20 CH4O Light alcoholic [13]
5.32 9-Hexadecen-1-ol 0.13 ± 0.06 ni 0.07 ± 0.01 0.05 ± 0.00 ni C16H32O -
Esters
1.89 Methyl acetate ni 0.28 ± 0.02 ni 0.27 ± 0.06 ni C16H32O Sweet and fruity [14]
3.42 Ethyl acetate 5.73 ± 0.00 0.20 ± 0.02 ni 0.06 ± 0.01 0.05 ± 0.04 C4H8O2 Sweet and fruity [15]
12.66 Methyl salicylate ni 0.90 ± 0.13 ni 0.09 ± 0.02 ni C8H8O3 Sweet, fruity, rooty, beer-like [16]
Hydrocarbons
0.68 Ethylene 49.78 ± 0.02 27.96 ± 1.52 35.72 ± 1.91 40.02 ± 0.39 7.43 ± 0.70 C2H4 Fruity, pineapple, pungent, varnish [17]
2.45 3-Methylpentane 25.40 ± 0.03 ni ni 0.13 ± 0.03 ni C6H14 Oil-like, gasoline-like, asphalt-like [29]
8.13 Toluene 0.73 ± 0.36 0.84 ± 0.25 ni ni ni C7H8 Sweet, pungent [19]
8.71 2-Chloro-2nitropropane 0.71 ± 0.02 0.37 ± 0.06 0.27 ± 0.05 0.06 ± 0.00 ni C3H6ClNO2 Oil-like, gasoline-like, asphalt-like [29]
10.94 Decane 0.94 ± 0.05 1.26 ± 0.16 ni ni ni C10H22 Oil-like, gasoline-like, asphalt-like [29]
Phenolics
6.07 4-(2-aminopropyl)-Phenol 0.02 ± 0.00 0.01 ± 0.01 ni 0.01 ± 0.01 ni C9H13NO -
13.77 Eugenol 1.19±0.09 17.5 ± 0.38 ni 14.03 ± 0.15 ni C10H12O2 Clove, pungent and spicy [20]
15.22 2-Methoxy-4-(1-propenyl)-phenol acetate 0.69±0.18 ni ni 1.13±0.38 ni C12H14O3 Weak rose-carnation [21]
Ketones
11.90 2-Nonanone ni 1.26 ± 0.86 ni 0.25 ± 0.01 ni C9H18O Sweet, earthy and fishy [22]
Aldehydes
14.14 Vitamin A aldehyde 0.09 ± 0.006 22.19 ± 0.17 0.82 ± 0.11 19.85 ± 0.93 0.01 ± 0.01 C20H28O -
Terpenoids
12.51 4-Methyl-1-(1-methylethyl) 3-cyclohexen-1-ol ni ni 0.49 ± 0.13 ni 1.46 ± 0.41 C10H18O Musty [23]
RT: retention time (minutes). MF: molecular formula.The results are the average and standard deviation values of two replicates. ni: not identified;were treated as zero for chemometrics not as missing values. MANOVA in comparison of values between groups. P: probability at the confidence level p<0.05.
Disclaimer/Publisher’s Note: The statements, opinions and data contained in all publications are solely those of the individual author(s) and contributor(s) and not of MDPI and/or the editor(s). MDPI and/or the editor(s) disclaim responsibility for any injury to people or property resulting from any ideas, methods, instructions or products referred to in the content.
Copyright: This open access article is published under a Creative Commons CC BY 4.0 license, which permit the free download, distribution, and reuse, provided that the author and preprint are cited in any reuse.
Prerpints.org logo

Preprints.org is a free preprint server supported by MDPI in Basel, Switzerland.

Subscribe

© 2024 MDPI (Basel, Switzerland) unless otherwise stated