Submitted:
11 April 2024
Posted:
15 April 2024
You are already at the latest version
Abstract
Keywords:
1. Introduction
2. Experimental
2.1. Sample Preparation
2.2. Ion Irradiation
2.3. Characterization Methodology
3. Results and Discussion
3.1. Pore Structure Analysis
3.2. Morphology Variation
3.3. Structural Variation
4. Conclusions
Acknowledgments
References
- Serp, J.; Allibert, M.; Beneš, O.; Delpech, S.; Feynberg, O.; Ghetta, V.; Heuer, D.; Holcomb, D.; Ignatiev, V.; Kloosterman, J.L.; et al. The molten salt reactor (MSR) in generation IV: Overview and perspectives. Prog. Nucl. Energy 2014, 77, 308–319. [Google Scholar] [CrossRef]
- McCoy, H.E.; Beatty, R.L.; Cook, W.H.; Gehlbach, R.E.; Kennedy, C.R.; Koger, J.W.; Litman, A.P.; Sessions, C.E.; Weir, J.R. New Developments in Materials for Molten-Salt Reactors. Nucl. Appl. Technol. 1970, 8, 156–169. [Google Scholar] [CrossRef]
- Rosenthal, M.W.; Haubenreich, P.N.; Briggs, R.B. The development status of molten-salt breeder reactors; Tennessee: Oak Ridge National Laboratory, 1972.
- Campbell, A.A.; Burchell, T.D. Radiation Effects in Graphite. In Comprehensive Nuclear Materials; 2020; pp. 398-436.
- Song, J.L.; Zhao, Y.L.; He, X.J.; Zhang, B.L.; Xu, L.; He, Z.T.; Zhang, D.S.; Gao, L.N.; Xia, H.H.; Zhou, X.T.; et al. Preparation of pyrolytic carbon coating on graphite for inhibiting liquid fluoride salt and Xe135 penetration for molten salt breeder reactor. J. Nucl. Mater. 2015, 456, 33–40. [Google Scholar] [CrossRef]
- He, Z.; Lian, P.F.; Song, Y.; Liu, Z.J.; Song, J.L.; Zhang, J.P.; Feng, J.; Yan, X.; Guo, Q.G. Improving molten fluoride salt and Xe135 barrier property of nuclear graphite by phenolic resin impregnation process. J. Nucl. Mater. 2018, 499, 79–87. [Google Scholar] [CrossRef]
- He, X.J.; Song, J.L.; Xu, L.; Tan, J.; Xia, H.H.; Zhang, B.L.; He, Z.T.; Gao, L.N.; Zhou, X.T.; Zhao, M.W.; et al. Protection of nuclear graphite toward liquid fluoride salt by isotropic pyrolytic carbon coating. J. Nucl. Mater. 2013, 442, 306–308. [Google Scholar] [CrossRef]
- He, X.J.; Song, J.L.; Tan, J.; Zhang, B.L.; Xia, H.H.; He, Z.T.; Zhou, X.T.; Zhao, M.W.; Liu, X.D.; Xu, L.; et al. SiC coating: An alternative for the protection of nuclear graphite from liquid fluoride salt. J. Nucl. Mater. 2014, 448, 1–3. [Google Scholar] [CrossRef]
- Zhang, J.C.; Shi, J.L.; Zhao, Y.; Guo, Q.G.; Liu, L.; Feng, Z.H.; Fan, Z. Structural changes in four different precursors with heat treatment at high temperature and resin carbon structural model. J. Mater. Sci. 2012, 47, 5891–5899. [Google Scholar] [CrossRef]
- Zhao, H.C.; He, Z.; Liu, Z.J.; Song, J.L.; Tsang, D.K.L.; Zhang, H.Y. Self-sintered nanopore-isotropic graphite derived from green pitch coke for application in molten salt nuclear reactor. Ann. Nucl. Energy 2019, 131, 412–416. [Google Scholar] [CrossRef]
- Song, J.L.; Zhao, Y.L.; Zhang, J.P.; He, X.J.; Zhang, B.L.; Lian, P.F.; Liu, Z.J.; Zhang, D.S.; He, Z.T.; Gao, L.N.; et al. Preparation of binderless nanopore-isotropic graphite for inhibiting the liquid fluoride salt and Xe135 penetration for molten salt nuclear reactor. Carbon 2014, 79, 36–45. [Google Scholar] [CrossRef]
- Wang, T.; Li, H.; Shen, Q.; Li, K.; Li, W.; Song, Q.; Zhang, S. Dependence of mechanical properties on microstructure of high-textured pyrocarbon prepared via isothermal and thermal gradient chemical vapor infiltration. Composites Part B: Engineering 2020, 192. [Google Scholar] [CrossRef]
- Zhang, H.Y.; Cheng, J.X.; Lian, P.F.; He, Z.; Wang, Q.; Yu, A.; Song, J.L.; Tang, Z.F.; Liu, Z.J. Effects of irradiation on nano-pore phenol-formaldehyde resin infiltrated IG-110 graphite. Nucl. Mater. Energy 2022, 32. [Google Scholar] [CrossRef]
- Zhang, H.Y.; Lei, Q.T.; Song, J.L.; Liu, M.; Zhang, C.; Gao, Y.T.; Zhang, W.T.; Xia, H.H.; Liu, X.D. Direct characterization of ion implanted nanopore pyrolytic graphite coatings for molten salt nuclear reactors. RSC Adv. 2018, 8, 33927–33938. [Google Scholar] [CrossRef]
- He, Z.; Lian, P.F.; Guo, X.H.; Song, J.L.; Yan, X.; Liu, Z.J.; Song, H.H. Ultrafine-grained graphite prepared from filler of onion-like carbon spheres via a liquid mixing process for using in molten salt reactor. J. Nucl. Mater. 2021, 547. [Google Scholar] [CrossRef]
- Zhang, H.Y.; Song, J.L.; Tang, Z.F.; Liu, Z.J.; Liu, X.D. The surface topography and microstructure change of densified nanopore nuclear graphite impregnated with polyimide and irradiated by xenon ions. Appl. Surf. Sci. 2020, 531. [Google Scholar] [CrossRef]
- Liu, M.; Zhang, W.T.; Song, J.L.; Zhang, H.Y.; Lian, P.F.; Gao, Y.T.; Zhang, C.; He, Z.T.; Liu, Z.J.; Zhao, M.W.; et al. Irradiation resistance study of binderless nanopore-isotropic graphite for use in molten salt nuclear reactors. Nucl. Eng. Des. 2018, 335, 231–240. [Google Scholar] [CrossRef]
- Li, P.D.; Lian, P.F.; Song, J.L.; Zhang, H.Y.; Cheng, J.X.; Wang, Q.B.; Liu, Z.J.; Tang, Z.F. Surface topography and microstructure changes of ultrafine-grained graphite prepared from filler of onion-like carbon spheres by Xe ions irradiation. Radiat. Phys. Chem. 2024, 219. [Google Scholar] [CrossRef]
- Zhang, H.Y.; Song, J.L.; Tang, Z.F.; He, Z.; Liu, X.D. The surface topography and microstructure of self-sintered nanopore graphite by Xe ions irradiation. Appl. Surf. Sci. 2020, 515. [Google Scholar] [CrossRef]
- Zhang, H.Y.; Cheng, J.X.; Song, J.L.; Yin, H.Q.; Tang, Z.F.; Liu, Z.J.; Liu, X.D. Topography changes and microstructural evolution of nuclear graphite (IG-110) induced by Xe26+ irradiation. New Carbon Mater. 2023, 38, 393–402. [Google Scholar] [CrossRef]
- Dickinson, J.M.; Shore, J.W. Observations concerning the determination of porosities in graphites. Carbon 1968, 6, 937–941. [Google Scholar] [CrossRef]
- Washburn, E.W. The dynamics of capillary flow. Physical Review 1921, 17, 273–283. [Google Scholar] [CrossRef]
- Arregui-Mena, J.D.; Worth, R.N.; Bodel, W.; März, B.; Li, W.; Campbell, A.A.; Cakmak, E.; Gallego, N.; Contescu, C.; Edmondson, P.D. Multiscale characterization and comparison of historical and modern nuclear graphite grades. Mater. Charact. 2022, 190. [Google Scholar] [CrossRef]
- Huang, Q.; Li, J.J.; Liu, R.D.; Yan, L.; Huang, H.F. Surface morphology and microstructure evolution of IG-110 graphite after xenon ion irradiation and subsequent annealing. J. Nucl. Mater. 2017, 491, 213–220. [Google Scholar] [CrossRef]
- Jiang, M.; Ammigan, K.; Lolov, G.; Pellemoine, F.; Liu, D. Porosity evolution in proton irradiated microfine-grained POCO graphite. J. Nucl. Mater. 2023, 587. [Google Scholar] [CrossRef]
- Heggie, M.I.; Suarez-Martinez, I.; Davidson, C.; Haffenden, G. Buckle, ruck and tuck: A proposed new model for the response of graphite to neutron irradiation. J. Nucl. Mater. 2011, 413, 150–155. [Google Scholar] [CrossRef]
- Manoj, B. Investigation of nanocrystalline structure in selected carbonaceous materials. Int. J. Miner. Metall. Mater. 2014, 21, 940–946. [Google Scholar] [CrossRef]
- Zhou, Z.; Bouwman, W.G.; Schut, H.; van Staveren, T.O.; Heijna, M.C.R.; Pappas, C. Influence of neutron irradiation on the microstructure of nuclear graphite: An X-ray diffraction study. J. Nucl. Mater. 2017, 487, 323–330. [Google Scholar] [CrossRef]
- Asthana, A.; Matsui, Y.; Yasuda, M.; Kimoto, K.; Iwata, T.; Ohshima, K.-i. Investigations on the structural disordering of neutron-irradiated highly oriented pyrolytic graphite by X-ray diffraction and electron microscopy. J. Appl. Crystallogr. 2005, 38, 361–367. [Google Scholar] [CrossRef]
- Mathew, S.; Chan, T.K.; Zhan, D.; Gopinadhan, K.; Barman, A.R.; Breese, M.B.H.; Dhar, S.; Shen, Z.X.; Venkatesan, T.; Thong, J.T.L. The effect of layer number and substrate on the stability of graphene under MeV proton beam irradiation. Carbon 2011, 49, 1720–1726. [Google Scholar] [CrossRef]
- Tuinstra, F.; Koenig, J.L. Raman Spectrum of Graphite. J. Chem. Phys. 1970, 53, 1126–1130. [Google Scholar] [CrossRef]
- Ferrari, A.C.; Robertson, J. Origin of the 1150 cm-1 Raman mode in nanocrystalline diamond. Phys. Rev. B 2001, 63, 121405. [Google Scholar] [CrossRef]
- Ferrari, A.C.; Robertson, J. Resonant Raman spectroscopy of disordered, amorphous, and diamondlike carbon. Phys. Rev. B 2001, 64, 075414. [Google Scholar] [CrossRef]
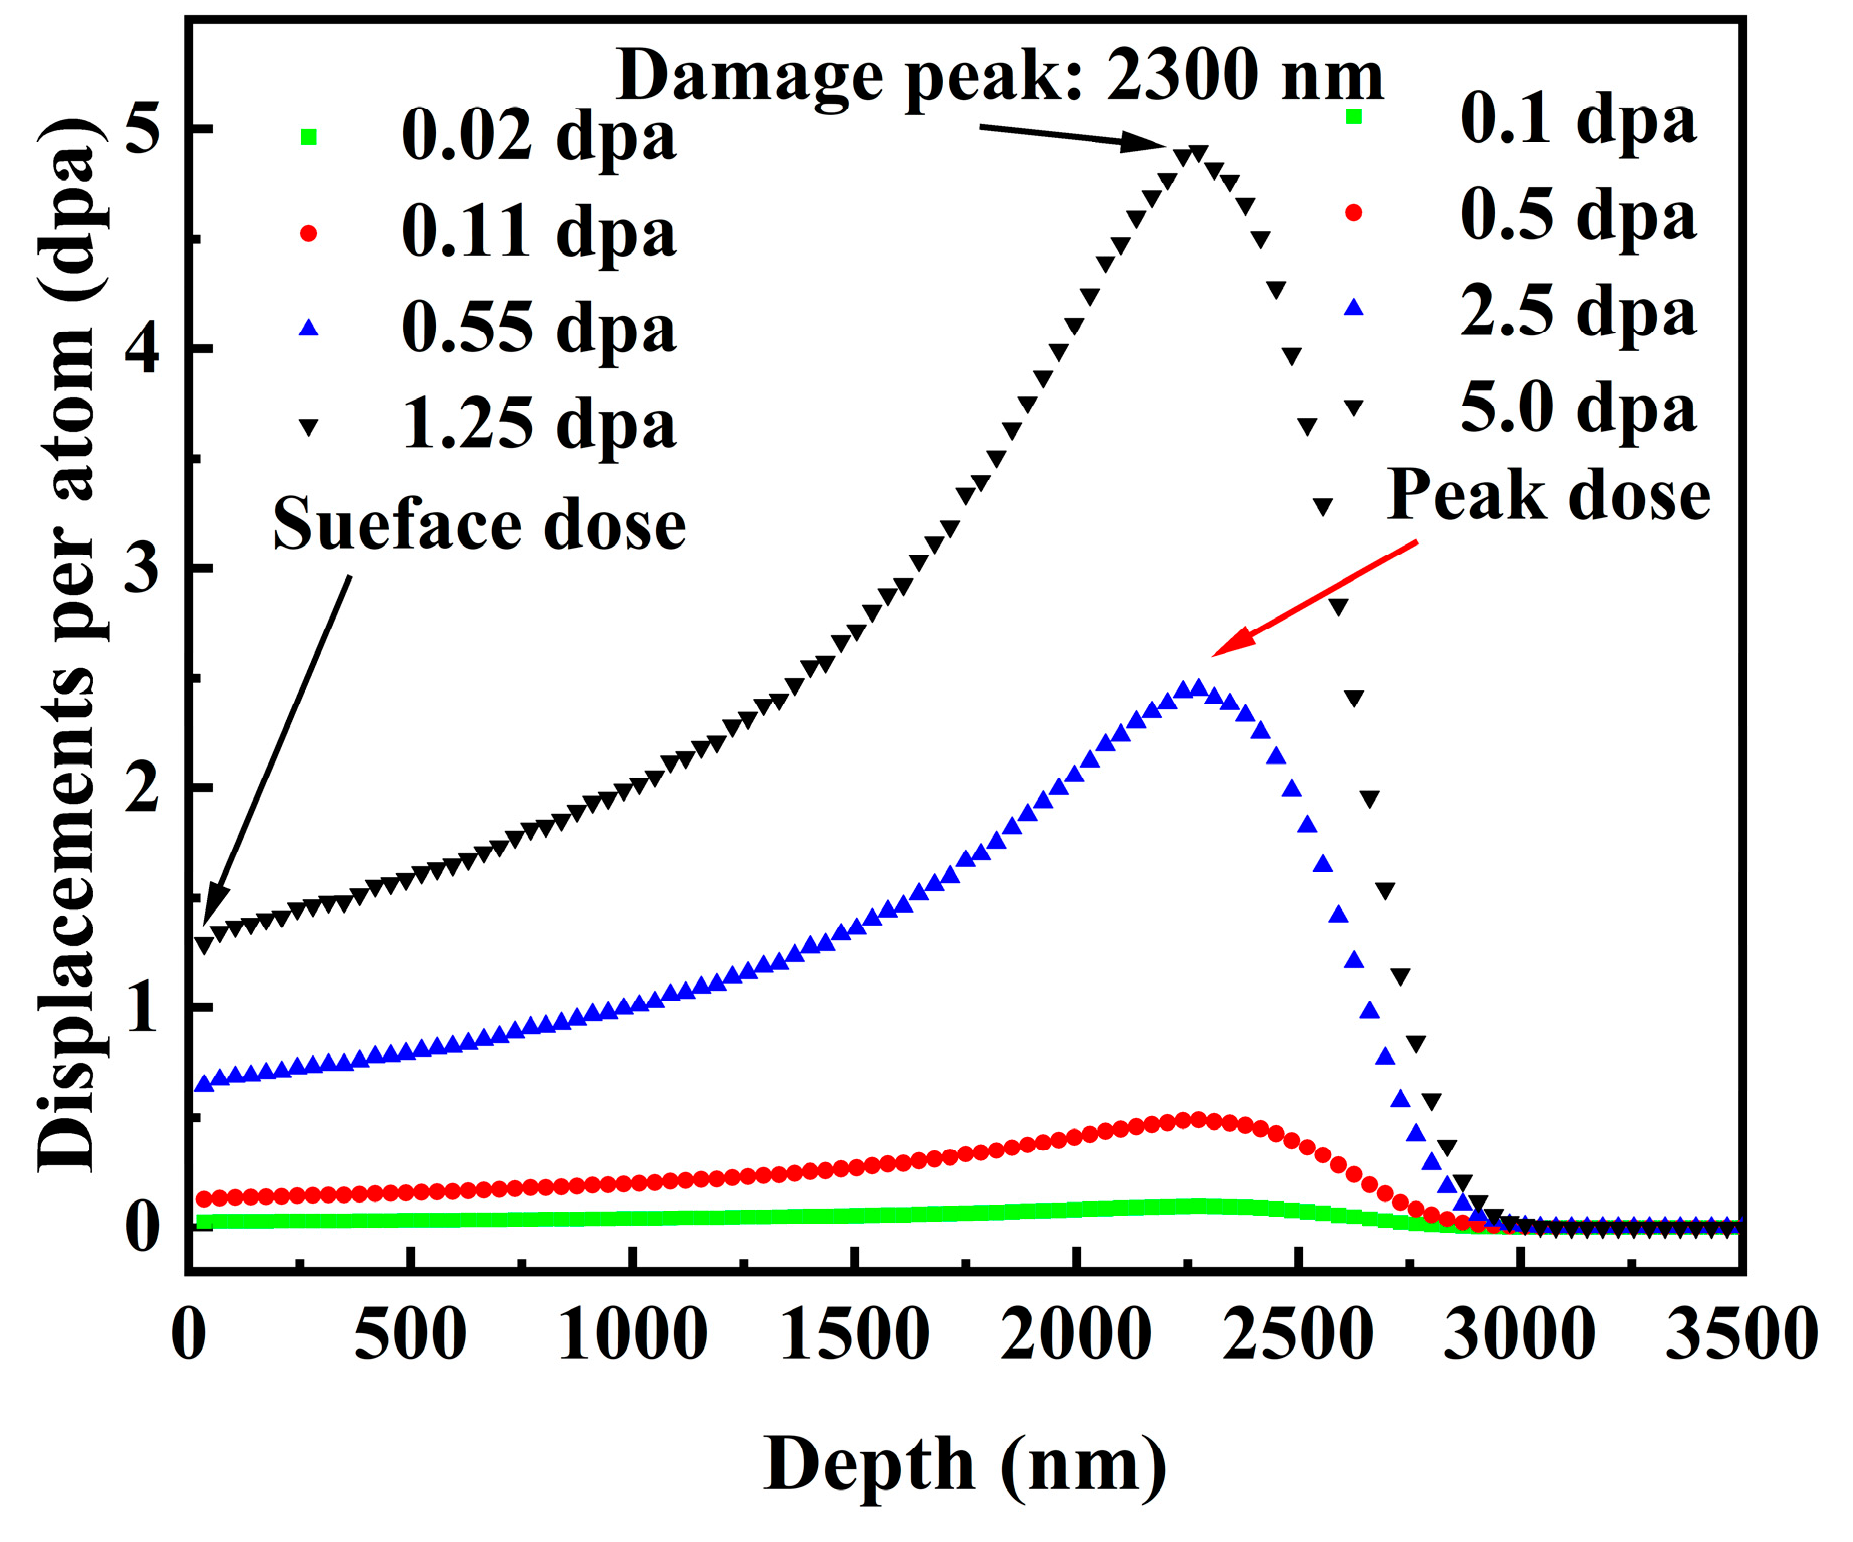
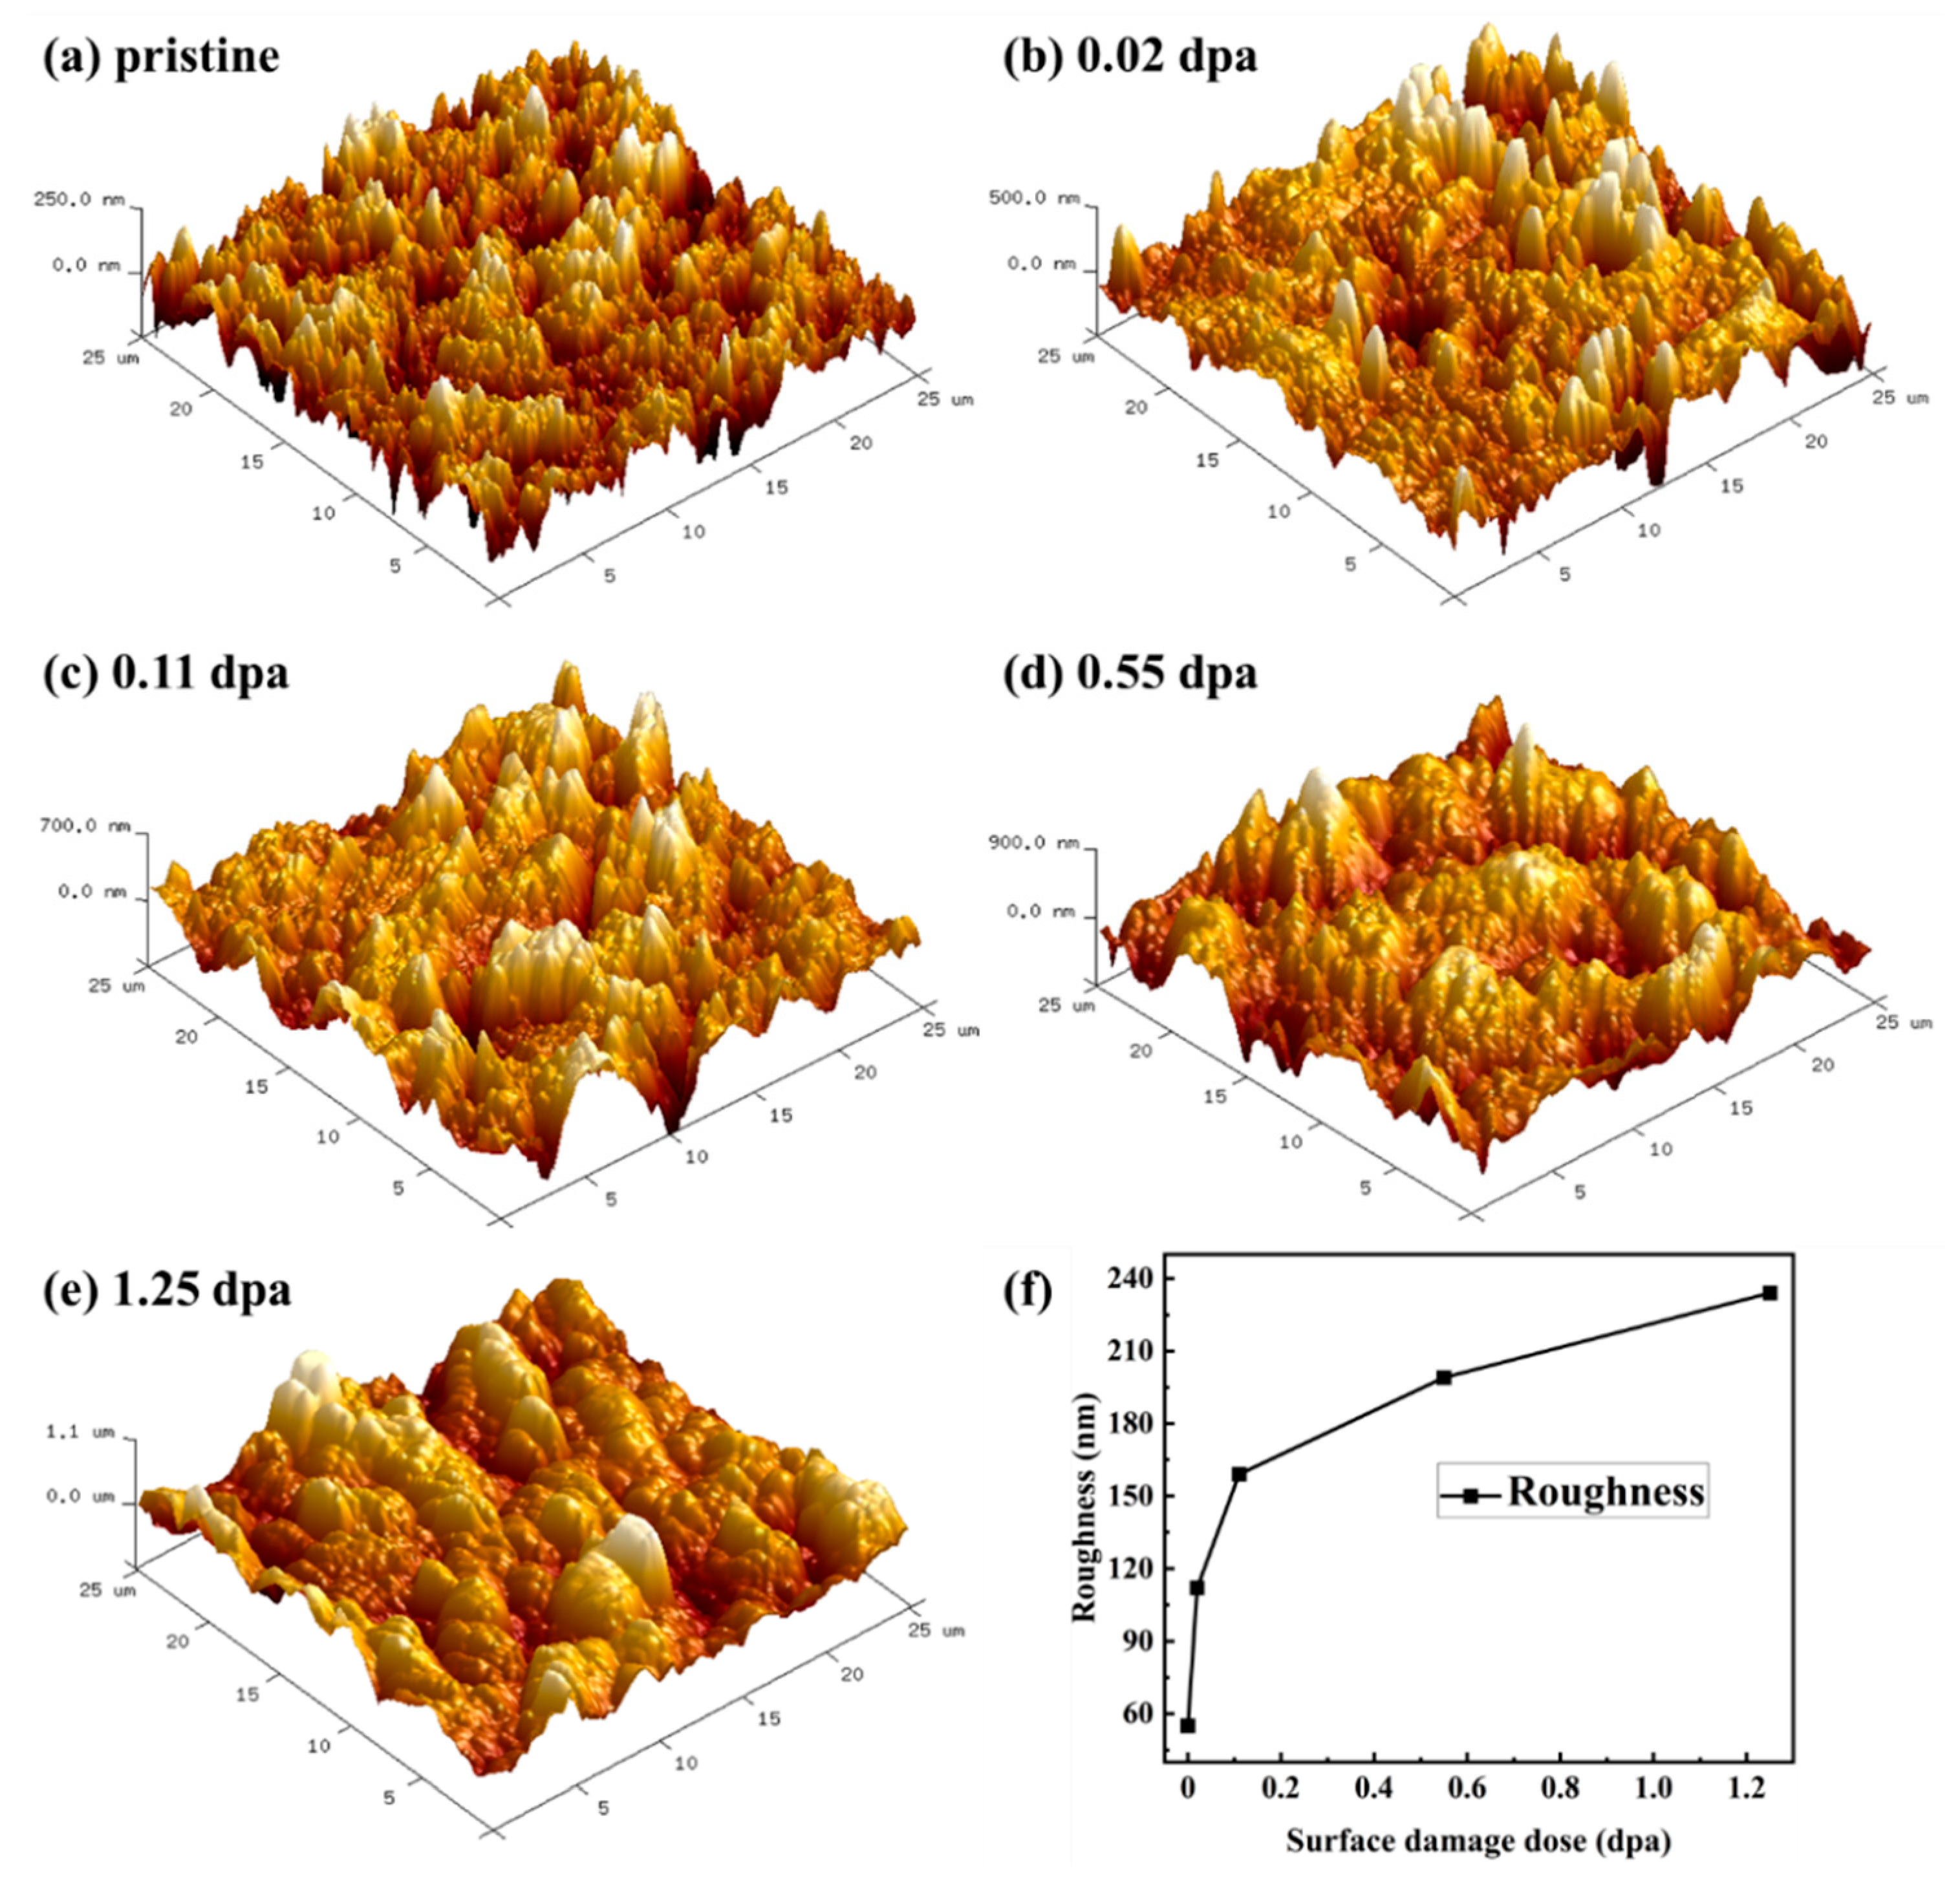
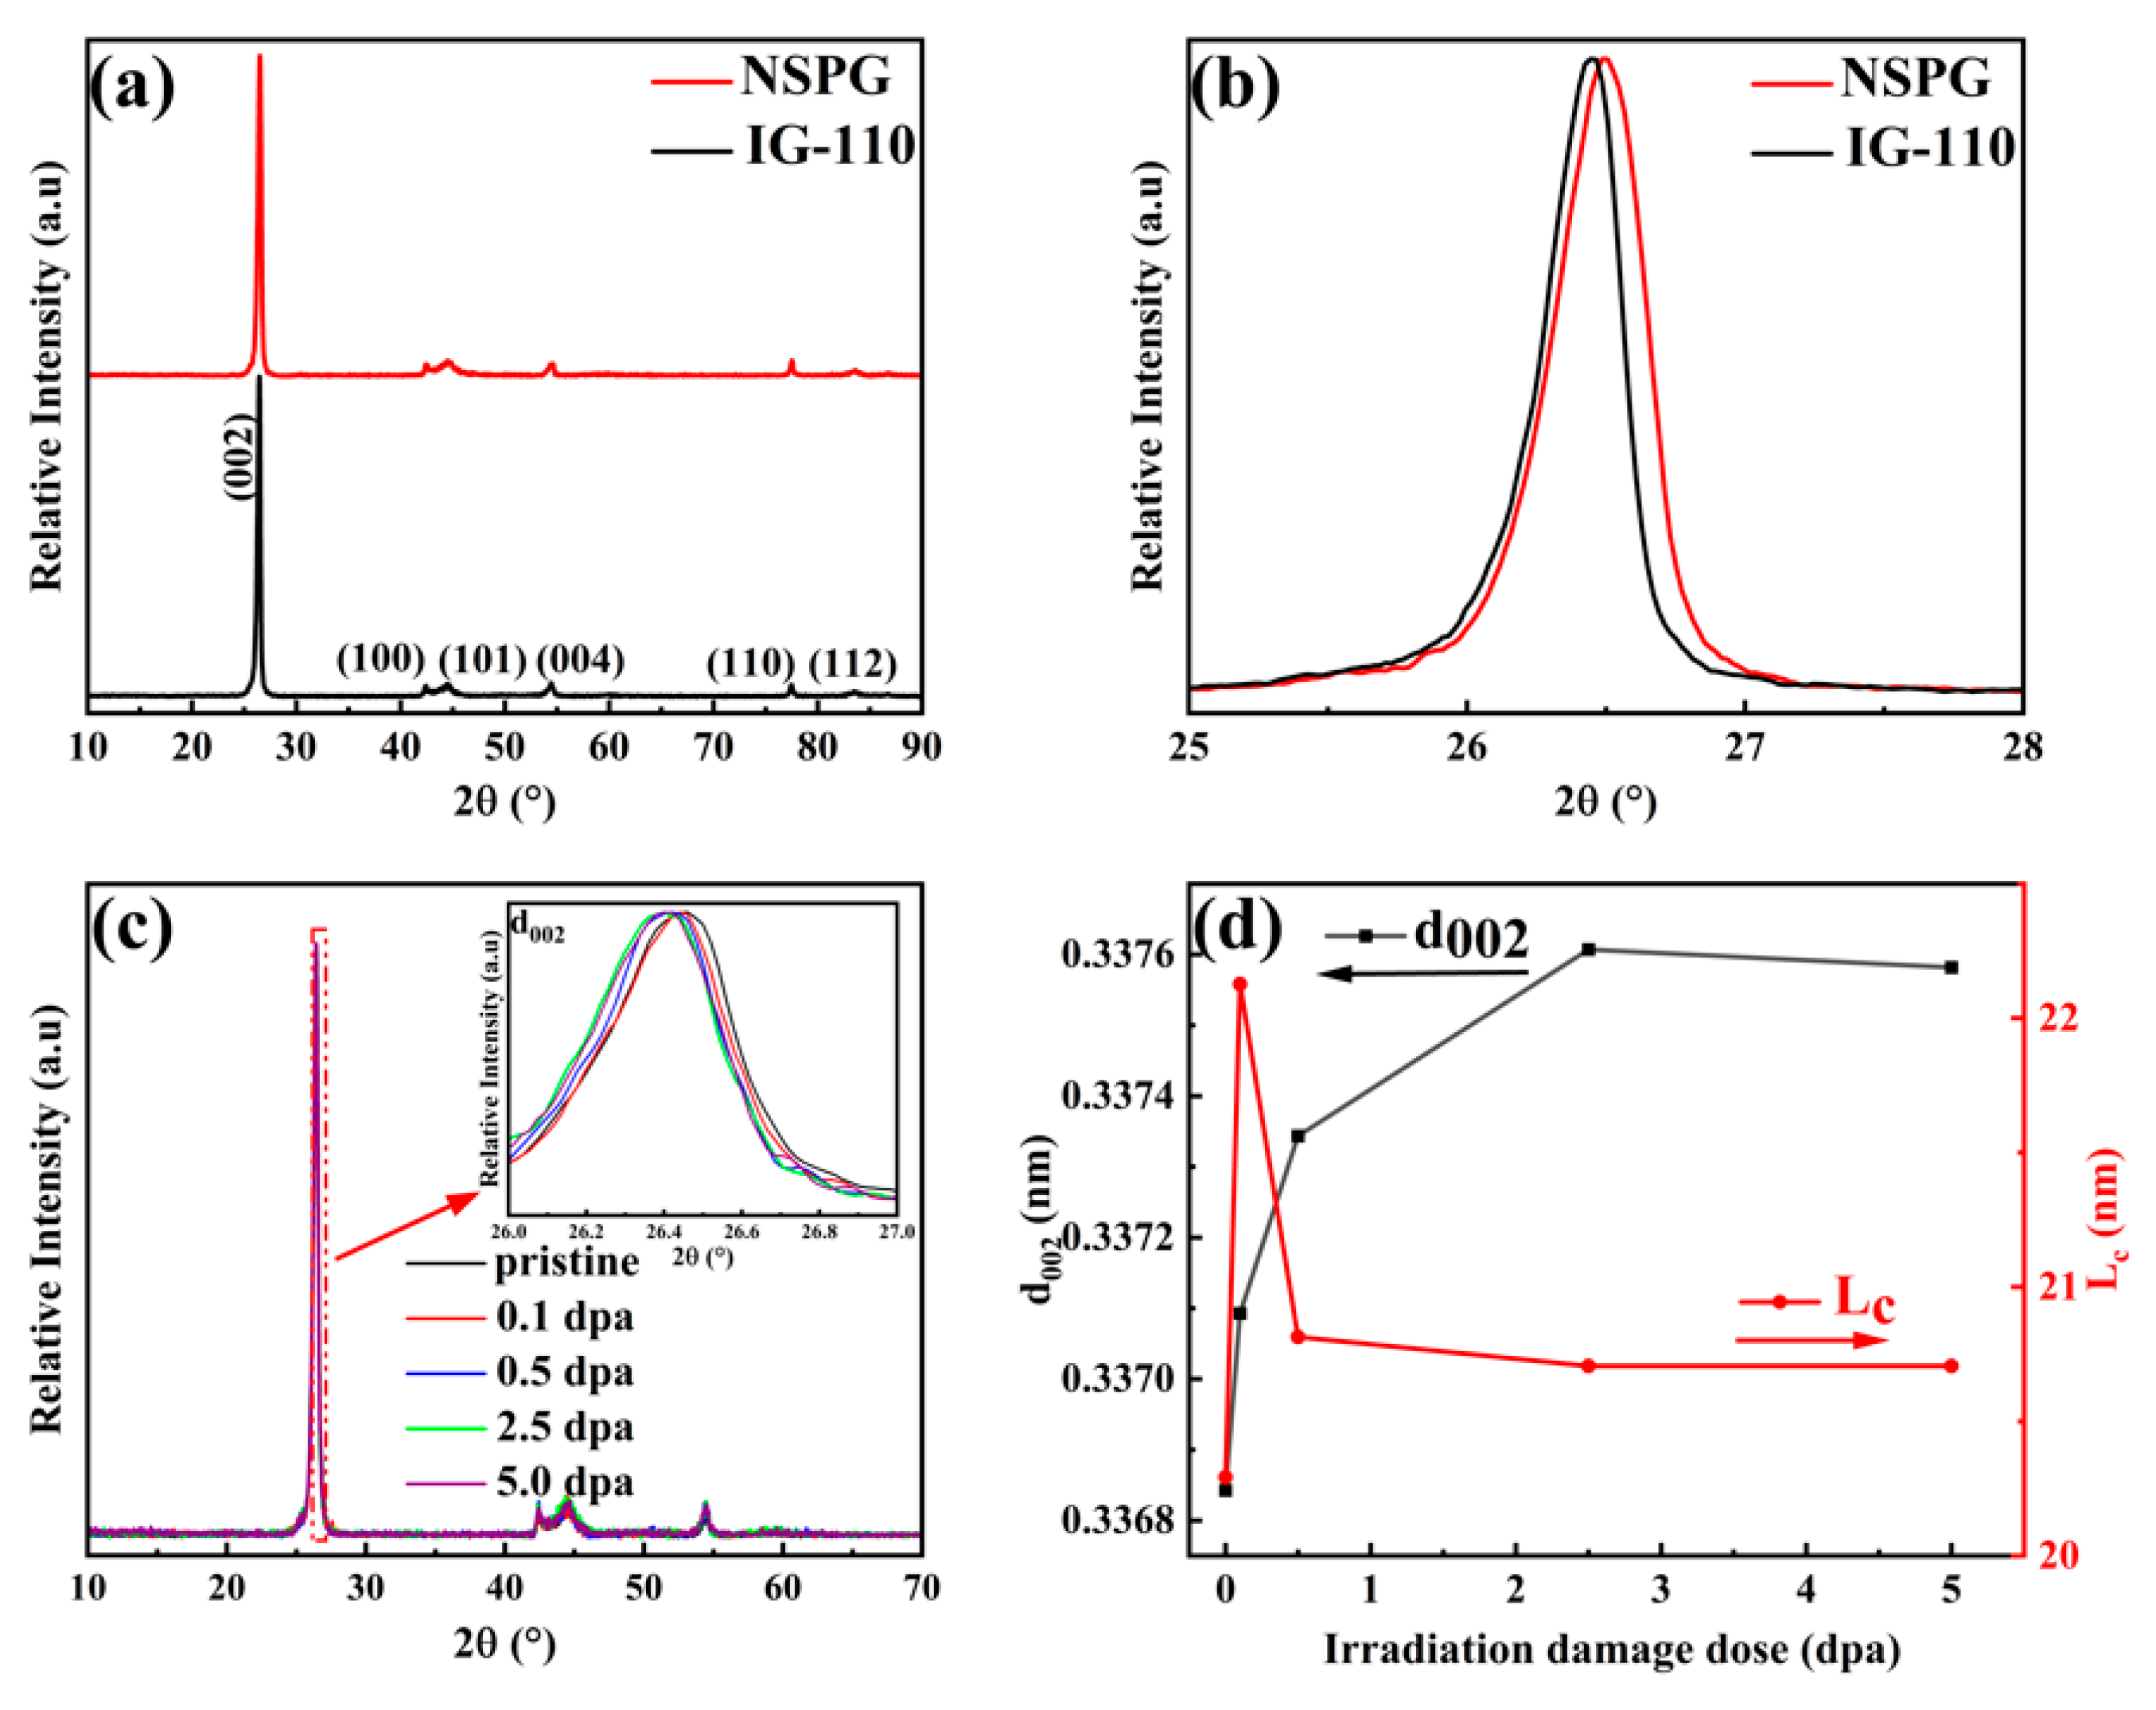
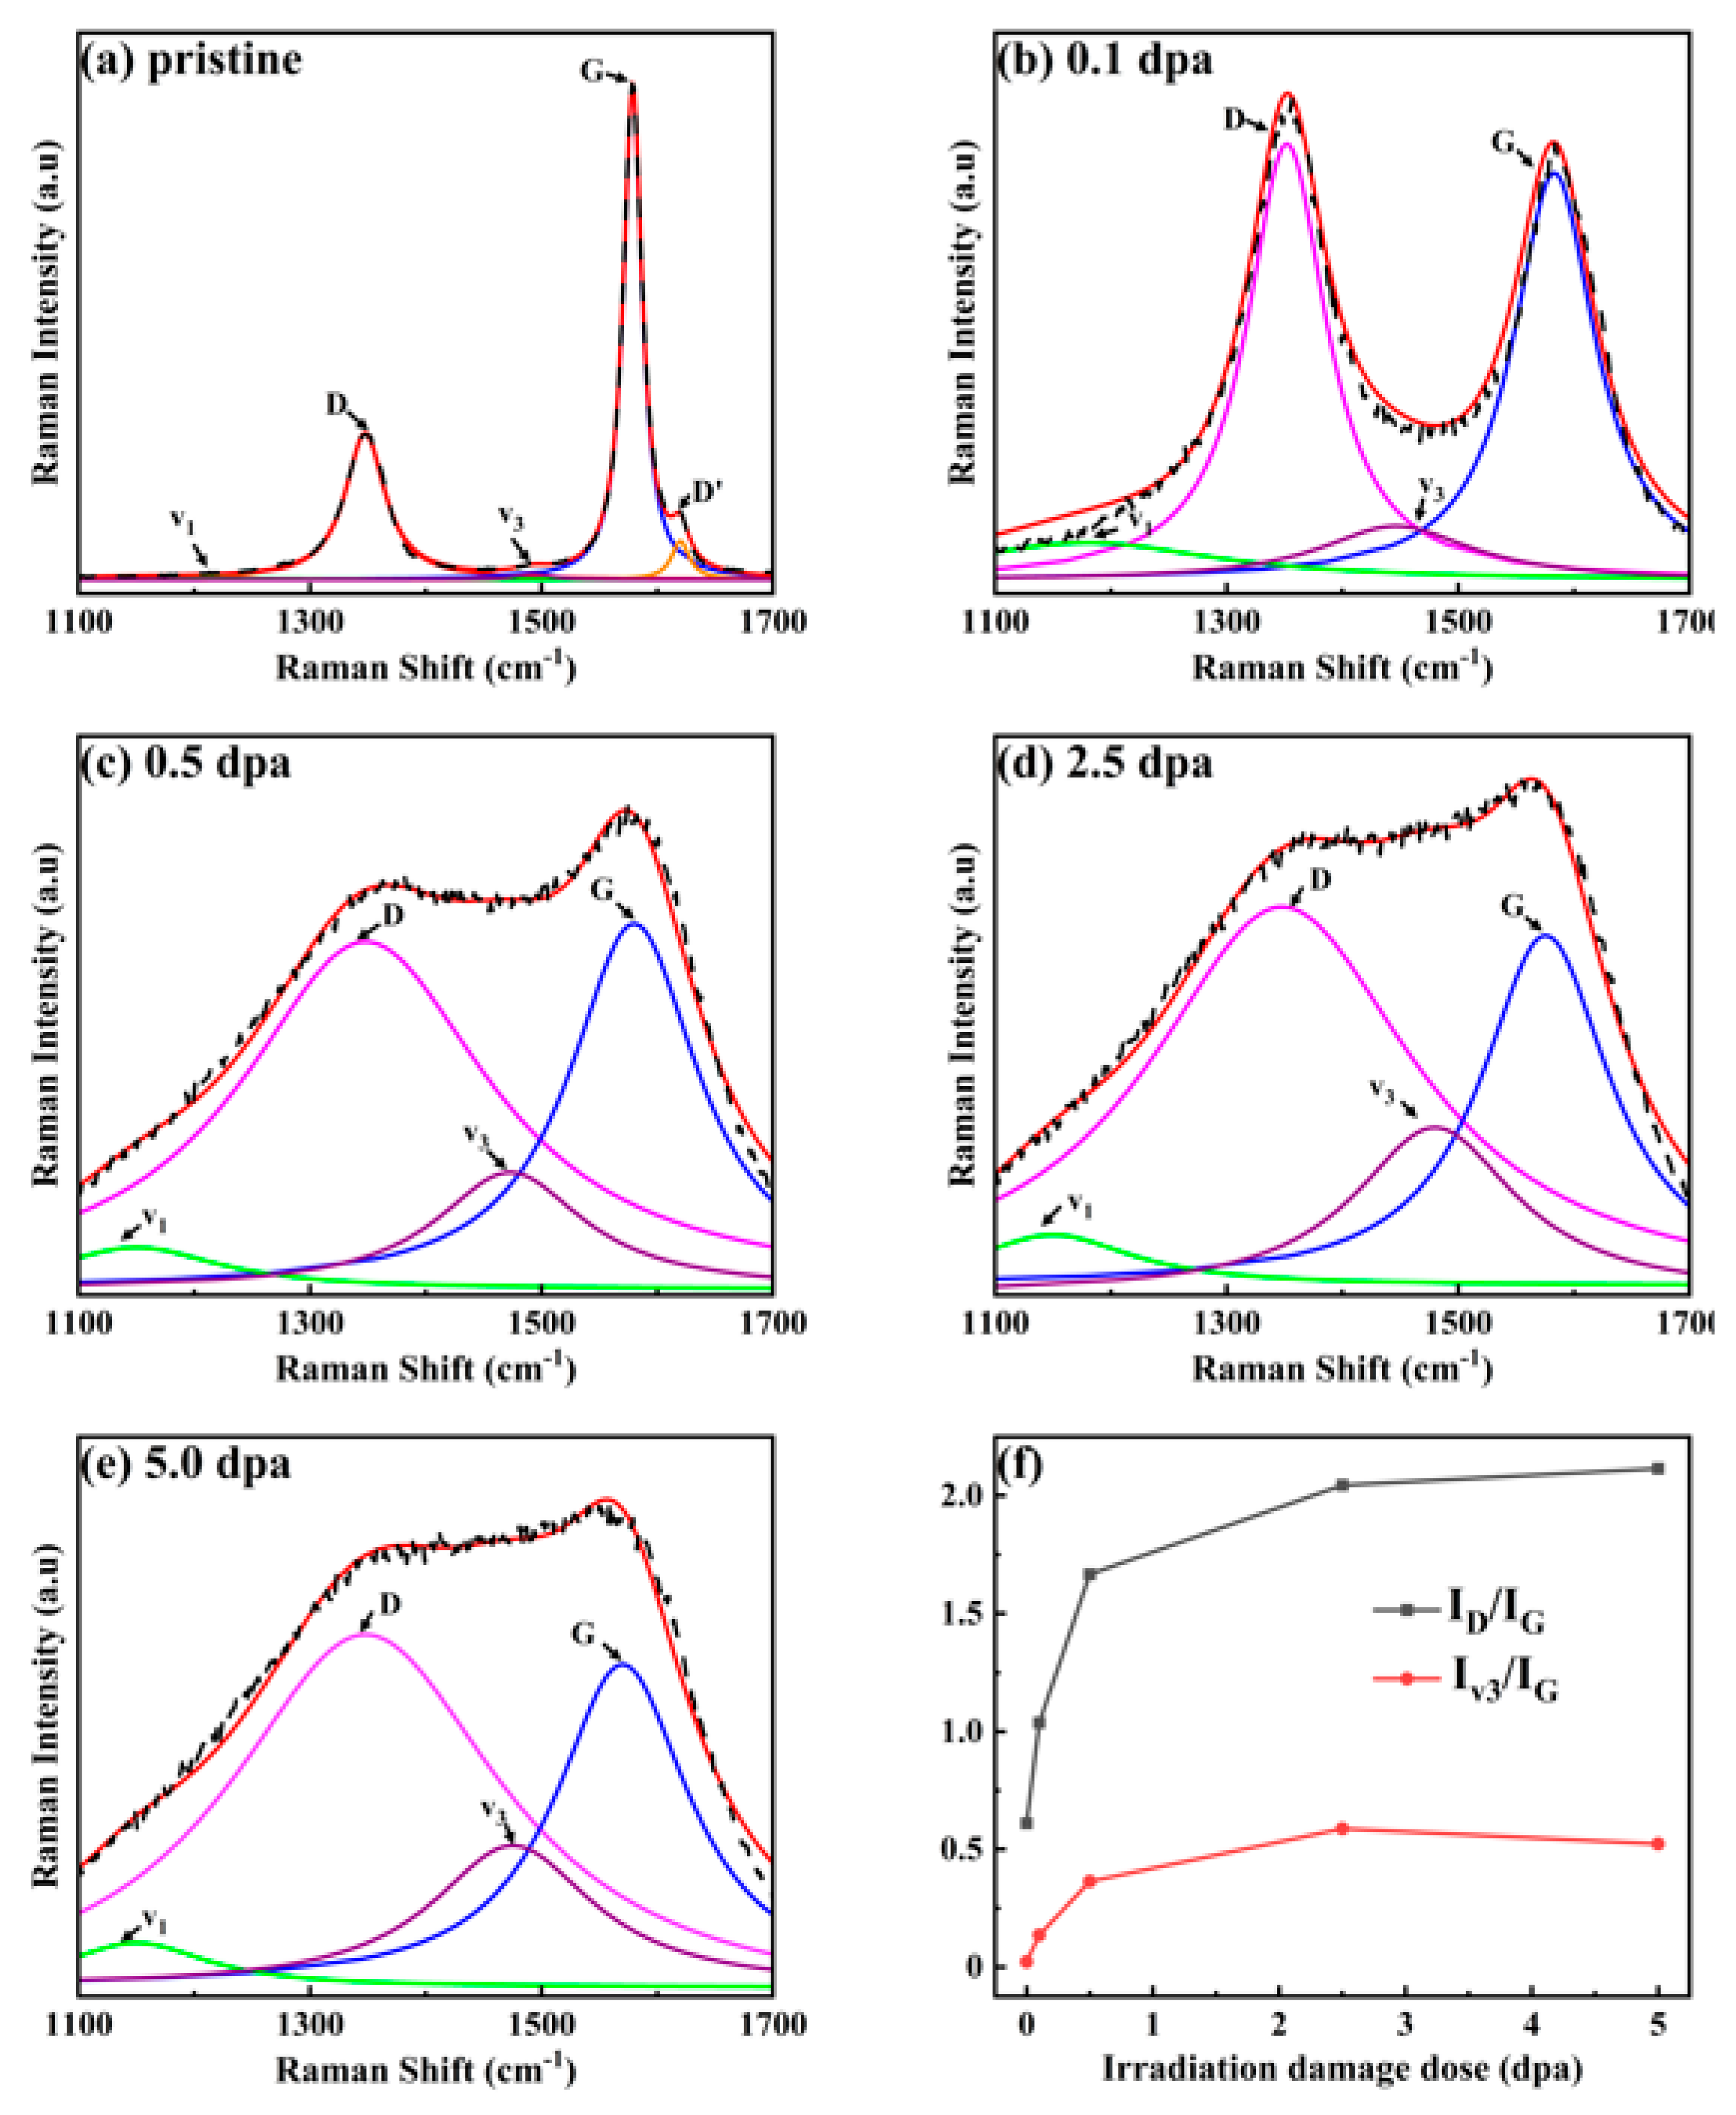
| Fluence (ions/cm2) | Peak irradiation dose (dpa) | Surface irradiation dose (dpa) |
| 9.6 × 10¹³ | 0.1 | 0.02 |
| 4.8 × 10¹⁴ | 0.5 | 0.11 |
| 2.4 × 10¹⁵ | 2.5 | 0.55 |
| 4.8 × 10¹⁵ | 5.0 | 1.25 |
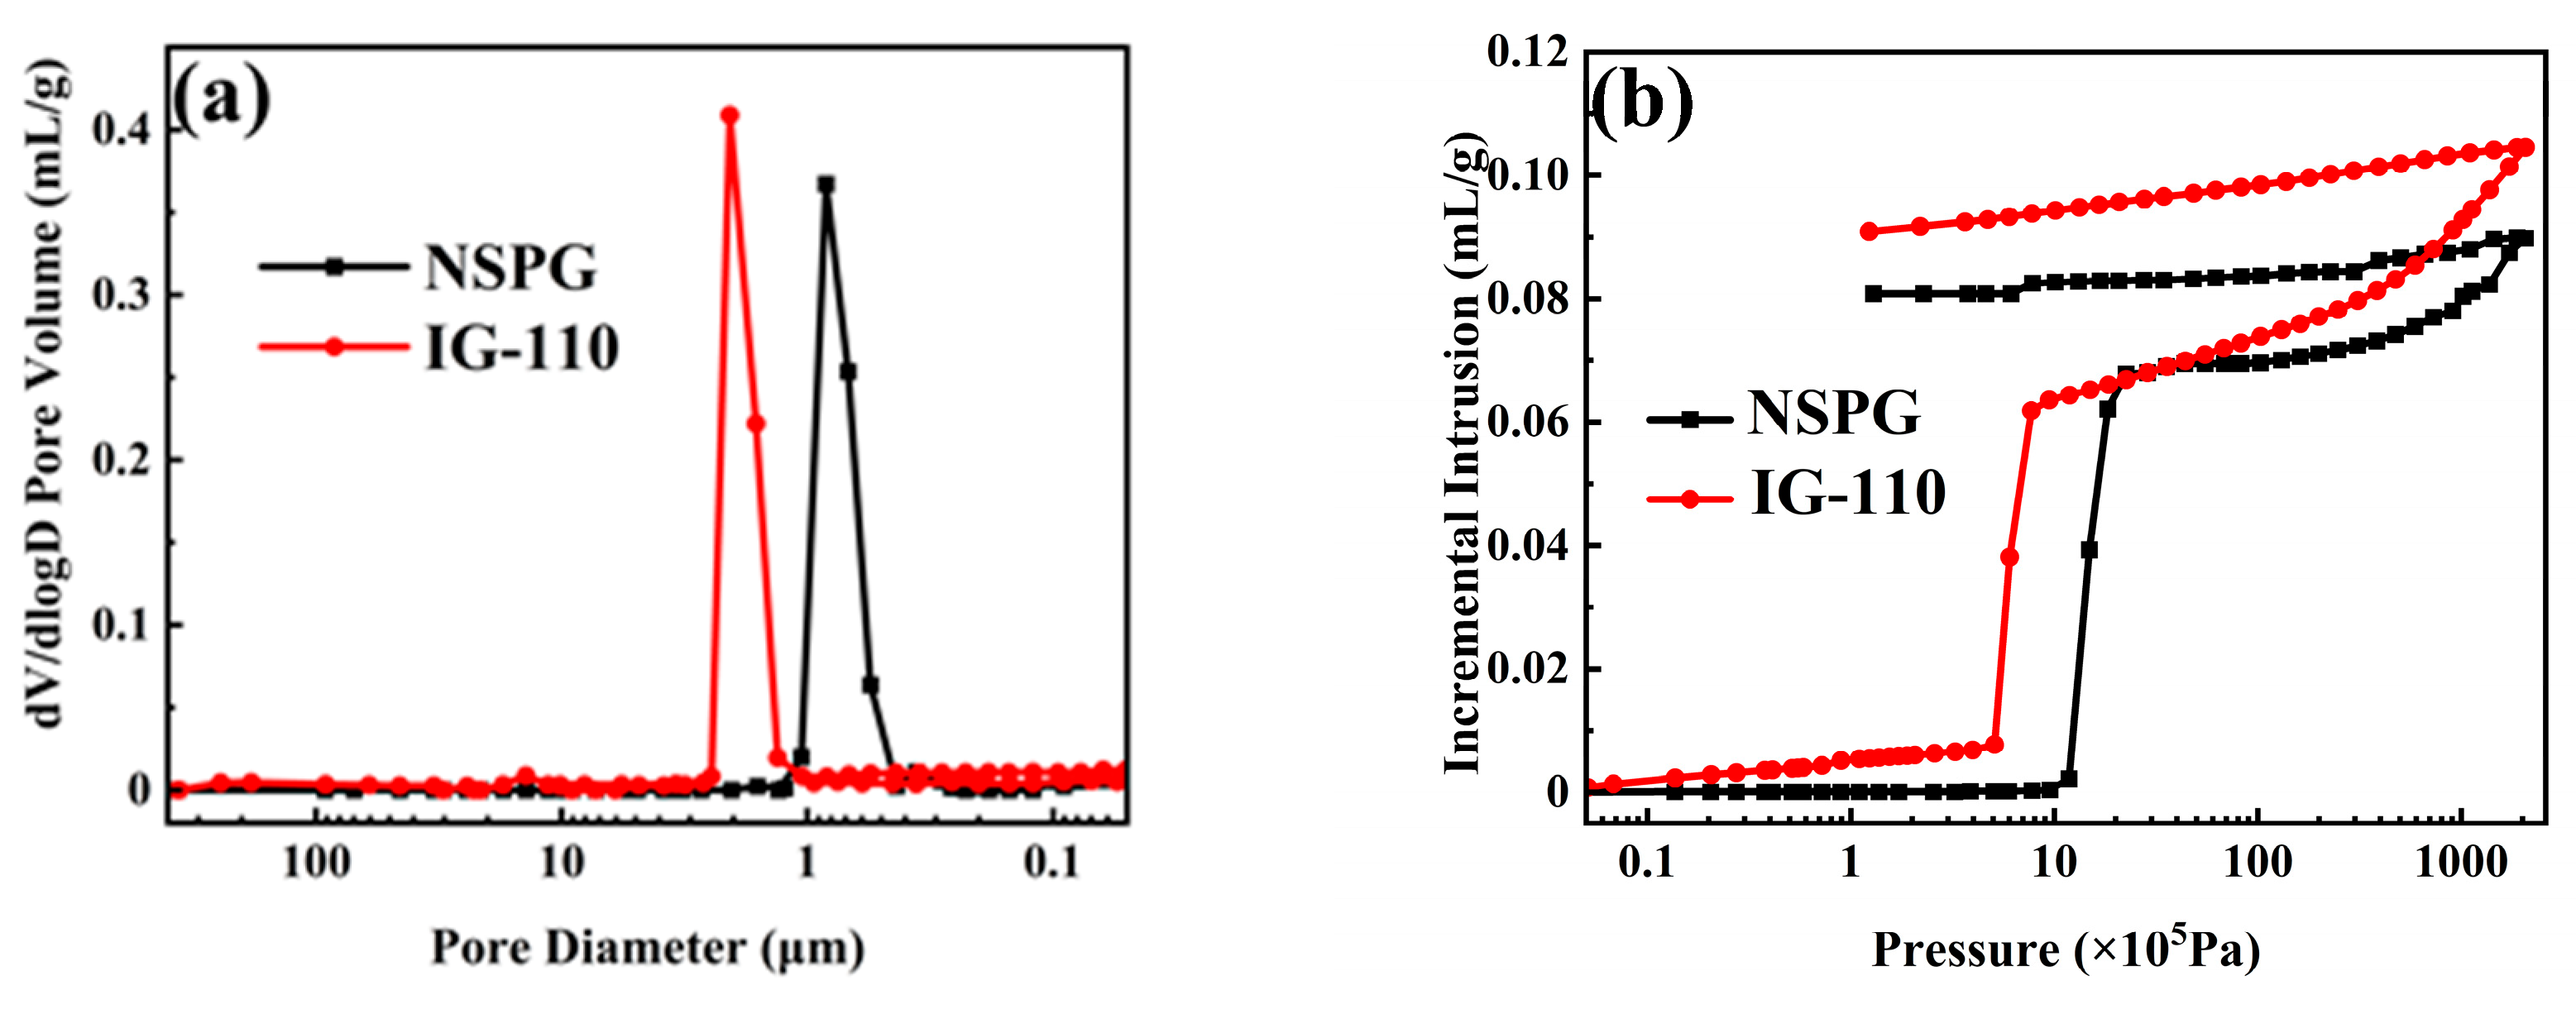
| Properties | IG-110 | NSPG |
| Bulk density (g/cm3) | 1.77 ± 0.02 | 1.79 ± 0.02 |
| Open porosity (%) | 18.4 ± 0.1 | 15.9 ± 0.1 |
| Median pore diameter (volume,μm) | 1.840 | 0.802 |
| Flexure strength (MPa) | 39.2 ± 2.5 | 61.0 ± 2.5 |
| Compressive strength (MPa) | 78 ± 3 | 102 ± 3 |
| Thermal conductivity (W/m·K) | 116± 2 | 127± 2 |
| CTEs (25-300 °C, 10-6/K) | 4.5 ± 0.2 | 4.1 ± 0.2 |
| Graphite | NSPG/IG-110 | ||||
| Irradiation damage dose (dpa) | 0 | 0.1 | 0.5 | 2.5 | 5.0 |
| Crystallite Lateral Size La (nm) | 31.516/24.976 | 18.664/8.339 | 11.581/7.633 | 9.423/7.542 | 9.111/7.267 |
Disclaimer/Publisher’s Note: The statements, opinions and data contained in all publications are solely those of the individual author(s) and contributor(s) and not of MDPI and/or the editor(s). MDPI and/or the editor(s) disclaim responsibility for any injury to people or property resulting from any ideas, methods, instructions or products referred to in the content. |
© 2024 by the authors. Licensee MDPI, Basel, Switzerland. This article is an open access article distributed under the terms and conditions of the Creative Commons Attribution (CC BY) license (http://creativecommons.org/licenses/by/4.0/).


