1. Introduction
Tropical rock lobsters (
Panulirus ornatus) have significant aquaculture potential, however; as a juvenile animal they are highly cannibalistic, which provides a challenge for the large-scale propagation of this species. Cannibalism events predominantly occur for
P. ornatus during the process of ecdysis (moulting), where the moulting animals are cannibalised by intermoult animals. In this study, intermoult is defined as one-week post-ecdysis extending to the earliest external signs of pre-ecdysis. The initial visual signs of pre-ecdysis in this study are noted by ventral surface pigment absorption and darkening of the region between the thorax and abdomen, and the darkening of the pleopods and uropods [
1]. In lobsters more pre-imminent visual signs of ecdysis occur one to two days prior to ecdysis with suture line development on the region between the carapace and the branchiostegite (external gill cover region) of pre-ecdysis lobsters [
1]. Identifying pre-ecdysis juvenile lobsters may provide an opportunity to disrupt cannibalism and so is the primary focus of this study.
Suture line development is externally detectable and an unambiguous identifier of pre-ecdysis in lobsters [
1]. Suture lines on small lobsters are difficult to discern visually, making pre-ecdysis identification imprecise and onerous, and requiring experience for manual identification. An image of a clear, conspicuous suture line could improve both speed and accuracy of manual identification to facilitate separation of animals, reducing the load on production staff, and increasing productivity [
2]. Improving suture definition would also increase the likelihood of success of an
in-situ computer vision pre-ecdysis detector. Lowe [
3] explains that feature extraction is simplified for images with less clutter which highlights the advantages in processing images of well-defined features on predominantly smooth backgrounds.
A complication for suture line detection in-situ is gaining a side-perspective view of lobsters from cameras on the bottom or side of culture vessels. The ability to detect pre-ecdysis through the surface of culture vessels is preferred and as the dorsal carapace of lobsters is predominantly directed towards the surface it presents as the ideal location on a lobster from which to sense pre-ecdysis.
Disconnecting the exoskeleton in preparation for moulting may result in changes of its surface biochemistry. Near infrared spectroscopy being a tool used to detect such changes. Pre-ecdysis absorption of minerals and nutrients from the integument is another potential identifier of pre-ecdysis in lobsters which may enable dorsal surface pre-ecdysis characterisation with a novel low-cost spectroscopy sensor [
4,
5].
Simultaneous data collection from a Sony IMX219 and an AS7265x spectral sensor can be coordinated through an edge computing device. Using broadband infrared illumination from Osram SFH 4737 LEDs and placing the camera lens in the centre of the AS7265x sensors creates an exploratory, novel low-cost spectroscopy sensor to attempt pre-ecdysis detection from the dorsal carapace. Aquino et al. [
6] demonstrated the combination of SFH 4737 LED’s with an AS7265x spectral sensor was able to create a low-cost tool to evaluate the fat content of olives while Noguera et al. [
7] assessed the ripeness of grapes and achieved promising results.
This simple, low-cost experimental environment promotes exploration of possible solutions to detect pre-ecdysis lobsters in-situ. The post-ecdysis dorsal carapace is a new surface which requires time to become mineralised following ecdysis. Being unmineralized makes it an ideal comparative surface with which to test the functional ability and resolution of the spectral camera. Successful recognition of the post-ecdysis dorsal carapace would opportunistically provide a documented post-ecdysis detector.
This study aims to appraise the comparative definition of suture lines in images against baseline images of intermoult lobsters under varying lighting conditions using a Sony IMX219 sensor. This study then aims to assess the viability of a low-cost spectral camera built around an edge computing device using low-cost components for the characterisation of pre-ecdysis, and/ or post-ecdysis from the dorsal carapace surface.
2. Materials and Methods
2.1. Test Animals
2.1.1. Animal Husbandry
The study was undertaken at the Institute for Marine and Antarctic Studies, (IMAS) University of Tasmania, Taroona over a duration of four months. Twelve hatchery bred and reared juvenile P. ornatus, were utilised in this study. Lobsters had a carapace length and weight range of 35.9 – 50.4 mm and 46.9 – 123.1 g, respectively. The lobsters were of mixed sex with 5 females and 7 males in the population. The lobsters were maintained in a communal culture vessel (2.52 m × 0.96 m × 0.38 m - length × width × height; volume 920-L), on recirculating seawater, temperature 26 ± 0.5 °C, salinity 34.0 ± 0.8, pH 8.2 ± 0.1 with culture vessels receiving 3 water exchanges h-1. Lobsters were fed twice daily with proprietary formulated pellet at a rate of 3.5% dry weight of animal body weight, adjusted to satiation. Cleaning of the tanks and removal of uneaten feed was done via siphon prior to each feeding event.
2.1.2. Moult Stages for Comparison
The moult stage groups for comparison are: 1) Intermoult lobsters, in this instance defined as one-week post-ecdysis extending to the earliest external signs of pre-ecdysis; 2). Pre-ecdysis, lobsters on the day of ecdysis with fully developed suture lines; 3). Post-ecdysis, lobsters on the day after ecdysis.
2.2. System Components and Construction
2.2.1. Host Edge Computing System
The host edge computing system was a NVIDIA Jetson Nano development kit (Rev 2B) running Jetpack 5.6. Nvgstcapture-1.0 is a Jetson image capture and camera control application supplied with the Jetpack SDK. Nvgstcapture-1.0 natively produces a live preview stream to a display and can simultaneously capture images. The system was built on to Nvgstcapture-1.0 to include control of the light sources via the system’s GPIO. UART communication with the AS7265x spectral sensor was added using the Termios libraries using programmed AT commands through a USB UART interface. Imaging via a CSI/MIPI interface and spectral data collection via USB allowing near simultaneous (<100 ms) operation.
2.2.2. Camera
The Sony IMX219 NOIR was used for all image collection. The sensor was mounted on an Arducam carrier board and connected to the host system via a CSI/MIPI interface. Arducam supply the IMX219 NOIR sensor with a motorised focus lens that is adjustable from the host system via the I
2C connection included in the CSI/MIPI interface specification [
8]. The camera was left in its default configuration with automatic exposure mode, permitting time to adjust to test light conditions before image acquisition. Although available with a NOIR designation from Arducam and Raspberry Pi, the sensitivity information of this camera is incomplete. Sony’s datasheet does not specify the full NOIR sensitivity of the sensor’s RGB channels beyond 700 nm, with Sony indicating that this sensor is not a designated IR sensor ([
9], Internal comms). Pagnutti et al. [
10] independently reviewed the specifications of this sensor on a Raspberry Pi V2 fixed focus module, but also did not report the sensitivity beyond 700 nm. A wider channel sensitivity bandwidth is reported for other Sony sensors. The IMX335 sensor has a similar sensitivity pattern to the IMX219 between 400 and 700 nm, with the expanded sensitivity plot showing how the three channels have overlapping sensitivity in the near infrared, just beyond 800 nm [
11]. It is expected that the channel sensitivity of IMX219 would behave similarly, due to the similarity of the underlying semiconductor and RGB filter properties.
2.2.3. Light Sources for Suture Line Imaging
Four illuminating light sources for suture line imaging were iPixel LED SJ-3W-CW cool white LEDs (visible light), LED Engin LZ4-00R408 850 nm LEDs (NIR), LED Engin LZ1-00UV0R 365 nm LEDs (NUV), and Osram SFH 4737 LEDs (IR broadband).
2.2.4. Near Infrared Spectroscopy Light Source
Osram SFH 4737 LEDs were used as the spectroscopy light source. The SFH 4737 LEDs operated for 3 sec bursts to meet the requirements for integration of the AS7265x sensors. LED 2000 driver demonstration boards (STEVAL-ILL051V1) were left in their default configuration for driving the SFH 4737 LEDs at 700 mA to generate a high intensity light. The operational parameters of the LEDs varied from those given in the datasheet (350 mA, 10 mS pulse) [
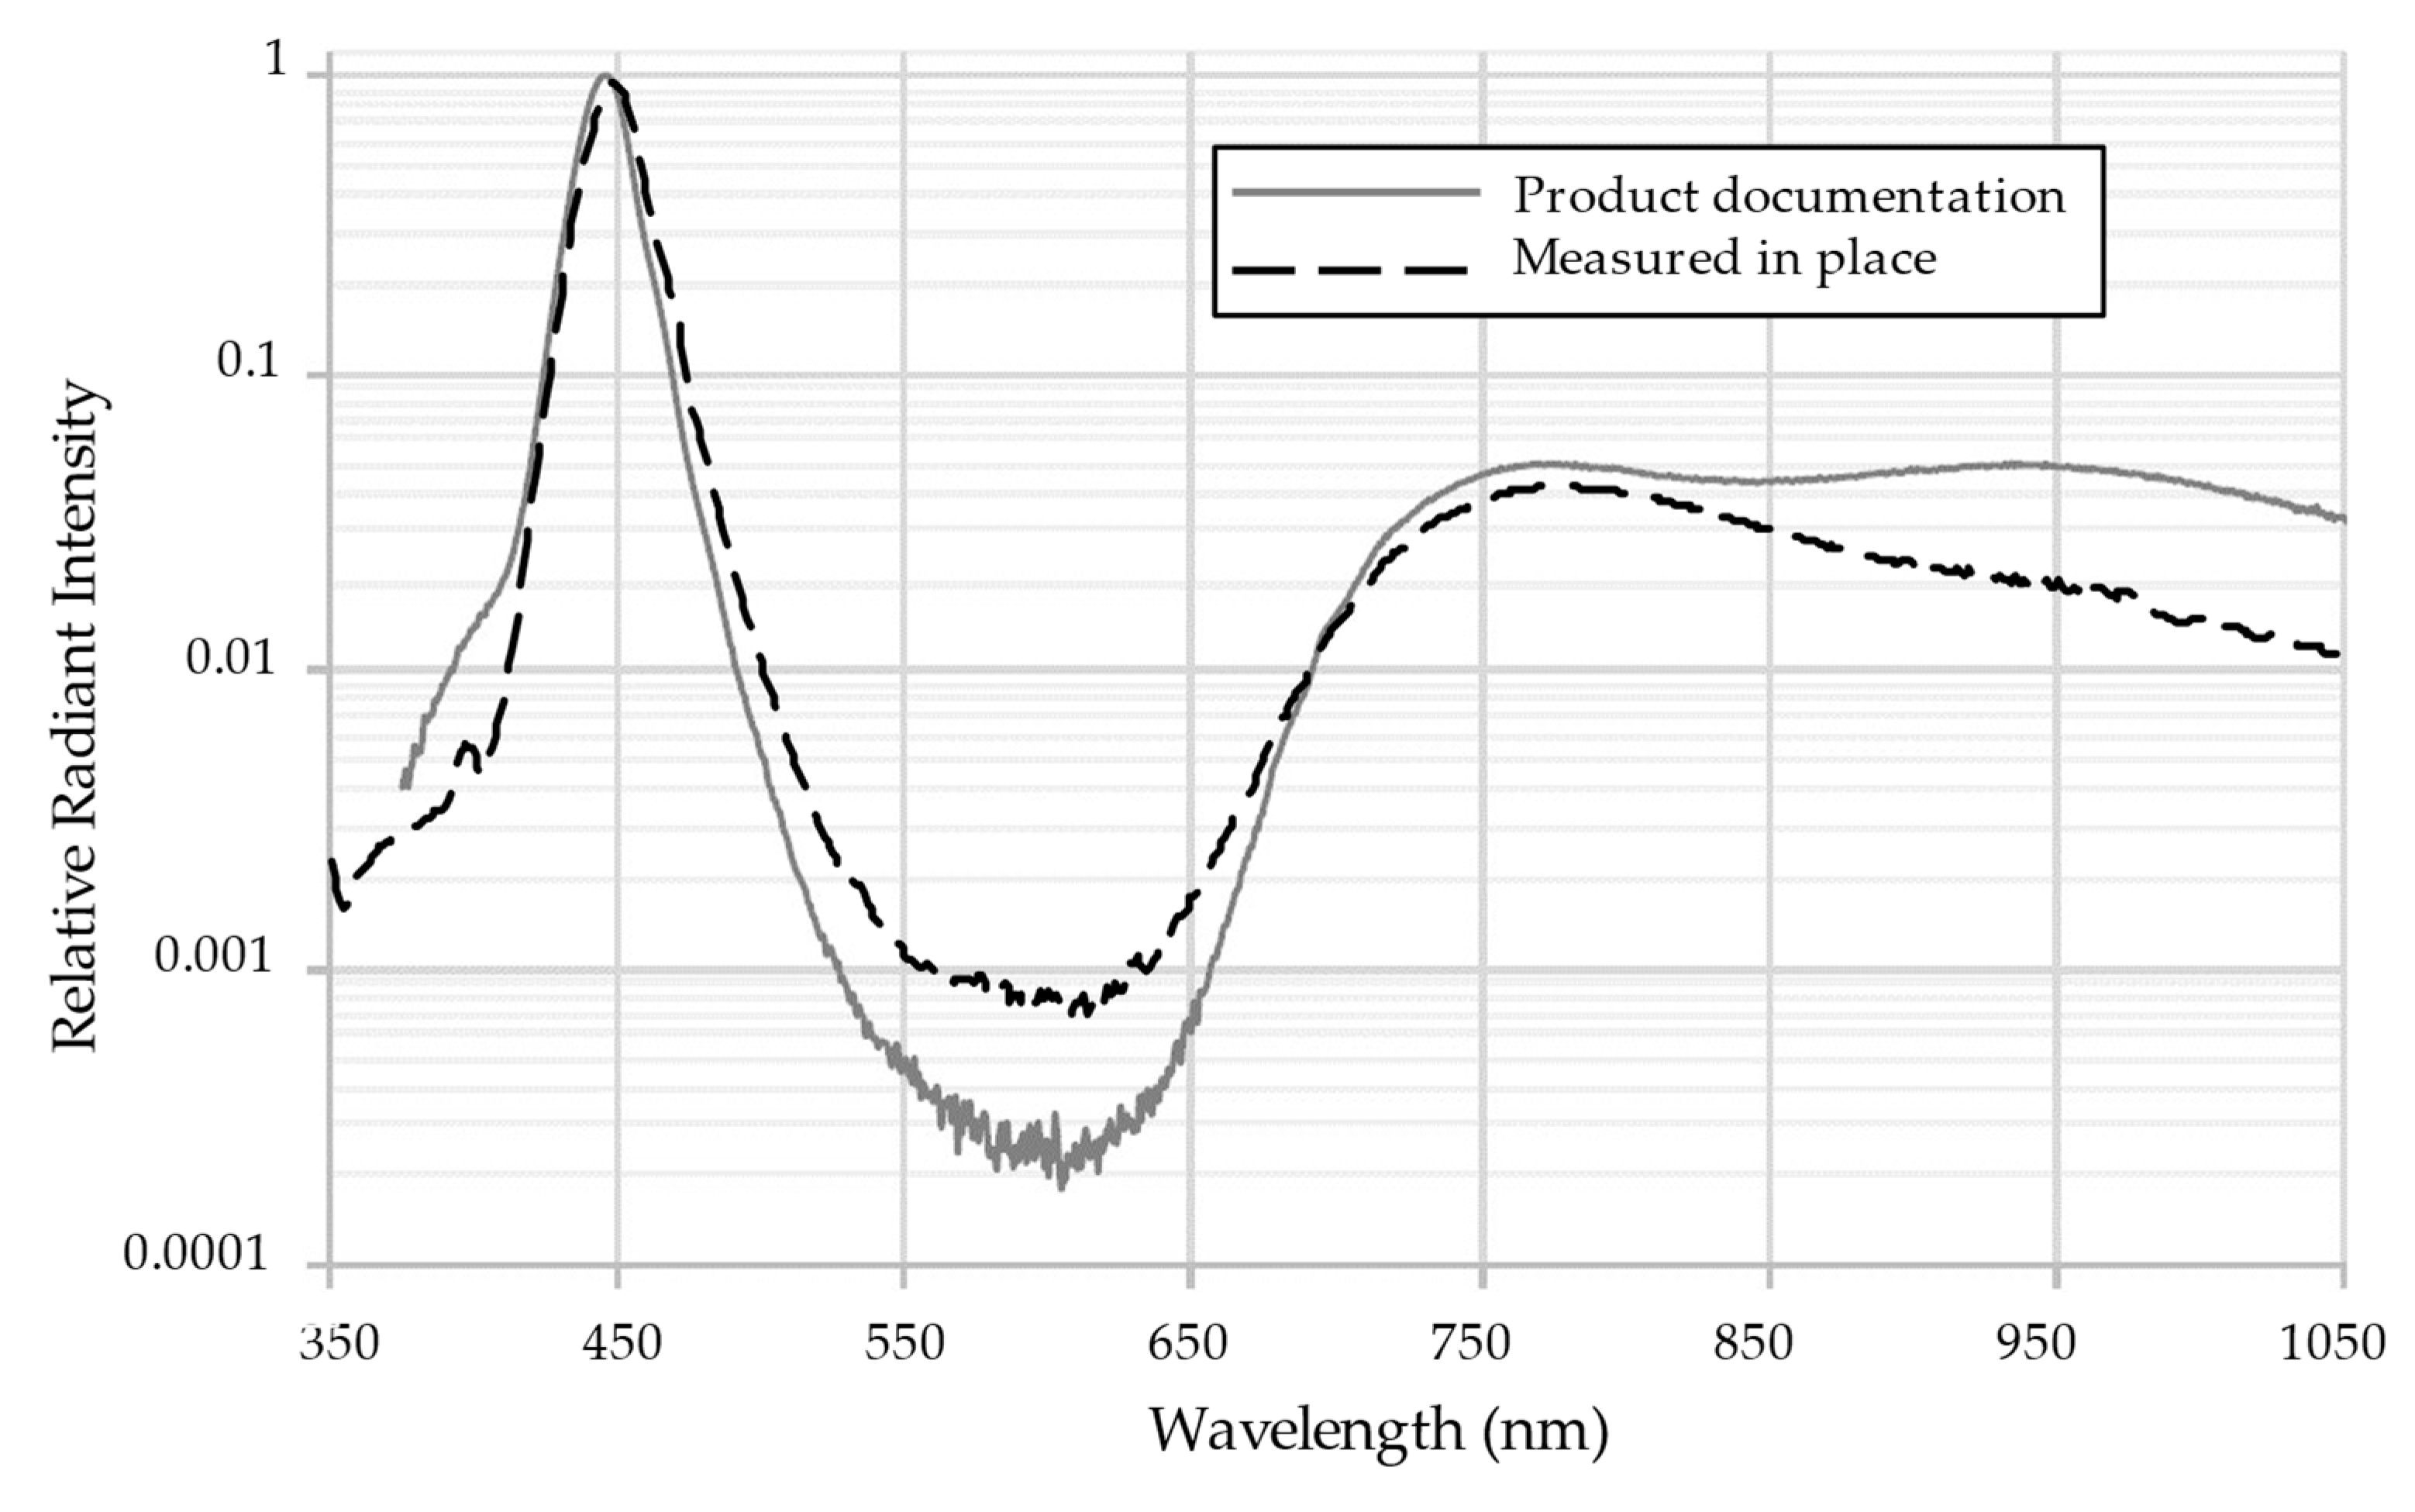
12]. The relative emission spectrum of the LEDs under operational conditions was recorded with a SpectralEvolution RS-8800 spectrometer off a 127x127 mm (5x5 inch) white 99% Spectralon reflectance panel. The measured curve of the LED relative radiant intensity emission spectrum was overlaid on the characteristic relative emission spectrum from the datasheet for comparison. The SFH 4737 LEDs were mounted on purpose built aluminium PCBs for heat control.
2.2.5. Spectral Sensor
AMS AS7265x 18-channel spectral array was used to capture spectral data. The AS7265x sensors were set to their maximum integration time of 708.9 ms. The AS7265x gain control is a linear multiplier and was set to its maximum value of 64. Test samples were taken to ensure the 16-bit channel data registers did not saturate and cause data loss. Each aperture of the three AS7265x sensors was covered with Tsujiden D121UP diffraction film to ensure adequate light diffusion from the target at close range.
The AMS AS7265x datasheet shows that each channel has an associated integration function that covers a bandwidth of light wavelengths [
13]. Each of the 18 integration functions is presented relative to its own peak value, resulting in a common scale between 0 and 1. This presentation overlooks the effects of relative channel sensitivity. A full calibration to a known light source is impractical with integration functions that are neither defined nor scaled to relative sensitivity. However, relative channel sensitivity can be investigated by testing with a calibrated light source.
Channel sensitivity was assessed with the low-cost spectral camera fitted in its housing. A LabSphere Helios (Model USLR-D12L-NANS) integration sphere with a 150 W lamp at 50% power was used as the test source. Raw data from test shots taken by the AS7265x was corrected using the formula:
Where
is calibration gain,
is calibrated source radiance,
is measured total signal or dark current of the test sensor, and
is the integration time of the test sensor. All test data was analysed as relative values because the continuous wavelength readout from the Helios integration sphere could not be mapped to the channel outputs of the AS7265x due to the undefined channel integration functions.
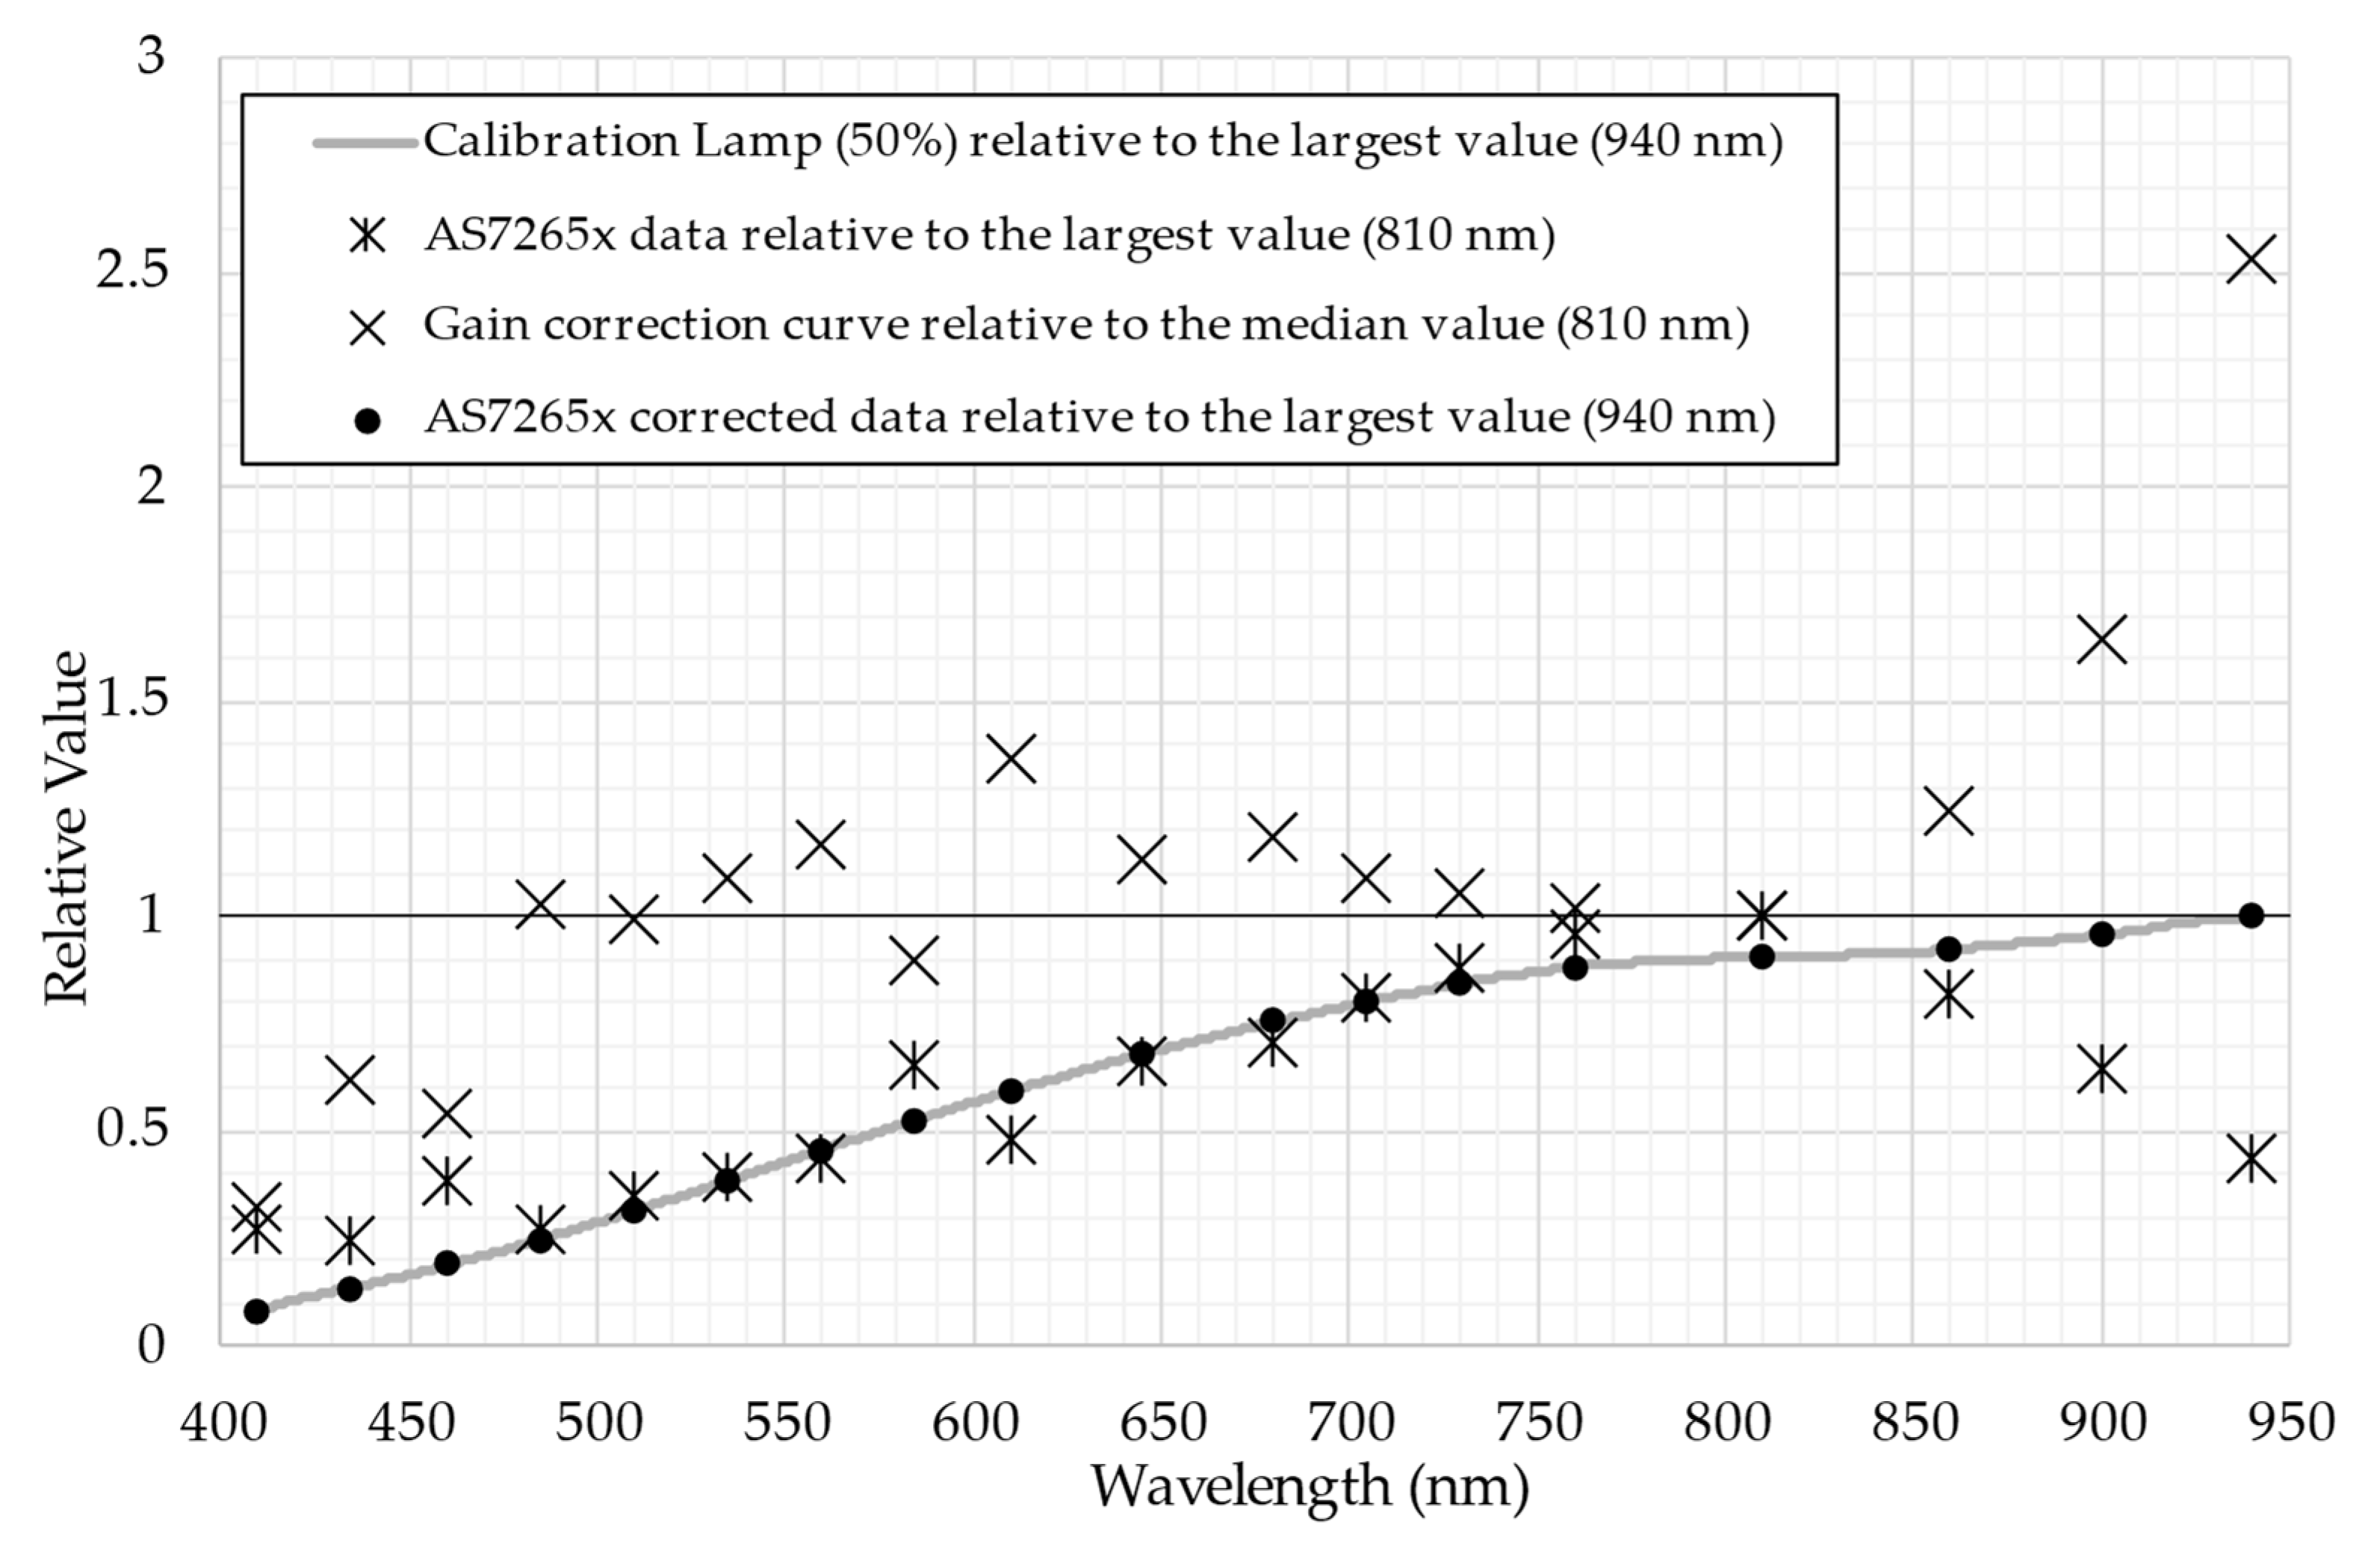
Four reference values were required to relatively adjust, align, and compare the known curve of the test light source, the readings of the test light source from the AS7265x, the gain correction curve, and the gain corrected readings of the test light source from the AS7265x. The four reference points were: 1). The test light source data was made relative to the value at 940 nm as this was the highest value in the relevant wavelength domain. 2). Readings of the test light source from the AS7265x were made relative to the 810 nm channel value as this was the highest recorded value. 3). Gain correction curve values were made relative to the 810 nm value as this value was close to the median value of the gain correction curve and it also aligned with the AS7265x data reference in point 2. 4). The gain corrected AS7265x readings of the test light source was made relative to the 940 nm channel value as this was the highest value and aligned the AS7265x corrected readings to the known test light source curve. The derived gain correction curve can be used to assess the extent to which channel sensitivity contributes to the acquired data.
2.2.6. Low-Cost Spectral Camera
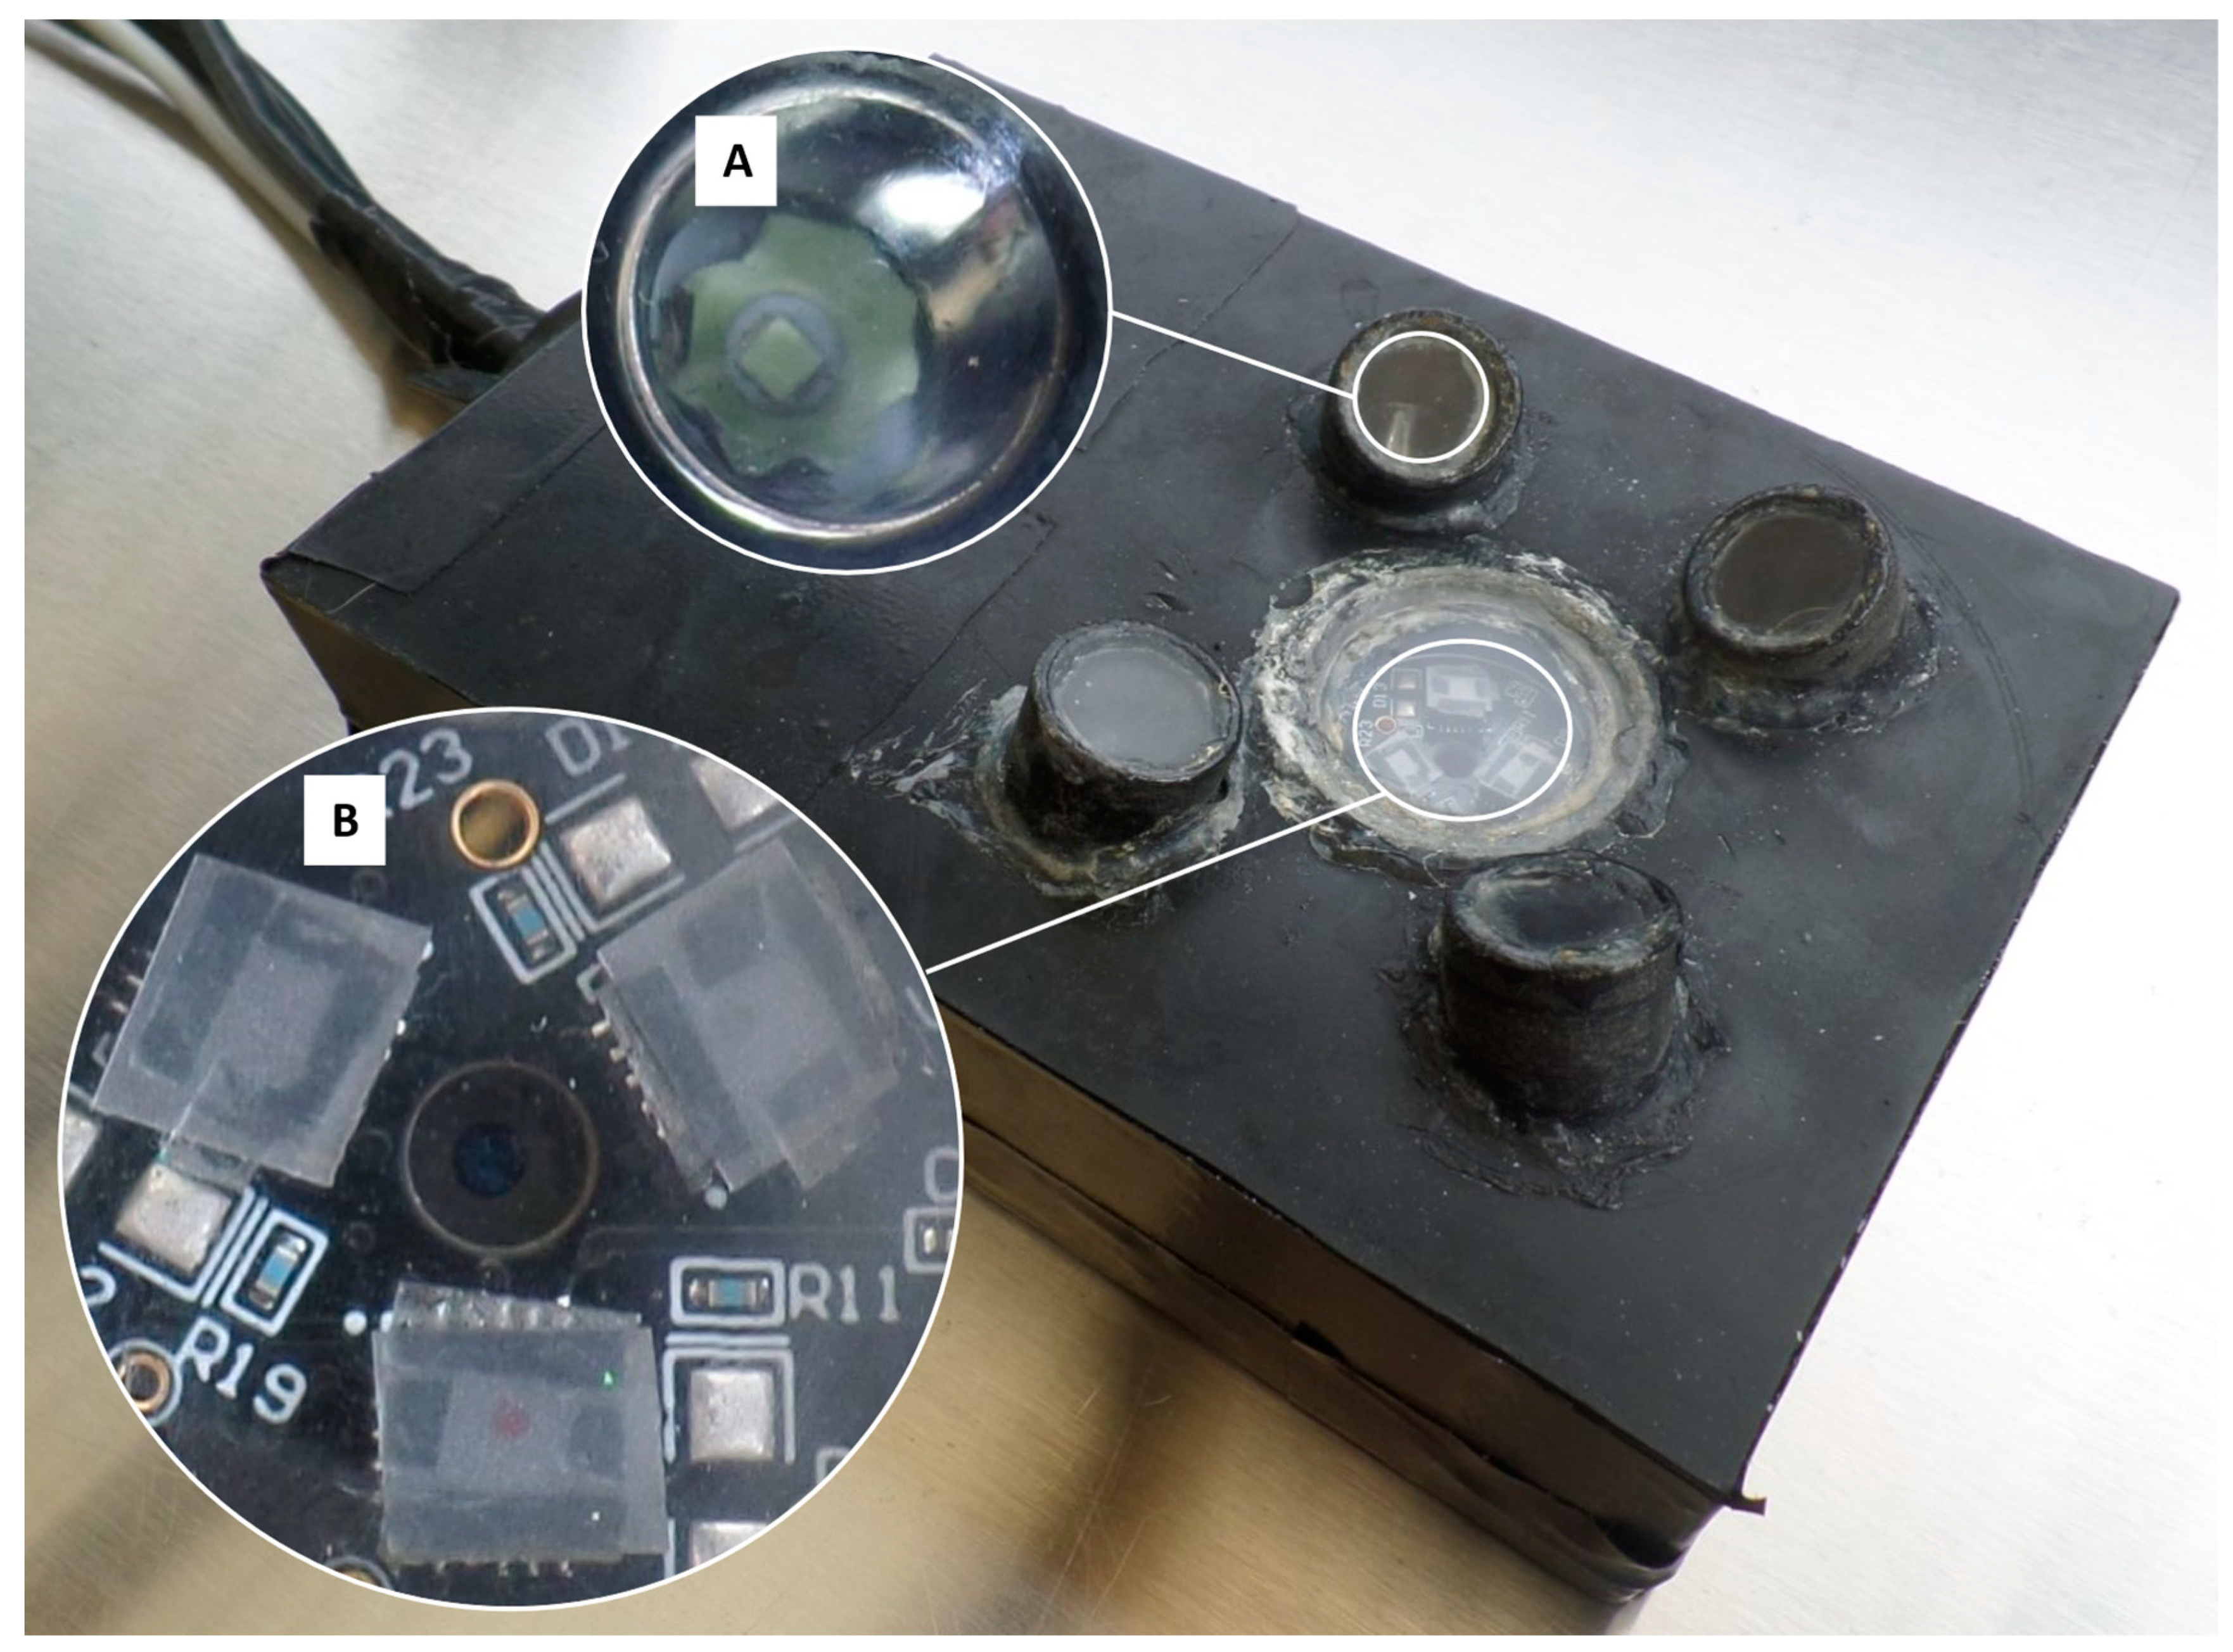
The low-cost spectral camera was constructed by mounting the camera lens through a hole central to the placement of the three AS7265x sensors on the AMS AS7265x demonstration board. Four Osram SFH 4737 LEDs surrounded the low-cost spectral camera in a purpose-built black HDPE housing with acrylic windows. Each LED was surrounded by a parabolic reflector and fitted into a separate tube. The four tubes were mounted in the housing to focus the individual light beams to a point 75 mm directly in front of the camera lens and AS7265x spectral sensors (
Figure 1). A manual action button was used to trigger the capture sequence of 1). Ambient LEDs off; 2). SFH 4737 LEDs on; 3). Integration delay/ camera exposure adjustment; 4). Near simultaneous image and spectral capture; 5). SFH 4737 LEDs off; 6). Ambient LEDs on.
2.3. Suture Line Imaging
Imaging the suture lines facilitated image comparisons under the four light sources outlined in section 2.2.3. Suture line images from pre-ecdysis lobsters and baseline images from intermoult lobsters were collected for comparison. Each light source was assessed for definition of the suture line when compared with the baseline image. Comparative image sets were acquired from emerged and immerged lobsters.
2.3.1. Emerged Suture Line Imaging
Emerged suture line images were taken to assess suture line appearance in the circumstance of camera assisted manual sorting. In this circumstance, only the assessment of RGB images was deemed suitable, given the simplicity of using a direct camera feed. To obtain clear images of emerged lobsters, the lobsters were secured to an elevated platform and images were acquired from the side. The elevated platform allowed the legs to fall away from the region of suture development so its full extent could be captured in images.
2.3.2. Immerged Suture Line Imaging
Immerged suture line imaging was considered as a circumstance aligned with in-situ automated detection of the suture line. Lobsters were placed in water filled 3 mm clear acrylic tubes, so the sides of the lobsters were accessible for imaging. The suture line’s appearance was compared on the complete RGB image, and on each colour channel presented in greyscale.
2.4. Low-Cost Spectroscopy Camera
Intermoult, pre-ecdysis, and post-ecdysis lobsters were sampled for comparative spectral and image data. The use of GPIO controlled ambient (white) lighting allowed the camera’s on-screen preview to be used to align the low-cost spectral camera with distinct spines and edges on the dorsal surface of the lobster. Image and spectral data were captured from the dorsal surface of lobsters held on a platform and submerged in a blackened tank of seawater after switching to illumination from SFH 4737 LEDs. Multiple readings were taken to ensure suitably comparable readings and images were acquired from each lobster.
2.4.1. Spectral Sampling NIR Reflectance Analysis
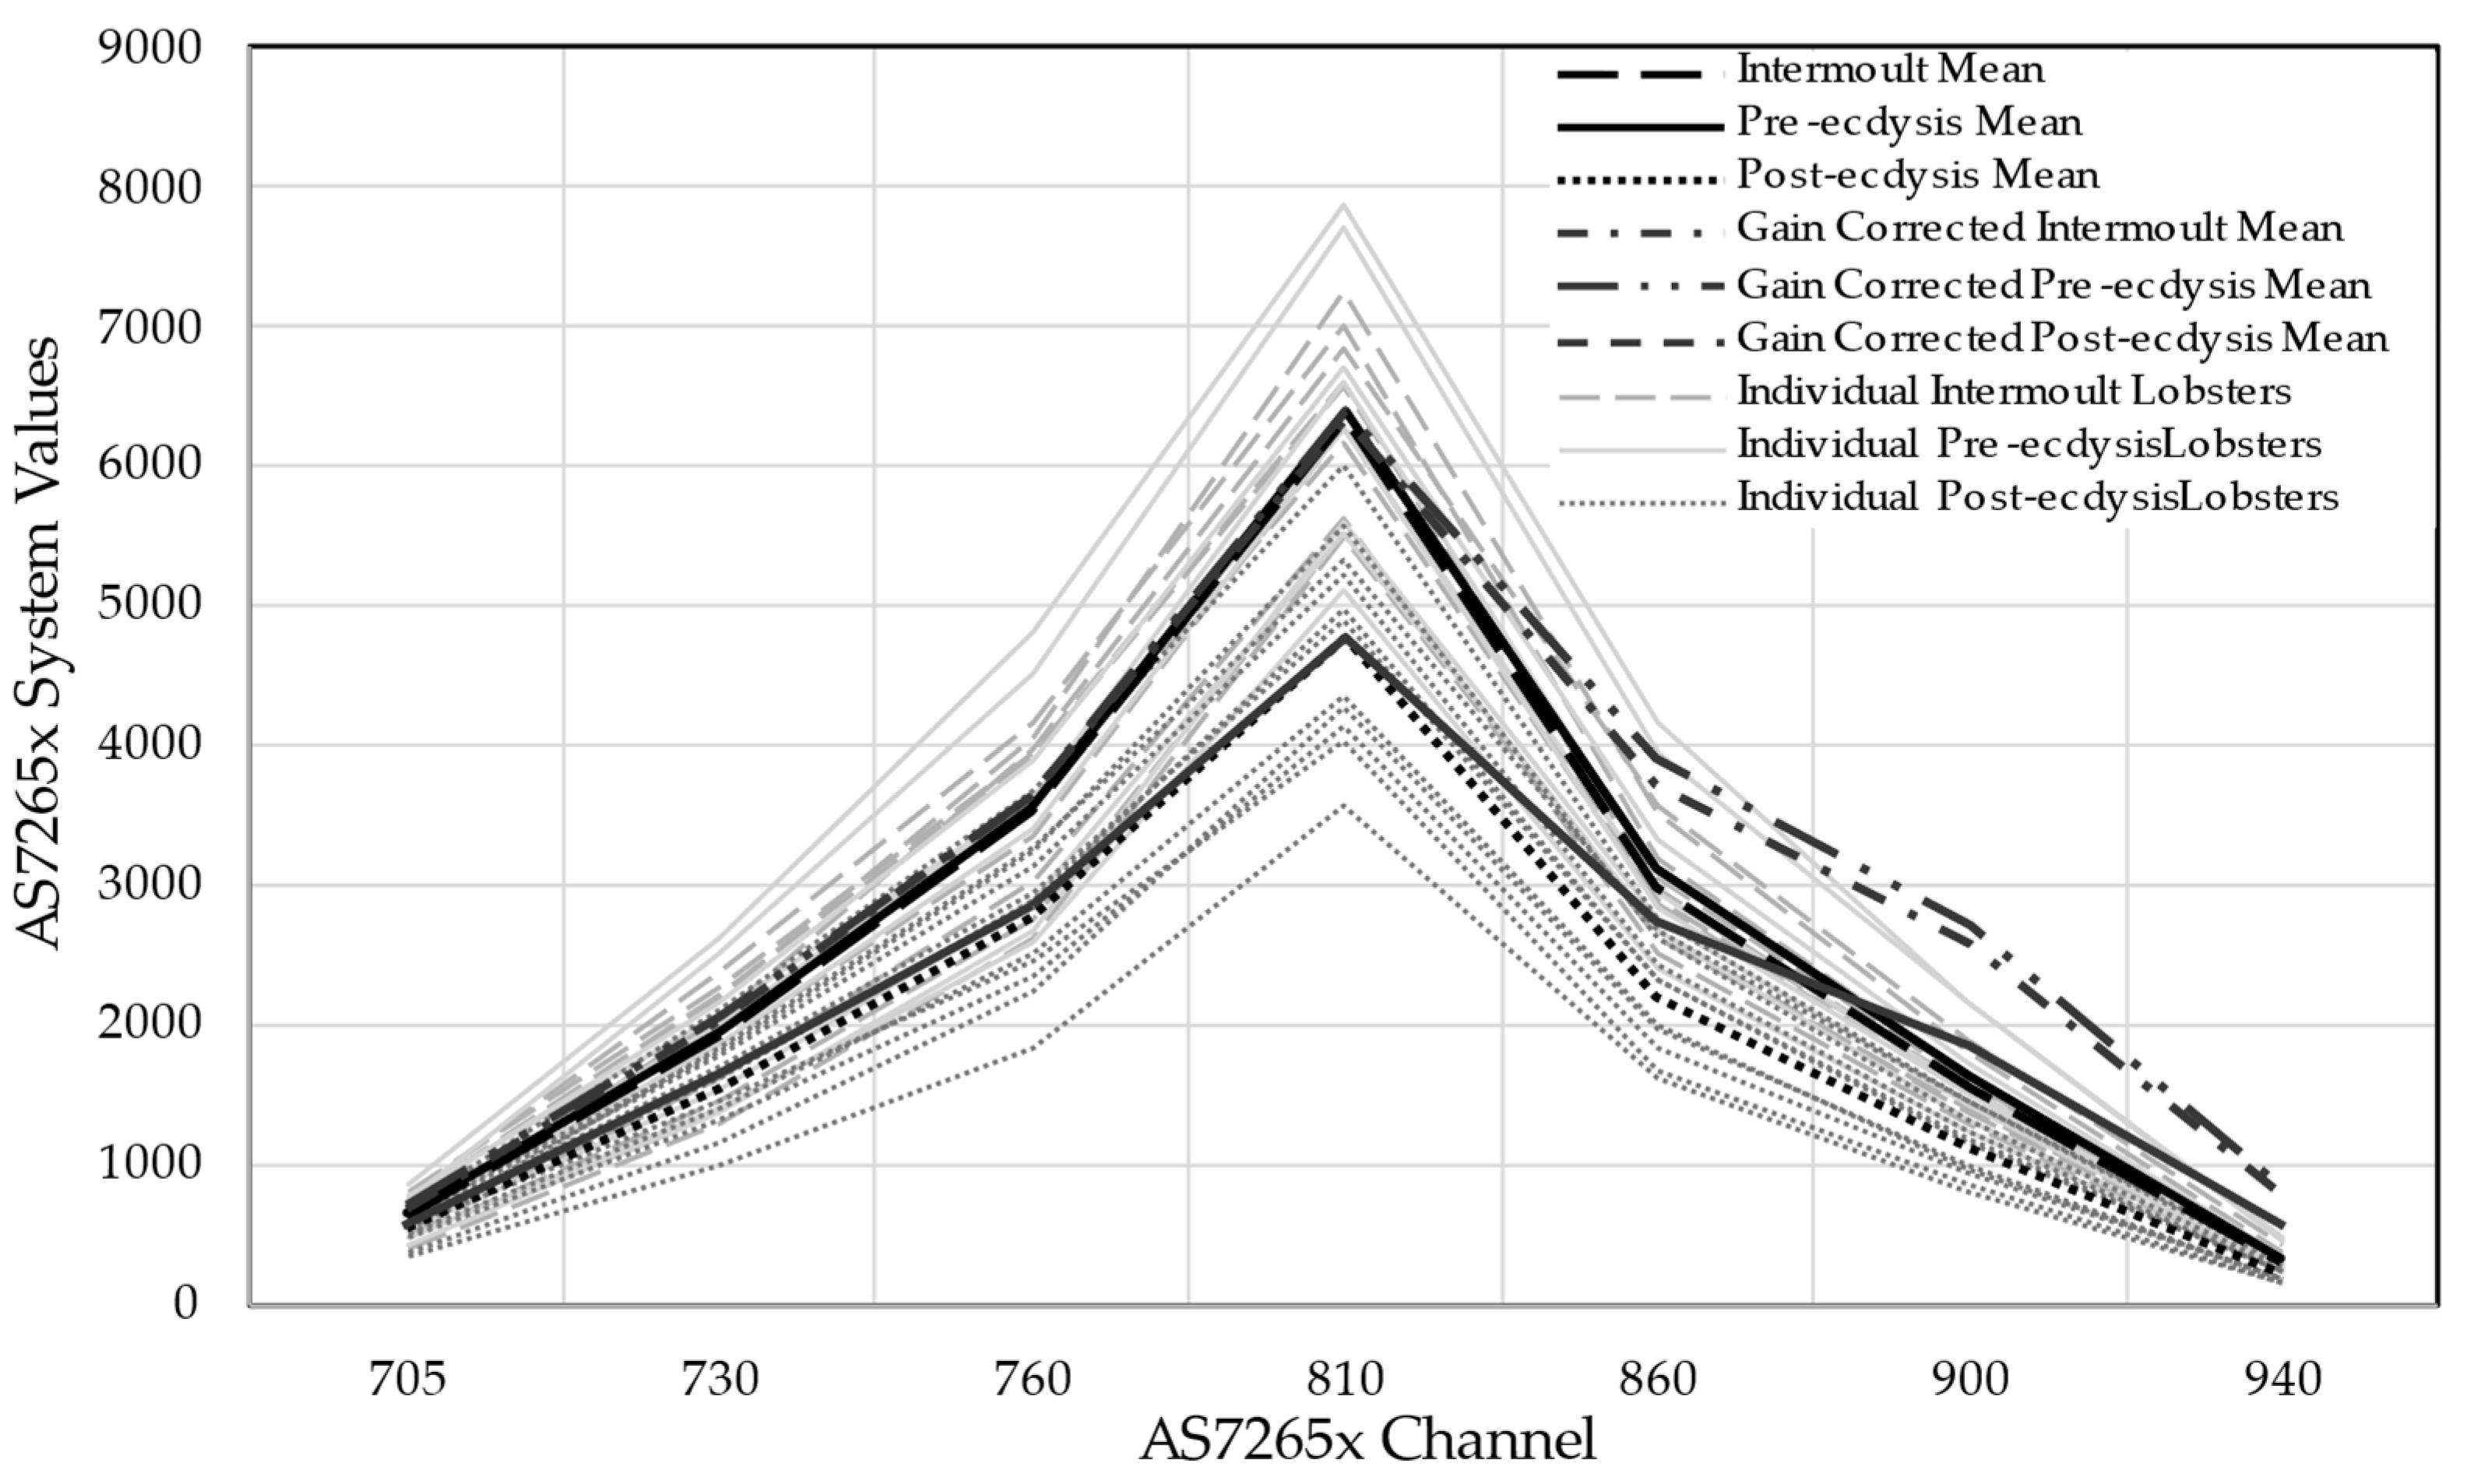
Only the seven longest wavelength channels, which include all the NIR channels, of the AS7265x were used for analysis. The visible light channels, particularly in blue, are affected by the coloured pigments of the lobster’s surface which varies naturally in a population and are not considered for analysis. The AS7265x NIR channel raw data was plotted by lobster for each of the three sample groups to assess the variability of the data between lobsters and groups. The spectral distribution from the dorsal carapace was assessed for apparent changes that occurred within the distributions of the three sample groups, while the seven long wavelength channel values were summed to assess the relative reflectance of all NIR light. Means for each group and the gain corrected means for each group were all plotted on the same axis to assess the effect of channel sensitivity on the mean distribution shape.
2.4.2. Spectral Sampling Image Analysis
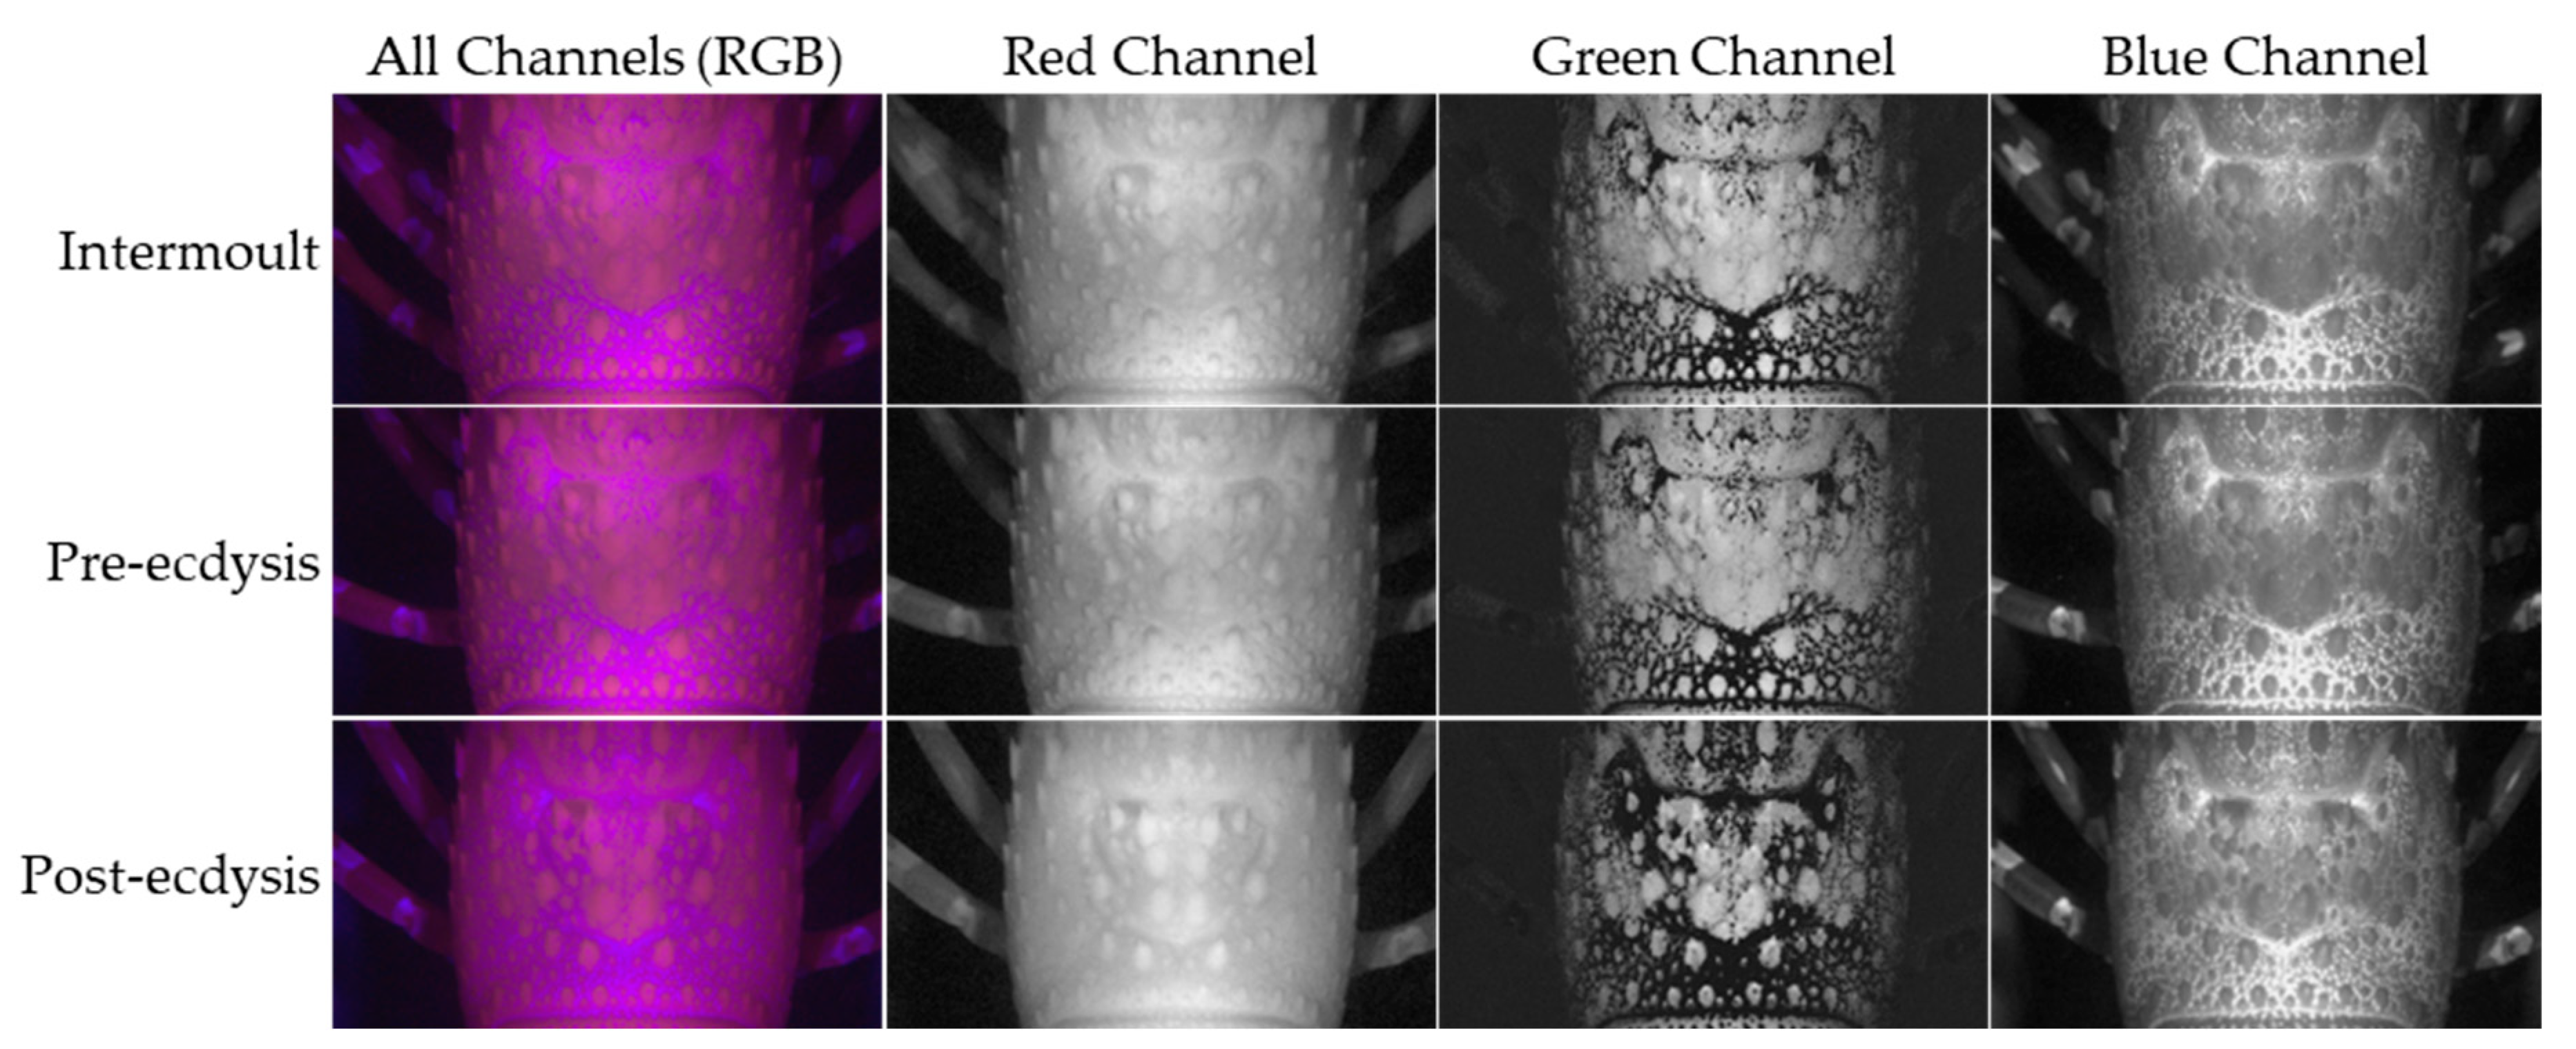
All images were compared as the complete colour image and split into grayscale representations of each RGB channel to better understand the effect of the SFH 4737 emission spectrum has on image presentation at the IMX219 sensor.
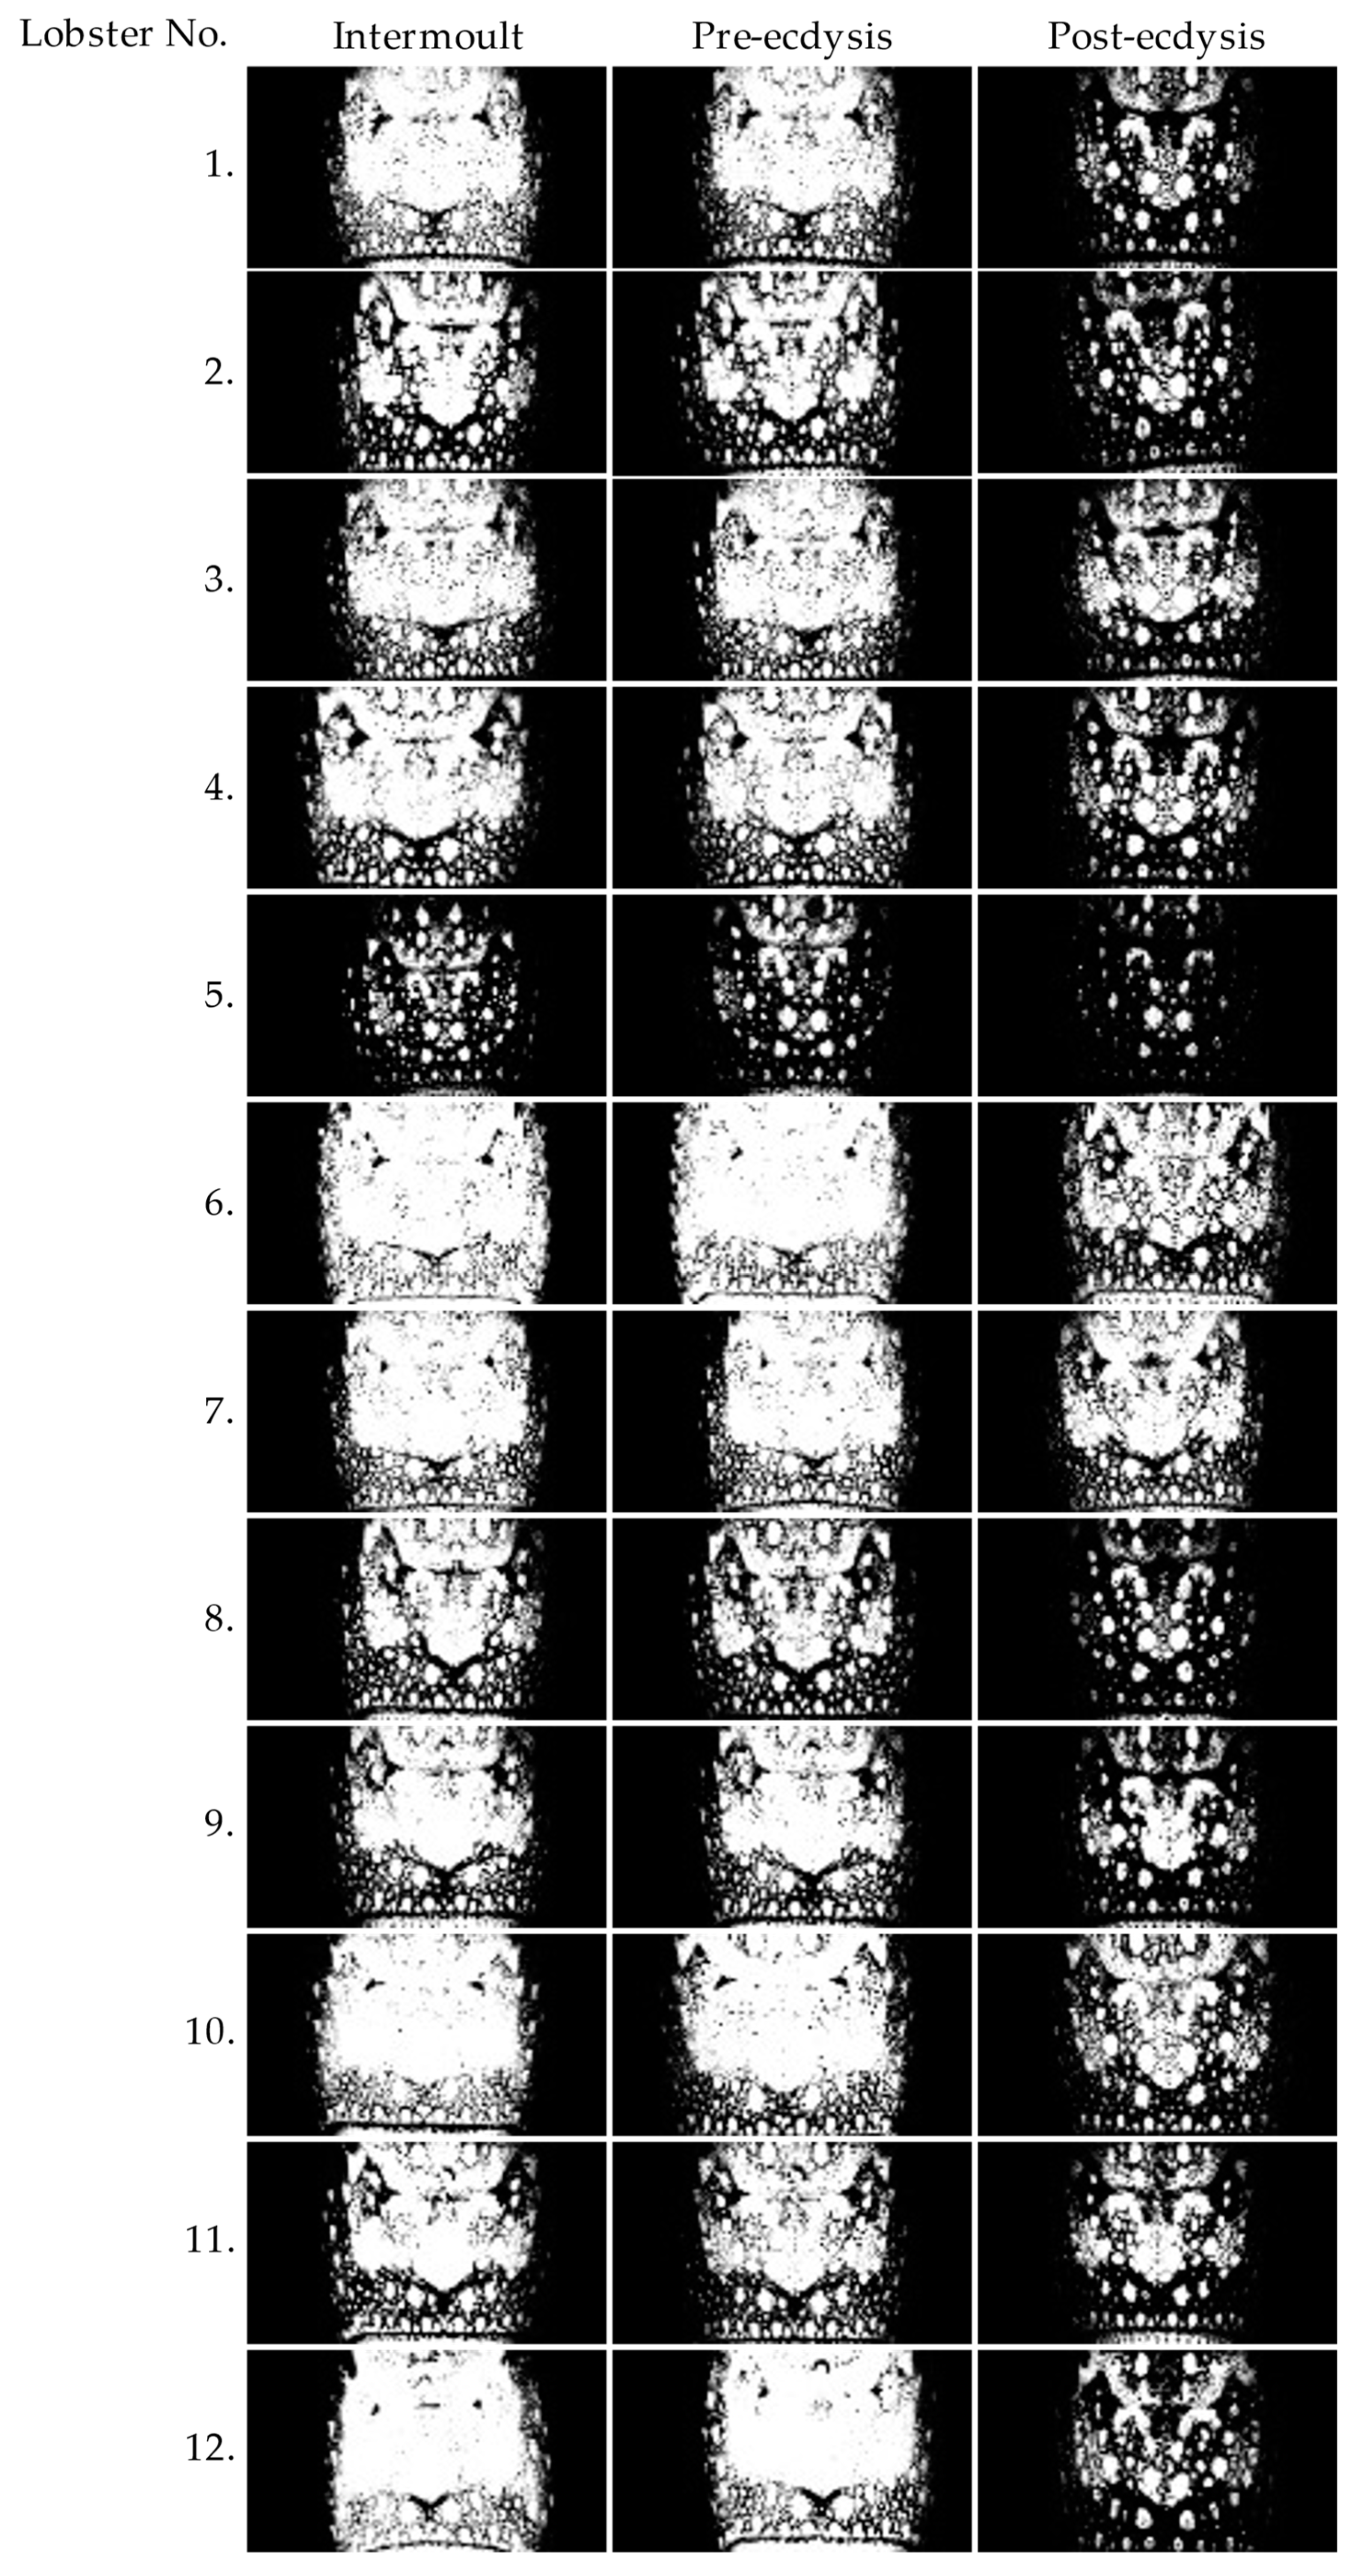
Green channel image analysis of the dorsal carapace proceeded by creating a dorsal carapace ROI through setting all pixels outside the dorsal carapace boundary to black. A threshold value of 35 (out of 255) was chosen as the threshold to distinguish dark and illuminated pixels in the ROI. The green channel images were normalised to percentage of illuminated pixels using the count of illuminated pixels and the total count of ROI pixels.
2.4.3. Spectral Sampling Statistical Analysis
The statistical analysis was performed using the R programming language. One-way ANOVAs were done for the reflectance of the summed AS7265x NIR raw channel data (section 2.4.1), and green channel pixel percentage illumination (section 2.4.2) across the three sample groups. All data was checked for conformance to the normal distribution with a Shapiro-Wilk test, and for homogeneity with a Bartlett’s test. The ANOVAs were grouped by stage and significant results were assessed with a Tukey HSD post hoc comparison. Significance was accepted at level p < 0.05.
To check for correlation between the NIR reflectance data and the green channel illuminated pixel percentage data, a Pearson’s correlation coefficient was performed. A correlation of the combined intermoult and pre-ecdysis data was done, with the post-ecdysis data correlated separately.
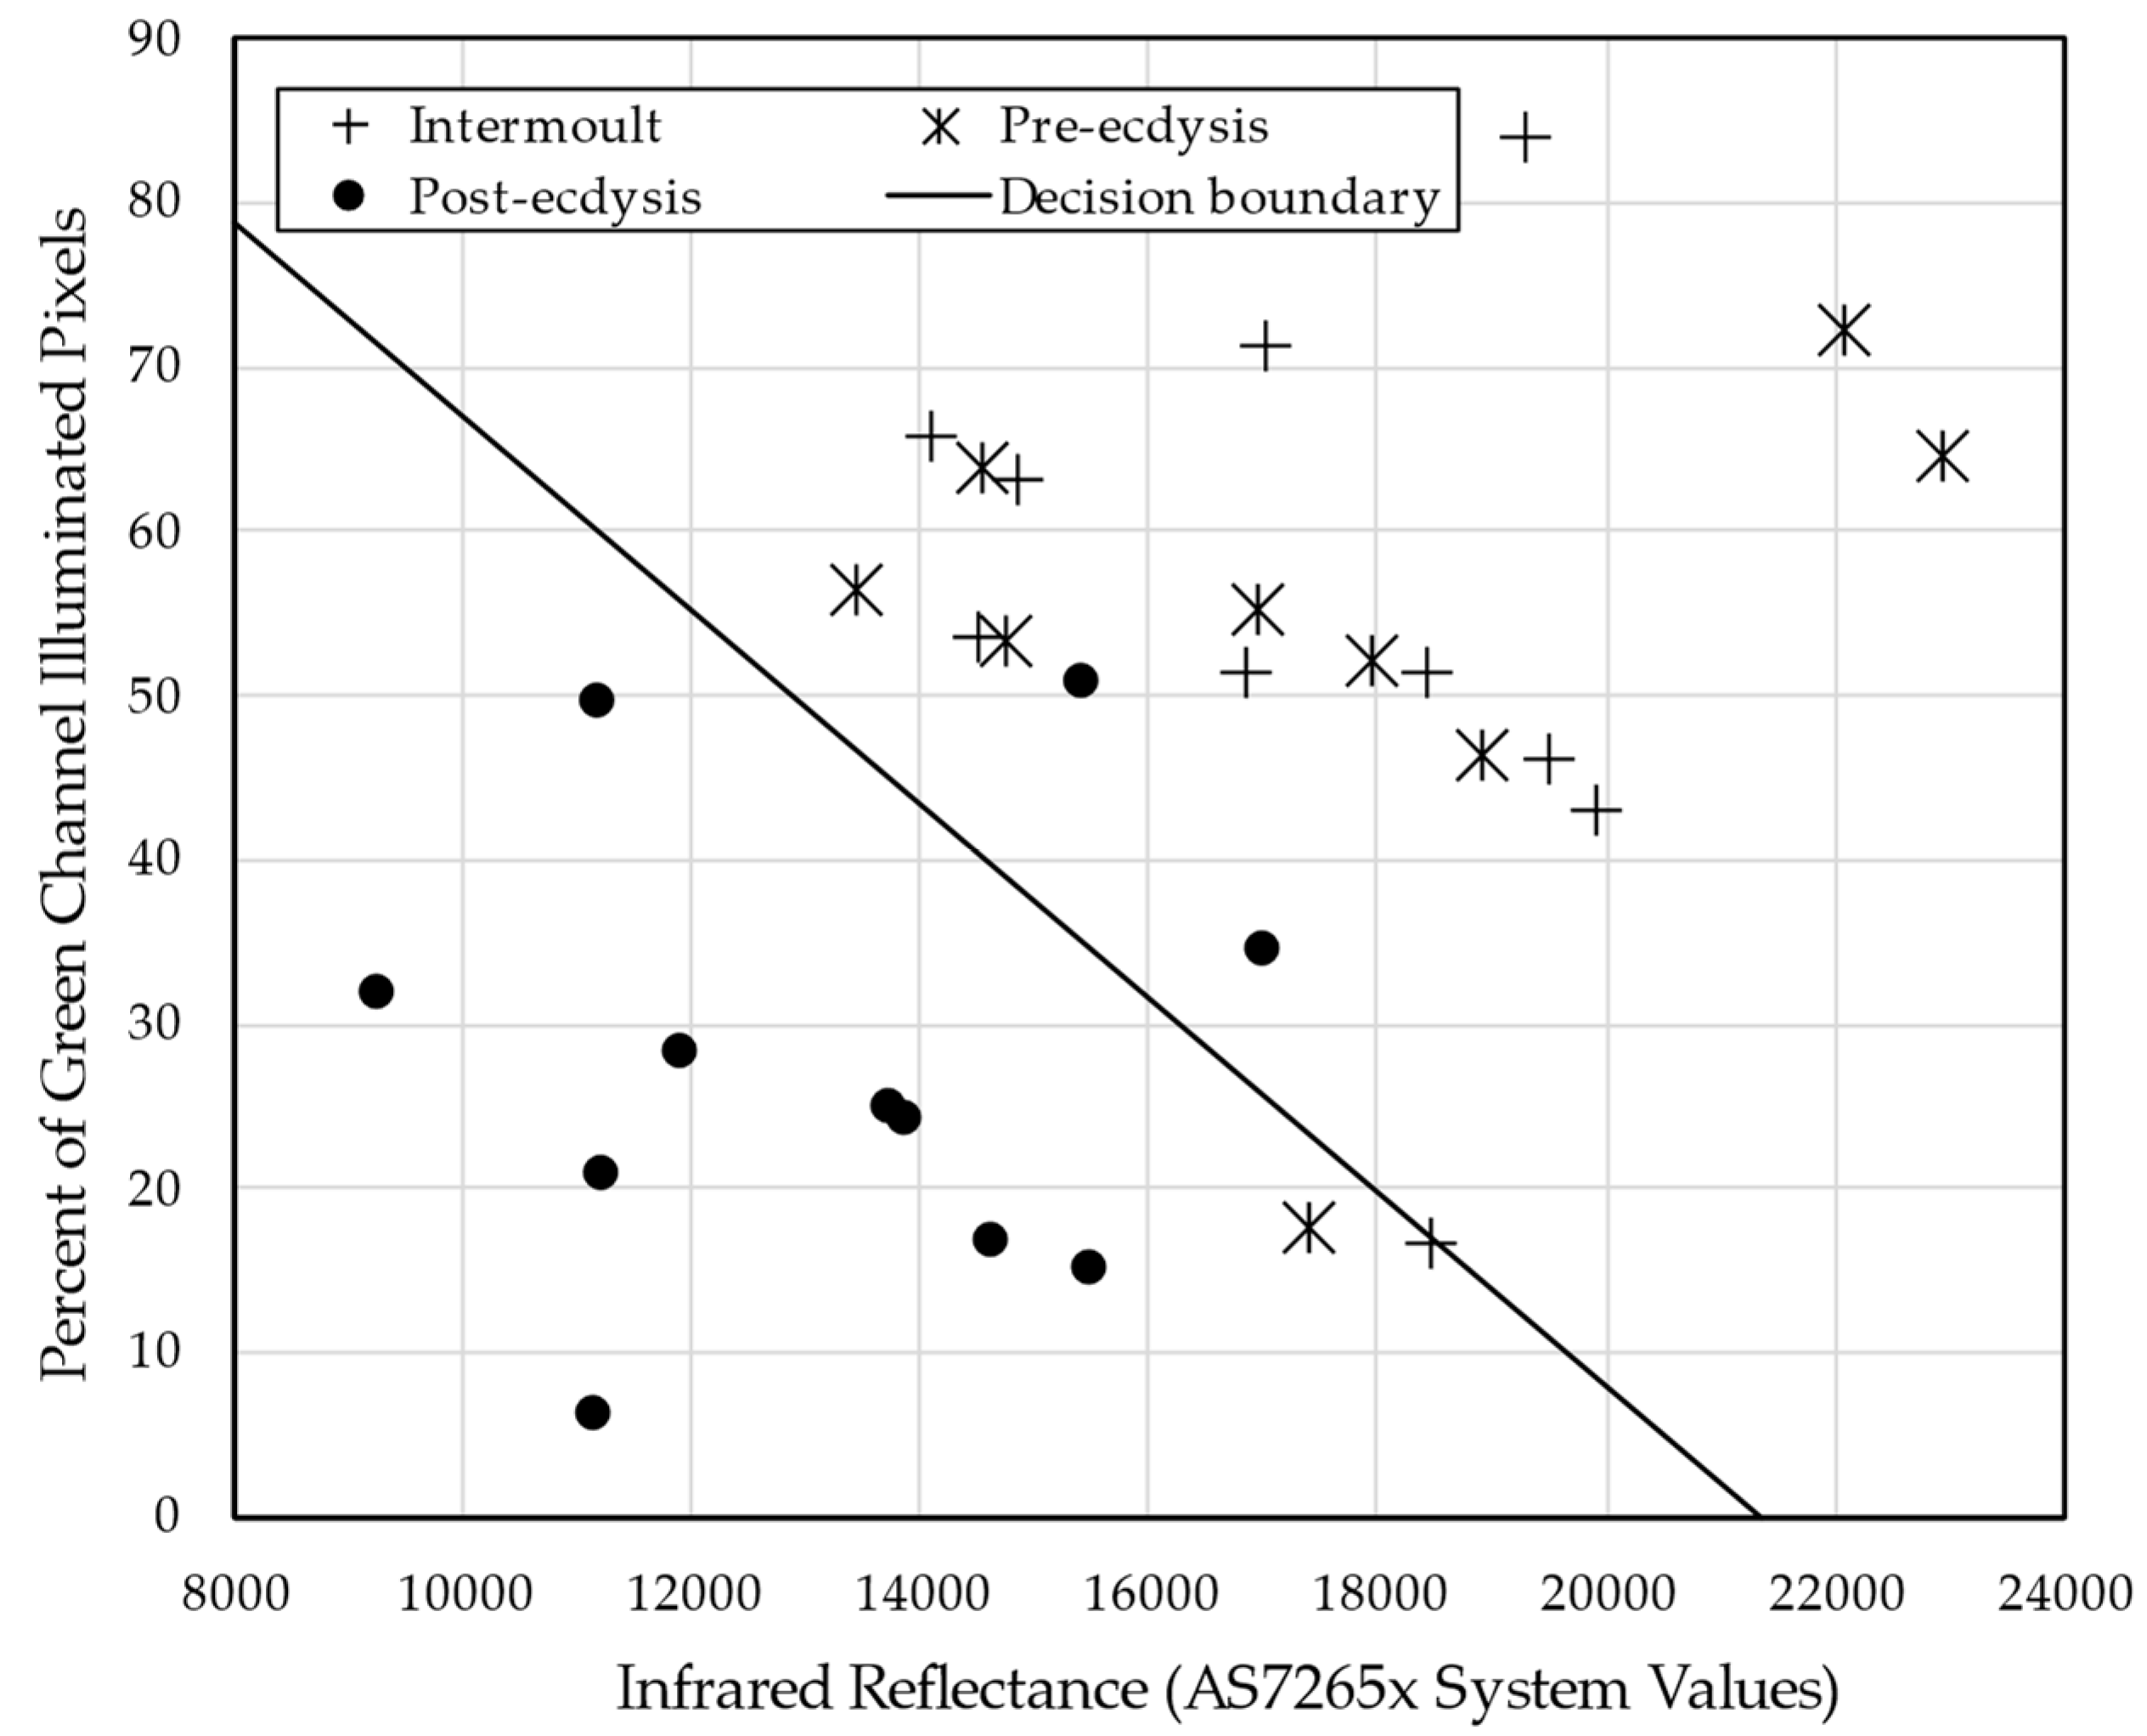
The green channel percentage of pixel illumination data was plotted against the NIR reflectance data with the stage groups as individual series. Least squares regression for binary classification was used to establish a decision boundary to separate post-ecdysis and the combined intermoult and pre-ecdysis stage groups on the plot. The model used was:
Where X is a vector of the two independent variables of green channel pixel percentage illumination and infrared reflectance, β is a vector of slope coefficients from the least squares regression and β
0 is the intercept coefficient.
3. Results
3.1. Emerged Suture Line Imaging
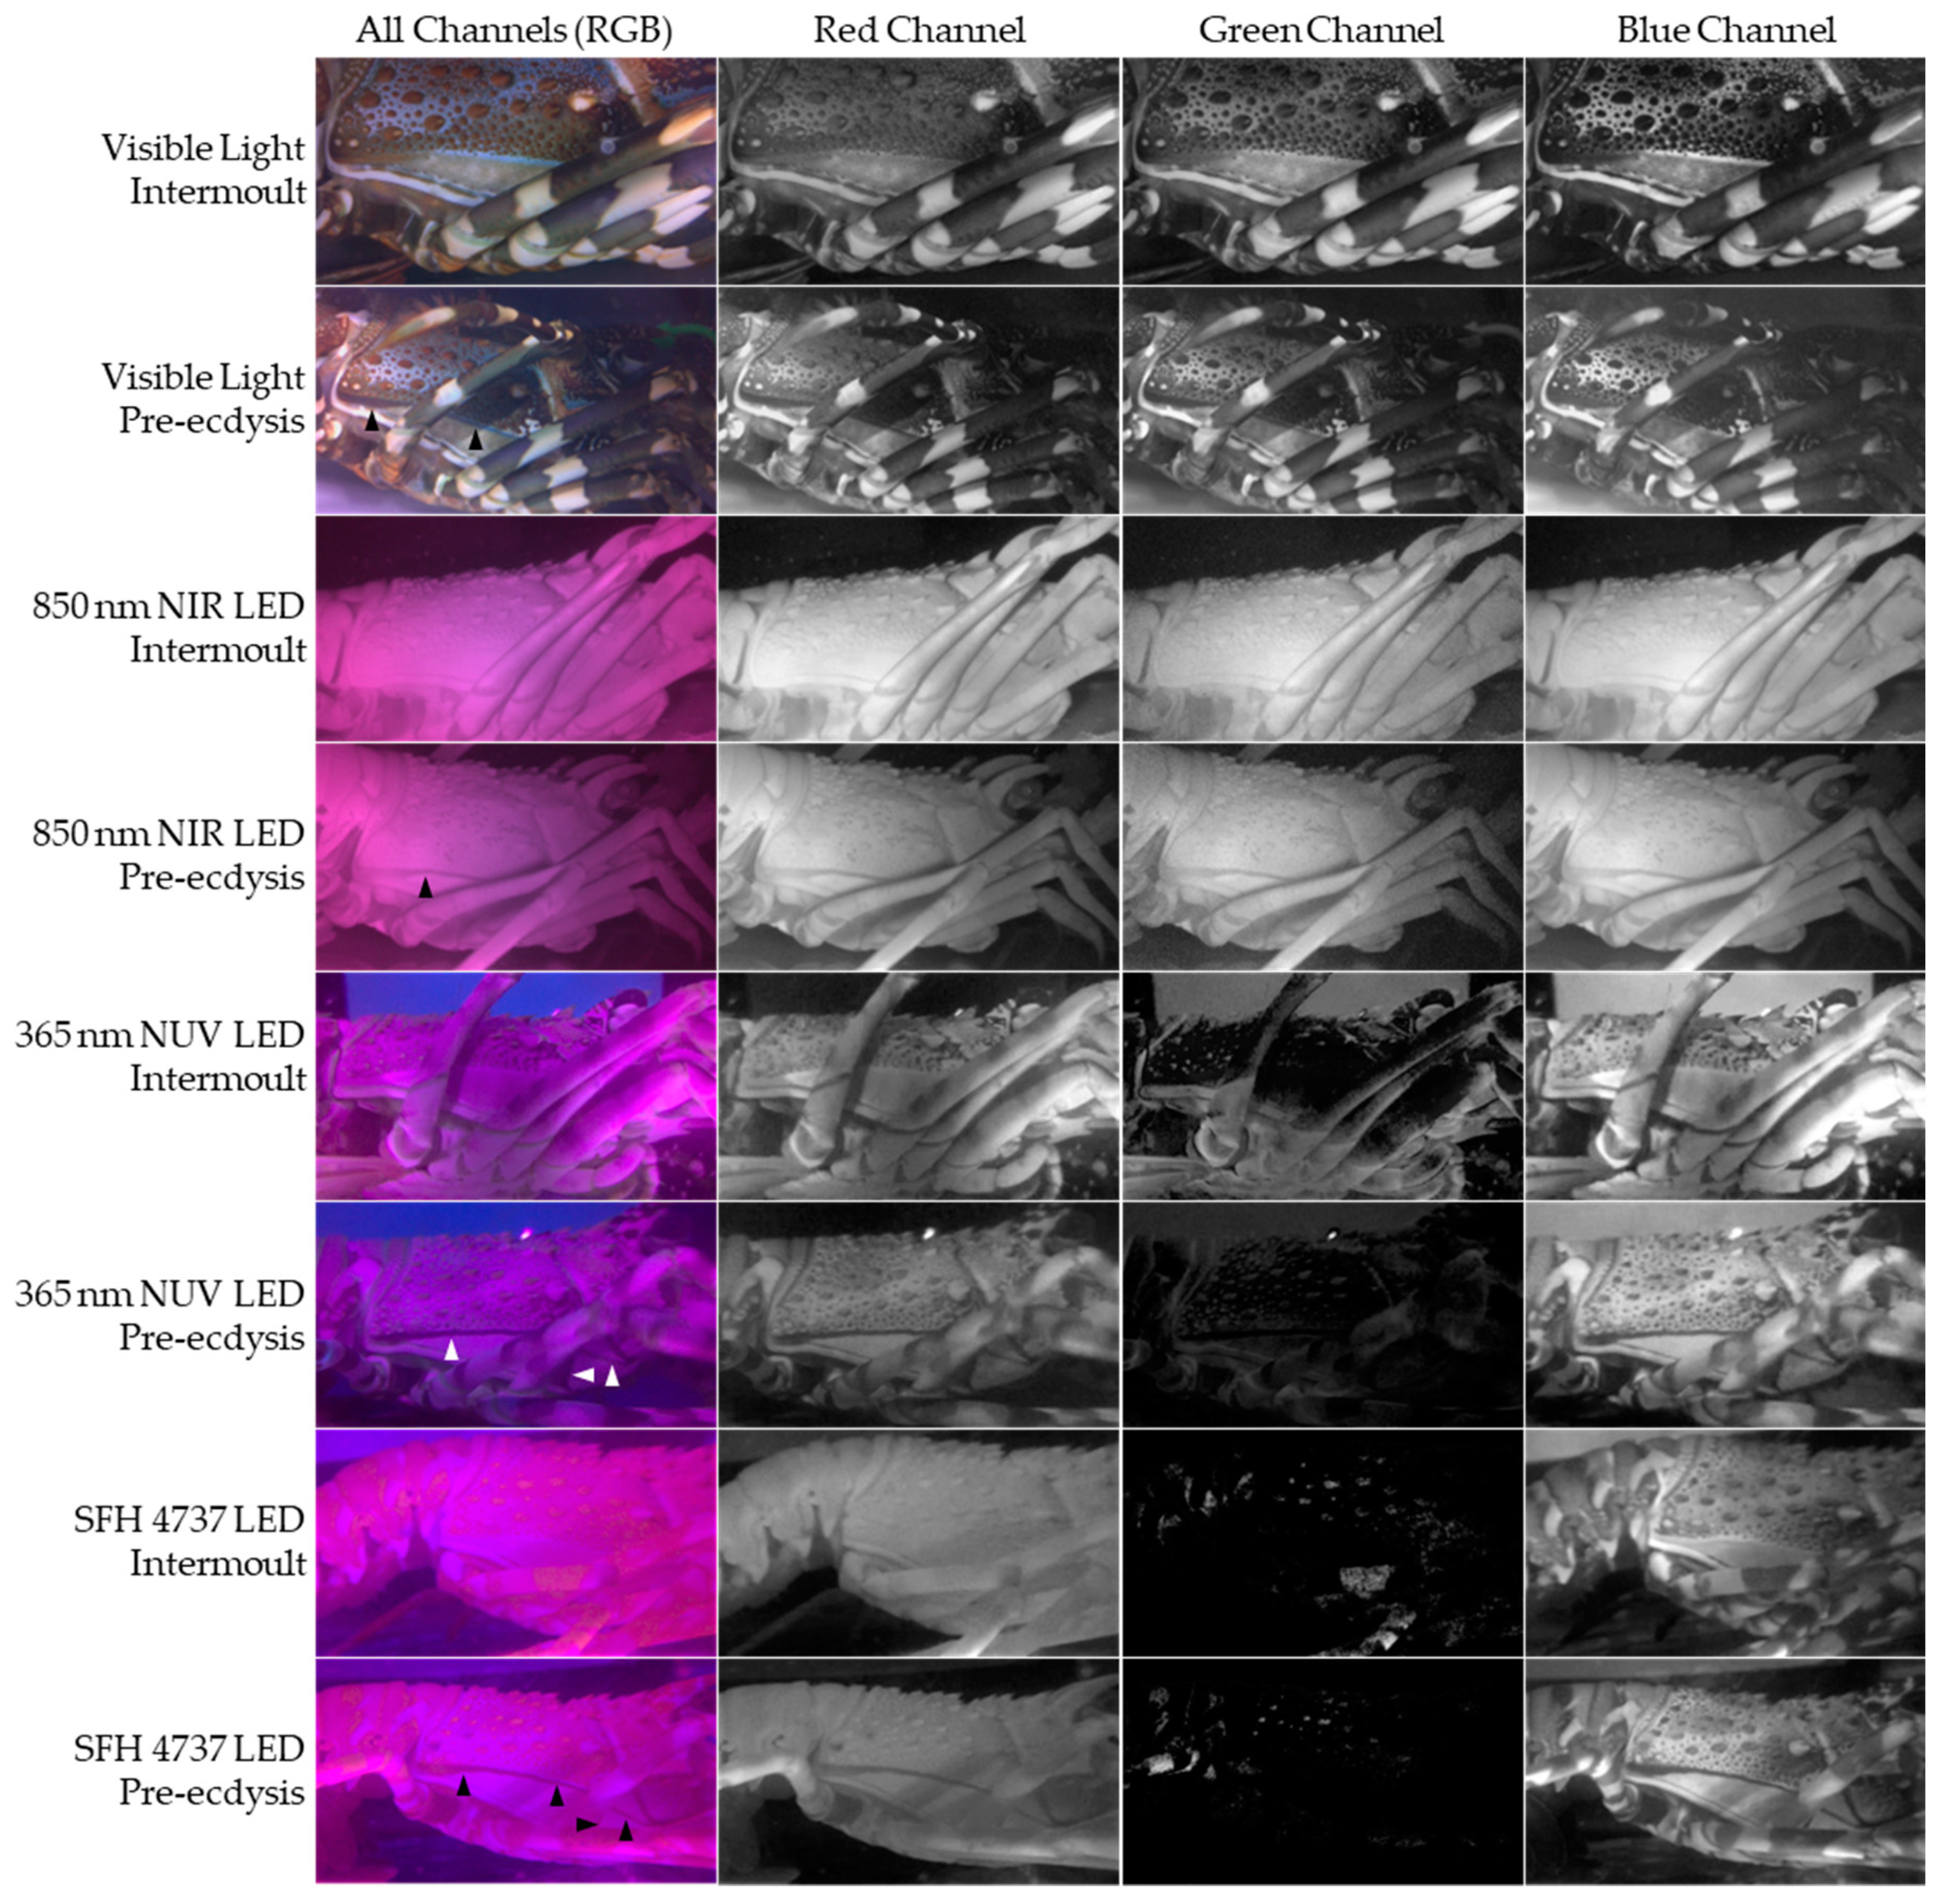
With the lobster emerged, the suture line is detectable on pre-ecdysis images under all four lighting conditions. Under the NIR and the SFH 4737 LEDs the suture line was well defined along its entire length as the detail and contrast of other surface structures of the lobster are supressed. Visible and NUV lighting maintains the definition of non-suture line textures and contrast on the surface of the lobster (
Figure 2). The suture remains distinct from baseline intermoult images because the suture path between the carapace and the branchiostegite is white during intermoult and becomes dark when the suture lines form. However, the posterior section of suture development on the carapace has a similar appearance to intermoult due to similarity with a band of brown pigment normally present on the intermoult branchiostegite.
3.2. Immerged Suture Line Imaging
With the lobster immerged and imaged using visible light, the presence of brown pigmentation on the posterior branchiostegite increases the uncertainty of suture line identification because the formed suture line is only defined by having a darker appearance when compared to the pigmentation in intermoult images. NIR, NUV and SFH 4737 LEDs show the suture line is clear and distinct from the intermoult images, with obvious darkening occurring in the suture line’s posterior section. These light sources do not reflect the brown pigmentation of the posterior branchiostegite which improves the definition of the suture line when it is present in this region. Suture line obstruction by the legs is evident in all images, with the anterior section of the suture being most affected, supporting the preferred focus on the posterior carapace (
Figure 3).
The RGB channel breakdown from the IMX219 sensor shows little difference between the images of the three channels for visible light images. Under visible light, the posterior suture line appears slightly darker than the equivalent appearance of pigmentation present in the baseline images. Under NIR light, suppression of surface contrast and features enhances the definition and contrast of the suture line on all colour channels compared to baseline images. The green channel image is noticeably grainier than the red and blue channel images when viewed at high resolution but appears unchanged at the resolution of
Figure 3. The NUV light source creates a dark suture line which contrasts with a clear white line of intact integument of the intermoult images. The blue channel is marginally brightest overall, but both the red and blue channels capture contrast and detail of the lobster’s surface features, albeit with reduced definition in the red channel image. NUV lighting does not convey information in the green channel with the images being too dark for any definition in the image.
The SFH 4737 LEDs produce images on the IMX219 sensor with a red channel that closely resembles the NIR image, and a blue channel that closely resembles the NUV image blue channel. The red channel strongly suppresses contrast and detail leaving a mostly smooth image, while the blue channel captures the full contrast and detail of the carapace surface. The green channel conveys no information about the suture line as it is too dark, although regions of pixels corresponding with spines and pigmentation bands on the legs are activated and appear “grainy”.
3.3. Spectral Analysis
3.3.1. SFH 4737 Relative Emission Spectrum
The system relative emission spectrum is a close match to the emission published in the SFH 4737 product datasheet (
Figure 4). The infrared performance beyond 850 nm appears slightly degraded in the configuration used for sampling. A maximum deviation of approximately 3% occurs at 950 nm. The maximum deviation between 500 and 700 nm is approximately 0.035%.
3.3.2. AS7265x Calibration
A gain correction curve to map the AS7265x channel output to a calibration light source was generated. The deviation of the gain correction curve from its reference of 1 is indicative of the relative spectral sensitivities of the channels on the AS7265x. Values greater than 1 indicate reduced relative channel sensitivity, while values less than 1 indicates heightened relative channel sensitivity. The calibration curve has increased channel sensitivity in the 410, 435 and 460 nm blue light channels. Channel sensitivity to infrared at the 900 and 940 nm channels is reduced with the 940 nm channel being less than half as sensitive as the median level (
Figure 5).
3.3.3. Dorsal Surface Imaging Using the Low-Cost Camera
The appearance of the dorsal carapace in red and blue channel images shows no obvious differences between the intermoult, pre-ecdysis and post-ecdysis groups. Reiterating the results from suture line imaging using the SFH 4737 lights, the red channel images have strongly suppressed contrast and appear as a NIR image, while the blue channel images have high contrast and feature definition and appear as a NUV blue channel image. The green channel on images of the dorsal carapace produces a third view, where the green channel from suture line images was mostly dark (
Figure 6). The intermoult and pre-ecdysis green channel images have similar pixel illumination for each lobster, but the post-ecdysis green channel image of each lobster has reduced pixel illumination levels (
Figure 7).
Overall, the one-way ANOVA result of green channel illuminated pixel percentage value analysis was significant. Group results were: Intermoult 56.3% ± 17.7%; Pre-ecdysis 53.9% ± 16.3%; Post-ecdysis 27.3% ± 13.1%. (F = 12.47; d.f. = 2,33; and p < 0.0001). The Tukey HSD post hoc comparison showed significance between the post-ecdysis values and both the intermoult and pre-ecdysis values (p = 0.0002 and p = 0.0006 respectively). However, the intermoult and pre-ecdysis values were not significantly different (p = 0.9254). The intermoult and pre-ecdysis pixel illumination values were combined for further comparisons with the post-ecdysis values.
3.3.4. Dorsal Surface Spectral Analysis Using the Low-Cost Camera
The spectral distribution around the NIR channels of the AS7265x formed a characteristic peak at the 810 nm channel when illuminated by SFH 4737 LED’s. Reflectivity increases steadily from the 705 nm channel with increasing wavelength to the 810 nm channel and then declines to the 940 nm channel. No change in the absorption characteristic of the dorsal carapace is evident because all channel values remained in a proportionally similar position to each other. The highest variation of reflectivity occurs at the central 810 nm channel, with both margins (705 and 940 channels) showing only small variability. Variability of the channels in the midpoints between the centre and each edge was proportional to their distance from the centre (
Figure 8).
The individual lobster traces show consistency of proportional placement of each spectral channel on the AS7265x (
Figure 8). An overall change in NIR reflectivity is apparent due to the proportional scaling of all points. On average, lobsters are less reflective to NIR light at post-ecdysis. The one-way ANOVA of infrared light reflectance from the surface of lobsters showed a significant result (F = 9.35; d.f. = 2,27; and
p = 0.0008). Group results were (summed AS7265x NIR channel raw data): Intermoult 17287 ± 2184; Pre-ecdysis 17659 ± 3270; Post-ecdysis 13185 ± 2379. The Tukey HSD post hoc comparison showed significance between the post-ecdysis values and both the intermoult and pre-ecdysis values (
p = 0.0036 and
p = 0.0021 respectively). However, the NIR reflectance of intermoult and pre-ecdysis lobsters was not significantly different (
p = 0.9487). The intermoult and pre-ecdysis NIR reflectivity values were combined for further comparisons with the post-ecdysis group.
Applying the gain correction leaves the distinct peak reflection at 810 nm intact and has little effect on the overall shape of the spectral curve, particularly on the lower peak sensitivity channels. Channel sensitivity has its largest influence on the 860 nm and 900 nm peak channel. The effect of gain calibration appears reduced at the 940 nm peak channel due to the relatively low values recorded. Channel sensitivity itself does not create the reflectivity peak at the 810 nm peak channel.
3.3.5. Correlation of Illuminated Pixel Percentage and NIR Abundance
Correlation between illuminated pixel percentage and NIR abundance was not seen for the combined intermoult and pre-ecdysis values (r = -0.0034 and p = 0.9890), nor the post-ecdysis values (r = 0.0782 and p = 0.8191).
3.3.6. Scatterplot of Illuminated Pixel Percentage and NIR Abundance
The scatterplot of illuminated pixel percentage values against NIR abundance values shows intermingling of the intermoult and pre-ecdysis values. The post-ecdysis values generally gather away from the intermoult and pre-ecdysis values. The least squares regression model (
R2 =0.5804; RSE = 0.6581 with d.f. 27) produced a binary classification decision boundary line with formula:
This boundary correctly classifies 26 of 30 (86.7 %) of the data (
Figure 9).
This section may be divided by subheadings. It should provide a concise and precise description of the experimental results, their interpretation, as well as the experimental conclusions that can be drawn.
4. Discussion
Extensive stock losses due to conspecific cannibalistic interactions in culture vessels is driving a need to detect the signs of pre-ecdysis quickly and accurately, whether the lobster is in, or out, of the culture vessel. Suture line development and nutrient and mineral reabsorption are key pre-ecdysis events that may enable pre-ecdysis characterisation with a sensor. Suture line development occurs visibly, allowing assessment via manual inspection, or via a computer vision algorithm. While nutrient and mineral re-absorption does not alter the visual appearance of the dorsal carapace, it may alter the surface chemical composition and thus light absorption properties on the lobster’s surface. Altered light absorption properties would create an opportunity to use spectroscopy to characterise pre-ecdysis. A low-cost spectral sensing solution is required for practical reasons. The availability of low-cost components, edge computing and rapid development coupled with comparative analysis enable the creation and assessment of novel solutions.
Real advantages in suture line imaging were gained by testing a variety of light sources with the Sony IMX219 NOIR camera. Clarifying the presence of the suture simplifies detecting approaching ecdysis and is a step towards the ultimate goal of identifying pre-ecdysis in-situ. Overall, the use of visible light is the least preferred method to create a well-defined image of the suture line. NIR light’s ability to flatten contrast and detail creates a smooth background against which the suture line becomes well defined. NUV light produces a well-defined suture line for immerged lobsters while maintaining detail of the lobster’s surface.
The SFH 4737’s ability to produce three different views simultaneously on the three camera channels creates benefits for the use of this light source particularly in conjunction with computer vision. Using the red and blue channel images could allow parallel inference from two models for improved detection accuracy. Parallel inference with re-combination is used for combining RGB image data with depth information for improved inference accuracy [
14].
The low-cost camera was effective at aligning the target via the on-screen preview allowing comparable datasets to be acquired. The data generated by the low-cost camera also had high repeatability and consistency which is supported by Ducanchez et al. [
15] who report good repeatability when using the AS7265x sensors and Pagnutti et al. [
10] report that the Raspberry Pi camera module V2 has stable operational characteristics. The spectral readings consistently created a proportionally scaled output which has low variability in the proportional placement of the datapoints. The spectral distribution shape, particularly the reflectivity peak on the 810 nm channel, was unexplained either by variations in the emission spectrum from the SFH 4737 LEDs under our operational conditions, or by the channel sensitivity biases introduced by the AS7265x spectral sensor. In the absence of an alternative explanation, it appears that
P. ornatus strongly reflects NIR light around 810 nm.
Using edge computing was beneficial in this study as it allowed the green channel of the camera and the NIR channels of the AS7265x to be captured simultaneously and combined to a single 2-dimensional data set. Dorsal surface characterisation of post-moult lobsters was demonstrated using the 2-dimensional data set with the creation of a least squares regression decision boundary to correctly classify 86.7% of lobsters on the 2-dimensial plane created by the AS7265x NIR reflectivity data and the camera’s green channel pixel illumination percentage data. Higher classification rates are unlikely due to high variability amongst the sample lobster population, particularly of the dorsal surface excretion responsible for green channel pixel illumination. Sutherland et al. [
1] noted high variability of ventral surface colour due to phenotypic and exogenic effects which is likely applicable here.
A second benefit from the use of edge computing is control of invisible light sources. Cummins et al. [
16] show that
Panulirus argus have light sensitivity from 360 nm to approximately 600 nm which may trigger photo avoidance behaviours. This observation coupled with the spectral reflectivity observation that NIR reaches a reflectivity peak near 810 nm from the surface of lobsters indicate that an invisible NIR light source may be most suitable for monitoring lobsters in culture vessels with a camera. We demonstrated effective on/off light control from the same Jetson Nano used for data collection using only simple additional circuits and readily available components.
The third benefit of computer power at the edge is flexible configuration. The Jetson Nano development kit carrier board is equipped with a GPIO that has 2 PWM GPIO pins, UART (serial), I2C and SPI communications along with the dual CSI/MIPI camera connectors. Dimming control of the lights was unused in this study, but easily implemented by swapping the GPIO output to PWM and using the dimming control input of the STEVAL-ILL051V1 LED driver boards. This allows for full automation of light control with the development of object detection models. The manual action button could be substituted by an inference trigger to momentarily change the Jetson Nano’s light and camera configuration to capture the best possible images for pre-ecdysis characterisation and reduce high intensity infrared light exposure while monitoring.
Upgrading both the spectral and camera sensors are options to increase spectral resolution, addressing the observation that pre-ecdysis changes on the surface of the dorsal carapace were insufficient to detect using the low-cost spectral sensing system as developed. The AMS AS7421 has 64 NIR channels between 700 and 1000 nm [
17]. While camera sensor technology is advancing steadily from the different vendors, including a wider variety of specialty sensors.
The Jetson Nano has dual display outputs on the development kit carrier board allowing this system to form the basis of a manual identification workstation based on suture line detection. Clarification of the suture can be used for manual sorting by production workers in the interim as development continues towards in-situ detection. Clear vision of the suture lines facilitates fast and accurate sorting and reduces handling and time spent out of water which are important factors in manual sorting. Using a live stream to a computer monitor and replacing the shutter release button with a foot pedal, an operator would have two hands free to gently hold and position the lobster in front of a camera and light source, placed behind a protective screen. A system that makes manual sorting viable in a production setting could have an immediate impact in reducing losses to conspecific cannibalism.
5. Conclusions
The formed suture line can be captured in images with greater definition by using light sources outside visible light with lobsters emerged and immerged. The Sony IMX219 camera and narrowband 850 nm LED combined to flatten contrast and reduce detail, as well as supress surface pigmentation in images. The suture line was made conspicuous by appearing against a mostly featureless background. The clarified suture line may simplify manual sorting and is also a step towards in-situ automated pre-ecdysis characterisation.
The novel low-cost spectral camera showed promising operational characteristics collecting many comparable images and spectral samples with a high level of consistent, reproduced data. Separate interactions of reduced green channel pixel percentage illumination and reduced NIR reflectance from the dorsal surface combined to enable characterisation of post-moult from the dorsal surface of P. ornatus. This finding itself validates the exploratory creation and testing of this novel solution.
With the hardware and software in place to enable combining image, spectral data and specialty light sources into a single two-dimension data stream, it is easily possible to re-configure and tune the system from the variety of available components. Combining different sensors on the same base platform is a quick and inexpensive way to test the effectiveness of low-cost analogues of typically expensive equipment.
This version of a low-cost spectral camera showed that the dorsal surface of P. ornatus remains stable between intermoult and pre-ecdysis despite nutrient and mineral absorption occurring within the integument. In the absence of a contradictory finding, dorsal surface stability into pre-ecdysis excludes spectrographic determination of pre-ecdysis, regardless of the equipment used.
Author Contributions
Conceptualization, C.S.; methodology, C.S.; software, C.S.; formal analysis, C.S.; investigation, C.S.; resources, C.S., A.H. and G.S; data curation, C.S.; writing—original draft preparation, C.S.; writing—review and editing, C.S., A.H., D.G, A.T. and G.S; supervision, A.H., D.G., A.T. and G.S.; project administration, C.S., A.H. and G.S.; funding acquisition, G.S. All authors have read and agreed to the published version of the manuscript.
Funding
This research was conducted by the Australian Research Council Industrial Transformation Hub for Sustainable Onshore Lobster Aquaculture (project number IH190100014). The views expressed herein are those of the authors and are not necessarily those of the Australian Government or the Australian Research Council.
Institutional Review Board Statement
Ethical review and approval were waived for this study due to research on invertebrates is currently exempt from ethics approval as per the current Australian code for the care and use of animals for scientific purposes [18]. “The Code applies to the care and use of all live non-human vertebrates and cephalopods.” Decapod crustaceans do not fall within these categories.
Informed Consent Statement
Not applicable.
Data Availability Statement
Data available on request.
Acknowledgments
Appreciation for technical assistance at IMAS, including Mathew Allan, Charlotte Levi, Jose Garcia Lafuente, Nigel Coombes and Ross Goldsmid, and technical assistance at the School of Engineering from Andrew Bylett, Rodrigo Ximeno, Ellie Jane, Simon Hogwood, Jon Rodden and Rick Barrett. We are grateful to Yukiko Burns from the Australia Japan Society, and Mr Hachimure from TSUJIDEN CO., LTD. for organising and supplying the D121UP diffusion film used in this study.
Conflicts of Interest
The authors declare no conflicts of interest. The funders had no role in the design of the study; in the collection, analyses, or interpretation of data; in the writing of the manuscript; or in the decision to publish the results.
References
- Sutherland, C.; Henderson, A.; Trotter, A.J.; Giosio, D.; Smith, G. Assessing Sensing Techniques for Detecting Markers of Approaching Ecdysis in Juvenile Tropical Rock Lobsters, Panulirus Ornatus. Aquacultural Engineering 2023, 102, 102342. [Google Scholar] [CrossRef]
- Jones, C.M. Tropical Spiny Lobster Aquaculture Development in Vietnam, Indonesia and Australia. J. Mar. Biol. Assoc. India 2010, 12. [Google Scholar]
- Lowe, D.G. Distinctive Image Features from Scale-Invariant Keypoints. International Journal of Computer Vision 2004, 60, 91–110. [Google Scholar] [CrossRef]
- Passano, L.M. Molting and Its Control. In The Physiology of Crustacea; Waterman, T.H., Ed.; Academic Press: New York, 1960; Vol. 1, pp. 473–536. ISBN 978-0-12-395628-6. [Google Scholar]
- Travis, D.F. The Molting Cycle of the Spiny Lobster, Panulirus Argus Latreille. III. Physiological Changes Which Occur in the Blood and Urine during the Normal Molting Cycle. Biol. Bull. 1955, 109, 484–503. [Google Scholar] [CrossRef]
- Aquino, A.; Noguera, M.; Millan, B.; Mejías, A.; Ponce, J.M.; Andújar, J.M. A Preliminary Evaluation of a Low-Cost Multispectral Sensor for Non-Destructive Evaluation of Olive Fruits’ Fat Content. In XLIII Jornadas de Automática: libro de actas: 7, 8 y 9 de septiembre de 2022, Logroño (La Rioja); Servizo de Publicacións da UDC, 2022; pp. 475–478 ISBN 978-84-9749-841-8.
- Noguera, M.; Millan, B.; Andújar, J.M. New, Low-Cost, Hand-Held Multispectral Device for In-Field Fruit-Ripening Assessment. Agriculture 2022, 13, 4. [Google Scholar] [CrossRef]
- Arducam Arducam NoIR IMX219-AF Programmable/Auto Focus IR Sensitive Camera Module for Nvidia Jetson Nano. Arducam 2023.
- Arducam IMX219 Datasheet 2016.
- Pagnutti, M.A.; Ryan, R.E.; V, G.J.C.; Gold, M.J.; Harlan, R.; Leggett, E.; Pagnutti, J.F. Laying the Foundation to Use Raspberry Pi 3 V2 Camera Module Imagery for Scientific and Engineering Purposes. JEI 2017, 26, 013014. [Google Scholar] [CrossRef]
- FRAMOS FSM-IMX335 Datasheet. Available online: https://www.framos.com/wp-content/uploads/FSM-IMX335-Datasheet.pdf (accessed on 10 August 2023).
- ams-OSRAM AG SFH 4737 Datasheet. Available online: https://look.ams-osram.com/m/576f284cd3c20cb4/original/SFH-4737.pdf (accessed on 9 June 2023).
- ams-OSRAM AG AS7265x Smart 18-Channel VIS to NIR Spectral_ ID 3-Sensor Chipset with Electronic Shutter. Available online: https://look.ams-osram.com/m/76ce4c0d80cd1565/original/AS7265x-DS000612.pdf (accessed on 9 June 2023).
- He, L.; Wang, G.; Hu, Z. Learning Depth From Single Images With Deep Neural Network Embedding Focal Length. IEEE Transactions on Image Processing 2018, 27, 4676–4689. [Google Scholar] [CrossRef]
- Ducanchez, A.; Moinard, S.; Brunel, G.; Bendoula, R.; Héran, D.; Tisseyre, B. The AS7265x Chipset as an Alternative Low-Cost Multispectral Sensor for Agriculture Applications Based on NDVI. In Proceedings of the Sense the Real Change: Proceedings of the 20th International Conference on Near Infrared Spectroscopy; Chu, X., Guo, L., Huang, Y., Yuan, H., Eds.; Springer Nature: Singapore, 2022; pp. 201–206. [Google Scholar] [CrossRef]
- Cummins, D.R.; Chen, D.-M.; Goldsmith, T.H. Spectral Sensitivity of the Spiny Lobster, Panulirus Argus. The Biological Bulletin 1984, 166, 269–276. [Google Scholar] [CrossRef]
- ams-OSRAM AG AS7421 64-Channel Hyperspectral NIR Sensor. Available online: https://look.ams-osram.com/m/1164a4e1da5c19a9/original/AS7421-DS000667.pdf (accessed on 9 June 2023).
|
Disclaimer/Publisher’s Note: The statements, opinions and data contained in all publications are solely those of the individual author(s) and contributor(s) and not of MDPI and/or the editor(s). MDPI and/or the editor(s) disclaim responsibility for any injury to people or property resulting from any ideas, methods, instructions or products referred to in the content. |
© 2024 by the authors. Licensee MDPI, Basel, Switzerland. This article is an open access article distributed under the terms and conditions of the Creative Commons Attribution (CC BY) license (http://creativecommons.org/licenses/by/4.0/).
