Instruments
Table 1.
List of instruments.
Table 1.
List of instruments.
| Instrument |
Model and manufacturer |
| Autoclaves |
Tomy, japan |
| Aerobic incubator |
Sanyo, Japan |
| Digital balance |
Mettler Toledo, Switzerland |
| Oven |
Binder, Germany |
| Deep freezer -70 0C |
Artiko |
| Refrigerator 5 |
whirpool |
| PH meter electrode |
Mettler-toledo,UK |
| Deep freezer -20 0C |
whirlpool |
| Gyrator shaker |
Corning gyratory shaker, Japan |
| 190-1100nm Ultraviolet visible spectrophotometer |
UV1600PC, China |
| Light(optical) microscope |
Amscope 120X-1200X, China |
Material:
The suppliers of all chemical and biological materials were the Egyptian companies Alnasr Chemical Company and Algomhuria Pharmaceutical Company. Analytical grade chemical reagents were utilised in all cases.
Isolation ofCorallococcus coralloides DSM 2259producing Corallopyronin antibiotics:
The selective isolation of species of
Corallococcus coralloides DSM 2259 from different soil samples was directly achieved using dilution plating. The technique comprised the suppression of competing bacteria exploiting antibiotics such as
10 mcg/ ml Vancomycin and/ or
10 mcg/ ml Chloramphenicol combined with wet heat treatment of soils and air drying. Fungi were eliminated via supplementing the plating medium with
2 mcg/ ml Terbinafine HCl. Swarming of
Corallococcus coralloides DSM 2259 colonies was controlled with
Casein Yeast Peptone(
CYP) plates incubated at
30℃ and
PH 7.2 for
5 days. The constitution of
CYP plate included
0.4 % Peptone from
Casein, tryptically digested,
0.3 % CaCl2.2H2O,
0.1 % MgSO4.7H2O,
PH 7.2. The potent bacterial isolate producing Myxopyronin was performed utilizing
16 S rRNA sequencing technique. The predominant bacterial isolate with high antibacterial activity was identified using
16S rRNA sequencing and other biochemical tests. Nucleic acid was extracted from a swab by bead-beating in a buffered solution containing Phenol, Chloroform and Isoamyl alcohol. Variable region of
16S rRNA gene was then amplified from the resulting nucleic acid using
PCR. The genomic
DNA was extracted from
120 hours cultured cells using a
DNA purification kit[
PurreLinkTM Genomic DNA Mini Kit with Catalog number: K182002 was purchased from Invitrogen, USA] according to the protocol provided by the manufacturer of
DNA purification kit.
The 16S rRNA gene was amplified by
PCR[
PCR SuperMix kit was purchased from Invitrogen,
USA] using forward[
5-AGAGTTTGATCCTGGCTCAG-3-] and reverse[
5-GGTTACCTTGTTACGACTT-3-]
primers.
PCR amplicons from up to hundreds of samples were then combined and sequenced on a single run. The resulting sequences were matched to a reference database to determine relative bacterial abundances. Polymerase Chain Reaction (
PCR) was a powerful method for amplifying particular segments of
DNA.
PCR used the enzyme
PlatinumTM Taq DNA polymerase with catalog number
10966018[ purchased from Invitrogen,
USA] that directed the synthesis of
DNA from deoxynucleotide substrates on a single-stranded
DNA template.
DNA polymerase added nucleotides to the 3` end of a custom-designed oligonucleotide when it was annealed to a longer template
DNA. Thus, if a synthetic oligonucleotide was annealed to a single-stranded template that contained a region complementary to the oligonucleotide,
DNA polymerase could use the oligonucleotide as a primer and elongate its 3` end to generate an extended region of double stranded
DNA. Denaturation was the initial
PCR cycle stage The
DNA template was heated to
94° C. This broke down the weak hydrogen bonds that held
DNA strands together in a helix, allowing the strands to separate creating single stranded
DNA. Annealing was the second
PCR cycle. The mixture was cooled to anywhere from
50-70° C. This allowed the primers to bind (anneal) to their complementary sequence in the template
DNA. Extension was the final step of
PCR cycle. The reaction was ; then heated up to
72° C, the optimal temperature for
DNA polymerase to act.
DNA polymerase extended the primers, adding nucleotides onto the primer in a sequential manner, using the target
DNA as a template.
With one cycle, a single segment of double-stranded DNA
template was amplified into two separate pieces of double-stranded DNA
. These two pieces were then available for amplification in the next cycle. As the cycles were repeated, more and more copies were generated and the number of copies of the template was increased exponentially. The amplified
PCR product was sequenced using a genetic analyzer
3130XL[ purchased from Applied biosystems,
USA].
DNA sequence homology search analysis of the predominant bacterial isolate was achieved using Blastn algorithm at
NCBI website. Fruiting bodies were examined using a
Stereomicroscope(
dissecting microscope)
MSC-ST45T( purchased from Infetik, China). Wet mounts from crushed fruiting bodies were prepared. The refaractility, shape and the size of Myxospores were determined employing phase contrast microscopy. On the other hand the plates were exposed to
360 nm wavelength ultraviolet light to assess the fruiting bodies fluoresced [
16].
Identification Myxopyronin B producing bacterial isolates:
Gram stain:
It classified bacteria into two categories based on the makeup of their cell walls. The bacterial cells became purple after being treated with a solution of crystal violet and subsequently iodine on a microscope slide. When colored cells were treated with a solvent such as alcohol or acetone, gram-positive organisms kept the stain whereas gram-negative organisms lost the stain and turned colorless. With the addition of the counter-stain safranin, the clear, gram-negative bacteria became pink [
17].
Spore shape:
This was discovered using the spore staining method. To get rid of any fingerprints, the slide was wiped with alcohol and a Kim-wipe. On the bottom of the slide, a Sharpie was used to create two circles. Each circle was filled with two tiny droplets of water using an inoculation loop. A very small amount of germs was taken out of the culture tube using an aseptic method. The water droplet on the slide had microorganisms on it. The slide was thoroughly dried by air. Bypassing the slide through the flame three to four times with the smear side up, the slide was heat-fixed. It took a while for the slide to completely cool. A piece of paper towel placed inside the slide's border was used to hide the streaks. A beaker of heating water was situated over the slide. The slide was allowed to steam for three to five minutes; while the paper towel was covered with a malachite green liquid. Removed and thrown away was the discolored paper towel. To get rid of any stray paper towel bits, the slide was gently cleaned with water. The counter-stain was safranin for 1 minute. Before putting the slide on the microscope's stage and seeing it via the oil immersion lens, the slide's bottom was dried [
18].
Spore site:
During the Gram stain test, the spore location was established [
19].
Cell shape:
During the Gram stain test, the cell shape was assessed [
20].
Blood haemolysis:
On blood agar media, the test antibiotic capacity to haemolyze the blood was tested [
21].
Motility test:
It discriminated between motile bacteria and non-motile bacteria.
A sterile needle was used to penetrate the medium to within 1 cm of the tube's bottom to select a well-isolated colony and test for motility. The needle was certainly retained in the same position as it was inserted and removed from the medium. It took
18 hours of incubation at
35°C, or until noticeable growth appeared [
22].
Nitrate reduction test:
0.5 ml of nitrate broth was added in a clean test tube, was autoclaved for 15 minutes at
15 lbs pressure and
121°C, and was let to cool to room temperature. The tube was inoculated with a heavy inoculum of fresh bacterial culture and was incubated at
35°C for
2 hours.
2 drops of reagent A and
2 drops of reagent B were added and mixed well. The development of red color within
2 minutes was observed for. If no red color was developed, a small amount of
zinc dust was added and observed for the development of the red color within
5 minutes [
23].
Methyl red test:
In the Methyl Red test, an infected tube of
MR broth was used before adding the methyl red
PH indicator. The buffers in the medium were overcome by the acids when an organism used the mixed acid fermentation pathway and produced stable acidic end products, resulting in an acidic environment [
24].
Catalase test:
A little inoculum of a specific bacterial strain was introduced to a
3% hydrogen peroxide solution to see if it might produce catalase. It was observed for the rapid emergence of oxygen bubbles [
25].
Oxidase test:
The 1% Kovács oxidase reagent was applied to a tiny piece of filter paper, which was then allowed to air dry. A well-isolated colony was taken from a fresh (
18 to 24-hour culture) bacterial plate using a sterile loop, and it was then rubbed onto prepared filter paper. Color alterations were noticed [
26].
Citrate utilization:
Five milliliters of a Simmon Koser's citrate medium were taken after it had been autoclaved at
15 pounds for
15 minutes. To create a clear slant and butt, the test tube containing melted citrate medium was slanted. Using sterilized wire and labeled tubes, the specified samples of microbe were injected on the media's incline. For
24 hours, the tubes were incubated at
37°C. The medium's color shift was watched for [
27].
Starch hydrolysis:
For
48 hours at
37°C, the bacterium plates were injected. After incubation, a dropper was used to saturate the surface of the plates with an iodine solution for
30 seconds. Iodine that was in excess was afterward poured out. The area surrounding the bacterial growth line was looked at [
28].
Tween 80 hydrolysis:
1% Tween 80 was used to create agar media. The supplied microorganism was added to the
Tween 80 agar plates by utilizing an inoculating loop to create a single center streak in the plate. The plates were incubated for
24 hours at
37 °C.
HgCl2 solution was poured over the plates. After a short while, the plates were examined. Positive test result; distinct halo-zone surrounding the injected region showed
Tween 80 hydrolysis [
29].
Growth at 10-45 0C:
On nutrient agar media, growth was observed to be possible at
10-45°C [
30].
Indol test:
The test tube containing the microorganism for inoculation received
5 drops of the
Kovács reagent directly. Within seconds after introducing the reagent to the media, the reagent layer formed a pink to red colour (cherry-red ring), which was a sign of a positive indol test [
31].
Tolerance salinity test:
Its capacity to develop on nutrient agar while being responsive to
5% and
7 % NaCl was examined [
32].
Voges-Proskauer(VP) test:
For the test, Voges-Proskauer broth, a glucose-phosphate broth loaded with microorganisms, was added to alpha-naphthol and potassium hydroxide. A successful outcome was indicated by a cherry red tint, whereas an unfortunate outcome was indicated by a yellow-brown color [
33].
Casein hydrolysis test:
For testing the casein hydrolyzing activity of the test antibiotic, a single line streak of the given culture was made in the center of the skim milk agar plate under aseptic conditions and plate was incubated at
37°C in an incubator for
24-48 h [
34].
Saccharide fermentation tests:
Glucose fermentation test:
The fermentation reactions of glucose were investigated using glucose purple broth. Peptone and the
PH indicator bromcresol purple made up the purple broth. A
1% concentration of glucose was added. Isolated colonies from a
24-hour pure culture of microorganisms were added to the glucose purple broth as an inoculant. Parallel to the inoculation of the glucose-based medium, a control tube of purple broth base was used. The inoculated medium was incubated aerobically for
3 days at a temperature of
35–37 °C. The medium began to become yellow, which was a sign of a successful outcome. A poor carbohydrate fermentation response was indicated by the lack of yellow color development [
35].
Fructose fermentation test:
A pure culture's inoculum was aseptically transferred to a sterile tube of phenol red fructose broth. The infected tube was incubated for
18–24 hours at
35–37 °C. A color shift from red to yellow, signifying an acidic PH alteration, was a sign of a favorable response [
36].
Maltose fermentation test:
A pure culture inoculum was aseptically transferred to a sterile tube containing phenol red maltose broth. The infected tube was incubated for
18–24 hours at
35–37 °C. A color shift from red to yellow, signifying an acidic PH alteration, was a sign of a favorable response [
37].
Sucrose fermentation test:
A pure culture's inoculum was aseptically transferred to a sterile tube containing phenol red sucrose broth. For
24 hours, the infected tube was incubated at
35–37 0C. A colour shift from red to yellow, signifying an acidic
PH alteration, was a sign of a favourable response [
38].
Purification of Corallopyronin B antibiotic:
This was achieved through reversed phase chromatography technique.
The aeration rate was
0.142 V/ V. min. The stirring rate was
500 rpm.
PO2 was about
90 % of saturation; but decreased to about
20 % after
18 hours). The fermentation was stopped after
40 hours via centrifugation at
500 rpm in a gyrator shaker. The supernatants were collected; then tested for antimicrobial sensitivity using broth dilution technique to detect MICs and agar paper diffusion discs technique. The test antibiotic was extracted from the
2 liters of culture broth with
2/ 10 volume ethyl acetate. The ethyl acetate was then removed under the reduced pressure at
40℃. Afterwards, the residue was dissolved in 398 ml of methanol-water(
90: 10) and chromatographed on reversed phase
HPLC. Methanol was the mobile phase. The eluent was
70 part
methanol:
16 part
water:
4 part
acetic acid with flow rate
300 ml/ min. Detection of the antibiotic components was achieved exploiting refractive index. The main peak with retention time
5 minutes contained the biological antibiotic activity which was determined via agar diffusion assay using paper discs and
Staphylococcus aureus as an indicator organism. On the other hand, the main peak was subjected to neutralization via
NaHCO3.
Corallopyronin A was extracted using
10 % V/ V Methylene chloride. After the evaporation of the solvent, about
87 % of the antibiotic substance purified was
Corallopyronin B. It was noticed that the retention rime of
Corallopyronin B was
9 minutes. Molecular formula of the purified
Corallopyronin B was detected through mass spectrometer(
Quadrupole mass spectrometer, Advion, USA) [
39]. It was detected also, that
13% of
Corallopyronin mixture extract were
7% Corallopyronin A and 6%
Corallopyronin C.
Procedure of Broth dilution assay for determination of MICs of Corallopyronin B:
A specific broth was added to several microtiter plates during the testing process based on the requirements of the target bacterium. The test microorganisms and antibiotics were then introduced to the plate in varying amounts. After that, the plate was put into a non-
CO2 incubator and left there for
sixteen to
twenty hours at
37 degrees Celsius. The plate was taken out and examined for bacterial growth after the specified amount of time had passed. Bacterial growth was detected in the cloudiness of the broth. The lowest concentration of antibiotics that prevented bacterial growth, or Minimum Inhibitory Concentration(
MIC), was used to describe the outcomes of t
he broth microdilution method [
40].
Agar diffusion assay with paper discs procedure for the determination of Corallopyronin B antimicrobial activity:
The agar diffusion technique(
ADM) was used to classify the disc diffusion method(
DDM) because the test microorganism-seeded agar media allowed the test antibiotic extract to disperse from its reservoir. A filter paper disc put on an agar surface served as the reservoir most of the time. After the filter paper disc was incubated, an inhibitory zone formed around the tested extract chemicals that were microbiologically active. The test extract's antibacterial potency was accurately reflected by the inhibition zone's diameter [
42]. Both broth and selection or enrichment growing media were used to isolate the test microorganisms(
Table 2).
Estimation of Corallopyronin B effect on bacterial RNA synthesis:
The concentration of
RNA isolated with
RNeasy Kits( purchased from
QIAGEN, USA) was determined by measuring the absorbance at
260 nm in a spectrophotometer. An absorbance of 1 unit at
260 nm corresponds to
40 µg of
RNA per ml(
A260 =
1 =
40 µg/ ml) [
42].
Estimation of Corallopyronin B effect on bacterial protein synthesis:
Absorbance was measured at
205 nm to calculate the protein concentration by comparison with a standard curve. A(
205) method could be used to quantify total protein in crude lysates and purified or partially purified protein. The
UV spectrophotometer was set to read at
205 nm allowing
15 min for the instrument to equilibrate. The absorbance reading was set to zero with a solution of the buffer and all components except the protein present. The protein solution was placed in the 1 ml cuvette and the absorbance was determined. The dilution and readings of samples were performed in duplicate.The matched cuvettes for samples and controls were utilized during the test procedure. The extinction coefficient of the protein was known, the following equation was employed.
Absorbance =
Extinction coefficient ×
concentration of protein ×
path length(
1 cm) to determine the concentration of the protein [
43].
Estimation of pharmacodynamic and pharmacokinetic effects of Corallopyronin B during experimental animal testing in preclinical clinical trials:
In the present study, the pharmacokinetics and the pharmacodynamics of
Corallopyronin B were evaluated after dosing in male rabbit animal models weighing about
2 kg. Furthermore, compound concentrations were determined in target compartments, such as lung, kidney and thigh tissue, using
LC-MS/ MS. Based on the pharmacokinetic results, the pharmacodynamic profile of
Corallopyronin B was assessed victimizing the standard neutropenic thigh and lung infection models [
44].
Estimation of pharmacodynamic and pharmacokinetic effects of Corallopyronin B in randomized human clinical trials phases 1/2:
This study was conducted in
150 human volunteer subjects to show the bioavailability, pharmacokinetics and the pharmacodynamics of the test antibiotic. The study was designed as randomized, single-dose,
2-treatment,
2-period crossover trial with a washout period of
1 week. Blood samples were collected at
0(
baseline),
10,
20, and
40 minutes and at
1, 1.5, 2, 3, 4, 6, 9, 12, and
24 hours postdose. Plasma concentrations of the 4 drugs were measured by using a rapid chromatography-tandem mass spectrometry method. Pharmacokinetic parameters were calculated by using noncompartmental methods. Bioequivalence was determined if the
90 % CIs of the log-transformed test/ reference ratios
AUC(
0-26),
AUC(
0-∞), and
Cmax were within the predetermined range of
80% to
125%. Tolerability was assessed by using clinical parameters and subject reports Pharmacodynamic effects were evaluated through the determination of
MICs via agar diffusion assay and broth dilution technique During
randomized human clinical trials phases 1/2 all utilized infectious bacterial cell counts were estimated spectrophotometrically [
45].
Estimation of of phototoxicity, mutagenicity and carcinogenicity of the test antibiotic:
The phototoxicity of
Corallopyronin B was determined via
3T3 neutral red uptake phototoxicity technique [
46]. On the other hand,
mutagenicity and carcinogenicity of the test antibiotic were assessed using
Ames test [
47].
The determination of toxokinetic and toxodynamic effects:
Up and down method for acute toxicity detection of
Corallopyronin B was utilized for this purpose [
48].
The determination of maximum bactericidal activity of Corallopyronin B:
A pure culture of a specified microorganism was grown overnight, then diluted in growth-supporting broth( typically
Mueller Hinton Broth) to a concentration between
1 x 10^5 and
1 x 10^6 cfu/ ml. A stock dilution of the antimicrobial test substance was made at approximately
100 times the expected
MIC. Further
1:1 dilutions were made in test tubes. All dilutions of the test antibiotic were inoculated with equal volumes of the specified microorganism. A positive and negative control tube was included for every test microorganism to demonstrate adequate microbial growth over the course of the incubation period and media sterility, respectively. An aliquot of the positive control was plated and used to establish a baseline concentration of the microorganism used.The tubes were then incubated at the appropriate temperature and duration. Turbidity indicated growth of the microorganism and the
MIC was the lowest concentration where no growth was visually observed. To determine the
MBC, the dilution representing the
MIC and at least two of the more concentrated test product dilutions were plated and enumerated to determine viable
CFU/ ml. The
MBC was the lowest concentration that demonstrated a pre-determined reduction (such as 99.9%) in
CFU/ ml when compared to the
MIC dilution [
49].
Determination of plasma protein binding capacity of Corallopyronin B:
Employing an ultrafiltration technique, the protein binding( PB) extent and changeability of the test antibiotic medicates were settled when given simultaneously to 30 patients inoculated with infectious pneumococci inside hospitals in Egypt. Clinical samples used were routinely received by microbiological laboratory inside the faculty of Pharmacy, Cairo University, Egypt. Plasma proteins were likewise plumbed. A protein-free medium was used to determine the nonspecific binding. Plasma samples from 30 patients were enclosed, of which plasma proteins were deliberated for 24 patients.
Determination of liver, kidney and heart function tests after addition of Corallopyronin B:
These functional tests were performed to assess the vitality of liver, kidney and heart during the randomized human clinical trials phases 1/2. On the other hand, Urine, stool analyses were achieved in addition to estimation of complete blood counts to all experimental subjects which received graded doses of Corallopyronin B.
Formulation of Corallopyronin B( COR B):
A liquid solution( COR B > 30 mg ml−1) comprising polyethylenglycol-15-hydroxystearate( 35%), propylene glycol( 15%), and phosphate buffered saline pH 7.3( 75%), as excipients, was prepared for IV and SC administration. PEG 400( 50%) and phosphate buffered saline PH 7.3( 60%) were added to a liquid formulation that included COR B for human effectuality attempts administered by oral and SC methods. For toxicity tests, a liquid COR B formulation based on PEG 200 that permitted an oral dosage of 1500 mg kg−1( 150 mg ml−1) was created. Each formulation exhibited adequate COR B in-use stability.
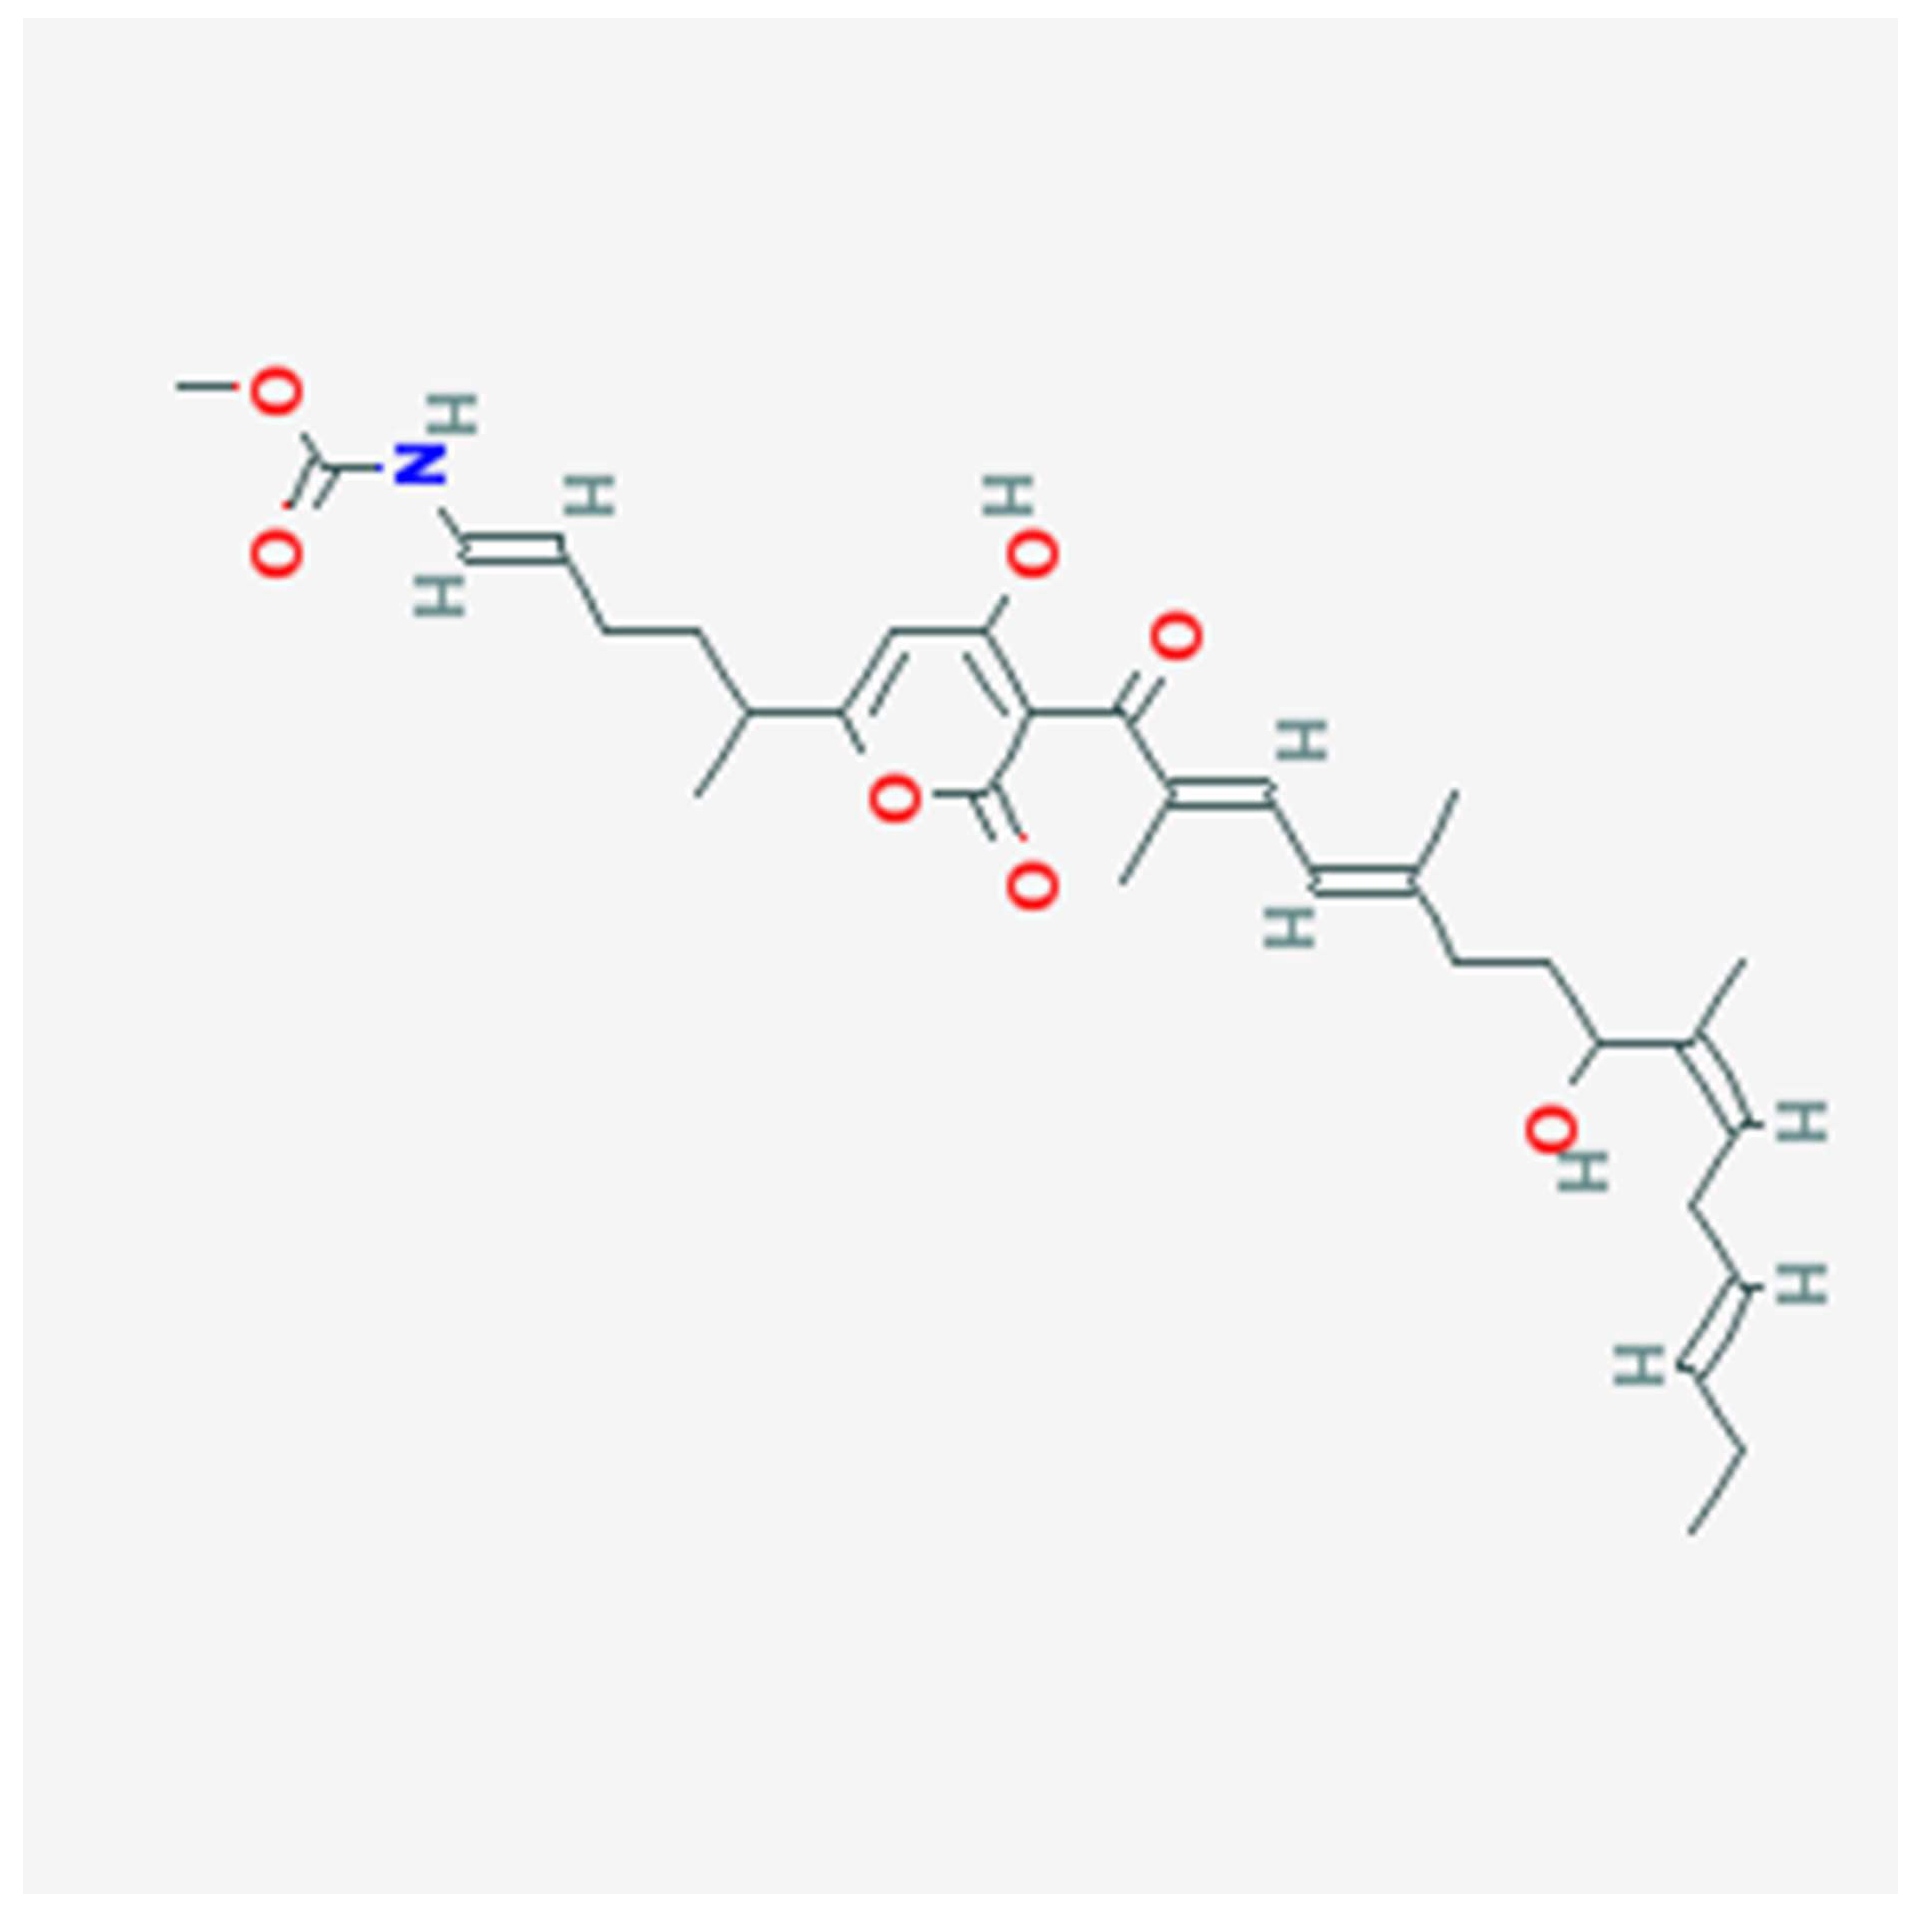
Figure 1.
It demonstrates the structure of Corallopyronin B extracted from bacterial isolates Corallococcus coralloides DSM 2259 collected from different soil environments in Egypt . Molecular formula of the purified test antibiotic was noticed to be C31H43NO7 determined through mass spectrometer.
Figure 1.
It demonstrates the structure of Corallopyronin B extracted from bacterial isolates Corallococcus coralloides DSM 2259 collected from different soil environments in Egypt . Molecular formula of the purified test antibiotic was noticed to be C31H43NO7 determined through mass spectrometer.
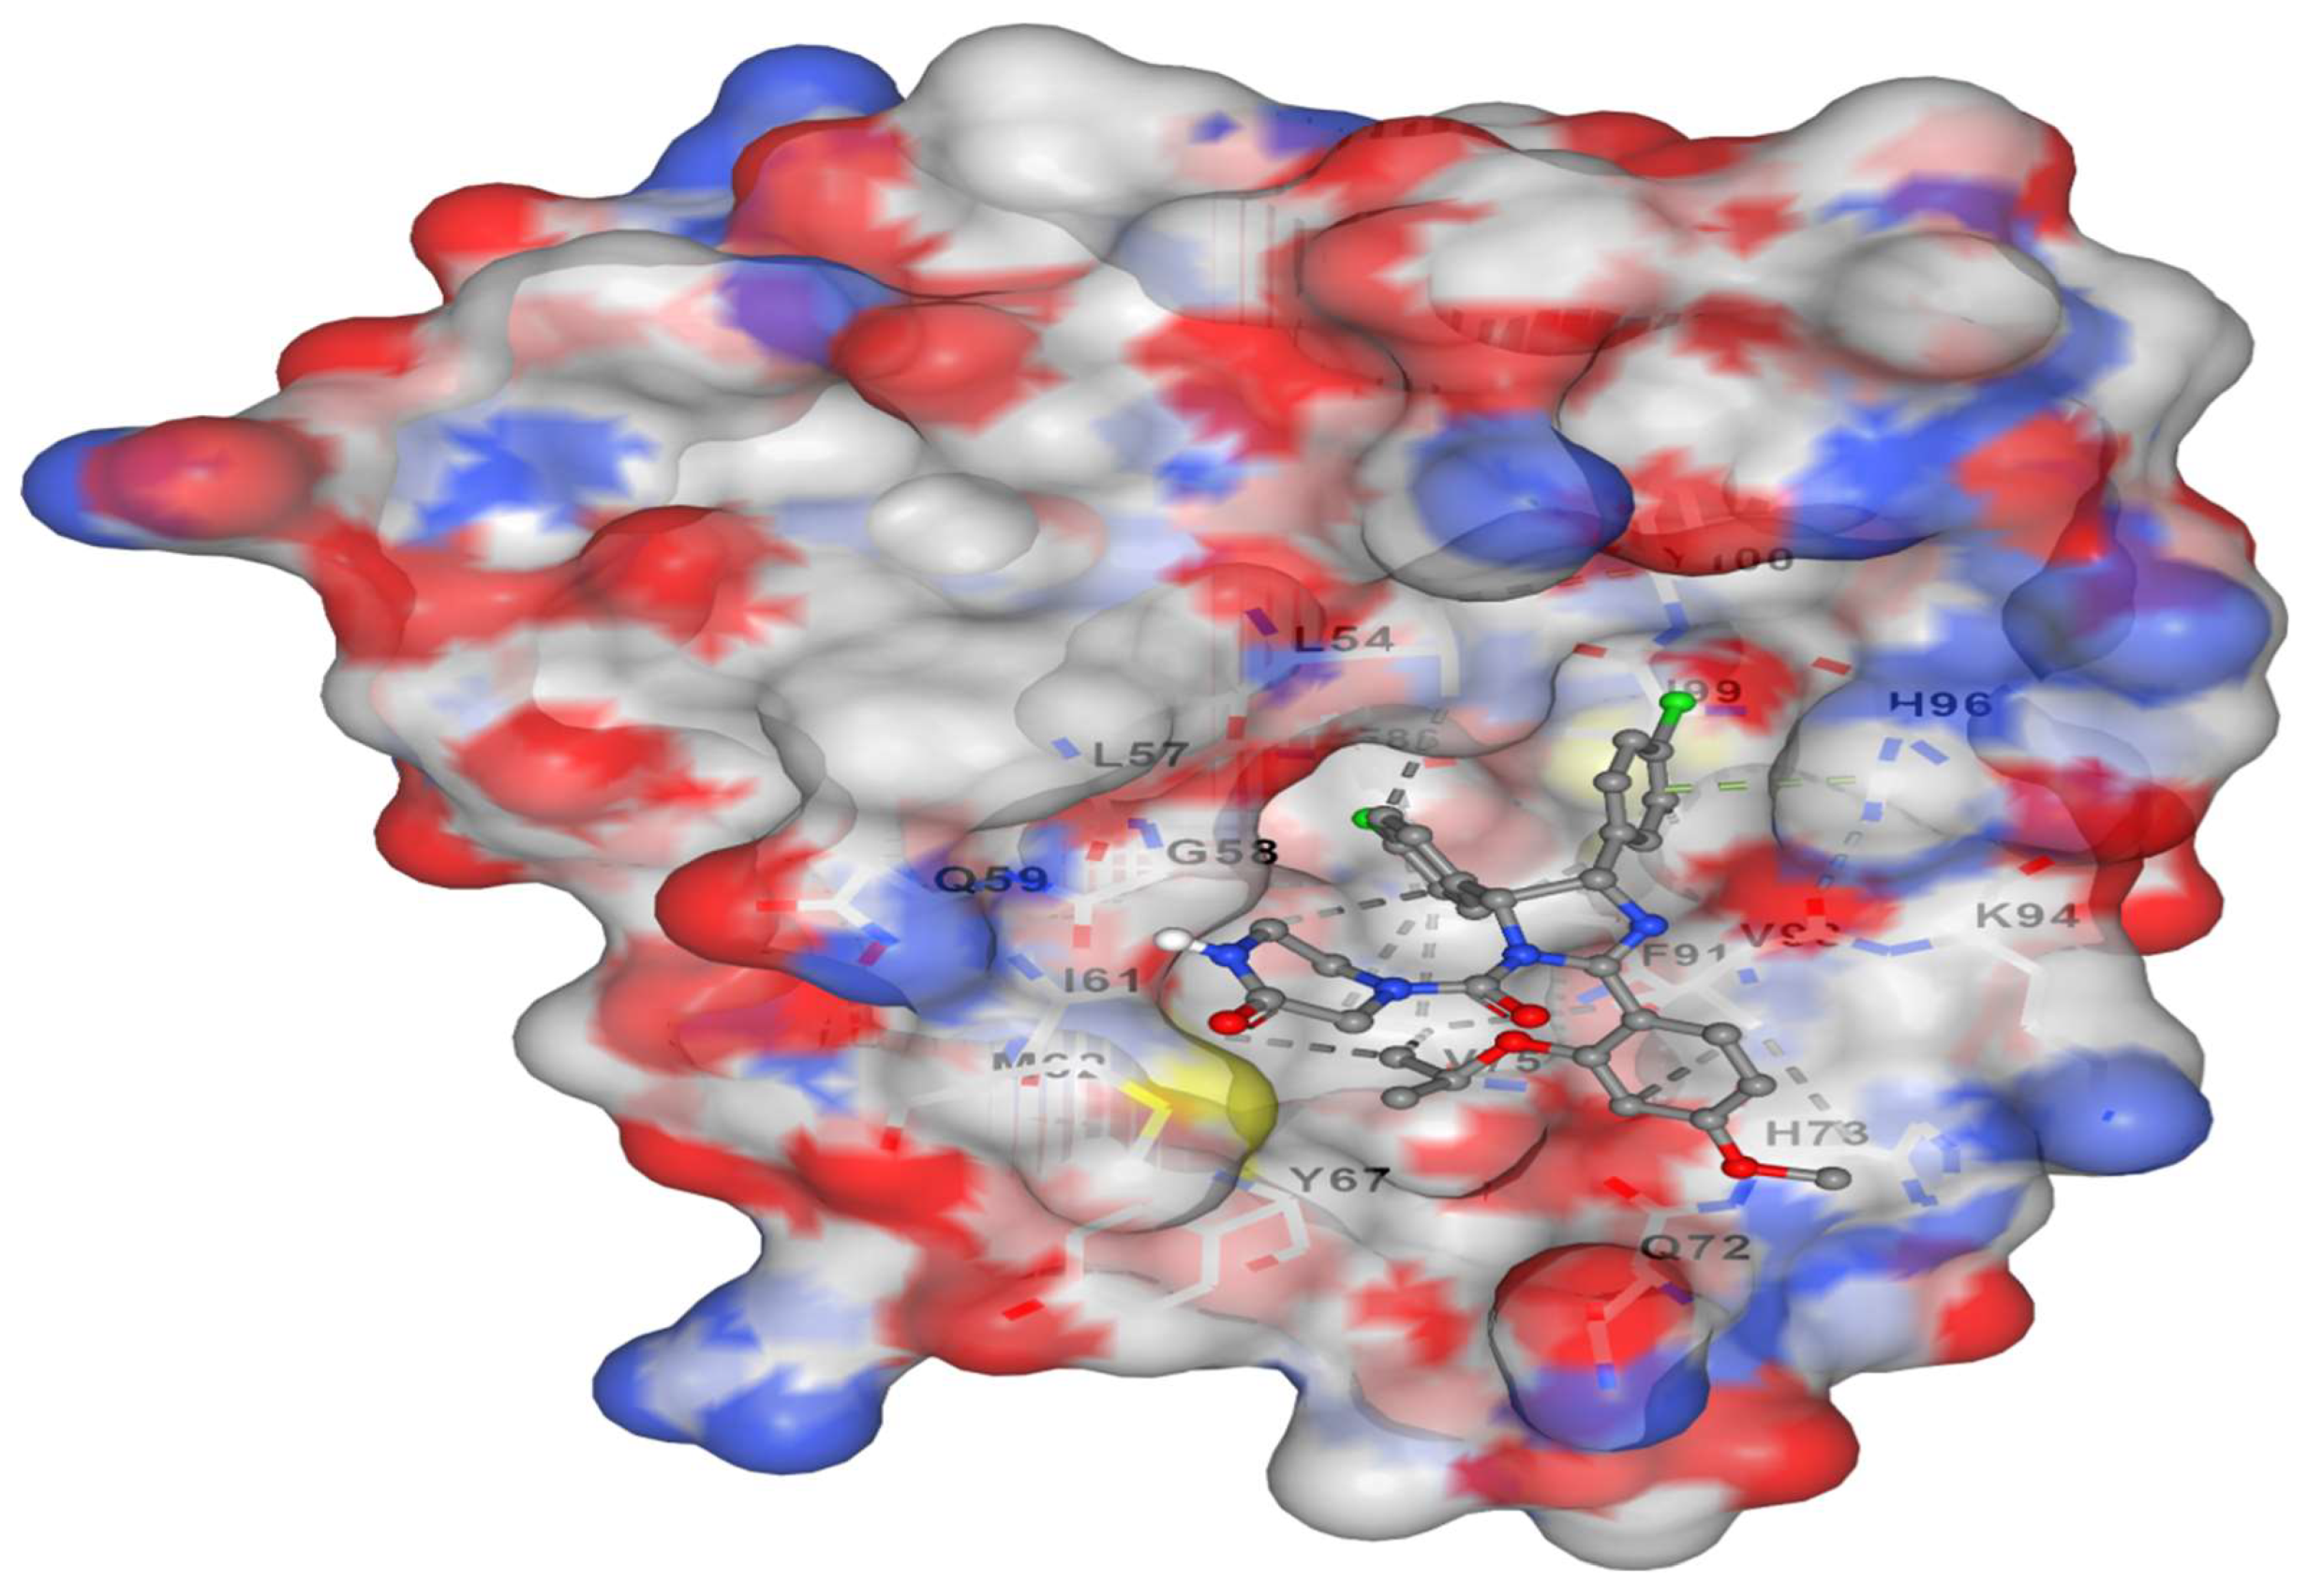
Figure 2.
It represents docking of Corallopyronin B ligand on Bacterial RNA polymerase. Corallopyronin B showed high affinity and inhibitory effect towards the switch region of RNA Polymerase. Molecular mass of Corallopyronin B was observed to be nearly 540 Da. ∆G was found to be roughly 15 J/mol; nevertheless it was discovered that the test antibiotic's Kd near the switch area was roughly -720 nM.
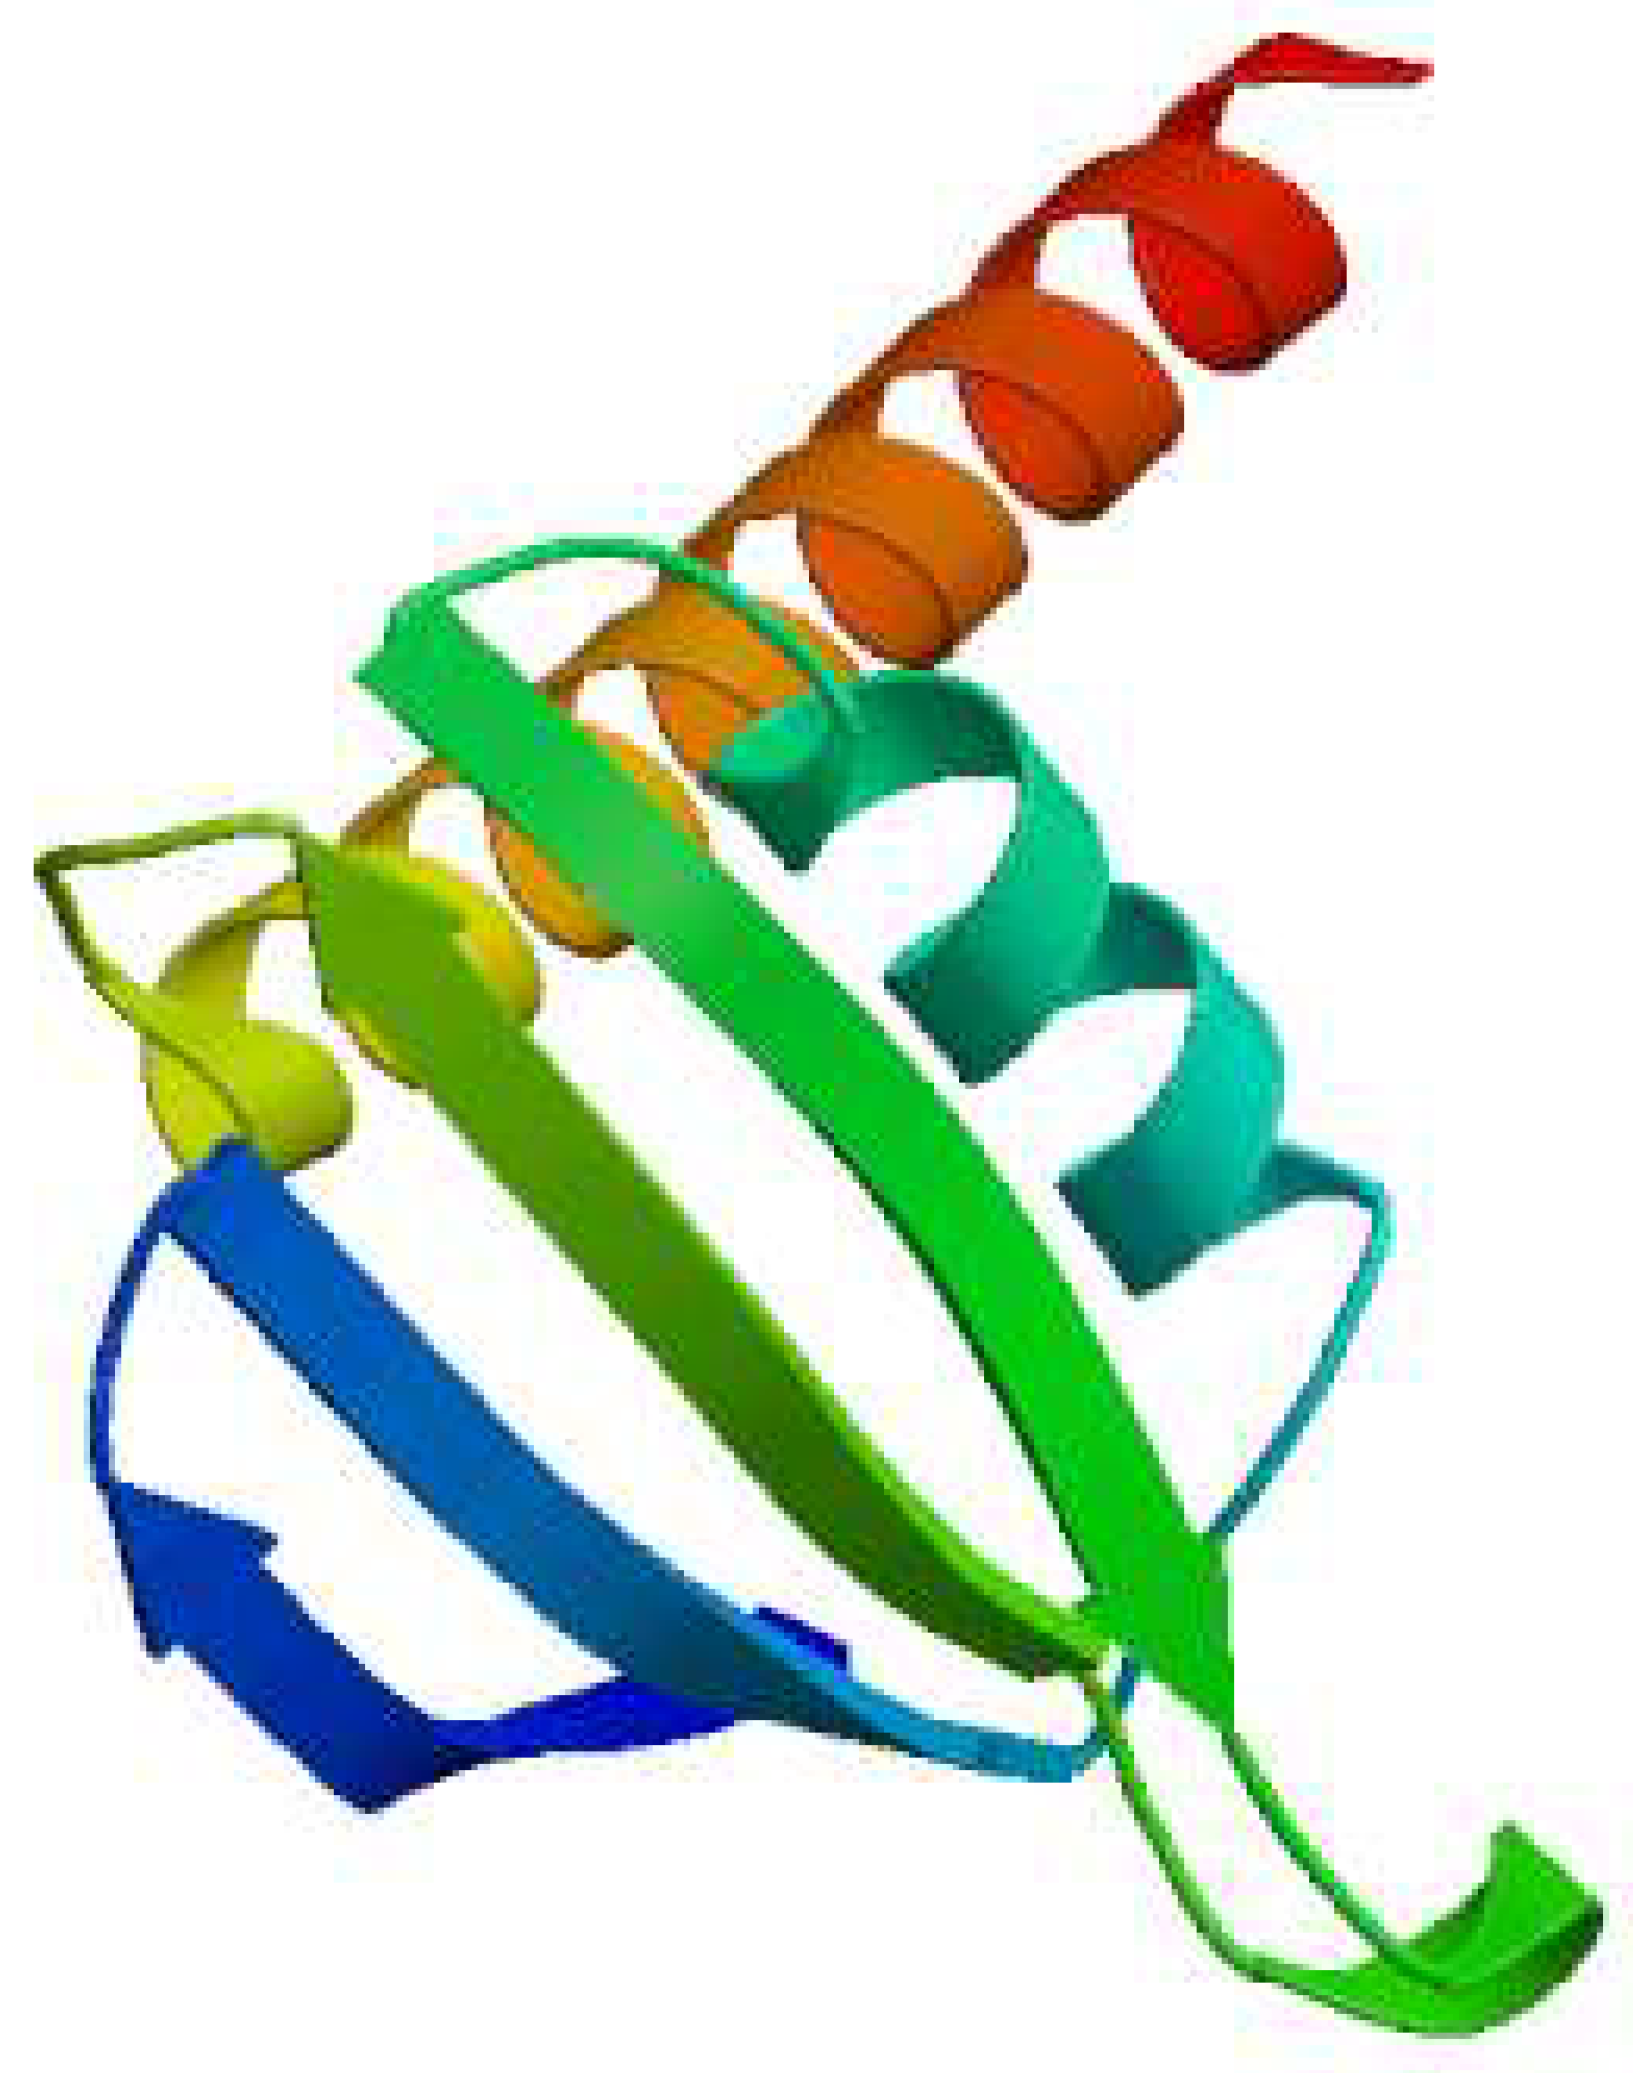
Figure 3.
It demonstrates 3D structure of bacterial prokaryotic RNA polymerase comprising the switch binding site to which Corallopyronin B Ligand strongly bound inhibiting bacterial RNA polymerase activity selectively leading to the inhibition of mRNA transcription and subsequently the mortality of the microbe. The secondary structure of RNA polymerase enzyme consisted of spiral alpha and beta sheets. Its molecular mass was approximately 198 amino-acids.
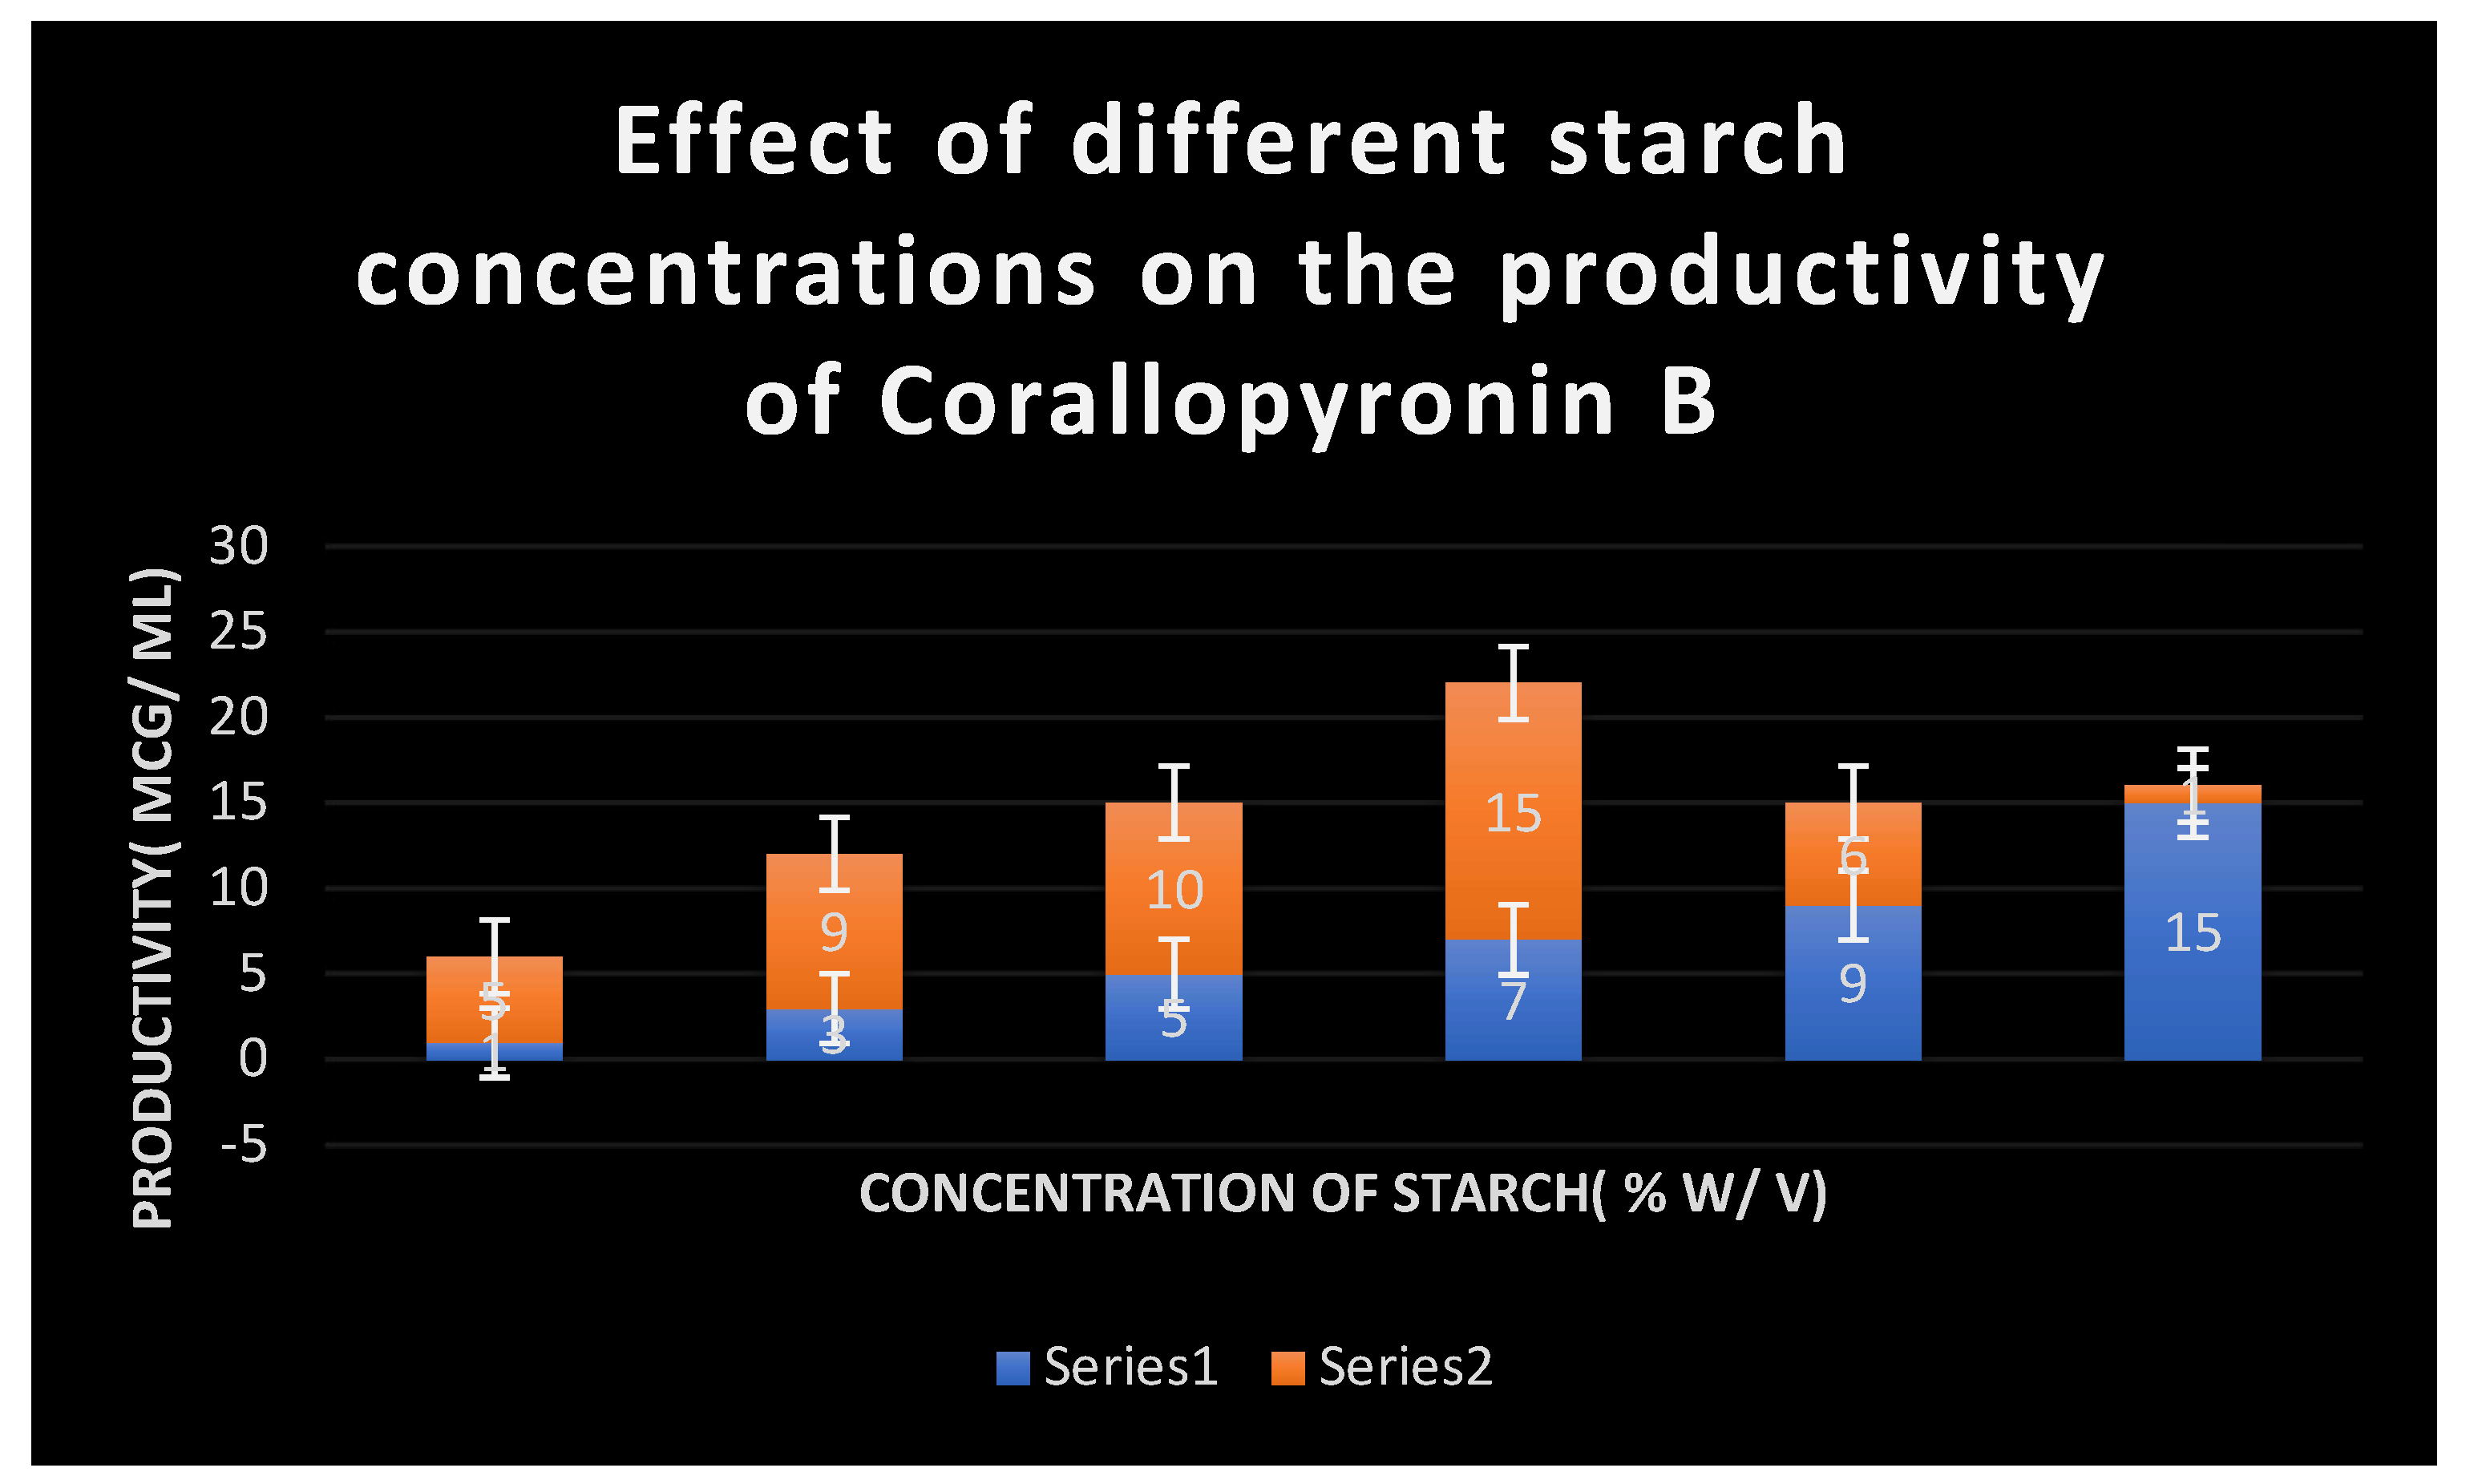
Figure 4.
It shows the impact of various concentrations of Soluble starch on the production of Corallopyronin B.
Figure 4.
It shows the impact of various concentrations of Soluble starch on the production of Corallopyronin B.
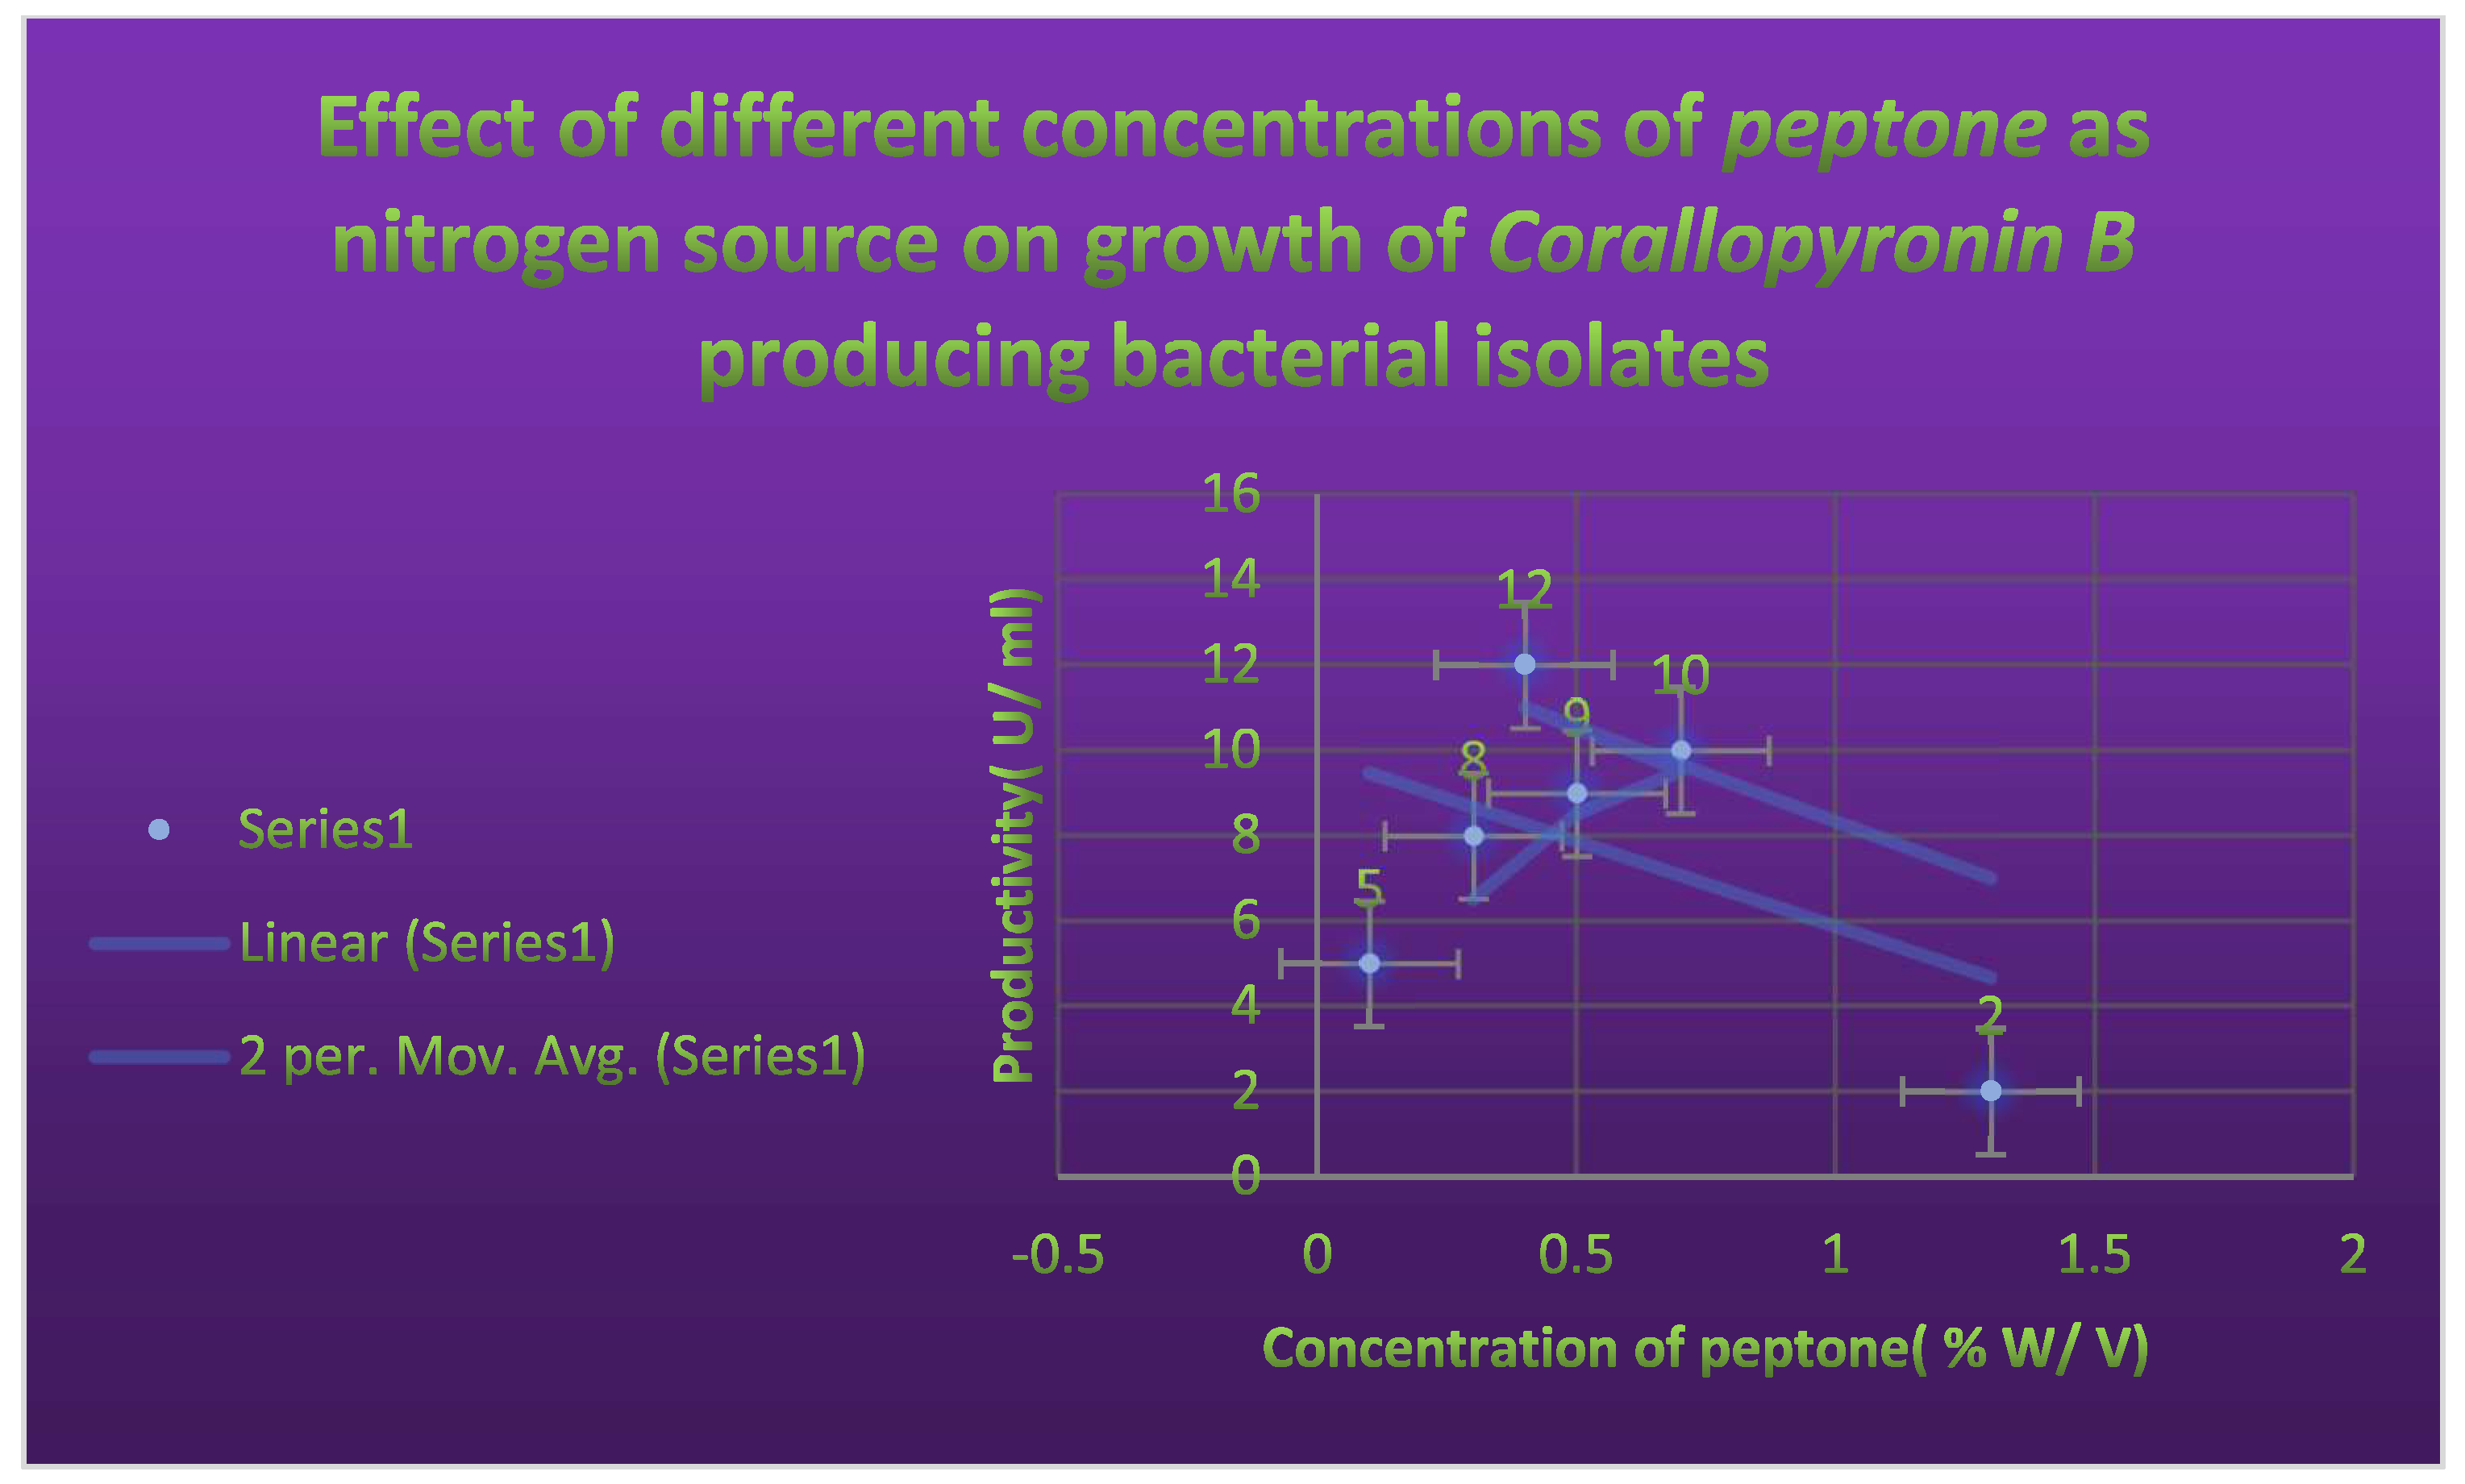
Figure 5.
It shows the effects of different Peptone concentrations as nitrogen growth factor on the productivity of Corallopyronin B.
Figure 5.
It shows the effects of different Peptone concentrations as nitrogen growth factor on the productivity of Corallopyronin B.
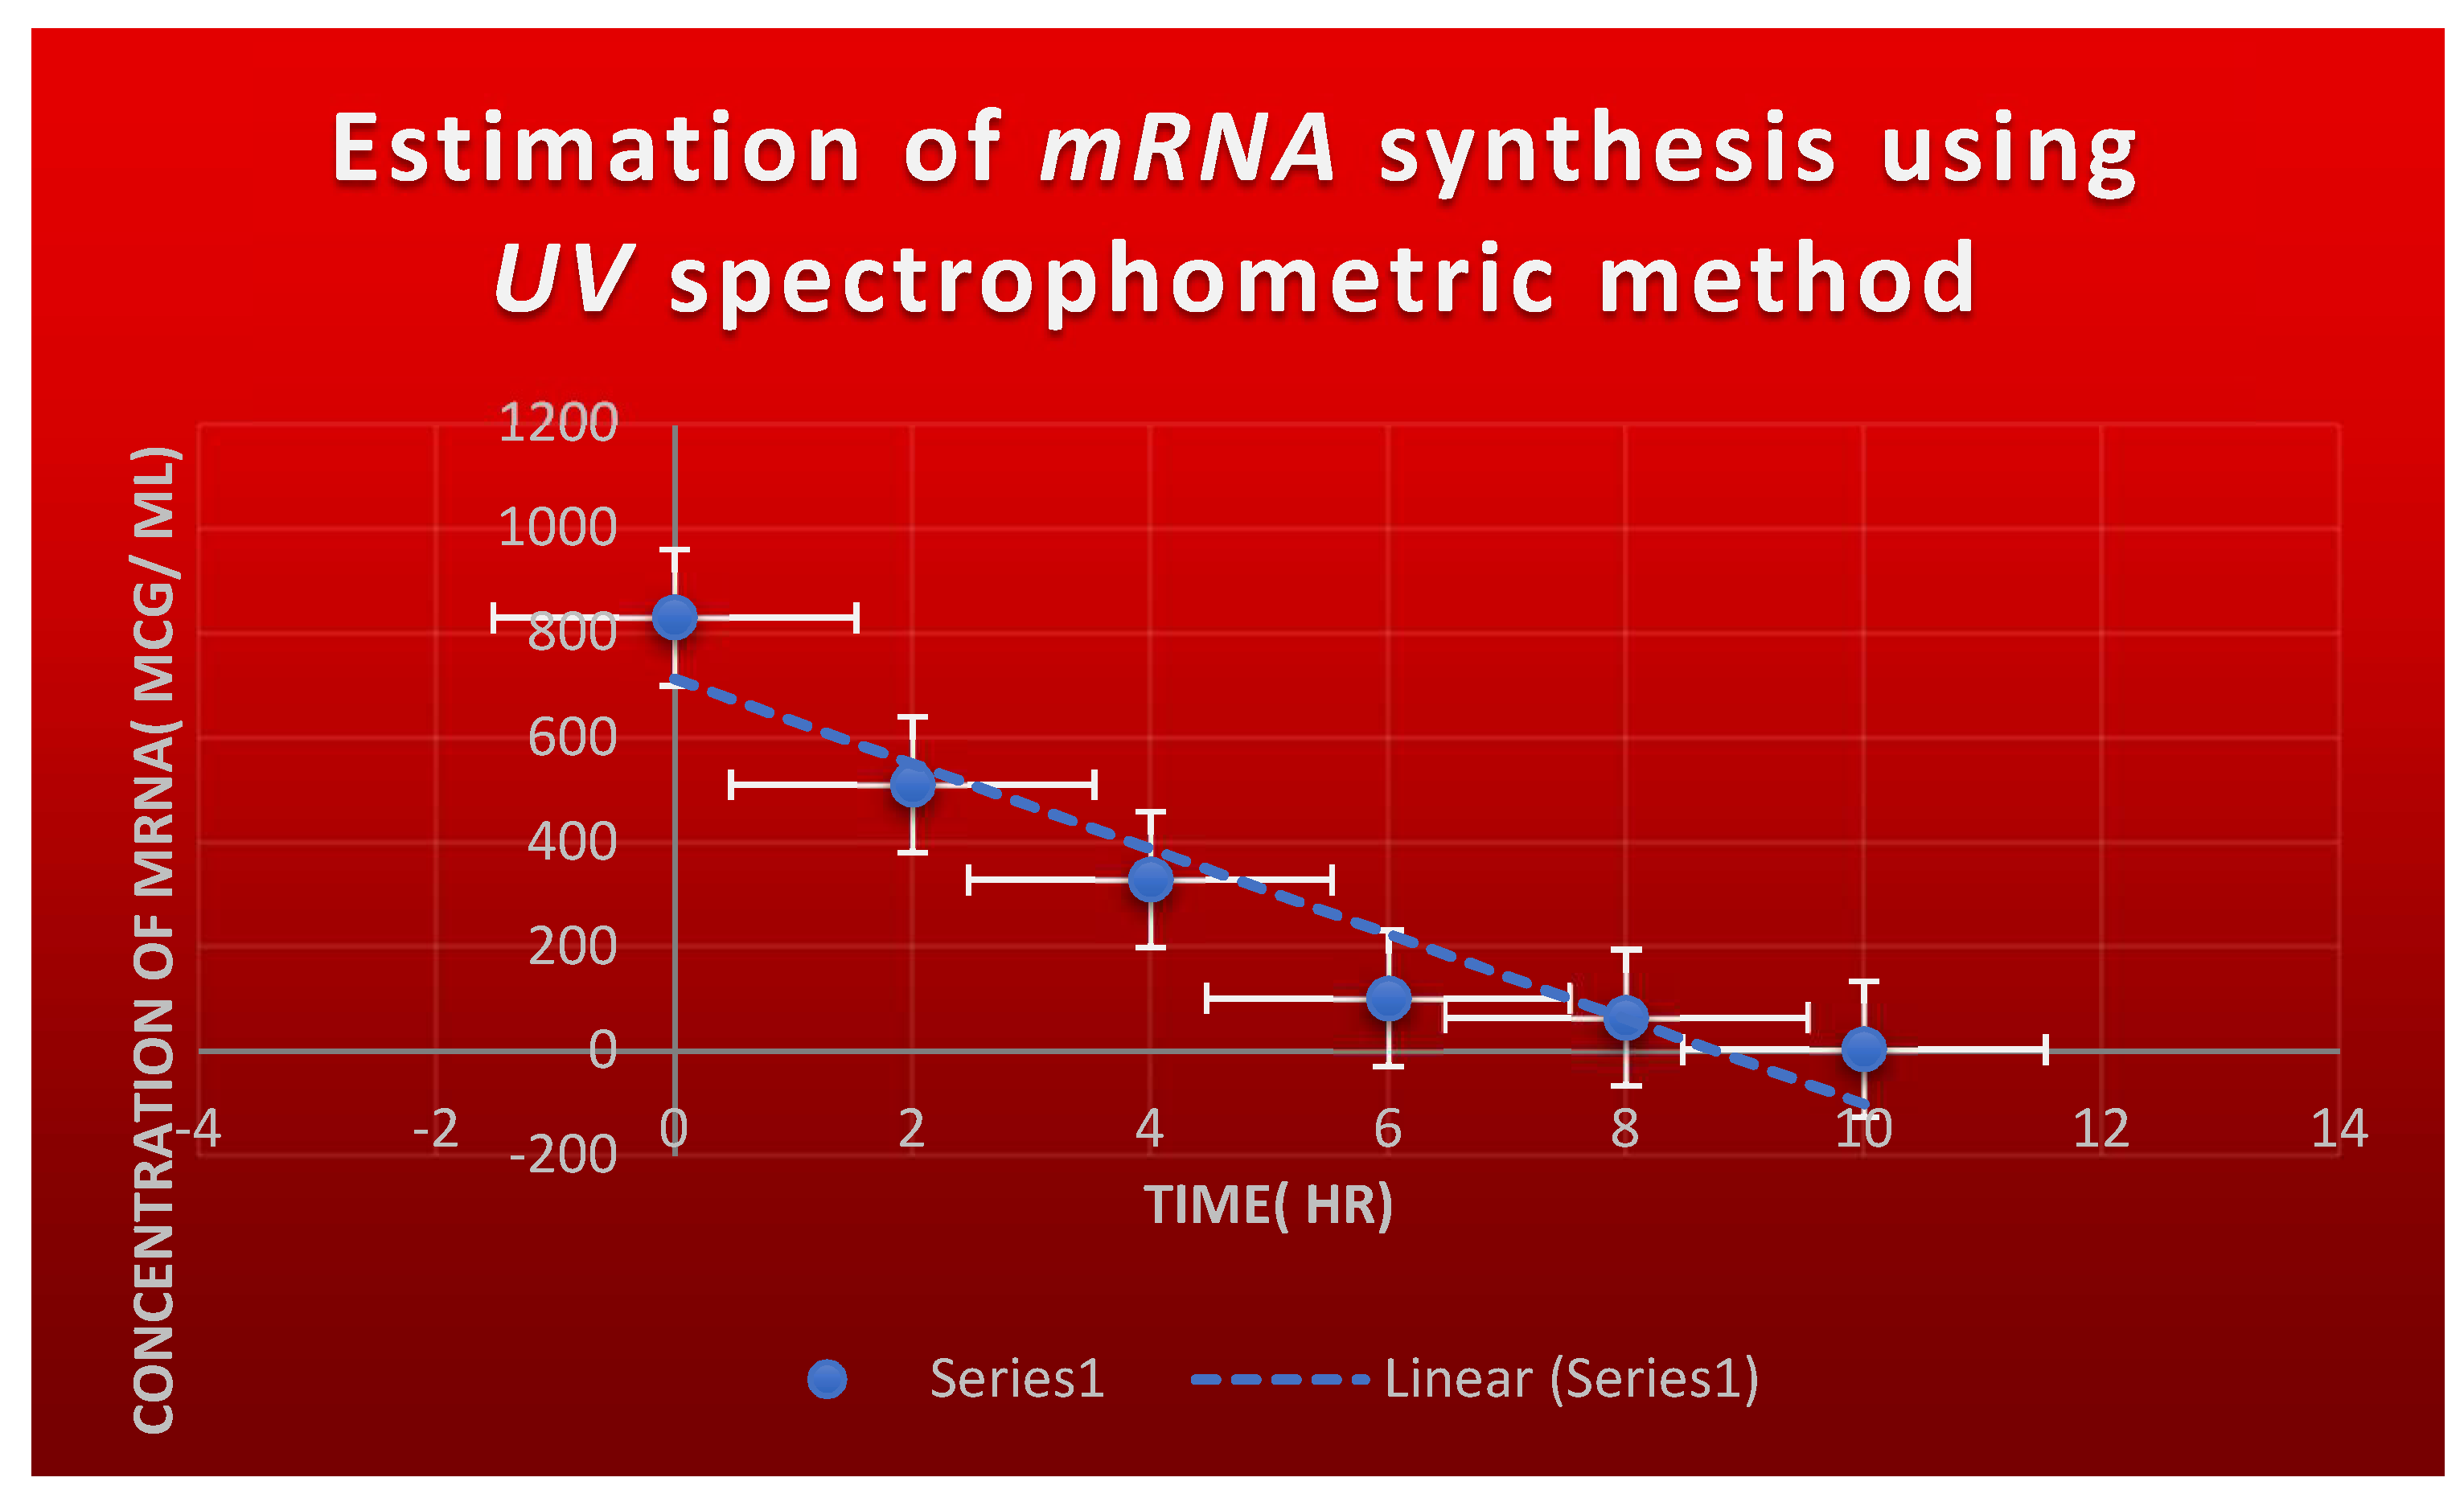
Figure 6.
It refers to the estimation of effect of Corallopyronin B on microbial mRNA productivity. mRNA synthesis was detected to be diminished proportionately up on employment of exploding doses of Myxopyronin B antibiotic.
Figure 6.
It refers to the estimation of effect of Corallopyronin B on microbial mRNA productivity. mRNA synthesis was detected to be diminished proportionately up on employment of exploding doses of Myxopyronin B antibiotic.
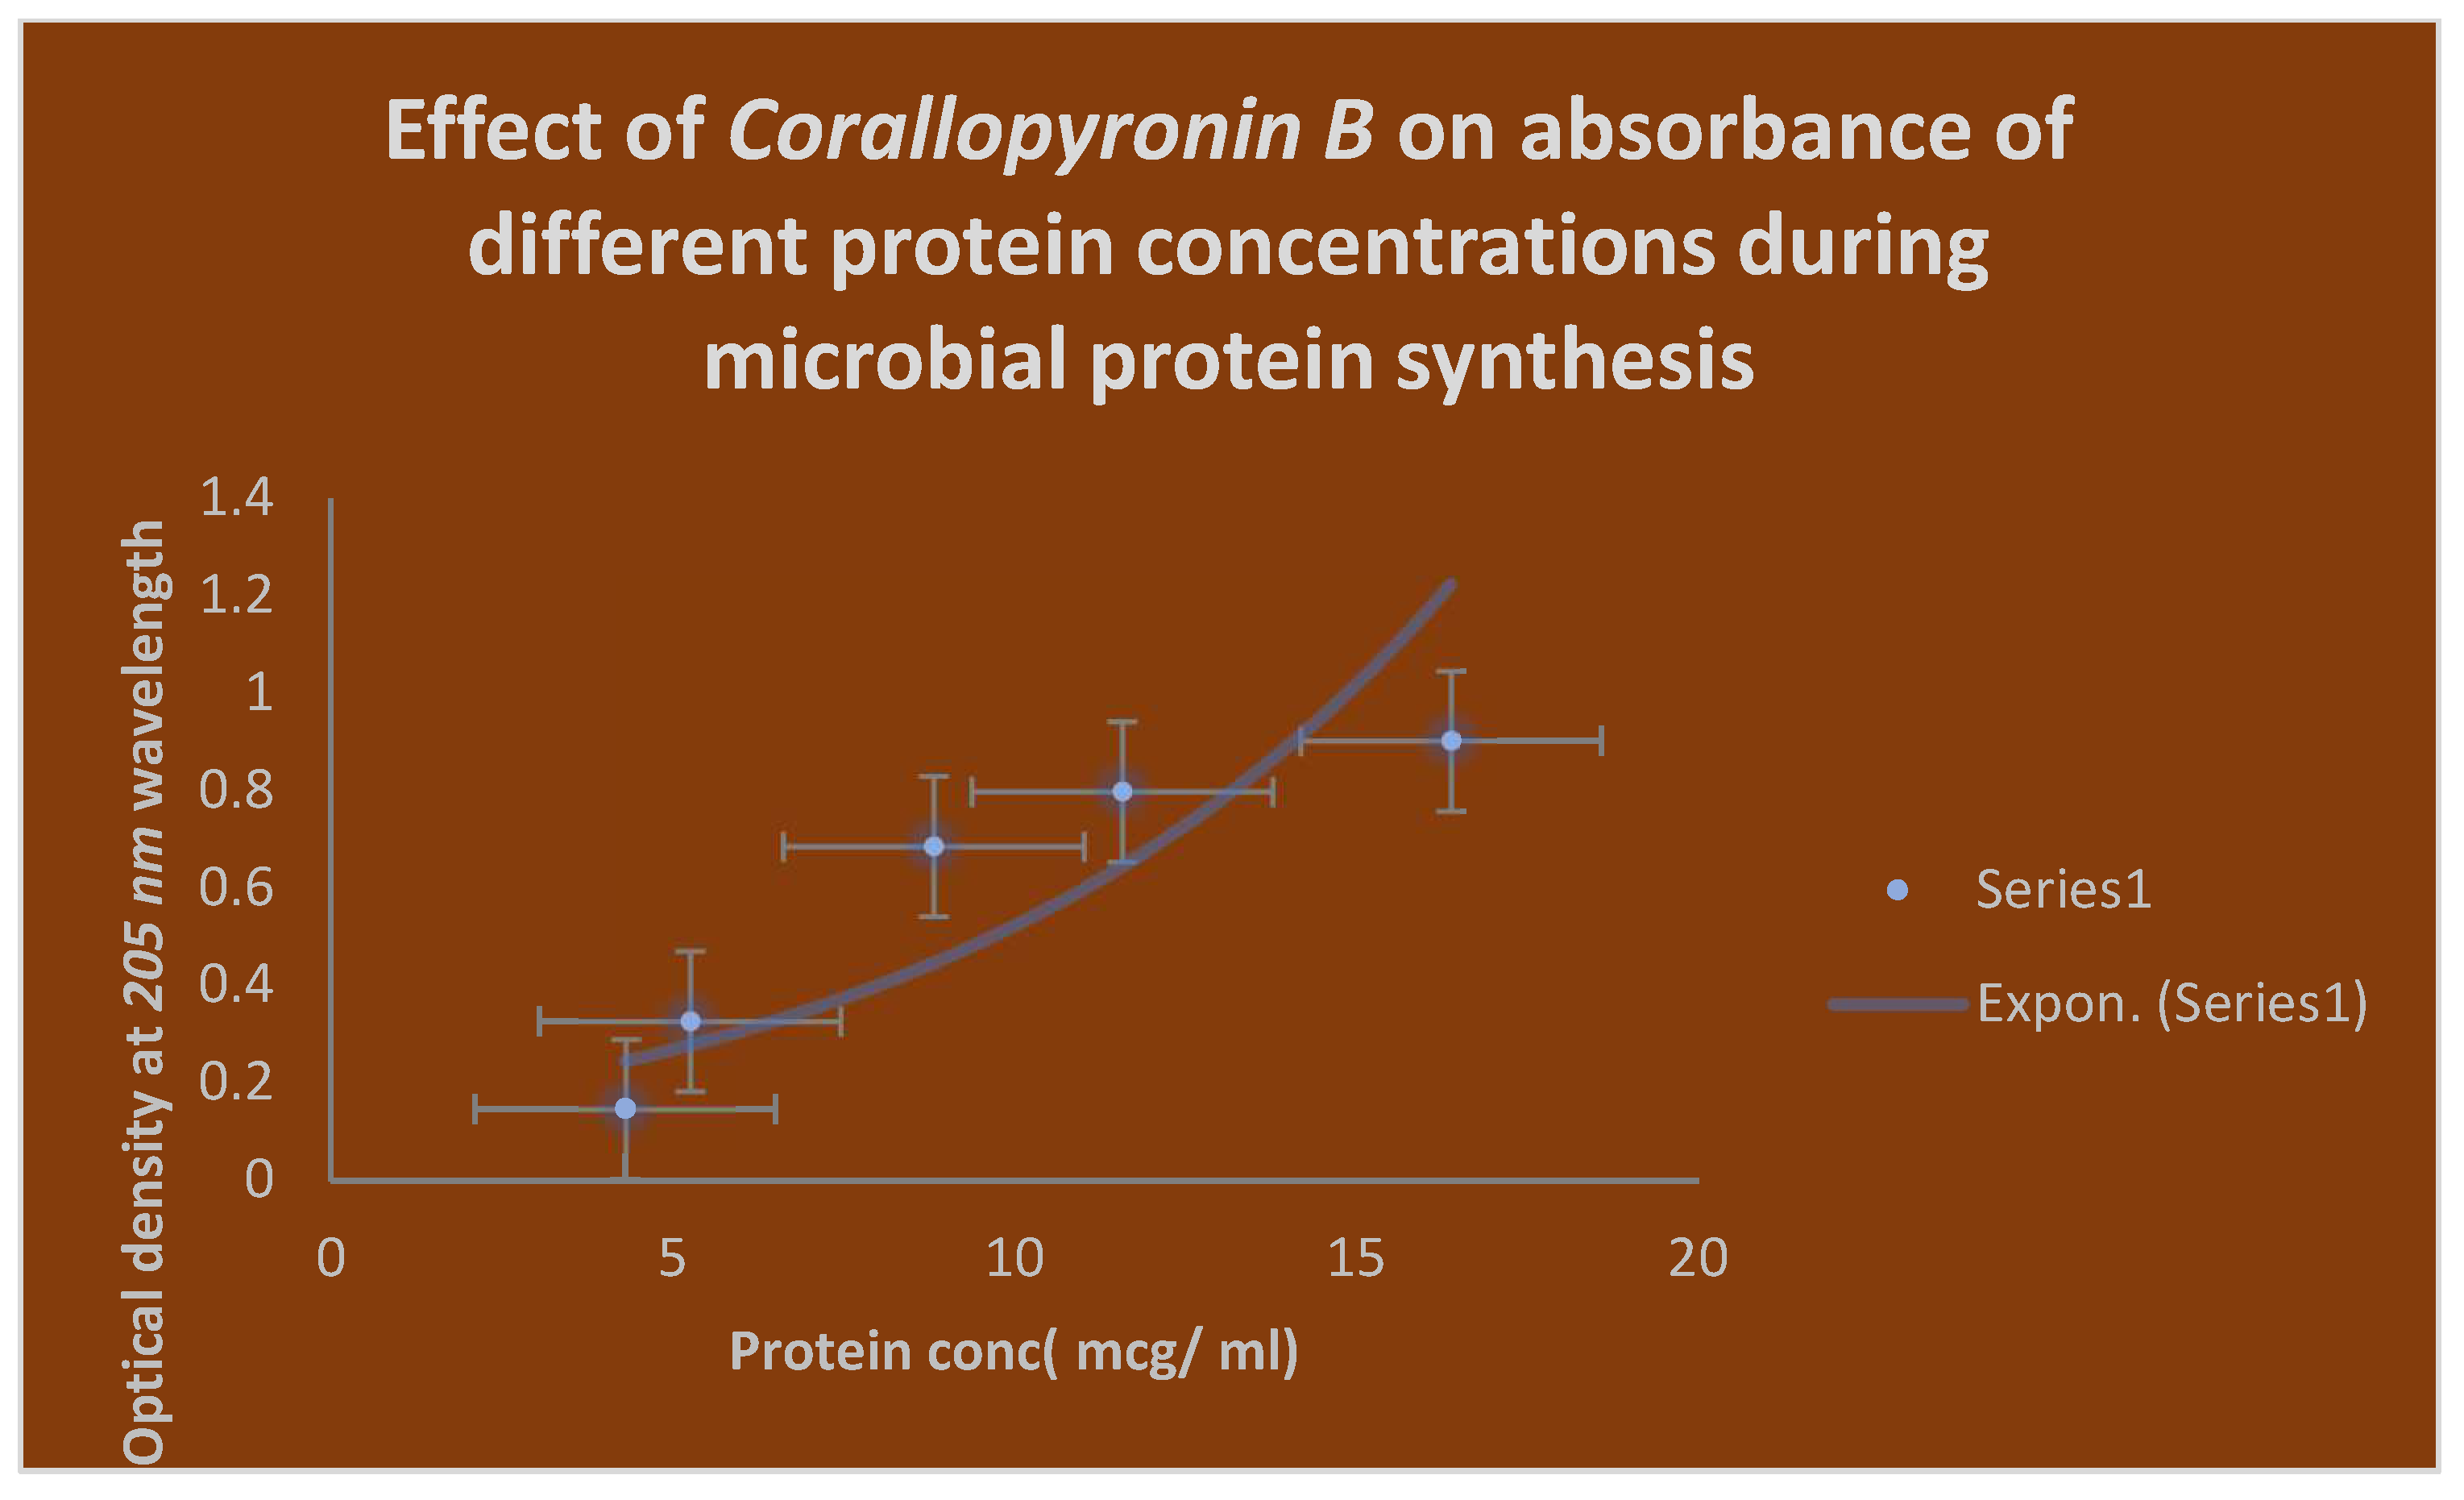
Figure 7.
It demonstrates the influence of Corallopyronin B on protein synthesis using UV spectrophotometer absorption at 205 nm. Protein synthesis was noticed to be decreased dramatically up on utilization of increasing doses of Corallopyronin B antibiotic.
Figure 7.
It demonstrates the influence of Corallopyronin B on protein synthesis using UV spectrophotometer absorption at 205 nm. Protein synthesis was noticed to be decreased dramatically up on utilization of increasing doses of Corallopyronin B antibiotic.
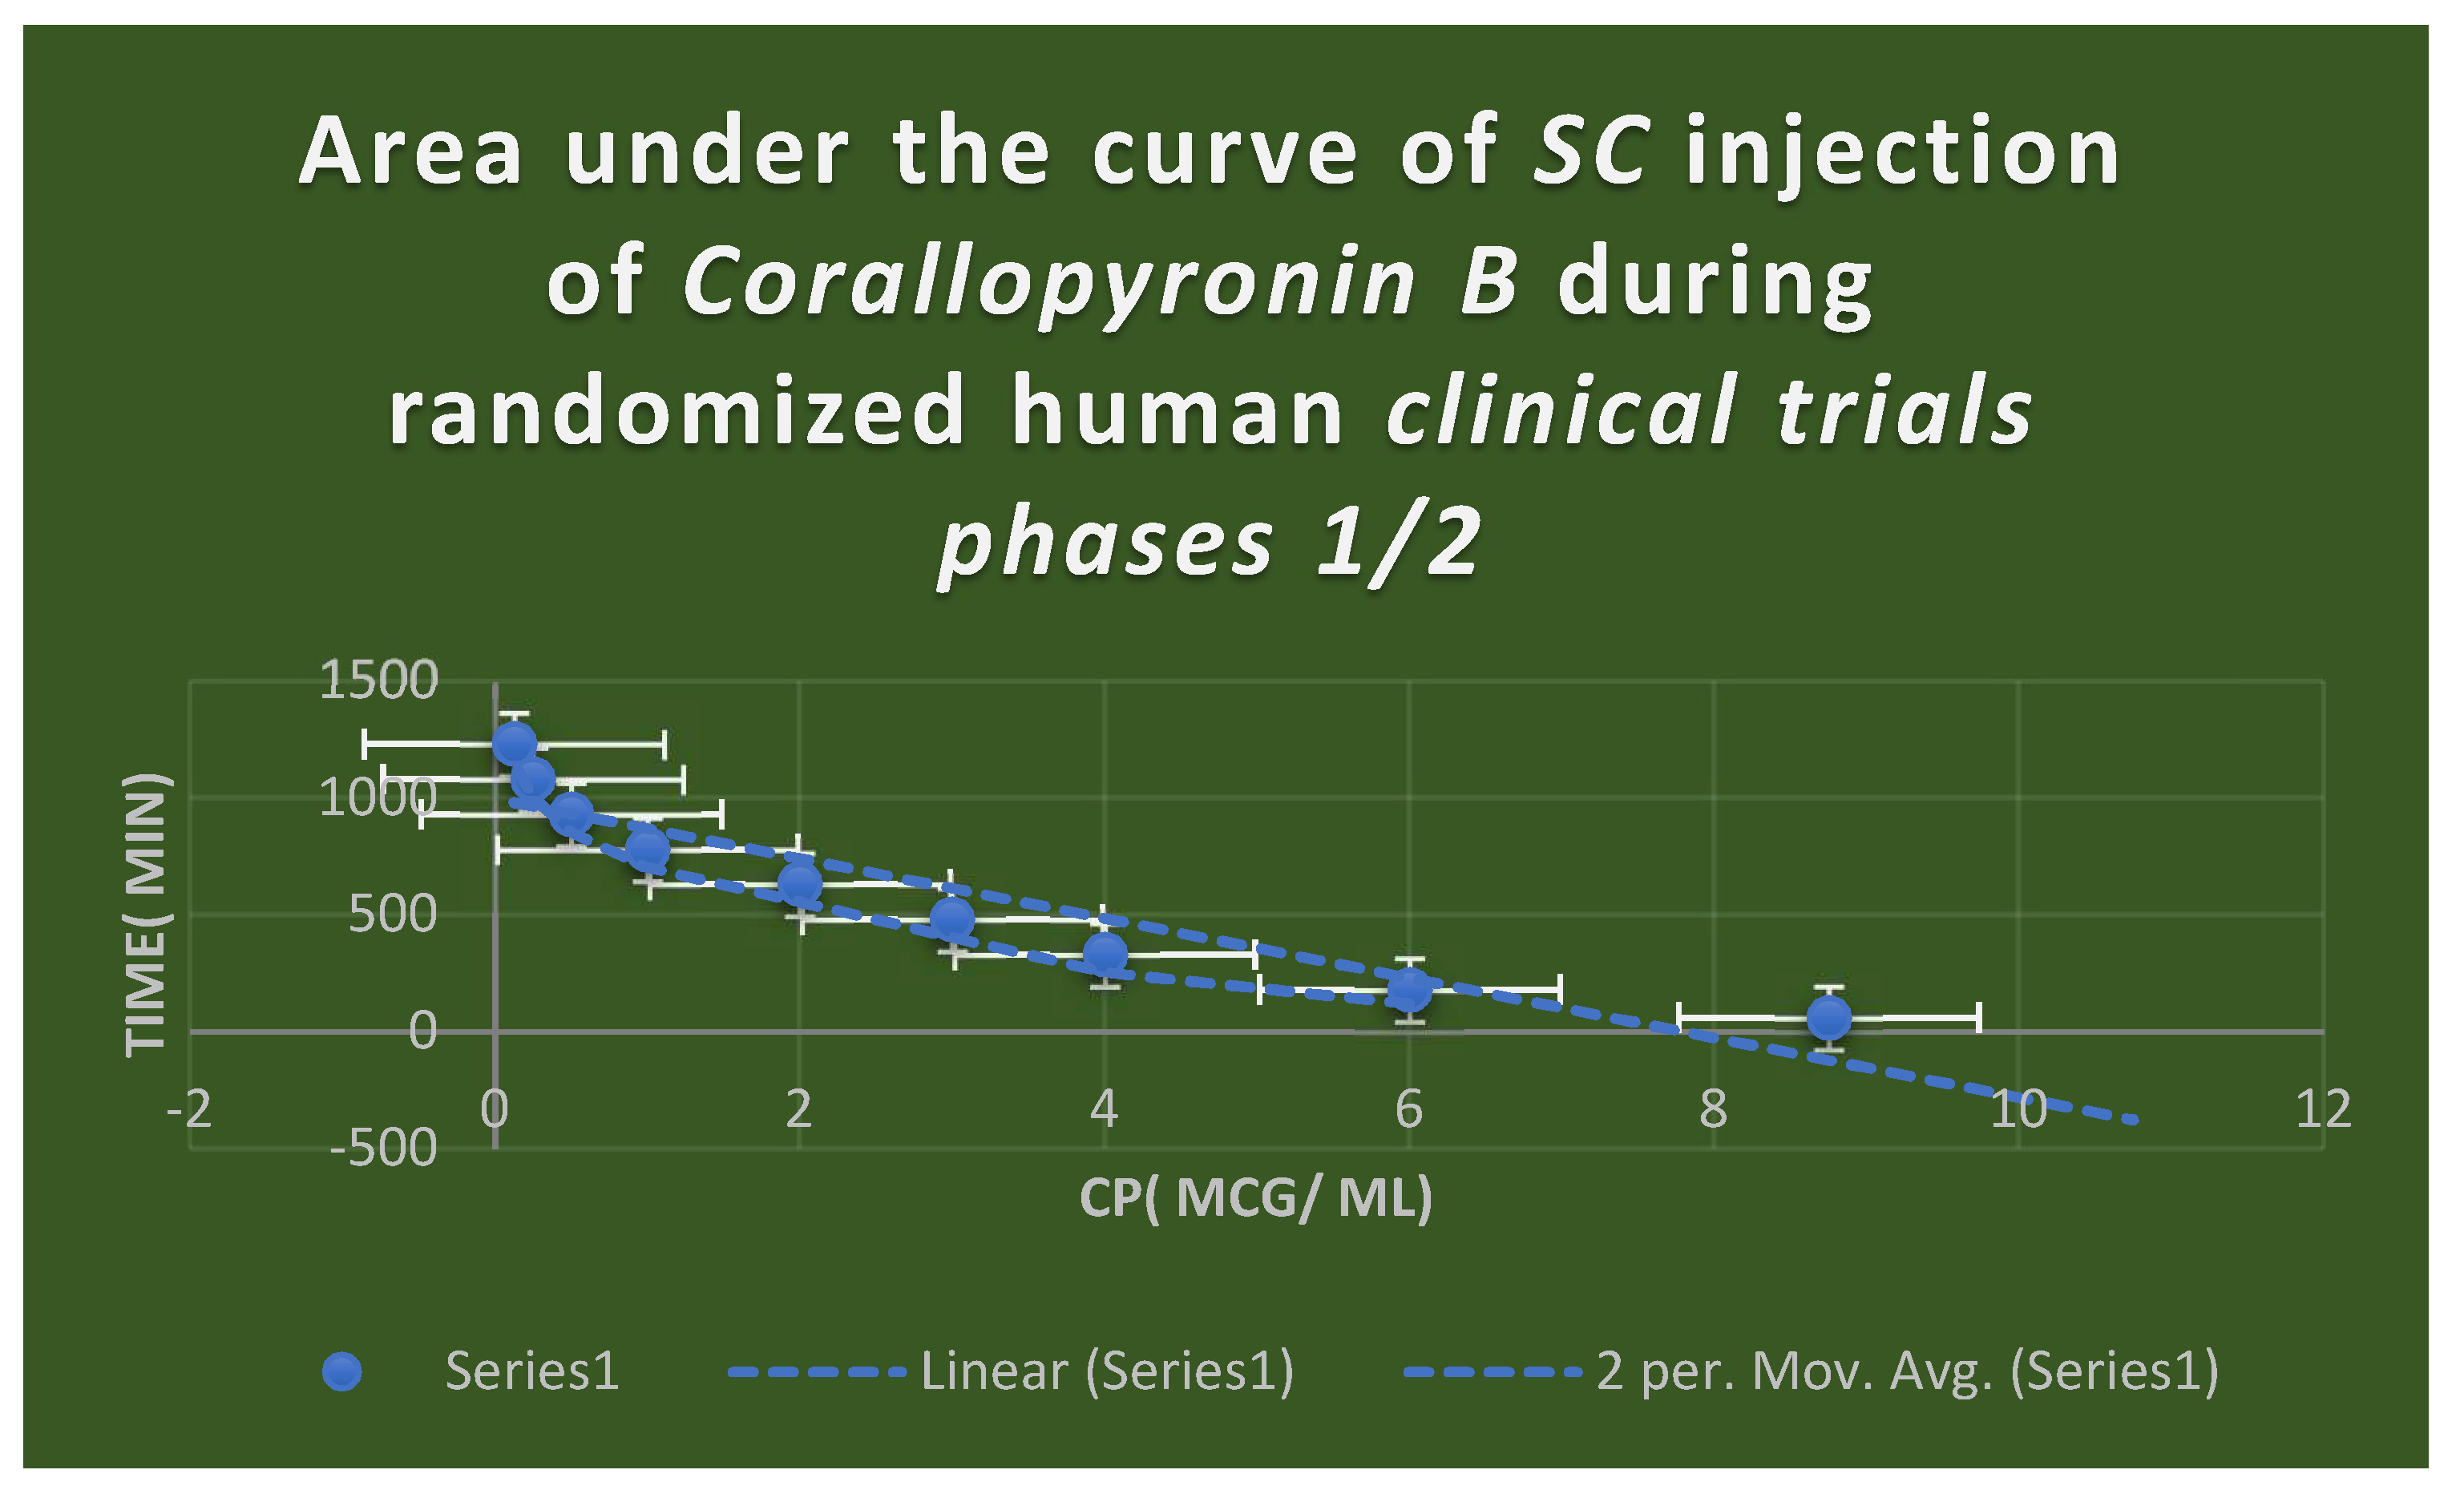
Figure 8.
It shows AUC of Corallopyronin B following SC administration in randomized human clinical trials stages 1/2. Efficacious dose ranged from 8-9 mg/ kg of body weight. Onset of action was observed following closely 15 minutes. It followed first order of elimination kinetics. Bioavailability approximately reached 96%.
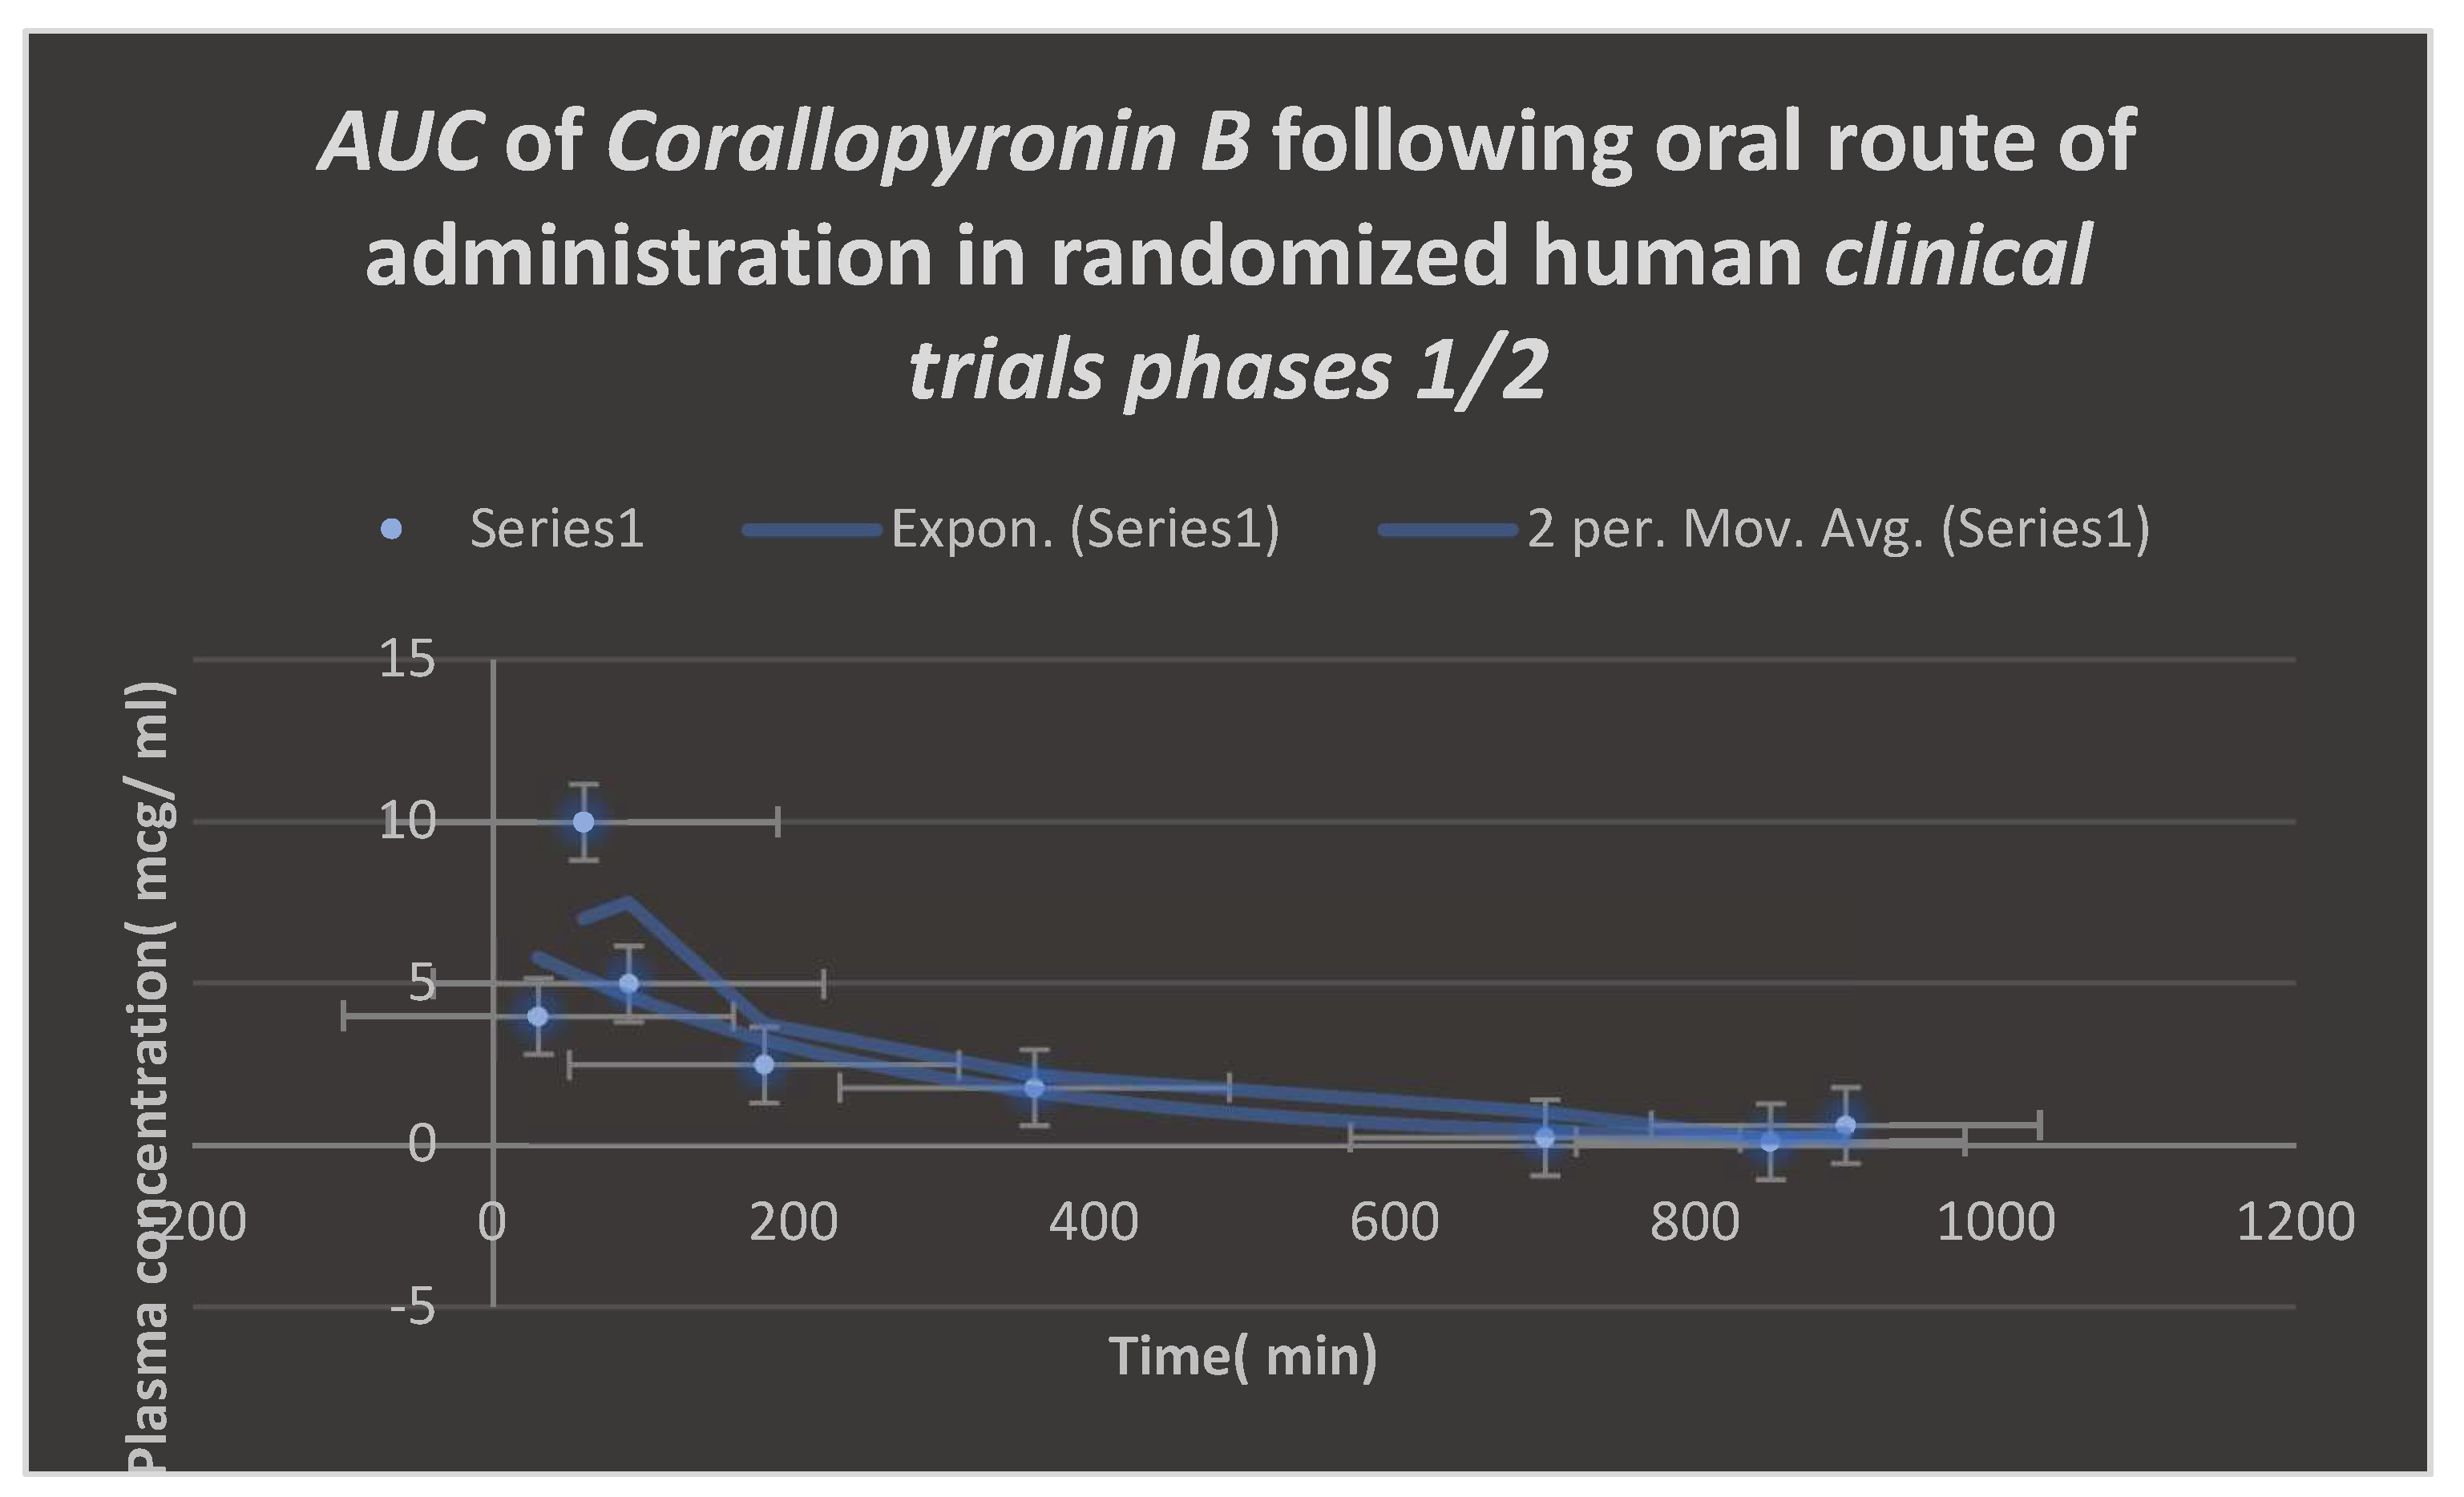
Figure 9.
Area under the curve( AUC) following oral administration of Corallopyronin B during clinical trials phases 1/2. Efficacious dose ranged from 9.5-10 mg/ kg of body weight. Onset of action was observed following nearly 30 minutes. It followed first order of elimination kinetics. Bioavailability reached approximately 95%.
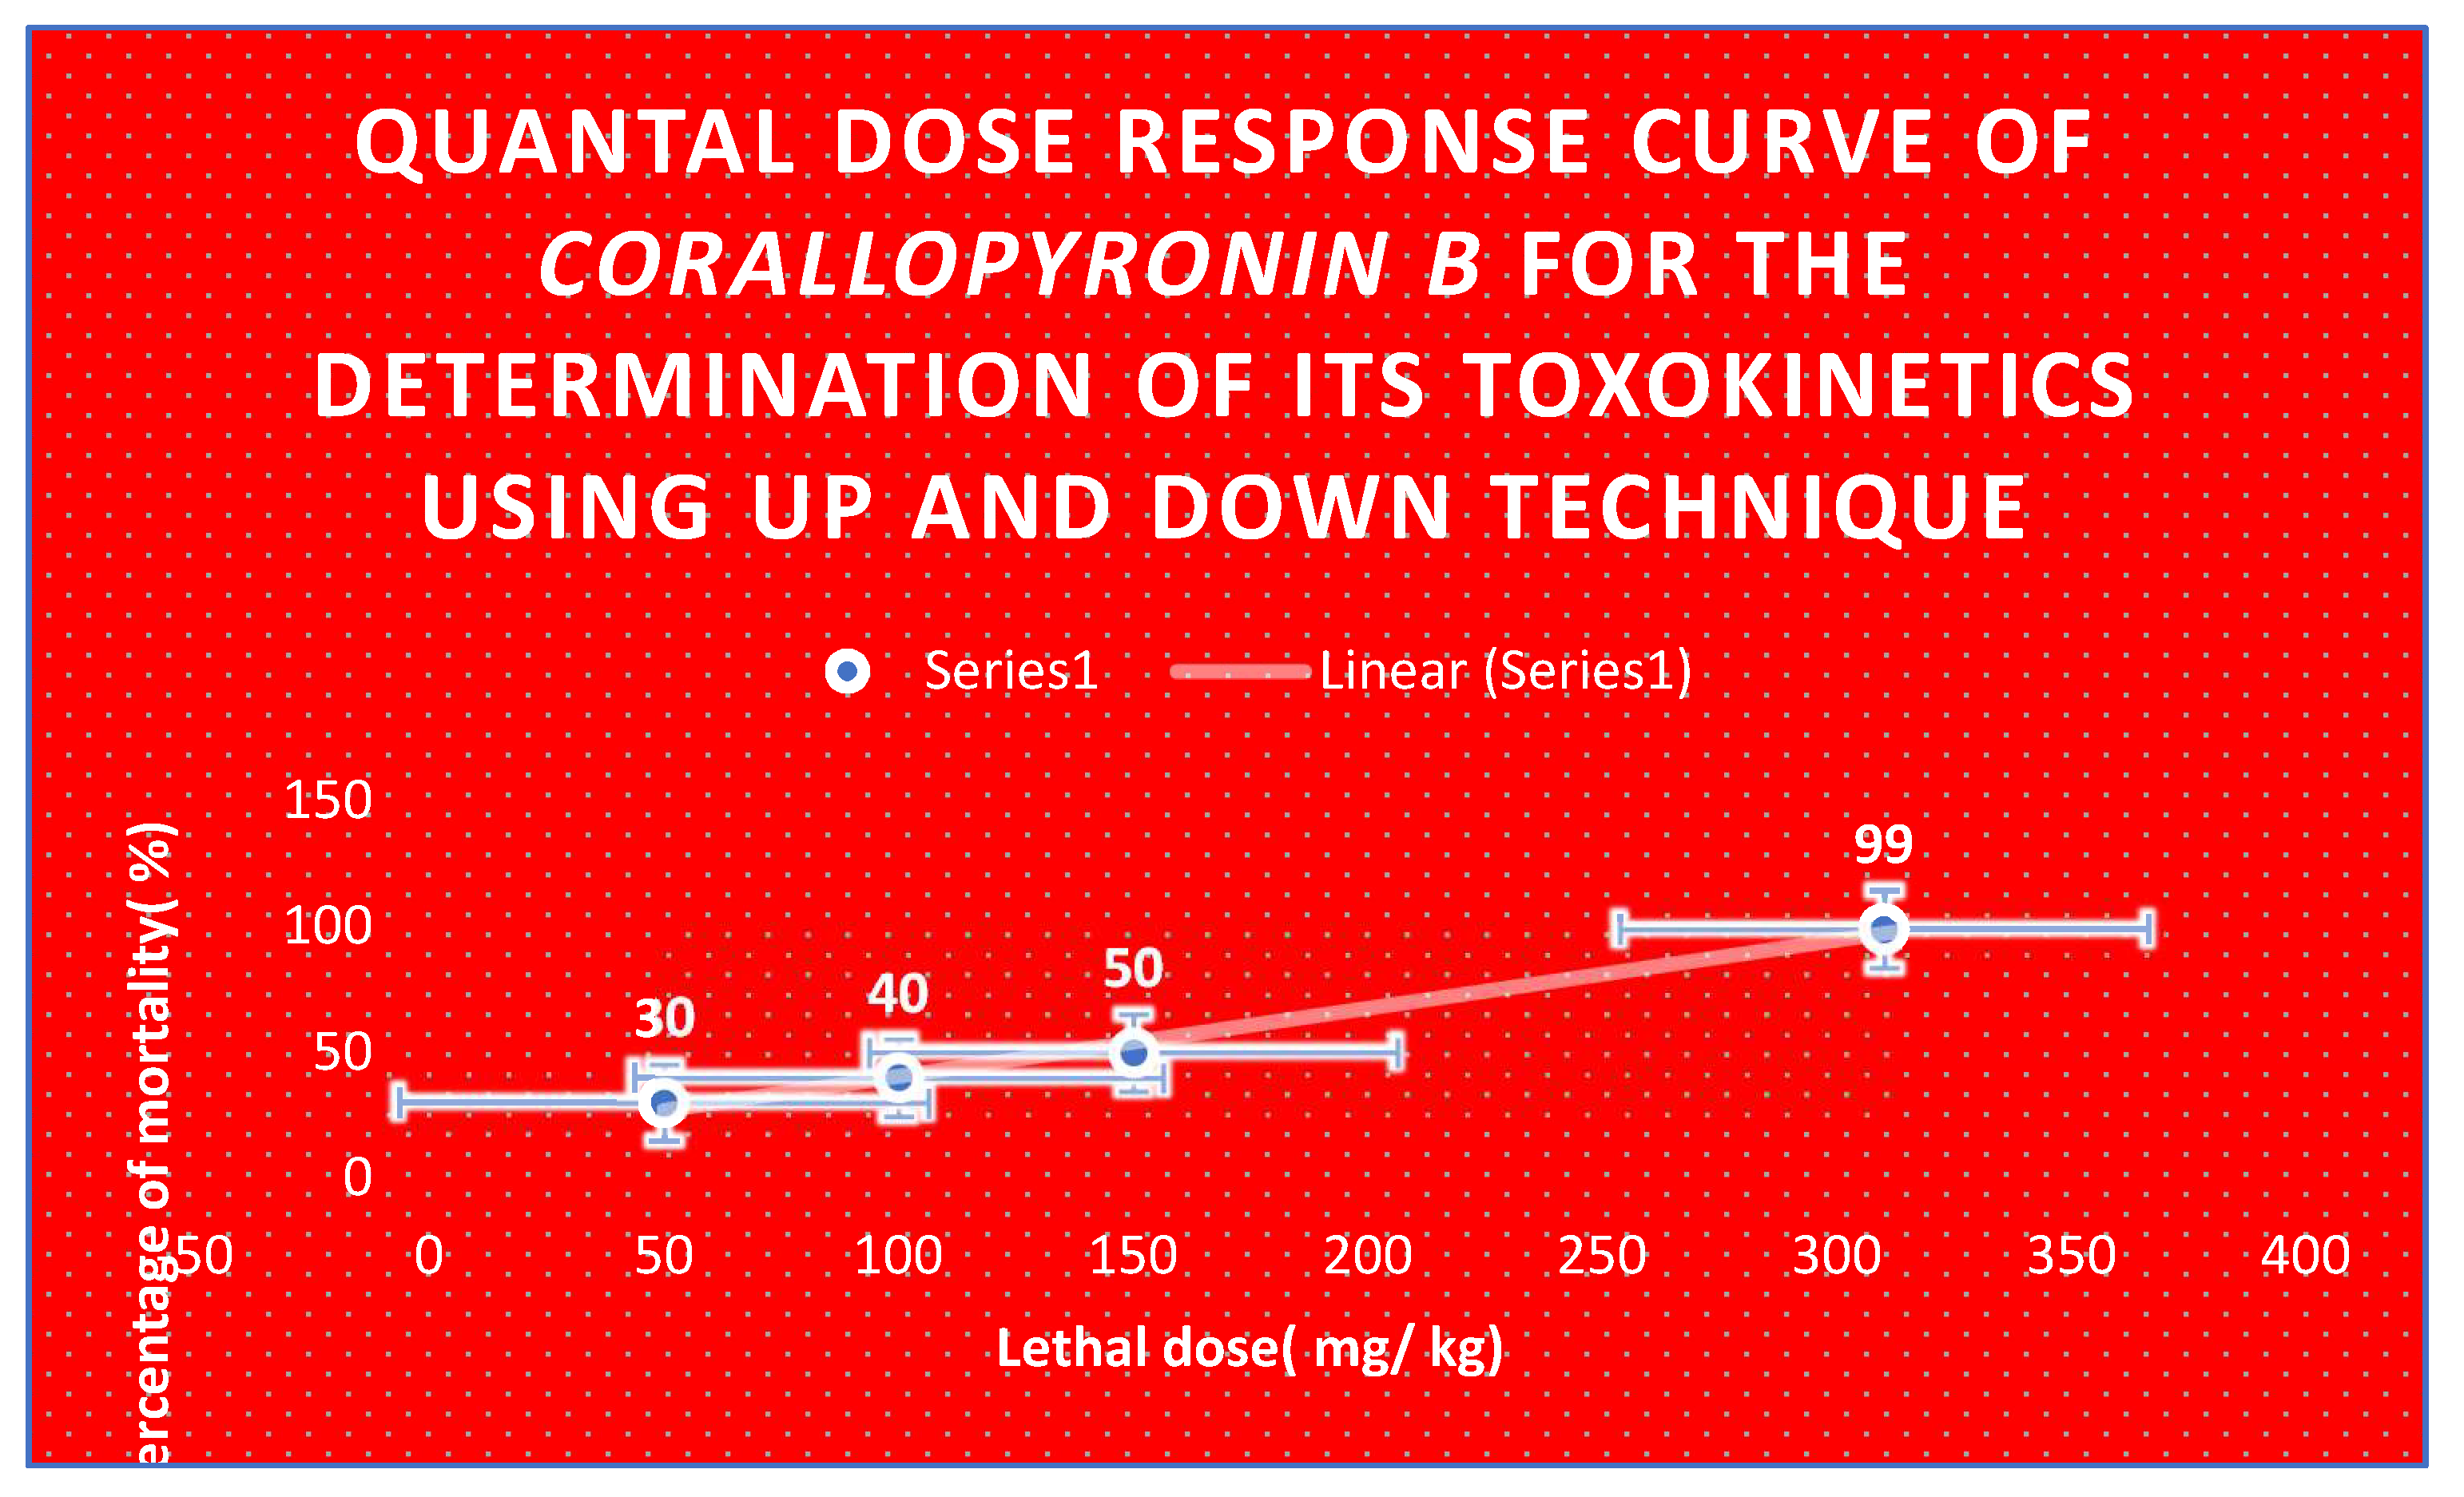
Figure 10.
Quantal dose response curve for the determination of toxokinetics of Corallopyronin B. LD50 % was found to be 150 mg / kg; while LD99 % was nearly 310 mg/ kg.
Figure 10.
Quantal dose response curve for the determination of toxokinetics of Corallopyronin B. LD50 % was found to be 150 mg / kg; while LD99 % was nearly 310 mg/ kg.
Results
From the culture supernatant of the soil bacterial isolate
Corallococcus coralloides DSM 2259, which was cultivated on Casein yeast peptone(
CYP) plate,
Corallopyronin B was generated. The test antibiotic prevented the growth of various
Gram +ve bacteria(
MICs ranging from
1 to 10 mcg/ml) and reduced the development of many
Gram -ve bacteria( including
Escherichia coli) at
MICs more than
100 mcg/ml. Conversely, eukaryotic cells—such as those found in fungi and humans—were unaffected. By preventing bacterial
DNA-dependent RNA polymerase, the test antibiotic was demonstrated to have a bactericidal effect(
RNLP). When
600 mg of the dose per
70 kg of body weight was given
SC in
phases 1/2 of randomized human clinical trials, the
Cmax was
8.6 mcg/ml at
Tmax of
one hour;
T1/2 reached
136 mins as a result of
first order kinetics of elimination. About
six to seven hours after
SC was given, it ceased working. Less than
6% of experimental candidates experienced unusual toxicity in
phases 1/2 of the preclinical and randomized human clinical trials, manifested as decreased bile flow. A detectable
83% protein binding with plasma albumin was found. After the test antibiotics were refined and purified using the
reverse phase HPLC technology, Corallopyronin B was the predominant component(
Table 4).
The 3T3 neutral red uptake phototoxicity test was used to determine the phototoxicity, and it revealed no phototoxicity. However, the Ames test was used to determine the mutagenicity and carcinogenicity of the test antibiotic, and the results showed that there was absolutely no genotoxicity or carcinogenicity. The main isolates of
Gram-negative bacteria that produce the antibiotic
Corallopyronin B are shown using a stereomicroscope in
Figure 11.
Table 3.
It shows the distribution of Corallopyronin B producing bacterial isolates:.
Table 3.
It shows the distribution of Corallopyronin B producing bacterial isolates:.
| No of +ve bacterial isolates producing Corallopyronin A |
No of -ve bacterial isolates producing Corallopyronin A |
| 61 |
39 |
Table 4.
It demonstrates the degree of purity of test antibiotics following the purification via reversed phase HPLC technique:.
Table 4.
It demonstrates the degree of purity of test antibiotics following the purification via reversed phase HPLC technique:.
| Test antibiotic |
Degree of purity( %) |
| Corallopyronin A |
7 |
| Corallopyronin B |
90 |
| Corallopyronin C |
3 |
Table 5.
It demonstrates 16 S rRNA detection of Corallopyronin B producing isolates using BLASTn software:.
Table 5.
It demonstrates 16 S rRNA detection of Corallopyronin B producing isolates using BLASTn software:.
| Description |
Query Cover |
E value |
Per. ident |
Acc. Len |
| Corallococcus coralloides DSM 2259, complete genome |
100% |
0 |
100 |
10080619 |
| Corallococcus sp. NCRR chromosome, complete genome |
100% |
0 |
99.05 |
9787125 |
| Corallococcus coralloides strain B035 chromosome, complete genome |
100% |
0 |
98.57 |
9587888 |
| Corallococcus sp. EGB chromosome, complete genome |
100% |
0 |
96.83 |
9431171 |
| Myxococcus fulvus 124B02, complete genome |
100% |
0 |
92.08 |
11048835 |
| Myxococcus sp. MH1 DNA, complete genome |
100% |
0 |
91.92 |
10778154 |
| Myxococcus sp. SDU36 chromosome, complete genome |
100% |
0 |
91.63 |
9016985 |
| Myxococcus xanthus strain GH3.5.6c2 chromosome, complete genome |
100% |
0 |
91.28 |
9321034 |
| Vulgatibacter incomptus strain DSM 27710, complete genome |
99% |
2.00E-153 |
82.99 |
4350553 |
| Anaeromyxobacter sp. Fw109-5, complete genome |
99% |
1.00E-125 |
80.43 |
5277990 |
| Uncultured bacterium clone F5K2Q4C04IF4QS 23S ribosomal RNA gene, partial sequence |
77% |
3.00E-122 |
83.53 |
492 |
| Uncultured bacterium clone F5K2Q4C04I5GUV 23S ribosomal RNA gene, partial sequence |
77% |
6.00E-114 |
82.73 |
491 |
Table 6.
It shows the estimation of zones of inhibition and minimum inhibitory concentrations of Corallopyronin B via Agar diffusion assay using paper discs:.
Table 6.
It shows the estimation of zones of inhibition and minimum inhibitory concentrations of Corallopyronin B via Agar diffusion assay using paper discs:.
| Test organism[1]
|
MIC( µg/ ml) |
Diameter of inhibition zone( mm) |
| Bacillus subtilis |
5 |
10 |
| Staphylococcus aureus |
6 |
16 |
| Streptococcus pneumonae |
10 |
7 |
| Escherichia coli |
119 |
13 |
| Pseudomonas aeruginosa |
129 |
0 |
| Candida albicans |
114 |
0 |
| Sacchromyces cerevisiae |
109 |
0 |
| Salmonella typhimurium |
137 |
15 |
| Bacillus cereus |
14 |
12 |
| Micrococcus luteus |
18 |
7 |
| Serratia Marcescens |
140 |
10 |
| Mucor hiemalis |
0 |
19 |
| Shigella dysentery |
109 |
14 |
| Proteus mirabilis |
123 |
8 |
| Rickettsiae prowazaki |
146 |
11 |
| Chlamydiae pneumonae |
125 |
19 |
| Legionella pneumophilla |
116 |
9 |
Table 7.
It demonstrates MICs of Corallopyronin B on different microorganisms using broth microdilution technique:.
Table 7.
It demonstrates MICs of Corallopyronin B on different microorganisms using broth microdilution technique:.
| Pathogenic m.o |
MIC( µg/ ml)
|
| Bacillus subtilis |
10 |
| Bacillus cereus |
7 |
| Staphylococcus aureus |
9 |
| Pneumococci |
6 |
| E.coli |
127 |
| Pseudomonas aeruginosa |
0 |
| Candida albicans |
0 |
| Sacchromyces cerevisiae |
0 |
| Salmonella typhimurium |
109 |
| Haemophilus influenza |
0 |
| Gonococci |
105 |
| meningococci |
134 |
| Serratia Marcescens |
129 |
| Mucor hiemalis |
0 |
| Shigella dysenteriae |
111 |
| Micrococcus luteus |
0 |
| Proteus mirabilis |
0 |
| Rickettsiae prowazaki |
139 |
| Chlamydiae pneumonae |
131 |
| Legionella pneumophilla |
146 |
Table 8.
It demonstrates Minimum bactericidal concentrations( MBCs) of Corallopyronin B on different microorganisms using Broth microdilution technique:.
Table 8.
It demonstrates Minimum bactericidal concentrations( MBCs) of Corallopyronin B on different microorganisms using Broth microdilution technique:.
| Pathogenic m.o |
MBC( µg/ ml) |
| Bacillus subtilis |
24 |
| Bacillus cereus |
23 |
| Staphylococcus aureus |
39 |
| Pneumococci |
44 |
| E.coli |
338 |
| Pseudomonas aeruginosa |
399 |
| Candida albicans |
0 |
| Sacchromyces cerevisiae |
0 |
| Salmonella typhimurium |
320 |
| Haemophilus influenza |
0 |
| Gonococci |
380 |
| meningococci |
377 |
| Serratia Marcescens |
307 |
| Mucor hiemalis |
0 |
| Shigella dysenteriae |
309 |
| Micrococcus luteus |
0 |
| Proteus mirabilis |
0 |
| Rickettsiae prowazaki |
400 |
| Chlamydiae pneumonae |
416 |
| Legionella pneumophilla |
252 |
Table 9.
It shows the estimation of mRNA quantity via UV spectrophotometer at 260 nm after addition of Corallopyronin B:.
Table 9.
It shows the estimation of mRNA quantity via UV spectrophotometer at 260 nm after addition of Corallopyronin B:.
|
mRNA concentration( ng/ ml) |
Absorbance( optical density) at 260 nm |
| 600 |
0.729 |
| 567 |
0.501 |
| 204 |
0.247 |
| 25 |
0.093 |
Table 10.
It shows the effect of Corallopyronin A on the microbial protein synthesis using UV spectrophotometer at 205 nm:.
Table 10.
It shows the effect of Corallopyronin A on the microbial protein synthesis using UV spectrophotometer at 205 nm:.
| Bacterial protein concentration( mcg/ ml) |
Time( hr) |
| 91.3 |
2 |
| 45.96 |
4 |
| 28.38 |
7 |
| 3.37 |
10 |
| 0.26 |
3 |
Table 11.
The resolution of biochemical reactions:.
Table 11.
The resolution of biochemical reactions:.
| Test |
Result |
| Gram stain |
-ve rods |
| Cell shape |
Elongated bacilli with tapered ends |
| Spore shape |
Ellipsoidal |
| Spore site |
Central |
| Motility |
+ via gliding |
| Catalase |
+ |
| Oxidase |
- |
| Blood haemolysis |
- |
| Indol |
- |
| Methyl red |
- |
| Nitrate reduction test |
+ |
| Vogues proscauer |
- |
| Citrate utilization |
- |
| Starch hydrolysis |
+ |
| Casein hydrolysis |
+ |
| Growth at 45 ℃ |
Bacterial isolates did not grow at 45 ℃; but were grown at 10-37 ℃ |
| Tween 80 |
+ |
| Tolerance salinity |
| 5% NaCl |
- |
| 7% NaCl |
- |
| Saccharide fermentation |
| Glucose |
- |
| Fructose |
- |
| Maltose |
- |
| Sucrose |
- |
Table 10 and
Table 9, respectively, show that there was a considerable decrease in protein synthesis and
mRNA synthesis as the dosage of Myxopyronin
B was increased. Docking experiments with
the MCULE and
SWISS DOCK softwares showed that the test antibiotic's mechanism of action was most likely caused by inhibiting
RNA polymerase by binding to its switch region. The test antibiotic's high
∆G was found to be roughly
15 J/mol using the SWISS
MODEL software. However, utilizing
SWISS MODEL software, it was discovered that the test antibiotic's low
Kd near the switch area was roughly
-720 nM.
Table 11 provides a summary of the biochemical profile and morphology of the strong bacterial isolates used in this investigation to produce the test antibiotic.
Corallococcus coralloides DSM 2259 was the most common bacterial isolate that secreted the extracellular test antibiotic, according to its appearance and biochemical responses. The study involved
150 human volunteers in total, with a mean age of
28.9[
8.1] years(
SD).
The 88% confidence intervals(
CIs) for the long transformed ratios of Cmax,
AUC( 0-26), and AUC( 0-∞) for the test antibiotic were, in order,
93.3 to
94.6, 90.5 to 95.2, and 90.7 to 93.1.
Corallopyronin B was found to have a mean protein binding(
PB) of about
83%. It was shown that
Albumin exhibited the predominant protein binding for both Rifampicin and
Corallopyronin B. The therapeutic activity was discovered to be attributed to the unbound fraction. The structure of
Corallopyronin B, which was isolated from bacterial isolates of
Corallococcus coralloides DSM 2259 collected from various soil conditions in Egypt, is depicted in
Figure 1. Using a mass spectrometer, the molecular formula of the purified test antibiotic was found to be
C31H43NO7. The area under the curve(
AUC) after
oral Corallopyronin B dosing during
phases 1/2 of clinical trials is shown in
Figure 9. The range of effective doses was
9.5–10 mg/kg of body weight. The action started after over thirty minutes. It adhered to the kinetics of first order elimination. The quantal dosage response curve for the assessment of
Corallopyronin B's toxicokinetics is displayed in
Figure 10. It was discovered that
LD50% was
150 mg/kg and
LD99% was around
310 mg/kg.
The AUC of
Corallopyronin B after
SC injection in
phases 1/2 of randomized human clinical trials is displayed in
Figure 8. The range of effective doses was
8–9 mg/kg of body weight. The beginning of the action was noted after a close
15 minutes. It adhered to the kinetics of first order elimination. The docking of the
Corallopyronin B ligand on Bacterial
RNA polymerase is shown in
Figure 2. High affinity and an inhibitory impact were demonstrated by
Corallopyronin B towards the
RNA Polymerase switch region.
Figure 7 uses the
UV spectrophotometer absorbance at
205 nm to illustrate how
Corallopyronin B affects protein synthesis. A significant reduction in protein synthesis was seen upon administration of escalating dosages of the antibiotic
Corallopyronin B.
The three-dimensional structure of bacterial prokaryotic
RNA polymerase is depicted in
Figure 3. This structure includes the switch binding site, to which
Corallopyronin B Ligand binds strongly, inhibiting the activity of bacterial
RNA polymerase selectively, which in turn causes the inhibition of
mRNA transcription and ultimately the death of the microbe.
Alpha and
Beta spiral sheets made up the
RNA polymerase enzyme's secondary structure. It had a molecular mass of about
198 amino acids.
Figure 6 speaks about estimating Corallopyronin B's impact on the productivity of microbial
mRNA. An increase in the dosage of the antibiotic
Myxopyronin B was found to cause a commensurate decrease in
mRNA production. The effects of varying peptone concentrations as a nitrogen growth factor on
Corallopyronin B production are depicted in
Figure 5. The effect of different soluble starch concentrations on the synthesis of
Corallopyronin B is depicted in
Figure 4. The resolution of biological reactions is shown in
Table 11.
Table 8 uses
the Broth microdilution technique to show the minimum bactericidal concentrations(
MBCs) of
Corallopyronin B on various bacteria. The measurement of the amount of
mRNA using a
UV spectrophotometer at
260 nm following the addition of
Corallopyronin B is displayed in
Table 9. The distribution of bacterial isolates that produce
Corallopyronin B is displayed in
Table 3. The degree of purity of the test antibiotics after they were purified using
the reversed phase HPLC process is shown in
Table 4.
Table 5 shows how to use
BLASTn software to detect
16S rRNA in isolates that produce
Corallopyronin B.
Table 7 shows
Corallopyronin B's minimum inhibitory concentrations(
MICs) on several bacteria using the broth microdilution method.
Corallopyronin B's zones of inhibition and minimum inhibitory concentrations are estimated using the Agar diffusion assay with paper discs, as shown in
Table 6.
Discuss
Globally, exploding morbidity and mortality due to antibiotic-resistant micro-organism infections was observed. Hence, amended hindrance and touchstone of infectious diseases, as well as appropriate use of approved antibacterial drugs were essential. The in vitro and in vivo antimicrobial activity of
Corallopyronin B, a novel antibiotic was evaluated in the present study. It demonstrated excellent bactericidal activity against a broad spectrum of
G +ve bacteria with
MICs did not exceed
20 mcg/ ml. On the other hand It showed broad bactericidal activities against
G -ve bacteria with minimal inhibitory concentrations were greater than
100 mcg/ ml. Its mechanism of action was realized during the investigation of
RNA synthesis to be via the inhibition of prokaryotic
DNA-dependant-RNA polymerase; whereas no inhibitory impact was observed for Eukaryotic one. Docking studies through
SWISS DOCK software confirmed this as well. The antibiotic activities
Corallopyronin A, B and
C were isolated from the culture supernatant of
29 bacterial isolates of Myxobacterium
Corallococcus coralloides DSM 2259 detected molecularly using
16 S rRNA technique( table 3). The antibiotic activity did not inhibit the growth or kill eukaryotic cells such as human and fungal cells reflecting selectivity towards the inhibition of the growth of prokaryotic bacterial cells. This selectivity effect minimized the adverse effects noticed during the present study. Docking studies via
SWISS DOCK software revealed that desmethylation of either Corallo
pyronin A, B, C enhanced its biological activity. Purification was performed through reversed phase
HPLC. Corallo
pyronin B was the main refined antibiotic. Its purity degree reached approximately
90 %; while, the remaining purified antibiotics were detected to be
Corallopyronin A( 7 %) and C( 3 %). The antibacterial activity was assessed via the determination of
MICs of the test antibiotics using the agar diffusion technique utilizing paper discs
5 mm in diameter and the broth dilution assay. The initial density of each test microorganism was about
105/ ml of the culture suspension. The
MICs of test antibiotic against
G +ve bacteria ranged from
6 to
20 mcg/ ml; Whereas
MICs reached above
100 mcg/ ml against some selected
G -ve bacteria. On the other hand no effect was detected against the growth of fungi and yeasts. ( Irschik H et al., 1983) stated that
Myxovalargin A was a novel peptide antibiotic isolated from the culture supernatant of the
myxobacterium Myxococcus fulvus strain Mx f65. It was active against
Gram-positive bacteria(
MIC 0.3 approximately
5 micrograms/ ml), at higher concentrations also against
Gram-negative ones(
MIC 6 approximately 100 micrograms/ ml), and not at all against yeasts and molds. Its mechanism of action involved the inhibition of the bacterial protein synthesis [
50]. According to( Glaus F et al., 2018)
Ripostatin, a novel antibiotic, isolated from the culture supernatant of
Myxobacterium,
Sorangium cellulosum strain So ce377. On the other hand it interfered of the bacterial
RNA synthesis [
51]. On the other hand,
Corallopyronin B was found to be structurally related to
α-pyrone antibiotics from
myxobacteria. Its ability to inhibit
RNA polymerase was through interaction with the switch region of
RNA polymerase; while
Rifampicin inhibited the same enzyme through different region [
52]. Myxopyronin showed no phototoxicity and mutagenicity in rabbit animal models during
the preclinical trials stage, in the present study. Rare adverse effects including cholestatic jaundice were reported in less than
5 % of the experimental subjects received the test antibiotics during
randomized human clinical trials phases 1/2. The biological half life of
Corallopyronin B reached approximately
2.25 hours.
0.4 % peptone and
7 % soluble starch were detected to be the optimal nitrogen and carbon growth factors for bacterial isolates producing the test antibiotics, respectively(
figures 4 and 5). High
∆G of the test antibiotic was observed to be approximately
15 J/ mole as determined via
SWISS MODEL software reflecting high catalytic activity of the test antibiotic towards the switch region. On the other hand, low
Kd of the test antibiotic towards the switch region was found to be approximately
-720 nM using
SWISS MODEL software indicating high affinity and binding capacity. Bioavailability studies were performed using
HPLC during randomized human clinical trials phases
1/2 revealed that
Corallopyronin B reached nearly
95% oral bioavailability, 96
% IM bioavailability and
100% IV bioavailability. Metabolic studies using
HPLC revealed that the test antibiotic showed no in vivo induction of hepatic metabolizing C
ytochrome P450 enzymatic system; while
Rifampicin induced
CYP3A4 hepatic metabolizing enzyme potently. Up and down procedure intended for the evaluation of acute toxicity profile of the test antibiotic showed that
LD50% was about
150 mg/ kg body weight; while
LD99% reached
310 mg/ kg. On the other hand, therapeutic margin of the test antibiotic ranged from 7
mcg/ ml to
100 mcg/ ml.
Corallopyronin B producing bacterial isolates were gram negative, spore forming
obligate aerobes and
chemoorganotrophic. They were
elongated rods with
tapered ends. No
flagella were present; but the cells moved via
gliding. They fermented
Tween 80,
starch and
casein. On the other hand they were positive for
catalase while negative for
oxidase tests. They reduced
nitrates
And were able to grow at
10-37 ℃. A total of
150 human subjects( mean
SD age,
27.3[ 8
.6] years were enrolled and completed the study.
The 88% confidence intervals(
CIs) for the long transformed ratios of
Cmax,
AUC( 0-26), and AUC( 0-∞) for the test antibiotic were, in order,
93.3 to
94.6, 90.5 to 95.2, and 90.7 to 93.1, respectively. The point estimates for
Cmax in the present study were outside the limit for bio-equivalence for
Rifampicin standard drug. The mean
PB was observed for
Corallopyronin B which approximated 83
% while that of
Rifampicin reached
88% [
53]. It was noticed that plasma protein binding was proportionally increased with increasing the doses of the test antibiotic. The plasma protein binding participated in extending the
Corallopyronin B duration of action. The major protein binding for
Corallopyronin B and
Rifampicin was noticed to be
Albumin. The unbound fraction was detected to be responsible for the therapeutic activity.
