
Submitted:
27 April 2024
Posted:
29 April 2024
You are already at the latest version
Abstract
A new quinazolinone alkaloid, named peniquinazolinone A (1), as well as eleven known com-pounds, 2-(2-hydroxy-3-phenylpropionamido)-N-methylbenzamide (2), viridicatin (3), viridicatol (4), (±)-cyclopeptin (5a/5b), dehydrocyclopeptin (6), cyclopenin (7), cyclopenol (8), methyl-indole-3-carboxylate (9), 2,5-dihydroxyphenyl acetate (10), methyl m-hydroxyphenylacetate (11), conidiogenone B (12), was isolated from the endophytic Penicillium sp. HJT-A-6. The chemical structures of all compounds were elucidated by comprehensive spectroscopic analysis, including 1D, 2D NMR, and HRESIMS. The absolute configuration at C-13 of peniquinazolinone A (1) was established by applying the modified Mosher’s method. Compounds 2, 3, and 7 exhibited an op-timal promoting effect on the seed germination of Rhodiola tibetica at a concentration of 0.01 mg/mL, while the optimal concentration for compounds 4 and 9 to promote Rhodiola tibetica seed germination was 0.001 mg/mL. Compound 12 showed optimal seed-germination-promoting activity at a concentration of 0.1 mg/mL. Compared with the positive drug 6-benzyladenine (6-BA), compounds 2, 3, 4, 7, 9, and 12 could extend the seed-germination period of Rhodiola tibetica up to the 11th day.
Keywords:
Rhodiola tibetica
; Penicillium sp. HJT-A-6
; quinazolinone
; seed-germination-promoting activity
1. Introduction
Significant mutualistic relationships have been established between endophytic fungi and their host plants, attracting considerable attention due to their ecological and biotechnological potential [1]. Endophytic fungi can produce a variety of secondary metabolites on their own and can be involved in the biosynthesis and biotransformation of secondary metabolites in host plants, making them an important source of active natural products. Active natural products derived from endophytic fungi hold vast potential applications in biopharmaceuticals, agricultural production, and industrial fermentation [2,3,4,5]. Currently, the secondary metabolites isolated from endophytic fungi fermentation products include alkaloids, polyketides, terpenes, etc [2,6], and some even possess activity in promoting seed germination [7].
Quinazolinones have great development prospects in medicinal chemistry [8], originating from a wide range of antibacterial [9], anti-inflammatory [10,11], antiviral [12,13], and antituberculosis [14] properties. So far, only a limited number of quinazolinones have been reported from endophytic fungi, including neosartoryadins and glyantrypines, antiviral agents from mangrove-derived fungi Neosartorya udagawae and Cladosporium sp., respectively [15,16]; chaetominine, a cytotoxic agent from an endophytic fungus Chaetomium sp. [17]; aniquinazolines A–D, antibacterial and cytotoxic molecules from a mangrove-derived fungus Aspergillus nidulans [18]; and (–)-(1R,4R)-1,4-(2,3)-Indolmethane-1-methyl-2,4-dihydro-1H-pyrazino-[2,1-b]-quinazoline-3,6-dione, an antifungal agent from an endophytic fungus Penicillium vinaceum [19]. This denotes that endophytic fungi still represent an underexploited reservoir of novel bioactive quinazoline molecules.
Herein, as a part of our ongoing studies on the bioactive secondary metabolites from Rhodiola tibetica endophytic fungi [20,21,22], we performed a Global Natural Products Social (GNPS) molecular networking analysis of the EtOAc extract of endophytic fungus Penicillium sp. HJT-A-6. GNPS molecular networking has been widely applied in the analysis of natural products to cluster compounds with similar MS/MS spectra, expediting the dereplication process of known natural products [23,24,25]. GNPS molecular networking analysis of the EtOAc extract led to the discovery of a new quinazolinone alkaloid, peniquinazolinone A (1), together with eleven known secondary metabolites. Seed-germination-promoting activities of the isolated compounds were also evaluated.
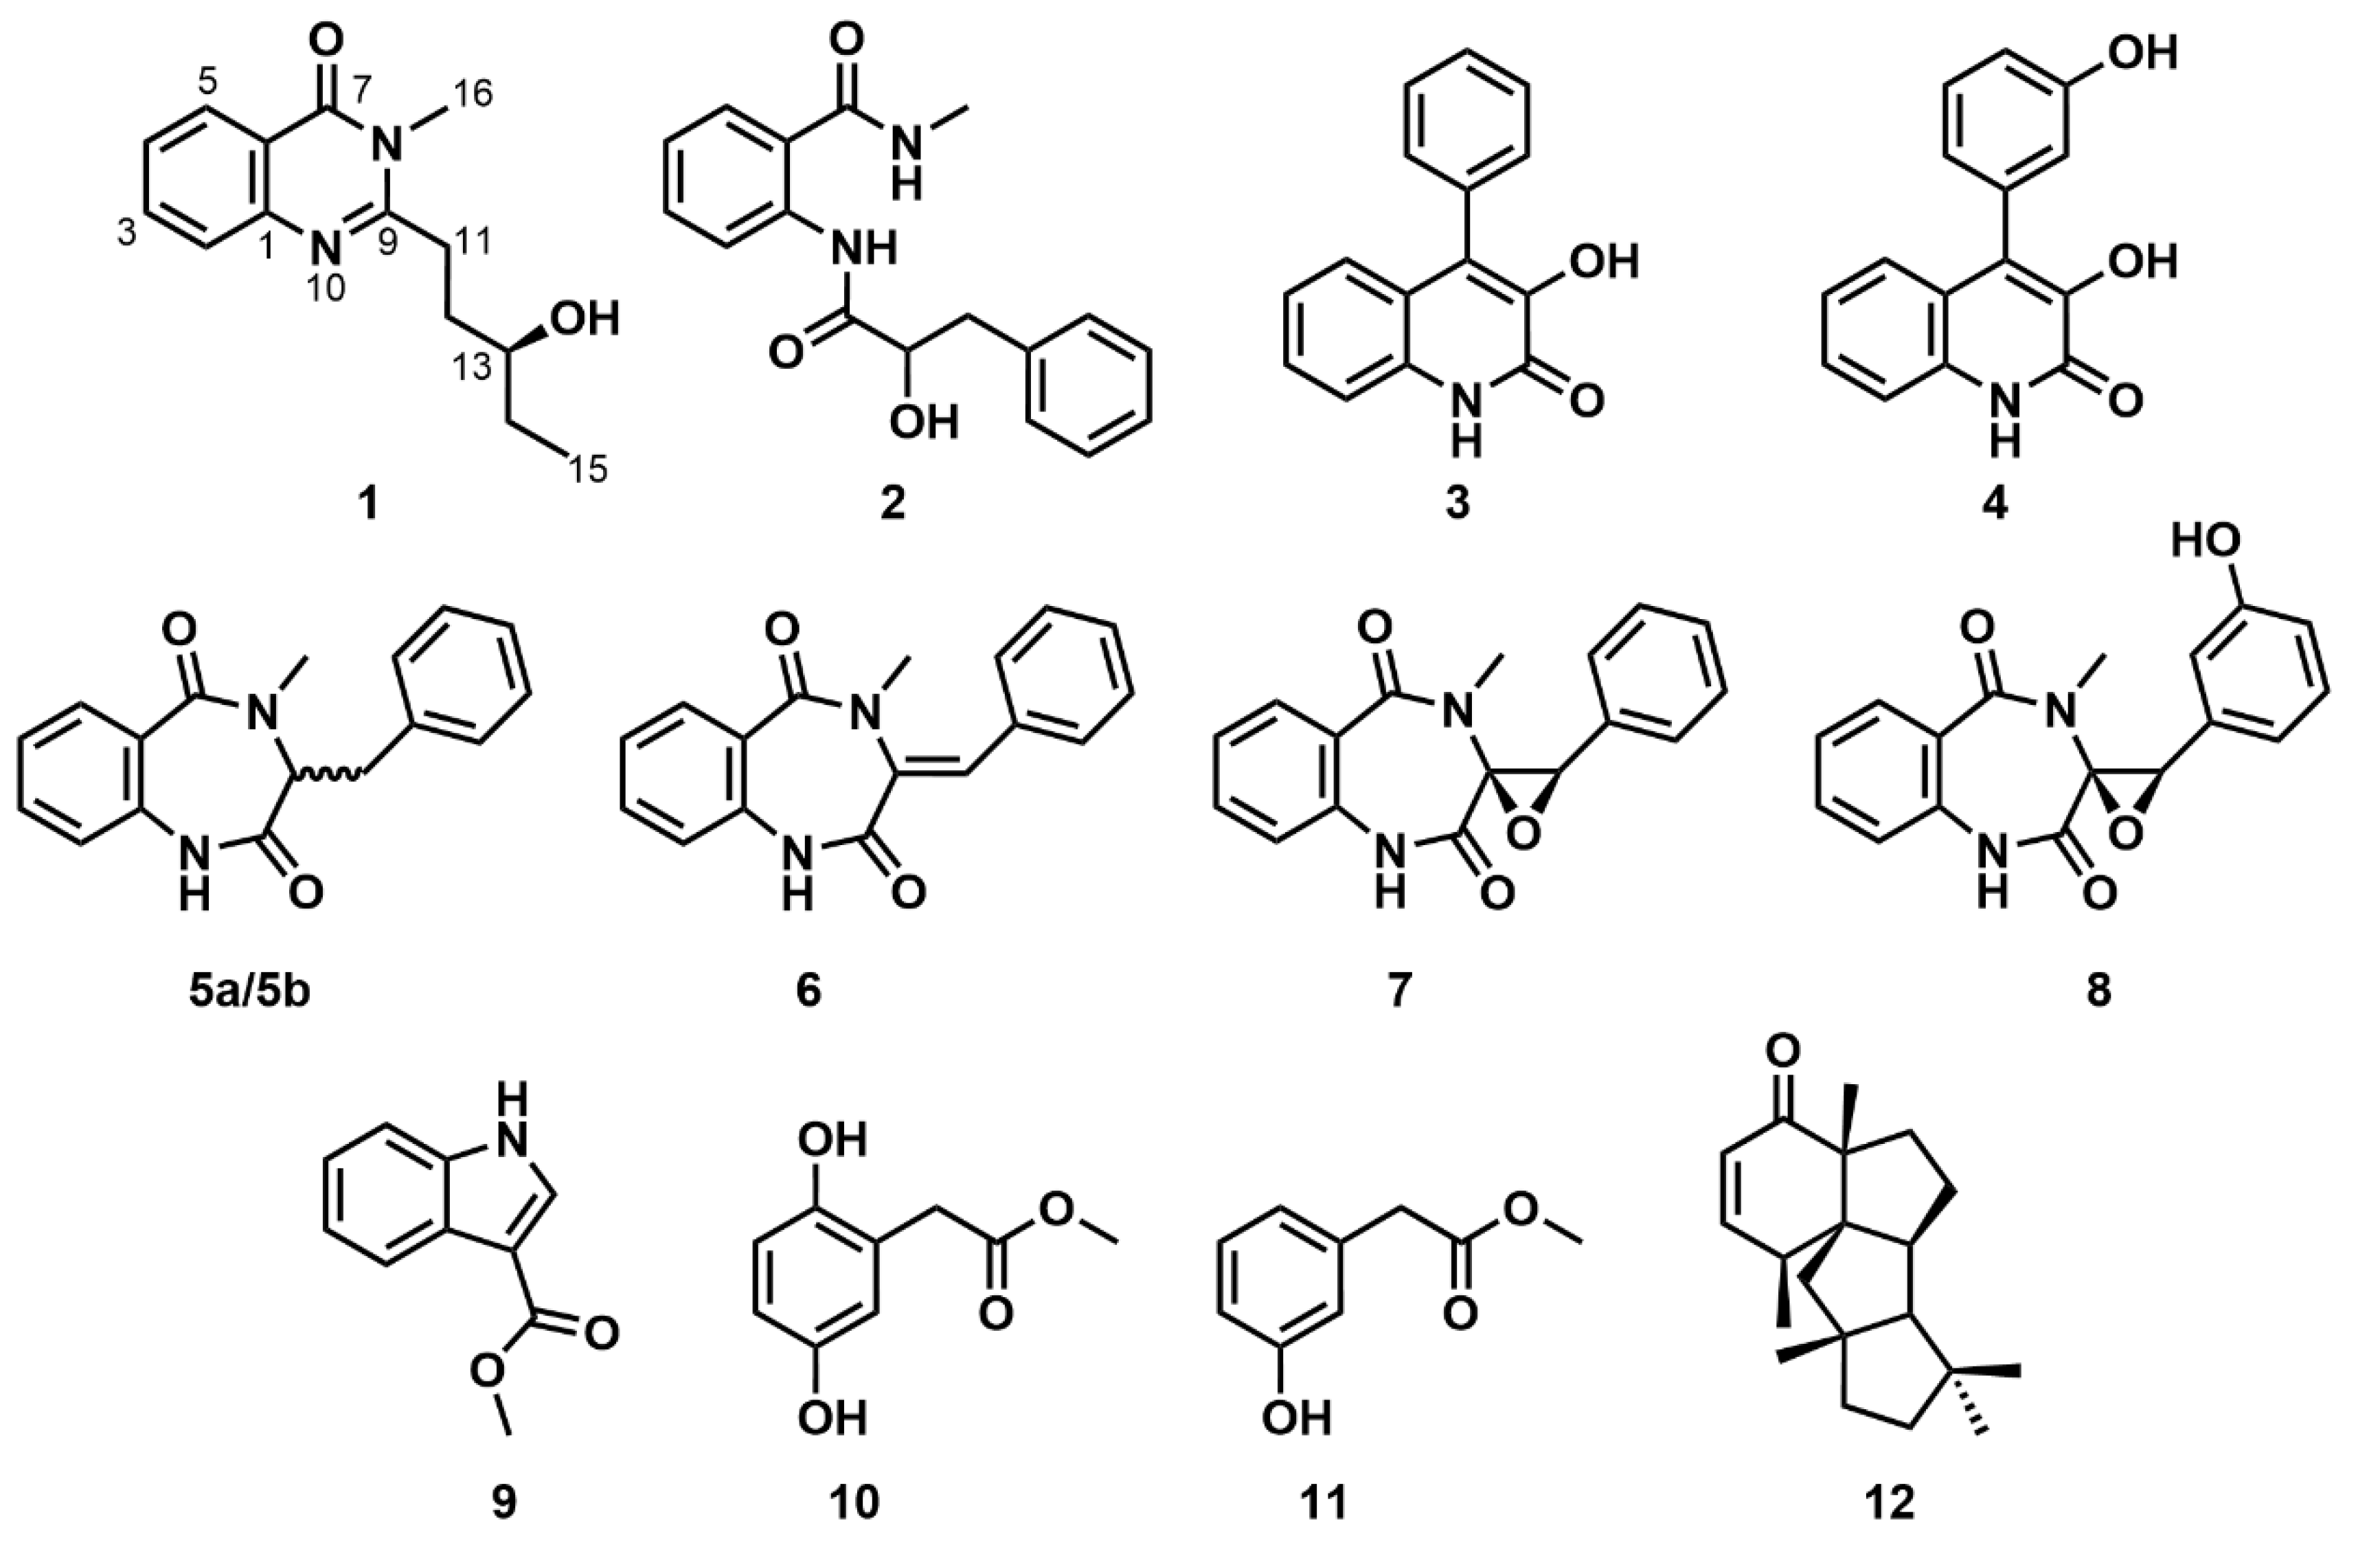
Figure 1.
Chemical structures of compounds 1–12.
2. Results and Discussion
2.1. Molecular Networking-Guided Isolation Workflow
To target the isolation of quinazolinone alkaloid, the crude EtOAc extract of Penicillium sp. HJT-A-6 was subjected to full scan HPLC-Q-TOF-MS/MS analysis. The obtained MS/MS data was used to generate the initial molecular network using the GNPS platform following the established protocol. This initial network was visualized and analyzed via Cytoscape 3.7.1 software.
As shown in Figure 2, the annotated nodes of total secondary metabolites were displayed, the color of the node indicates the m/z of the parent ion. This process generated a network featuring 2373 nodes and 755 clusters, those representative highlighted clusters indicated several known natural products and a promising new compound. In cluster 1 highlighted in light red, the node (m/z 276.062) was connected to the node (m/z 260.069), which were supposed to be two known compounds, viridicatin (3) and viridicatol (4). Clusters 2 and 3 highlighted in light blue and light purple, respectively, for identifying two classes of natural products, cyclopeptin analogues (5a/5b–7) and phenyl acetate derivates (10, 11). The orphan cluster 4 (m/z 247.144) in light green, which was not associated with any structurally known compound, for guiding the targeted isolation of a new quinazolinone alkaloid, peniquinazolinone A (1).
2.2. Structure Elucidation of the Isolated Compounds
Compound 1 was obtained as a yellow oil. Its molecular formula was determined as C14H18N2O2 based on HRESIMS at m/z 269.1271 [M + Na]+ (calcd for 269.1266) (Figure S1), indicating seven degrees of unsaturation. The 1H NMR spectrum (Table 1 and Figure S3) revealed the resonances of four aromatic protons at δH 8.10 (d, J = 7.5 Hz, H-5), 7.77 (t, J = 7.5 Hz, H-3), 7.59 (d, J = 7.5 Hz, H-2) and 7.47 (d, J = 7.5 Hz, H-4), which indicated the presence of one 1,2-disubstituted phenyl group in 1; three methylene protons at δH 1.43–2.99; one oxygenated methine proton at δH 3.48 (m, H-13); two methyl protons at δH 3.56 (s), 0.90 (t, J = 7.5 Hz, H-15). The 13C NMR and HSQC spectra (Table 1 and Figures S6–S7) of 1 displayed the presence of fourteen carbons, including one carbonyl carbon, seven aromatic/olefinic carbons, three methylenes, one oxygenated methine, and two methyls.
The planar structure of compound 1 was deduced by HMBC and 1H–1H COSY spectra (Figure 3 and Figures S8–S9). The HMBC correlations from H-2 to C-6, from H-3 to C-1, from H-4 to C-6, from H-5 to C-3 and C-7, as well as from H-16 to C-7 and C-9, established the structural skeleton of quinazolinone. The proton spin systems of H-11/H-12/H-13/H-14/H-15 and H-13/13-OH, coupled with the HMBC correlations from H-11 to C-9, C-12, and C-13, from H-14 to C-13, and from H-15 to C-13 and C-14, confirmed the linkage of the quinazolinone group and the pentan-3-ol moiety at C-9. Consequently, the planar structure of compound 1 was constructed, named peniquinazolinone A.
The absolute configuration of C-13 was defined by the application of the Mosher method. Compound 1 was reacted with both (R)-(–) and S-(+)-α-methoxy-α-(trifluoromethyl) phenylacetyl chlorides (MTPA-Cl) to afford the corresponding (S)- and (R)-Mosher esters (1a and 1b), respectively. The absolute configuration at C-13 in 1 was determined to be R by the observed chemical shift differences Δδ(δS-δR) (Figure 4 and Figures S4–S5).
The known compounds 2-(2-hydroxy-3-phenylpropionamido)-N-methylbenzamide (2) [26], viridicatin (3) [27], viridicatol (4) [27], (±)-cyclopeptin (5a/5b) [28,29], dehydrocyclopeptin (6) [29], cyclopenin (7) [30], cyclopenol (8) [31], methyl-indole-3-carboxylate (9) [32], 2,5-dihydroxyphenyl acetate (10) [33], methyl m-hydroxyphenylacetate (11) [34], and conidiogenone B (12) [35] were identified based on their 1H NMR and 13C NMR spectra (Figures S12–S32) and compared with those reported in the previous literature values.
2.3. Seed-Germination-Promoting Activity of the Isolated Compounds
Compounds 2, 3, 4, 7, 9, and 12 were tested for their seed-germination-promoting activity. As shown in Figure 5, Compounds 2, 3, and 7 showed an optimal promoting effect on the seed germination of Rhodiola tibetica at a concentration of 0.01 mg/mL, with a germination rate of about 62%, 70%, and 62%, respectively, compared to the germination rate of about 52% of the positive drug 6-BA. Compounds 4 and 9 exhibited a germination rate of about 72% and 58%, respectively, at the optimal concentration of 0.001 mg/mL, indicating a negative correlation between concentration and germination rate. Compared with other tested compounds, compound 12 showed the best germination rate of about 62% at the same concentration level (0.1 mg/mL). In addition, compounds 2, 3, 4, 7, 9, and 12 could delay the seed-germination of Rhodiola tibetica up to the 11th day, while the positive drug 6-BA only affected the seed germination process until the 9th day (Figure 6). Compound 1 was not tested for its seed-germination-promoting activity due to the trace amount. Compound 2 is a structural analogue of compound 1, generated by the ring-opening of the quinazoline moiety of compound 1, further seed germination assays of compound 1 may verify whether the existence of the quinazoline moiety affects its seed-germination-promoting activity.
3. Materials and Methods
3.1. General Experimental Procedures
The UV spectrum was recorded on a Jasco V-560 spectrophotometer (JASCO Corporation, Japan). Optical rotation was obtained on an Autopol IV Polarimeter (Rudolph Research Analytical, Flanders, NJ, USA). CD spectrum was acquired on a Jasco J-810-150S spectropolarimeter (JASCO Corporation, Japan). High-resolution electrospray ionization mass spectrometry (HRESIMS) data was collected on an AB Sciex Triple TOF 4600 mass spectrometer (AB SCIEX, Framingham, MA, USA). NMR spectra were carried out on a Bruker Avance II 500 MHz NMR spectrometer (Bruker, Karlsruhe, Germany) with tetramethylsilane (TMS) as an internal standard. Agilent 1260 Infinity (Agilent Technologies Inc., Santa Clara, CA, USA), Waters 2535 (Waters Corporation, Milford, MA, USA), and Shimadzu LC-20AR (Shimadzu Corporation, Kyoto, Japan) semi-preparative HPLC systems were performed using a Welch Ultimate XB-C18 column, (250 mm × 10.0 mm, 5 μm). Silica gel (100−200 mesh & 200−300 mesh, Qingdao Marine Chemical Ltd., Qingdao, China) and Sephadex LH-20 (GE Healthcare Bio-Sciences AB, Uppsala, Sweden) were used for column chromatography. The silica gel GF254 (Qingdao Marine Chemical Co., Ltd., Qingdao, China) was used for analytical and preparative thin-layer chromatography (TLC).
3.2. Fungal Material
The fungus strain Penicillium sp. HJT-A-6 was obtained from the stem of Rhodiola tibetica collected in Langkazi County, Shannan City, Tibet, China, in July 2021. It was identified based on its morphological characteristics and its sequence of the internal transcribed spacer (ITS) analysis of rDNA, and the BLAST search result showed that the sequence was the most similar (99%) to the sequence of Penicillium sp. (compared to MN634462.1), The sequence data of the fungus was submitted to GenBank database, accession number: OR346333.1. The fungus was deposited in the College of Life and Health, Dalian University, Dalian, China.
3.3. Fermentation and Isolation
The fungal strain was cultured on autoclaved rice medium (one hundred 500 mL Erlenmeyer flasks, each containing 80 g rice, 110 mL water) in the stationary phase at 28 oC for 40 days. After 40 days, the fermentation was cut into small pieces, and extracted with 95% EtOH three times. The extract was concentrated under reduced pressure to afford an aqueous solution and then partitioned with petroleum ether, EtOAc, and n-BuOH to obtain the EtOAc-soluble extract (64 g). The extract was subjected to silica gel column chromatography with CH2Cl2/MeOH (100:0–0:100) to afford fourteen fractions (Fr. A–N).
Fr. B (10.5 g) was chromatographed on a silica gel column with gradient elution (PE/EtOAc, 5:1–1:2) to yield 8 subfractions (Fr. B1–Fr. B8). Fr. B5 was further purified by semi-preparative HPLC with MeOH/H2O (40:60, 0–35 min, 3 mL/min) to obtain compound 11 (1.6 mg, tR = 29 min).
Fr. C (6.3 g) was eluted with gradient petroleum (PE/EtOAc, 5:1–1:1) to afford 9 subfractions (Fr. C1–Fr. C9). Fr. C1 and Fr. C4 were subjected to Sephadex LH-20 gel column and preparative TLC, respectively, to obtain compounds 3 (250 mg) and 12 (4.6 mg). Fr. C5 was chromatographed by Sephadex LH-20 gel column using isocratic elution with CH2Cl2/MeOH (1:1), yielding Fr. C5b, which was purified by semi-preparative HPLC with CH3CN /H2O (30:70, 0–30 min, 3 mL/min) to give compound 6 (13.6 mg, tR = 22 min). Fr. C7 was purified by semi-preparative HPLC with MeOH/H2O (60:40, 0–40 min, 3 mL/min) to obtain compound 7 (193 mg, tR = 14 min) and the mixture of 5a and 5b in a 1:1.7 molar ratio (13.8 mg, tR = 17 min). Fr. C8 was applied to Sephadex LH-20 gel column with CH2Cl2/MeOH (1:1) to give Fr. C8e, which was purified by semi-preparative HPLC with gradient MeOH/H2O (20:80–60:40, 0–30 min, 3 mL/min) to obtain compound 9 (20 mg, tR = 25 min).
Fr. E (6.3 g) was chromatographed on a silica gel column with gradient elution (PE/EtOAc, 7:1–1:2), affording 20 fractions (Fr. E1–Fr. E20). Fr. E13 was purified by semi-preparative HPLC with gradient MeOH/H2O (20:80–95:5, 0–40 min, 3 mL/min) to yield compound 1 (1.6 mg, tR = 26 min). Fr. E14 was purified by semi-preparative HPLC with MeOH/H2O (40:60, 0–40 min, 3 mL/min) to obtain compound 2 (3.4 mg, tR = 16 min) and compound 4 (120 mg, tR = 32 min). Fr. E16 was purified by semi-preparative HPLC with CH3CN/H2O (45:55, 0–25 min, 3 mL/min) to afford compound 8 (6 mg, tR = 12 min).
Fr. G (6.7g) was chromatographed on a silica gel column with gradient elution (PE/EtOAc, 10:1–1:1) to afford 5 subfractions (Fr. G1–Fr. G5). Fr. G4 was applied to Sephadex LH-20 gel column with CH2Cl2/MeOH (1:1) to yield Fr. G4d, which was purified by semi-preparative HPLC with gradient MeOH/H2O (20:80–95:5, 0–30 min, 3 mL/min) to obtain compound 10 (5.8 mg, tR = 10 min).
Peniquinazolinone A (1): yellow oil; +20 (c 0.2, MeOH); UV (CH3OH) λmax (log ε) 223 (4.24), 267 (3.74) nm ; ECD (CH3OH) λmax (Δε) 220 (–7.0) nm; 1H NMR (DMSO-d6, 500 MHz) and 13C NMR (DMSO-d6, 125 MHz) data (see Table 1); HRESIMS m/z 269.1271 [M + Na]+ (calculated for C14H18N2O2Na, 269.1266).
3.4. Mosher Esterification of Compound 1
Compound 1 (0.5 mg) was dissolved in 100 μL CDCl3 in an NMR tube, sequentially added 9 μL pyridine and 15 μL (R)-(–)-α-methoxy-α-(trifluoromethyl)phenylacetyl chloride ((R)-(–)-MTPA-Cl). The mixture was stirred at room temperature for 1 h to afford the corresponding (S)-Mosher ester (1a), and subsequently diluted with 300 μL CDCl3 to acquire 1H NMR spectrum. The (R)-Mosher ester (1b) of 1 was prepared from (S)-(+)-MTPA-Cl using the same method.
3.5. Seed-Germination-Promoting Assay
Compounds 2, 3, 4, 7, 9, and 12 were dissolved in 0.2% DMSO aqueous solution to yield the stock solution with a concentration of 0.06 mg/mL. 5 µL, 50 µL, and 500 µL of compounds 2, 3, 4, 7, 9, and 12 were added to the 30 mm filter paper placed in the 6-well plate. After evaporation of the solvent, the filter paper was immersed in 300 µL of distilled water, and then 20 seeds of Rhodiola tibetica were displayed in each 30 mm filter paper and incubated at a light-dark regime of 16:8 h condition, 20 °C for 7 days. The germination rate of the seeds was calculated after incubation. The experimental data were collected from three independent experiments. Further experiments on the relationship between the number of germinated seeds and germination time for compounds 2, 3, 4, 7, 9, and 12 were also conducted, the germination period was set up to 11 days.
4. Conclusions
In this work, the chemical investigation of the Rhodiola tibetica endophytic fungus Penicillium sp. HJT-A-6 led to the isolation and identification of a new quinazolinone alkaloid, named peniquinazolinone A (1), and eleven known compounds. Compound 1 was identified by extensive spectroscopic analysis and the modified Mosher’s method. Compounds 2, 3, and 7 showed an optimal promoting effect on the seed germination of Rhodiola tibetica at a concentration of 0.01 mg/mL. Compounds 4 and 9 had optimal seed-germination-promoting activity at a concentration of 0.001 mg/mL, while the optimal concentration for compound 12 to promote Rhodiola tibetica seed germination was 0.1 mg/mL. Additionally, all the tested compounds assuredly delayed the seed-germination of the host plant. These results not only broadened the structural diversity of quinazoline metabolites derived from fungi, but also provided data support for understanding the interactive relationship between endophytic fungi and host plants.
Supplementary Materials
The following supporting information can be downloaded at the website of this paper posted on Preprints.org, Figure S1: Positive mode HRESIMS spectrum of 1; Figure S2: UV spectrum of 1; Figure S3: 1H NMR (DMSO-d6, 500 MHz) spectrum of 1; Figure S4: 1H NMR (DMSO-d6, 500 MHz) spectrum of 1a; Figure S5: 1H NMR (DMSO-d6, 500 MHz) spectrum of 1b; Figure S6: 13C NMR (DMSO-d6, 125 MHz) spectrum of 1; Figure S7: HSQC (DMSO-d6, 500 MHz) spectrum of 1; Figure S8: HMBC (DMSO-d6, 500 MHz) spectrum of 1; Figure S9: 1H-1H COSY (DMSO-d6, 500 MHz) spectrum of 1; Figure S10: NOESY (DMSO-d6, 500 MHz) spectrum of 1; Figure S11: CD spectrum of 1; Figure S12: 1H NMR (DMSO-d6, 500 MHz) spectrum of 2; Figure S13: 13C NMR (DMSO-d6, 125 MHz) spectrum of 2; Figure S14: 1H NMR (DMSO-d6, 500 MHz) spectrum of 3; Figure S15: 13C NMR (DMSO-d6, 125 MHz) spectrum of 3; Figure S16: 1H NMR (DMSO-d6, 500 MHz) spectrum of 4; Figure S17: 13C NMR (DMSO-d6, 125 MHz) spectrum of 4; Figure S18: 1H NMR (DMSO-d6, 500 MHz) spectrum of 5a/5b; Figure S19: 13C NMR (DMSO-d6, 125 MHz) spectrum of 5a/5b; Figure S20: 1H NMR (DMSO-d6, 500 MHz) spectrum of 6; Figure S21: 13C NMR (DMSO-d6, 125 MHz) spectrum of 6; Figure S22: 1H NMR (DMSO-d6, 500 MHz) spectrum of 7; Figure S23: 13C NMR (DMSO-d6, 125 MHz) spectrum of 7; Figure S24: 1H NMR (DMSO-d6, 500 MHz) spectrum of 8; Figure S25: 13C NMR (DMSO-d6, 125 MHz) spectrum of 8; Figure S26: 1H NMR (DMSO-d6, 500 MHz) spectrum of 9; Figure S27: 1H NMR (DMSO-d6, 500 MHz) spectrum of 10; Figure S28: 13C NMR (DMSO-d6, 125 MHz) spectrum of 10; Figure S29: 1H NMR (DMSO-d6, 500 MHz) spectrum of 11; Figure S30: 13C NMR (DMSO-d6, 125 MHz) spectrum of 11; Figure S31: 1H NMR (DMSO-d6, 500 MHz) spectrum of 12; Figure S32: 13C NMR (DMSO-d6, 125 MHz) spectrum of 12.
Author Contributions
Conceptualization, D.X., X.L. and B.F.; methodology, D.X., Y.W., X.L. and B.F.; validation, D.X., Y.W., X.L. and B.F.; formal analysis, D.X., X.L. and B.F.; investigation, D.X., Y.W., C.G., X.Z., W.F., X.L. and B.F.; resources, X.L. and B.F.; data curation, D.X., X.L. and B.F.; writing—original draft preparation, D.X. and Y.W.; writing—review and editing, D.X. and X.L.; visualization, X.L. and Y.W.; supervision, D.X., X.L. and B.F.; project administration, X.L. and B.F.; funding acquisition, D.X., C.G. and X.L. All authors have read and agreed to the published version of the manuscript.
Funding
This work was supported by the grants from the Dalian Science and Technology Innovation Fund Project (2022JJ12WZ059), Dalian University Research Platform Project (202101YB08), and Liaoning Provincial Department of Education Basic Scientific Research Project (JYTQN2023100, LJKFZ20220287).
Institutional Review Board Statement
Not applicable.
Informed Consent Statement
Not applicable.
Data Availability Statement
Not applicable.
Conflicts of Interest
The authors declare no conflict of interest.
Sample Availability
Not applicable.
References
- Kusari, S.; Spiteller, M. Are we ready for industrial production of bioactive plant secondary metabolites utilizing endophytes?. Nat. Prod. Rep. 2011, 28, 1203–1207. [CrossRef]
- Zheng, R.H.; Li, S.J.; Zhang, X.; Zhao, C.Q. Biological activities of some new secondary metabolites isolated from endophytic fungi: a review study. Int. J. Mol. Sci. 2021, 22, 959. [CrossRef]
- Daley, S.K.; Cordell, G.A. Biologically significant and recently isolated alkaloids from endophytic fungi. J. Nat. Prod. 2021, 84, 871–897. [CrossRef]
- Strobel, G.; Daisy, B.; Castillo, U.; Harper, J. Natural products from endophytic microorganisms. J. Nat. Prod. 2004, 67, 257–268. [CrossRef]
- Zhao, Y.; Cui, J.; Liu, M.Y.J.; Zhao, L. Progress on terpenoids with biological activities produced by plant endophytic fungi in China between 2017 and 2019. Nat. Prod. Commun. 2020, 15, 1–18. [CrossRef]
- Ye, K.; Ai, H. L.; Liu, J.K. Identification and bioactivities of secondary metabolites derived from endophytic fungi isolated from ethnomedicinal plants of Tujia in Hubei province: a review. Nat. Prod. Bioprospect. 2021, 11, 185–205. [CrossRef]
- Bie, Q.; Chen, C.M.; Yu, M.Y.; Guo, J.R.; Wang, J.P.; Liu, J.J.; Zhou, Y.; Zhu, H.C.; Zhang, Y.H. Dongtingnoids A-G: fusicoccane diterpenoids from a Penicillium species. J. Nat. Prod. 2019, 82, 80–86. [CrossRef]
- Jafari, E.; Khajouei, M.R.; Hassanzadeh, F.; Hakimelahi, G.H.; Khodarahmi, G.A. Quinazolinone and quinazoline derivatives: recent structures with potent antimicrobial and cytotoxic activities. Res. Pharm. Sci. 2016, 11, 1–14.
- Habib, O.M.O.; Hassan, H.M.; El-Mekabaty, A. Novel quinazolinone derivatives: synthesis and antimicrobial activity. Med. Chem. Res. 2013, 22, 507–519. [CrossRef]
- Manivannan, E.; Chaturvedi, S.C. Analogue-based design, synthesis and molecular docking analysis of 2,3-diaryl quinazolinones as non-ulcerogenic anti-inflammatory agents. Bioorg. Med. Chem., 2011, 19, 4520–4528. [CrossRef]
- Abdel-Aziz, A.A.; Abou-Zeid, L.A.; ElTahir, K.E.H.; Ayyad, R.R.; El-Sayed, M.A.; El-Azab, A.S. Synthesis, anti-inflammatory, analgesic, COX-1/2 inhibitory activities and molecular docking studies of substituted 2-mercapto-4(3H)-quinazolinones. Eur. J. Med. Chem. 2016, 121, 410–421. [CrossRef]
- Brown, C.E.; Kong, T.; McNulty, J.; D'Aiuto, L.; Williamson, K.; McClain, L.; Piazza, P.; Nimgaonkar, V.L. Discovery of potent antiviral (HSV-1) quinazolinones and initial structure-activity relationship studies. Bioorg. Med. Chem. Lett. 2017, 27, 4601–4605. [CrossRef]
- Wang, Z.W.; Wang, M.X.; Yao, X.; Li, Y.; Tan, J.; Wang, L.Z.; Qiao, W.T.; Geng, Y.Q.; Liu, Y.X.; Wang, Q.M. Design, synthesis and antiviral activity of novel quinazolinones. Eur. J. Med. Chem. 2012, 53, 275–282. [CrossRef]
- Zhu, S.R.; Wang, J.; Chandrashekar, G.; Smith, E.; Liu, X.J.; Zhang, Y.S. Synthesis and evaluation of 4-quinazolinone compounds as potential antimalarial agents. Eur. J. Med. Chem. 2010, 45, 3864–3869. [CrossRef]
- Yu, G.H.; Zhou, G.L.; Zhu, M.L.; Wang, W.; Zhu, T.J.; Gu, Q.Q.; Li, D.H. Neosartoryadins A and B, fumiquinazoline alkaloids from a mangrove-derived fungus Neosartorya udagawae HDN13-313. Org. Lett., 2016, 18, 244–247. [CrossRef]
- Peng, J.X.; Lin, T.; Wang, W.; Xin, Z.H.; Zhu, T.J.; Gu, Q.Q.; Li, D.H. Antiviral alkaloids produced by the mangrove-derived fungus Cladosporium sp. PJX-41. J. Nat. Prod. 2013, 76, 1133–1140. [CrossRef]
- Jiao, R.H.; Xu, S.; Liu, J.Y.; Ge, H.M.; Ding, H.; Xu, C.; Zhu, H.L.; Tan, R.X. Chaetominine, a cytotoxic alkaloid produced by endophytic Chaetomium sp. IFB-E015. Org. Lett. 2006, 8, 5709–5712. [CrossRef]
- An, C.Y.; Li, X.M.; Li, C.S.; Wang, M.H.; Xu, G.M.; Wang, B.G. Aniquinazolines A-D, four new quinazolinone alkaloids from marine-derived endophytic fungus Aspergillus nidulans. Mar. Drugs. 2013, 11, 2682–2694. [CrossRef]
- Zheng, C.J.; Li, L.; Zou, J.P.; Han, T.; Qin, L.P. Identification of a quinazoline alkaloid produced by Penicillium vinaceum, an endophytic fungus from Crocus sativus. Pharm. Biol., 2012, 50, 129–133. [CrossRef]
- Lu, X.; Tang, X.Y.; Wang, H.X.; Huang, W.J.; Feng, W.X.; Feng, B.M. Polyketone metabolites isolated from Rhodiola tibetica endophytic fungus Alternaria sp. HJT-Y7 and their SARS-CoV-2 virus inhibitory activities. Bioorg. Chem. 2021, 116, 105309. [CrossRef]
- Tang, X.Y.; Zhao, Y.X.; Wang, X.D.; Ye, C.T.; Feng, B.M.; Tang, C.; Lu, X. Polyketides with anti-inflammatory activity from Rhodiola tibetica endophytic fungus Alternaria sp. HJT-Y7. Phytochemistry 2022, 203, 113383. [CrossRef]
- Lu, X.; Qi, J.K.; Tang, X.Y.; Wang, X.D.; Ye, C.T.; Bai, J.; Tang, C.; Xi, Y.F.; Wu, B.; Wan, X.; Feng, B.M. Polyketides with anti-inflammatory activity isolated from Rhodiola tibetica endophytic fungus Penicillium sp. HJT-A-10. Fitoterapia, 2023, 164, 105361. [CrossRef]
- Gaudêncio, S.P.; Pereira, F. Dereplication: racing to speed up the natural products discovery process. Nat. Prod. Rep. 2015, 32, 779–810. [CrossRef]
- Wang, M.; Carver, J.J.; Phelan, V.V.; Sanchez, L.M.; Garg, N.; Peng, Y.; Nguyen, D.D.; Watrous, J.; Kapono, C.A.; Luzzatto-Knaan, T.; et al. Sharing and community curation of mass spectrometry data with Global Natural Products Social Molecular Networking. Nat. Biotechnol. 2016, 34, 828–837. [CrossRef]
- Aron, A.T.; Gentry, E.C.; McPhail, K.L.; Nothias, L.F.; Nothias-Esposito, M.; Bouslimani, A.; Petras, D.; Gauglitz, J.M.; Sikora, N.; Vargas, F.; et al. Reproducible molecular networking of untargeted mass spectrometry data using GNPS. Nat. Protoc. 2020, 15, 1954–1991. [CrossRef]
- Smith, H.W.; Rapoport, H. Mechanism of the transformation of cyclopenin to viridicatin. J. Am. Chem. Soc. 1969, 91, 6083–6089. [CrossRef]
- Kobayashi, Y.; Harayama, T. A concise and versatile synthesis of viridicatin alkaloids from cyanoacetanilides. Org. Lett. 2009, 11, 1603–1606. [CrossRef]
- Zhang, C.C.; Ding, S.S.; Shi, W.S.; Cao, F.; Zhu, H.J.; Wen, M.L. A new quinolinone from freshwater lake-derived fungus Myrothecium verrucaria. Nat. Prod. Res. 2017, 31, 99–103. [CrossRef]
- Framm, J.; Nover, L.; el-Azzouny, A.; Richter, H.; Winter, K.; Werner, S.; Luckner, M. Cyclopeptin and dehydrocyclopeptin. Intermediates in the biosynthesis of cyclopeptin-viridicatin alkaloids in Penicillium cyclopium Westling. Eur. J. Biochem. 1973, 37, 78–85. [CrossRef]
- Hodge, R.P.; Harris, C.M.; Harris, T.M. Verrucofortine, a major metabolite of Penicillium verrucosum var. cyclopium, the fungus that produces the mycotoxin verrucosidin. J. Nat. Prod. 1988, 51, 66–73. [CrossRef]
- Cai, X.Y.; Wang, J.P.; Shu, Y.; Hu, J.T.; Sun, C.T.; Cai, L.; Ding, Z.T. A new cytotoxic indole alkaloid from the fungus Penicillium polonicum TY12. Nat. Prod. Res. 2022, 36, 2270–2276. [CrossRef]
- Bano, S.; Ahmad, V.U.; Perveen, S.; Bano, N.; Shafiuddin, S.; Shameel, M. Marine natural products; II. Chemical constituents of red alga Botryocladia leptopoda. Planta. Med. 1987, 53, 117–118. [CrossRef]
- Tan, D.P.; Chou, G.; Wang, Z.T. Phenolic compounds from Senecio scandens. Biochem. Syst. Ecol. 2010, 38, 122–124. [CrossRef]
- Xu, L.; Wang, X.H.; Luo, R.Y.; Lu, S.Q.; Guo, Z.J.; Wang, M.A.; Zhou, L.G. Secondary metabolites of rice sheath blight pathogen Rhizoctonia solani Kühn and their biological activities. J. Integr. Agr. 2015, 14, 80–87. [CrossRef]
- Gao, S.S.; Li, X.M.; Zhang, Y.; Li, C.S.; Wang, B.G. Conidiogenones H and I, two new diterpenes of Cyclopiane class from a marine-derived endophytic fungus Penicillium chrysogenum QEN-24S. Chem. Biodivers. 2011, 8, 1748–1753. [CrossRef]
Figure 2.
Molecular networking-guided chemometric discovery of peniquinazolinone A (1) and several known compounds (3–7, 9, 10).
Figure 2.
Molecular networking-guided chemometric discovery of peniquinazolinone A (1) and several known compounds (3–7, 9, 10).
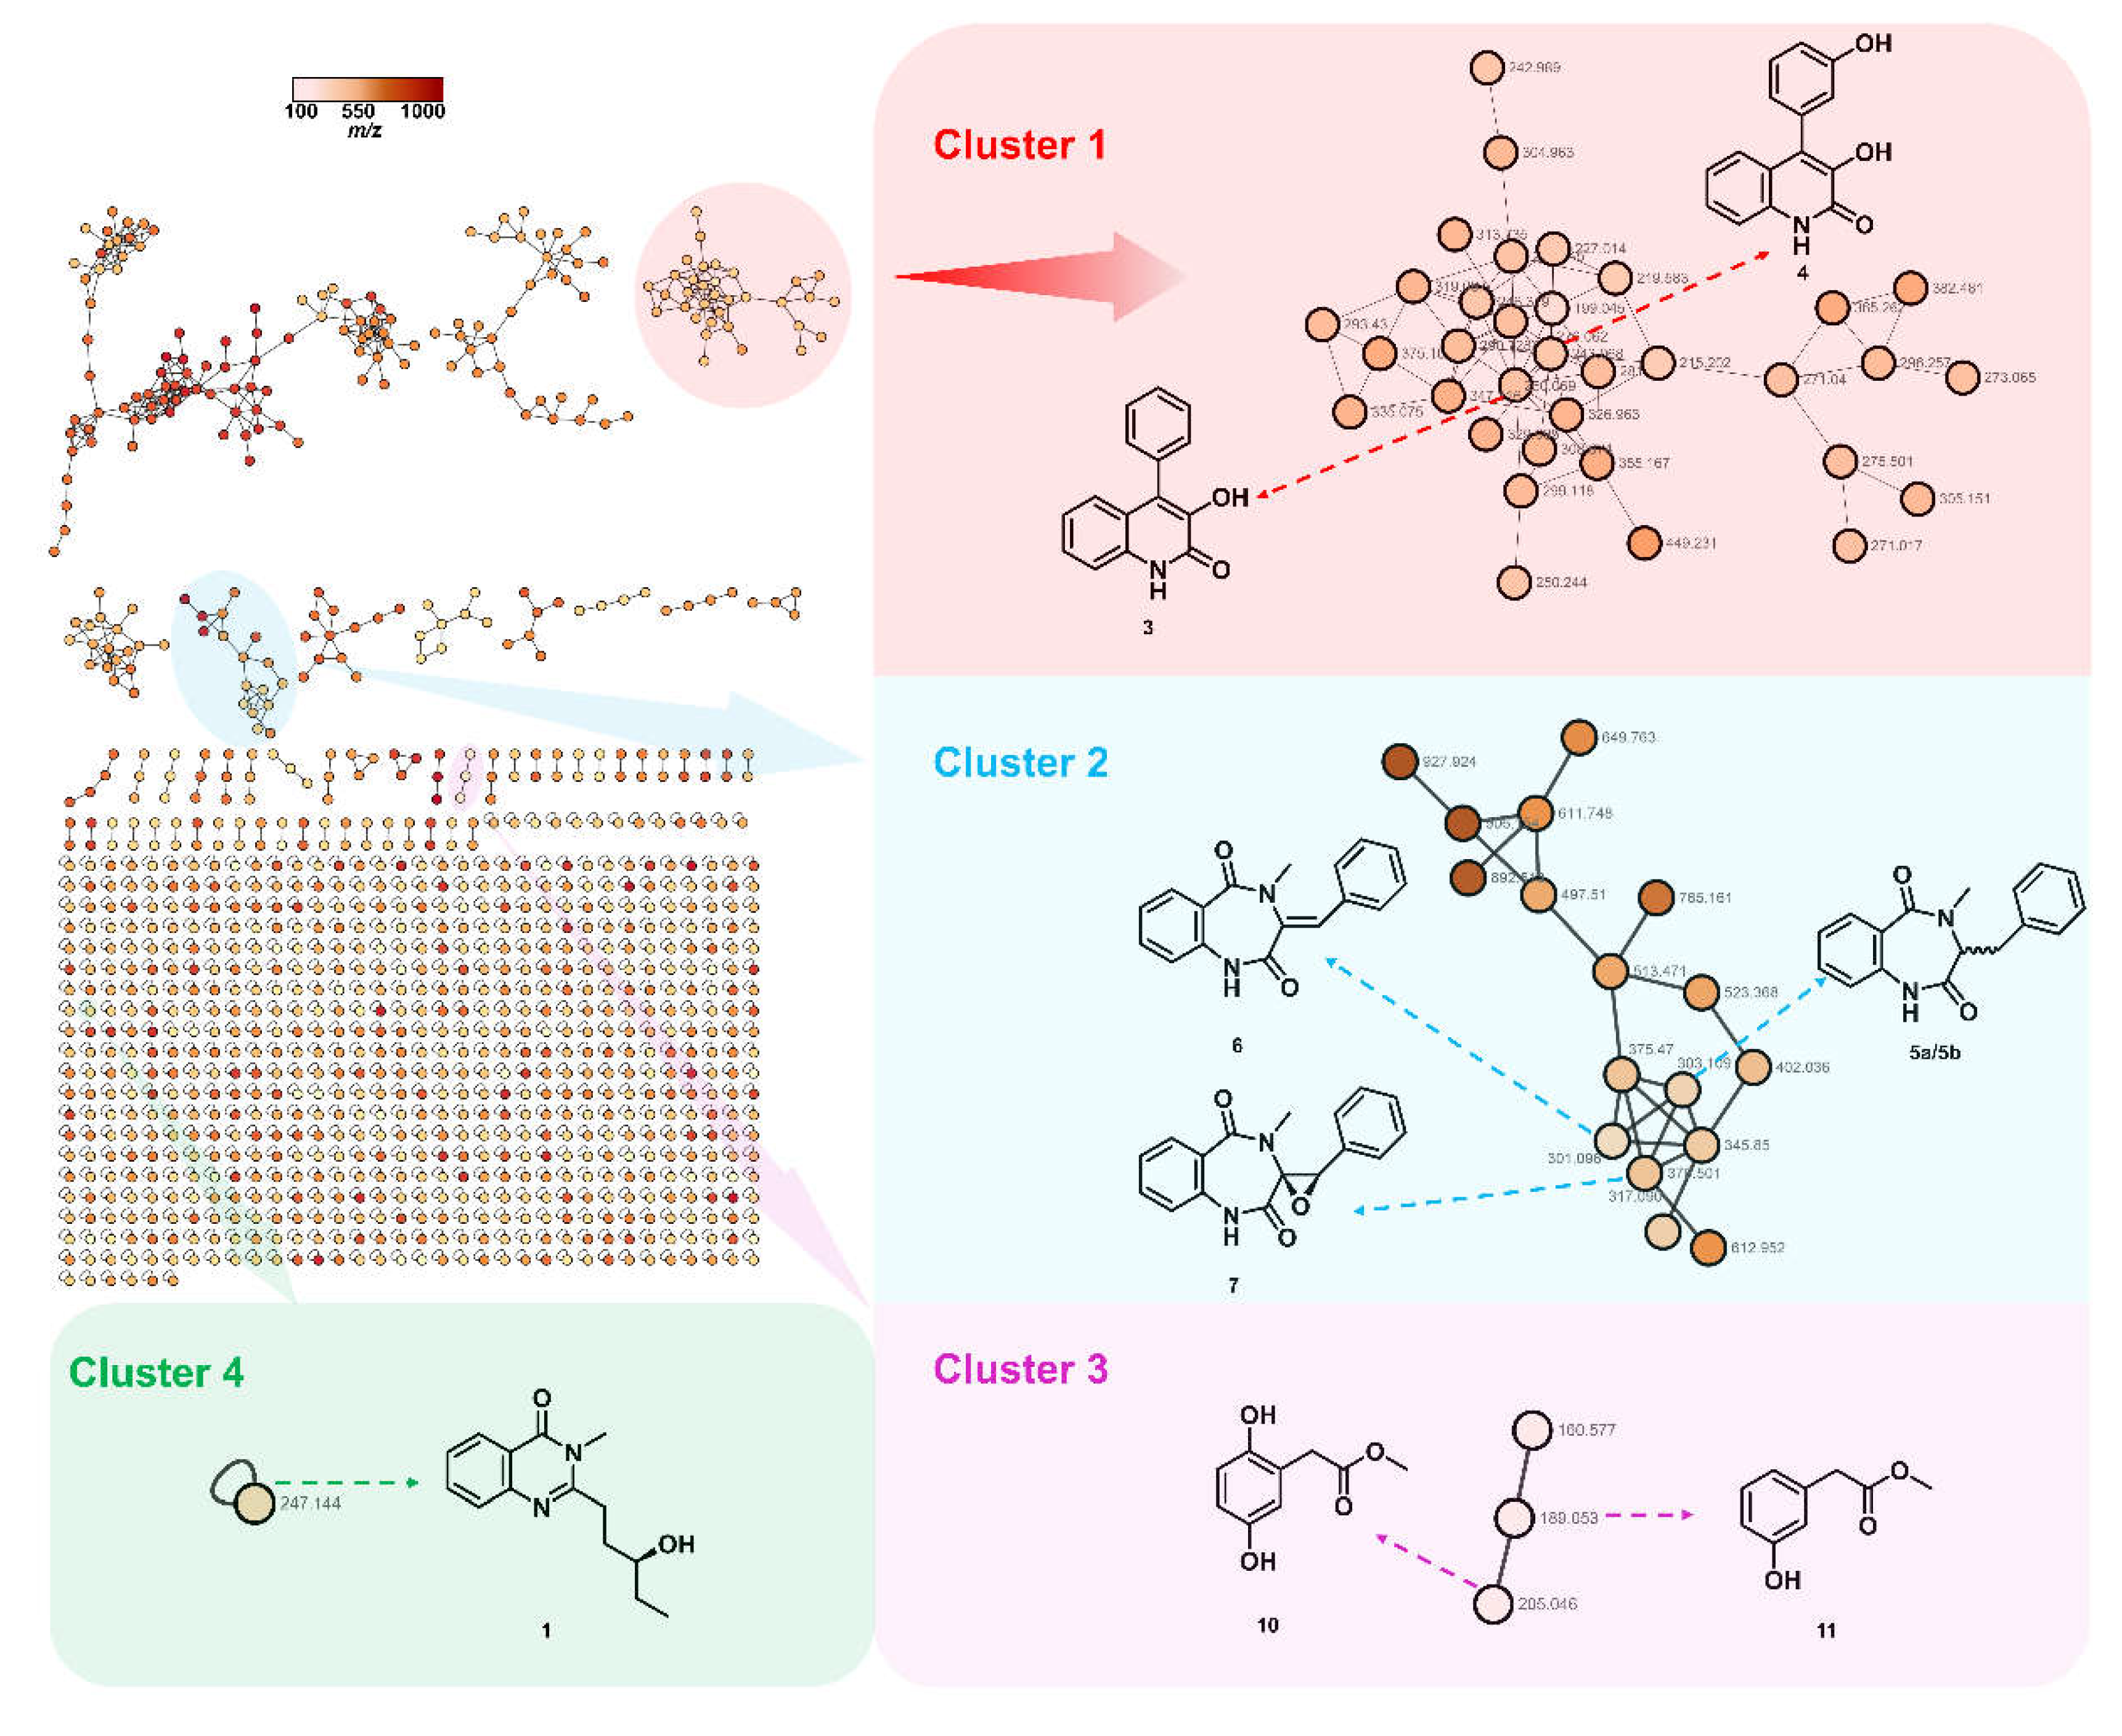
Figure 3.
Key 1H-1H COSY and HMBC correlations of 1.
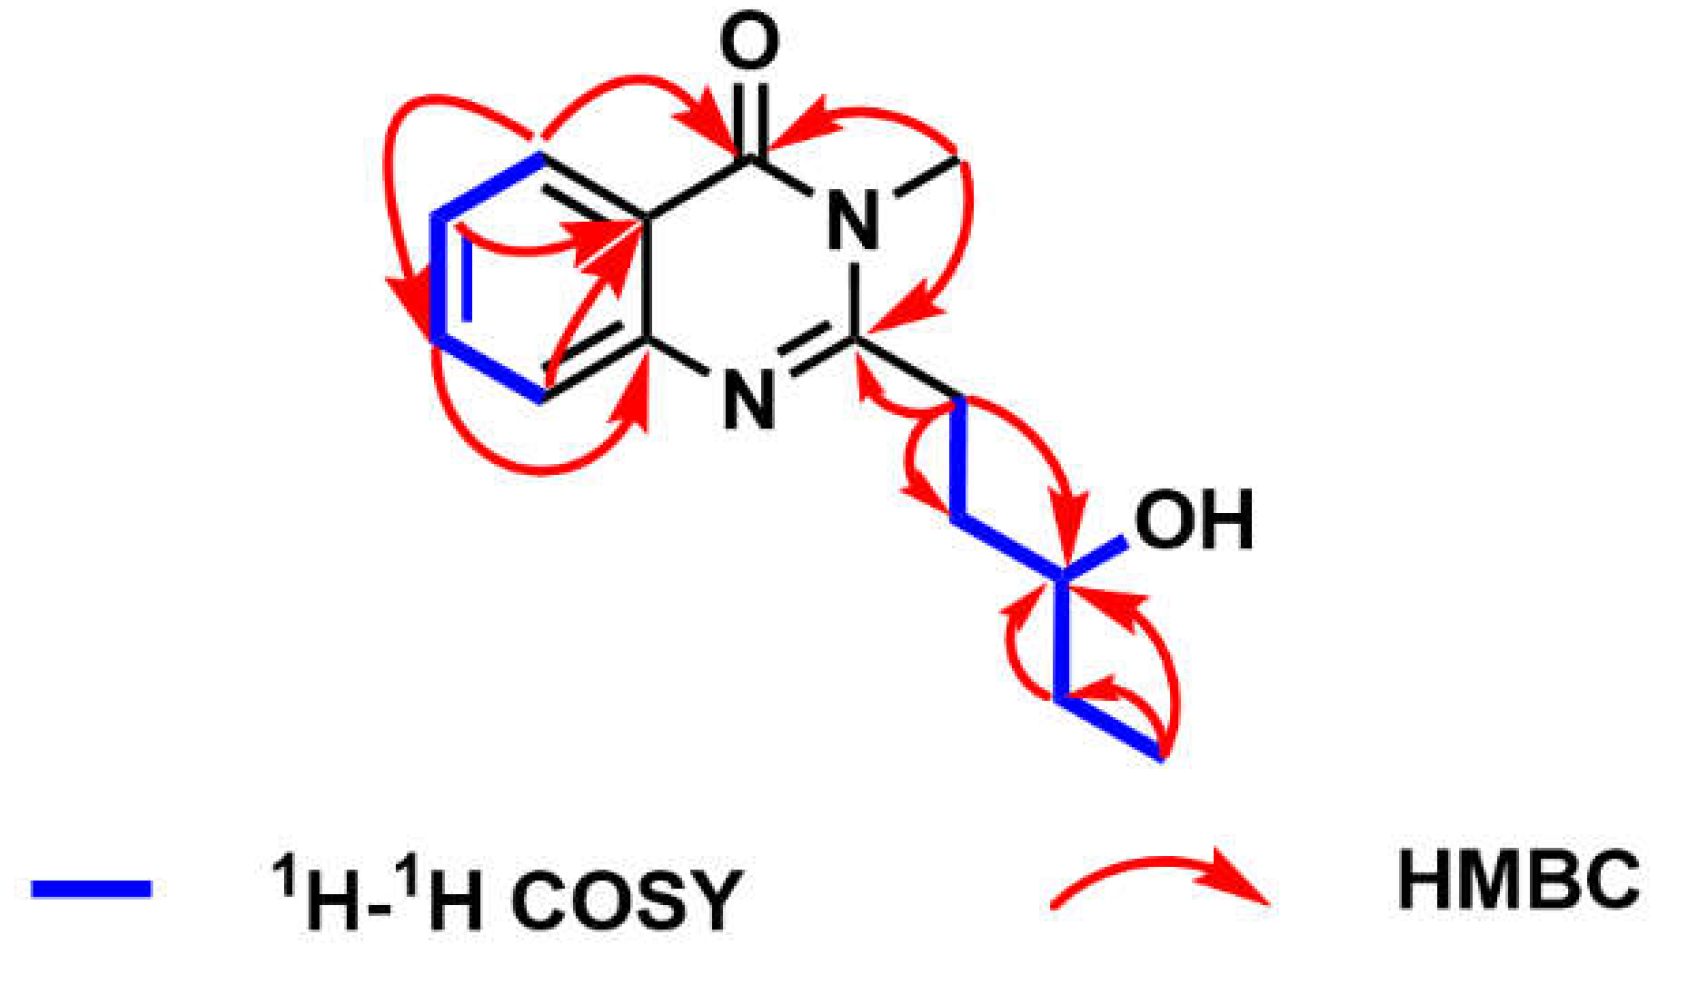
Figure 4.
∆δ(δS-δR) values for MTPA esters of 1.
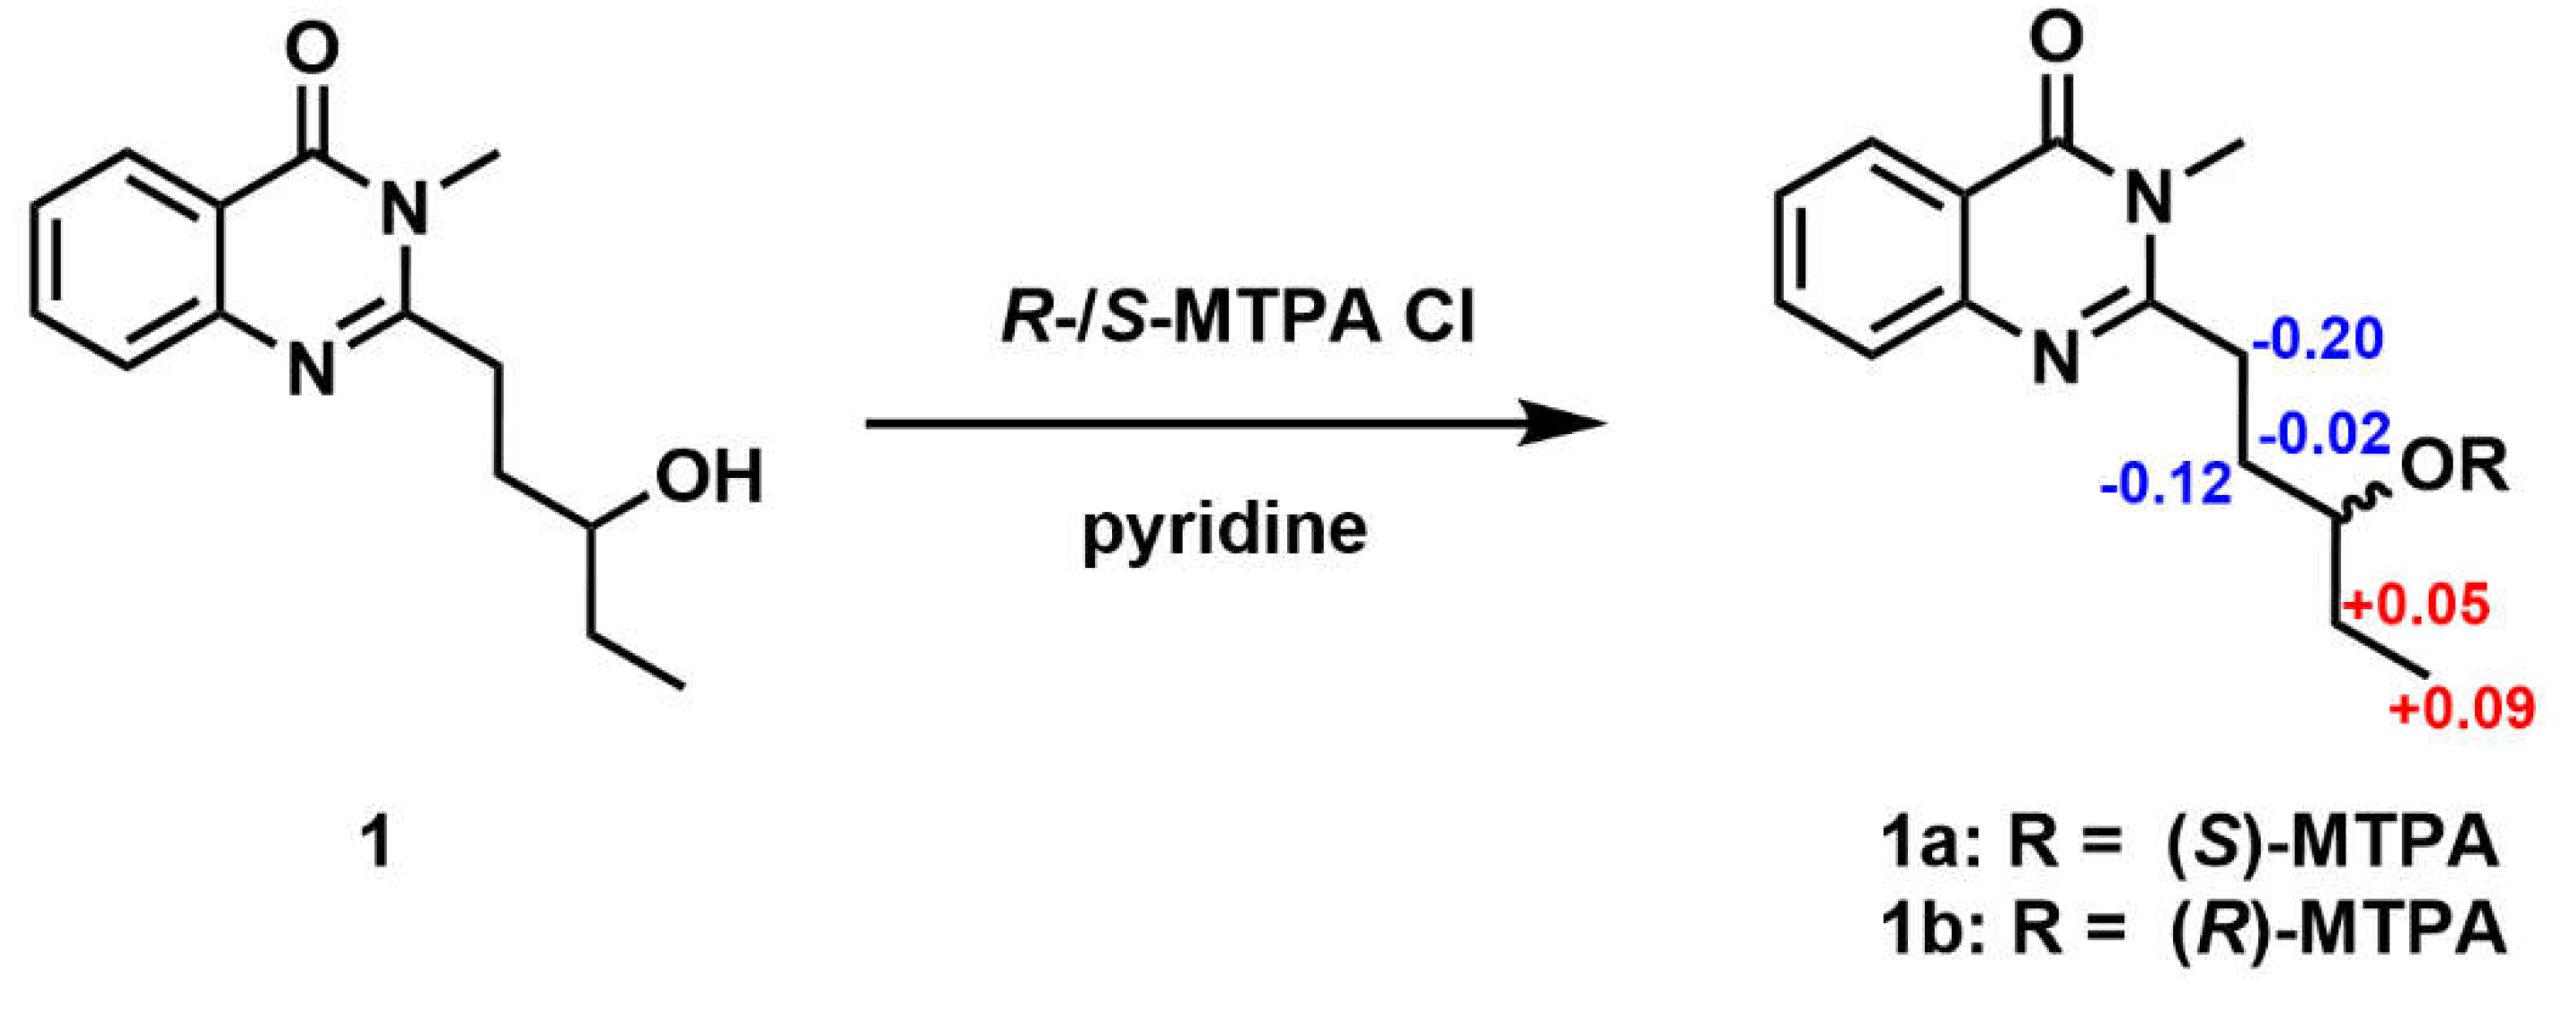
Figure 5.
Rhodiola tibetica Seed germination rate of 2, 3, 4, 7, 9, and 12. Columns represent the mean ± SD, n = 3, ***P < 0.001, **P < 0.01 and *P < 0.05 vs. the blank control water.
Figure 5.
Rhodiola tibetica Seed germination rate of 2, 3, 4, 7, 9, and 12. Columns represent the mean ± SD, n = 3, ***P < 0.001, **P < 0.01 and *P < 0.05 vs. the blank control water.
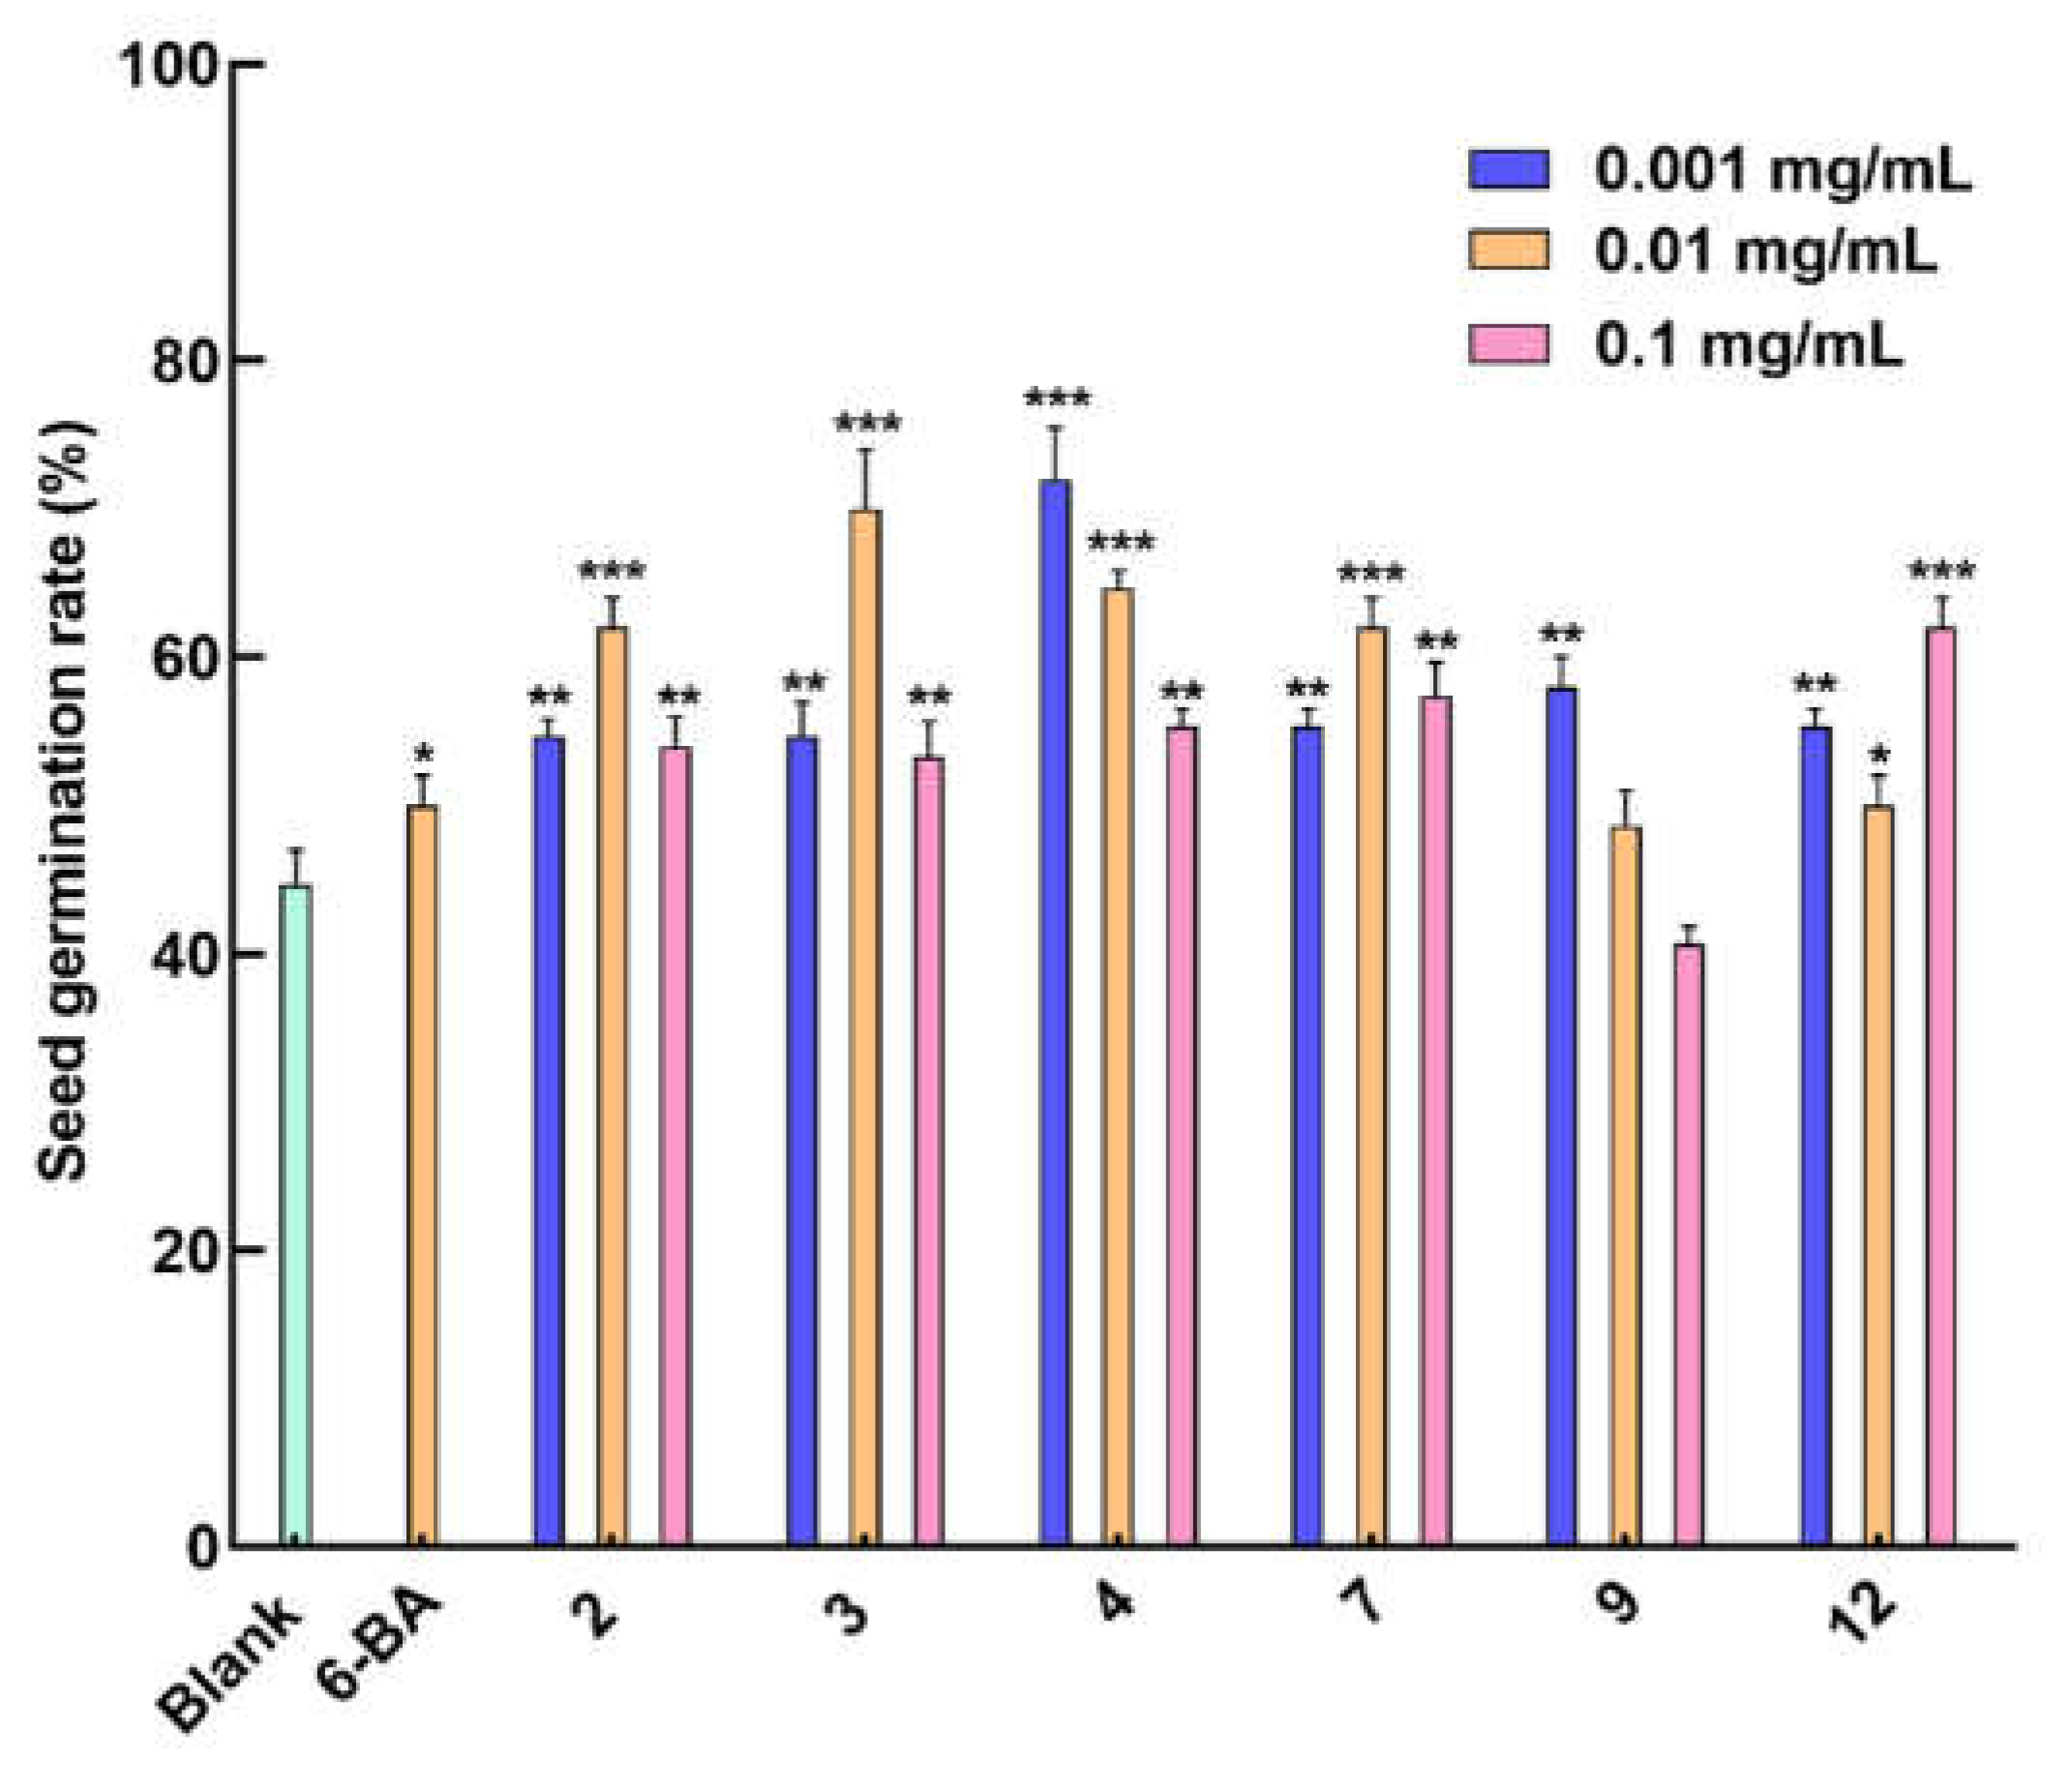
Figure 6.
Effects of all the tested compounds, 6-BA, and the blank control water on the seed-germination period of Rhodiola tibetica.
Figure 6.
Effects of all the tested compounds, 6-BA, and the blank control water on the seed-germination period of Rhodiola tibetica.
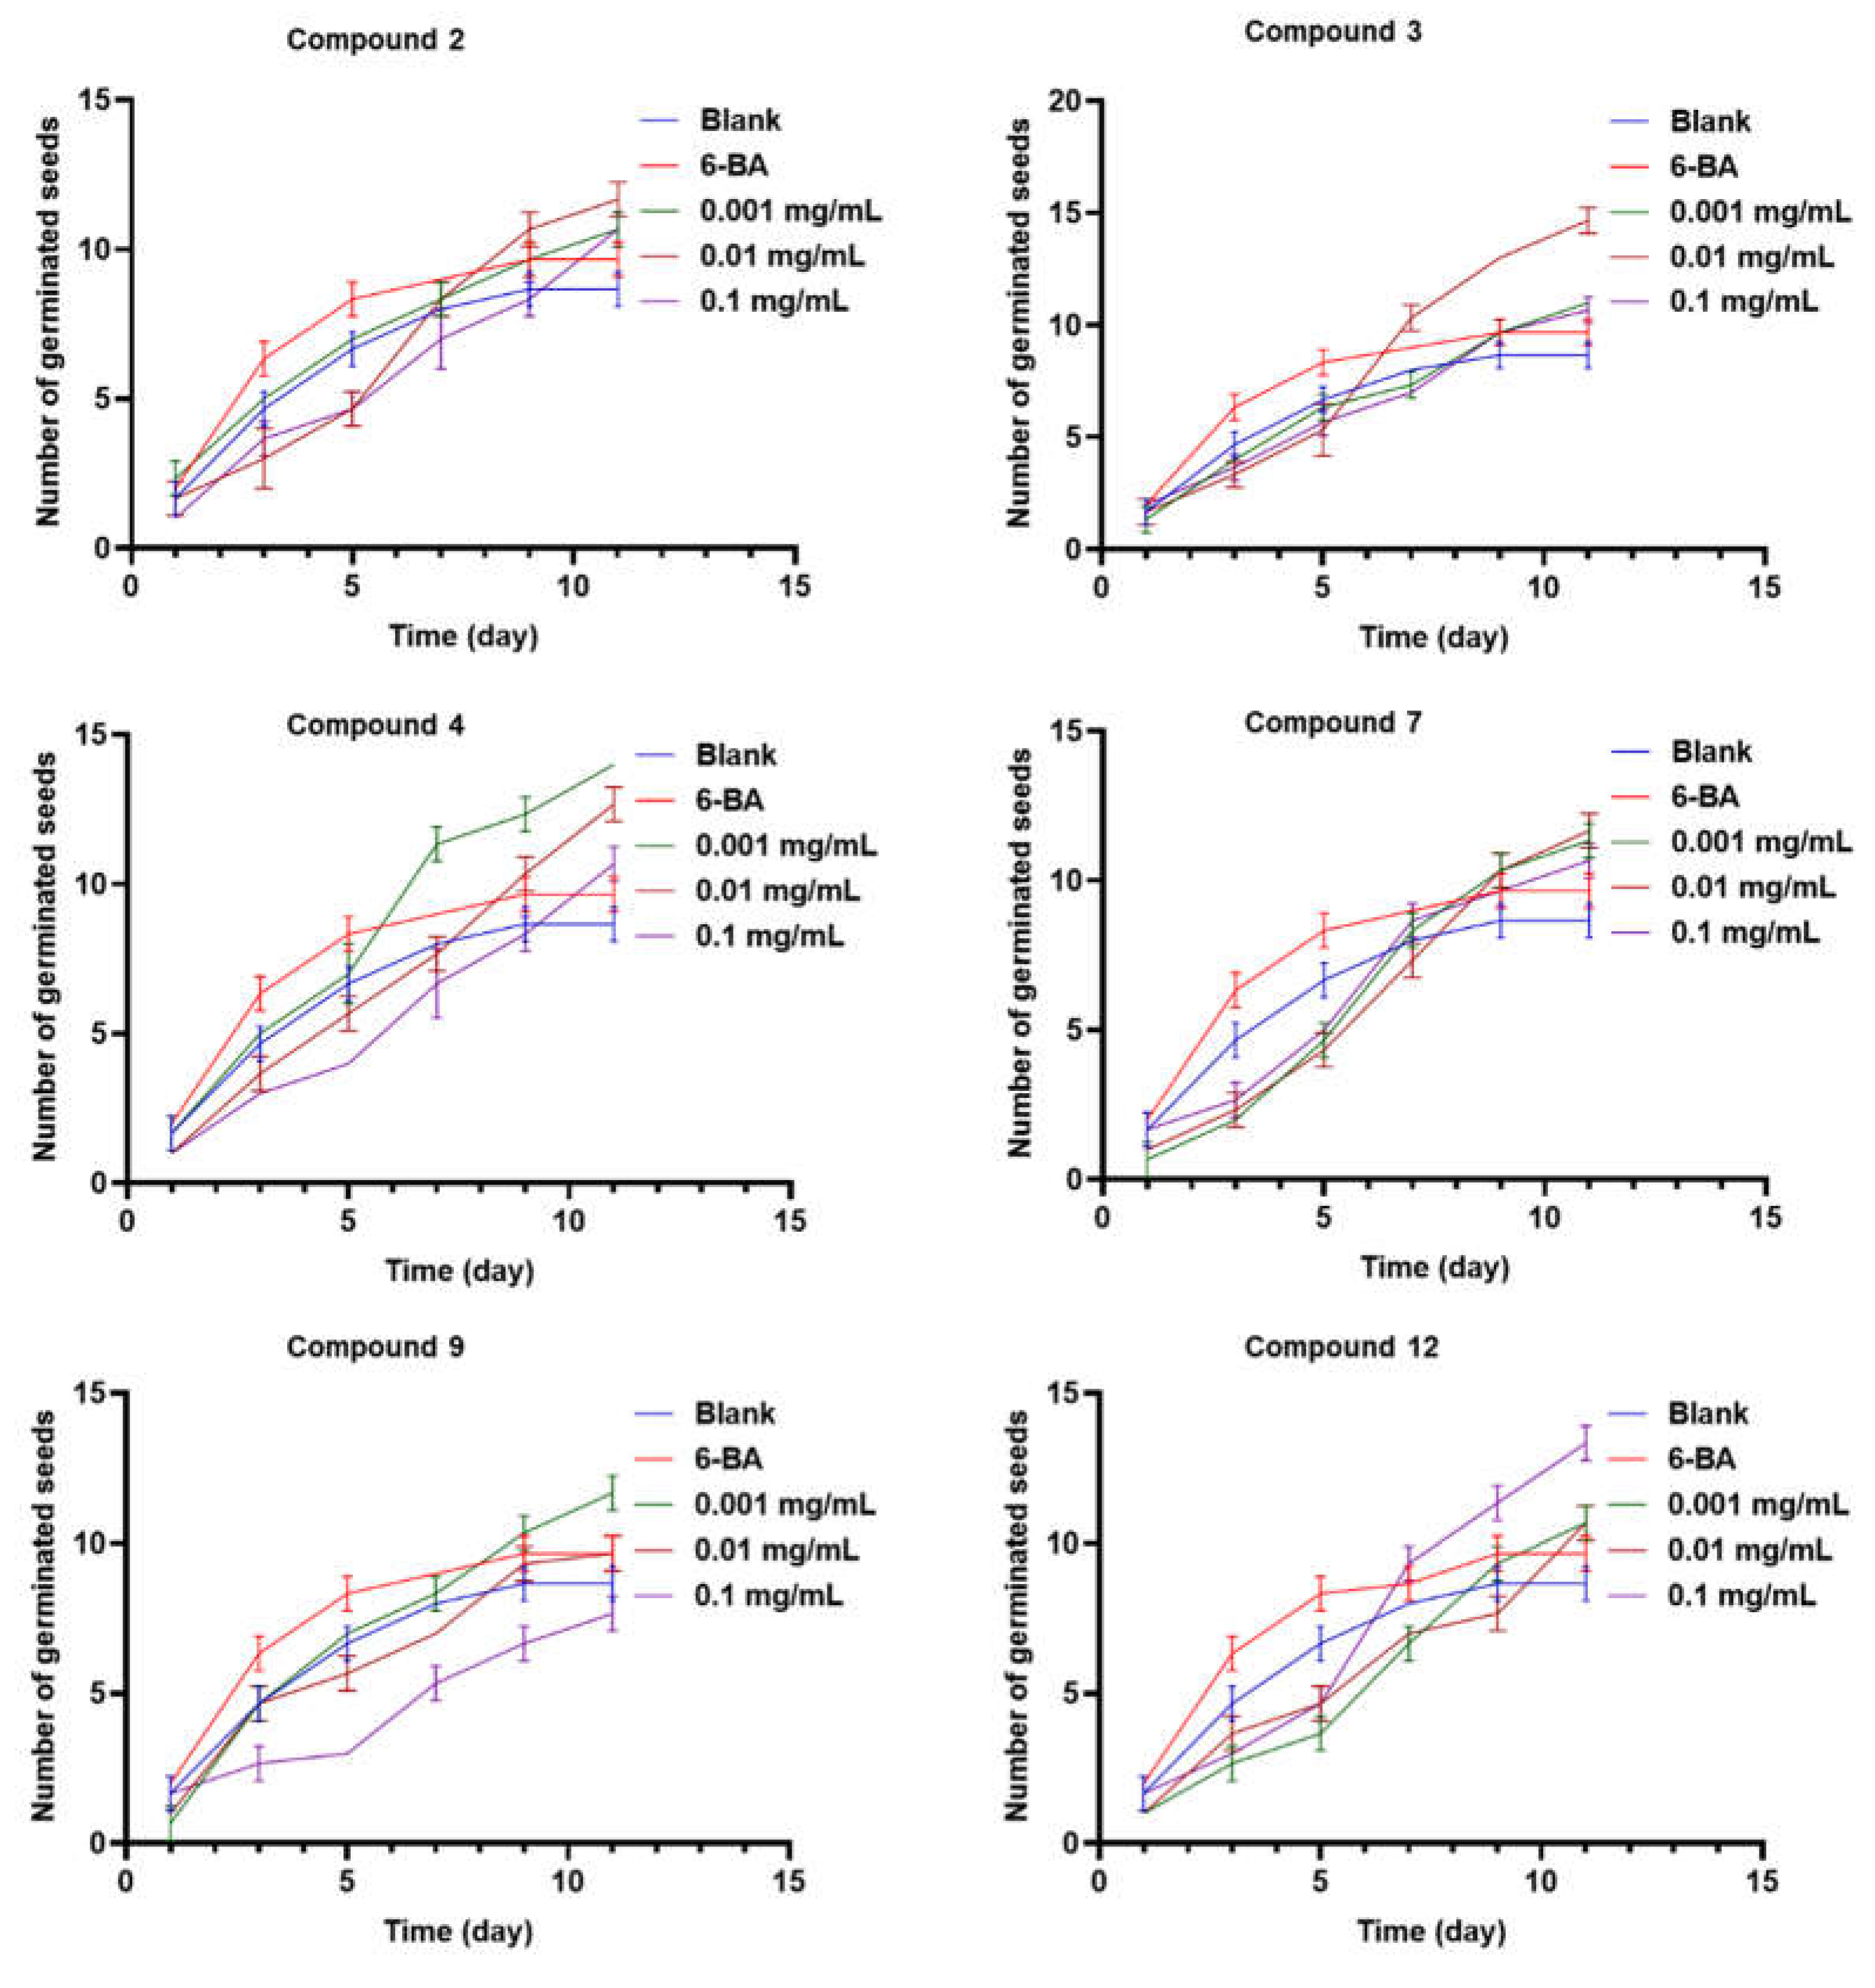

Table 1.
1H and 13C NMR data for compound 1 in DMSO-d6.
| Position | δH (mult., J in Hz) | δC, Type |
|---|---|---|
| 1 | — | 147.4, C |
| 2 | 7.59 (d, 7.5) | 127.1, C |
| 3 | 7.77 (t, 7.5) | 134.6, C |
| 4 | 7.47 (t, 7.5) | 126.6, C |
| 5 | 8.10 (d, 7.5) | 126.6, C |
| 6 | — | 120.2, C |
| 7 | — | 161.9, C |
| 8 | — | — |
| 9 | — | 158.6, C |
| 10 | — | — |
| 11 | 2.99 (m) | 31.6, CH2 |
| 2.85 (m) | ||
| 12 | 1.92 (m) | 33.7, CH2 |
| 1.73 (m) | ||
| 13 | 3.48 (m) | 71.0, CH |
| 14 | 1.43 (m) | 30.4, CH2 |
| 15 | 0.90 (t, 7.5) | 10.6, CH3 |
| 16 | 3.56 (s) | 30.4, CH3 |
| 13-OH | 4.57 (s) | — |
Disclaimer/Publisher’s Note: The statements, opinions and data contained in all publications are solely those of the individual author(s) and contributor(s) and not of MDPI and/or the editor(s). MDPI and/or the editor(s) disclaim responsibility for any injury to people or property resulting from any ideas, methods, instructions or products referred to in the content. |
© 2024 by the authors. Licensee MDPI, Basel, Switzerland. This article is an open access article distributed under the terms and conditions of the Creative Commons Attribution (CC BY) license (http://creativecommons.org/licenses/by/4.0/).
Copyright: This open access article is published under a Creative Commons CC BY 4.0 license, which permit the free download, distribution, and reuse, provided that the author and preprint are cited in any reuse.


